the quality of life and regional development in fyr macedonia
TRANSCRIPT
121
William Bartlett, Hristina Cipusheva, Marjan Nikolov and Miroljub ShukarovThe Quality of Life and Regional Development in FYR MacedoniaCroatian Economic Survey : Vol. 12 : No. 1 : April 2010 : pp. 121-162
The Quality of Life and Regional Development in FYR Macedonia
AbstractTh e paper focuses on regional disparities in the quality of life in the Former Yugoslav Republic of Macedonia. It explores the relationship between the quality of life, social exclusion, and policies towards regional and local economic development. Th e paper is based on a household survey carried out in August 2008 which provides a detailed picture of the situation facing households across regions. Overall, the survey shows that there are large regional disparities in life satisfaction, indicating an important role for regional policy in improving the life experience of people living in the most deprived parts of the country. Th e paper concludes with a
William BartlettLondon School of Economics and Political Science, London, [email protected]
Hristina CipushevaSouth East European University, Tetovo, [email protected]
Marjan NikolovCenter for Economic Analyses, Skopje, [email protected]
Miroljub ShukarovSouth East European University, Tetovo, [email protected]
CroEconSurVol. 12No. 1April 2010pp. 121-162
Received: December 06, 2009Accepted: February 25, 2010Review Article
122
William Bartlett, Hristina Cipusheva, Marjan Nikolov and Miroljub ShukarovThe Quality of Life and Regional Development in FYR MacedoniaCroatian Economic Survey : Vol. 12 : No. 1 : April 2010 : pp. 121-162
number of recommendations for improving the focus of regional policies to ensure a higher quality of life in the deprived regions of Macedonia.
Keywords: quality of life, happiness, regional disparities, FYR Macedonia
JEL classifi cation: I00, I10, I20, I32
1 IntroductionTh e focus of this paper is on regional and local disparities in the quality of life in FYR Macedonia.1 As in most transition economies, the introduction of market competition and privatisation has had mixed eff ects. While some localities have benefi ted from the new opportunities presented by the opening of markets, others have been left behind and the quality of life has suff ered from adverse aspects of the restructuring and change which has accompanied transition such as deindustrialisation, outward migration of young skilled people, environmental degradation, and the deterioration of public services. Quality of life is a broad multi-dimensional concept concerned with the overall well-being of individuals within society which can be measured by subjective as well as objective indicators (Fahey, Noland and Whelan, 2003). Th e approach emphasises an individual’s whole life circumstances, taking into account employment status, education attainment and skills which determine income earning opportunities, health status and access to quality health care, and housing conditions.2 Generally, people who are less educated, in ill-health, or unemployed, have a lower quality of life and express lower levels of life satisfaction and happiness.
1 Th e paper is based on the fi ndings of a research project funded by the UNDP and led by the South East European University in Tetovo. Th e project carried out a large scale household survey in Macedonia in July/August 2008. Th e full report and analysis of the survey can be found in Bartlett et al. (2009).
2 Th e approach has been pioneered by the European Foundation for the Improvement of Living and Working Conditions which carried out a major international survey of the quality of life in Europe (European Foundation, 2004; 2005; Daly and Rose, 2007).

123
William Bartlett, Hristina Cipusheva, Marjan Nikolov and Miroljub ShukarovThe Quality of Life and Regional Development in FYR MacedoniaCroatian Economic Survey : Vol. 12 : No. 1 : April 2010 : pp. 121-162
Th e measurement of quality of life is of great interest in the countries in transition in which there are large informal economies and where the quality of the data on incomes and employment is poor. In these circumstances, the subjective measurement of life satisfaction may give a better picture of the real situation facing people than do income statistics which are riddled with measurement errors. Key factors determining levels of life satisfaction include having an income, enjoying a satisfactory family life, and being in good health. One early study of economic well-being in Eastern Europe between 1991 and 1995 found that life satisfaction was infl uenced by age, education, relative economic position and unemployment, while gender and marital status had little eff ect (Hayo and Seifert, 2003). Another recent study found that on average people in transition countries have lower life satisfaction than people living elsewhere, while those with higher incomes, higher levels of education, and who are self-employed, are more satisfi ed with their lives than others (Sanfey and Teksoz, 2007). Also, people are more satisfi ed with their lives in those transition countries in which standards of economic governance are higher, and in which inequality is lower.
Closely related to the quality of life is people’s experience of happiness. Recent research on the economics of happiness has shown that subjective perceptions of happiness can be used to refl ect real well-being. Th e main factors which determine levels of happiness in adult life are family relationships, the individual’s fi nancial situation and employment status, relations in the community and with friends, health, personal freedom, and personal values (Layard, 2005). Recent survey evidence has shown that levels of unhappiness are relatively high in the countries of South East Europe (EBRD, 2007a; 2007b). People in FYR Macedonia were particularly unhappy, with almost 50 percent of people dissatisfi ed with their lives, compared to less than 30 percent who were satisfi ed. In most South East European countries with the exception of Albania, people felt that their living standards were worse than they had been in 1989. In FYR Macedonia, around 50 percent of people felt that their living standards had fallen, and over 70 percent felt that their level of household wealth had fallen since 1989. Considering the views on the

124
William Bartlett, Hristina Cipusheva, Marjan Nikolov and Miroljub ShukarovThe Quality of Life and Regional Development in FYR MacedoniaCroatian Economic Survey : Vol. 12 : No. 1 : April 2010 : pp. 121-162
overall economic situation in 2006 compared to that in 1989, over 80 percent of people felt that the situation had worsened, a proportion higher than in any other transition country apart from Bosnia and Herzegovina, and a higher proportion even than in the transition countries of Central Asia.
It is hardly surprising that people in Macedonia experience a low quality of life and are less happy than people in many other parts of Europe. Th e country was particularly badly aff ected by the breakup of the former Yugoslavia, the impact of UN sanctions against Serbia in the 1990s, the armed confl ict of 2001 which poisoned relations between the Macedonian and Albanian ethnic groups even further than before, and the various blockades by Greece over the “name issue” which most recently has blocked the country from NATO accession and from opening membership negotiations with the EU since submitting its membership application to the EU in March 2004. Th e Commission’s Opinion on the membership application in November 2005 agreed that the country had taken “important steps” towards establishing a functioning market economy, but that it would not be able to cope with competitive pressure within the Union even in the medium term. Despite these caveats, the country became a candidate for EU membership in December 2005, although it has still not been permitted to open membership negotiations with the European Commission.
A new government led by VMRO-DPMNE was elected in July 2006. It inherited a relatively favourable economic situation. Economic growth had reached 4 percent in 2005, after years of stagnation. Interest rates had fallen on the back of growing international reserves. Infl ation was low at 0.5 percent, the budget defi cit within its 0.6 percent target, and external debt was also relatively low at just 46 percent of GDP. Economic growth increased further to 5.2 percent in 2007 and 5.5 percent in 2008, and the government decided not to renew the Stand-by Arrangement with the IMF. However, as a consequence of the global economic crisis, economic growth began to slow down sharply in early 2009, due to declining export revenues, lower FDI infl ows, and falling remittance incomes. In this context, the opening of EU accession negotiations is a priority for reviving FDI infl ows and stimulating

125
William Bartlett, Hristina Cipusheva, Marjan Nikolov and Miroljub ShukarovThe Quality of Life and Regional Development in FYR MacedoniaCroatian Economic Survey : Vol. 12 : No. 1 : April 2010 : pp. 121-162
renewed economic growth. Fortunately, increased fi nancial assistance for pre-accession reform has been provided through the Instrument for Pre-accession Assistance (IPA), focusing inter alia on cross-border co-operation and regional development, which has become an important part of government policy to reduce regional diff erences within the country.
In the last twenty years, large regional diff erences in the quality of life have emerged within many transition economies. Five main factors have increased in these regional inequalities during the transition period. Firstly, privatisation had a strong spatial dimension due to the earlier location decisions of the central planners. Regions with a more diversifi ed economic base were more able to successfully restructure their local economies, whereas locations reliant on a single industry were less able to adapt (Petrakos, 2001). Secondly, restructuring in transition economies led to an increased share of services. Urban areas, especially capital cities, benefi ted from this whereas rural areas tend to be left behind as few service industries locate there, although public services funded by central government, such as schools and hospitals, were more evenly spread. Th irdly, foreign direct investment concentrated in capital cities due to better business infrastructure, international linkages, and pools of skilled workers. Fourthly, regional diff erences in education and skills have been found to explain much of the regional variation in incomes and unemployment in transition countries (OECD, 2000). In the EU’s new member states, education levels are lowest in agricultural areas, and highest in capital cities, while the share of low-skill manual workers is higher in rural regions than elsewhere (Landesmann and Ward, 2004). Fifthly, regional imbalances in health outcomes are also pronounced in transition countries, especially in the Western Balkans where health infrastructure resources are depleted and where health insurance systems do not cover many uninsured families.
Macedonia has been similarly aff ected by growing regional inequalities during transition. Pre-existing regional inequalities have intensifi ed during the transition process and have been exacerbated by non-economic factors such as declining levels of trust, increased pessimism since the 2001 war, and high levels of uncertainty
126
William Bartlett, Hristina Cipusheva, Marjan Nikolov and Miroljub ShukarovThe Quality of Life and Regional Development in FYR MacedoniaCroatian Economic Survey : Vol. 12 : No. 1 : April 2010 : pp. 121-162
about the future. Per capita income in the capital city Skopje is far above the rest of the country. It is the main pole of development for the whole country and attracts the inhabitants from all the other regions. Consequently, Skopje is a magnet for investments and business activities of the private sector, both domestic and foreign. Th e concentration of business activities and investments in the Skopje region attracts the population from the surrounding villages, neighbouring regions, and even from the wider Southern Balkan region (Kosovo, Southern Serbia and Albania). While the other regions have secondary towns that are poles for their development and attractiveness, none of them can compete with Skopje. Th is monocentric pattern of development has underpinned huge diff erences in the quality of life among the regions of the country.
Although regional policies have been put in place over the years and a process of decentralisation has been applied since the end of the 2001 confl ict, they have as yet not addressed these fundamental inequalities. Th e EU pre-accession policies have also had a bearing on the regional policy in the country. In recent years eight planning regions have been defi ned at NUTS 3 level, each of which has its own specifi c characteristics and development problems.3 In 2007, a Law on Equal Regional Development was passed which sought to resolve the problem of delayed development of some regions in an institutional manner. Th e strategic document on regional development sets out the principles, goals and priorities of regional policy, as well as the measures and instruments for promoting development. A Council for Equal Development has been established with a mandate to coordinate regional development policy, and a Council for the Development of the Planning Regions has been established as a body responsible for the implementation of the policy in each planning region. Th e former Agency for Economically Underdeveloped Areas has been transformed into the Regional Development Bureau. So far, regional policy has been mainly concerned with economic conditions and with building economic infrastructure, while less attention has been paid to the quality of life and its regional diff erences. Th e rest of this paper aims to identify the nature of
3 NUTS 3 – Th e Republic of Macedonia is divided into eight regions: Skopje, Vardar, Polog, Pelagonia, Northeast, Southeast, Southwest and East.

127
William Bartlett, Hristina Cipusheva, Marjan Nikolov and Miroljub ShukarovThe Quality of Life and Regional Development in FYR MacedoniaCroatian Economic Survey : Vol. 12 : No. 1 : April 2010 : pp. 121-162
these diff erences, and to point out the ways in which regional policies could be strengthened by taking these dimensions into account.
2 A Regional Profi le of the Quality of LifeTh is section considers several aspects of quality of life measured by objective as well as subjective indicators to identify the regions most at risk of social exclusion. It begins with subjective indicators of the quality of life in terms of overall life satisfaction, and overall happiness, before examining some objective indicators of income and poverty. GDP per capita in terms of purchasing power parity is compared with that in EU countries in order to set the context and the convergence perspective for the country as an EU candidate. Inequality across regions and across ethnic affi liation is also measured and discussed. Since poverty is a major aspect of vulnerability and social exclusion, various dimensions of poverty including its incidence and depth are identifi ed. Since people try to preserve their life style even when incomes fl uctuate, life style issues are taken into account as well as household income. A deprivation index is presented which represents exclusion from minimally acceptable standards of living and household essentials. Since participation in the labour market is a key determinant of social inclusion, labour market outcomes are analysed, as are perceptions of access to education and health services. An index of the quality of life is presented in order to identify in more detail the regional diff erences in welfare and well-being across the country.
2.1 The Quality of Life: Satisfaction and Happiness
Th e transition to a market economy has aff ected peoples’ lives and their attitudes towards prospects for the future. Indicators such as life satisfaction, the level of happiness, housing conditions, health status, and social relations give an insight into peoples’ quality of life. Th is section therefore begins with a discussion of subjective well-being using two indicators: life satisfaction and overall happiness.

128
William Bartlett, Hristina Cipusheva, Marjan Nikolov and Miroljub ShukarovThe Quality of Life and Regional Development in FYR MacedoniaCroatian Economic Survey : Vol. 12 : No. 1 : April 2010 : pp. 121-162
Figure 1: Satisfaction with Life and Happiness (Mean Scores on a Scale of 1-10)
87
Happiness
6
Satisfaction with life
543
Macedonia
Croatia
EU-25
EU-15
Source: For EU, European Foundation (2004); for Croatia, UNDP (2006); for Macedonia, Bartlett et al. (2009).
Figure 1 shows that the mean level of life satisfaction and happiness in FYR Macedonia is lower than the average of the EU countries whether considering the older Member States (EU-15) or the EU as a whole including the New Member States which joined since 2004 (EU-10). While the diff erences between the EU groupings are not large, FYR Macedonia has far lower levels of life satisfaction and happiness, with people experiencing signifi cantly lower levels of well-being on these measures than people in either of the EU groups and signifi cantly below that in Croatia, another EU candidate state in the region. In all the cases, the scores for life satisfaction are lower than the scores for happiness, revealing an even greater dissatisfaction with the quality of the society and the environment in which people live (satisfaction) than with their personal emotional reaction to that environment (happiness). Th is suggests that people are able to compensate for dissatisfaction with the quality of life in various ways, through family relations and personal adjustments, and to enjoy levels of happiness that are somewhat above the level that could be expected from their reported levels of satisfaction with life as a whole.

129
William Bartlett, Hristina Cipusheva, Marjan Nikolov and Miroljub ShukarovThe Quality of Life and Regional Development in FYR MacedoniaCroatian Economic Survey : Vol. 12 : No. 1 : April 2010 : pp. 121-162
Figure 2: Satisfaction with Life and Happiness by Region (Mean Scores on a Scale of 1-10)
76.56
Happiness
5.5
Satisfaction with life
54.543.53
Vardar
Skopje region
Northeast
Southwest
Southeast
Polog
Pelagonia
East
Source: Bartlett et al. (2009).
Th e average level of life satisfaction and happiness by region is presented in Figure 2. Life satisfaction is lowest in the Southeast and highest in Polog. Average levels of happiness are highest in the East and lowest in Vardar. Th ere are quite large diff erences between the two indicators, suggesting that people compensate to some extent for dissatisfaction with the quality of life through family relations and personal adjustments, to varying extents across diff erent regions. Th is adjustment seems to be especially strong in the Southeast and Pelagonia.
It should be expected that the levels of satisfaction with life and the levels of happiness bear a strong relationship to income and expenditure capacity, since the European Quality of Life surveys have shown that the main determinants of life satisfaction and happiness are employment status and income. Th e negative impact of low incomes is greater in poorer countries, where having a low income entails greater personal challenges than in more prosperous countries. Th e survey fi ndings confi rm this expectation, and show that the average levels of life satisfaction and happiness are closely correlated with the level of equivalised expenditure.4 People
4 Equivalisation is made on the basis of the OECD modifi ed scale, which assigns a value of 1 to the household head, of 0.5 to each additional adult member and of 0.3 to each child.
130
William Bartlett, Hristina Cipusheva, Marjan Nikolov and Miroljub ShukarovThe Quality of Life and Regional Development in FYR MacedoniaCroatian Economic Survey : Vol. 12 : No. 1 : April 2010 : pp. 121-162
within the top quartile of equivalised expenditure are signifi cantly more satisfi ed with their lives and are happier than people with lower expenditure. However, incomes and expenditure are not the only determinants of life satisfaction and happiness. Other factors can be expected to have a strong infl uence, including factors which determine social status such as education, age, gender, place of residence, and ethnicity.
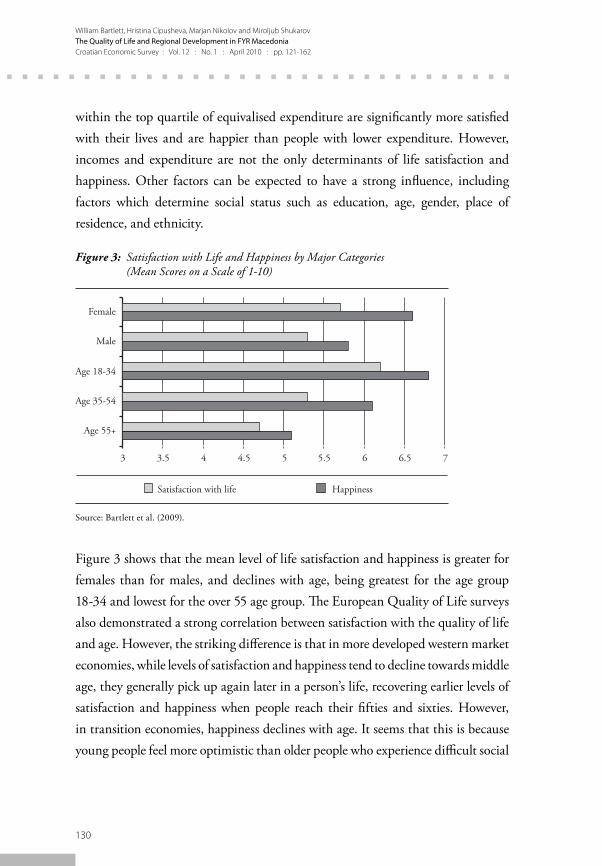
Figure 3: Satisfaction with Life and Happiness by Major Categories (Mean Scores on a Scale of 1-10)
76.56
Happiness
5.5
Satisfaction with life
54.543.53
Female
Male
Age 18-34
Age 35-54
Age 55+
Source: Bartlett et al. (2009).
Figure 3 shows that the mean level of life satisfaction and happiness is greater for females than for males, and declines with age, being greatest for the age group 18-34 and lowest for the over 55 age group. Th e European Quality of Life surveys also demonstrated a strong correlation between satisfaction with the quality of life and age. However, the striking diff erence is that in more developed western market economies, while levels of satisfaction and happiness tend to decline towards middle age, they generally pick up again later in a person’s life, recovering earlier levels of satisfaction and happiness when people reach their fi fties and sixties. However, in transition economies, happiness declines with age. It seems that this is because young people feel more optimistic than older people who experience diffi cult social

131
William Bartlett, Hristina Cipusheva, Marjan Nikolov and Miroljub ShukarovThe Quality of Life and Regional Development in FYR MacedoniaCroatian Economic Survey : Vol. 12 : No. 1 : April 2010 : pp. 121-162
problems, and have found it hard to adjust to the dramatic changes brought about by the transition. Th is eff ect is typical of many transition economies where older people have faced a loss of economic security and a devaluation of their human capital and skills which had been developed for a completely diff erent type of economy and social structure (Guriev and Zhuravskaya, 2009). Th is suggests that policies to improve well-being in the country should pay special attention to the needs of older people.
Figure 4: Satisfaction with Life and Happiness by Location and Ethnicity (Mean Scores on a Scale of 1-10)
76.565.554.543.53
Rural
Urban
Skopje
Macedonian
Albanian
Roma
Satisfaction with life Happiness
Source: Bartlett et al. (2009).
Figure 4 shows that the average level of life satisfaction and happiness is greater for those who live in urban areas compared to those who live in rural areas. Th e low levels of satisfaction with the quality of life, and the low levels of happiness in rural areas compared to urban areas, and the city of Skopje, reinforce the remarks made in the introduction about the monocentric nature of the development process, the relative bias towards urban development, and the atrophy of the countryside. Th is suggests a strong role for policies directed towards improving the quality of life in rural areas, and especially the importance of accessing EU assistance from the IPA programme for the development and regeneration of rural areas. Considering

132
William Bartlett, Hristina Cipusheva, Marjan Nikolov and Miroljub ShukarovThe Quality of Life and Regional Development in FYR MacedoniaCroatian Economic Survey : Vol. 12 : No. 1 : April 2010 : pp. 121-162
ethnic groups, ethnic Macedonians have equivalent levels of life satisfaction to Albanians, while the Roma population have signifi cantly lower levels of satisfaction with their lives. Levels of happiness among ethnic groups are more diverse with the greatest levels of happiness appearing among ethnic Macedonians compared to the other ethnic groups.
2.2 Economic Performance and Incomes
FYR Macedonia is a candidate for EU membership, yet its income levels are far below those of many EU member states. Even in ex-Yugoslavia, the Socialist Republic of Macedonia was one of the poorest republics in the federation. With the start of transition in the fi rst half of the 1990s, many factors brought about further deterioration in the economy, including the shock of economic restructuring as well as the blockades by Greece and the UN sanctions against Serbia and Montenegro. Since the onset of the transition process at the start of the 1990s, the country has experienced relatively low rates of economic growth vis-à-vis almost all of its neighbours. Following a severe recession in the early 1990s and subsequent slow growth in the post-confl ict period between 2001 and 2004, economic growth increased to an average of around 4 percent from 2004 to 2007. According to the National Bank of Macedonia, the GDP growth rate in 2008 was even higher at over 5 percent, before falling by 3 percent in 2009 due to the impact of the global economic recession. Living standards remain far below those in the EU. Th e level of GDP per capita is only 25 percent of the EU average in terms of purchasing power parity.
Large diff erences in GDP per capita can be observed across regions (see Figure 5). Not surprisingly, the Skopje region has the highest level of GDP per capita, more than three fi fths above the average level for the country as a whole. With the exception of Vardar, GDP per capita in all other regions is below the country average. Th e lowest levels are in Polog and the Northeast, where levels are around one half of the country average. Th e gap between Skopje and these two regions is

133
William Bartlett, Hristina Cipusheva, Marjan Nikolov and Miroljub ShukarovThe Quality of Life and Regional Development in FYR MacedoniaCroatian Economic Survey : Vol. 12 : No. 1 : April 2010 : pp. 121-162
wide, with GDP per capita in the latter less than one third of the former. Levels of production and incomes do not, however, necessarily correspond, as commuter fl ows may have a signifi cant infl uence on the regional distribution. Th e daily migration of labour to Skopje from neighbouring regions increases GDP per capita in some regions to a level that could not be achieved by the resident population on its own. Th e commuter incomes are transferred to the regions where they live, giving rise to potentially large diff erences between measured GDP per capita and measured income levels across regions.
Figure 5: Regional GDP per capita
0 20 40 60 80 100 120 140 160 180
Whole country
Vardar
Southwest
Southeast
Skopje region
Polog
Pelagonia
Northeast
East
Index
Source: Bartlett et al. (2009).
Regional diff erences in median monthly household equivalised income observed through the survey are relatively high, but far less variable than the average (mean) regional GDP per capita (see Figure 6). Th e lowest median monthly equivalised income, observed in the Northeast, is about 60 percent of the highest income observed in Pelagonia. It is interesting to note that while average GDP per capita in Polog is the lowest in the country, its mean household equivalised income is above that of the country as a whole and is similar to that in the Skopje region. Th is diff erence between mean GDP per capita and median household income could

134
William Bartlett, Hristina Cipusheva, Marjan Nikolov and Miroljub ShukarovThe Quality of Life and Regional Development in FYR MacedoniaCroatian Economic Survey : Vol. 12 : No. 1 : April 2010 : pp. 121-162
refl ect either the presence of a high level of informal economic activity not captured by the offi cial GDP measure, remittances from abroad, a commuter fl ow eff ect, or else simply the diff erence in distribution of the mean compared to the median as an indicator of the average levels of activity and income. Th e latter could arise if the less prosperous regions have fewer high income individuals, which would tend to bunch together the measures of the mean and the mode income and activity levels. Furthermore, the scale of household income diff erences is lower between regions than between ethnic affi liations. Th e lowest median monthly equivalised income among the Roma is much lower than among ethnic Macedonians. Since three fi fths of the country’s Roma population live in the Skopje region, the income in the Skopje region is reduced directly by the signifi cant presence of low Roma incomes.
Figure 6: Mean and Median Equivalised Household Income by Region
0
50
100
150
200
250
Median Mean
FYR
Mac
edon
ia
Skop
je
Var
dar
Nor
thea
st
Polo
g
Pela
goni
a
Eas
t
Sout
hwes
t
Sout
heas
t
In EUR
Source: Bartlett et al. (2009).
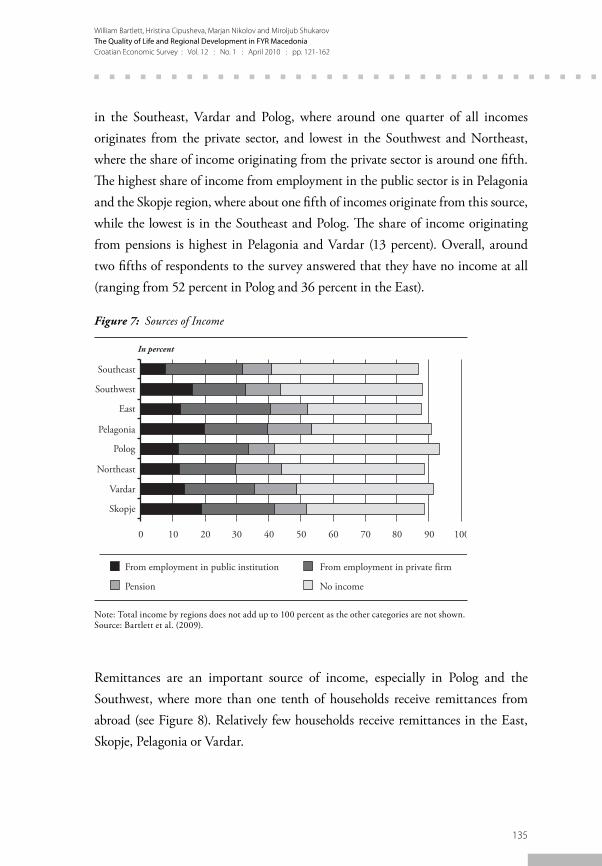
Th e survey also provided information about the sources of income in the regions (see Figure 7). Th e share of income from employment in private fi rms is highest
135
William Bartlett, Hristina Cipusheva, Marjan Nikolov and Miroljub ShukarovThe Quality of Life and Regional Development in FYR MacedoniaCroatian Economic Survey : Vol. 12 : No. 1 : April 2010 : pp. 121-162
in the Southeast, Vardar and Polog, where around one quarter of all incomes originates from the private sector, and lowest in the Southwest and Northeast, where the share of income originating from the private sector is around one fi fth. Th e highest share of income from employment in the public sector is in Pelagonia and the Skopje region, where about one fi fth of incomes originate from this source, while the lowest is in the Southeast and Polog. Th e share of income originating from pensions is highest in Pelagonia and Vardar (13 percent). Overall, around two fi fths of respondents to the survey answered that they have no income at all (ranging from 52 percent in Polog and 36 percent in the East).
Figure 7: Sources of Income
Skopje
Vardar
Pelagonia
10090
From employment in private firm
8070
No income
6050
From employment in public institution
40302010
Pension
0
Northeast
Polog
East
Southwest
Southeast
In percent
Note: Total income by regions does not add up to 100 percent as the other categories are not shown.Source: Bartlett et al. (2009).
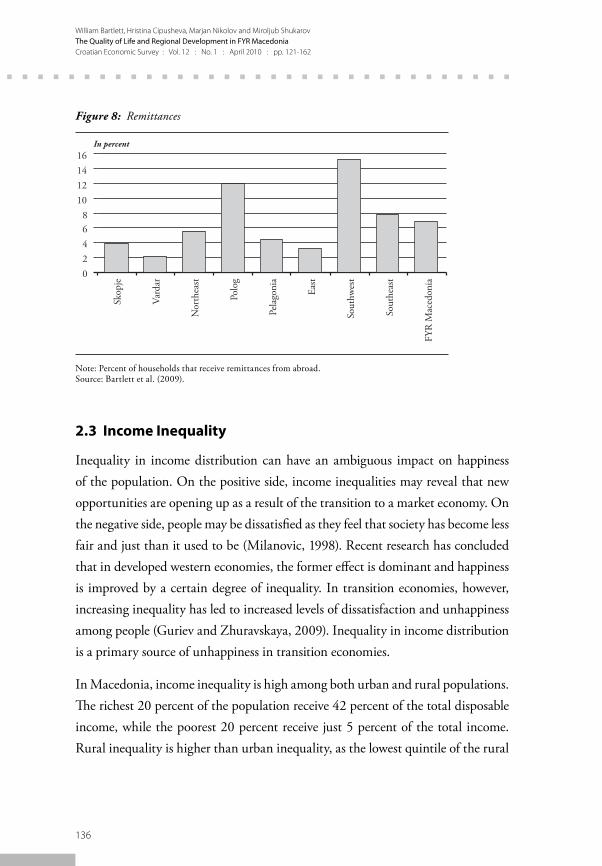
Remittances are an important source of income, especially in Polog and the Southwest, where more than one tenth of households receive remittances from abroad (see Figure 8). Relatively few households receive remittances in the East, Skopje, Pelagonia or Vardar.
136
William Bartlett, Hristina Cipusheva, Marjan Nikolov and Miroljub ShukarovThe Quality of Life and Regional Development in FYR MacedoniaCroatian Economic Survey : Vol. 12 : No. 1 : April 2010 : pp. 121-162
Figure 8: Remittances
0
2
4
68
10
12
14
16
Skop
je
Var
dar
Nor
thea
st
Polo
g
Pela
goni
a
Eas
t
Sout
hwes
t
Sout
heas
t
FYR
Mac
edon
ia
In percent
Note: Percent of households that receive remittances from abroad.Source: Bartlett et al. (2009).
2.3 Income Inequality
Inequality in income distribution can have an ambiguous impact on happiness of the population. On the positive side, income inequalities may reveal that new opportunities are opening up as a result of the transition to a market economy. On the negative side, people may be dissatisfi ed as they feel that society has become less fair and just than it used to be (Milanovic, 1998). Recent research has concluded that in developed western economies, the former eff ect is dominant and happiness is improved by a certain degree of inequality. In transition economies, however, increasing inequality has led to increased levels of dissatisfaction and unhappiness among people (Guriev and Zhuravskaya, 2009). Inequality in income distribution is a primary source of unhappiness in transition economies.
In Macedonia, income inequality is high among both urban and rural populations. Th e richest 20 percent of the population receive 42 percent of the total disposable income, while the poorest 20 percent receive just 5 percent of the total income. Rural inequality is higher than urban inequality, as the lowest quintile of the rural

137
William Bartlett, Hristina Cipusheva, Marjan Nikolov and Miroljub ShukarovThe Quality of Life and Regional Development in FYR MacedoniaCroatian Economic Survey : Vol. 12 : No. 1 : April 2010 : pp. 121-162
population receives only 5 percent of the equivalised disposable income while the highest quintile receives 43 percent of the equivalised disposable income, compared to 6 percent and 41 percent respectively for the urban population. Th e picture in Skopje mirrors that for urban locations in general. Inequality in equivalised income, measured by the Gini coeffi cient, is therefore somewhat higher in the rural areas than in the urban areas. However, inequality in equivalised expenditure is about the same in both rural and urban areas, being slightly higher in urban areas. Th is indicates that people living in rural and urban areas have a similar standard of expenditure irrespective of the income distribution, owing to a homogenous distribution of needs and expectations in rural and urban locations.
Table 1: Equivalised Disposable Income and Expenditure by Quintiles, by Location
Equivalised Disposable Income by Quintiles
Equivalised Disposable Expenditure by Quintiles
Quintiles Rural Urban Skopje Rural Urban Skopje
1 5% 6% 6% 8% 8% 8%
2 11% 12% 12% 15% 13% 14%
3 17% 17% 18% 20% 17% 18%
4 24% 23% 25% 23% 22% 23%
5 43% 41% 40% 35% 38% 37%
S80/S20 8 7 7 4 5 5
Source: Bartlett et al. (2009).
Another indicator of income distribution is the S80/S20 ratio – the ratio between the total income received by the highest quintile and the total income received by the lowest quintile (the poorest 20 percent of the population). Th ere is little diff erence between rural and urban locations (see Table 1). Diff erences are also observed on this measure in relation to ethnic groups. In the case of ethnic Macedonians this ratio is 8 (the richest 20 percent receive 8 times higher income in total than the poorest 20 percent). Th e highest ratio (hence the highest overall inequality) is among Roma (20).

138
William Bartlett, Hristina Cipusheva, Marjan Nikolov and Miroljub ShukarovThe Quality of Life and Regional Development in FYR MacedoniaCroatian Economic Survey : Vol. 12 : No. 1 : April 2010 : pp. 121-162
2.4 Poverty
Poverty is a major determinant of a low quality of life. In transition economies, where a signifi cant share of income comes from the informal sector, it is common for people to underreport their incomes. Consequently, poverty assessment is typically made on the basis both of incomes and expenditures.
Figure 9: Poverty Headcount
Skopje region
Whole country
4035
Poor households by expenditure (poverty headcount)
Poor households by income (poverty headcount)
302520151050
Southwest
Southeast
Northeast
Vardar
Polog
Pelagonia
East
In percent
Note: Th e poverty line is defi ned for households living under 60 percent of the median expenditure (6,571 denars) or median income (5,778 denars).Source: Bartlett et al. (2009).
Th e EU defi nes the “at-risk-of-poverty rate” as a share of people with an equivalised disposable income below 60 percent of the national equivalised median income. Th ere is a high degree of regional variability in the at-risk-of-poverty rate. In the Northeast, over one third of households are at risk of poverty, while in Pelagonia and Vardar less than one fi fth of households are at risk of poverty on the income-based measure. Th e reason why the income-based poverty measure is higher than the expenditure-based measure in almost all regions except Polog may be due to the fact that part of household incomes comes from the informal sector and is
139
William Bartlett, Hristina Cipusheva, Marjan Nikolov and Miroljub ShukarovThe Quality of Life and Regional Development in FYR MacedoniaCroatian Economic Survey : Vol. 12 : No. 1 : April 2010 : pp. 121-162
underreported, or that part of expenditure derives from a draw-down of savings. Th e share of individuals at risk of poverty is 28 percent on the income-based measure, whereas the share of individuals at risk of poverty on the expenditure-based poverty measure is lower at 19 percent. It is discouraging to note that, except for the Southwest and Vardar (on the income-based measure), the proportion of children under the age of 15 at risk of poverty is even higher than the overall proportion of households at risk of poverty. Th e Northeast has an extremely high proportion of children at risk of poverty, reaching over three fi fths when measured in relation to household income.
Figure 10: Poverty Gap
Skopje region
Whole country
25
Poverty gap (expenditure-based)
201510
Poverty gap (income-based)
50
Vardar
Southwest
Southeast
Polog
Pelagonia
Northeast
East
In percent
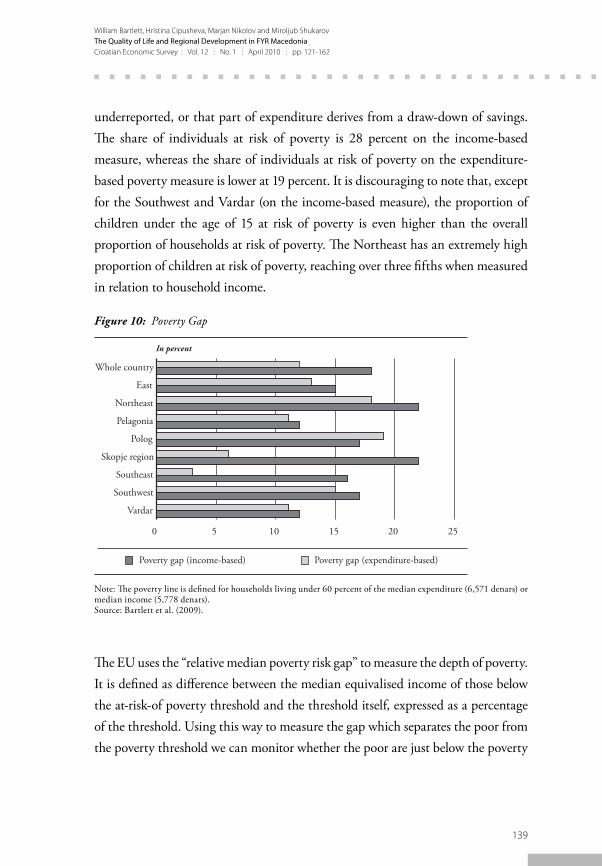
Note: Th e poverty line is defi ned for households living under 60 percent of the median expenditure (6,571 denars) or median income (5,778 denars).Source: Bartlett et al. (2009).
Th e EU uses the “relative median poverty risk gap” to measure the depth of poverty. It is defi ned as diff erence between the median equivalised income of those below the at-risk-of poverty threshold and the threshold itself, expressed as a percentage of the threshold. Using this way to measure the gap which separates the poor from the poverty threshold we can monitor whether the poor are just below the poverty
140
William Bartlett, Hristina Cipusheva, Marjan Nikolov and Miroljub ShukarovThe Quality of Life and Regional Development in FYR MacedoniaCroatian Economic Survey : Vol. 12 : No. 1 : April 2010 : pp. 121-162
threshold (suggesting that it is relatively easy for this group to escape poverty) or are deeply below it (suggesting that specifi c approaches are needed to reduce poverty). Figure 10 shows that the poverty gap is highest in the Northeast and lowest in Pelagonia.
A key element of social exclusion is the inability to make ends meet. Th e survey respondents are asked whether they are able to cover basic household bills and expenditures in relation to the household’s total monthly income. Th e proportion of households experiencing diffi culties in this way varies widely among the EU countries. Th e European Quality of Life surveys have shown that while just one in ten households in the EU-15 reports such diffi culties, the proportion is half as high again in the EU-25 (which includes the EU New Member States from the 2004 enlargement). Th e situation is even worse in FYR Macedonia, where a far greater proportion of people have diffi culty making ends meet. Th e survey data show that more than one half (55 percent) of households are in this position. Across the regions, the worst situation is in the Southeast where two thirds of households have diffi culty in making ends meet, while the Skopje region is in a relatively favourable position with just over one half reporting diffi culties. Overall, more people experience subjective poverty than the measurement of income-based poverty would suggest.
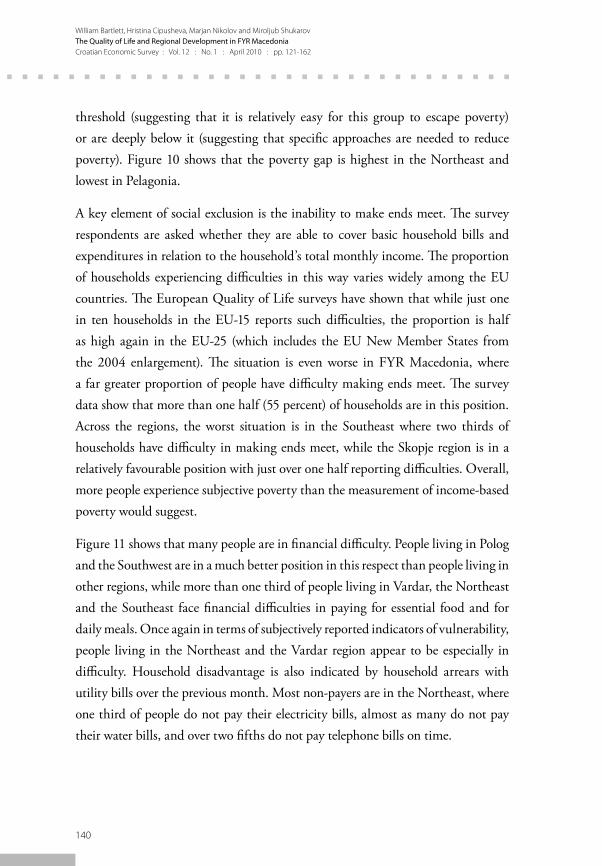
Figure 11 shows that many people are in fi nancial diffi culty. People living in Polog and the Southwest are in a much better position in this respect than people living in other regions, while more than one third of people living in Vardar, the Northeast and the Southeast face fi nancial diffi culties in paying for essential food and for daily meals. Once again in terms of subjectively reported indicators of vulnerability, people living in the Northeast and the Vardar region appear to be especially in diffi culty. Household disadvantage is also indicated by household arrears with utility bills over the previous month. Most non-payers are in the Northeast, where one third of people do not pay their electricity bills, almost as many do not pay their water bills, and over two fi fths do not pay telephone bills on time.

141
William Bartlett, Hristina Cipusheva, Marjan Nikolov and Miroljub ShukarovThe Quality of Life and Regional Development in FYR MacedoniaCroatian Economic Survey : Vol. 12 : No. 1 : April 2010 : pp. 121-162
Figure 11: Households Which Ran Out of Money to Pay for Essential Food for Daily Meals in the Six Months Prior to the Survey
10 15 20 25 30 35 40 45
East
Northeast
Pelagonia
Polog
Skopje region
Southeast
Southwest
Vardar
In percent
Source: Bartlett et al. (2009).
Poverty has many dimensions in addition to income and expenditure. We use an index of multiple deprivation to capture this multi-dimensional aspect of poverty and material deprivation. Th e deprivation index consists of six items:
1) keeping one’s home adequately warm;
2) paying for a week’s annual holiday;
3) replacing any worn-out furniture;
4) having a meal with meat every second day if you wanted;
5) buying new, rather than second-hand clothes;
6) having friends or family for a drink or meal at least once a month.
Th is index has a value of 0.7 in the EU-15, and 1.0 in the EU-25 group of countries. In FYR Macedonia the index is far higher at 2.6, meaning that, on average, people are deprived of almost three of the six items. On the basis of this index it appears

142
William Bartlett, Hristina Cipusheva, Marjan Nikolov and Miroljub ShukarovThe Quality of Life and Regional Development in FYR MacedoniaCroatian Economic Survey : Vol. 12 : No. 1 : April 2010 : pp. 121-162
that people in FYR Macedonia suff er signifi cantly more material deprivation than those in the EU. In terms of the deprivation index they are between two to three times worse off .
Figure 12: Multiple Deprivation Index by Region
2 2.2 2.4 2.6 2.8 3
Skopje
Vardar
Northeast
Polog
Pelagonia
East
Southwest
Southeast
Whole country
Index
Source: Bartlett et al. (2009).
Th e regional diff erences in the multiple deprivation index are shown in Figure 12. Th e region with the lowest level of material deprivation is the Skopje region. Th is is hardly surprising given that the Skopje region has the highest levels of GDP per capita and among the highest equivalised household income levels as well. Th e highest levels of material deprivation are found in Vardar and the Northeast, the latter of which corresponds to the region with the lowest level of equivalised household income. Th e relatively high levels of material deprivation in Vardar correspond to the high levels of subjective poverty in that region. Th ere is something of a contrast with the relatively high levels of equivalised household income in the Vardar region however, indicating the two measures of poverty, subjective and objective, are sometimes quite wide apart. Th is gives credence to the view that it is important to study subjective poverty levels in addition to the supposedly “hard” data from income studies, which may signifi cantly misrepresent the subjective experience of individuals and households.

143
William Bartlett, Hristina Cipusheva, Marjan Nikolov and Miroljub ShukarovThe Quality of Life and Regional Development in FYR MacedoniaCroatian Economic Survey : Vol. 12 : No. 1 : April 2010 : pp. 121-162
2.5 Labour Market
A critical weakness in the Macedonian economy is in the fi eld of job creation, due to the high costs of starting up new businesses and of employing new workers which has prevented the labour market from functioning eff ectively to reduce unemployment from its historically high levels. High long-term unemployment is related to the poor qualifi cation structure of the unemployed. A rigid legislative framework governing labour relations as well as a high tax wedge have contributed to a stagnant formal labour market and a large informal sector. Th ere is a vicious circle between unemployment, poverty and social exclusion. An initial spell of unemployment may lead to a lower standard of living and an increased risk of poverty. Th is in turn may increase the diffi culty of job search, and may eventually lead to long-term unemployment, social exclusion and individual stigmatization. Th e vicious circle is closed when social exclusion reduces the chances to obtain information about job vacancies. Th us, social exclusion often prevents poor people to actively participate on the labour market. Measured according to ILO methodology, the unemployment rate in the country, at 35 percent, is one of the highest in Europe, even though it has declined in recent years. Figure 13 shows that the unemployment rate, as measured by the survey, appears to be at 31 percent, below the ILO-measure unemployment rate reported by the State Statistical Offi ce.
At a regional level, according to the survey, the lowest unemployment rate is in the Skopje region, Polog, the Southwest and the East, while above average rates are found in the Northeast, Southeast, Pelagonia, and Vardar (see Figure 13). Th e diff erence in unemployment rates reported by our survey and the offi cial ILO measure reported by the State Statistical Offi ce may be attributable to diff erences in defi nition. Among ethnic groups, the unemployment rate is lowest for ethnic Albanians (27 percent) and highest for the Roma population (73 percent).

144
William Bartlett, Hristina Cipusheva, Marjan Nikolov and Miroljub ShukarovThe Quality of Life and Regional Development in FYR MacedoniaCroatian Economic Survey : Vol. 12 : No. 1 : April 2010 : pp. 121-162
Figure 13: Unemployment Rate by Region
0 5 10 15 20 25 30 35 40 45 50
Skopje
Vardar
Northeast
Polog
Pelagonia
East
Southwest
Southeast
Whole country
In percent
Source: Bartlett et al. (2009).
One key indicator of social exclusion is the share of households which have no employed member. Such households survive without any formally earned income which makes them especially vulnerable. Th e regional diff erences in this indicator are relatively high. In the country as a whole, almost one quarter of households is in this position, while one third has only one employed member. Th e Northeast has the most households with no employed members, with almost one third of households in such a position, while Polog and Vardar have the lowest proportion. Polog also has the highest proportion of households with three or more family members in employment.
Th e risk of losing one’s job is important for both economic and psychological reasons, and in addition such risk can also infl uence a person’s creditworthiness. Almost half of the people in the country as a whole consider that losing their job is very unlikely, while one in ten has insecure employment. Polog has the lowest proportion of people in insecure employment, while the Southeast and the Southwest have relatively high proportions of people with insecure jobs (see Figure 14).

145
William Bartlett, Hristina Cipusheva, Marjan Nikolov and Miroljub ShukarovThe Quality of Life and Regional Development in FYR MacedoniaCroatian Economic Survey : Vol. 12 : No. 1 : April 2010 : pp. 121-162
Figure 14: Net Job Security by Region
5 10 15 20 25 30 35
Vardar
Southwest
Southeast
Skopje region
Polog
Pelagonia
Northeast
East
Whole country
In percent
Note: Net job security is defi ned as the diff erence between those survey respondents who report that it is “very unlikely” that they will lose their job and those who report that it is “very likely” that they will lose their job.Source: Bartlett et al. (2009).
Long-term unemployment also has a negative eff ect on people’s life chances and increases social exclusion. Making numerous unsuccessful attempts to fi nd a job demoralizes people and creates an impression that the community has discarded them. As a consequence, unemployed people often become discouraged, losing hope that their eff orts to fi nd a job could change anything. Youth unemployment is especially problematic, leading to anti-social behaviour and exposing young unemployed people to the temptation of criminal activities. Older long-term unemployed people often withdraw from the labour market altogether (UNDP, 2002). On the other hand, high unemployment encourages people to apply for a job at every new competition which puts downward pressure on wages and salaries. Th is means that active labour market measures should be promoted, and the unemployment register should refl ect only those who are genuinely seeking work, and exclude those who only report as unemployed in order to be eligible for other entitlements such as social and health insurance.

146
William Bartlett, Hristina Cipusheva, Marjan Nikolov and Miroljub ShukarovThe Quality of Life and Regional Development in FYR MacedoniaCroatian Economic Survey : Vol. 12 : No. 1 : April 2010 : pp. 121-162
2.6 Education
In FYR Macedonia the labour market is characterised by unskilled and low productivity employment refl ected in relatively low salaries. Among the unemployed, the largest groups are the people with educational level up to primary school (54 percent) and secondary education (33 percent), whereas 6 percent of the unemployed lack a complete primary education (Bartlett et al., 2009). Education is a key factor in restoring social cohesion in post-confl ict societies, especially ethnically divided ones, where it can either promote or block reconciliation depending on the education policies adopted and the way in which they are implemented. In transition societies, education is an important element in facilitating change in society. In particular, the reform of vocational education is essential for the wider aims of labour market reform, labour reallocation, and structural adjustment. Without people trained in new skills appropriate to an emerging market economy, wider hopes for economic development are likely to fl ounder. Moreover, education contributes to reducing the risk of poverty.
In FYR Macedonia education expenditures at 5.7 percent of GDP in 2008 were higher than in most other countries of the region. Th e share of people with secondary education is around 87 percent, while 51 percent have received some form of higher education. Secondary schooling only became mandatory in 2008. According to offi cial reports, the Gross Enrolment Rate (GER) in secondary schools increased from 88 percent in 2006 to 95 percent in 2008. However, this does not mean that the education provided is eff ective, or that it increases skills and expertise, rather than just providing formal qualifi cations. Enrolment levels in secondary education depend partly on family wealth, place of residence, and ethnicity, and there are signifi cant diff erences in spending on schools with diff erent ethnic composition. Consequently, educational outcomes are worse than in neighbouring countries, contributing to relatively low rates of economic growth. Th ere is also an excess supply of people with lower education among the unemployed because too few low-skill jobs are being created to eliminate unemployment (Nikolov, 2005). In recent years, new private universities have enrolled as many students as
147
William Bartlett, Hristina Cipusheva, Marjan Nikolov and Miroljub ShukarovThe Quality of Life and Regional Development in FYR MacedoniaCroatian Economic Survey : Vol. 12 : No. 1 : April 2010 : pp. 121-162
possible and off er easy studies to obtain a diploma. As a consequence, the GER in higher education has increased sharply from 42 percent to 85 percent. Th is is a remarkable achievement which, if true, is probably the fastest rate of expansion of higher education in Europe.5 However, there is little control as to what they are “producing”, i.e., what quality graduates from higher education are off ering to the labour market.
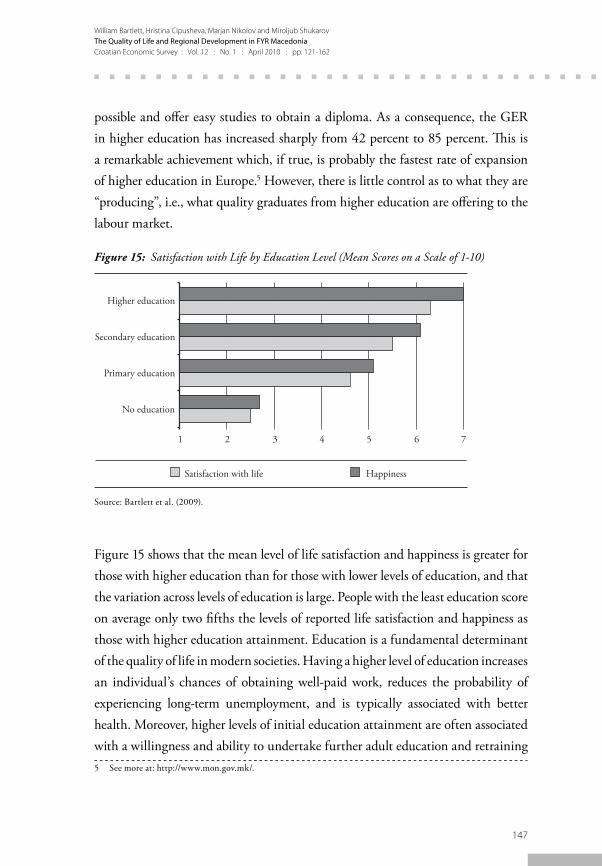
Figure 15: Satisfaction with Life by Education Level (Mean Scores on a Scale of 1-10)
1 2 3 4 5 6 7
No education
Primary education
Secondary education
Higher education
Satisfaction with life Happiness
Source: Bartlett et al. (2009).
Figure 15 shows that the mean level of life satisfaction and happiness is greater for those with higher education than for those with lower levels of education, and that the variation across levels of education is large. People with the least education score on average only two fi fths the levels of reported life satisfaction and happiness as those with higher education attainment. Education is a fundamental determinant of the quality of life in modern societies. Having a higher level of education increases an individual’s chances of obtaining well-paid work, reduces the probability of experiencing long-term unemployment, and is typically associated with better health. Moreover, higher levels of initial education attainment are often associated with a willingness and ability to undertake further adult education and retraining 5 See more at: http://www.mon.gov.mk/.

148
William Bartlett, Hristina Cipusheva, Marjan Nikolov and Miroljub ShukarovThe Quality of Life and Regional Development in FYR MacedoniaCroatian Economic Survey : Vol. 12 : No. 1 : April 2010 : pp. 121-162
in later life, enabling better educated individuals to more easily adjust to the process of structural change during transition.
Figure 16: Training Courses Taken
Training organised by Employment Service Training organised by municipal government
Training organised by NGO Other
Apprenticeship training In-house training organised by employer
0 5 10 15 20 25
Vardar
Southwest
Southeast
Skopje region
Polog
Pelagonia
Northeast
East
In percent
Source: Bartlett et al. (2009).
Lifelong learning is widely regarded as crucial for successful local economic development. However, Figure 16 shows that few people are following training courses of any type, and of those who are, most are organised by the employer. Th e subject of the training course was mostly in ICT and languages. Th e regional diff erences are noticeable with the greatest proportionate access to training courses being in Pelagonia and the lowest in the Skopje region. Training is also prevalent in the deprived Northeast of the country, which is an encouraging sign that policies are being targeted to the population in need. In a globalised world the problem of social exclusion, vulnerability and deprivation can best be tackled if an economy becomes a knowledge economy, with high levels of innovation, education, training, and lifelong learning. Th e reforms in the education system should be directed

149
William Bartlett, Hristina Cipusheva, Marjan Nikolov and Miroljub ShukarovThe Quality of Life and Regional Development in FYR MacedoniaCroatian Economic Survey : Vol. 12 : No. 1 : April 2010 : pp. 121-162
towards this end. Special attention should be paid to the human and fi nancial resources required for the mandatory secondary education.
2.7 Health Services
Reforms carried out immediately after the country became independent in 1991 legalised the private provision of health services by primary health care practitioners. A World Bank project completed in 2002 proposed an extension of the privatisation of the primary care sector and the introduction of capitation payments for family doctors (Nordyke and Peabody, 2002). In 2004 amendments to the Law on Health Care enabled the privatisation of pharmacies and dental services on the basis of leasing of facilities from the state. Th e Ohrid Agreement mandated the decentralisation of the health care responsibilities to the municipal level, and representatives of municipalities have begun to participate on the boards of primary health care centres (Gjorgjev et al., 2006).
While health outcomes are better than in many countries with similar income levels, these outcomes are achieved at a relatively high cost. Health sector spending makes up 15 percent of government expenditure and has historically been an area with signifi cant risks associated with pharmaceutical procurement and less than fully transparent operation of the Health Insurance Fund and health care institutions. Health planning has over-emphasised in-patient care in hospitals to the detriment of more cost-eff ective preventative and primary care services in the community. Informal out-of-pocket payments to the doctor are a normal expectation, imposing an obstacle to access to health services for low income families.
Following the reforms and the privatisation which they introduced, spatial inequalities in the provision of health services have emerged. Th e survey shows that access to a hospital is most diffi cult in the Northeast, while the Skopje region and the Southwest are also in a similar position (see Figure 17). Access to a primary medical centre is most diffi cult in the Southwest, and easiest in the Southeast.

150
William Bartlett, Hristina Cipusheva, Marjan Nikolov and Miroljub ShukarovThe Quality of Life and Regional Development in FYR MacedoniaCroatian Economic Survey : Vol. 12 : No. 1 : April 2010 : pp. 121-162
Taking both indicators together it seems that the access to health services is most problematic in the Southwest region.
Figure 17: Share of Respondents for Whom Distance to Nearest Medical Centre or Hospital is More than One Kilometre
0 10 20 30 40 50 60 70 80 90
Vardar
Southwest
Southeast
Skopje region
Polog
Pelagonia
Northeast
East
Whole country
Nearest primary medical centre Nearest hospital
In percent
Source: Bartlett et al. (2009).
Access to health care is clearly unevenly distributed across the regions in Macedonia. It is noticeable that the distance to the nearest primary medical centre is far more uneven across regions than the distance to the nearest hospital. Th is suggests that there is much scope for health planners to rebalance the distribution of resources within the health care system to improve the spatial inequalities in health care services. Primary health care is one of the functions being devolved to local administrations under the decentralisation process agreed under the Ohrid Framework Agreement which brought the civil confl ict in Macedonia in 2001 to an end. However, decentralisation often leads to even greater levels of inequality, due to the variable capacity of local administrations to fi nance public services. Whether decentralisation will lead to an improvement in health care provision and in other local public services is an open question, but this will almost inevitably also have signifi cant impacts on the quality of life in the coming years.

151
William Bartlett, Hristina Cipusheva, Marjan Nikolov and Miroljub ShukarovThe Quality of Life and Regional Development in FYR MacedoniaCroatian Economic Survey : Vol. 12 : No. 1 : April 2010 : pp. 121-162
2.8 Quality of Life
Regional imbalances appear to be high by all the measures used. However, diff erent measures provide a diff erent ranking of regions on the various aspects of the quality of life reviewed in this chapter. In order to provide an overview of this otherwise potentially confusing picture, it is appropriate to construct an overall index of the quality of life across the regions in Macedonia. Any construction of a synthetic index of the quality of life is bound to contain a certain degree of arbitrariness, depending on the set of sub-indicators that are included. Th e weighting attached to these indicators is also a controversial aspect of the construction of a synthetic indicator, refl ecting the implicit policy evaluation of the signifi cance of the diff erent components. In constructing our synthetic indicator here we adopt the principles set out in Atkinson et al. (2002) in their discussion of a synthetic index of social exclusion. Th e fi rst principle is that the basic indicators should be balanced across diff erent dimensions. Any selection of these indicators inevitably has to be made, since no available set of indicators can be exhaustive. However, the selection should ensure that all main areas of concern are covered. Secondly, the indicators should generally have similar levels of importance, suggesting also that they would have broadly equal weights in the synthetic index. To achieve this we take the overall average of the indicators in constructing our synthetic index. Taking ten of the indicators addressed in the chapter, an overall ranking was computed. Th e procedure adopted was to take the raw values of the following indicators, and to rank them individually according to a unique alphabetical list of regions:
1) happiness score;
2) index of GDP per capita;
3) mean deprivation index;
4) median household equivalent disposable income;
5) net job security;

152
William Bartlett, Hristina Cipusheva, Marjan Nikolov and Miroljub ShukarovThe Quality of Life and Regional Development in FYR MacedoniaCroatian Economic Survey : Vol. 12 : No. 1 : April 2010 : pp. 121-162
6) poverty gap (income-based);
7) poverty headcount (income-based);
8) proportion of households which could not pay for essential food;
9) satisfaction with life score;
10) unemployment rate.
Th e rank scores of these indicators were then summed to provide the overall quality of life score. Th e indicators have been selected in accordance with the Atkinson et al. principles that cover the broad spectrum of concerns which are encompassed in the concept of the quality of life. Th ey include the mean happiness score as an important component of the subjective assessment of the quality of life as discussed above, as well as the more objective index of GDP per capita as a measure of the economic conditions in the regions. Th e other indicators used cover the fi elds of vulnerability, deprivation, poverty and labour market access.
Figure 18: Scores for Overall Quality of Life by Region
0 10 20 30 40 50 60
Northeast
Vardar
Southeast
Pelagonia
Southwest
Polog
East
Skopje region
Index
Source: Bartlett et al. (2009).

153
William Bartlett, Hristina Cipusheva, Marjan Nikolov and Miroljub ShukarovThe Quality of Life and Regional Development in FYR MacedoniaCroatian Economic Survey : Vol. 12 : No. 1 : April 2010 : pp. 121-162
Th e full ranking is portrayed in Figure 18. Th e results show that the quality of life is highest in the Skopje region and lowest in the Northeast, closely followed by the Vardar region.
3 ConclusionsTh is paper has used the fi ndings from a large scale household survey to investigate the regional profi le of the quality of life using both objective and subjective indicators. It has shown a very low level of life satisfaction and happiness in FYR Macedonia compared to many other European and transition economies, in line with fi ndings from previous research studies. Th e household survey has furthermore revealed relatively large regional diff erences in life satisfaction and happiness, and that these regional diff erences are higher for females than for males, higher for younger people than for older people, higher for the better educated than for the less educated, and higher for those living in urban areas than those living in rural areas. Ethnic Macedonians as well as ethnic Albanians are equally dissatisfi ed with their lives, while the Roma are highly unsatisfi ed. Levels of happiness tend on the whole to be higher than levels of life satisfaction as individuals adjust to their circumstances. However, levels of happiness are more diverse, with lower levels of happiness among ethnic Albanians than among ethnic Macedonians. People living in rural areas are less satisfi ed with their lives than those living in urban areas, which have been a magnet for the migration of young people from the countryside, leaving behind a more vulnerable and poorer population in the villages. Th ere is, therefore, a need for rural development policies to increase investment in infrastructure to make the villages once again attractive places for young people and entrepreneurs to live. Programmes to promote lifelong learning in rural areas, to establish industrial zones for small manufacturing and service industries, to develop rural cooperatives and social enterprises, and to promote networking of associations and community organisations to build rural social capital are needed to achieve these aims.

154
William Bartlett, Hristina Cipusheva, Marjan Nikolov and Miroljub ShukarovThe Quality of Life and Regional Development in FYR MacedoniaCroatian Economic Survey : Vol. 12 : No. 1 : April 2010 : pp. 121-162
Not surprisingly, the level of life satisfaction and happiness is closely correlated with the level of income. More than half of households have equivalised income below the national average, while one quarter has no income at all. Overall, the richest 20 percent of the population receive 42 percent of total disposable income, while the poorest 20 percent receive just 5 percent. Most income is derived from employment in private fi rms, although there is also a high share from employment in the public sector. Remittances are also an important source of income, especially for the Southwest and Polog regions. Income inequalities are somewhat higher in rural than in urban areas, but these diff erences largely disappear when inequality is measured by expenditure inequality. Th e poverty headcount and the poverty gap measures show that people living in the Northeast region are far below the poverty line. Th e wide extent of poverty is shown by the fi nding that half of all households have diffi culties in making ends meet, with the worst situation in the Southeast and the best in the Skopje region. Deprivation, as measured by the index of multiple deprivation, is most severe in Vardar and least severe in the Skopje region. Th e survey also revealed a disturbing incidence of child poverty which is extremely high in some regions such as the Northeast. Anti-poverty measures should focus on the issue of child poverty, and assistance for large families and single parents should become a priority of government policy in this area, as should the development of appropriate family policies and the training of social workers specialised in dealing with the problems of disadvantaged children.
Th e survey also confi rmed a strong correlation between the quality of life and the age of the respondents. Happiness and life satisfaction diminish with age, being lowest for the age group of 55 years and above. Th is suggests a role for policies to improve the quality of life of the elderly. Th is age group is especially vulnerable to long-term unemployment, and to poverty due to the low level of state pensions. While pension reforms have taken place in recent years designed to address the latter problem, they will not solve the problem of low incomes of pensioners alive today. A concerted programme to improve the quality of life of elderly people is needed. Decentralisation has transferred responsibility for old people’s homes to

155
William Bartlett, Hristina Cipusheva, Marjan Nikolov and Miroljub ShukarovThe Quality of Life and Regional Development in FYR MacedoniaCroatian Economic Survey : Vol. 12 : No. 1 : April 2010 : pp. 121-162
the municipalities, and these require suffi cient support both fi nancially and for staff training from the central government. Th e housing and health needs of the elderly population also need to be addressed, including both the issue of access to health care facilities, and the adaptation of housing to the needs of the infi rm elderly population.
Regional diff erences in labour market participation and unemployment are pronounced, and youth unemployment and long-term unemployment are a serious problem. Th ere is a relatively high share of households which have no employed members at all. Regional diff erences in unemployment are high, and the government should develop active labour market measures for the most disadvantaged regions. Th e unemployment rate measured by the survey is lower than the offi cial measure, and is lowest for ethnic Albanians and highest for Roma population. However, even among those who are employed, job insecurity is a further diffi culty faced by many. Youth unemployment and long-term unemployment are a serious problem especially given the high level of unemployment in some regions. Many of the unemployed have had only a short formal employment history and have become increasingly diffi cult to employ with little relevant working experience, low education and poor job-seeking skills. In the Northeast and Vardar there is a relatively high share of households which have no employed members at all. Job insecurity is a further diffi culty faced by many in employment, an issue which appears to be especially problematic in the Southeast. Policy-makers should continue their eff orts to develop active labour market policies, including greater fl exibility in working time, improved regulation and government administration to reduce the informal economy and undeclared employment, support for lifelong learning to help workers to improve their skills, and special programs targeting those long-term unemployed.
Th e fi ndings confi rmed a strong correlation between quality of life and education levels. Better educated people are systematically happier and more satisfi ed with their lives. Th is suggests an important role for the government through continuing eff orts to improve the quality of educational experience. Primary and secondary
156
William Bartlett, Hristina Cipusheva, Marjan Nikolov and Miroljub ShukarovThe Quality of Life and Regional Development in FYR MacedoniaCroatian Economic Survey : Vol. 12 : No. 1 : April 2010 : pp. 121-162
education have been devolved to local authority responsibility through the decentralisation process, and it is important that this local responsibility is backed up by adequate funding from the central government, especially in areas of greatest deprivation such as the Northeast and other deprived regions and localities. Education is an important means to improve life chances, and the enrolment rate in higher education has increased sharply in recent years. However, there are doubts about the quality of the education received, and there is a continuing skills gap in the labour market. In addition, the survey revealed a rather low level of educational attainment in foreign languages and ICT skills among the adult population. Th is should be addressed by far greater attention to programmes of lifelong learning and adult education.
Th e survey also confi rmed high regional inequalities in access to health services in terms of distance to health care facilities, and in the incidence of barriers of various sorts to health care services. Th e privatisation of the primary health care has clearly not resolved this issue. Despite attempts at health service reforms, little progress has been made in cutting costs, increasing transparency and improving governance in the health sector (IMF, 2004: 13-14). Inside the health care institutions low salaries, poor organisation and shortage of basic supplies reduce morale and motivation. Specifi c problems include very poor standards of hygiene in many facilities, including maternity wards, a serious shortage of cars for rural health workers, and a tendency for the more able professionals to move away from the rural areas for employment in urban areas where conditions and opportunities are better.
On the basis of the survey fi ndings, the paper has set out several factors which have contributed to the quality of life at the regional level, including household income, income inequality, poverty, and other factors such as unemployment and job security, education, and access to health and other social services. Taking all these together, an index of the quality of life was developed which revealed that the highest quality of life in the country is enjoyed by residents in the Skopje region, while the lowest quality of life is found in the Northeast region of the country.

157
William Bartlett, Hristina Cipusheva, Marjan Nikolov and Miroljub ShukarovThe Quality of Life and Regional Development in FYR MacedoniaCroatian Economic Survey : Vol. 12 : No. 1 : April 2010 : pp. 121-162
Between these extremes, a wide variation in the quality of life is observed at regional levels. Th is fi nding emphasises the relevance and importance of developing regional polices that could raise the quality of life in the more deprived regions. It should be recognised, of course, that there is also substantial intra-regional variation, and that the issue of the quality of life at a municipal level is one which aff ects all regions to a greater or lesser degree.
158
William Bartlett, Hristina Cipusheva, Marjan Nikolov and Miroljub ShukarovThe Quality of Life and Regional Development in FYR MacedoniaCroatian Economic Survey : Vol. 12 : No. 1 : April 2010 : pp. 121-162
AppendixMethodological Framework: The Sample Procedure
Th e sample procedure was based on the principle of making a national and regional representative sample defi ning the region according to its defi nition by the State Statistical Offi ce (EU’s NUTS 3). Th e number of respondents in each of the regions was approximately proportionately distributed to the total number of population 18+ in each region, using the offi cial statistics from the national census of 2002. Th e actually realized total sample consists of 2,797 households6, each represented by a respondent aged 18+. Th e primary selection criterion was determined taking into account the specifi c nature of the geo-demographic structure of FYR Macedonia. According to the latest municipal division of the country, the top three most inhabited municipalities in the region contain 70.5 percent of 18+ population (except Skopje region). Th e diverse urbanization characteristics of the municipalities allow for effi cient recruitment of respondents living in diff erent types of urbanization and thereby diff erent types of dwellings. In addition to the primary selected municipalities, the random choice of one or two smaller municipalities in each region was included in the sample, as well as one municipality which was a part of the booster sample.7 In order to avoid the potential of overweighting for the additional municipalities selected in every region, their participation was proportional to the relative size of the municipality, though in some cases when the municipality was signifi cantly small, overweighting was allowed in order to cover for the potential sampling error (the limit being at least 15 respondents per municipality). As a result of the applied methodology 42 municipalities participated in the research, which represent 50 percent of the total number of the municipalities in the country. Th e random route sample methodology which enables more persons to be selected around the assigned sampling point was applied since there was a time constraint for collecting, controlling and processing
6 From the conducted 3,000 interviews, 203 were excluded because they did not satisfy the validity criteria.
7 Th e booster refers to rural municipalities that satisfy certain demographic, social and economic criteria, such as low educational level, low level of literacy, high unemployment rate and low GDP per capita. Th e values of these criteria were taken from the 2002 Census.
159
William Bartlett, Hristina Cipusheva, Marjan Nikolov and Miroljub ShukarovThe Quality of Life and Regional Development in FYR MacedoniaCroatian Economic Survey : Vol. 12 : No. 1 : April 2010 : pp. 121-162
of data. Th e interviews were carried out face-to-face in people’s homes, using Paper-and-Pencil (PAPI). Eight groups of interviewers were formed – each being active in one particular region and a total of 66 interviewers were engaged in the project. Each group was assigned a coordinator and his/her obligation was to coordinate as well as supervise the fi eldwork by monitoring the fulfi lment of the basic criteria such as the routing and selection of households. Th e fi eldwork started on 21 July 2008 and lasted until 16 August 2008. Th e responsiveness of the total number of persons to whom the questionnaires were given was 27 percent, i.e., just over one quarter of households that were approached agreed to fi ll in the questionnaire.

160
William Bartlett, Hristina Cipusheva, Marjan Nikolov and Miroljub ShukarovThe Quality of Life and Regional Development in FYR MacedoniaCroatian Economic Survey : Vol. 12 : No. 1 : April 2010 : pp. 121-162
LiteratureAtkinson, Tony, Bea Cantillon, Eric Marlier and Brian Nolan, 2002, Social Indicators: Th e EU and social inclusion, Oxford: Oxford University Press.
Bartlett, William, Veton Latifi , Marjan Nikolov, Jovan Pejkovski and Miroljub Shukarov, 2009, People Centred Analyses: Regional development, local governance and the quality of life, Skopje: South East European University and UNDP.
Daly, Mary and Richard Rose, 2007, First European Quality of Life Survey: Key fi ndings from a policy perspective, Luxembourg: European Foundation for the Improvement of Living and Working Conditions, Offi ce for Offi cial Publications of the European Communities.
EBRD, 2007a, Life in Transition, London: European Bank for Reconstruction and Development.
EBRD, 2007b, Transition Report 2007: People in Transition, London: European Bank for Reconstruction and Development.
European Foundation, 2004, Quality of Life in Europe for 2003, Dublin: European Foundation for the Improvement of Living and Working Conditions.
European Foundation, 2005, First European Quality of Life Survey, income inequalities and deprivation, Luxembourg: European Foundation for the Improvement of Living and Working Conditions, Offi ce for Offi cial Publications of the European Communities.
Fahey, Tony, Brian Nolan and Christopher T. Whelan, 2003, Monitoring quality of life in Europe, Luxembourg: European Foundation for the Improvement of Living and Working Conditions, Offi ce for Offi cial Publications of the European Communities.
161
William Bartlett, Hristina Cipusheva, Marjan Nikolov and Miroljub ShukarovThe Quality of Life and Regional Development in FYR MacedoniaCroatian Economic Survey : Vol. 12 : No. 1 : April 2010 : pp. 121-162
Gjorgjev, Dragan, Angelina Bacanovic, Snezana Cicevalieva, Zlate Sulevski and Susanne Grosse-Tebe, 2006, “Th e Former Yugoslav Republic of Macedonia: health system review”, Health Systems in Transition, 8(2), pp. 1-98.
Guriev, Sergei M. and Ekaterina V. Zhuravskaya, 2009, “(Un)happiness in transition”, Journal of Economic Perspectives, 23(2), pp. 143-168.
Hayo, Bernd and Wolfgang Seifert, 2003, “Subjective economic well-being in Eastern Europe”, Journal of Economic Psychology, 24(3), pp. 329-348.
IMF, 2004, IMF Country Report, No. 04/276, Washington, DC: International Monetary Fund.
Landesmann, Michael and Terry Ward, 2004, Economic Restructuring and Labour Markets in the Accession Countries, Brussels: European Commission: Directorate-General for Employment, Social Aff airs and Equal Opportunities Unit A.1.
Layard, Richard, 2005, Happiness: lessons from a new science, London: Penguin Books.
Milanovic, Branko, 1998, Income, Inequality, and Poverty during the Transition from Planned to Market Economy, Washington, DC: Th e World Bank.
Nikolov, Marjan, 2005, Report on the labour market in Macedonia, Skopje: Center for economic analyses – CEA.
Nordyke, Robert J. and John W. Peabody, 2002, “Market reforms and public incentives: fi nding a balance in the Republic of Macedonia”, Social Science & Medicine, 54(6), pp. 939-953.
OECD, 2000, “Disparities in regional labour markets”, Chapter 2, Employment Outlook 2000, Paris: Organisation for Economic Cooperation and Development.
Petrakos, George, 2001, Patterns of Regional Inequality in Transition Economies, European Planning Studies, 9(3), pp. 359-383.

162
William Bartlett, Hristina Cipusheva, Marjan Nikolov and Miroljub ShukarovThe Quality of Life and Regional Development in FYR MacedoniaCroatian Economic Survey : Vol. 12 : No. 1 : April 2010 : pp. 121-162
Sanfey, Peter and Utku Teksoz, 2007, “Does transition make you happy?”, Economics of Transition, 15(4), pp. 707-731.
UNDP, 2002, How to Make Local Development Work, Bratislava: United Nations Development Programme.
UNDP, 2006, Quality of Life and the Risk of Social Exclusion in the Republic of Croatia, Zagreb: United Nations Development Programme.