the purple book · 2 the purple book | 2015 the purple books give the most comprehensive picture of...
TRANSCRIPT

The Purple BookD B P E N S I O N S U N I V E R S E R I S K P R O F I L E | 2 0 1 5

2 t h e p u r p l e b o o k | 2 0 1 5
The Purple Books give the most comprehensive picture
of the risks faced by the PPF-eligible defined benefit
pension schemes.

3t h e p u r p l e b o o k | 2 0 1 5
Chapter 1: Executive Summary 9
Chapter 2: The Data 14
Chapter 3: Scheme Demographics 18
Chapter 4: Scheme Funding 26
Chapter 5: Funding Sensitivities 37
Chapter 6: Insolvency Risk 45
Chapter 7: Asset Allocation 48
Chapter 8: PPF Risk Developments 55
Chapter 9: PPF Levy Payments 2014/15 59
Chapter 10: Schemes in Assessment 66
Chapter 11: PPF Compensation 2014/15 73
Chapter 12: Risk Reduction 79
Appendix 83
Glossary 88
Contents

4 t h e p u r p l e b o o k | 2 0 1 5
Chapter 1: Figure 1.1 | UK economic and financial environment 10
Chapter 2: Figure 2.1 | Distribution of schemes excluding those in assessment by number of members as at 31 March 2015 16
Figure 2.2 | Distribution of assets, s179 liabilities and memberships by number of members as at 31 March 2015 16
Figure 2.3 | Purple datasets and universe estimates 17
Chapter 3: Figure 3.1 | Distribution of schemes by status 20
Figure 3.2 | Distribution of schemes by status 20
Figure 3.3 | Distribution of schemes by status (excluding hybrid schemes) 21
Figure 3.4 | Schemes by status and year 21
Figure 3.5 | Memberships by status and year 21
Figure 3.6 | Scheme status by member group 22
Figure 3.7 | Percentage distribution of memberships by scheme status 22
Figure 3.8 | Distribution of membership by status 22
Figure 3.9 | Distribution of membership by status (excluding hybrid schemes) 23
Figure 3.10 | Membership by membership type and status, 31 March 2015 23
Figure 3.11 | Active memberships in Purple datasets 23
Figure 3.12 | Distribution of member types in the Purple 2015 dataset 24
Figure 3.13 | Distribution of member types in the Purple 2015 dataset 24
Figure 3.14 | Proportion of schemes by size band by year 24
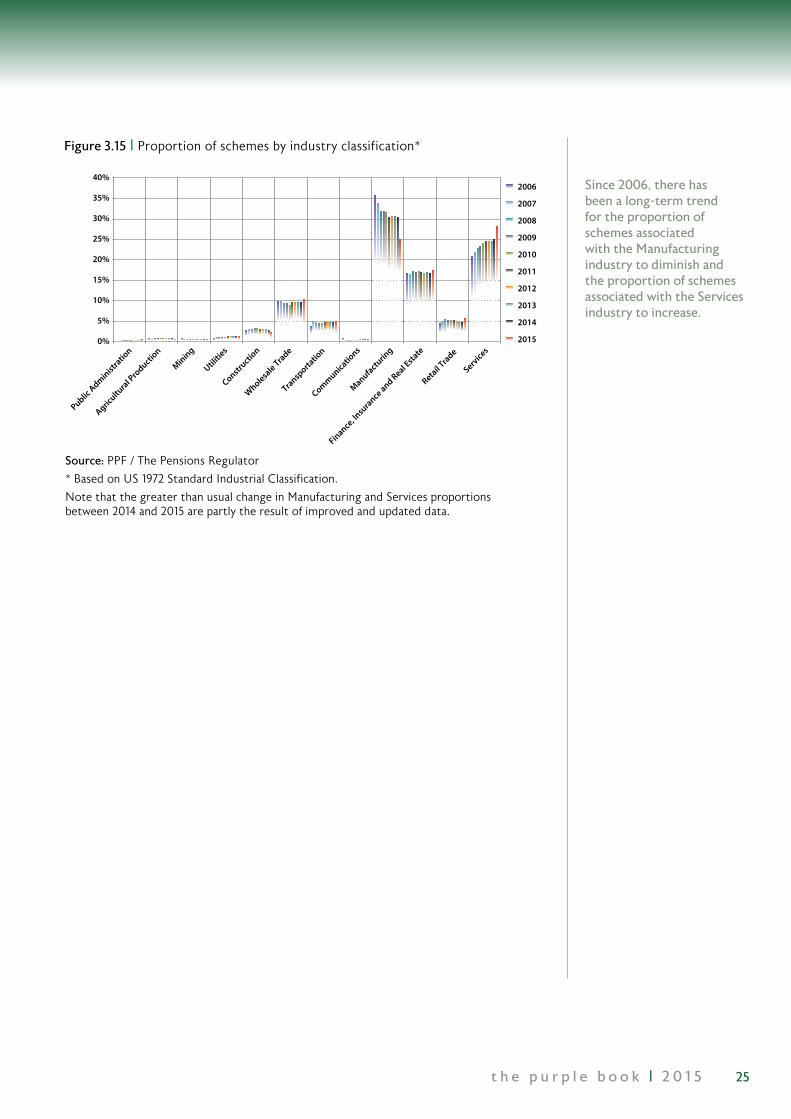
Figure 3.15 | Proportion of schemes by industry classification 25
Chapter 4: Figure 4.1 | Key funding statistics as at 31 March 2015 27
Figure 4.2 | Historical funding figures on a s179 basis 28
Figure 4.3 | Historical funding figures on a full buy-out basis 28
Figure 4.4 | s179 funding levels by size of scheme membership as at 31 March 2015 29
Figure 4.5 | Total assets and liabilities on a s179 basis as at 31 March 2015 29
Figure 4.6 | Distribution of s179 funding levels by size of scheme membership as at 31 March 2015 30
Charts and Tables

5t h e p u r p l e b o o k | 2 0 1 5
Figure 4.7 | Estimated full buy-out levels by size of scheme membership as at 31 March 2015 30
Figure 4.8 | Total assets and liabilities by size of scheme membership on an estimated full buy-out basis as at 31 March 2015 31
Figure 4.9 | Distribution of buy-out funding levels by size of scheme membership as at 31 March 2015 31
Figure 4.10 | Analysis of s179 funding levels by scheme maturity as at 31 March 2015 32
Figure 4.11 | Distribution of s179 assets and liabilities by scheme maturity as at 31 March 2015 32
Figure 4.12 | Distribution of funding levels on a s179 basis by scheme maturity as at 31 March 2015 33
Figure 4.13 | Analysis of s179 funding levels by scheme status as at 31 March 2015 33
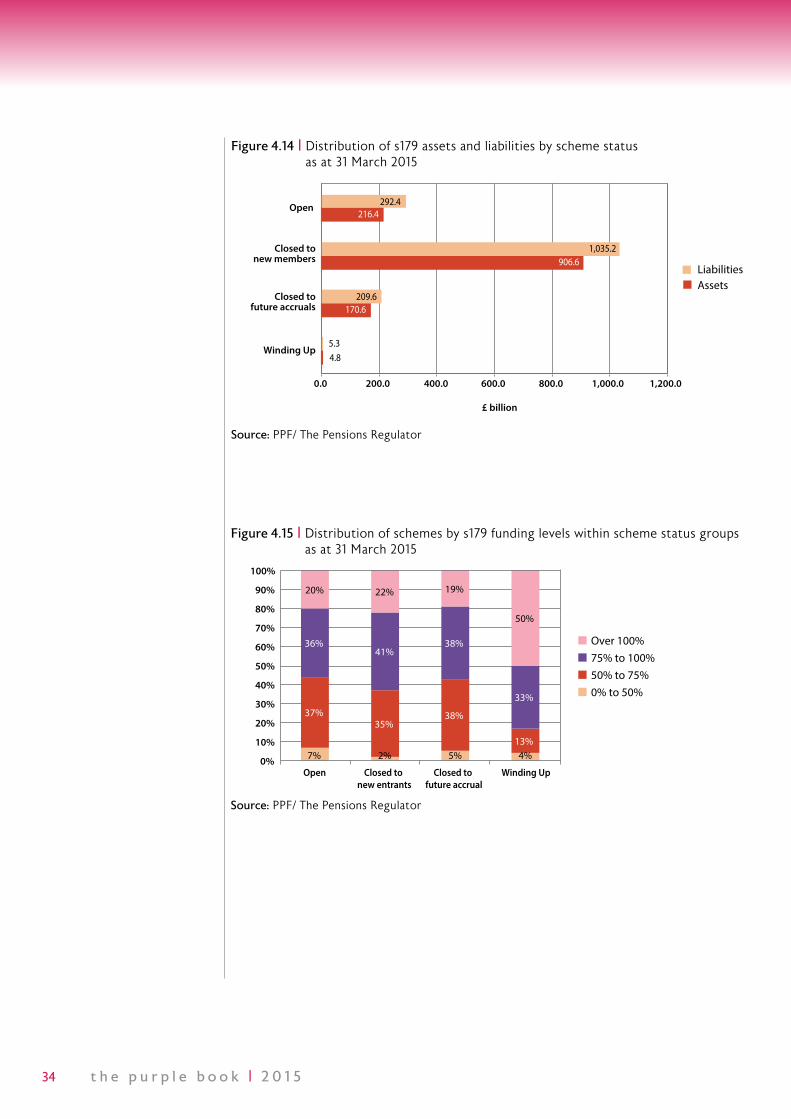
Figure 4.14 | Distribution of s179 assets and liabilities by scheme status as at 31 March 2015 34
Figure 4.15 | Distribution of schemes by s179 funding levels within scheme status groups as at 31 March 2015 34
Figure 4.16 | Analysis of estimated full buy-out funding levels by scheme status as at 31 March 2015 35
Figure 4.17 | Distribution of estimated full buy-out assets and liabilities by status as at 31 March 2015 35
Figure 4.18 | Distribution of estimated full buy-out funding levels by scheme status as at 31 March 2015 35
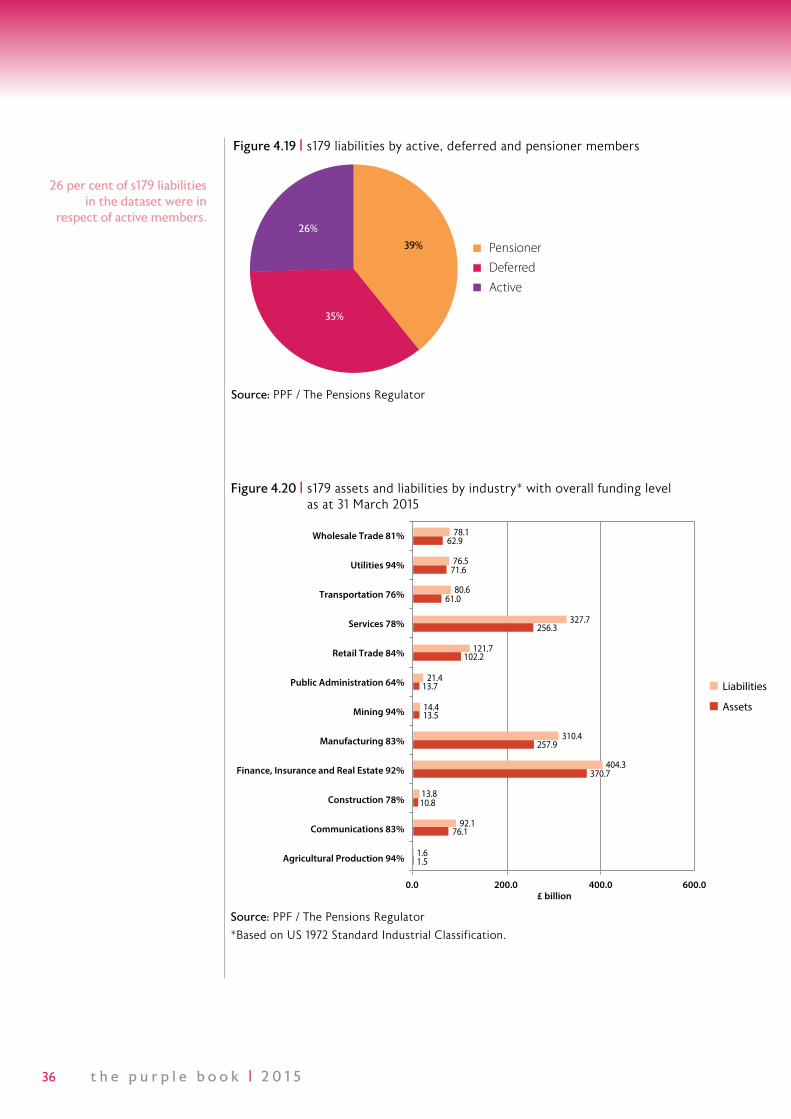
Figure 4.19 | s179 liabilities by active, deferred and pensioner members 36
Figure 4.20 | s179 assets and liabilities by industry with overall funding level as at 31 March 2015 36
Chapter 5: Figure 5.1 | Historical s179 funding ratio (assets as a percentage of liabilities) of pension schemes in the Purple datasets 38
Figure 5.2 | Historical s179 aggregate balance (assets less liabilities) of pension schemes in the Purple datasets 39
Figure 5.3 | Historical movements in assets and s179 liabilities of schemes in the Purple datasets 39

6 t h e p u r p l e b o o k | 2 0 1 5
Figure 5.4 | Historical aggregate assets less aggregate liabilities for schemes in deficit 40
Figure 5.5 | Historical percentage of schemes in deficit each month in the Purple datasets 40
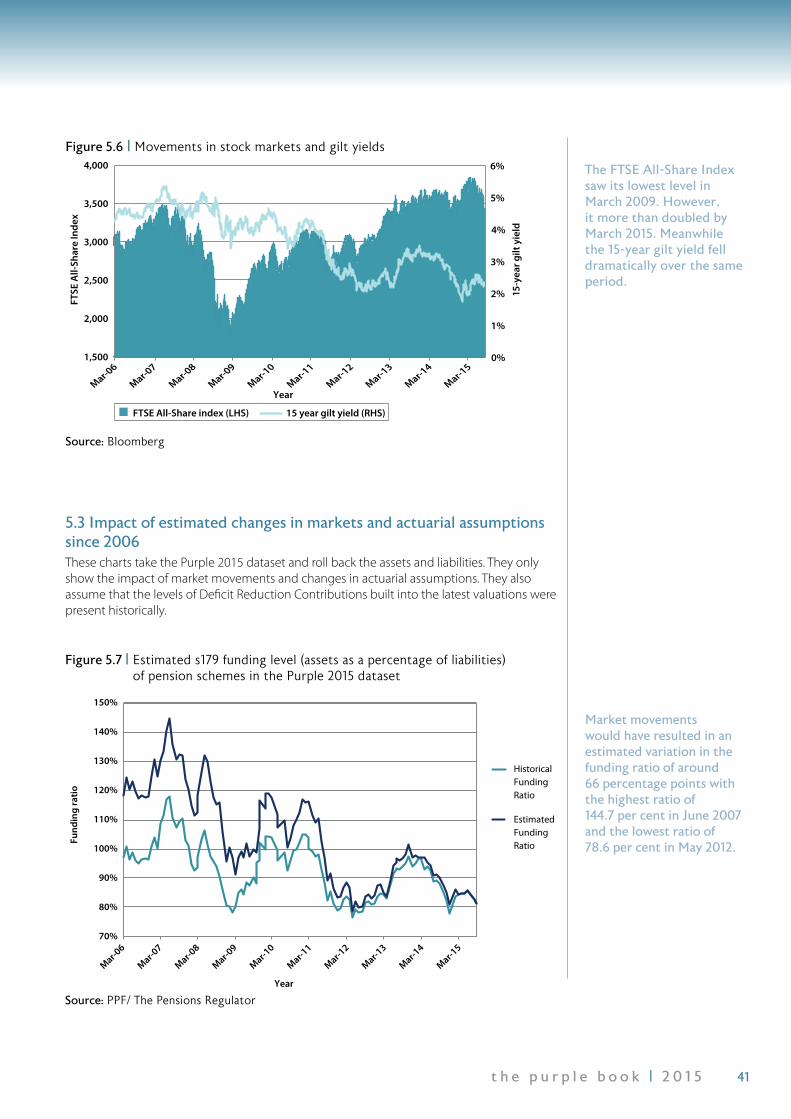
Figure 5.6 | Movements in stock markets and gilt yields 41
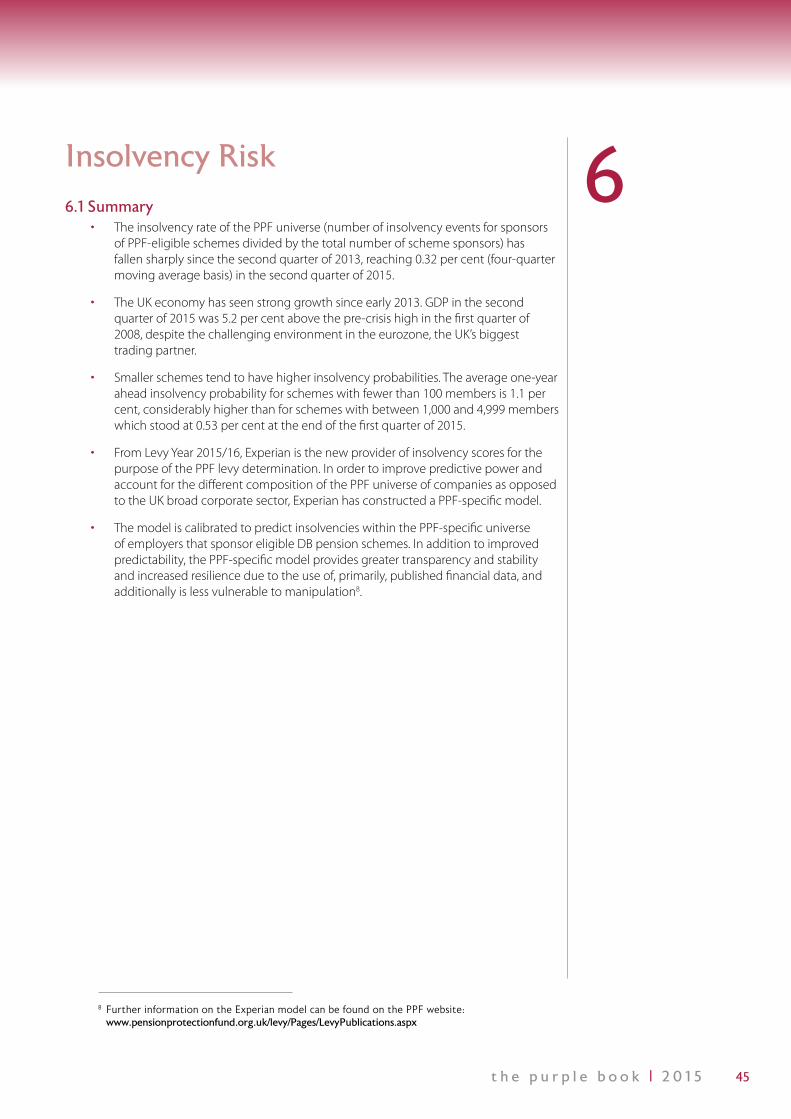
Figure 5.7 | Estimated s179 funding ratio (assets as a percentage of liabilities) of pension schemes in the Purple 2015 dataset 41
Figure 5.8 | Estimated s179 aggregate balance (assets less liabilities) of pension schemes in the Purple 2015 dataset 42
Figure 5.9 | Impact of changes in gilt yields and equity prices on s179 funding levels from a base aggregate deficit of £244.2 billion, as at 31 March 2015 42
Figure 5.10 | Impact of changes in gilt yields and equity prices on assets from a base of 100, as at 31 March 2015 43
Figure 5.11 | Impact of changes in gilt yields on s179 liabilities from a base of 100, as at 31 March 2015 43
Figure 5.12 | Impact of changes in gilt yields and equity prices on the s179 funding position from a base total deficit of £285.3 billion, excluding schemes in surplus, as at 31 March 2015 43
Figure 5.13 | Impact of changes in the rate of inflation on s179 liabilities (base = £1,542.5 billion), as at 31 March 2015 44
Figure 5.14 | Impact of changes in longevity assumptions on s179 liabilities (base = £1,542.5 billion), as at 31 March 2015 44
Chapter 6: Figure 6.1 | PPF universe insolvency rates 46
Figure 6.2 | UK company liquidations 46
Figure 6.3 | Average one-year ahead insolvency probability based on Experian failure scores by scheme size as measured by number of members, as at 31 March 2015 47
Chapter 7: Figure 7.1 | Distribution of schemes by asset allocation date 49
Figure 7.2 | Average asset allocation in total assets 50
Figure 7.3 | Asset allocation: simple averages 50
Figure 7.4 | Gilt and fixed interest splits 51
Figure 7.5 | Equity splits 51
Figure 7.6 | Simple average asset allocation of schemes by asset size 52
Figure 7.7 | Simple average of equities and fixed-interest assets split by asset size 52
Figure 7.8 | Weighted-average asset allocation by s179 funding level 53
7t h e p u r p l e b o o k | 2 0 1 5
Figure 7.9 | Weighted-average asset allocation of schemes by current pensioner liabilities as a percentage of total liabilities 53
Figure 7.10 | Weighted-average asset allocation of schemes by Experian levy band (the lower the band the lower the predicted probability of insolvency) 54
Chapter 8: Figure 8.1 | Cumulative deficits of schemes entering the PPF from 31 March 2015 56
Figure 8.2 | Modelled probability of the PPF meeting its funding objective, as at 31 March 2015 58
Chapter 9: Figure 9.1 | Levy Payments 60
Figure 9.2 | Distribution of levy payments by largest levy payers in 2014/2015 60
Figure 9.3 | Schemes paying no Risk-Based Levy by levy year 61
Figure 9.4 | Number of schemes with capped Risk-Based Levies by levy band 61
Figure 9.5 | Number of schemes with capped Risk-Based Levies by funding level 62
Figure 9.6 | Levy distribution by levy band 62
Figure 9.7 | Liabilities by levy band 62
Figure 9.8 | Levy per member by levy band 63
Figure 9.9 | Levy payments as a proportion of assets by levy band 63
Figure 9.10 | Percentage of total levy that is Scheme- and Risk-based by levy band 64
Figure 9.11 | Percentage of total levy that is Scheme- and Risk-based by funding level 64
Figure 9.12 | Levy per £ of liabilities by levy and funding bands 65
Figure 9.13 | Total levy by industry 65
Chapter 10: Figure 10.1 | Number of schemes in assessment each year, as at 31 March 67
Figure 10.2 | Funding statistics for schemes in assessment each year, as at 31 March 67
Figure 10.3 | Number of qualifying insolvency events by date of insolvency 68
Figure 10.4 | Total s179 deficits for schemes entering an assessment period 68
Figure 10.5 | Percentage of schemes and percentage of s179 liabilities grouped by size of liabilities for schemes in assessment, as at 31 March 2015 69

8 t h e p u r p l e b o o k | 2 0 1 5
Figure 10.6 | Proportion of schemes in assessment by number of members 69
Figure 10.7 | Maturity of schemes in assessment by membership size 70
Figure 10.8 | Total s179 deficit of schemes in assessment by liability size 70
Figure 10.9 | Simple-average asset allocations prior to assessment for schemes in assessment and the Purple 2015 dataset as at 31 March 2015 71
Figure 10.10 | Distribution of schemes in assessment by industry classification 71
Figure 10.11 | Distribution of schemes entering an assessment period since 2005 by industry classification 72
Figure 10.12 | Proportion of claims since 2005 by membership size 72
Chapter 11: Figure 11.1 | Total compensation and number of members 74
Figure 11.2 | Distribution of pensioners by annualised compensation levels 74
Figure 11.3 | Distribution of deferred members by annualised compensation levels 75
Figure 11.4 | Gender composition of pensioners and deferred members 75
Figure 11.5 | Proportions of spouses and other dependants, and members within the PPF current pensioner population 76
Figure 11.6 | Distribution of pensioner and deferred members by NPA 76
Figure 11.7 | Pensioner and deferred member annualised compensation by individual sector 77
Figure 11.8 | Pensioner and deferred member annualised compensation by UK region 77
Figure 11.9 | Pre-6 and Post-5 April 1997 annualised compensation for pensioners and deferred members 78
Figure 11.10 | Value of non-AVC liabilities attributable to Pre-6 and Post-5 April 1997 compensation for pensioners and deferred members sector 78
Chapter 12: Figure 12.1 | Contingent assets by type 80
Figure 12.2 | Special contributions 80
Figure 12.3 | Technical Provision (TP) and Recovery Plan (RP) lengths (unweighted) 81
Figure 12.4 | Value of risk transfer deals since 2007 81
Figure 12.5 | Number of risk transfer deals since 2010 82
Figure 12.6 | Value of risk transfer deals since Q2 2013 82
Appendix 83
Glossary 88

9t h e p u r p l e b o o k | 2 0 1 5
Summary This is the tenth edition of the Pensions Universe Risk Profile (The Purple Book), a joint annual publication by the Pension Protection Fund (the PPF) and The Pensions Regulator (the regulator). The Purple Book focuses on the risks faced by Defined Benefit (DB) pension schemes, predominantly in the private sector.
1.1 Economic background and introductionThe main focus in each year’s Purple Book is the position at the end of March for the year in question, and a comparison of how risks have changed over the last year. This year we also focus on the major changes over Purple’s 10-year history.
Over the 12 months to March 2015, the economic recovery continued. However, 10-year gilt yields fell markedly, adversely affecting scheme funding. The drop in yields largely reflected international developments such as the collapse in oil prices, deflation fears in the euro-area, the announcement of Quantitative Easing (QE) by the European Central Bank, and indications from the US Fed that it could be patient in raising rates.
• The UK economy saw further robust growth, GDP rising by 2.7 per cent in the year to the first quarter of 2015.
• CPI Inflation fell from 1.6 per cent in March 2014 to zero in March 2015.
• Insolvency Service statistics showed that the company liquidation rate in the year to the first quarter of 2015 was 0.5 per cent, down from 0.6 per cent in the first quarter of 2014.
• The total number of company insolvencies (also including receiverships, administrations, and company voluntary arrangements) was 12 per cent lower in the first quarter of 2015 than in the same quarter of 2014.
• The FTSE All-Share index rose by 3.0 per cent in the year to March 2015.
• 10-year gilt yields fell from 2.7 per cent to 1.6 per cent while 10-year AA corporate bond yields increased slightly to 3.4 per cent.
• The Bank of England kept its policy rate unchanged at 0.5 per cent and did not add to its asset purchases under its Quantitative Easing programme.
Since March 2015, the UK economic recovery has continued with GDP rising by a further 0.7 per cent in the second quarter while inflation was -0.1 per cent in September. The total number of company insolvencies fell by a further three per cent between the first and second quarters of 2015. Equity markets fell by 9 per cent between end-March and end-September while gilt yields rose by 0.2 percentage points.
1Executive Summary

10 t h e p u r p l e b o o k | 2 0 1 5
End March
UK 2009 2010 2011 2012 2013 2014 2015End Sep
2015
GDP growth year-on-year
-6.8% 0.5% 1.7% 0.6% 0.7% 3.0% 2.7% 2.4%*
CPI Inflation 2.9% 3.4% 4.0% 3.5% 2.8% 1.6% 0.0% -0.1%
Company liquidation rate –12 months prior
0.9% 0.9% 0.8% 0.8% 0.7% 0.6% 0.5% 0.5%*
Total insolvency events**
6,857 5,348 5,332 5,613 4,528 4,571 4,025 3,908*
FTSE All-Share level
1,984 2,910 3,068 3,003 3,381 3,556 3,664 3,336
10-year gilt yield 3.2% 3.9% 3.7% 2.2% 1.8% 2.7% 1.6% 1.8%
10-year index linked yield
0.9% 0.4% 0.6% -0.6% -1.6% -0.3% -1.0% -0.9%
10-year AA corporate bond yield
6.8% 4.7% 5.1% 3.9% 2.9% 3.3% 3.4% 3.4%
Bank of England policy rate
0.5% 0.5% 0.5% 0.5% 0.5% 0.5% 0.5% 0.5%
QE £billion 15 200 200 325 375 375 375 375
Sources: Office for National Statistics, the Insolvency Service, Bank of England and Bloomberg
* These relate to Q2 2015.** This comprises liquidations, receiverships, administrations and company voluntary
arrangements. This excludes creditors’ voluntary liquidations following administration which had been included in the Insolvency Service statistics a year ago.
Much of the analysis of the 2015 Purple Book (‘Purple 2015’) is based on new information from 5,945 scheme returns issued in December 2014 and January 2015 and returned to the regulator by the end of March 2015. The Purple Book covers virtually all schemes in the universe of PPF-eligible schemes.
The Purple Books have focused on the risk of scheme members not receiving promised benefits and of claims on the PPF. These in turn depend on two key elements, namely the risk of the sponsoring employer becoming insolvent and the extent of scheme underfunding. The main focus of this publication is risk as at 31 March 2015.
Some of the key points from Purple 2015 are given below, followed by a description of the main changes since Purple 2006.
Figure 1.1 | UK economic and financial environment

11t h e p u r p l e b o o k | 2 0 1 5
Purple 2015: main developments
Scheme demographics • The percentage of schemes closed to future accrual rose again in 2015 – from 32
per cent to 34 per cent. This is a continuation of the trend that has been in place since the start of the Purple Book in 2006.
• The percentage of schemes that are open remained at 13 per cent in 2015 and has changed little over the last three years.
• The number of active memberships fell by 3.4 per cent in 2015, to 1.75 million.
Scheme funding • Scheme funding deteriorated between end-March 2014 and end-March 2015 -
from 97 per cent in 2014 to 84 per cent on a section 179 (s179) basis, and from 67 per cent to 62 per cent on a full buy-out basis – reflecting the impact of the fall in gilt yields on liabilities which more than offset the impact of higher equity markets and gilt prices on assets.
• Between end-March 2015 and end-September 2015, scheme funding on a s179 basis deteriorated by a further 3.1 percentage points, mainly reflecting the impact of lower equity markets and gilt prices on assets which more than offset the impact of higher gilt yields on liabilities.
Asset allocation • In 2015, the equity share of total scheme assets fell from 35.0 per cent to 33.0 per
cent while the gilts and fixed interest share rose from 44.1 per cent to 47.7 per cent.
• The share of “other investments”, total investments less equities and bonds, fell from 20.9 per cent in 2014 to 19.3 per cent in 2015. This largely reflected a large fall in the cash share which more than offset increases for the remaining components (insurance policies, property, hedge funds and “other1”).
• The share of UK-quoted equities in total equity holdings fell from 28.9 per cent in 2014 to 25.6 per cent in 2015, while the overseas-quoted share increased from 62.4 per cent to 65.4 per cent.
• Within total gilts and fixed interest assets, the corporate fixed interest securities’ proportion decreased from 40.3 per cent in 2014 to 37.7 per cent in 2015. Meanwhile, the proportion of government fixed interest securities rose from 18.6 per cent to 20.3 per cent. The balance of holdings in index-linked securities rose to 42.0 per cent from 41.1 per cent in 2014.
10 years of dramatic change for DB schemes There have been major changes in the scheme status of the PPF-eligible universe of mainly private sector DB schemes over the last 10 years as companies became more aware of the market and longevity risks attached to the schemes. There have also been major changes in financial markets as boom was followed by the financial crisis and recession, near-zero interest rates and Quantitative Easing.
The proportion of schemes open to new members and new accrual has dropped by two-thirds since 2006. The equity share of total assets has almost halved while the gilt and fixed interest share has risen by almost two-thirds and alternative assets have grown rapidly. The UK-quoted share of total equities has almost halved since 2008.
1 Other includes deferred or immediate fully insured annuities, commodities, and a residual ‘other’ category.
12 t h e p u r p l e b o o k | 2 0 1 5
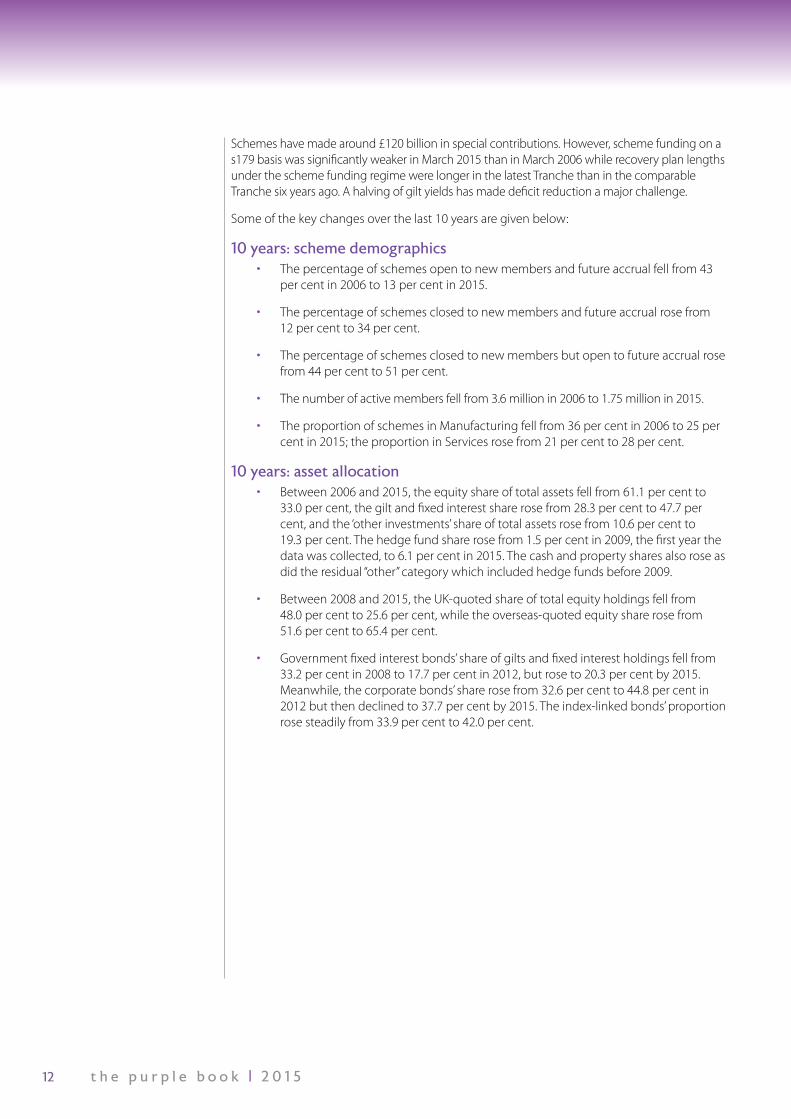
Schemes have made around £120 billion in special contributions. However, scheme funding on a s179 basis was significantly weaker in March 2015 than in March 2006 while recovery plan lengths under the scheme funding regime were longer in the latest Tranche than in the comparable Tranche six years ago. A halving of gilt yields has made deficit reduction a major challenge.
Some of the key changes over the last 10 years are given below:
10 years: scheme demographics • The percentage of schemes open to new members and future accrual fell from 43
per cent in 2006 to 13 per cent in 2015.
• The percentage of schemes closed to new members and future accrual rose from 12 per cent to 34 per cent.
• The percentage of schemes closed to new members but open to future accrual rose from 44 per cent to 51 per cent.
• The number of active members fell from 3.6 million in 2006 to 1.75 million in 2015.
• The proportion of schemes in Manufacturing fell from 36 per cent in 2006 to 25 per cent in 2015; the proportion in Services rose from 21 per cent to 28 per cent.
10 years: asset allocation • Between 2006 and 2015, the equity share of total assets fell from 61.1 per cent to
33.0 per cent, the gilt and fixed interest share rose from 28.3 per cent to 47.7 per cent, and the ‘other investments’ share of total assets rose from 10.6 per cent to 19.3 per cent. The hedge fund share rose from 1.5 per cent in 2009, the first year the data was collected, to 6.1 per cent in 2015. The cash and property shares also rose as did the residual “other” category which included hedge funds before 2009.
• Between 2008 and 2015, the UK-quoted share of total equity holdings fell from 48.0 per cent to 25.6 per cent, while the overseas-quoted equity share rose from 51.6 per cent to 65.4 per cent.
• Government fixed interest bonds’ share of gilts and fixed interest holdings fell from 33.2 per cent in 2008 to 17.7 per cent in 2012, but rose to 20.3 per cent by 2015. Meanwhile, the corporate bonds’ share rose from 32.6 per cent to 44.8 per cent in 2012 but then declined to 37.7 per cent by 2015. The index-linked bonds’ proportion rose steadily from 33.9 per cent to 42.0 per cent.
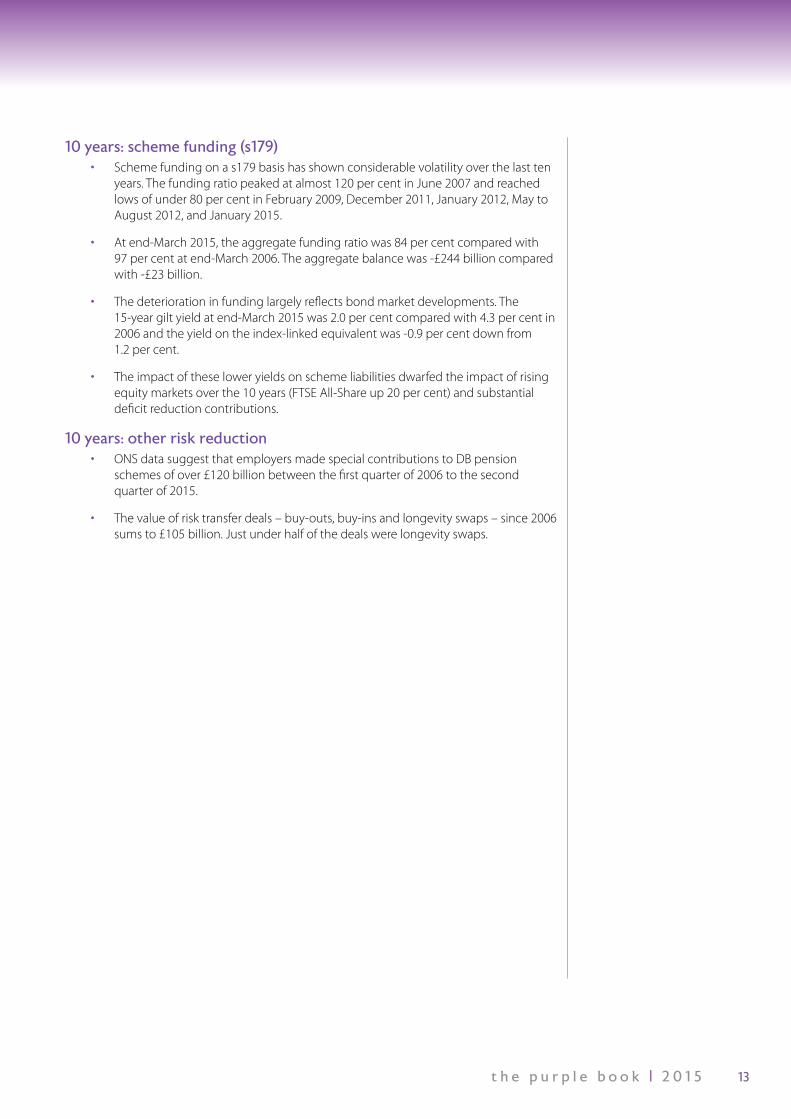
13t h e p u r p l e b o o k | 2 0 1 5
10 years: scheme funding (s179) • Scheme funding on a s179 basis has shown considerable volatility over the last ten
years. The funding ratio peaked at almost 120 per cent in June 2007 and reached lows of under 80 per cent in February 2009, December 2011, January 2012, May to August 2012, and January 2015.
• At end-March 2015, the aggregate funding ratio was 84 per cent compared with 97 per cent at end-March 2006. The aggregate balance was -£244 billion compared with -£23 billion.
• The deterioration in funding largely reflects bond market developments. The 15-year gilt yield at end-March 2015 was 2.0 per cent compared with 4.3 per cent in 2006 and the yield on the index-linked equivalent was -0.9 per cent down from 1.2 per cent.
• The impact of these lower yields on scheme liabilities dwarfed the impact of rising equity markets over the 10 years (FTSE All-Share up 20 per cent) and substantial deficit reduction contributions.
10 years: other risk reduction • ONS data suggest that employers made special contributions to DB pension
schemes of over £120 billion between the first quarter of 2006 to the second quarter of 2015.
• The value of risk transfer deals – buy-outs, buy-ins and longevity swaps – since 2006 sums to £105 billion. Just under half of the deals were longevity swaps.

14 t h e p u r p l e b o o k | 2 0 1 5
2 2.1 Summary
The Data
• The main body of the analysis in Purple 2015 is based on new scheme returns for a dataset of 5,945 Defined Benefit (DB) schemes, covering 11.0 million memberships2. This represents virtually all PPF-eligible schemes and universe liabilities. Complete 2015 information is not yet available for the remaining schemes and, hence, these have been excluded from the sample.
• It is estimated that the eligible universe of schemes is 5,967, a reduction from 6,070 in March 2014. The declining universe reflects schemes winding up, scheme mergers, schemes entering assessment, and schemes transferring into the PPF.
• The fact that the dataset accounts for such a large proportion of the universe means that results for the whole universe are expected to be only slightly different from those presented in Purple 2015.
• The Risk-Based Levy charged by the PPF to eligible schemes takes account of the risk of a scheme’s sponsoring employer becoming insolvent (insolvency risk) and the size of the potential claim on the PPF (underfunding risk).
• As in previous Purple Books, the bulk of the analysis uses funding on a s179 basis. This is an estimate of what would have to be paid to an insurance company to take on the payment of PPF levels of compensation.
• From the Levy Year 2015/16, Experian provides the PPF with scores as indicators of insolvency risk using the PPF-specific model. This is a statistical model, developed using observed insolvencies amongst employers and guarantors of DB pension schemes. More detail on the model can be found on the PPF website3.
• In earlier levy years, Dun and Bradstreet (D&B) failure scores were used as indicators of insolvency risk in determining scheme levy payments.
• To look at insolvency risk more broadly, the PPF and the regulator use other information, for example long-term credit ratings from the major ratings agencies, and market implied ratings (based on the credit default swap and equity markets).
2 A ‘membership’ is one individual’s participation in one scheme. One individual can have multiple memberships. Hence the number of memberships exceeds the number of individuals.3 For more information see: www.pensionprotectionfund.org.uk/levy/insolvencyrisk/Pages/InsolvencyRisk.aspx
15t h e p u r p l e b o o k | 2 0 1 5
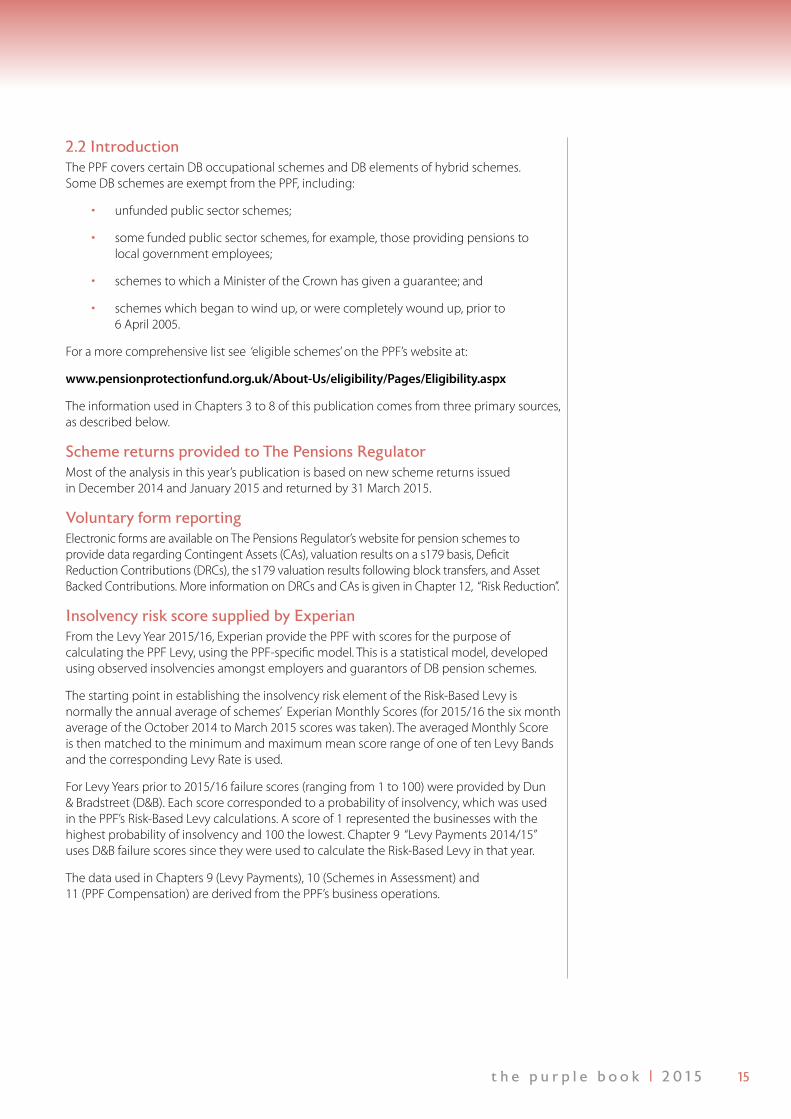
2.2 IntroductionThe PPF covers certain DB occupational schemes and DB elements of hybrid schemes. Some DB schemes are exempt from the PPF, including:
• unfunded public sector schemes;
• some funded public sector schemes, for example, those providing pensions to local government employees;
• schemes to which a Minister of the Crown has given a guarantee; and
• schemes which began to wind up, or were completely wound up, prior to 6 April 2005.
For a more comprehensive list see ‘eligible schemes’ on the PPF’s website at:
www.pensionprotectionfund.org.uk/About-Us/eligibility/Pages/Eligibility.aspx
The information used in Chapters 3 to 8 of this publication comes from three primary sources, as described below.
Scheme returns provided to The Pensions Regulator Most of the analysis in this year’s publication is based on new scheme returns issued in December 2014 and January 2015 and returned by 31 March 2015.
Voluntary form reportingElectronic forms are available on The Pensions Regulator’s website for pension schemes to provide data regarding Contingent Assets (CAs), valuation results on a s179 basis, Deficit Reduction Contributions (DRCs), the s179 valuation results following block transfers, and Asset Backed Contributions. More information on DRCs and CAs is given in Chapter 12, “Risk Reduction”.
Insolvency risk score supplied by Experian From the Levy Year 2015/16, Experian provide the PPF with scores for the purpose of calculating the PPF Levy, using the PPF-specific model. This is a statistical model, developed using observed insolvencies amongst employers and guarantors of DB pension schemes.
The starting point in establishing the insolvency risk element of the Risk-Based Levy is normally the annual average of schemes’ Experian Monthly Scores (for 2015/16 the six month average of the October 2014 to March 2015 scores was taken). The averaged Monthly Score is then matched to the minimum and maximum mean score range of one of ten Levy Bands and the corresponding Levy Rate is used.
For Levy Years prior to 2015/16 failure scores (ranging from 1 to 100) were provided by Dun & Bradstreet (D&B). Each score corresponded to a probability of insolvency, which was used in the PPF’s Risk-Based Levy calculations. A score of 1 represented the businesses with the highest probability of insolvency and 100 the lowest. Chapter 9 “Levy Payments 2014/15” uses D&B failure scores since they were used to calculate the Risk-Based Levy in that year.
The data used in Chapters 9 (Levy Payments), 10 (Schemes in Assessment) and 11 (PPF Compensation) are derived from the PPF’s business operations.
16 t h e p u r p l e b o o k | 2 0 1 5
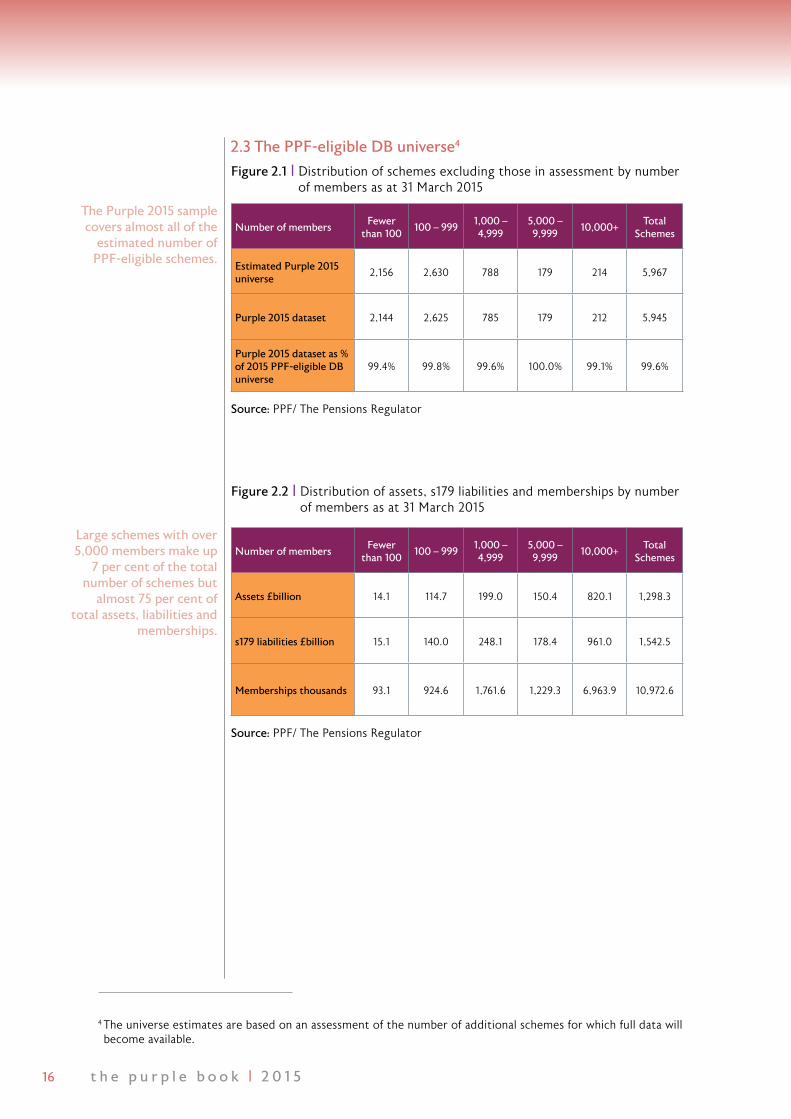
Figure 2.1 | Distribution of schemes excluding those in assessment by number of members as at 31 March 2015
Figure 2.2 | Distribution of assets, s179 liabilities and memberships by number of members as at 31 March 2015
Source: PPF/ The Pensions Regulator
Source: PPF/ The Pensions Regulator
Number of membersFewer
than 100100 – 999
1,000 – 4,999
5,000 – 9,999
10,000+Total
Schemes
Estimated Purple 2015 universe
2,156 2,630 788 179 214 5,967
Purple 2015 dataset 2,144 2,625 785 179 212 5,945
Purple 2015 dataset as % of 2015 PPF-eligible DB universe
99.4% 99.8% 99.6% 100.0% 99.1% 99.6%
Number of membersFewer
than 100100 – 999
1,000 – 4,999
5,000 – 9,999
10,000+Total
Schemes
Assets £billion 14.1 114.7 199.0 150.4 820.1 1,298.3
s179 liabilities £billion 15.1 140.0 248.1 178.4 961.0 1,542.5
Memberships thousands 93.1 924.6 1,761.6 1,229.3 6,963.9 10,972.6
2.3 The PPF-eligible DB universe4
The Purple 2015 sample covers almost all of the
estimated number of PPF-eligible schemes.
Large schemes with over 5,000 members make up
7 per cent of the total number of schemes but
almost 75 per cent of total assets, liabilities and
memberships.
4 The universe estimates are based on an assessment of the number of additional schemes for which full data will become available.
17t h e p u r p l e b o o k | 2 0 1 5
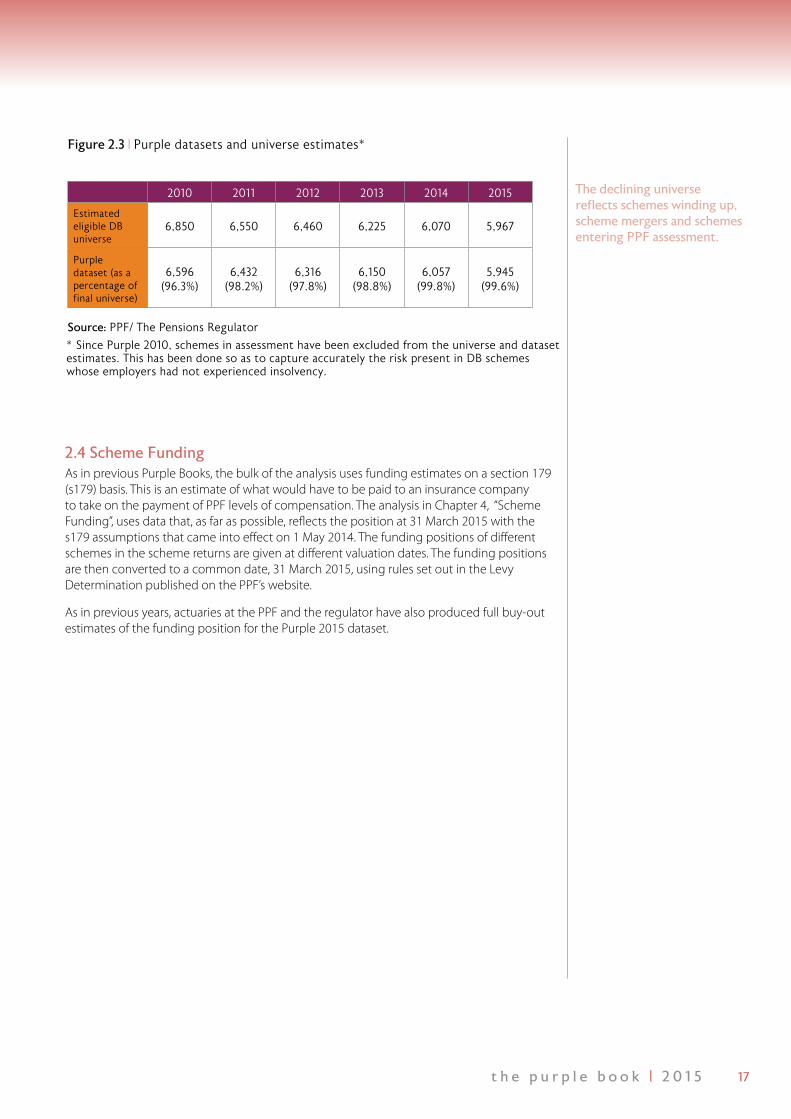
2.4 Scheme FundingAs in previous Purple Books, the bulk of the analysis uses funding estimates on a section 179 (s179) basis. This is an estimate of what would have to be paid to an insurance company to take on the payment of PPF levels of compensation. The analysis in Chapter 4, “Scheme Funding”, uses data that, as far as possible, reflects the position at 31 March 2015 with the s179 assumptions that came into effect on 1 May 2014. The funding positions of different schemes in the scheme returns are given at different valuation dates. The funding positions are then converted to a common date, 31 March 2015, using rules set out in the Levy Determination published on the PPF’s website.
As in previous years, actuaries at the PPF and the regulator have also produced full buy-out estimates of the funding position for the Purple 2015 dataset.
Figure 2.3 | Purple datasets and universe estimates*
Source: PPF/ The Pensions Regulator
2010 2011 2012 2013 2014 2015
Estimated eligible DB universe
6,850 6,550 6,460 6,225 6,070 5,967
Purple dataset (as a percentage of final universe)
6,596 (96.3%)
6,432 (98.2%)
6,316 (97.8%)
6,150 (98.8%)
6,057 (99.8%)
5,945(99.6%)
The declining universe reflects schemes winding up, scheme mergers and schemes entering PPF assessment.
* Since Purple 2010, schemes in assessment have been excluded from the universe and dataset estimates. This has been done so as to capture accurately the risk present in DB schemes whose employers had not experienced insolvency.

18 t h e p u r p l e b o o k | 2 0 1 5
3 Scheme Demographics3.1 Summary
• 13 per cent of schemes in the dataset are open to new members.
• 34 per cent of schemes are closed to future accrual, 2 per cent more than in 2014, with the proportion of schemes closed to new members falling from 53 per cent to 51 per cent.
• Schemes with 2 to 99 members were the least likely group to be closed to new members. The largest schemes have the highest proportion of closed to new members schemes – they also have the largest proportion of open schemes.
• 22 per cent of memberships were in schemes which were open to new members.
• 8 per cent of memberships in the dataset are active members in open schemes. The largest group is deferred members in schemes closed to new members.
• Active memberships fell by 3.4 per cent from 2014, the smallest drop in active members recorded in the Purple Book. The number of active memberships is around half of those found in the expanded Purple 2006 dataset.
• The highest proportion of active members is in schemes with 10,000 or more members.
• The proportions of schemes and memberships by size band have remained stable over time.
• Since 2006 there has been a long-term trend for the proportion of schemes associated with the Manufacturing industry to diminish and the proportion of schemes associated with the Services industry to increase.
3.2 IntroductionIn this chapter the composition of the dataset used for this year’s edition of the Purple Book is described. Figures for the total number of schemes and total scheme membership are included, with breakdowns by size, maturity, scheme status and industrial classification.
For each edition of the Purple Book, a dataset is collated including all appropriate schemes where scheme return information has been processed and cleaned. In subsequent months, more scheme returns are processed and cleaned and in 2006 and 2007 these were incorporated into the existing dataset to produce an ‘extended’ dataset. For 2006 and 2007, the increased coverage produced significantly different results to the original datasets. However, since then datasets have been much larger and the increased coverage made only a small difference. Accordingly, comparisons are made with previous publications as follows:
• Purple 2006 and 2007 - extended dataset
• Purple 2008 to 2014 - original dataset
19t h e p u r p l e b o o k | 2 0 1 5
3.3 Scheme statusScheme status in this Purple Book is split between:
• open schemes, where new members can join the DB section of the scheme and accrue benefits;
• schemes closed to new members, in which existing members continue to accrue benefits;
• schemes closed to future accruals, where existing members can no longer accrue new years of service; and
• schemes that are winding up.
Because many larger employers have adopted the strategy of migrating their pension provision towards Defined Contribution (DC) by opening a DC section in an existing DB scheme, many hybrid schemes may accept new members but no longer allow new (or existing) members to accrue defined benefits.
This has been handled differently across different editions of the Purple Book. In Purple 2006, 40 per cent of memberships were in the open category and 25 per cent were categorised as ‘part open’. It was noted that the ‘part open’ category included a significant number of hybrids for which the DB element was closed. In Purple 2007, the ‘part open’ category was removed and the percentage of schemes classified as open increased in comparison with Purple 2006. Many hybrid schemes which had previously identified themselves as ‘part open’ now identified themselves as ‘open’. In Purple 2008 and Purple 2009, we analysed the largest 100 schemes (by membership) in the hybrid category separately so as to adjust the information provided in the scheme return and remove potential misinterpretation caused by hybrid schemes with closed DB sections declaring themselves as open.
Improved levels of information on hybrid schemes are now available from the scheme returns and since Purple 2010 we are able to adjust hybrid statuses to ‘closed’ where DB provision is not available to new members.
Since 2013, those hybrids which no longer admit new defined benefit accruing members are categorised as ‘closed to new members’. In addition, where those schemes have no active defined benefit membership it is assumed that the scheme is closed to future accrual. In 2015, 264 open hybrid schemes with approximately 1.3 million members were reclassified as closed to new members and a further 116 open hybrid schemes with approximately 321,000 members had their status amended to closed to future accrual.
The changes to the information available and consequent developing approach across the various editions of the Purple Book should be taken into account when comparing figures from different editions.

20 t h e p u r p l e b o o k | 2 0 1 5
Figure 3.2 | Distribution of schemes by status
Percentage of schemes
Extended Purple 2006*
Extended Purple 2007
2008 2009 2010 2011 2012 2013 2014 2015
Open 43% 36% 31% 27% 18% 16% 14% 14% 13% 13%
Closed to new members
44% 45% 50% 52% 58% 58% 57% 54% 53% 51%
Closed to future accruals
12% 16% 17% 19% 21% 24% 26% 30% 32% 34%
Winding up
<1% 2% 2% 2% 2% 2% 2% 2% 2% 2%
Total 100% 100% 100% 100% 100% 100% 100% 100% 100% 100%
Source: PPF / The Pensions Regulator
*For 2006, schemes declared as open and part open have all been counted as open.
Note that whilst schemes which are labelled as ‘closed to future accrual’ are also closed to new memberships, references to ‘closed to new members’ status schemes do not include ‘closed to future accruals’ status schemes.
Figure 3.1 | Distribution of schemes by status
Source: PPF/ The Pensions Regulator
Winding-up1292%
Closed to new members
3,053 51%
Open765 13%
Closed to future accrual
1,99834%
Closed to new members
Open
Closed to future accrual
Winding up
13 per cent of schemes in the dataset are open to new
members.
34 per cent of schemes are closed to future accrual, 2 per cent more than in 2014, with
the proportion of schemes closed to new members
falling from 53 per cent to 51 per cent.

21t h e p u r p l e b o o k | 2 0 1 5
Figure 3.3 | Distribution of schemes by status (excluding hybrid schemes)
Percentage of schemes
Extended Purple 2006
Extended Purple 2007
2008 2009 2010 2011 2012 2013 2014 2015
Open 35% 33% 26% 22% 21% 18% 17% 16% 15% 14%
Closed to new members
49% 49% 52% 55% 54% 54% 53% 51% 50% 49%
Closed to future accruals
15% 17% 19% 20% 23% 26% 29% 31% 33% 35%
Winding up
1% 1% 3% 3% 2% 2% 2% 2% 2% 2%
Total 100% 100% 100% 100% 100% 100% 100% 100% 100% 100%
Source: PPF/ The Pensions Regulator
Figure 3.4 | Schemes by status and year
Figure 3.5 | Memberships by status and year
66% 50%
44% 37% 34% 31% 28% 23% 22% 22%
32% 46%
52% 59% 60% 62% 64%
65% 62% 62%
3% 4% 4% 5% 6% 8% 12% 15% 16%
0%
10%
20%
30%
40%
50%
60%
70%
80%
90%
100%
2006 2007 2008 2009 2010 2011 2012 2013 2014 2015
1% 1% 2%
Winding Up
future accrual
Closed to new members Open
Closed to
Source: PPF/ The Pensions Regulator
Source: PPF/ The Pensions Regulator
43% 36% 31% 27%
18% 16% 14% 14% 13% 13%
44% 45%
50% 52% 58% 58% 57% 54% 53% 51%
12% 16% 17% 19% 21% 24% 26% 30% 32% 34%
1% 2% 2% 2% 2% 2% 2% 2% 2% 2%
0%
10%
20%
30%
40%
50%
60%
70%
80%
90%
100%
2006 2007 2008 2009 2010 2011 2012 2013 2014 2015
Winding Up
future accrual Closed to new members Open
Closed to
22 t h e p u r p l e b o o k | 2 0 1 5
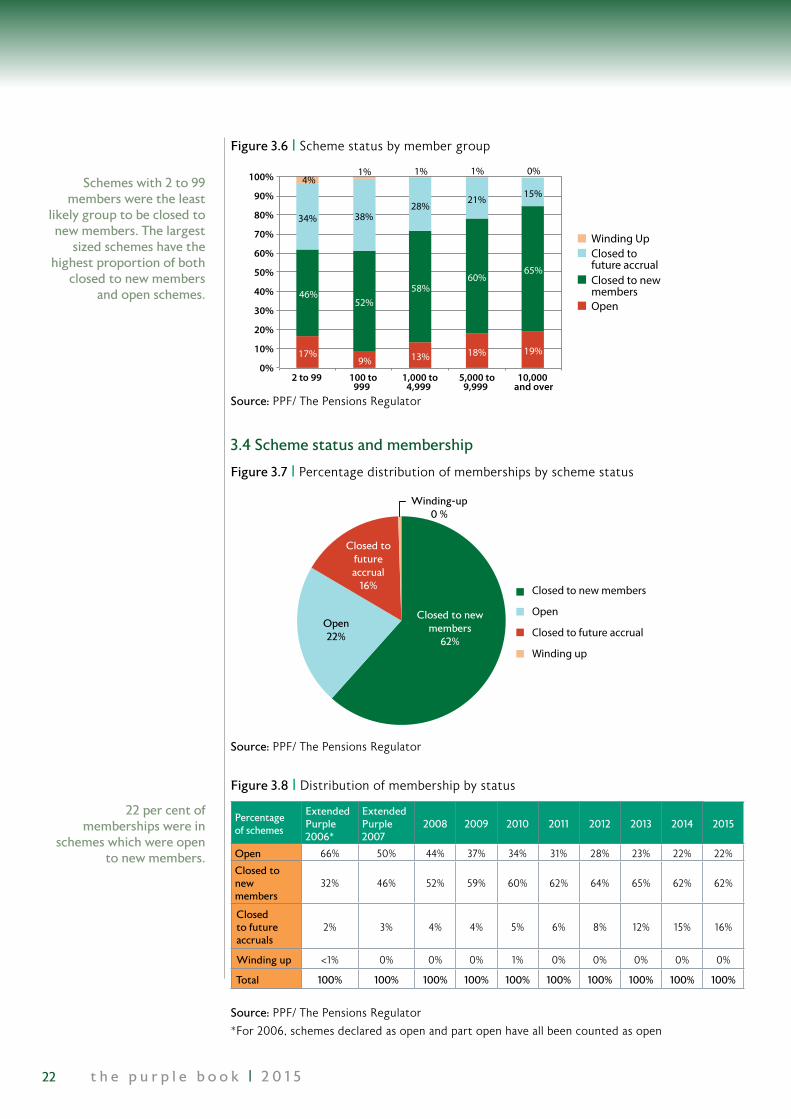
Figure 3.6 | Scheme status by member group
Winding Up
future accrual Closed to new members Open
17% 9% 13% 18% 19%
46% 52%
58% 60%
65%
34% 38% 28%
21% 15% 4%
1% 1% 1% 0%
0%
10%
20%
30%
40%
50%
60%
70%
80%
90%
100%
2 to 99 100 to 999
1,000 to 4,999
5,000 to 9,999
10,000 and over
Closed to
Figure 3.7 | Percentage distribution of memberships by scheme status
Source: PPF/ The Pensions Regulator
Source: PPF/ The Pensions Regulator
Closed to new members
Open
Closed to future accrual
Winding up
Winding-up 0 %
Closed to new members
62%
Open22%
Closed to future accrual
16%
Figure 3.8 | Distribution of membership by status
Percentage of schemes
Extended Purple 2006*
Extended Purple 2007
2008 2009 2010 2011 2012 2013 2014 2015
Open 66% 50% 44% 37% 34% 31% 28% 23% 22% 22%
Closed to new members
32% 46% 52% 59% 60% 62% 64% 65% 62% 62%
Closed to future accruals
2% 3% 4% 4% 5% 6% 8% 12% 15% 16%
Winding up <1% 0% 0% 0% 1% 0% 0% 0% 0% 0%
Total 100% 100% 100% 100% 100% 100% 100% 100% 100% 100%
Source: PPF/ The Pensions Regulator
*For 2006, schemes declared as open and part open have all been counted as open
Schemes with 2 to 99 members were the least
likely group to be closed to new members. The largest
sized schemes have the highest proportion of both
closed to new members and open schemes.
22 per cent of memberships were in
schemes which were open to new members.
3.4 Scheme status and membership

23t h e p u r p l e b o o k | 2 0 1 5
Figure 3.10 | Membership by membership type and status, 31 March 2015*
Members (millions) Open ClosedClosed to
future accrualWinding Up Total
Active members 0.84 0.91 0.00 0.00 1.75
Deferred members 0.83 3.04 1.06 0.02 4.95
Pensioner Members 0.72 2.81 0.70 0.03 4.27
Total 2.40 6.76 1.76 0.05 10.97
Source: PPF/ The Pensions Regulator
* Note that for various reasons a small number of schemes have breakdowns of membership by active, deferred and pensioner types which do not match the total figure for membership. Therefore, totals may not match figures calculated from the component parts. Where members are listed as active in the information provided by closed schemes they are assumed to be deferred members.
Figure 3.11 | Active memberships in Purple datasets
Source: PPF / The Pensions Regulator
Figure 3.9 | Distribution of membership by status (excluding hybrid schemes)
Percentage of schemes
Extended Purple 2006
Extended Purple 2007
2008 2009 2010 2011 2012 2013 2014 2015
Open 35% 55% 46% 38% 38% 34% 30% 27% 25% 24%
Closed to new members
49% 41% 49% 57% 56% 58% 61% 61% 60% 59%
Closed to future accruals
15% 3% 4% 5% 6% 8% 9% 11% 14% 16%
Winding up
1% 0% 0% 0% 1% 0% 0% 0% 1% 1%
Total 100% 100% 100% 100% 100% 100% 100% 100% 100% 100%
Source: PPF/ The Pensions Regulator
0
0.5
1
1.5
2
2.5
3
3.5
4
2006 2007 2008 2009 2010 2011 2012 2013 2014 2015
Act
ive
mem
bers
hip
(mill
ions
)
8 per cent of memberships in the dataset are active members in open schemes. The largest group is deferred members in schemes closed to new members.
Active memberships fell by 3.4 per cent from 2014, the smallest drop in active members recorded in the Purple Book. The number of active memberships is around half of that found in the expanded Purple 2006 dataset.
3.5 Scheme membership

24 t h e p u r p l e b o o k | 2 0 1 5
Figure 3.13 | Distribution of member types in the Purple 2015 dataset
Pensioner members
Active membersDeferred members
10% 11% 13% 13% 18%
50% 52% 50% 46% 42%
40% 36% 37% 40% 39%
0%
10%
20%
30%
40%
50%
60%
70%
80%
90%
100%
5 to 100 100 to 1,000
1,000 to 5,000
5,000 to 10,000
10,000 and over
Over 10,000
1,000-4,999 100-999 2-99
5,000-9,999
36% 37% 36% 35% 36% 35% 36% 36% 36% 36%
46% 45% 45% 46% 46% 45% 45% 45% 44% 44%
12% 12% 13% 13% 13% 13% 13% 13% 13% 13% 3% 3% 3% 3% 2% 4% 3% 3% 4% 3%
3% 3% 3% 3% 3% 3% 3% 3% 3% 4%
0%
10%
20%
30%
40%
50%
60%
70%
80%
90%
100%
2006 2007 2008 2009 2010 2011 2012 2013 2014 2015
Source: PPF / The Pensions Regulator
Source: PPF/ The Pensions Regulator
Figure 3.14 | Proportion of schemes by size band by year
Source: PPF/ The Pensions Regulator
Figure 3.12 | Distribution of member types in the Purple 2015 dataset
Active members
Deferred members
Pensioner members4,918,751
45%
4,267,383 39%
1,786,463 16%
The highest proportion of active members is in
schemes with 10,000 or more members.
The proportions of schemes and memberships
by size band have remained stable over time.
25t h e p u r p l e b o o k | 2 0 1 5
Source: PPF / The Pensions Regulator
* Based on US 1972 Standard Industrial Classification.
Note that the greater than usual change in Manufacturing and Services proportions between 2014 and 2015 are partly the result of improved and updated data.
Figure 3.15 | Proportion of schemes by industry classification*
Communications
Utiliti
es
Finance, Insu
rance and Real E
state
Agricultu
ral P
roductio
n
Mining
Wholesa
le Trade
Constructio
n
Public Administ
ratio
n
Transp
ortatio
n
Manufacturin
g
Retail T
rade
Services
0%
5%
10%
15%
20%
25%
30%
35%
40%2006
2007
2008
2009
2010
2011
2012
2013
2014
2015
2006200720082009201020112012201320142015
Since 2006, there has been a long-term trend for the proportion of schemes associated with the Manufacturing industry to diminish and the proportion of schemes associated with the Services industry to increase.

26 t h e p u r p l e b o o k | 2 0 1 5
4 Scheme Funding
4.1 Summary • The aggregate s179 funding position of the schemes in the Purple 2015 dataset
as end-March 2015 was a deficit of £244.2 billion. This is the largest s179 deficit at an end-March date since the establishment of the PPF (although the funding ratio was lower in 2009 and 2012). This is primarily because of the reduction in real and nominal discount rates as a result of marked changes in relevant interest rates.
• The s179 funding ratio for 2015 is 84 per cent. Total liabilities have increased from £1,176.8 billion in 2014 to £1,542.5 billion this year. Total assets have increased from £1,137.5 billion to £1,298.3 billion.
• 21 per cent of schemes in the over 10,000 members group had s179 funding levels of over 100 per cent compared with 45 per cent last year.
• Higher funding levels remain associated with schemes with greater maturity.
• 26 per cent of s179 liabilities in the dataset were in respect of active members.

27t h e p u r p l e b o o k | 2 0 1 5
s179 Full buy-out
Total number of schemes 5,945 5,945
Total assets (£ billion) 1,298.3 1,298.3
Total liabilities (£ billion) 1,542.5 2,099.2
Aggregate funding position (£ billion)
-244.2 -800.9
Total balance for schemes in deficit (£ billion)
-285.3 -804.9
Total balance for schemes in surplus (£ billion)
41.1 4.0
Funding ratio 84% 62%
Figure 4.1 | Key funding statistics as at 31 March 2015
Source: PPF/ The Pensions Regulator
4.2 IntroductionThis chapter primarily deals with funding on a s179 basis as at March 2015. Funding information supplied in scheme returns is processed so that the funding levels can be estimated at a common date, allowing consistent totals to be used. A scheme 100 per cent funded on a s179 basis is broadly speaking at the level which would have to be paid to an insurance company for it to take on the payment of PPF levels of compensation. In addition, full buy-out funding information is included.
The processing of s179 results allows for the different assumptions used for the s179 valuations at different effective dates. s179 figures form the basis for PPF levy calculations, subject to subsequent adjustments in defined circumstances. Estimates of liabilities on the full buy-out basis have used the same valuation assumptions and underlying data but allow for the difference between the PPF level of compensation and full scheme benefits. The buy-out calculations are hypothetical, as only small numbers of buy-outs actually occur and the terms achieved are confidential and not necessarily obtainable for other schemes.
The aggregate s179 funding position of the schemes in the Purple 2015 dataset as at end March 2015 was a deficit of £244.2 billion. This is the largest s179 deficit at an end-March date since the establishment of the PPF (although the funding ratio was lower in 2009 and 2012). This is primarily because of the reduction in real and nominal discount rates as a result of marked changes in relevant interest rates.
4.3 Overall funding

28 t h e p u r p l e b o o k | 2 0 1 5
Year
Full buy-out
Liabilities (£ billion)
Aggregate funding (£ billion)
Deficit of schemes in deficit (£ billion)
Surplus of schemes in surplus (£ billion)
Funding ratio
2006 1,273.5 -504.0 n/a n/a 60%
2007 1,289.3 -451.6 n/a n/a 65%
2008 1,356.0 -518.6 -520.4 1.6 62%
2009 1,351.6 -571.2 -572.3 1.1 58%
2010 1,359.2 -433.0 -436.5 3.5 68%
2011 1,435.5 -467.0 -470.7 3.7 67%
2012 1,702.6 -675.8 -677.3 1.5 60%
2013 1,826.7 -708.2 -709.9 1.7 61%
2014 1,690.3 -552.8 -558.2 5.4 67%
2015 2,099.2 -800.9 -804.9 4.0 62%
Figure 4.3 | Historical funding figures on a full buy-out basis
Source: PPF/ The Pensions Regulator
YearNo. of
schemesTotal assets (£ billion)
s179
Liabilities (£ billion)
Aggregate funding (s179)
(£ billion)
Deficit of schemes in
deficit (£ billion)
Surplus of schemes in
surplus (£ billion)
Funding ratio
2006 7,751 769.5 792.2 -22.7 -76.3 53.5 97%
2007 7,542 837.7 769.9 67.8 -46.8 96.5 109%
2008 6,897 837.2 842.3 -5.1 -67.7 62.6 99%
2009 6,885 780.4 981.0 -200.6 -216.7 16.0 80%
2010 6,596 926.2 887.9 38.3 -49.1 87.4 104%
2011 6,432 968.5 969.7 -1.2 -78.3 77.1 100%
2012 6,316 1,026.8 1,231.0 -204.2 -231.3 27.1 83%
2013 6,150 1,118.5 1,329.2 -210.8 -245.8 35.0 84%
2014 6,057 1,137.5 1,176.8 -39.3 -119.0 79.7 97%
2015 5,945 1,298.3 1,542.5 -244.2 -285.3 41.1 84%
Figure 4.2 | Historical funding figures on a s179 basis
Source: PPF/ The Pensions Regulator
The s179 funding ratio for 2015 is 84 per cent. Total liabilities have increased
from £1,176.8 billion in 2014 to £1,542.5 billion this year. Total assets have increased
from £1,137.5 billion to £1,298.3 billion.

29t h e p u r p l e b o o k | 2 0 1 5
Membership group
Number of schemes in
sample
Market value of assets (£ billion)
Liabilities (£ billion)
Balance (£ billion)
Weighted average
funding ratio
Simple average funding ratio*
2 to 99 members
2,144 14.1 15.1 -1.0 93% 90%
100 to 999 members
2,625 114.7 140.0 -25.2 82% 80%
1,000 to 4,999 members
785 199.0 248.1 -49.0 80% 78%
5,000 to 9,999 members
179 150.4 178.4 -28.0 84% 82%
Over 10,000 members
212 820.1 961.0 -140.9 85% 85%
Total 5,945 1,298.3 1,542.5 -244.2 84% 84%
Figure 4.4 | s179 funding levels by size of scheme membership as at 31 March 2015
Source: PPF/ The Pensions Regulator
*Note that schemes with unusual funding arrangements were excluded from the simple averages in this table to avoid distortions. Sixteen schemes were removed on the basis that their buy-out funding level was equal to or greater than 200 per cent.
14.1
114.7
199.0
150.4
820.1
15.1
140.0
248.1
178.4
961.0
0 200 400 600 800 1,000
2 to 99members
100 to 999members
1,000 to 4,999members
5,000 to 9,999members
Over 10,000members
£ billion
Liabilities Assets
Figure 4.5 | Total assets and liabilities on a s179 basis as at 31 March 2015
Source: PPF/ The Pensions Regulator
4.4 Analysis of funding by scheme size

30 t h e p u r p l e b o o k | 2 0 1 5
Membership group
Number of schemes in
sample
Market value of assets (£ billion)
Liabilities (£ billion)
Balance (£ billion)
Weighted average
funding ratio
Simple average funding ratio*
2 to 99 members
2,144 14.1 21.2 -7.1 67% 66%
100 to 999 members
2,625 114.7 191.4 -76.7 60% 59%
1,000 to 4,999 members
785 199.0 332.4 -133.4 60% 59%
5,000 to 9,999 members
179 150.4 240.1 -89.7 63% 60%
Over 10,000 members
212 820.1 1,314.1 -494.0 62% 62%
Total 5,945 1,298.3 2,099.2 -800.9 62% 62%
Figure 4.7 | Estimated full buy-out levels by size of scheme membership as at 31 March 2015
Source: PPF / The Pensions Regulator
* Note that schemes with unusual funding arrangements were excluded from the simple averages in this table to avoid distortions. Sixteen schemes were removed on the basis that their buy-out funding level was equal to or greater than 200 per cent.
28%
41% 44% 29%
24%
36%
39% 41%
49% 51%
33%
15% 12% 17% 21%
3% 5% 3% 5% 4% 0%
10%
20%
30%
40%
50%
60%
70%
80%
90%
100%
2 to 99members
100 to 999members
1,000 to 4,999
members
5,000 to9,999
members
10,000and overmembers
Over 100%75% to 100%50% to 75%0% to 50%
Membership group
Perc
enta
ge o
f sch
emes
in
mem
bers
hip
grou
p
Figure 4.6 | Distribution of s179 funding levels by size of scheme membership as at 31 March 2015
Source: PPF/ The Pensions Regulator
21 per cent of schemes in the over 10,000 members
group had s179 funding levels of over 100 per cent
compared with 45 per cent last year.

31t h e p u r p l e b o o k | 2 0 1 5
Figure 4.7 | Estimated full buy-out levels by size of scheme membership as at 31 March 2015
21.2
191.4
332.4
240.1
1,314.1
14.1
114.7
199.0
150.4
820.1
0 500 1,000 1,500 £ billion
2 to 99members
100 to 999members
1,000 to 4,999members
5,000 to 9,999members
Over 10,000members
Liabilities Assets
Figure 4.8 | Total assets and liabilities by size of scheme membership on an estimated full buy-out basis as at 31 March 2015
Source: PPF/ The Pensions Regulator
20% 28% 27% 24%
17%
6% 1% 1% 1% 0%
52%
60% 63% 59%
64%
22%
11% 9% 16% 19%
0%
10%
20%
30%
40%
50%
60%
70%
80%
90%
100%
2 to 99members
100 to 999members
1,000 to 4,999
members Membership group
Perc
enta
ge o
f sch
emes
in
mem
bers
hip
grou
p
5,000 to9,999
members
10,000and overmembers
Over 100%75% to 100%50% to 75%0% to 50%
Figure 4.9 | Distribution of buy-out funding levels by size of scheme membership as at 31 March 2015
Source: PPF/ The Pensions Regulator
Figure 4.6 | Distribution of s179 funding levels by size of scheme membership as at 31 March 2015

32 t h e p u r p l e b o o k | 2 0 1 5
£ billion
269.0
956.9
291.9
24.728.7
0.0 200.0 400.0 600.0 800.0 1,000.0 1,200.0
25% and less
Between 25%and 50%
Between 50%and 75%
Between 75%and 100%
Liabilities Assets
188.3
290.0
791.3
Figure 4.11 | Distribution of s179 assets and liabilities by scheme maturity as at 31 March 2015
Source: PPF/ The Pensions Regulator
Scheme maturity is represented by dividing schemes into groups according to the proportion of s179 liabilities which relate to pensioners.
Proportion of s179 liabilities
relating to pensioners
Number of schemes in
sample
Market value of Assets (£ billion)
Liabilities (£ billion)
Balance(£ billion)
Weighted average
funding ratio
Simple average funding ratio*
25% and less 1,970 188.3 269.0 -80.7 70% 76%
Between 25% and 50%
2,787 791.3 956.9 -165.6 83% 82%
Between 50% and 75%
984 290.0 291.9 -1.9 99% 97%
Between 75% and 100%
204 28.7 24.7 3.9 116% 118%
Total 5,945 1,298.3 1,542.5 -244.2 84% 84%
Figure 4.10 | Analysis of s179 funding levels by scheme maturity as at 31 March 2015
Source: PPF/ The Pensions Regulator
* Note that schemes with unusual funding arrangements were excluded from the simple averages in this table to avoid distortions. Sixteen schemes were removed on the basis that their buy-out funding level was equal to or greater than 200 per cent.
Higher funding levels remain associated with
schemes with greater maturity.
4.5 Analysis of funding by scheme maturity

33t h e p u r p l e b o o k | 2 0 1 5
49%
37%
14% 3%
30%
45%
44%
18%
13% 16%
41%
78%
8% 2% 1% 1% 0%
10%
20%
30%
40%
50%
60%
70%
80%
90%
100%
25% and less Between 25% and 50%
Between 50% and 75%
Between 75% and 100%
Over 100%75% to 100%50% to 75%0% to 50%
Figure 4.12 | Distribution of funding levels on a s179 basis by scheme maturity as at 31 March 2015
Source: PPF/ The Pensions Regulator
StatusNumber of schemes in
sample
Market value of Assets (£ billion)
Liabilities (£ billion)
Balance (£ billion)
Weighted average
funding ratio
Simple average funding ratio*
Open 765 216.4 292.4 -76.0 74% 82%
Closed to new members
3,053 906.6 1,035.2 -128.6 88% 85%
Closed to future accrual
1,998 170.6 209.6 -39.1 81% 82%
Winding up 129 4.8 5.3 -0.6 89% 103%
Total 5,945 1,298.3 1,542.5 -244.2 84% 84%
Figure 4.13 | Analysis of s179 funding levels by scheme status as at 31 March 2015
4.6 Analysis of funding by scheme status
Source: PPF/ The Pensions Regulator
* Note that schemes with unusual funding arrangements were excluded from the simple averages in this table to avoid distortions. Sixteen schemes were removed on the basis that their buy-out funding level was equal to or greater than 200 per cent.
34 t h e p u r p l e b o o k | 2 0 1 5
5.3
209.6
1,035.2
292.4
4.8
170.6
906.6
216.4
0.0 200.0 400.0 600.0 800.0 1,000.0 1,200.0
Winding Up
Closed tofuture accruals
Closed tonew members
Open
£ billion
Liabilities Assets
Figure 4.14 | Distribution of s179 assets and liabilities by scheme status as at 31 March 2015
Source: PPF/ The Pensions Regulator
37% 35%
38%
13%
36% 41%
38%
33%
20% 22% 19%
50%
7% 2% 5% 4% 0%
10%
20%
30%
40%
50%
60%
70%
80%
90%
100%
Open Closed to new entrants
Closed to future accrual
Winding Up
Over 100%75% to 100%50% to 75%0% to 50%
Figure 4.15 | Distribution of schemes by s179 funding levels within scheme status groups as at 31 March 2015
Source: PPF/ The Pensions Regulator

35t h e p u r p l e b o o k | 2 0 1 5
£ billion
7.4
286.6
1,416.8
388.4
4.8
170.6
906.6
216.4
0.0 200.0 400.0 600.0 800.0 1000.0 1200.0 1400.0 1600.0
Winding Up
Closed tofuture accruals
Closed tonew members
Open
Liabilities Assets
Figure 4.17 | Distribution of estimated full buy-out assets and liabilities by status as at 31 March 2015
Source: PPF / The Pensions Regulator
25% 22% 28%
12%
50% 59%58%
39%
20%16% 12%
32%
5% 3% 2%
18%
0%
10%
20%
30%
40%
50%
60%
70%
80%
90%
100%
Open Closed to new members
Closed to future accrual
Winding-up
Over 100%75% to 100%50% to 75%0% to 50%
Figure 4.18 | Distribution of estimated full buy-out funding levels by scheme status as at 31 March 2015
Source: PPF / The Pensions Regulator
StatusNumber of schemes in
sample
Market value of Assets (£ billion)
Liabilities (£ billion)
Balance (£ billion)
Weighted Average
funding ratio
Simple average funding ratio*
Open 765 216.4 388.4 -172.0 56% 64%
Closed to new members
3,053 906.6 1,416.8 -510.2 64% 62%
Closed to future accrual
1,998 170.6 286.6 -116.0 60% 60%
Winding up 129 4.8 7.4 -2.6 64% 76%
Total 5,945 1,298.3 2,099.2 -800.9 62% 62%
Figure 4.16 | Analysis of estimated full buy-out funding levels by scheme status as at 31 March 2015
Source: PPF / The Pensions Regulator
*Note that schemes with unusual funding arrangements were excluded from the simple averages in this table to avoid distortions. Sixteen schemes were removed on the basis that their buy-out funding level was equal to or greater than 200 per cent.
Figure 4.15 | Distribution of schemes by s179 funding levels within scheme status groups as at 31 March 2015
36 t h e p u r p l e b o o k | 2 0 1 5
Source: PPF / The Pensions Regulator
Figure 4.19 | s179 liabilities by active, deferred and pensioner members
39%
35%
26%
Pensioner
Deferred
Active
£ billion
1.5
76.1
10.8
257.9
13.5
13.7
102.2
256.3
61.0
71.6
62.9
1.6
92.1
13.8
404.3
310.4
14.4
21.4
121.7
327.7
80.6
76.5
78.1
0.0 200.0 400.0 600.0
Agricultural Production 94%
Communications 83%
Construction 78%
Finance, Insurance and Real Estate 92%
Manufacturing 83%
Mining 94%
Public Administration 64%
Retail Trade 84%
Services 78%
Transportation 76%
Utilities 94%
Wholesale Trade 81%
Liabilities
Assets
370.7
Figure 4.20 | s179 assets and liabilities by industry* with overall funding level as at 31 March 2015
Source: PPF / The Pensions Regulator
*Based on US 1972 Standard Industrial Classification.
26 per cent of s179 liabilities in the dataset were in
respect of active members.
37t h e p u r p l e b o o k | 2 0 1 5
5.1 Summary • All the funding sensitivities in Chapter 5 are on a s179 basis, taking the funding
position as at 31 March 20155 as the base and using the Purple 2015 dataset. The sensitivities do not take into account the use of derivative instruments to hedge changes in interest rates, inflation, equity levels or longevity.
• The historical series in section 5.2 takes the estimated funding position at 31 March of each year given in Chapter 4, “Scheme Funding”. The monthly profiles between end-March of one year and end-February of the next are obtained by rolling forward the assets and liabilities using the latest scheme asset allocation and movements in nominal and real gilt yields and equity markets.
• The funding position of schemes can change over time reflecting changes in a number of factors including: financial markets, actuarial assumptions, the decline in the universe of defined benefit schemes, employers’ special contributions6, and pensions getting closer to payment.
• Since the start of the financial crisis in 2008, aggregate scheme funding on a s179 basis has been over 100 per cent in only 10 of the 89 months. Over this period, the funding ratio has averaged 89.7 per cent compared with 102.1 per cent between March 2006 and March 2008.
• The historical aggregate balance and funding ratio have been trending downwards since 2006.
• The percentage of schemes in deficit on a historical s179 basis was around 85 per cent in January 2015, similar to the peak percentages in 2009 and 2012.
• A 0.1 percentage point (10 basis point) rise in gilt yields decreases the end-March 2015 aggregate deficit by £23.3 billion from £244.2 billion to £220.9 billion while a 2.5 per cent rise in equity prices would reduce the aggregate deficit by £10.6 billion.
• A 0.1 percentage point (10 basis point) reduction in gilt yields raises aggregate scheme liabilities by 2.0 per cent and raises aggregate scheme assets by 0.5 per cent. A 2.5 per cent rise in equity markets raises scheme assets by 0.8 per cent.
• If the assumed rate of inflation increases by 0.1 percentage point with nominal gilt yields unchanged, then the s179 liabilities for aggregate schemes increases by approximately 0.7 per cent or £11 billion.
• An increase in longevity such that the experienced mortality is now equivalent to that of an individual two years younger would increase aggregate schemes’ liabilities by 6.4 per cent, or £99.4 billion. This sensitivity is greater than last year (5.5 per cent or £63 billion) because a constant addition to longevity is much more expensive at lower bond yields.
5Funding Sensitivities
5 Using the previous valuation guidance as in Chapter 4, please follow the link for more information www.pensionprotectionfund.org.uk/DocumentLibrary/Documents/Section_179_Assumptions_Guidance_VA7_May14.pdf
6 For more information, please see Chapter 12, section 12.3 on special contributions.

38 t h e p u r p l e b o o k | 2 0 1 5
5.2 Historical changes in s179 scheme funding since 2006 – the new PPF Funding IndexMovements in the estimated funding position of schemes can change over time reflecting changes in a number of factors including: financial markets, actuarial assumptions, the decline in the universe of defined benefit schemes, employers’ special contributions7, and pensions getting closer to payment. The historical series in this section takes the estimated funding position at 31 March of each year given in Chapter 4 “Scheme Funding”. The monthly profiles between end-March of one year and end-February of the next are obtained by rolling forward the assets and liabilities using movements in nominal and real gilt yields and equity markets.
Mar-06
Mar-07
Mar-08
Mar-09
Mar-10
Mar-11
Mar-12
Mar-13
Mar-14
Mar-15
Fund
ing
ratio
Year
70%
80%
90%
100%
110%
120%
Figure 5.1 | Historical s179 funding ratio (assets as a percentage of liabilities) of pension schemes in the Purple datasets
Source: PPF / The Pensions Regulator
Since the start of the financial crisis in 2008,
scheme funding on a s179 basis has been over 100
per cent in only 10 of the 89 months. The February 2009 trough was mainly
the result of lower equity markets while the May 2012 and January 2015
troughs mainly reflected lower gilt yields.
7 For more information, please see Chapter 12, section 12.3 on special contributions.

39t h e p u r p l e b o o k | 2 0 1 5
Mar-06
Mar-07
Mar-08
Mar-09
Mar-10
Mar-11
Mar-12
Mar-13
Mar-14
Mar-15
Agg
rega
te B
alan
ce (£
bill
ion)
Year
100
100
-100
-200
-300
-400
200
Mar-06
Mar-07
Mar-08
Mar-09
Mar-10
Mar-11
Mar-12
Mar-13
Mar-14
Mar-15
£ bi
llion
Year
600
800
1,000
1,200
1,400
1,600
1,800
Assets Liabilities
Figure 5.2 | Historical s179 aggregate balance (assets less liabilities) of pension schemes in the Purple datasets
Figure 5.3 | Historical movements in assets and s179 liabilities of schemes in the Purple datasets
Source: PPF / The Pensions Regulator
Source: PPF / The Pensions Regulator
There has been a more marked downward trend in the aggregate balance. Although the funding ratios are similar in March 2009, April 2012, and January 2015 the aggregate deficit becomes larger over time as assets and liabilities rise.
Scheme assets have risen strongly since the end of the financial crisis largely reflecting both rising equity markets and bond prices. However, scheme liabilities have risen more, reflecting the impact of lower gilt yields.

40 t h e p u r p l e b o o k | 2 0 1 5
The aggregate deficit of schemes in deficit was at
its largest in January 2015 at £392.6 billion, almost double the deficit in the
financial crisis.
In January 2015, around 85 per cent of schemes were
in deficit, similar to the peak percentages in 2009
and 2012.
Mar-06
Mar-07
Mar-08
Mar-09
Mar-10
Mar-11
Mar-12
Mar-13
Mar-14
Mar-15
Agg
rega
te B
alan
ce (£
bill
ion)
Year
-400
-350
-300
-250
-200
-150
-100
-50
0
Figure 5.4 | Historical aggregate assets less aggregate liabilities for schemes in deficit
Source: PPF/ The Pensions Regulator
Mar-06
Mar-07
Mar-08
Mar-09
Mar-10
Mar-11
Mar-12
Mar-13
Mar-14
Mar-15
Year
40%
50%
60%
70%
80%
90%
100%
Perc
enta
ge o
f sch
emes
* *
*
*
Figure 5.5 | Historical percentage of schemes in deficit each month in the Purple datasets*
Source: PPF / The Pensions Regulator
*Note: the changes to assumptions in March 2008, October 2009 and April 2011 reduced the number of schemes in deficit by 473, 714 and 253 respectively, while the changes in assumptions in May 2014 raised the number of schemes in deficit by 259.
41t h e p u r p l e b o o k | 2 0 1 5
Year
FTSE
All-
Shar
e In
dex
15-y
ear g
ilt y
ield
0%
1%
2%
3%
4%
5%
6%
FTSE All-Share index (LHS) 15 year gilt yield (RHS)
Mar-06
Mar-07
Mar-08
Mar-09
Mar-10
Mar-11
Mar-12
Mar-13
Mar-14
Mar-15
1,500
2,000
2,500
3,000
3,500
4,000
Figure 5.6 | Movements in stock markets and gilt yields
Source: Bloomberg
70%
80%
90%
100%
110%
120%
130%
140%
150%
Fund
ing
ratio
Mar-06
Mar-07
Mar-08
Mar-09
Mar-10
Mar-11
Mar-12
Mar-13
Mar-14
Mar-15
Year
Historical Funding Ratio
Estimated Funding Ratio
Figure 5.7 | Estimated s179 funding level (assets as a percentage of liabilities) of pension schemes in the Purple 2015 dataset
Source: PPF/ The Pensions Regulator
The FTSE All-Share Index saw its lowest level in March 2009. However, it more than doubled by March 2015. Meanwhile the 15-year gilt yield fell dramatically over the same period.
Market movements would have resulted in an estimated variation in the funding ratio of around 66 percentage points with the highest ratio of 144.7 per cent in June 2007 and the lowest ratio of 78.6 per cent in May 2012.
5.3 Impact of estimated changes in markets and actuarial assumptions since 2006These charts take the Purple 2015 dataset and roll back the assets and liabilities. They only show the impact of market movements and changes in actuarial assumptions. They also assume that the levels of Deficit Reduction Contributions built into the latest valuations were present historically.

42 t h e p u r p l e b o o k | 2 0 1 5
Historical Aggregate Balance
Estimated Aggregate Balance
-400
-300
-200
-100
0
100
200
300
Mar-06
Mar-07
Mar-08
Mar-09
Mar-10
Mar-11
Mar-12
Mar-13
Mar-14
Mar-15
Agg
rega
te B
alan
ce (
£ bi
llion
)
Year
Figure 5.8 | Estimated s179 aggregate balance (assets less liabilities) of pension schemes in the Purple 2015 dataset
Source: PPF/ The Pensions Regulator
Assets less s179 liabilities (£ billion)
Movement in equity prices
Movement in gilt yields
-0.3pp -0.2pp -0.1pp 0.0pp 0.1pp 0.2pp 0.3pp
7.5% -281.9 -258.7 -235.5 -212.2 -188.8 -165.4 -141.9
5.0% -292.6 -269.4 -246.2 -222.9 -199.5 -176.1 -152.6
2.5% -303.3 -280.1 -256.9 -233.6 -210.2 -186.8 -163.3
0.0% -313.9 -290.8 -267.5 -244.2 -220.9 -197.4 -173.9
-2.5% -324.6 -301.4 -278.2 -254.9 -231.5 -208.1 -184.6
-5.0% -335.3 -312.1 -288.9 -265.6 -242.2 -218.8 -195.3
-7.5% -346.0 -322.8 -299.6 -276.3 -252.9 -229.5 -206.0
Figure 5.9 | Impact of changes in gilt yields and equity prices on s179 funding levels from a base aggregate deficit of £244.2 billion, as at 31 March 2015
Source: PPF / The Pensions Regulator
A 0.1 percentage point (10 basis point) rise in gilt
yields would have improved the end March 2015 s179
aggregate deficit by £23.4 billion from £244.2 billion
(bold) to £220.9 billion (shaded), somewhat larger
than the impact of a 2.5 per cent increase in equity prices
which result in a deficit of £233.6 billion (shaded).
5.4 Funding Sensitivities: rules of thumb
Market movements would have resulted in an estimated variation in the s179 aggregate balance of around £570 billion with
the largest surplus of £261.5 billion in June 2007 and the
largest deficit of £308.8 billion in January 2015.

43t h e p u r p l e b o o k | 2 0 1 5
Figure 5.10 | Impact of changes in gilt yields and equity prices on assets from a base of 100, as at 31 March 2015
Figure 5.11 | Impact of changes in gilt yields on s179 liabilities from a base of 100, as at 31 March 2015
Source: PPF/ The Pensions Regulator
Source: PPF/ The Pensions Regulator
Assets less s179 liabilities (£ billion)
Movement in equity prices
Movement in gilt yields
-0.3pp -0.2pp -0.1pp 0.0pp 0.1pp 0.2pp 0.3pp
7.5% -321.8 -301.4 -280.9 -260.4 -239.8 -219.2 -198.6
5.0% -330.1 -309.7 -289.2 -268.7 -248.1 -227.5 -206.9
2.5% -338.4 -318.0 -297.5 -277.0 -256.4 -235.8 -215.2
0.0% -346.7 -326.3 -305.8 -285.3 -264.7 -244.1 -223.5
-2.5% -355.0 -334.5 -314.1 -293.6 -273.0 -252.4 -231.8
-5.0% -363.3 -342.8 -322.4 -301.9 -281.3 -260.7 -240.1
-7.5% -371.6 -351.1 -330.7 -310.2 -289.6 -269.0 -248.4
Assets relative to a base of 100
Movement in equity prices
Movement in gilt yields
-0.3pp -0.2pp -0.1pp 0.0pp 0.1pp 0.2pp 0.3pp
7.5% 104.1 103.6 103.0 102.5 101.9 101.4 100.9
5.0% 103.3 102.7 102.2 101.6 101.1 100.6 100.1
2.5% 102.5 101.9 101.4 100.8 100.3 99.8 99.2
0.0% 101.6 101.1 100.5 100.0 99.5 98.9 98.4
-2.5% 100.8 100.3 99.7 99.2 98.6 98.1 97.6
-5.0% 100.0 99.4 98.9 98.4 97.8 97.3 96.8
-7.5% 99.2 98.6 98.1 97.5 97.0 96.5 95.9
s179 liabilities relative to a base of 100
s179 liabilities relative to March
level (=100)
Movement in gilt yields
-0.3pp -0.2pp -0.1pp 0.0pp 0.1pp 0.2pp 0.3pp
105.9 103.9 102.0 100.0 98.0 96.1 94.1
Figure 5.12 | Impact of changes in gilt yields and equity prices on the s179 funding position from a base total deficit of £285.3 billion, excluding schemes in surplus, as at 31 March 2015
Source: PPF / The Pensions Regulator
A 2.5 per cent increase in equity prices would have raised scheme assets by 0.8 per cent. A 0.3 per cent decrease in gilt yields would increase scheme assets by 1.6 per cent.
A 2.5 per cent increase in equity prices would decrease the scheme deficit for underfunded schemes by £8.3 billion from a base case of £285.3 billion. A 0.3 per cent decrease in gilt yields would increase the scheme deficit by £61.4 billion from a base of £285.3 billion.
A 0.1 percentage point (10 basis points) reduction or increase in gilt yields increases or reduces s179 liabilities by 2 per cent.

44 t h e p u r p l e b o o k | 2 0 1 5
s179 liabilities (£ billion)
Movement in equity pricesChange in nominal yields Change in real yields
-0.1pp 0.1pp -0.1pp 0.1pp
£ billions 1,562.8 1,522.3 1,553.8 1,531.3
Percentage change 1.3% -1.3% 0.7% -0.7%
Figure 5.13 | Impact of changes in the rate of inflation on s179 liabilities (base = £1,542.5 billion), as at 31 March 2015
Source: PPF / The Pensions Regulator
s179 liabilities (£ billion) % Change from base
Age Rating + 2 years 1,443.0 -6.5%
Age Rating - 2 years 1,641.9 6.4%
Figure 5.14 | Impact of changes in longevity assumptions on s179 liabilities (base = £1,542.5 billion), as at 31 March 2015
Source: PPF / The Pensions Regulator
If the assumed rate of inflation increases by 0.1
percentage points and nominal rates remain
unchanged then the s179 liabilities rise by 0.7 per
cent or £11.3 billion.
An increase in longevity such that experienced
mortality is now equivalent to that of an individual two years younger would cause total scheme s179 liabilities to increase by £99.4 billion,
or 6.4 per cent.
45t h e p u r p l e b o o k | 2 0 1 5
6Insolvency Risk6.1 Summary • The insolvency rate of the PPF universe (number of insolvency events for sponsors
of PPF-eligible schemes divided by the total number of scheme sponsors) has fallen sharply since the second quarter of 2013, reaching 0.32 per cent (four-quarter moving average basis) in the second quarter of 2015.
• The UK economy has seen strong growth since early 2013. GDP in the second quarter of 2015 was 5.2 per cent above the pre-crisis high in the first quarter of 2008, despite the challenging environment in the eurozone, the UK’s biggest trading partner.
• Smaller schemes tend to have higher insolvency probabilities. The average one-year ahead insolvency probability for schemes with fewer than 100 members is 1.1 per cent, considerably higher than for schemes with between 1,000 and 4,999 members which stood at 0.53 per cent at the end of the first quarter of 2015.
• From Levy Year 2015/16, Experian is the new provider of insolvency scores for the purpose of the PPF levy determination. In order to improve predictive power and account for the different composition of the PPF universe of companies as opposed to the UK broad corporate sector, Experian has constructed a PPF-specific model.
• The model is calibrated to predict insolvencies within the PPF-specific universe of employers that sponsor eligible DB pension schemes. In addition to improved predictability, the PPF-specific model provides greater transparency and stability and increased resilience due to the use of, primarily, published financial data, and additionally is less vulnerable to manipulation8.
8 Further information on the Experian model can be found on the PPF website: www.pensionprotectionfund.org.uk/levy/Pages/LevyPublications.aspx
46 t h e p u r p l e b o o k | 2 0 1 5
Figure 6.2 | UK company liquidations
Source: Office for National Statistics and the UK Insolvency Service
0
1000
2000
3000
4000
5000
6000
7000
8000
9000 -7%
-5%
-3%
-1%
1%
3%
5%
7%
1991 Q2
1993 Q2
1995 Q2
1997 Q2
1999 Q2
2001 Q2
2003 Q2
2005 Q2
2007 Q2
2009 Q2
2011 Q2
2013 Q2
2015 Q2
Liqu
idat
ions
(inv
erte
d sc
ale)
GD
P G
row
th
Real GDP growth, YoY (LHS) Number of liquidations (Quarterly, RHS)
GDP growth has been strong since the end of
2013, and GDP in Q2 2015 was 5.2 per cent above the pre-crisis level in Q1 2008.
The number of company liquidations has been
trending down since 2013.
Figure 6.1 | PPF universe insolvency rates*
Source: The UK Insolvency Service and the PPF / The Pensions Regulator
* There are around 2.7 million companies in the UK, compared to around 14,000 in the PPF universe.
0
10
20
30
40
50
60
Q2 2005
Q4 2005
Q2 2006
Q4 2006
Q2 2007
Q4 2007
Q2 2008
Q4 2008
Q2 2009
Q4 2009
Q2 2010
Q4 2010
Q2 2011
Q4 2011
Q2 2012
Q4 2012
Q2 2013
Q4 2013
Q2 2014
Q4 2014
Q2 2015
Coun
t of i
nsol
venc
y ev
ents
ove
r qua
rter
Insolvency events in surplus at assessment date Insolvency events in deficit at assessment date Four-quarter moving average of total insolvency events
The PPF-universe insolvency rate has been
trending down since Q2 2013.
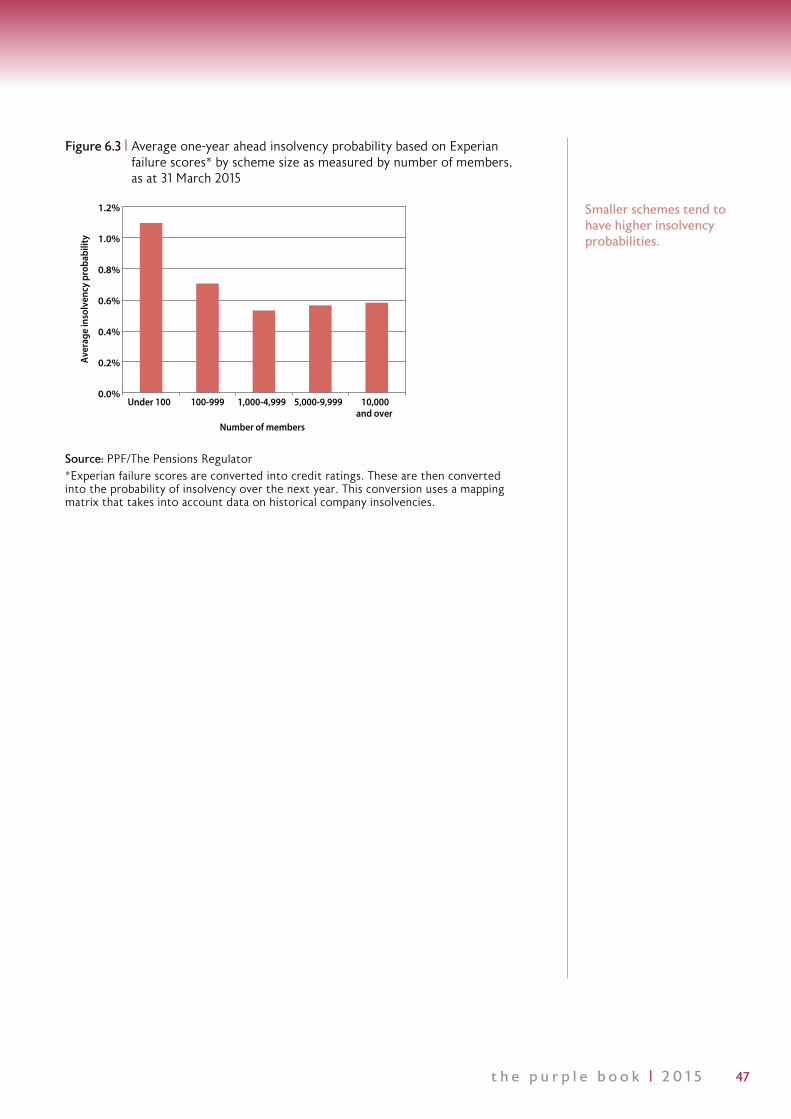
47t h e p u r p l e b o o k | 2 0 1 5
Figure 6.3 | Average one-year ahead insolvency probability based on Experian failure scores* by scheme size as measured by number of members, as at 31 March 2015
Source: PPF/The Pensions Regulator*Experian failure scores are converted into credit ratings. These are then converted into the probability of insolvency over the next year. This conversion uses a mapping matrix that takes into account data on historical company insolvencies.
0.0%
0.2%
0.4%
0.6%
0.8%
1.0%
1.2%
Under 100 100-999 1,000-4,999 5,000-9,999 10,000and over
Aver
age
inso
lven
cy p
roba
bilit
y
Number of members
Smaller schemes tend to have higher insolvency probabilities.

48 t h e p u r p l e b o o k | 2 0 1 5
7 Asset Allocation7.1 Summary • In 2015, the equity share of total scheme assets fell from 35.0 per cent to 33.0 per
cent while the gilts and fixed interest share rose from 44.1 per cent to 47.7 per cent.
• The share of “other investments”, total investments less equities and bonds, fell from 20.9 per cent in 2014 to 19.3 per cent in 2015. This largely reflected a large fall in the cash share which more than offset increases for the remaining components (insurance policies, property, hedge funds and “other” 9).
• The UK-quoted proportion of total equity holdings fell from 28.9 per cent in 2014 to 25.6 per cent in 2015, while the overseas-quoted share increased from 62.4 per cent to 65.4 per cent. The balance of holdings in unquoted/private equities rose from 8.7 per cent in 2014 to 9.0 per cent in 2015.
• Within total gilts and fixed interest assets, the changes were more noticeable in 2015 after modest changes in 2014. The corporate fixed interest bonds’ proportion decreased from 40.3 per cent in 2014 to 37.7 per cent in 2015. Meanwhile, the proportion of government fixed interest bonds rose from 18.6 per cent to 20.3 per cent. The balance of holdings in index-linked bonds rose to 42.0 per cent from 41.1 per cent in 2014.
• Many of the changes in 2015 continue the trends that have been in place for some time.
o Between 2006 and 2015, the equity share of total assets fell from 61.1 per cent to 33.0 per cent, the gilt and fixed interest share rose from 28.3 per cent to 47.7 per cent. Between 2008 and 2015, the UK-quoted share of total equity holdings fell from 48.0 per cent to 25.6 per cent, while the overseas-quoted equity share rose from 51.6 per cent to 65.4 per cent.
o Government fixed interest bonds’ share of gilts and fixed interest holdings fell from 33.2 per cent in 2008 to 17.7 per cent in 2012, but rose to 20.3 per cent by 2015. Meanwhile, the corporate bonds’ share rose from 32.6 per cent to 44.8 per cent in 2012 but then declined to 37.7 per cent by 2015. The index-linked bonds’ proportion rose steadily from 33.9 per cent to 42.0 per cent.
• Between 2006 and 2015 the share of other investments rose from 10.6 per cent to 19.3 per cent. The hedge fund share rose from 1.5 per cent in 2009, the first year the data was collected, to 6.1 per cent in 2015. The cash and property shares also rose as did the residual “other” category which will have included hedge funds before 2009.
• Schemes provide their most recent asset allocations in their scheme returns. In the 2015 returns, approximately 99 per cent of schemes provided asset allocations for 2013 or later.
9 Other includes deferred or immediate fully insured annuities, commodities, asset backed securities and a residual ‘other’ category.

49t h e p u r p l e b o o k | 2 0 1 5
• Smaller schemes tend to have a higher proportion of assets in UK-quoted equities and a smaller proportion in overseas-quoted equities and unquoted/private equities. For example, schemes with under £5 million in assets have 54 per cent of their equity holdings in UK-quoted equities compared with 29 per cent for schemes with over £100 million in assets.
• Within gilts and fixed interest, smaller schemes tend to have a higher proportion in government fixed interest and a smaller proportion in index-linked bonds. For example, schemes with under £5 million in assets have 30 per cent of their fixed interest holdings in government fixed interest compared with 19 per cent for schemes with over £100 million in assets.
• The proportion of equities in total assets falls with scheme maturity while the proportion of gilts and fixed interest rises.
• The best funded schemes tend to have the greatest proportion of their assets invested in gilts and fixed interest, and a smaller proportion invested in equities.
• Most of this chapter uses weighted-average asset allocations. For example, the share of equities in each scheme’s asset allocation is multiplied by the weight of its assets in the total and then added together for all schemes. This is equivalent to the share of total equities in total assets. The simple average just takes the arithmetic average of the share of equities in total assets for each scheme.
7.2 Scheme return data10
Figure 7.1 | Distribution of schemes by asset allocation date*
Source: PPF/ The Pensions Regulator
*There can be a gap, sometimes significant, between the date of the scheme return and the date at which the asset allocation was taken. This means that the date at which asset allocation data is provided differs from scheme to scheme.
**This is due to winding up schemes which have not updated their asset return data.
Asset allocation year Number of schemesPercentage of Purple dataset
2006-2011** 30 0.5%
2012 55 0.9%
2013 1,989 33.5%
2014 3,855 64.9%
2015 16 0.3%
About 99 per cent of schemes provided an asset allocation which was for 2013 or later.
10 Asset allocations submitted by schemes are not adjusted for market movements.

50 t h e p u r p l e b o o k | 2 0 1 5
Figure 7.2 | Average asset allocation in total assets
Figure 7.3 | Asset allocation: simple averages
Source: PPF/ The Pensions Regulator
*The fall in the insurance policies shown from 2012 reflects the fact that schemes were encouraged to give a split of their insurance investments by asset class given the New Levy formula which included investment risk.
Source: PPF/ The Pensions Regulator
Extended Purple 2006
Extended Purple 2007
Extended Purple 2008
Purple 2009
Purple 2010
Purple 2011
Purple 2012
Purple 2013
Purple 2014
Purple 2015
Equities 61.1% 59.5% 53.6% 46.4% 42.0% 41.1% 38.5% 35.1% 35.0% 33.0%
Gilts and fixed interest
28.3% 29.6% 32.9% 37.1% 40.4% 40.1% 43.2% 44.8% 44.1% 47.7%
Other investmentsof which:
10.6% 10.9% 13.5% 16.5% 17.6% 18.8% 18.3% 20.1% 20.9% 19.3%
Insurance policies
0.9% 0.8% 1.1% 1.4% 1.4% 1.6% 0.2%* 0.1% 0.1% 0.1%
Cash and deposits
2.3% 2.3% 3.0% 3.9% 3.9% 4.1% 5.1% 6.7% 6.1% 3.5%
Property 4.3% 5.2% 5.6% 5.2% 4.6% 4.4% 4.9% 4.7% 4.6% 4.9%
Hedge Funds
n/a n/a n/a 1.5% 2.2% 2.4% 4.5% 5.2% 5.8% 6.1%
'Other' 3.1% 2.5% 3.8% 4.5% 5.4% 6.3% 3.6% 3.5% 4.3% 4.7%
Simple averages
2006 2007 2008 2009 2010 2011 2012 2013 2014 2015
Equities 52.6% 53.5% 50.2% 46.6% 43.1% 43.7% 43.7% 40.6% 39.4% 38.8%
Gilts and fixed interest
22.6% 24.0% 26.5% 29.2% 32.6% 32.6% 36.1% 39.1% 39.0% 39.4%
Other investmentsof which:
24.8% 22.5% 23.3% 24.2% 24.3% 23.7% 20.2% 20.3% 21.6% 21.8%
Insurance policies 14.9% 13.7% 13.0% 12.4% 12.3% 11.8% 4.4% 2.0% 1.8% 1.7%
Cash and deposits 3.9% 3.7% 4.4% 5.6% 5.7% 4.9% 5.5% 6.2% 6.4% 5.7%
Property 2.1% 2.5% 2.9% 2.8% 2.6% 2.7% 3.5% 3.6% 3.5% 3.6%
Hedge Funds n/a n/a n/a 0.7% 0.9% 1.0% 3.7% 5.0% 6.2% 7.3%
'Other' 3.6% 2.6% 2.9% 2.6% 2.8% 3.3% 3.2% 3.5% 3.9% 3.7%
The proportion of gilts and fixed interest rose
while the proportions in equities decreased in 2015,
a continuation of long term trends. The other
investments share fell for the first time since 2012.
Looking at simple averages, the equity share also fell and
the gilt and fixed interest share also rose. However,
the other investments share rose slightly.

51t h e p u r p l e b o o k | 2 0 1 5
Figure 7.4 | Gilt and fixed interest splits
Figure 7.5 | Equity splits
Source: PPF/ The Pensions Regulator
Source: PPF/ The Pensions Regulator
Year
Gilts and fixed interest
Government fixed interest bonds
Corporate fixed interest bonds Index linked bonds
Average share
Weighted average share
Average share
Weighted average share
Average share
Weighted average share
2008 47.2% 33.2% 33.0% 32.6% 19.8% 33.9%
2009 45.6% 29.0% 37.3% 38.3% 17.1% 32.6%
2010 37.3% 24.6% 43.0% 42.2% 19.8% 33.1%
2011 31.2% 19.6% 47.1% 44.3% 21.7% 36.1%
2012 28.2% 17.7% 49.4% 44.8% 22.4% 37.5%
2013 27.0% 18.5% 49.6% 40.6% 23.4% 40.9%
2014 23.8% 18.6% 51.9% 40.3% 24.4% 41.1%
2015 23.8% 20.3% 51.2% 37.7% 25.0% 42.0%
Year
Equities
UK-quoted equities Overseas-quoted equitiesUnquoted/private
equities
Average share
Weighted average share
Average share
Weighted average share
Average share
Weighted average share
2008 60.4% 48.0% 39.6% 51.6% n/a n/a
2009 57.6% 44.2% 41.7% 53.8% 0.7% 1.9%
2010 55.3% 40.1% 43.7% 55.3% 1.0% 4.4%
2011 52.7% 38.0% 46.1% 57.2% 1.2% 4.8%
2012 49.9% 33.9% 48.5% 60.0% 1.7% 6.1%
2013 47.5% 31.0% 50.3% 61.3% 2.2% 7.7%
2014 44.9% 28.9% 52.7% 62.4% 2.4% 8.7%
2015 42.2% 25.6% 55.3% 65.4% 2.5% 9.0%
Within gilts and fixed interest, the weighted average corporate bond proportion declined in 2015, while the proportions of government fixed interest and index-linked rose. The proportion of index-linked bonds has risen steadily since 2009 by over nine percentage points. Over the same period, the share of government fixed interest bonds has fallen by a similar amount.
Within equities the overseas-quoted and unquoted equity proportions continued to rise in 2015, while the share of UK-quoted equities continued to fall.

52 t h e p u r p l e b o o k | 2 0 1 5
Figure 7.7 | Simple average of equities and fixed-interest assets split by asset size
Source: PPF/ The Pensions Regulator
0%
10%
20%
30%
40%
50%
60%
70%
Governmentbonds
Corporatebonds
Index-linkedsecurities
UK equities Overseasequities
Unquotedequities
Perc
enta
ge o
f ass
ets
Under £5m
£5m-£10m
£10m-£100m
Over £100m
EquityFixed Interest
Figure 7.6 | Simple average asset allocation of schemes by asset size
Source: PPF/ The Pensions Regulator
*Other includes deferred or immediate fully insured annuities, commodities, asset backed securities and a residual ‘other’ category
0%
5%
10%
15%
20%
25%
30%
35%
40%
45%
50%
Equities Gilts and fixed interest
Property Cash and deposits
Insurance policies
Hedgefunds
Other*
Perc
enta
ge o
f ass
ets
Asset class
Under £5m £5m-£10m £10m-£100m Over £100m
The proportion of assets held in gilts and fixed interest bonds and in hedge funds tends to
increase with scheme size. The proportions held in
insurance policies and cash and deposits tend to
decrease with scheme size.
Larger schemes tend to hold more in overseas-
quoted rather than UK-quoted equities and
more in index-linked rather than in conventional
government bonds.

53t h e p u r p l e b o o k | 2 0 1 5
Figure 7.8 | Weighted-average asset allocation by s179 funding level
Equities Gilts and fixed interest
Property Cash and deposits
Insurance policies
Hedgefunds
Other*
Asset class
0%
10%
20%
30%
40%
50%
60%
Perc
enta
ge o
f ass
ets
Under 60% 60%-79% 80%-99% 100% and over
Source: PPF/ The Pensions Regulator
*Other includes deferred or immediate fully insured annuities, commodities, asset backed securities and a residual ‘other’ category.
The best funded schemes tend to have the greatest proportion of their assets invested in gilts and fixed interest, and a smaller proportion invested in equities.
Figure 7.9 | Weighted-average asset allocation of schemes by current pensioner liabilities as a percentage of total liabilities
0%
10%
20%
30%
40%
50%
60%
Perc
enta
ge o
f ass
ets
0%-19%
20%-39%
40%-59%
60%-79%
80%-100%
Equities Gilts and fixed interest
Property Cash and deposits
Insurance policies
Hedgefunds
Other*
Asset class
**
Source: PPF/ The Pensions Regulator
*Other includes deferred or immediate fully insured annuities, commodities, asset backed securities and a residual ‘other’ category.**This is dominated by one large scheme which has shifted a lot of its assets into annuities
The proportion of equities in total assets falls with scheme maturity (as measured by the percentage of pensioner liabilities) while the proportion of gilts and fixed interest rises.

54 t h e p u r p l e b o o k | 2 0 1 5
Figure 7.10 | Weighted-average asset allocation of schemes by Experian levy band (the lower the band the lower the predicted probability of insolvency)
0%
10%
20%
30%
40%
50%
60%
70%
Equities Gilts and fixedinterest
Property Cash anddeposits
Insurancepolicies
Hedge funds Other*
Perc
enta
ge o
f ass
ets
Asset class
1 2 3 4
5 6 7 8
9 10
Source: PPF/ The Pensions Regulator
*Other includes deferred or immediate fully insured annuities, commodities, asset backed securities and a residual ‘other’ category.
There appears to be no relationship between asset
allocation and Experian levy band.

55t h e p u r p l e b o o k | 2 0 1 5
8PPF Risk Developments8.1 Summary • The PPF published its Long-Term Funding Strategy in August 2010. As part of this
strategy the PPF aims to be self-sufficient by 2030. The target for self-sufficiency is set as a percentage margin over the liabilities, this being held to cover remaining risks after the PPF reaches the funding horizon. The risk margin covers the risk of unexpected longevity improvements and any future claims (beyond the horizon) in excess of PPF levies together with operational risk and the fact that the PPF’s assets do not exactly track its CPI-linked liabilities. The Funding Strategy is reviewed annually to check whether the funding objective remains appropriate and whether the PPF is on track to achieve it.
• The PPF uses two key statistics to monitor progress against its funding objective – the “probability of success” and “downside risk”. To measure these statistics it has developed an internal model that projects the level of PPF assets and liabilities in future years. It generates an extensive range of asset returns, insolvency and longevity scenarios, and then projects a range of balance sheet outcomes.
• The model projections, with a calculation date of 31 March 2015, suggest that the PPF has an 88 per cent probability of meeting its funding objective compared with 90 per cent one year earlier11 while the “downside risk” has risen from £4 billion to £5 billion. This assumes no change to the PPF’s investment strategy or to the PPF Levy formula.
• The decrease in the probability of success, and higher downside risk, are mostly attributable to the combination of an increase in employer insolvency probabilities over the year and a decrease in the funding level of the schemes that they sponsor. These were partially offset by changes to the assumptions in the model and an improvement in the PPF’s own funding position.
11 This probability is sensitive to a range of modelling assumptions. For a description of the modelling methodology and assumptions employed, see www.pensionprotectionfund.org.uk/DocumentLibrary/Documents/PPF_Funding_Strategy_Document.pdf For the July 2015 review of the funding strategy, see: www.pensionprotectionfund.org.uk/DocumentLibrary/Documents/Funding_Strategy_Review_2015.pdf

56 t h e p u r p l e b o o k | 2 0 1 5
8.2 Long-Term Risk
Figure 8.1 | Cumulative deficits of schemes entering the PPF from 31 March 2015*
£20bn
£18bn
£16bn
£14bn
£12bn
£10bn
£8bn
£6bn
£4bn
£2bn
£0bn2016 2017 2018 2019 2020 2021 2022 2023 2024 2025 2026 2027 2028 2029 2030
Cum
ulat
ive
Clai
m A
mou
nts
90th/10th percentile80th/20th percentile70th/30th percentile60th/40th percentilemedian
Source: PPF/ The Pensions Regulator
*As projected in the PPF’s internal model. The fan chart depicts the probability that the cumulative deficits of schemes entering the PPF from 31 March 2015 will be within certain boundaries.
Claims on the PPF are the pension deficits that are
brought into the PPF when scheme sponsors suffer
insolvency. The PPF faces a significant tail-risk, i.e. high
impact, low probability claims. The claims
distribution also means that expected (mean)
claims can be some way above the median level.

57t h e p u r p l e b o o k | 2 0 1 5
• The PPF published its Long-Term Funding Strategy in August 2010 and its most recent annual update was in July 2015. The strategy established a long-term funding objective and a framework for monitoring the Fund’s progress towards this target.
• The PPF’s long-term funding objective is to be self-sufficient by 2030. Self-sufficiency means that the PPF is fully-funded with zero exposure to market, inflation and interest-rate risk and with protection against a number of risks beyond the funding horizon: future claims, members living longer than expected, the PPF’s RPI-linked assets not exactly tracking its CPI-linked liabilities and operational risk. Exposure to market, inflation and interest rate risk can be reduced using conventional hedging arrangements and investment in low-risk securities. Analysis of output from the PPF’s internal model described below suggests that a funding reserve equivalent to 10 per cent of PPF liabilities at 2030 would be sufficient to cover unexpected claims, longevity, operational and matching risk, regarding the CPI, (over the lifetime of the Fund) in 9 out of 10 scenarios.
• The PPF has two key measures to monitor progress against its funding objective – the “probability of success” and the “downside risk”. The probability of success measures its chances of being self-sufficient at the funding horizon if it continues on its current course with no change to its investment strategy or to the PPF Levy formula on its course to self-sufficiency. The downside risk is a measure of how poorly funded the PPF might become on its path to self-sufficiency. It is calculated such that in ten per cent of modelled scenarios its deficit reaches at least that level at some point before it reaches its funding horizon.
• To measure these statistics the PPF has developed an internal model that projects the level of PPF assets and liabilities in future years. It generates an extensive range of asset returns, insolvency and longevity scenarios and then projects a range of PPF balance-sheet outcomes. The process of using a large number of modelled scenarios to derive a distribution of outcomes is termed stochastic analysis. It is widely used in the financial services industry and its primary advantage over deterministic or ‘single point forecasts’ is that having a distribution of outcomes allows the PPF to assess not just its best estimate of the future but also the likelihood of specific variations from that outcome.
• As at 31 March 2015, the probability of success was estimated to be 88 per cent, down from 90 per cent at 31 March 2014, while the downside risk was estimated to be £5 billion, up from £4 billion.
• As with any financial model it is important to exercise an appropriate degree of caution when analysing output. To help assess the level of model and parameter risk the PPF carries out multiple runs to test the sensitivity of the output to changes in the key assumptions - see Figure 8.2. The PPF also carries out more fundamental stresses by changing various assumptions all at once.
• The Board of the PPF regularly monitors the probability of success and the downside risk in quarterly updates of the modelling. To do this it has devised a Red-Amber-Green framework where a Green rating indicates that the Board should be comfortable, an Amber rating indicates that it should consider pulling one of its strategic levers and a Red rating indicates that it should almost certainly be planning to pull one of its strategic levers. Though the probability of success has fallen, it has remained in the Green zone throughout the past year. Its strategic levers are adjustments to its investment strategy, levy parameters and, as a last resort, compensation.
8.3 The PPF’s Long-Term Funding Strategy
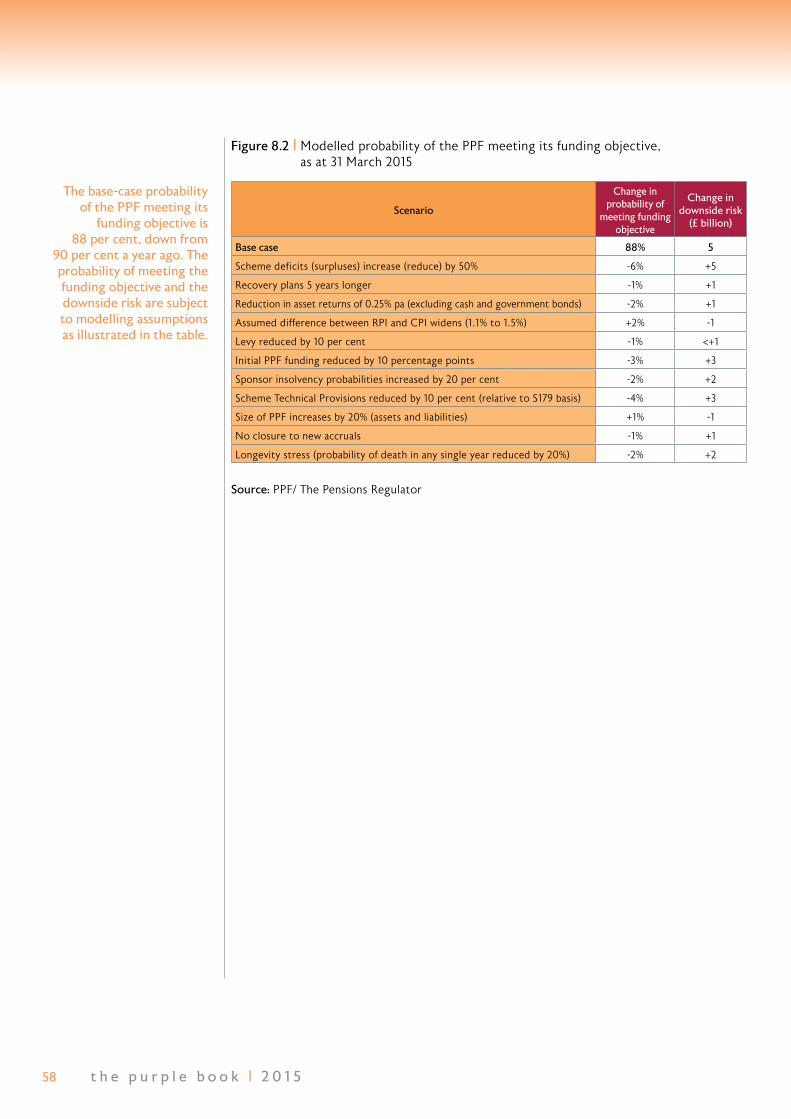
58 t h e p u r p l e b o o k | 2 0 1 5
Figure 8.2 | Modelled probability of the PPF meeting its funding objective, as at 31 March 2015
Source: PPF/ The Pensions Regulator
Scenario
Change in probability of
meeting funding objective
Change in downside risk
(£ billion)
Base case 88% 5
Scheme deficits (surpluses) increase (reduce) by 50% -6% +5
Recovery plans 5 years longer -1% +1
Reduction in asset returns of 0.25% pa (excluding cash and government bonds) -2% +1
Assumed difference between RPI and CPI widens (1.1% to 1.5%) +2% -1
Levy reduced by 10 per cent -1% <+1
Initial PPF funding reduced by 10 percentage points -3% +3
Sponsor insolvency probabilities increased by 20 per cent -2% +2
Scheme Technical Provisions reduced by 10 per cent (relative to S179 basis) -4% +3
Size of PPF increases by 20% (assets and liabilities) +1% -1
No closure to new accruals -1% +1
Longevity stress (probability of death in any single year reduced by 20%) -2% +2
The base-case probability of the PPF meeting its
funding objective is 88 per cent, down from
90 per cent a year ago. The probability of meeting the funding objective and the downside risk are subject to modelling assumptions as illustrated in the table.

59t h e p u r p l e b o o k | 2 0 1 5
9PPF Levy Payments 2014/15Summary • Since 2006/7, the PPF has collected a levy determined mainly by the risk schemes
pose to the PPF. Over this period, it has collected a total of £5.2 billion.
• The dataset used in this chapter is based on 6,020 schemes which, at the time of writing, have contributed a total levy of £579 million for the year 2014/15. This represents 0.06 per cent of the total assets of the schemes12. The total levy is somewhat smaller than the £695 million the PPF expected to collect. This was mainly because the underfunding and insolvency risk turned out to be lower than had been assumed.
• In 2014/15, the number of schemes paying no Risk-Based Levy (RBL) represented 18 per cent of total schemes which is similar to the two preceding years.
• Since 2012/13, schemes that were fully funded, after taking account of their investment risk, pay no RBL. By comparison, in earlier years, schemes had to be significantly over funded to pay no RBL13.
• In 2014/15, 274 schemes had their Risk-Based Levy capped at 0.75 per cent of unstressed liabilities. This is around 5 per cent of the total number of schemes. The liabilities of capped schemes equalled £5 billion or 0.4 per cent of total s179 liabilities.
• The top 100 levy payers accounted for £243 million or 42 per cent of the total levy in 2014/15.
• Manufacturing accounted for 26 per cent of total liabilities in 2014 and pays 37 per cent of total levy in 2014/15 due to it having the largest average insolvency probability of any industry. Finance, Insurance and Real Estate account for 24 per cent of total liabilities and 15 per cent of total levy.
• This chapter uses Dun & Bradstreet failure scores because these were used for measuring insolvency risk in the levy formula for the 2014/15 financial year.
• From the Levy Year 2015/16, Experian provides the PPF with scores as indicators of insolvency risk using the PPF-specific model. This is a statistical model, developed using observed insolvencies amongst employers and guarantors of DB pension schemes.
12 Assets and liabilities in this chapter are on a smoothed, stressed basis www.pensionprotectionfund.org.uk/levy/Pages/1415_Levy_Determination.aspx
13 In 2012/13, changes were made to the way the Pension Protection Levy is calculated. Notable changes included: assets and liabilities being smoothed to reduce data volatility and stressed to account for investment risk; averaging insolvency risk taken over a 12-month period; using more current data and moving from 100 to ten levy bands.
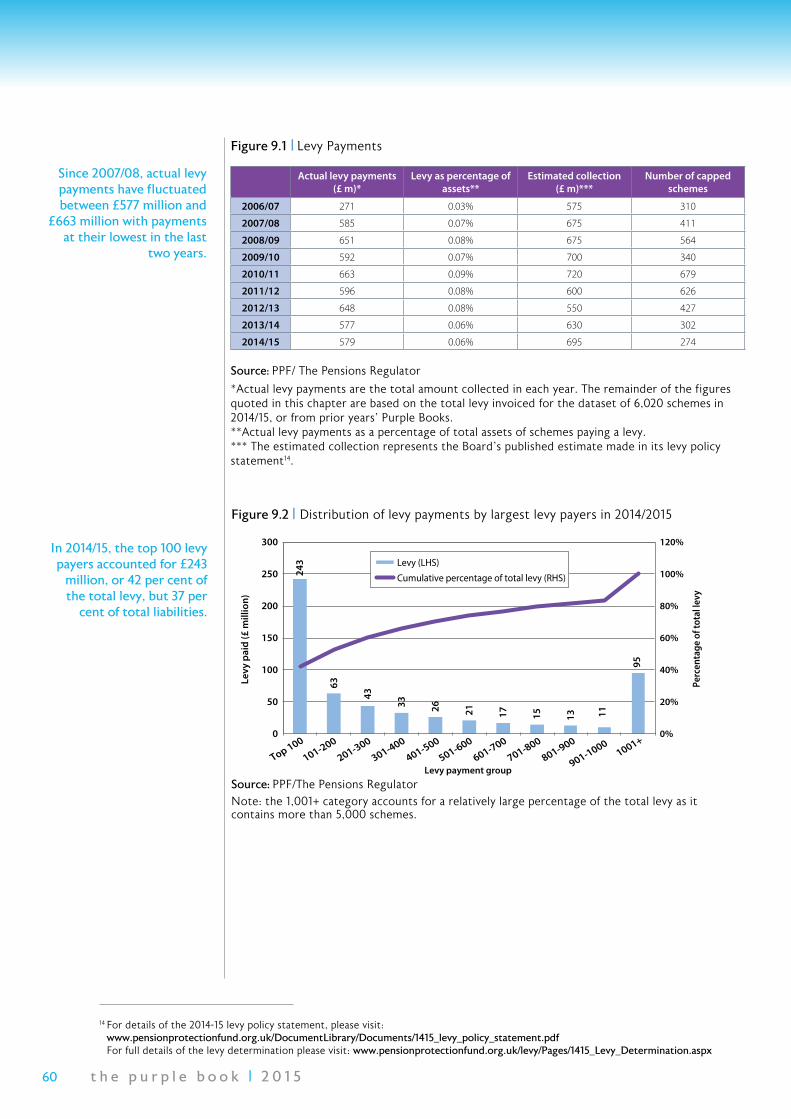
60 t h e p u r p l e b o o k | 2 0 1 5
Since 2007/08, actual levy payments have fluctuated between £577 million and
£663 million with payments at their lowest in the last
two years.
Figure 9.1 | Levy Payments
Source: PPF/ The Pensions Regulator
*Actual levy payments are the total amount collected in each year. The remainder of the figures quoted in this chapter are based on the total levy invoiced for the dataset of 6,020 schemes in 2014/15, or from prior years’ Purple Books. **Actual levy payments as a percentage of total assets of schemes paying a levy. *** The estimated collection represents the Board’s published estimate made in its levy policy statement14.
Actual levy payments (£ m)*
Levy as percentage of assets**
Estimated collection (£ m)***
Number of capped schemes
2006/07 271 0.03% 575 310
2007/08 585 0.07% 675 411
2008/09 651 0.08% 675 564
2009/10 592 0.07% 700 340
2010/11 663 0.09% 720 679
2011/12 596 0.08% 600 626
2012/13 648 0.08% 550 427
2013/14 577 0.06% 630 302
2014/15 579 0.06% 695 274
In 2014/15, the top 100 levy payers accounted for £243
million, or 42 per cent of the total levy, but 37 per
cent of total liabilities.
Figure 9.2 | Distribution of levy payments by largest levy payers in 2014/2015
Source: PPF/The Pensions RegulatorNote: the 1,001+ category accounts for a relatively large percentage of the total levy as it contains more than 5,000 schemes.
243
63
43
33
26
21
17
15
13
11
95
0%
20%
40%
60%
80%
100%
120%
0
50
100
150
200
250
300
Top 100
101-200
201-300
301-400
401-500
501-600
601-700
701-800
801-900
901-1000 1001+
Perc
enta
ge o
f tot
al le
vy
Levy
pai
d (£
mill
ion)
Levy payment group
Levy (LHS)
Cumulative percentage of total levy (RHS)
14 For details of the 2014-15 levy policy statement, please visit: www.pensionprotectionfund.org.uk/DocumentLibrary/Documents/1415_levy_policy_statement.pdf For full details of the levy determination please visit: www.pensionprotectionfund.org.uk/levy/Pages/1415_Levy_Determination.aspx
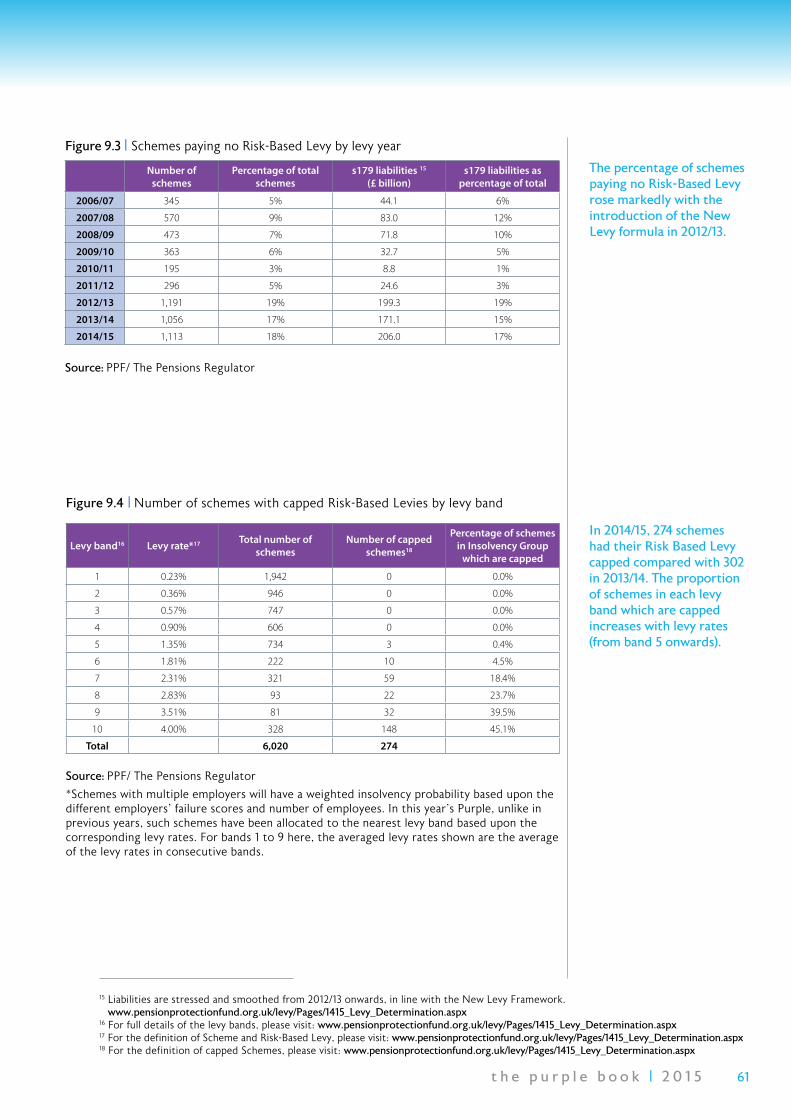
61t h e p u r p l e b o o k | 2 0 1 5
The percentage of schemes paying no Risk-Based Levy rose markedly with the introduction of the New Levy formula in 2012/13.
In 2014/15, 274 schemes had their Risk Based Levy capped compared with 302 in 2013/14. The proportion of schemes in each levy band which are capped increases with levy rates (from band 5 onwards).
Figure 9.3 | Schemes paying no Risk-Based Levy by levy year
Source: PPF/ The Pensions Regulator
Number of schemes
Percentage of total schemes
s179 liabilities 15 (£ billion)
s179 liabilities as percentage of total
2006/07 345 5% 44.1 6%
2007/08 570 9% 83.0 12%
2008/09 473 7% 71.8 10%
2009/10 363 6% 32.7 5%
2010/11 195 3% 8.8 1%
2011/12 296 5% 24.6 3%
2012/13 1,191 19% 199.3 19%
2013/14 1,056 17% 171.1 15%
2014/15 1,113 18% 206.0 17%
Figure 9.4 | Number of schemes with capped Risk-Based Levies by levy band
Source: PPF/ The Pensions Regulator
*Schemes with multiple employers will have a weighted insolvency probability based upon the different employers’ failure scores and number of employees. In this year’s Purple, unlike in previous years, such schemes have been allocated to the nearest levy band based upon the corresponding levy rates. For bands 1 to 9 here, the averaged levy rates shown are the average of the levy rates in consecutive bands.
Levy band16 Levy rate*17 Total number of schemes
Number of capped schemes18
Percentage of schemes in Insolvency Group
which are capped
1 0.23% 1,942 0 0.0%
2 0.36% 946 0 0.0%
3 0.57% 747 0 0.0%
4 0.90% 606 0 0.0%
5 1.35% 734 3 0.4%
6 1.81% 222 10 4.5%
7 2.31% 321 59 18.4%
8 2.83% 93 22 23.7%
9 3.51% 81 32 39.5%
10 4.00% 328 148 45.1%
Total 6,020 274
15 Liabilities are stressed and smoothed from 2012/13 onwards, in line with the New Levy Framework. www.pensionprotectionfund.org.uk/levy/Pages/1415_Levy_Determination.aspx
16 For full details of the levy bands, please visit: www.pensionprotectionfund.org.uk/levy/Pages/1415_Levy_Determination.aspx17 For the definition of Scheme and Risk-Based Levy, please visit: www.pensionprotectionfund.org.uk/levy/Pages/1415_Levy_Determination.aspx 18 For the definition of capped Schemes, please visit: www.pensionprotectionfund.org.uk/levy/Pages/1415_Levy_Determination.aspx
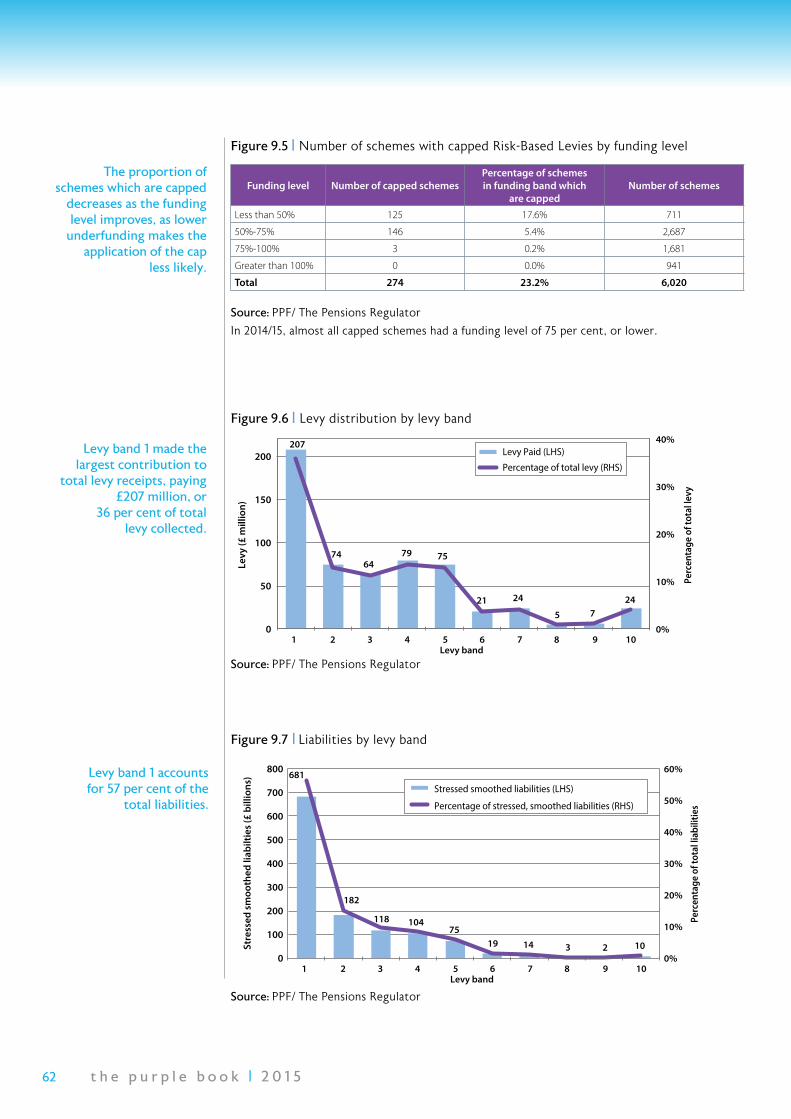
62 t h e p u r p l e b o o k | 2 0 1 5
The proportion of schemes which are capped
decreases as the funding level improves, as lower
underfunding makes the application of the cap
less likely.
Figure 9.5 | Number of schemes with capped Risk-Based Levies by funding level
Figure 9.6 | Levy distribution by levy band
Source: PPF/ The Pensions Regulator
Source: PPF/ The Pensions Regulator
In 2014/15, almost all capped schemes had a funding level of 75 per cent, or lower.
Funding level Number of capped schemesPercentage of schemes in funding band which
are cappedNumber of schemes
Less than 50% 125 17.6% 711
50%-75% 146 5.4% 2,687
75%-100% 3 0.2% 1,681
Greater than 100% 0 0.0% 941
Total 274 23.2% 6,020
207
74 64
79 75
21 24
5 7 24
0%
10%
20%
30%
40%
0
50
100
150
200
1 2 3 4 5 6 7 8 9 10
Perc
enta
ge o
f tot
al le
vy
Levy
(£ m
illio
n)
Levy band
Levy Paid (LHS)
Percentage of total levy (RHS)
Levy band 1 made the largest contribution to
total levy receipts, paying £207 million, or
36 per cent of total levy collected.
Levy band 1 accounts for 57 per cent of the
total liabilities.
Figure 9.7 | Liabilities by levy band
Source: PPF/ The Pensions Regulator
1 2 3 4 5 6 7 8 9 10 Levy band
681
118 104 75
19 14 3 2 10 0%
10%
20%
30%
40%
50%
60%
0
100
200
300
400
500
600
700
800
Perc
enta
ge o
f tot
al li
abili
ties
Stre
ssed
sm
ooth
ed li
abilt
ies
(£ b
illio
ns)
Stressed smoothed liabilities (LHS)
Percentage of stressed, smoothed liabilities (RHS)
182

63t h e p u r p l e b o o k | 2 0 1 5
The average levy per member was £52 in 2014/15. Levy per member is the highest in band 9. The decrease in levy band 10 reflects the RBL cap on schemes.
The PPF levy is very small compared with the value of total assets. The average (total levy divided by total assets) was 0.06 per cent in 2014/15, the same as in 2013/14. The low overall average of 0.06 per cent reflects the large number of schemes in the lower levy bands.
Figure 9.8 | Levy per member by levy band
Figure 9.9 | Levy payments as a proportion of assets by levy band
Source: PPF/ The Pensions Regulator
Source: PPF/ The Pensions Regulator
1 2 3 4 5 6 7 8 9 10 Levy band
0.04% 0.05% 0.07% 0.10%
0.12% 0.13%
0.21% 0.21%
0.48%
0.32%
0
500
1000
1500
2000
2500
0.0%
0.1%
0.2%
0.3%
0.4%
0.5%
0.6%
Num
ber o
f sch
emes
Levy
pay
men
ts a
s a p
erce
ntag
e of
tota
l ass
ets
Levy as % of assets Number of schemes (RHS)
1 2 3 4 5 6 7 8 9 10 Levy band
33 4361
85110 106
175
226
306
240
0
50
100
150
200
250
300
350
Levy
per
mem
ber (
£)

64 t h e p u r p l e b o o k | 2 0 1 5
Figure 9.11 | Percentage of total levy that is Scheme- and Risk-based by funding level
Source: PPF/ The Pensions Regulator
0%
20%
40%
60%
80%
100%
Less than 50% 50%-75% 75%-100% Over 100%
Perc
enta
ge o
f lev
y
Funding level
Percentage of levy that is Risk-based Percentage of levy that is Scheme-based
The proportion of Risk-Based Levy declines as
scheme funding improves. The levy paid by schemes
which are over 100 per cent funded consists of 100 per cent Scheme-Based Levy.
Figure 9.10 | Percentage of total levy that is Scheme- and Risk-based19 by levy band
Source: PPF/ The Pensions RegulatorLevy band
0%
10%
20%
30%
40%
50%
60%
70%
80%
90%
100%
1 2 3 4 5 6 7 8 9 10
Perc
enta
ge o
f lev
y
Percentage of levy that is Risk-based Percentage of levy that is Scheme-based
The share of Risk-Based Levy tends to rise and the share of Scheme-
Based Levy to fall as the levy band increases.
19 For the definition of scheme and risk based levy, please visit: www.pensionprotectionfund.org.uk/levy/Pages/1415_Levy_Determination.aspx

65t h e p u r p l e b o o k | 2 0 1 5
Figure 9.12 | Levy per £ of liabilities by levy and funding bands
Source: PPF/ The Pensions Regulator
*The circles represent the total levy divided by the stressed smoothed liabilities for schemes in a particular levy band with a certain funding level. For example, 0.77 per cent represents the proportion of total levy with respect to the smoothed stressed liabilities for the schemes in levy band 9 with a funding ratio lower than 50 per cent.
Fund
ing
Leve
l Ban
d
0 1 2 3 4 5 6 7 8 9 10
Levy Band
>100%
75-100%
50-75%
<50% 0.77%*
0.64%*0.64%*
Figure 9.13 | Total levy by industry20
Source: PPF/ The Pensions Regulator
20 These figures are based on a sample of 5,100 schemes across all years. Industry data is based on the 1972 US Standard Industrial Classification.
Levy
(£ m
illio
ns)
0
50
100
150
200
250
Agricultu
ral
Productio
n
Communications
Constructio
n
Finance, Insu
rance
and Real Esta
te
Manufacturin
g
Mining
Public Administ
ration
Retail Trade
Services
Transporta
tion
Utilitie
s
Wholesale Trade
Nonclassifiable
Establis
hments
2007/08 2008/09 2009/10 2010/11 2011/12 2012/13 2013/14 2014/15
Manufacturing, Finance, Insurance and Real Estate, and Services are the highest levy paying industries.
Those schemes which are below 75 per cent funded pay more levy per £ of liabilities compared with other schemes grouped in the same levy band.

66 t h e p u r p l e b o o k | 2 0 1 5
10 Schemes in Assessment10.1 Summary • Before transferring into the PPF, all schemes go through an assessment period
to determine their ability to pay PPF levels of compensation21. The PPF aims to complete the assessment period for most schemes within two years.
• The PPF’s Annual Report and Accounts 2014/15 show that there were 133 schemes in assessment as at 31 March 2015 compared with 182 as at 31 March 2014. Of the 133 figure, 111 were recognised in provisions on the PPF balance sheet, down from 158 at 31 March 2014. In these figures, all segregated parts of schemes have been counted as separate schemes.
• In this chapter, for analytical purposes, scheme sections and segregated parts are amalgamated at scheme level. As a result, the number of schemes in assessment in this chapter is less than reported in the 2014/15 Annual Report and Accounts. After this amalgamation there were 112 schemes (with 80,500 members) in a PPF assessment period as at 31 March 2015, compared with 148 schemes (with 95,000 members) a year earlier.
• The fall over the year reflects 46 new schemes entering and remaining in assessment, 64 schemes transferring into the PPF and 18 being rescued, rejected or withdrawn.
• As at 31 March 2015, the aggregate assets of schemes in assessment totalled £5.3 billion and their liabilities £7.5 billion (equivalent to 0.5 per cent of universe liabilities) on a s179 basis. Liabilities averaged £67.4 million per scheme and assets averaged £47.0 million.
• Schemes with liabilities below £5 million account for 32.1 per cent of schemes in assessment but only 0.8 per cent of the liabilities in assessment, while schemes with liabilities of over £100 million account for 11.6 per cent of schemes in assessment but 76.3 per cent of liabilities in assessment.
• The aggregate funding level (total assets divided by total liabilities) of the schemes in assessment as at 31 March 2015 was 70 per cent, considerably below the aggregate funding levels of the schemes in the Purple 2015 dataset (84 per cent).
• Compared to schemes in the 2015 Purple dataset, schemes in assessment had a greater allocation to insurance policies and a lower allocation to gilts and fixed interest.
• The Manufacturing sector accounted for 39 per cent of schemes in assessment while the Services sector accounts for 16 per cent and the Finance, Insurance and Real Estate sector for 15 per cent.
21 See Chapter 2, The Data, for a description of the eligibility test.

67t h e p u r p l e b o o k | 2 0 1 5
• The representation of Manufacturing in schemes in assessment is much greater than the sector’s share of scheme sponsors in the PPF universe (29 per cent), which in turn is greater than the share of Manufacturing in the UK economy (10 per cent).
• Since 2005, there have been around 1,100 claims on the PPF with a total deficit value of £6.7 billion on a s179 basis (excluding recoveries). During the same period, total levy and recoveries were £5.2 billion and £1.9 billion respectively. Schemes with under 100 members accounted for 48 per cent of the claims since 2005.
• The Manufacturing sector makes up 44 per cent of the total claims, higher than its average share of scheme sponsors (31 per cent). The Services sector makes up 15 per cent of total claims, much lower than its average share over the 10 years (28 per cent).
10.2 Schemes entering assessment
The number of schemes in assessment has been declining since 2011.
At 31 March 2015, the scheme funding ratio for schemes in assessment was 70 per cent compared with 77 per cent the year before. It has been below the universe funding ratio every year.
Figure 10.2 | Funding statistics for schemes in assessment each year, as at 31 March
Figure 10.1 | Number of schemes in assessment each year, as at 31 March
Source: PPF/ The Pensions Regulator
Source: PPF/ The Pensions Regulator
0
50
100
150
200
250
300
Number of schemes in assessment
Entered anassessment period
Transferredto PPF
Rescued, rejectedor withdrawn
Num
ber o
f sch
emes
2008 2009 2010 2011
2012 2013 2014 2015
Year Assets (£billion)
Liabilities (£billion)
Surplus(£billion) Funding ratio Universe
funding ratio
2007 4.0 4.7 -0.7 85% 109%2008 4.2 5.4 -1.2 78% 99%2009 6.7 9.4 -2.8 71% 80%2010 8.9 10.0 -1.1 89% 104%2011 9.5 10.9 -1.4 87% 100%2012 6.2 8.4 -2.2 74% 83%2013 5.8 7.6 -1.8 77% 84%2014 5.8 7.6 -1.7 77% 97%2015 5.3 7.5 -2.3 70% 84%

68 t h e p u r p l e b o o k | 2 0 1 5
The total deficit of schemes entering
assessment in the year to Q2 2015 was £707 million, down from £725 million in
the year to Q2 2014.
Figure 10.4 | Total s179 deficits for schemes entering an assessment period
Source: PPF/ The Pensions Regulator
0
100
200
300
400
500
600
700
800
900
1000
Q2 2005
Q4 2005
Q2 2006
Q4 2006
Q2 2007
Q4 2007
Q2 2008
Q4 2008
Q2 2009
Q4 2009
Q2 2010
Q4 2010
Q2 2011
Q4 2011
Q2 2012
Q4 2012
Q2 2013
Q4 2013
Q2 2014
Q4 2014
Q2 2015
Tota
l defi
cit (
£ m
illio
n)
Financial Quarter
Total deficit (millions) Quarterly moving average
Figure 10.3 | Number of qualifying insolvency events by date of insolvency*
Source: PPF/ The Pensions Regulator
*Sections and segregated schemes not amalgamated.
0
10
20
30
40
50
60
Q2 2005
Q2 2006
Q2 2007
Q2 2008
Q2 2009
Q2 2010
Q2 2011
Q2 2012
Q2 2013
Q2 2014
Q2 2015
Financial quarter
Coun
t of i
nsol
venc
y ev
ents
ove
r qua
rter
Insolvency events in surplus at assessment date Insolvency events in deficit at assessment date Four-quarter moving average of total insolvency events
The number of insolvency events has been trending
down over the past three years.

69t h e p u r p l e b o o k | 2 0 1 5
Schemes with liabilities of more than £100 million represent 11.6 per cent of schemes in assessment but 76.3 per cent of liabilities.
In 2015, 41 per cent of the schemes in assessment had fewer than 100 members. 49 per cent were in the 100-999 membership range.
10.3 Scheme Demographics
Figure 10.5 | Percentage of schemes and percentage of s179 liabilities grouped by size of liabilities for schemes in assessment, as at 31 March 2015
Figure 10.6 | Proportion of schemes in assessment by number of members
Source: PPF/ The Pensions Regulator
Source: PPF/ The Pensions Regulator
0%
10%
20%
30%
40%
50%
60%
Less than 100 100 to 999 1,000 to 4,999 5,000 to 9,999 10,000 and over
Perc
enta
ge
Number of members
2014 2015
0%
10%
20%
30%
40%
50%
60%
70%
80%
Less than £5m
£5m to £10m
£10m to £20m
£20m to £50m
£50m to £100m
Over £100m
Perc
enta
ge
Liability group
Percentage of schemes in assessment Percentage of s179 liabilities in assessment

70 t h e p u r p l e b o o k | 2 0 1 5
Schemes in assessment in the 10,000 and over
membership range are the most mature schemes.
2015 saw an increase in the deficit of the schemes
in the over £100 million liability group.
10.4 Funding level
Figure 10.8 | Total s179 deficit of schemes in assessment by liability size
Figure 10.7 | Maturity of schemes in assessment by membership size
Source: PPF/ The Pensions Regulator
Source: PPF/ The Pensions Regulator
0
200
400
600
800
1,000
1,200
1,400
1,600
1,800
Less than £5m
£5m to £10m
£10m to £20m
£20m to £50m
£50m to £100m
Over £100m
Tota
l defi
cit (
£ m
illio
n)
Liability group
2014 2015
0%
20%
40%
60%
80%
100%
Less than 100 100 to 999 1,000 to 4,999 5,000 to 9,999 10,000 and over
Perc
enta
ge o
f tot
al m
embe
rs
in m
embe
rshi
p gr
oup
Total members in scheme
Deferred members Pensioners

71t h e p u r p l e b o o k | 2 0 1 5
Compared to schemes in the 2015 universe, schemes in assessment had a greater allocation to insurance policies and a lower allocation to gilts and fixed interest.
Manufacturing made up 44 of the 112 schemes in assessment (39 per cent).
10.6 Industry Classification
10.5 Asset Allocation
Figure 10.9 | Simple-average asset allocations prior to assessment for schemes in assessment and the Purple 2015 dataset as at 31 March 2015
Source: PPF/ The Pensions Regulator
0%
5%
10%
15%
20%
25%
30%
35%
40%
45%
Equities Gilts and fixed interest
Insurance policies
Cash and deposits
Property Other investments
Perc
enta
ge o
f ass
ets
Asset allocation for schemes in assessment Asset allocation for schemes in Purple 2015
Figure 10.10 | Distribution of schemes in assessment by industry classification*
Source: PPF/ The Pensions Regulator
*Based on a US 1972 Standard Industrial Classification
0% 0% 3.7%
14.9%
38.8%
0.7% 0%
7.5%
16.4%
4.5% 1.5%
10.4%
1.5% 0
20
40
60
Num
ber o
f sch
emes
Agricultu
ral Pro
duction
Communications
Constructio
n
Finance, Insu
rance and Real Esta
te
Manufacturin
g
Mining
Public Administ
ration
Retail Trade
Services
Transporta
tion
Utilitie
s
Wholesa
le Trade
Nonclassifiable Esta
blishments
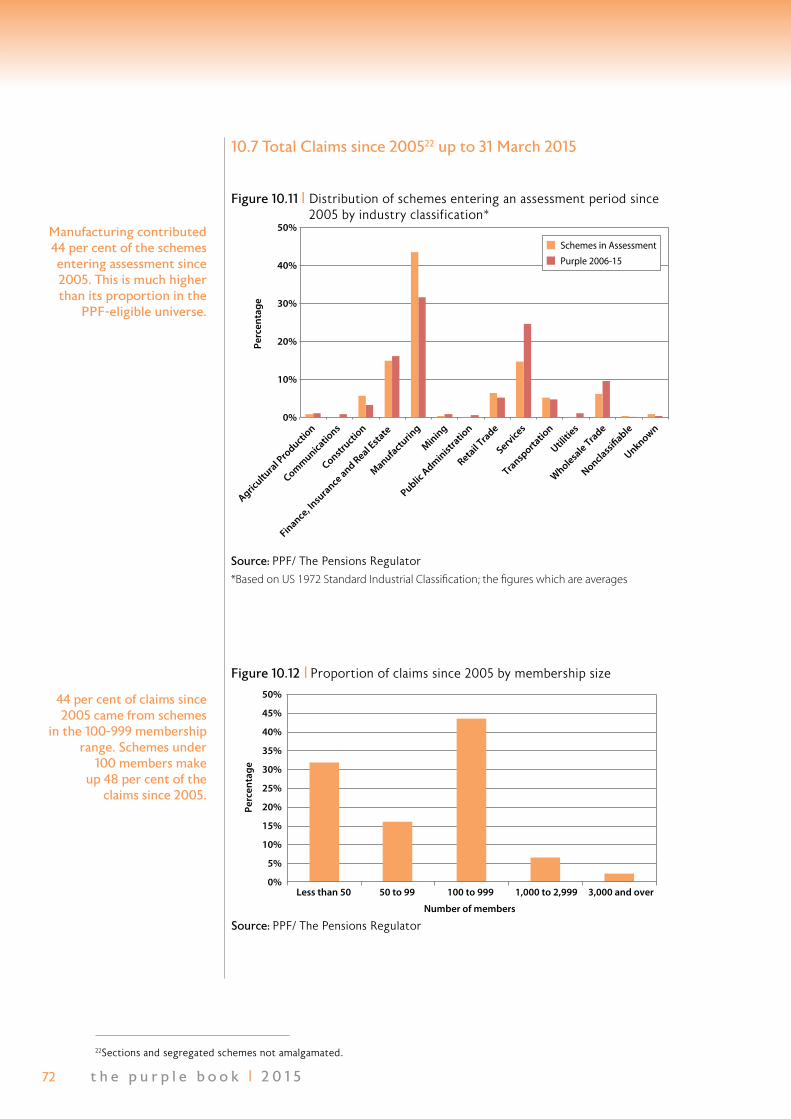
72 t h e p u r p l e b o o k | 2 0 1 5
Manufacturing contributed 44 per cent of the schemes entering assessment since 2005. This is much higher than its proportion in the
PPF-eligible universe.
44 per cent of claims since 2005 came from schemes
in the 100-999 membership range. Schemes under
100 members make up 48 per cent of the
claims since 2005.
10.7 Total Claims since 200522 up to 31 March 2015
Figure 10.11 | Distribution of schemes entering an assessment period since 2005 by industry classification*
Source: PPF/ The Pensions Regulator
*Based on US 1972 Standard Industrial Classification; the figures which are averages
0%
10%
20%
30%
40%
50%
Agricultu
ral Pro
duction
Communications
Constructio
n
Finance, Insu
rance and Real Esta
te
Manufacturin
g
Mining
Public Administ
ration
Retail Trade
Services
Transporta
tion
Utilitie
s
Wholesa
le Trade
Nonclassifiable
Unknown
Perc
enta
ge
Schemes in Assessment
Purple 2006-15
Figure 10.12 | Proportion of claims since 2005 by membership size
Source: PPF/ The Pensions Regulator
Perc
enta
ge
0%
5%
10%
15%
20%
25%
30%
35%
40%
45%
50%
Less than 50 50 to 99 100 to 999 1,000 to 2,999 3,000 and over
Number of members
22Sections and segregated schemes not amalgamated.

73t h e p u r p l e b o o k | 2 0 1 5
11PPF Compensation 2014/1511.1 Summary • When an eligible Defined Benefit (DB) scheme transfers into the PPF, the PPF
generally pays compensation of 90 per cent of scheme pension (subject to a compensation cap) to members who were yet to reach their Normal Pension Age (NPA) at the date the scheme entered assessment. The PPF will generally pay a starting level of compensation equivalent to 100 per cent of scheme pension to those who were already over their NPA at the start of the assessment period23.
• In 2014/15, the PPF made compensation payments of £564 million compared with £445 million in 2013/14.
• As at 31 March 2015, 114,028 members were in receipt of PPF compensation, up from 95,599 as at 31 March 2014. Average compensation in payment stood at £4,128 a year (unless otherwise stated, totals and averages relating to pensioners include dependants). The number of members with compensation not yet in payment (deferred members) as at 31 March 2015 totalled 110,681. For these members, the average accrued periodic compensation (before any prospective application of the compensation cap at NPA) was £3,396 a year.
• As at 31 March 2015, males constituted 63 per cent of pensioner and 68 per cent of deferred members.
• Spouses and other dependants account for 15 per cent of those currently in receipt of compensation. They receive 10 per cent of the total compensation in payment.
• Around 41 per cent of pensioner compensation is attributable to former employees of the Manufacturing sector down from 49 per cent the previous year.
• The North East region has the largest receipt of compensation, currently at 15 per cent of total pensioner compensation.
• 90 per cent of members are in receipt of (or have accrued) compensation of less than 25 per cent of the compensation cap at age 65 (i.e. £9,100 a year).
• The majority of compensation (and liabilities) was accrued in relation to service before 6 April 1997 and is, therefore, not subject to indexation. Compensation accrued on or after 6 April 1997 is increased each year in line with Consumer Price Inflation (CPI) capped at 2.5 per cent with a floor of zero per cent.
• Deferred compensation is re-valued over the period to NPA in line with CPI capped at 5 per cent per annum (for compensation accrued before 6 April 2009) and CPI capped at 2.5 per cent per annum (for compensation accrued on or after 6 April 2009), subject to a floor of zero per cent in both cases.
23 The annualised average rate of compensation is calculated by scaling up compensation over one month to reflect one year. This measure, which excludes lump sum payments, is used in order to accurately represent periodic compensation in payment at 31 March 2015.

74 t h e p u r p l e b o o k | 2 0 1 5
11.2 Total compensation and number of members
Total compensation paid has increased over the year from £445 million
to £564 million.
11.3 Distribution of compensation
80 per cent of pensioner members are in receipt of annualised compensation
of less than £6,000.
Figure 11.2 | Distribution of pensioners by annualised compensation levels
Figure 11.1 | Total compensation and number of members
Source: PPF/ The Pensions Regulator
Source: PPF/ The Pensions Regulator
0%
10%
20%
30%
40%
50%
60%
70%
80%
90%
100%
0%
10%
20%
30%
40%
50%
60%
Cum
ulat
ive
perc
enta
ge o
f Pen
sion
ers/
Pens
ions
Perc
enta
ge o
f Pen
sion
ers
Less th
an £2,000
£2,000 to £3,999
£4,000 to £5,999
£6,000 to £7,999
£8,000 to £9,999
£10,000 to £11,999
£12,000 to £13,999
£14,000 to £15,999
£16,000 to £17,999
£18,000 to £19,999
More th
an £20,000
Annualised Compensation
Cumulative percentage of pensioners (RHS)
Percentage of pensions (RHS)
Percentage of pensioners (LHS)
Year2007 2008 2009 2010 2011
Total compensation (£ million, year to 31 March) 1.4 17.3 37.6 81.6 119.5
Total pensioner members (31 March) 1,457 3,596 12,723 20,775 33,069
Total deferred members (31 March) 5,621 8,577 18,009 26,058 42,063
Year2012 2013 2014 2015
Total compensation (£ million, year to 31 March) 203.3 331.8 445.1 564.0
Total pensioner members (31 March) 57,506 80,665 95,599 114,028
Total deferred members (31 March) 70,608 91,353 100,070 110,681

75t h e p u r p l e b o o k | 2 0 1 5
84 per cent of deferred members have accrued annualised compensation of less than £6,000.
Figure 11.4 | Gender composition of pensioners and deferred members
Figure 11.3 | Distribution of deferred members by annualised compensation levels
Source: PPF/ The Pensions Regulator
Source: PPF/ The Pensions Regulator
0%
10%
20%
30%
40%
50%
60%
70%
80%
90%
100%
0%
10%
20%
30%
40%
50%
60%
Cum
ulat
ive
perc
enta
ge o
f de
ferr
ed m
embe
rs/P
ensi
ons
Perc
enta
ge o
f def
erre
d
Less th
an £2,000
£2,000 to £3,999
£4,000 to £5,999
£6,000 to £7,999
£8,000 to £9,999
£10,000 to £11,999
£12,000 to £13,999
£14,000 to £15,999
£16,000 to £17,999
£18,000 to £19,999
More th
an £20,000
Annualised Compensation
Cumulative percentage of deferred (RHS)
Percentage of pensions (RHS)
Percentage of deferred (LHS)
MaleFemale
Pensioners
63%
37% 32%
68%
Deferred members
35%
65%
Overall
11.4 Gender
Overall, males make up 65 per cent of members of transferred schemes.
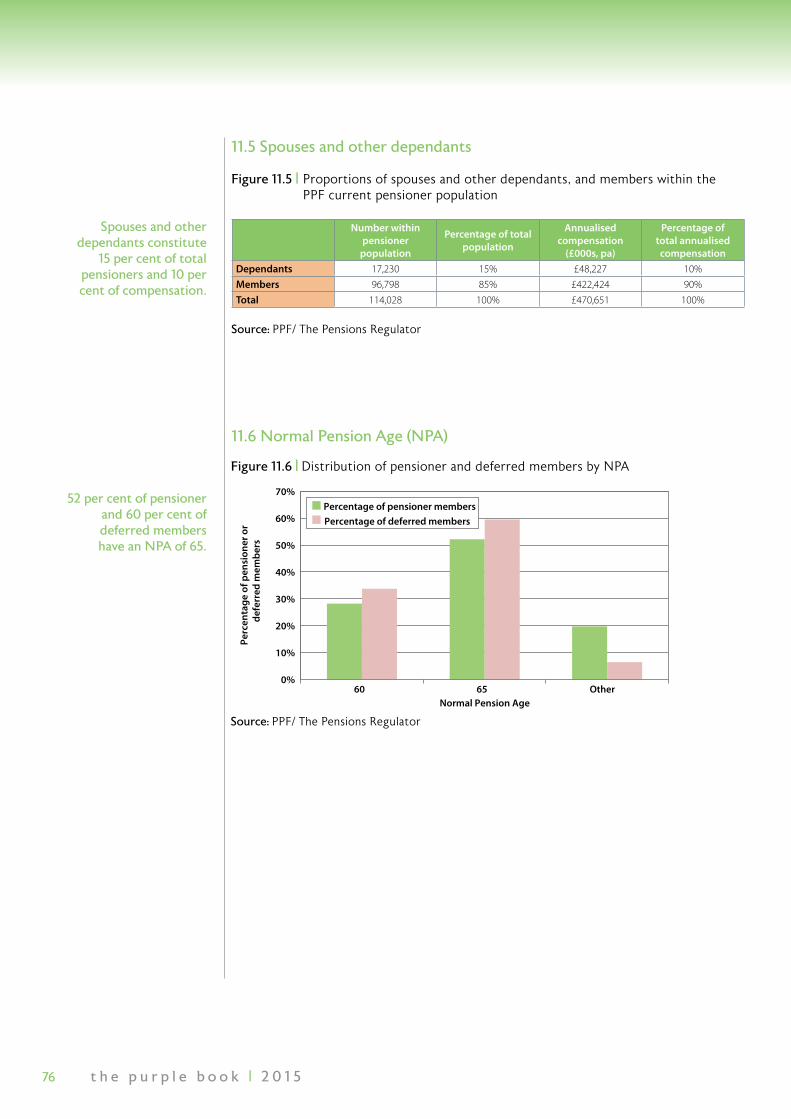
76 t h e p u r p l e b o o k | 2 0 1 5
11.6 Normal Pension Age (NPA)
52 per cent of pensioner and 60 per cent of deferred members have an NPA of 65.
Figure 11.5 | Proportions of spouses and other dependants, and members within the PPF current pensioner population
Source: PPF/ The Pensions Regulator
Number within pensioner
population
Percentage of total population
Annualised compensation
(£000s, pa)
Percentage of total annualised compensation
Dependants 17,230 15% £48,227 10%Members 96,798 85% £422,424 90%Total 114,028 100% £470,651 100%
11.5 Spouses and other dependants
Spouses and other dependants constitute
15 per cent of total pensioners and 10 per cent of compensation.
Figure 11.6 | Distribution of pensioner and deferred members by NPA
Source: PPF/ The Pensions Regulator
0%
10%
20%
30%
40%
50%
60%
70%
60 65 Other
Perc
enta
ge o
f pen
sion
er o
r de
ferr
ed m
embe
rs
Normal Pension Age
Percentage of pensioner members Percentage of deferred members

77t h e p u r p l e b o o k | 2 0 1 5
11.7 Industry
11.8 Geography
The proportion of pensioner compensation paid to former employees of the Manufacturing industry has fallen to 41 per cent from 49 per cent the previous year.
The largest share of compensation goes to the North East, due to the high number of sponsor insolvencies in the region. In Purple 2014 the largest share of compensation was in the North West.
Figure 11.7 | Pensioner and deferred member annualised compensation by individual sector*
Figure 11.8 | Pensioner and deferred member annualised compensation by UK region
Source: PPF/ The Pensions Regulator
*Based on US 1972 Standard Industrial Classification
Source: PPF/ The Pensions Regulator
0%
5%
10%
15%
20%
25%
30%
35%
40%
45%
50%
Manufacturin
g
Finance, Insu
rance
and Real Esta
te
Services
Retail Trade
Transporta
tion
Agricultu
ral Pro
duction
Wholesa
le Trade
Constructio
n
Communications
Mining
Utilitie
s
Perc
enta
ge o
f pen
sion
er o
r def
erre
d
annu
alis
ed c
ompe
nsat
ion
Industrial sector
Percentage of pensioner compensation
Percentage of deferred compensation
0%
4%
8%
12%
16%
20%
Perc
enta
ge o
f pen
sion
er o
r de
ferr
ed c
ompe
nsat
ion
Percentage of pensioner compensationPercentage of deferred compensation
South W
est
South East
Wales
West
Midlands
East Midlands
East Anglia
North W
est
North East
Scotland
London
Northern
Ireland
Unknown / Overse
as
Region

78 t h e p u r p l e b o o k | 2 0 1 5
11.9 Period of service
The majority of compensation for
pensioners was accrued in relation to service before 5 April 1997.
Figure 11.10 | Value of non-AVC liabilities24 attributable to Pre-6 and Post-5 April 1997 compensation for pensioners and deferred members sector
Figure 11.9 | Pre-6 and Post-5 April 1997 annualised compensation for pensioners and deferred members
Source: PPF/ The Pensions Regulator
Source: PPF/ The Pensions Regulator
Pensioners DeferredCompensation
(£000s, pa) Percentage of total Compensation (£000s, pa) Percentage of total
Pre-April 1997 346,805 74% 180,842 48%Post-April 1997 123,846 26% 195,076 52%Total 470,651 100% 375,918 100%
Pensioners DeferredLiabilities (£000s) % Liabilities (£000s) %
Pre-April 1997 5,409,755 63% 3,652,494 39%Post-April 1997 3,126,816 37% 5,621,249 61%Total 8,536,571 100% 9,273,744 100%
24 On the basis used for the PPF’s Annual Report and Accounts 2014/15. AVC are additional voluntary contributions.
79t h e p u r p l e b o o k | 2 0 1 5
12Risk Reduction12.1 Summary • The total number of Contingent Assets (CAs) recognised by the PPF for the 2015/16
levy year was 632, almost 20 per cent lower than in 2014/15. This mainly reflected a further fall in the number of Type A CAs (company guarantees). The number of Type A CAs in 2015/16 is 35 per cent below the level in 2011/12. The fall in the number of Type A CAs reflects two main factors; PPF tightening rules and checking certificates and, in 2015/16, reduced benefit from CAs due to the move to Experian for measuring insolvency risk (group strength is now included as a factor in assigning company scores, which will narrow differences in scores across a group).
• The number of Type B CAs (security over holdings of cash, real estate and or securities) fell slightly.
• Data from the Office for National Statistics (ONS) covering 350 large pension schemes (including 100 local authorities and some DC schemes) show that in 2014 employers made £12.6 billion in special contributions (i.e. those in excess of regular annual contributions), lower than £16.7 billion in 2013.
• Analysis of the Pension Regulator’s latest technical provisions and recovery plan data show that in Tranche 825, the average recovery plan length was 8.5 years, the same as in Tranche 5 (comparable given the three year valuation cycle).
• The average funding ratio as measured by assets divided by technical provisions was 82.5 per cent in Tranche 8, also the same as in Tranche 5.
• Technical provisions as a percentage of s179 liabilities dropped to 98.5 per from 111.6 per cent in Tranche 5, and was at its lowest level since the start of the scheme funding regime. The fall in technical provisions as a percentage of buy-out liabilities was smaller, from 73.8 per cent to 71.2 per cent.
• Total risk transfer business covering buy-outs, buy-ins and longevity hedges amounted to £105.4 billion between the end of 2007 and the second quarter of 2015. Just under half of these deals were longevity hedges.
25 Tranche 8 covers schemes with valuation dates between 22 September 2012 and 21 September 2013. www.thepensionsregulator.gov.uk/docs/scheme-funding-appendix-2015.pdf

80 t h e p u r p l e b o o k | 2 0 1 5
Figure 12.2 | Special contributions
Figure 12.1 | Contingent assets by type*
Source: PPF/ The Pensions Regulator
*The numbers of recognised contingent assets for each year presented in Figure 12.1 may change as a result of, for example, successful appeals.
Source: MQ5, ‘Investment by Insurance Companies. Pension Funds and Trusts’, ONS
13 34 62 81 100 114 126 141 133 124107211
362
514628
764 716 666 624496
0
100
200
300
400
500
600
700
800
900
1000
2006/2007
2007/2008
2008/2009
2009/2010
2010/2011
2011/2012
2012/2013
2013/2014
2014/2015
2015/2016
Num
ber o
f con
tinge
nt a
sset
s in
pla
ce
Levy year
Type AType BType C
0
5
10
15
20
25
0
1.0
2.0
3.0
4.0
5.0
6.0
7.0
8.0
9.0
£ Bi
llion
£ Bi
llion
1993 1995
1997 1999
2001 2003
2005 2007
2009 2011
2013 2015
Special Contributions Four - Quarter Total (RHS)
The total number of contingent assets (CAs) recognised by the PPF
fell to 632 for the 2015/16 levy year. This mainly
reflected a further fall in the number of Type A CAs. The number of recognised
Type A CAs has fallen markedly since 2011/12.
ONS data covering 350 large pension schemes
(including 100 local authorities and some
DC schemes), show that employers made £12.6 billion in special contributions in 2014,
lower than £16.7 billion in 2013. Special contributions have been on a downward
trend since 2012.
12.2 Contingent assets
12.3 Special contributions
Type A contingent assets are guarantees provided by the parent/group companies to fund the scheme, most commonly, to a pre-arranged percentage of liabilities. Type B contingent assets comprise security over holdings of cash, real estate and/or securities. Type C26 contingent assets consist of letters of credit and bank guarantees.
26 The values for type C are 15 in 2006/2007, 19 in 2007/2008, 29 in 2008/2009, 20 in 2009/2010, 19 in 2010/2011, 17 in 2011/2012, 8 in 2012/2013, 10 in 2013/2014, 13 in 2014/2015, and 12 in 2015/2016
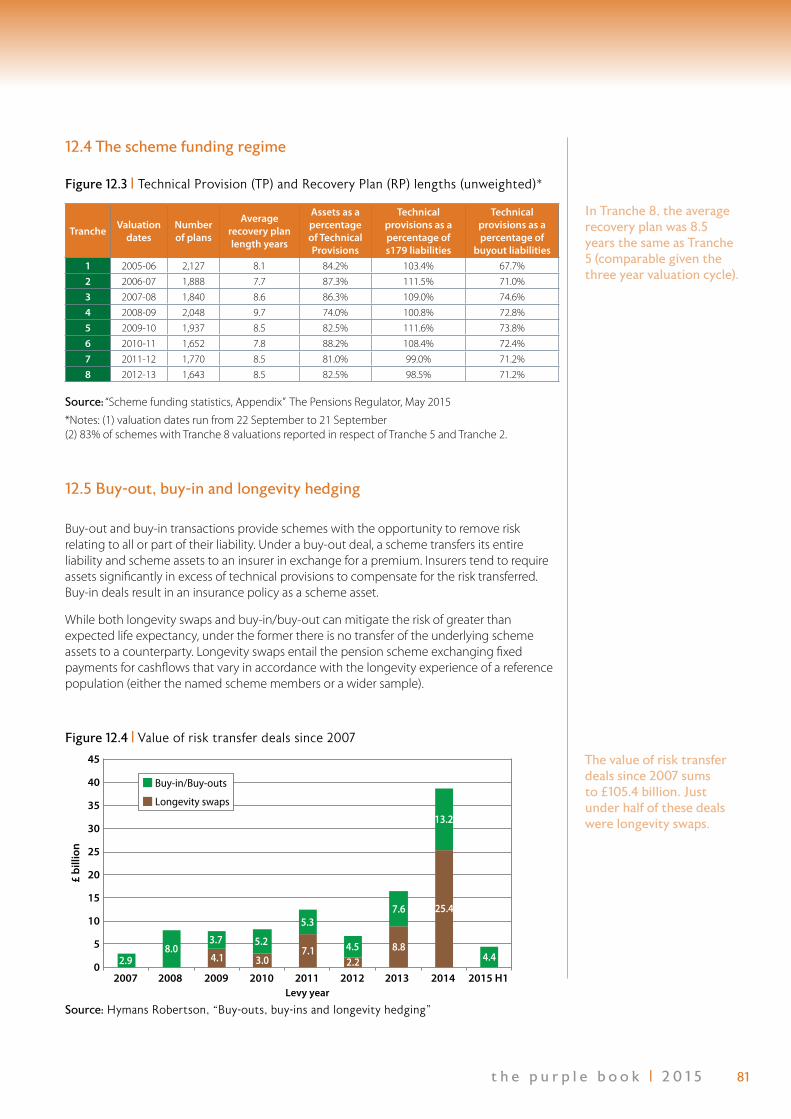
81t h e p u r p l e b o o k | 2 0 1 5
Figure 12.3 | Technical Provision (TP) and Recovery Plan (RP) lengths (unweighted)*
Source: “Scheme funding statistics, Appendix” The Pensions Regulator, May 2015
*Notes: (1) valuation dates run from 22 September to 21 September (2) 83% of schemes with Tranche 8 valuations reported in respect of Tranche 5 and Tranche 2.
Tranche Valuation dates
Number of plans
Average recovery plan length years
Assets as a percentage of Technical Provisions
Technical provisions as a percentage of s179 liabilities
Technical provisions as a percentage of
buyout liabilities1 2005-06 2,127 8.1 84.2% 103.4% 67.7%2 2006-07 1,888 7.7 87.3% 111.5% 71.0%3 2007-08 1,840 8.6 86.3% 109.0% 74.6%4 2008-09 2,048 9.7 74.0% 100.8% 72.8%5 2009-10 1,937 8.5 82.5% 111.6% 73.8%6 2010-11 1,652 7.8 88.2% 108.4% 72.4%7 2011-12 1,770 8.5 81.0% 99.0% 71.2%8 2012-13 1,643 8.5 82.5% 98.5% 71.2%
Figure 12.4 | Value of risk transfer deals since 2007
Source: Hymans Robertson, “Buy-outs, buy-ins and longevity hedging”
4.1 3.07.1
2.28.8
25.4
2.98.0
3.7 5.2
5.3
4.5
7.6
13.2
4.40
5
10
15
20
25
30
35
40
45
2007 2008 2009 2010 2011 2012 2013 2014 2015 H1
£ bi
llion
Buy-in/Buy-outs
Longevity swaps
Levy year
In Tranche 8, the average recovery plan was 8.5 years the same as Tranche 5 (comparable given the three year valuation cycle).
The value of risk transfer deals since 2007 sums to £105.4 billion. Just under half of these deals were longevity swaps.
12.4 The scheme funding regime
12.5 Buy-out, buy-in and longevity hedging
Buy-out and buy-in transactions provide schemes with the opportunity to remove risk relating to all or part of their liability. Under a buy-out deal, a scheme transfers its entire liability and scheme assets to an insurer in exchange for a premium. Insurers tend to require assets significantly in excess of technical provisions to compensate for the risk transferred. Buy-in deals result in an insurance policy as a scheme asset.
While both longevity swaps and buy-in/buy-out can mitigate the risk of greater than expected life expectancy, under the former there is no transfer of the underlying scheme assets to a counterparty. Longevity swaps entail the pension scheme exchanging fixed payments for cashflows that vary in accordance with the longevity experience of a reference population (either the named scheme members or a wider sample).
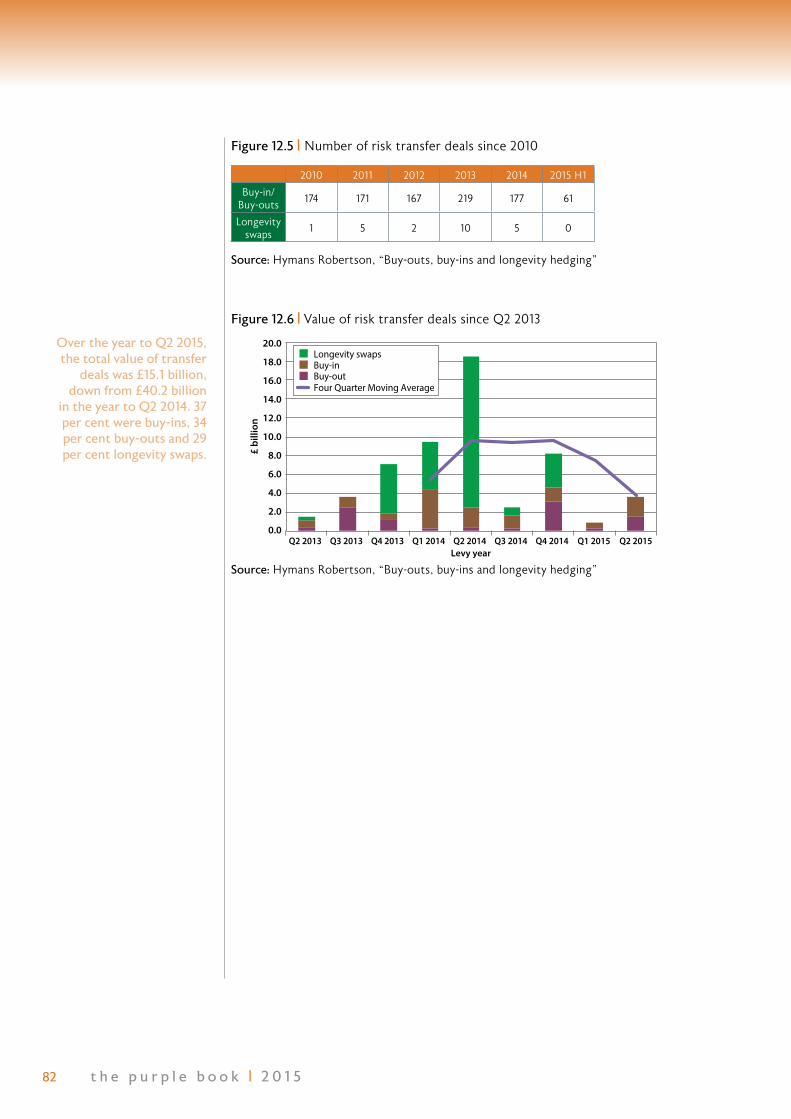
82 t h e p u r p l e b o o k | 2 0 1 5
Figure 12.5 | Number of risk transfer deals since 2010
Figure 12.6 | Value of risk transfer deals since Q2 2013
Source: Hymans Robertson, “Buy-outs, buy-ins and longevity hedging”
Source: Hymans Robertson, “Buy-outs, buy-ins and longevity hedging” £
billi
on
0.0
2.0
4.0
6.0
8.0
10.0
12.0
14.0
16.0
18.0
20.0
Q2 2013 Q3 2013 Q4 2013 Q1 2014 Q2 2014 Q3 2014 Q4 2014 Q1 2015 Q2 2015
Longevity swaps Buy-in Buy-out Four Quarter Moving Average
Levy year
2010 2011 2012 2013 2014 2015 H1
Buy-in/Buy-outs
174 171 167 219 177 61
Longevity swaps
1 5 2 10 5 0
Over the year to Q2 2015, the total value of transfer
deals was £15.1 billion, down from £40.2 billion
in the year to Q2 2014. 37 per cent were buy-ins, 34 per cent buy-outs and 29 per cent longevity swaps.

83t h e p u r p l e b o o k | 2 0 1 5
Schemes by size band
Schemes
Status
All
Ope
n
Clo
sed
to
new
en
tran
ts
Clo
sed
to
futu
re a
ccru
al
Win
din
g-up
Member Group
5 to 99 members 354 978 725 87 2,144
100 to 999 members 233 1,372 986 34 2,625
1,000 to 4,999 members
105 457 217 6 785
5,000 to 9,999 members
32 108 38 . 179
Over 10,000 members 41 138 32 . 212
Total 765 3,053 1,998 127 5,945
Note that results have been suppressed to preserve confidentiality.
Members by size band
Members
Status
All
Ope
n
Clo
sed
to
new
ent
rant
s
Clo
sed
to
futu
re a
ccru
al
Win
din
g-up
Member Group
5 to 99 members 11,486 43,880 35,107 2,626 93,099
100 to 999 members 78,431 512,725 321,044 12,408 924,608
1,000 to 4,999 members 266,174 1,005,641 474,623 15,193 1,761,631
5,000 to 9,999 members 222,861 743,600 256,605 6,269 1,229,335
Over 10,000 members 1,818,834 4,455,312 673,693 16,085 6,963,924
Total 2,397,786 6,761,158 1,761,072 52,581 10,972,597
Chapter 3 appendix

84 t h e p u r p l e b o o k | 2 0 1 5
Membership by member type
Act
ive
mem
bers
Def
erre
d
mem
bers
Pens
ione
r m
embe
rs
5 to 99 members 9,247 46,572 37,280
100 to 999 members 105,363 483,529 335,716
1,000 to 4,999 members 234,824 878,879 647,928
5,000 to 9,999 members 162,391 570,875 496,069
Over 10,000 members 1,274,638 2,938,896 2,750,390
Total 1,786,463 4,918,751 4,267,383
Schemes, membership, and s179 liability by industry
Industry
Total number of schemes
Total % of schemes
Total DB members
Total % of memberships
Total % s179 liability
Agricultural production
52 0.9 18,343 0.2 0.1
Communications 45 0.8 555,119 5.1 6.0
Construction 154 2.6 98,285 0.9 0.9
Finance, insurance and real estate
1,047 17.6 2,712,045 24.7 26.2
Manufacturing 1,503 25.3 2,210,947 20.1 20.1
Mining 48 0.8 80,522 0.7 0.9
Public administration
41 0.7 131,610 1.2 1.4
Retail trade 349 5.9 1,385,082 12.6 7.9
Services 1,686 28.4 2,204,819 20.1 21.2
Transportation 311 5.2 569,166 5.2 5.2
Utilities 87 1.5 376,110 3.4 5.0
Wholesale trade 622 10.5 630,549 5.7 5.1
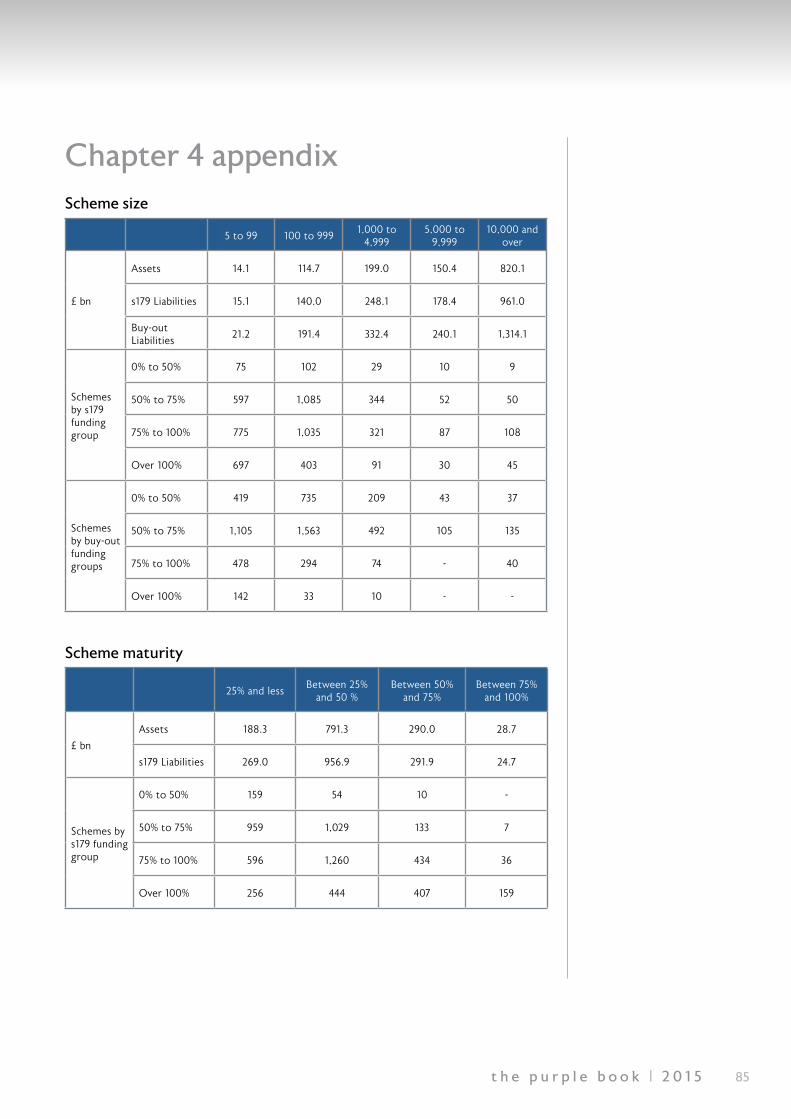
85t h e p u r p l e b o o k | 2 0 1 5
Chapter 4 appendixScheme size
5 to 99 100 to 9991,000 to
4,9995,000 to
9,99910,000 and
over
£ bn
Assets 14.1 114.7 199.0 150.4 820.1
s179 Liabilities 15.1 140.0 248.1 178.4 961.0
Buy-out Liabilities
21.2 191.4 332.4 240.1 1,314.1
Schemes by s179 funding group
0% to 50% 75 102 29 10 9
50% to 75% 597 1,085 344 52 50
75% to 100% 775 1,035 321 87 108
Over 100% 697 403 91 30 45
Schemes by buy-out funding groups
0% to 50% 419 735 209 43 37
50% to 75% 1,105 1,563 492 105 135
75% to 100% 478 294 74 - 40
Over 100% 142 33 10 - -
Scheme maturity
25% and lessBetween 25%
and 50 %Between 50%
and 75%Between 75%
and 100%
£ bn
Assets 188.3 791.3 290.0 28.7
s179 Liabilities 269.0 956.9 291.9 24.7
Schemes by s179 funding group
0% to 50% 159 54 10 -
50% to 75% 959 1,029 133 7
75% to 100% 596 1,260 434 36
Over 100% 256 444 407 159

86 t h e p u r p l e b o o k | 2 0 1 5
Scheme status
OpenClosed to new
entrantsClosed to future
accrualWinding-up
£ bn
Assets 216.4 906.6 170.6 4.8
S179 Liability 292.4 1,035.2 209.6 5.3
Buy-out Liability 388.4 1,416.8 286.6 7.4
Schemes by s179 funding groups
0% to 50% 52 80 88 -
50% to 75% 286 1,056 769 17
75% to 100% 274 1,248 762 42
Over 100% 153 669 379 65
Schemes by estimated buy-out liability group
0% to 50% 192 671 565 15
50% to 75% 380 1,814 1,156 50
75% to 100% 152 483 238 41
Over 100% 41 85 39 23
Assets by scheme size (£bn)
5 to 99 1.8 7 4.9 0.3
100 to 999 9.2 70.5 33.7 1.3
1,000 to 4,999 24.4 120.3 53.1 1.1
5,000 to 9,999 20.0 105.7 24.0 0.6
10,000 and over 161 602.9 54.7 1.5

87t h e p u r p l e b o o k | 2 0 1 5
Industry
Schemes by status £ bn
OpenClosed to new
entrants
Closed to future accrual
Winding-up
Assetss179 Liability
Agricultural production
- 24 23 - 1.5 1.6
Communications - 27 10 - 76.1 92.1
Construction - 63 57 - 10.8 13.8
Finance, insurance and real estate
99 582 345 21 370.7 404.3
Manufacturing 124 783 576 20 257.9 310.4
Mining - 29 12 - 13.5 14.4
Public administration 21 19 - - 13.7 21.4
Retail trade 33 162 133 21 102.2 121.7
Services 323 801 519 43 256.3 327.7
Transportation - 173 77 - 61 80.6
Utilities - 59 14 - 71.6 76.5
Wholesale trade 43 331 231 17 62.9 78.1
88 t h e p u r p l e b o o k | 2 0 1 5
Active memberIn relation to an occupational pension scheme, a person who is in pensionable service under the scheme.
AcronymsLDILiability-driven investment
ONSOffice for National Statistics
AdministrationSee Company: trading status.
Aggregate funding positionSum of assets less sum of liabilities, or average of scheme funding positions. In a pool of schemes where schemes in deficit outweigh schemes in surplus there is an aggregate deficit.
Assessment periodThe time when a scheme is being assessed to see if the Pension Protection Fund can assume responsibility for it.
Asset Backed Contribution (ABC) A contractual arrangement between trustees and one or more entities within the sponsoring employer’s group. ABCs involve regular payments to the scheme for the duration of the arrangement. The payment stream derives from an underlying asset. For more information see www.pensionprotectionfund.org.uk/levy/Pages/1516_Levy_Determination.aspx
Buy-out basisThe level of coverage the current assets will provide if all benefits were to be bought out in the name of the individual member with an insurance company. See also full buy-out.
Closed (to new members)The scheme does not admit new members. Existing members can continue to accrue pensionable service/benefits.
Glossary

89t h e p u r p l e b o o k | 2 0 1 5
Company: business typesLimited liability partnershipsThese are a type of alternative corporate business vehicle that gives the benefits of limited liability but allows its members the flexibility of organising their internal structure as a traditional partnership.
PartnershipThe relationship that exists between individuals who run a business together with a view to making a profit. The rights of each partner are governed by a partnership agreement or the Partnership Act 1980.
Private companyA company registered under the Companies Act 1985 that is not a public limited company. A private company may be registered as a limited or unlimited liability company. It must have at least one member and at least one director. There is no minimum share capital requirement.
Public limited companyA company registered under the Companies Act 1985. It must have at least two members and two directors and a share capital that complies with the authorised minimum amounts. It can offer its shares to the public and may be among the public companies that trade on the Stock Exchange.
Registered charityAn institution (corporate or not) which is established for exclusively charitable purposes and which is registered with the Charity Commission.
Sole traderAn individual who carries on a business on his or her own account. The individual is fully liable for any losses of the business and pays income tax on any taxable profits of the business.
Company: trading statusActive/currently tradingThe company is continuing to trade.
Administration
One of the main corporate insolvency rescue procedures. It can be a precursor to a company voluntary arrangement under which the company is restructured and passed back to its directors. In an administration, the insolvency practitioner, as officer of the court, takes over powers of management of the business (but is able to delegate these back to management) with the objective of rescuing the company or (if that is not possible, or if the result would be better for creditors) rescuing the business as a going concern and providing protection from actions by creditors while doing so. A partnership can also be subject to administration as a prelude to a partnership voluntary arrangement.
DissolvedThe company has ceased trading. All assets of the company have been disposed of and/ or it has been taken off the register at Companies House.

90 t h e p u r p l e b o o k | 2 0 1 5
DormantThe company is not currently trading but remains a corporate entity and/or remains on the register at Companies House.
In liquidationEither a creditor or the company can apply to the courts to put the company into liquidation. It is the process which eventually brings a company’s existence to an end after distributing its assets to creditors/shareholders.
LiquidatedFollowing the liquidation process, the company has ceased trading. All assets of the company have been disposed of and/or it has been taken off the register at Companies House.
Receivership(Also known as administrative receivership or Law of Property Act (LPA) 1925 receivership.) Non-court procedure whereby an insolvency practitioner takes control of the whole of a company’s assets under the terms of a charge or mortgage.
Default riskThe risk that the borrower will be unable to satisfy the terms of its borrowing obligations with respect to the timely payment of interest and repayment of the amount borrowed.
Deferred memberIn relation to an occupational pension scheme, a person (other than an active or pensioner member) who has accrued rights under the scheme.
Deficit reduction contributionA one-off (or irregular) contribution made by a scheme sponsor to a pension scheme to reduce the level of deficit.
Defined benefitBenefits are worked out using a formula that is usually related to the members pensionable earnings and/or length of service. These schemes are also referred to as final salary or salary related pension schemes.
Defined contributionBenefits are based on the amount of contributions paid, the investment returns earned and the amount of pension this money will buy when a member retires. These schemes are also referred to as money purchase pension schemes.
Dun & Bradstreet (D&B)A provider of insolvency scores. This was used in the levy calculations before levy year 2015/16.
ExperianA provider of insolvency scores. This is used in the levy calculations from levy year 2015/16 onwards.
91t h e p u r p l e b o o k | 2 0 1 5
FRS17In November 2000, the UK Accounting Standards Board released a new financial reporting standard, numbered 17 (‘FRS17’). This sets out the accounting treatment for retirement benefits such as pensions and medical care during retirement. It replaces SSAP 24 (‘Accounting for pension costs’) and UITF Abstract 6 (‘Accounting for post-retirement benefits other than pensions’).
Full buy-outThe cost of insuring a pension scheme in the private market. The discount rate applied to liabilities would be more prudent in general than the discount rate applied to section 179 and MFR valuations. The benefit assumed in private insurance is usually non-capped and thus could be greater than Pension Protection Fund coverage.
Gilt yieldThe yield, if held to maturity, of a government (non-indexed) bond.
Hybrid scheme or partial defined benefit schemeA scheme that can provide defined benefits and defined contribution benefits. A scheme providing benefits on a defined contribution basis but that is or was contracted out of the state scheme on either a GMP or Reference Scheme test basis is a common example of a hybrid scheme.
IAS19An international accounting standard equivalent of FRS17.
Insolvency eventsThese are the insolvency triggers set out in the Pension Protection Fund legislation.
Insolvency riskThe risk that a borrower will have to close business due to its inability to service either the principal or interest of its debt. This is a more extreme event than a default. See also Insolvency events.
Insurance companyInsurance companies provide a range of services to pension schemes, including:
• asset investment;
• asset management;
• investment advice and expertise;
• custodian facilities; and
• scheme administration services.
Insurance managed fundsA unitised fund invested in multiple investment categories managed by an insurance company.
Insurance policyInvestment class: an annuity or a deposit administration contract purchased from an insurance company.

92 t h e p u r p l e b o o k | 2 0 1 5
LTRMThe Pension Protection Fund’s Long-Term Risk Model, which is based on stochastic simulations of economic scenarios and their respective impacts on assets and liabilities of pension schemes under coverage and the credit quality of the sponsoring employers.
MQ5 dataThe data from the ONS MQ5 enquiry is based on a sample of 350 pension schemes. This comprises around 100 local authorities and 250 public and private corporations (the PPF database excludes local authorities and public corporations). The sample has total assets of £1,100 billion, which is much higher than the PPF database. All schemes with more than 20,000 members are automatically included and schemes with fewer than 20,000 members are randomly selected. The sample is made up of what are known as ‘superannuation and self-administered pension funds’. A self-administered pension fund is defined as an occupational pension schemes with units invested in one or more managed schemes or unit trusts; a superannuation pension fund is defined as an organisational pension programme created by a company for the benefit of its employees. The sample may also contain defined contribution schemes.
OpenThe scheme continues to accept new members, and benefits continue to accrue.
Paid up (or frozen)All contributions to the scheme have stopped and no further pensionable service accrues. Members’ benefits for earlier service continue to be held and invested in the scheme.
Part 3 Valuation or scheme funding valuation An actuarial valuation meeting the requirements of Part 3 of the Pensions Act 2004 concerning the funding of DB, which apply to any actuarial valuation received by trustees (on or after 30 December 2005) that is based on an effective date of 22 September 2005 or later.
Participating employerAn employer that has some (or all) employees who can join an occupational pension scheme. This term is usually used where there is more than one employer participating in a single scheme.
Pensioner memberA person who is currently receiving a pension from the scheme or from an annuity bought in the trustee’s name.
Pension Protection Fund (PPF)A statutory corporation run by the Board of the Pension Protection Fund, established under the Pensions Act 2004.
Pension protection levyThis is the annual amount that a pension scheme is charged by the Pension Protection Fund. It is composed of a scheme-based levy and a risk-based levy. It is similar to an insurance premium.
The Pensions RegulatorThe UK regulator of work-based pension schemes, an executive non-departmental public body established under the Pensions Act 2004.

93t h e p u r p l e b o o k | 2 0 1 5
Principal employerThe employer named in the trust deed and rules of the scheme which usually has powers such as those to appoint trustees, amend the scheme rules or wind the scheme up. This is often the employer who set up the scheme, or its successor in business.
Risk-based levySee pension protection levy. Calculated on the basis of a pension scheme’s deficit and insolvency risk of the sponsoring employer.
Scheme actuaryThe named actuary appointed by the trustees of a defined benefit occupational pension scheme to carry out specific duties set out in the Pensions Act 1995.
Section 179 (s179) valuationTo calculate the risk-based pension protection levy the Pension Protection Fund Board must take account of scheme underfunding. To obtain a consistent basis for determining underfunding, schemes can complete a Pension Protection Fund valuation (section 179). This valuation will be based on the level of assets and liabilities for the scheme. The liabilities will be based on the scheme benefits taking into account key features of the levels of compensation paid by the Board of the Pension Protection Fund as set out in Schedule 7 of the Pensions Act.
Scheme-based levySee pension protection levy. Calculated on the basis of section 179 liabilities and the number of members participating in the pension scheme.
Scheme funding positionThe difference between the assets and liabilities of a pension scheme (scheme deficit if negative, scheme surplus if positive).
Scheme funding valuationNew legislation on scheme funding came into force on 30 December 2005. The new requirements, introduced by the Pensions Act 2004, replace the minimum funding requirement and apply to occupational pension schemes providing defined benefits.
Scheme memberIn relation to an occupational pension scheme, a scheme member is any person who:
• is an active member;
• is a deferred member;
• is a pensioner member;
• has rights due to transfer credits under the scheme; or
• has pension credit rights under the scheme.
This includes scheme members whose only entitlements are equivalent pension benefits
(EPBs) as those rights were earned through pensionable employment. Members (for occupational and personal schemes) do not include dependants of members. Those whose only entitlements are lump sum benefits payable on death are also not included.

94 t h e p u r p l e b o o k | 2 0 1 5
Scheme return noticeThe Pensions Act 2004 set out the requirement to send occupational pension schemes a scheme return to complete. The information collected in the scheme return will further enable the regulator to perform its new role and responsibilities. The scheme return notice is issued to schemes to inform them that it is time to complete a scheme return.
Sectionalised schemeA multi-employer scheme which is divided into two or more sections where:
• any contributions payable to the scheme by an employer in relation to the scheme, or by an employee of that employer, are allocated to that employer’s section; and
• a specified proportion of the assets of the scheme is attributable to each section of the scheme and cannot be used for the purposes of any other section.
Some sections open/some sections closedA scheme that has sections with different status types. For example the scheme may have a defined benefit section closed to new entrants, and a defined contribution section open to new entrants.
SwapA contract calling for the exchange of payments over time. Often one payment is fixed in advance and the other is floating based upon the realisation of a price or interest rate.
Technical provisions (TPs) The funding measure used for the purposes of Part 3 valuations. The TPs are a calculation undertaken by the actuary of the assets needed at any particular time to make provision for benefits already considered accrued under the scheme using assumptions prudently chosen by the trustees – in other words, what is required for the scheme to meet the statutory funding objective. These include pensions in payment (including those payable to survivors of former members) and benefits accrued by other members and beneficiaries, which will become payable in the future.
Total deficitSum of scheme deficits, or average of scheme funding positions for schemes in deficit only.
TrusteesCorporate trustee (non-professional)A company usually related to the employer (or the employer itself ) set up to act as trustee for a scheme or a series of related or associated schemes.
Member-nominated trustee (MNT)A person nominated by the members (and sometimes elected) to be a trustee of the scheme. A MNT may be a member of the scheme. A MNT is appointed in accordance with sections 16-21 of the Pensions Act 1995.
Pensioneer trusteeA pensioneer trustee is an individual or a company recognised by HMRC (Inland Revenue) as having pensions expertise.

95t h e p u r p l e b o o k | 2 0 1 5
Professional trustee (including corporate)A professional trustee not connected with the employer and not a scheme member. The trustee could be a corporate trustee company or an individual. A professional trustee provides trusteeship and trustee services to a number of unrelated and nonassociated pension schemes.
Statutory independent trusteeA trustee appointed to a scheme where an insolvency practitioner has been appointed over an employer in accordance with sections 22-26 of the Pensions Act 1995.
Voluntary form reportingElectronic forms are available on the Pension Protection Fund’s website for pension schemes to provide data regarding sectionalised schemes, contingent assets, participating employers, scheme structure, estimates of pension fund deficits on a section 179 basis, deficit reduction contributions and block transfers.
Winding up/wound upAfter the wind-up is complete (the scheme is wound up), there will be no assets or liabilities left in the scheme, and the scheme will cease to exist as a legal entity. Winding up describes the process of reaching wind-up from normal ongoing status. To make sure that members will still receive benefits, there are several options:
• transferring pension values to another pension arrangement;
• buying immediate or deferred annuities; or
• transferring the assets and liabilities of the scheme to another pension scheme.
The scheme must be wound up in accordance with the scheme rules and any relevant legislation.

How to contact us:
Pension Protection Fund
Renaissance12 Dingwall RoadCroydonSurreyCR0 2NA
www.pensionprotectionfund.org.uk
Phone: 0845 600 2541Textphone: 0845 600 2542Fax: 020 8633 903Email: [email protected]
The Pensions Regulator
Napier HouseTrafalgar PlaceBrightonBN1 4DW
www.thepensionsregulator.gov.uk www.trusteetoolkit.com
Customer Support
Phone: 0870 606 3636Textphone: 08702433123Fax: 0870 241 1144Email: [email protected] 16
0359