the publication alcohol and health in wales 2014
TRANSCRIPT
The publication Alcohol and health in Wales 2014 consists of:
- a Wales profile
- seven health board summary documents
- interactive data files with the main indicators
- a technical guide describing the methods, data sources and caveats
These are available on www.publichealthwalesobservatory.wales.nhs.uk/alcohol
Main project team (analysis and writing): Andrea Gartner, Ioan Francis, Dee Hickey,
Rhian Hughes, Leon May Additional analysis work: James Allen, Hugo Cosh, Arthur Duncan-Jones, Rhys Powell,
Holly Walsh, Mari Ann Jones
Project manager: Andrea Gartner Project director: Nathan Lester
Acknowledgements:
Thanks to the following people for their help with this publication: Professor Mark Bellis, Helen Crowther, Dr Gareth Davies, Ruth Davies, Andrew Dring, Cath Roberts (WG), Isabel Puscas, Mark Robinson (PHE), Sacha Wyke (PHE)
Contact:
Public Health Wales Observatory 14 Cathedral Road
Cardiff CF11 9LJ
Email: [email protected] Website: www.publichealthwalesobservatory.wales.nhs.uk
© 2014 Public Health Wales NHS Trust
All tables, charts and maps were produced by the Public Health Wales Observatory and the data
sources are shown under each graphic. Material contained in this profile may be reproduced without
prior permission provided it is done so accurately and is not used in a misleading context.
Acknowledgement to Public Health Wales NHS Trust to be stated. Typographical copyright lies with
Public Health Wales NHS Trust.

Alcohol and health in Wales 2014: Wales profile
1
Table of contents
FIGURES & TABLES ................................................................................. 2
KEY MESSAGES ........................................................................................ 5
1 INTRODUCTION ................................................................................ 6
2 DEFINITION OF UNITS AND DRINKING PATTERNS .......................... 7
3 PATTERNS OF DRINKING .................................................................. 9 3.1 Drinking in children and young people .......................................... 9 3.2 Consumption in adults in Wales .................................................. 10
3.2.1 Frequency of alcohol consumption in Wales ................................. 11 3.2.2 Alcohol consumption trend in Wales ............................................ 11 3.2.3 Abstainers ............................................................................... 12 3.2.4 Drinking patterns by age group and over time ............................. 13 3.2.5 Geographical variation in very heavy drinking .............................. 16 3.3 Drinking patterns and trends in Great Britain ................................ 18 3.4 Comparison of survey results and sales data ................................ 18 3.5 International comparison of consumption ..................................... 20
4 HOSPITAL ADMISSIONS ................................................................. 21 4.1 The scale and breakdown by condition ......................................... 22 4.2 Hospital admission trends over time ............................................ 24 4.3 Geographical variation in hospital admissions ............................... 26 4.4 Comparison to England and English regions .................................. 28
5 MORTALITY .................................................................................... 32 5.1 Alcohol-specific and alcohol-attributable mortality ......................... 32 5.2 Chronic liver disease and cirrhosis ............................................... 34 5.3 Months of life lost ..................................................................... 35 5.4 Geographical variation in mortality .............................................. 37 5.5 Comparison to England and English regions .................................. 38
6 SOCIO-ECONOMIC PATTERNS ......................................................... 41
7 REFERENCES................................................................................... 47

Alcohol and health in Wales 2014: Wales profile
2
Figures & Tables
Table 1 Number of units in common alcoholic drinks 7
Table 2 Overview of definitions used 8
Figure 1 Percentage of respondents who reported drinking alcohol at least once a week,
boys and girls aged 11-16, 2009/10
10
Figure 2 Reported average frequency of drinking alcohol, percentages, males and
females aged 16+, Wales, 2012
11
Figure 3 Percentage of adults who reported drinking on the heaviest day in the past
week, age-standardised percentage, males and females aged 16+, Wales, 2008
-2013
12
Figure 4 Percentage of adults who reported abstaining from alcohol, males and
females aged 16+, Wales, 2008-09 and 2011-12
13
Figure 5 Percentage of adults who reported drinking above guidelines, males and females
aged 16+, Wales, 2008-09 and 2011-12
14
Figure 6 Percentage of adults who reported heavy (binge) drinking, males and females
aged 16+, Wales, 2008-09 and 2011-12
15
Figure 7 Percentage of adults who reported very heavy drinking, males and females aged
16+, Wales, 2008-09 and 2011-12
15
Figure 8 Percentage of adults reporting very heavy drinking (males over 12 units,
females over 9 units) on the heaviest drinking day in the past week, age-
standardised percentage, persons, Wales health boards, 2011-2012
16
Figure 9 Percentage of adults reporting very heavy drinking (males, over 12 units,
females over 9 units) on the heaviest drinking day in the past week, Wales,
2008-12
17
Figure 10 Percentage of adults who reported drinking alcohol on the heaviest drinking day
in the past week, persons aged 16+, Great Britain, 2012
18
Figure 11 Comparison of sales and survey consumption data, weekly alcohol units per
person, 1996-2012
19
Figure 12 International alcohol consumption for selected countries, litres of pure alcohol
per person aged 15+, 2010
20
Table 3 Overview of definitions for person-based hospital admission indicators 21
Figure 13 Alcohol-specific hospital admissions by condition, 2012/13 22
Figure 14 Alcohol-attributable hospital admissions (narrow) by condition, 2012/13 23
Figure 15 Alcohol-attributable hospital admissions (broad) by condition, 2012/13 24
Figure 16 Hospital admissions (person based), European age-standardised rate (EASR)
per 100,000, males and females, all ages, Wales, financial years 2003/04-
2012/13
25
Figure 17 Alcohol-specific hospital admissions, 3-year rolling crude rate per 100,000,
males and females aged under 18, Wales, financial years 2003/04-2012/13
26
Figure 18 Alcohol-specific hospital admissions (person-based), European age-standardised
rate per 100,000, males, all ages, Wales health boards, financial year 2012/13
27
Alcohol and health in Wales 2014: Wales profile
3
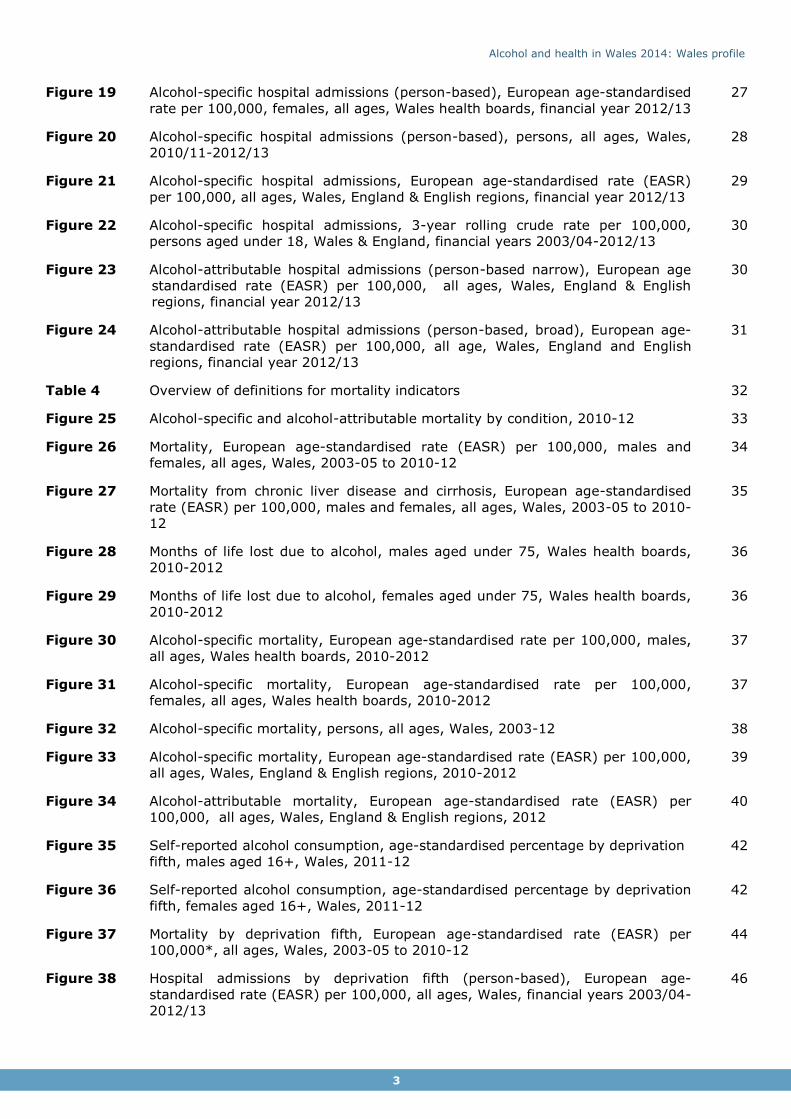
Figure 19 Alcohol-specific hospital admissions (person-based), European age-standardised
rate per 100,000, females, all ages, Wales health boards, financial year 2012/13
27
Figure 20 Alcohol-specific hospital admissions (person-based), persons, all ages, Wales,
2010/11-2012/13
28
Figure 21 Alcohol-specific hospital admissions, European age-standardised rate (EASR)
per 100,000, all ages, Wales, England & English regions, financial year 2012/13
29
Figure 22 Alcohol-specific hospital admissions, 3-year rolling crude rate per 100,000,
persons aged under 18, Wales & England, financial years 2003/04-2012/13
30
Figure 23 Alcohol-attributable hospital admissions (person-based narrow), European age
standardised rate (EASR) per 100,000, all ages, Wales, England & English
regions, financial year 2012/13
30
Figure 24 Alcohol-attributable hospital admissions (person-based, broad), European age-
standardised rate (EASR) per 100,000, all age, Wales, England and English
regions, financial year 2012/13
31
Table 4 Overview of definitions for mortality indicators 32
Figure 25 Alcohol-specific and alcohol-attributable mortality by condition, 2010-12 33
Figure 26 Mortality, European age-standardised rate (EASR) per 100,000, males and
females, all ages, Wales, 2003-05 to 2010-12
34
Figure 27 Mortality from chronic liver disease and cirrhosis, European age-standardised
rate (EASR) per 100,000, males and females, all ages, Wales, 2003-05 to 2010-
12
35
Figure 28 Months of life lost due to alcohol, males aged under 75, Wales health boards,
2010-2012
36
Figure 29 Months of life lost due to alcohol, females aged under 75, Wales health boards,
2010-2012
36
Figure 30 Alcohol-specific mortality, European age-standardised rate per 100,000, males,
all ages, Wales health boards, 2010-2012
37
Figure 31 Alcohol-specific mortality, European age-standardised rate per 100,000,
females, all ages, Wales health boards, 2010-2012
37
Figure 32 Alcohol-specific mortality, persons, all ages, Wales, 2003-12 38
Figure 33 Alcohol-specific mortality, European age-standardised rate (EASR) per 100,000,
all ages, Wales, England & English regions, 2010-2012
39
Figure 34 Alcohol-attributable mortality, European age-standardised rate (EASR) per
100,000, all ages, Wales, England & English regions, 2012
40
Figure 35 Self-reported alcohol consumption, age-standardised percentage by deprivation
fifth, males aged 16+, Wales, 2011-12
42
Figure 36 Self-reported alcohol consumption, age-standardised percentage by deprivation
fifth, females aged 16+, Wales, 2011-12
42
Figure 37 Mortality by deprivation fifth, European age-standardised rate (EASR) per
100,000*, all ages, Wales, 2003-05 to 2010-12
44
Figure 38 Hospital admissions by deprivation fifth (person-based), European age-
standardised rate (EASR) per 100,000, all ages, Wales, financial years 2003/04-
2012/13
46

Alcohol and health in Wales 2014: Wales profile
4
Foreword Every week in Wales alcohol results in 29 deaths; around 1 in 20 of all deaths. These are not just bar brawls and overdoses resulting from binge drinking. In fact, most result from long-term
drinking and its role in increasing risks of diseases such as cancer and cardiovascular disease. Tragically, many of those affected by alcohol are unaware of how it is harming their health until the disease process is well established.
The impact of alcohol on health also creates enormous pressures on our health systems. Every week our hospitals handle as many as 1,000 admissions related to alcohol, increasing strains on already stretched services. Such admissions are only the tip of an iceberg which includes many more presentations at emergency departments, ambulance requests and GP appointments all
resulting from alcohol. The cost of alcohol to Wales extends even further through alcohol related crime, domestic violence, abuse and neglect where individuals’ well-being, property and sometimes families are harmed through the misuse of alcohol by others. Alcohol related long-term
disability and lost productivity at work mean that it is not just individuals but also the economy that suffers from an unhealthy relationship with alcohol.
Our problems with alcohol in Wales must be tackled early in life. A greater proportion of children drink alcohol in Wales than in England, Scotland or the Republic of Ireland. The normalisation of
drinking at a young age, particularly when associated with binge drinking, is especially harmful and is linked with poor educational performance, sexual health problems in early life and sets the pattern for harmful drinking behaviour in adulthood. Alcohol also hurts the poorest the most.
While this report shows that no parts of Wales are untouched by alcohol, its impact is greatest in our most deprived communities which suffer substantially higher levels of both alcohol related disease and deaths.
We can change our relationship with alcohol. The Welsh Government is taking forward a Minimum Unit Price for alcohol; a targeted measure intended to reduce alcohol consumption in the heaviest drinkers who favour very cheap alcohol but leave the moderate drinker with little or no changes to what they pay for their drinks. Such measures have successfully improved health elsewhere and
can do the same in Wales. However, we also need to empower individuals in Wales to make the right choices about their own drinking. Too many drinkers fail to recognise how even moderate drinking can increase their risks of developing diseases such as cancer. Public health professionals
must rise to the challenge of informing the public about these risks in an environment dominated by advertising intent on increasing consumption of their products. Our experience with tobacco
suggests that sustained and population wide messages about harms were only possible once legislation stipulated prominent
health information on all advertisements and products. The risks related to alcohol use are now clear - what is needed is the policy to allow them to be communicated at scale to the public.
The Welsh Government’s 10 year substance misuse strategy, Working Together to Reduce Harm (2008-18), is clear that a multi-pronged approach involving individuals, the health service, the alcohol industry and government is required if we are to make
significant progress in tackling this public health challenge. I congratulate my colleagues at the Public Health Wales Observatory for producing this comprehensive report which sets out the scale of
the challenges we face if we are to prevent the harms related to alcohol consumption across Wales. It provides a clear indication that while we are making progress much more is still to be done if
we want to reduce the avoidable harms that alcohol causes to families, business and communities across Wales.
Professor Mark Bellis
Director of Policy,
Research and Development Public Health Wales

Alcohol and health in Wales 2014: Wales profile
5
Key Messages
Alcohol remains a major cause of death and illness in Wales. Around 1,500 deaths in
Wales are attributable to alcohol each year (4.9% of all deaths).
Drinking in children and young people remains a concern with 17% of males and 14%
of females aged 11-16 in Wales drinking alcohol at least once a week. This is higher than in Scotland, Ireland, England and the survey average.
Adult consumption has fallen slightly in Wales since 2008 for all three measures:
drinking above guidelines, heavy (binge) drinking and very heavy drinking. This mirrors UK sales data which has fallen since its peak in 2004.
Adults under 45 now drink less. Drinking above guidelines, heavy and very heavy drinking have decreased in adults aged under 45, particularly in males and the youngest females, and increased or stayed the same for adults aged 45 and over.
Whilst a reduction in average drinking is good news, it is not uniform across the age groups and masks persistent or increased drinking in over 45 year olds.
More young males aged 16-24 and more older females aged 75+ have abstained from alcohol in the past year, whilst the percentage in the other age groups has largely remained the same.
The comparison with UK alcohol sales data suggests that surveys including the Welsh Health Survey underestimate alcohol consumption, and may still only represent 60% of
the alcohol sold.
The hospital admission rate in children and young people under 18 for alcohol-specific conditions has been decreasing steadily for several years, but around 410 young people
were still admitted per year in the most recent period.
The rate of individuals admitted to hospital for alcohol-specific conditions has remained
static since 2006/07. The rate of alcohol-attributable admissions (narrow) has decreased slowly since 2006/07, but in contrast, the rate for the broad measure has increased steadily over time.
Both the alcohol-specific hospital admission rates and alcohol-attributable admission rates are lower in Wales than in England for males, but more similar for females.
The months of life lost in Wales with 13.5 months for males and 6.5 months for females was higher than in England with 11.5 months for males and 5.4 months for females.
There were around 250 alcohol-specific deaths in males and 140 in females per year in Wales, based on the period 2010-12, and alcoholic liver disease accounts for the
majority of these. Mortality rates are higher in Wales than in England.
Mortality and hospital admissions are strongly related to deprivation, where rates in the most deprived areas are much higher than in least deprived areas. In contrast self-
reported heavy and very heavy drinking is very similar between the deprivation fifths.
There is no sign of improvement in the gap in mortality between the most deprived and
the least deprived areas over time.
Inequalities in alcohol-specific and alcohol-attributable (narrow) hospital admissions
have slightly narrowed over time, but slightly widened for the alcohol-attributable (broad) admissions.

Alcohol and health in Wales 2014: Wales profile
6
1 Introduction
Alcohol is deeply engrained in the culture of Wales, the UK and many other countries. Many people enjoy alcoholic drinks in moderation but alcohol use can lead to significant harm to the
individual, their families and society. The harmful use of alcohol ranks among the top five risk factors for disease, disability and death throughout the world. Alcohol is a causal factor in
more than 200 disease and injury conditions and accounts for an estimated 5.9% of all deaths worldwide1. Alcohol use and its consequences remain a major public challenge in Wales, the UK and elsewhere.
The Welsh Government’s substance misuse strategy Working together to reduce harm was published in 2008 and in its 10 year plan sets out a national programme for tackling and
reducing the harms associated with alcohol, drugs and other substances2. The Welsh Government publishes annual reports on progress made to implement the strategy2 and data from our publication has been provided for the forthcoming 2014 annual update.
This new publication provides the latest update to our report A profile of alcohol and health in Wales published five years ago3. Public Health England have recently published revised
methods for mortality and hospital admission indicators4 following a review of alcohol-attributable fractions5 for each condition linked to alcohol. We have implemented these methods using Wales data, providing a comprehensive and extended set of indicators for
Wales, allowing a comparison to England.
This Wales report provides further analysis with interpretation on alcohol consumption
patterns, hospital admissions, mortality and socio-economic inequalities. The publication contains an extensive local component to support local action with seven health board summary documents, each with data provided at the lowest geographical level possible. The
main indicator data is published in interactive data files and details of definitions, methods and caveats as well as guidance on interpretation can be found in the technical guide.
Alcohol and health in Wales 2014: Wales profile
7
2 Definition of units and
drinking patterns
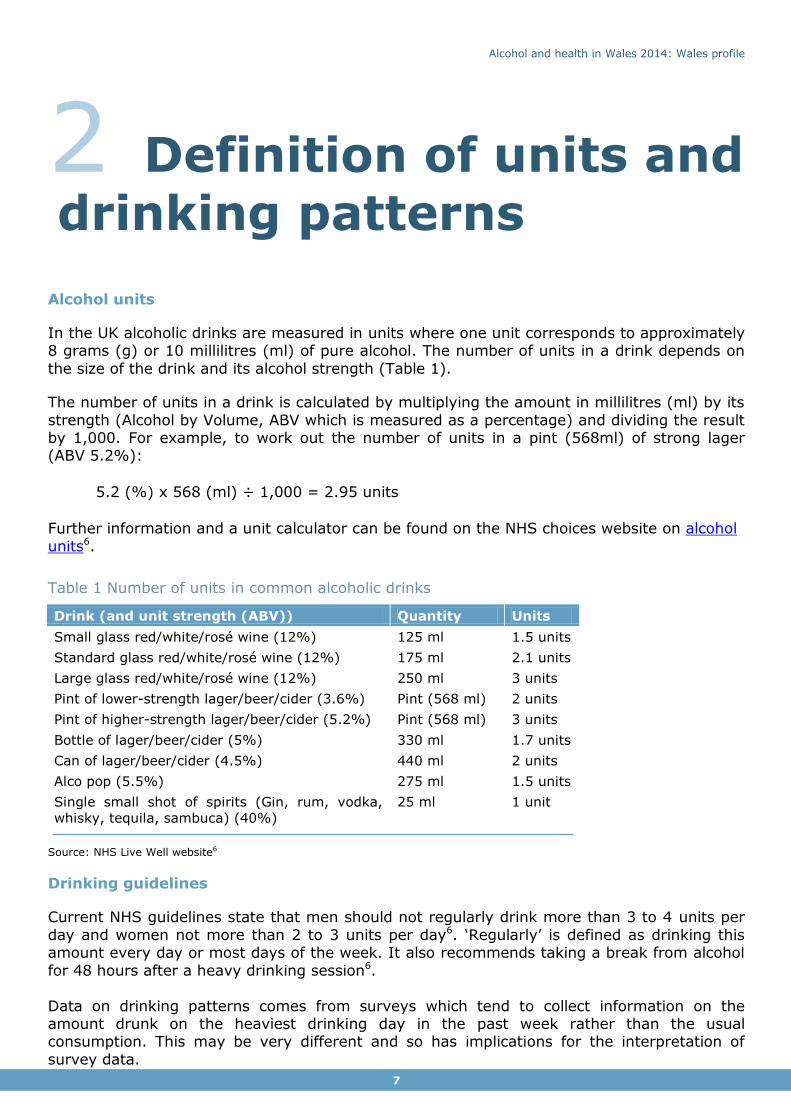
Alcohol units
In the UK alcoholic drinks are measured in units where one unit corresponds to approximately 8 grams (g) or 10 millilitres (ml) of pure alcohol. The number of units in a drink depends on
the size of the drink and its alcohol strength (Table 1).
The number of units in a drink is calculated by multiplying the amount in millilitres (ml) by its
strength (Alcohol by Volume, ABV which is measured as a percentage) and dividing the result by 1,000. For example, to work out the number of units in a pint (568ml) of strong lager (ABV 5.2%):
5.2 (%) x 568 (ml) ÷ 1,000 = 2.95 units
Further information and a unit calculator can be found on the NHS choices website on alcohol
units6.
Table 1 Number of units in common alcoholic drinks
Drink (and unit strength (ABV)) Quantity Units
Small glass red/white/rosé wine (12%) 125 ml 1.5 units
Standard glass red/white/rosé wine (12%) 175 ml 2.1 units
Large glass red/white/rosé wine (12%) 250 ml 3 units
Pint of lower-strength lager/beer/cider (3.6%) Pint (568 ml) 2 units
Pint of higher-strength lager/beer/cider (5.2%) Pint (568 ml) 3 units
Bottle of lager/beer/cider (5%) 330 ml 1.7 units
Can of lager/beer/cider (4.5%) 440 ml 2 units
Alco pop (5.5%) 275 ml 1.5 units
Single small shot of spirits (Gin, rum, vodka,
whisky, tequila, sambuca) (40%)
25 ml 1 unit
Source: NHS Live Well website6
Drinking guidelines
Current NHS guidelines state that men should not regularly drink more than 3 to 4 units per
day and women not more than 2 to 3 units per day6. ‘Regularly’ is defined as drinking this amount every day or most days of the week. It also recommends taking a break from alcohol
for 48 hours after a heavy drinking session6.
Data on drinking patterns comes from surveys which tend to collect information on the amount drunk on the heaviest drinking day in the past week rather than the usual consumption. This may be very different and so has implications for the interpretation of
survey data.
Alcohol and health in Wales 2014: Wales profile
8
Drinking above guidelines
Drinking above guidelines from surveys is usually measured as men drinking more than 4 units and women drinking more than 3 units on their heaviest drinking day in the previous
week.
Heavy (binge) drinking
The term ‘binge drinking’ usually refers to drinking lots of alcohol in a short period of time or
drinking to get drunk6. In surveys, it is usually measured as drinking more than twice the daily guidelines, which for men is more than 8 units and women more than 6 units on their
heaviest drinking day in the previous week. In Welsh Health Survey (WHS) publications this measure has been referred to as either ‘heavy drinking’ or ‘binge drinking’. To avoid any confusion with the new ‘very heavy drinking’ category, both terms ‘heavy (binge) drinking’
are used throughout this report for Wales or Great Britain data (see Table 2).
Very heavy drinking
The new measure ‘very heavy drinking’ has no formal definition, but has recently been used in Office for National Statistics (ONS) publications and referred to as men drinking more than 12 units and women drinking more than 9 units on their heaviest drinking day in the previous
week. This definition, listed in Table 2, is used throughout this report where survey results are reported for Wales and Great Britain.
Abstainers
Abstainers in this report refer to WHS respondents who report not having drunk alcohol in the past 12 months (Table 2). It includes those abstainers who have not consumed alcohol during
this fixed period of time regardless of whether they have drunk alcohol before this 12 month period.
Table 2 Overview of definitions used
Category Men Women
Abstainer Not drinking at all in the previous
12 months
Not drinking at all in the
previous 12 months
Drinking above guidelines Drinking more than 3-4 units on
the heaviest drinking day in the
previous week
Drinking more than 2-3 units on
the heaviest drinking day in the
previous week
Heavy (binge) drinking Drinking more than 8 units on the
heaviest drinking day in the
previous week
Drinking more than 6 units on
the heaviest drinking day in the
previous week
Very heavy drinking Drinking more than 12 units on
the heaviest drinking day in the
previous week
Drinking more than 9 units on
the heaviest drinking day in the
previous week
Alcohol and health in Wales 2014: Wales profile
9
…Drinking in children and young people remains a concern with 17% of males and 14% of females aged 11-16 in Wales drinking alcohol at least once a week. This is higher than in Scotland, Ireland and England and the
survey average ...”
“
3 Patterns of drinking
Drinking patterns in this report come from surveys which ask a sample of the population about their drinking habits. These results are then used as an estimate of the drinking
patterns of the population. The main source is the annual Welsh Health Survey, which asks around 15,000 residents in Wales about their health and lifestyle choices.
Another survey is the Opinions and Lifestyle Survey (OPN), run by the ONS (formerly called the General Household Survey), which covers adults in England, Scotland and Wales, and allows comparisons across Great Britain.
Further information on these surveys can be found in the technical guide that accompanies
this publication (see inside cover). Additionally, socio-economic patterns of alcohol consumption are discussed in Section 6.
3.1 Drinking in children and young people Drinking alcohol can damage a child’s health. It is recommended that children do not drink
alcohol, however if children do drink alcohol, they should not do so until they are at least 15 years old7.
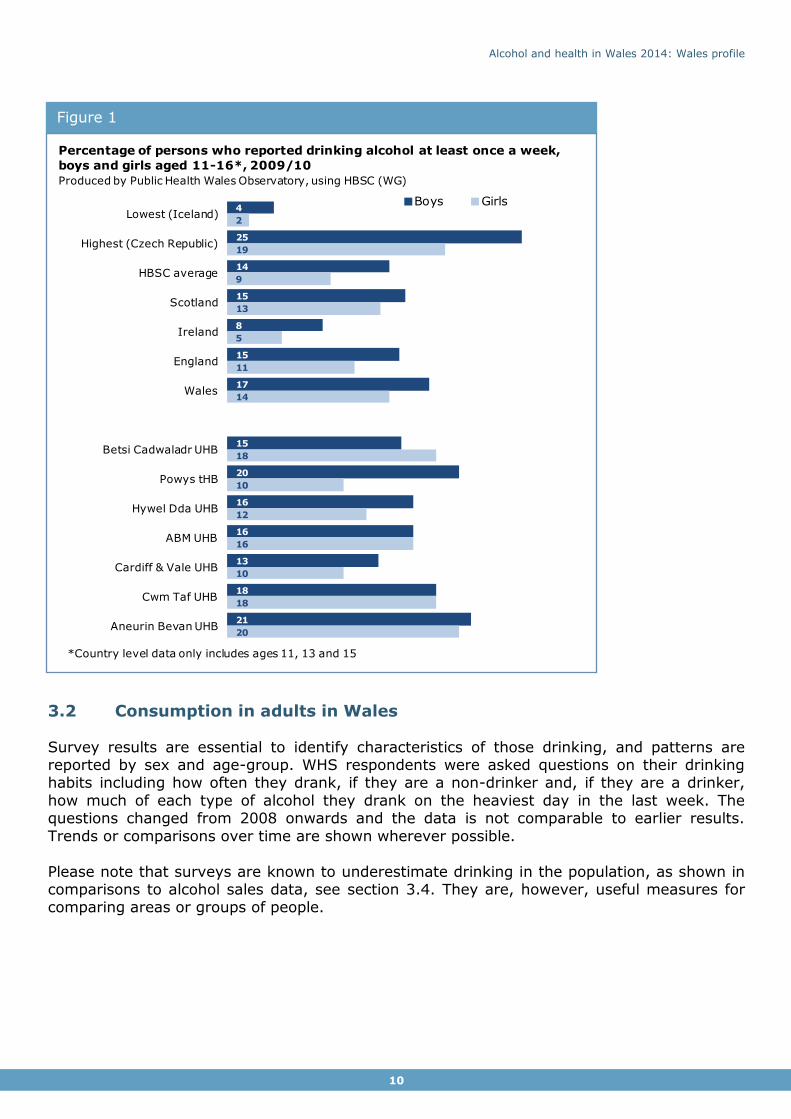
Drinking in children and young people remains of concern with 17% of males and 14% of females aged 11-16 in Wales drinking alcohol
at least once a week in 2009/10, the most recent data available (Figure 1). The Health Behaviour in School-aged Children survey
(HBSC) is conducted in 40 countries, including Wales, England and Scotland. The percentages of young people drinking alcohol at least once a week are higher in Wales than in Scotland, Ireland, England
and the survey average for both males and females. The percentage in Wales is twice that of Ireland. At the health board
level, the higher percentages of 11-16 year olds are in Cwm Taf UHB (males and females both 18%) and Aneurin Bevan UHB (males 21% and females 20%). The largest difference between males and
females is in Powys with twice the percentage of males (20%) reporting drinking than females (10%), although this may be the
result of bias associated with small numbers of survey respondents.
Alcohol and health in Wales 2014: Wales profile
10
3.2 Consumption in adults in Wales
Survey results are essential to identify characteristics of those drinking, and patterns are reported by sex and age-group. WHS respondents were asked questions on their drinking habits including how often they drank, if they are a non-drinker and, if they are a drinker,
how much of each type of alcohol they drank on the heaviest day in the last week. The questions changed from 2008 onwards and the data is not comparable to earlier results.
Trends or comparisons over time are shown wherever possible.
Please note that surveys are known to underestimate drinking in the population, as shown in comparisons to alcohol sales data, see section 3.4. They are, however, useful measures for comparing areas or groups of people.
Figure 1
4
25
14
15
8
15
17
15
20
16
16
13
18
21
2
19
9
13
5
11
14
18
10
12
16
10
18
20
Lowest (Iceland)
Highest (Czech Republic)
HBSC average
Scotland
Ireland
England
Wales
Betsi Cadwaladr UHB
Powys tHB
Hywel Dda UHB
ABM UHB
Cardiff & Vale UHB
Cwm Taf UHB
Aneurin Bevan UHB
Boys Girls
Percentage of persons who reported drinking alcohol at least once a week,
boys and girls aged 11-16*, 2009/10
Produced by Public Health Wales Observatory, using HBSC (WG)
*Country level data only includes ages 11, 13 and 15
Alcohol and health in Wales 2014: Wales profile
11
…Adult consumption has fallen slightly across Wales since 2008 for all three measures. This mirrors UK sales data which has fallen since
its peak in 2004 ...”
“
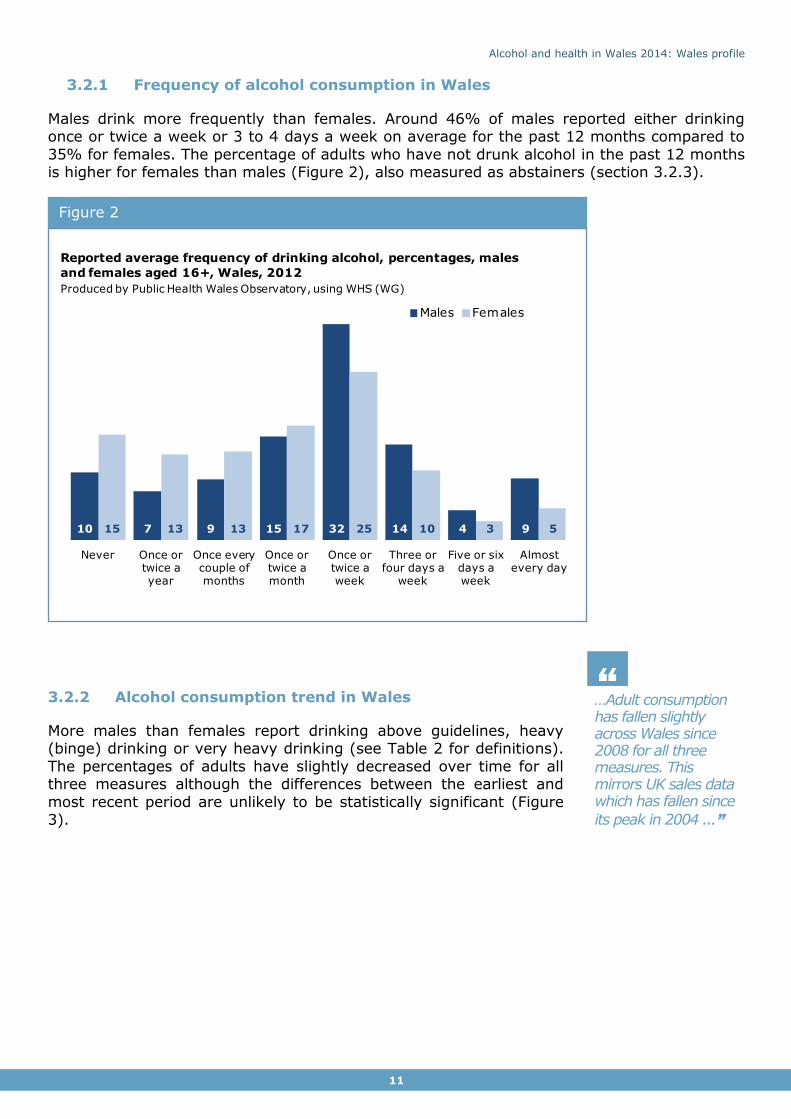
3.2.1 Frequency of alcohol consumption in Wales
Males drink more frequently than females. Around 46% of males reported either drinking once or twice a week or 3 to 4 days a week on average for the past 12 months compared to
35% for females. The percentage of adults who have not drunk alcohol in the past 12 months is higher for females than males (Figure 2), also measured as abstainers (section 3.2.3).
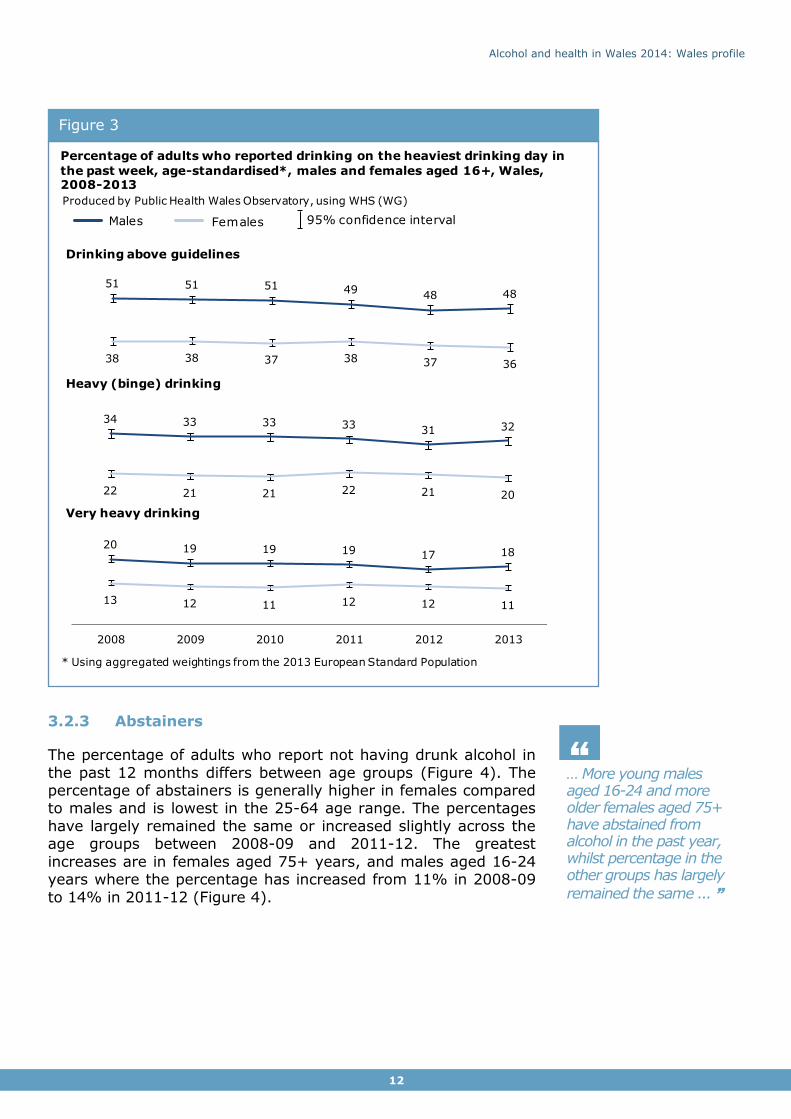
3.2.2 Alcohol consumption trend in Wales
More males than females report drinking above guidelines, heavy (binge) drinking or very heavy drinking (see Table 2 for definitions).
The percentages of adults have slightly decreased over time for all three measures although the differences between the earliest and
most recent period are unlikely to be statistically significant (Figure 3).
Figure 2
10 7 9 15 32 14 4 915 13 13 17 25 10 3 5
Never Once or twice a year
Once every couple of months
Once or twice a month
Once or twice a week
Three or four days a
week
Five or six days a week
Almost every day
Males Females
Reported average frequency of drinking alcohol, percentages, males
and females aged 16+, Wales, 2012
Produced by Public Health Wales Observatory, using WHS (WG)
Alcohol and health in Wales 2014: Wales profile
12
… More young males aged 16-24 and more older females aged 75+ have abstained from alcohol in the past year, whilst percentage in the other groups has largely
remained the same ... ”
“
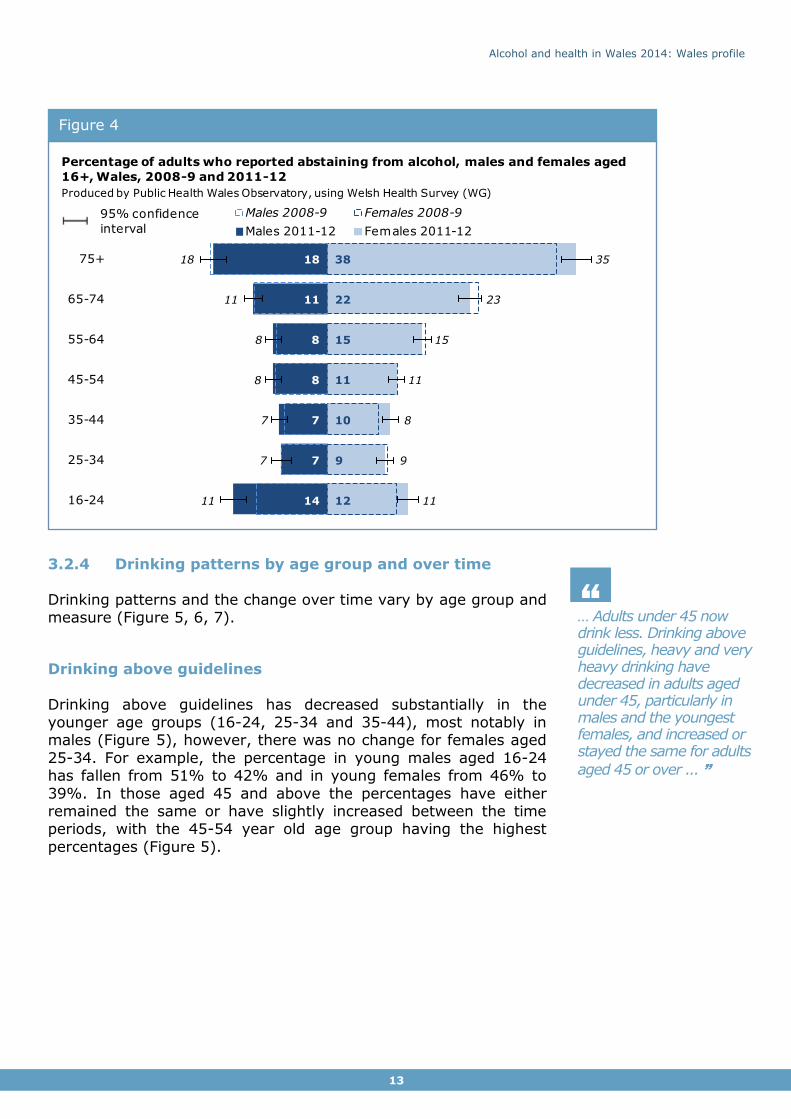
3.2.3 Abstainers
The percentage of adults who report not having drunk alcohol in
the past 12 months differs between age groups (Figure 4). The percentage of abstainers is generally higher in females compared to males and is lowest in the 25-64 age range. The percentages
have largely remained the same or increased slightly across the age groups between 2008-09 and 2011-12. The greatest
increases are in females aged 75+ years, and males aged 16-24 years where the percentage has increased from 11% in 2008-09
to 14% in 2011-12 (Figure 4).
Figure 3
Produced by Public Health Wales Observatory, using WHS (WG)
34 33 33 3331 32
22 21 21 22 21 20
51 51 51 4948 48
38 38 37 38 37 36
20 19 19 19 17 18
13 12 11 12 12 11
2008 2009 2010 2011 2012 2013
Males Females
Very heavy drinking
Drinking above guidelines
* Using aggregated weightings from the 2013 European Standard Population
Heavy (binge) drinking
95% confidence interval
Percentage of adults who reported drinking on the heaviest drinking day in
the past week, age-standardised*, males and females aged 16+, Wales, 2008-2013
Alcohol and health in Wales 2014: Wales profile
13
… Adults under 45 now drink less. Drinking above guidelines, heavy and very heavy drinking have decreased in adults aged under 45, particularly in males and the youngest females, and increased or stayed the same for adults
aged 45 or over ... ”
“
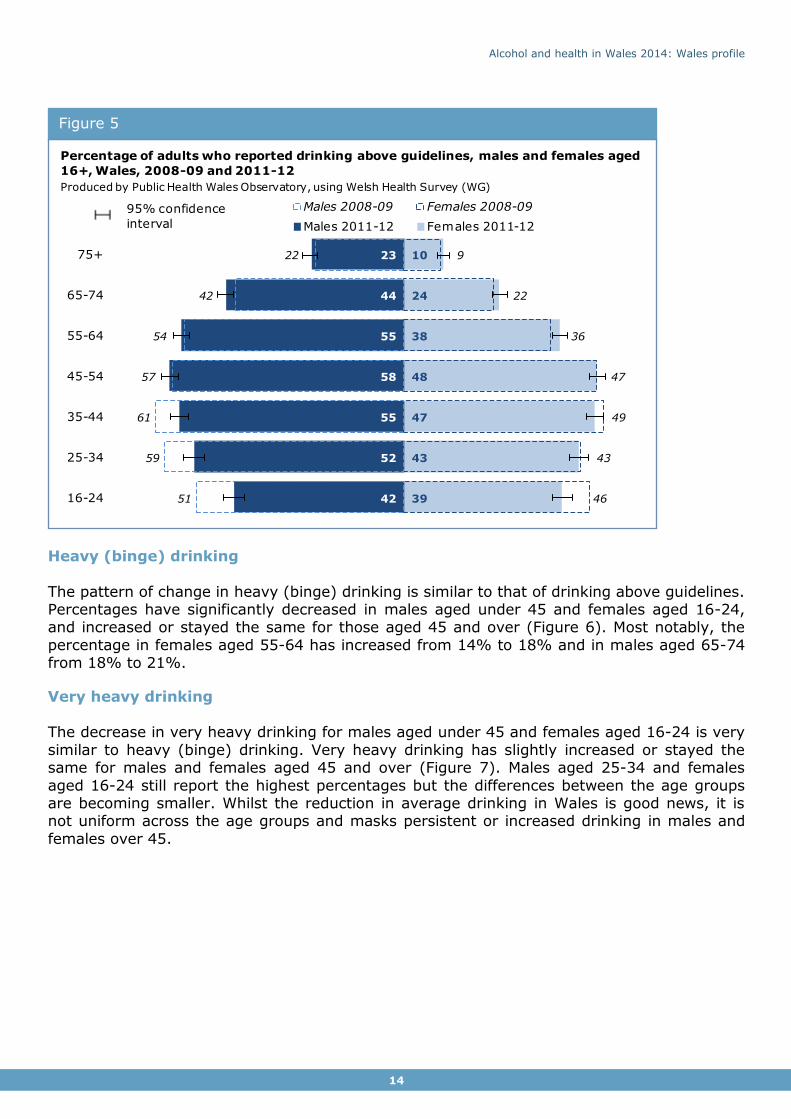
3.2.4 Drinking patterns by age group and over time
Drinking patterns and the change over time vary by age group and measure (Figure 5, 6, 7).
Drinking above guidelines
Drinking above guidelines has decreased substantially in the younger age groups (16-24, 25-34 and 35-44), most notably in males (Figure 5), however, there was no change for females aged
25-34. For example, the percentage in young males aged 16-24 has fallen from 51% to 42% and in young females from 46% to
39%. In those aged 45 and above the percentages have either remained the same or have slightly increased between the time periods, with the 45-54 year old age group having the highest
percentages (Figure 5).
Figure 4
12
9
10
11
15
22
38
14
7
7
8
8
11
18
11
9
8
11
15
23
35
11
7
7
8
8
11
18
16-24
25-34
35-44
45-54
55-64
65-74
75+
Males 2008-9 Females 2008-9
Males 2011-12 Females 2011-12
Percentage of adults who reported abstaining from alcohol, males and females aged
16+, Wales, 2008-9 and 2011-12
Produced by Public Health Wales Observatory, using Welsh Health Survey (WG)
95% confidence
interval
Alcohol and health in Wales 2014: Wales profile
14
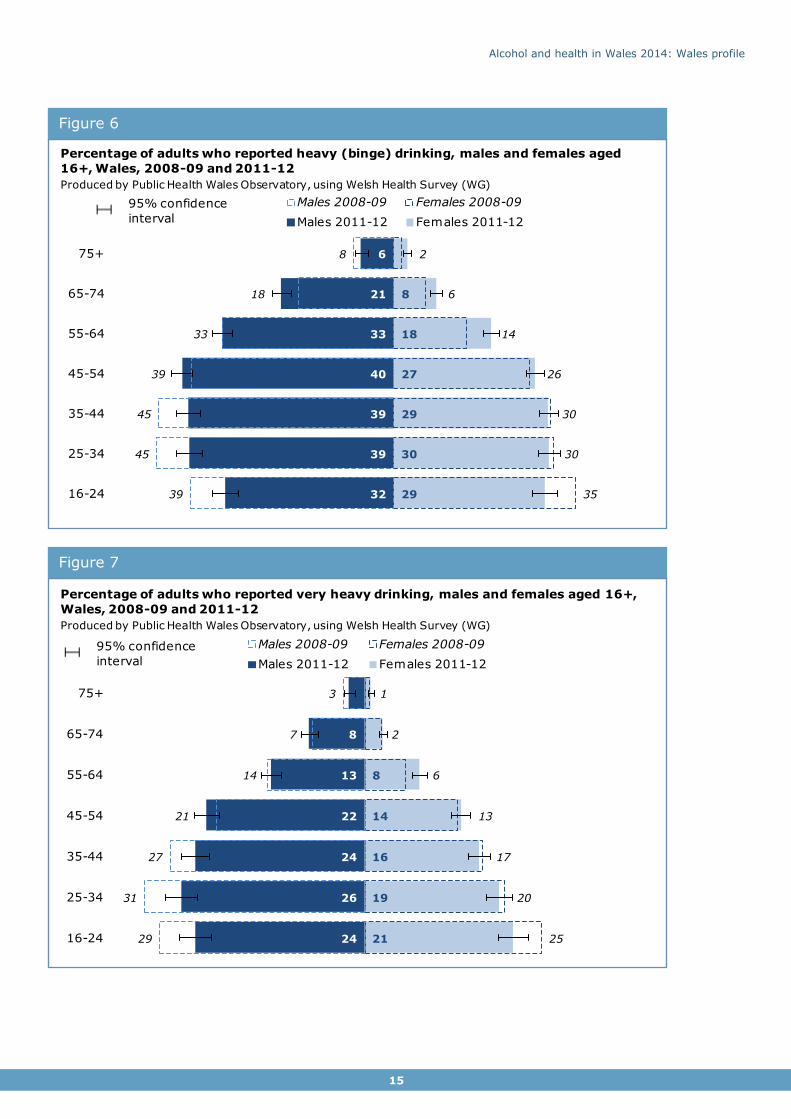
Heavy (binge) drinking
The pattern of change in heavy (binge) drinking is similar to that of drinking above guidelines. Percentages have significantly decreased in males aged under 45 and females aged 16-24, and increased or stayed the same for those aged 45 and over (Figure 6). Most notably, the
percentage in females aged 55-64 has increased from 14% to 18% and in males aged 65-74 from 18% to 21%.
Very heavy drinking The decrease in very heavy drinking for males aged under 45 and females aged 16-24 is very
similar to heavy (binge) drinking. Very heavy drinking has slightly increased or stayed the same for males and females aged 45 and over (Figure 7). Males aged 25-34 and females
aged 16-24 still report the highest percentages but the differences between the age groups are becoming smaller. Whilst the reduction in average drinking in Wales is good news, it is not uniform across the age groups and masks persistent or increased drinking in males and
females over 45.
Figure 5
39
43
47
48
38
24
10
42
52
55
58
55
44
23
46
43
49
47
36
22
9
51
59
61
57
54
42
22
16-24
25-34
35-44
45-54
55-64
65-74
75+
Males 2008-09 Females 2008-09
Males 2011-12 Females 2011-12
Percentage of adults who reported drinking above guidelines, males and females aged
16+, Wales, 2008-09 and 2011-12
Produced by Public Health Wales Observatory, using Welsh Health Survey (WG)
95% confidence
interval
Alcohol and health in Wales 2014: Wales profile
15
Figure 7
Figure 6
29
30
29
27
18
8
32
39
39
40
33
21
6
35
30
30
26
14
6
2
39
45
45
39
33
18
8
16-24
25-34
35-44
45-54
55-64
65-74
75+
Males 2008-09 Females 2008-09
Males 2011-12 Females 2011-12
Percentage of adults who reported heavy (binge) drinking, males and females aged
16+, Wales, 2008-09 and 2011-12
Produced by Public Health Wales Observatory, using Welsh Health Survey (WG)
95% confidence
interval
21
19
16
14
8
24
26
24
22
13
8
25
20
17
13
6
2
1
29
31
27
21
14
7
3
16-24
25-34
35-44
45-54
55-64
65-74
75+
Males 2008-09 Females 2008-09
Males 2011-12 Females 2011-12
Percentage of adults who reported very heavy drinking, males and females aged 16+,
Wales, 2008-09 and 2011-12
Produced by Public Health Wales Observatory, using Welsh Health Survey (WG)
95% confidence
interval

Alcohol and health in Wales 2014: Wales profile
16
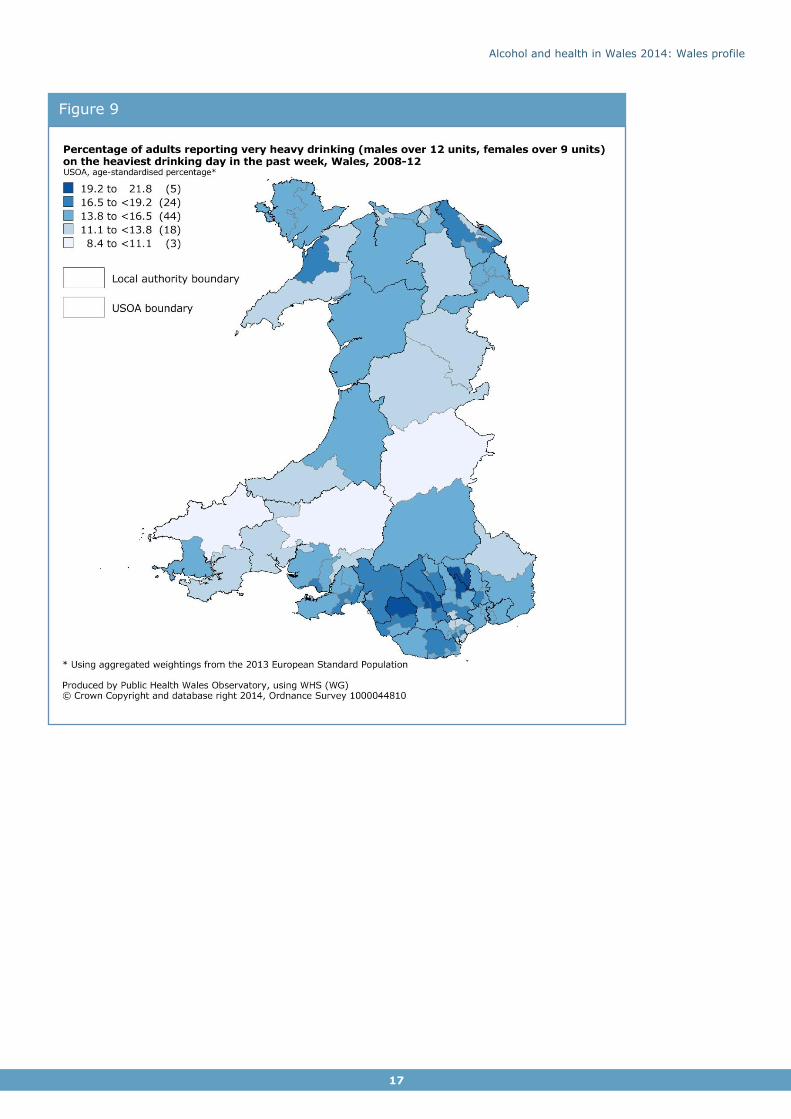
3.2.5 Geographical variation in very heavy drinking
The percentage of adults aged 16 and over who report very heavy drinking varies between health boards. The percentage for persons in Powys tHB (12.6%) and Hywel Dda UHB
(13.3%) is statistically significantly lower than Wales, whilst Cwm Taf UHB (17.6%) is statistically significantly higher (Figure 8).
The percentages vary considerably at sub-local authority level (upper super output areas) ranging from 8.4 to 21.8 (see map) (Figure 9). The map for each health board separately is
included in the Health Board summary document (see inside cover). The highest percentages of adults reporting very heavy drinking are in USOAs within Rhondda Cynon Taf, Caerphilly, Bridgend and Blaenau Gwent.
Figure 8
14.6
12.6
13.3
15.3
14.4
17.6
15.9
Wales = 14.9
Betsi Cadwaladr UHB
Powys tHB
Hywel Dda UHB
ABM UHB
Cardiff & Vale UHB
Cwm Taf UHB
Aneurin Bevan UHB
Percentage of adults reporting very heavy drinking (males over 12 units,
females over 9 units) on the heaviest drinking day in the past week, age-standardised percentage*, persons, Wales health boards, 2011-2012Produced by Public Health Wales Observatory, using Welsh Health Survey (WG)
* Using aggregated weightings from the 2013 European Standard Population
95% confidence interval
Alcohol and health in Wales 2014: Wales profile
17
Figure 9
Alcohol and health in Wales 2014: Wales profile
18
… The comparison with UK alcohol sales data suggests that surveys including the Welsh Health Survey underestimate alcohol consumption, and may still only represent 60%
of the alcohol sold ... ”
“
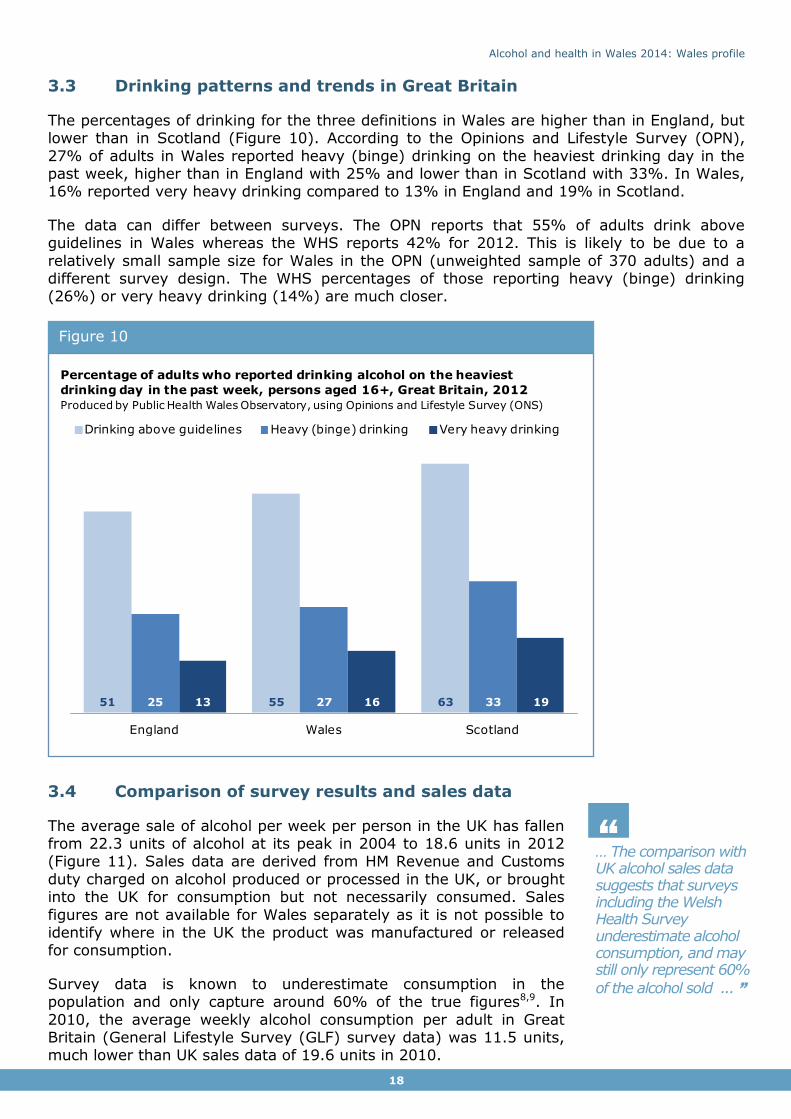
3.3 Drinking patterns and trends in Great Britain
The percentages of drinking for the three definitions in Wales are higher than in England, but lower than in Scotland (Figure 10). According to the Opinions and Lifestyle Survey (OPN),
27% of adults in Wales reported heavy (binge) drinking on the heaviest drinking day in the past week, higher than in England with 25% and lower than in Scotland with 33%. In Wales, 16% reported very heavy drinking compared to 13% in England and 19% in Scotland.
The data can differ between surveys. The OPN reports that 55% of adults drink above guidelines in Wales whereas the WHS reports 42% for 2012. This is likely to be due to a
relatively small sample size for Wales in the OPN (unweighted sample of 370 adults) and a different survey design. The WHS percentages of those reporting heavy (binge) drinking (26%) or very heavy drinking (14%) are much closer.
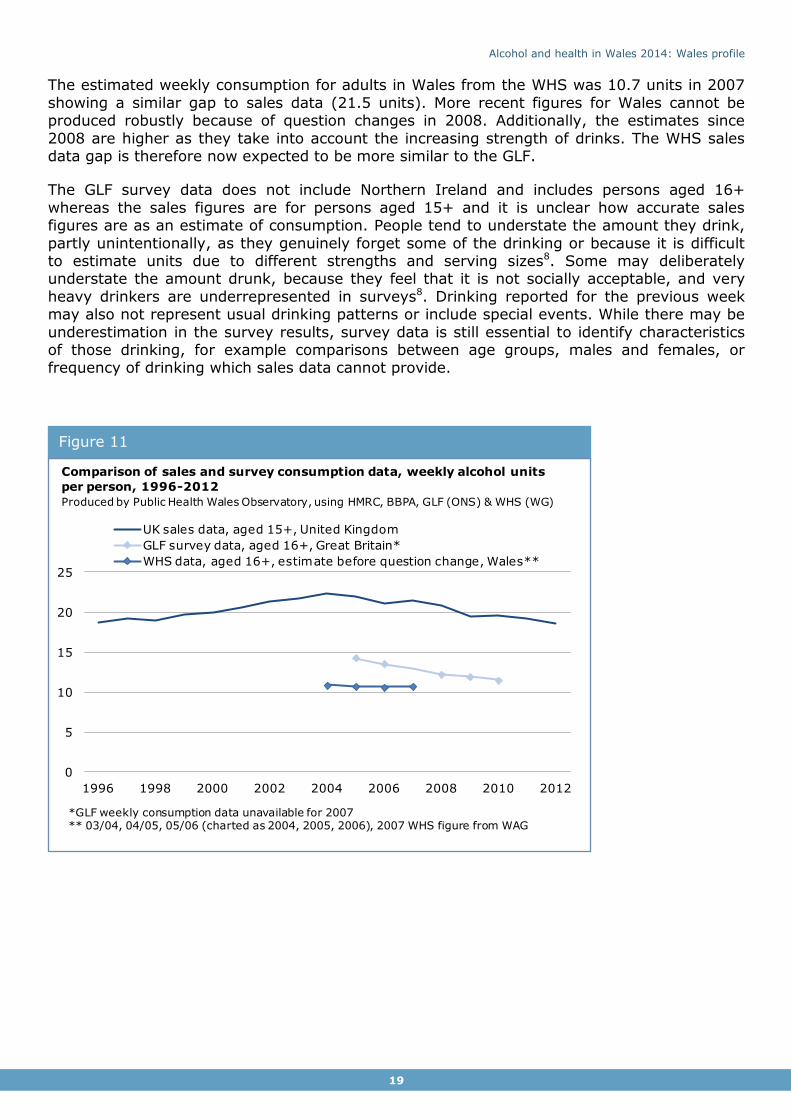
3.4 Comparison of survey results and sales data
The average sale of alcohol per week per person in the UK has fallen from 22.3 units of alcohol at its peak in 2004 to 18.6 units in 2012 (Figure 11). Sales data are derived from HM Revenue and Customs
duty charged on alcohol produced or processed in the UK, or brought into the UK for consumption but not necessarily consumed. Sales
figures are not available for Wales separately as it is not possible to identify where in the UK the product was manufactured or released for consumption.
Survey data is known to underestimate consumption in the population and only capture around 60% of the true figures8,9. In
2010, the average weekly alcohol consumption per adult in Great Britain (General Lifestyle Survey (GLF) survey data) was 11.5 units, much lower than UK sales data of 19.6 units in 2010.
Figure 10
51 55 6325 27 3313 16 19
England Wales Scotland
Drinking above guidelines Heavy (binge) drinking Very heavy drinking
Percentage of adults who reported drinking alcohol on the heaviest
drinking day in the past week, persons aged 16+, Great Britain, 2012
Produced by Public Health Wales Observatory, using Opinions and Lifestyle Survey (ONS)
Alcohol and health in Wales 2014: Wales profile
19
The estimated weekly consumption for adults in Wales from the WHS was 10.7 units in 2007
showing a similar gap to sales data (21.5 units). More recent figures for Wales cannot be produced robustly because of question changes in 2008. Additionally, the estimates since
2008 are higher as they take into account the increasing strength of drinks. The WHS sales data gap is therefore now expected to be more similar to the GLF.
The GLF survey data does not include Northern Ireland and includes persons aged 16+
whereas the sales figures are for persons aged 15+ and it is unclear how accurate sales figures are as an estimate of consumption. People tend to understate the amount they drink,
partly unintentionally, as they genuinely forget some of the drinking or because it is difficult to estimate units due to different strengths and serving sizes8. Some may deliberately understate the amount drunk, because they feel that it is not socially acceptable, and very
heavy drinkers are underrepresented in surveys8. Drinking reported for the previous week may also not represent usual drinking patterns or include special events. While there may be
underestimation in the survey results, survey data is still essential to identify characteristics of those drinking, for example comparisons between age groups, males and females, or frequency of drinking which sales data cannot provide.
Figure 11
0
5
10
15
20
25
1996 1998 2000 2002 2004 2006 2008 2010 2012
UK sales data, aged 15+, United Kingdom
GLF survey data, aged 16+, Great Britain*
WHS data, aged 16+, estimate before question change, Wales**
Comparison of sales and survey consumption data, weekly alcohol units
per person, 1996-2012
Produced by Public Health Wales Observatory, using HMRC, BBPA, GLF (ONS) & WHS (WG)
*GLF weekly consumption data unavailable for 2007** 03/04, 04/05, 05/06 (charted as 2004, 2005, 2006), 2007 WHS figure from WAG
Alcohol and health in Wales 2014: Wales profile
20
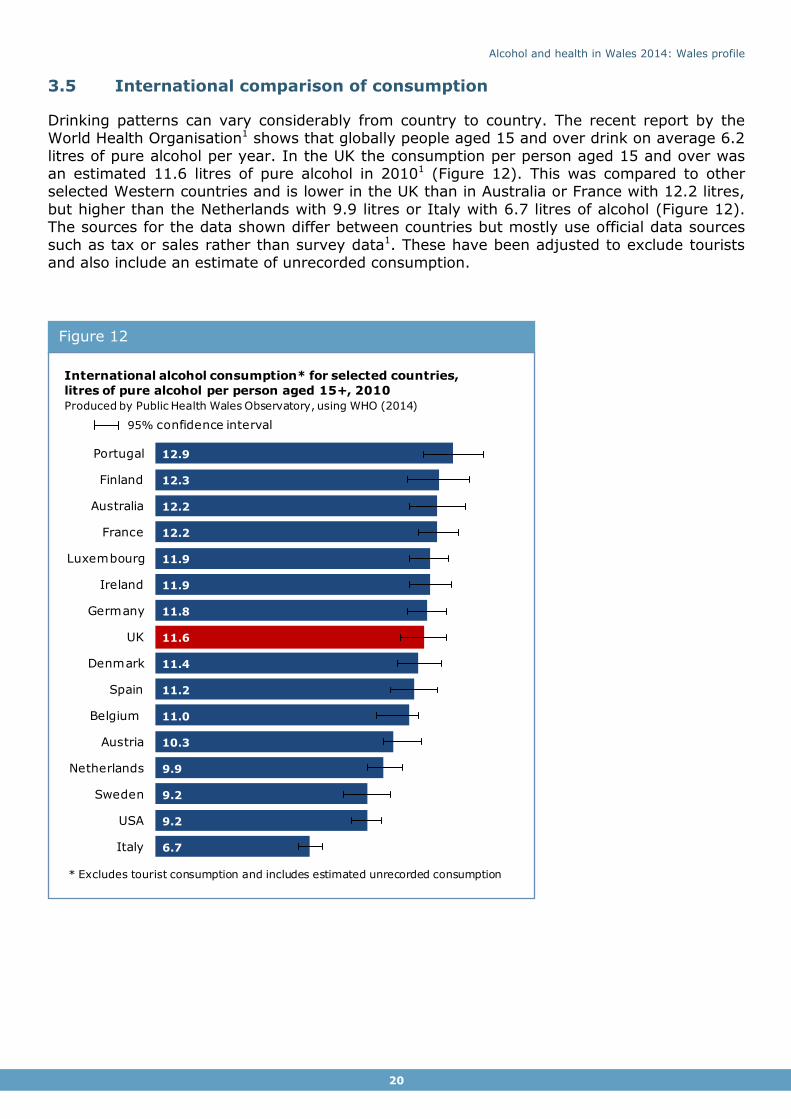
3.5 International comparison of consumption
Drinking patterns can vary considerably from country to country. The recent report by the World Health Organisation1 shows that globally people aged 15 and over drink on average 6.2
litres of pure alcohol per year. In the UK the consumption per person aged 15 and over was an estimated 11.6 litres of pure alcohol in 20101 (Figure 12). This was compared to other selected Western countries and is lower in the UK than in Australia or France with 12.2 litres,
but higher than the Netherlands with 9.9 litres or Italy with 6.7 litres of alcohol (Figure 12). The sources for the data shown differ between countries but mostly use official data sources
such as tax or sales rather than survey data1. These have been adjusted to exclude tourists and also include an estimate of unrecorded consumption.
Figure 12
6.7
9.2
9.2
9.9
10.3
11.0
11.2
11.4
11.6
11.8
11.9
11.9
12.2
12.2
12.3
12.9
Italy
USA
Sweden
Netherlands
Austria
Belgium
Spain
Denmark
UK
Germany
Ireland
Luxembourg
France
Australia
Finland
Portugal
International alcohol consumption* for selected countries,
litres of pure alcohol per person aged 15+, 2010
Produced by Public Health Wales Observatory, using WHO (2014)
* Excludes tourist consumption and includes estimated unrecorded consumption
95% confidence interval
Alcohol and health in Wales 2014: Wales profile
21
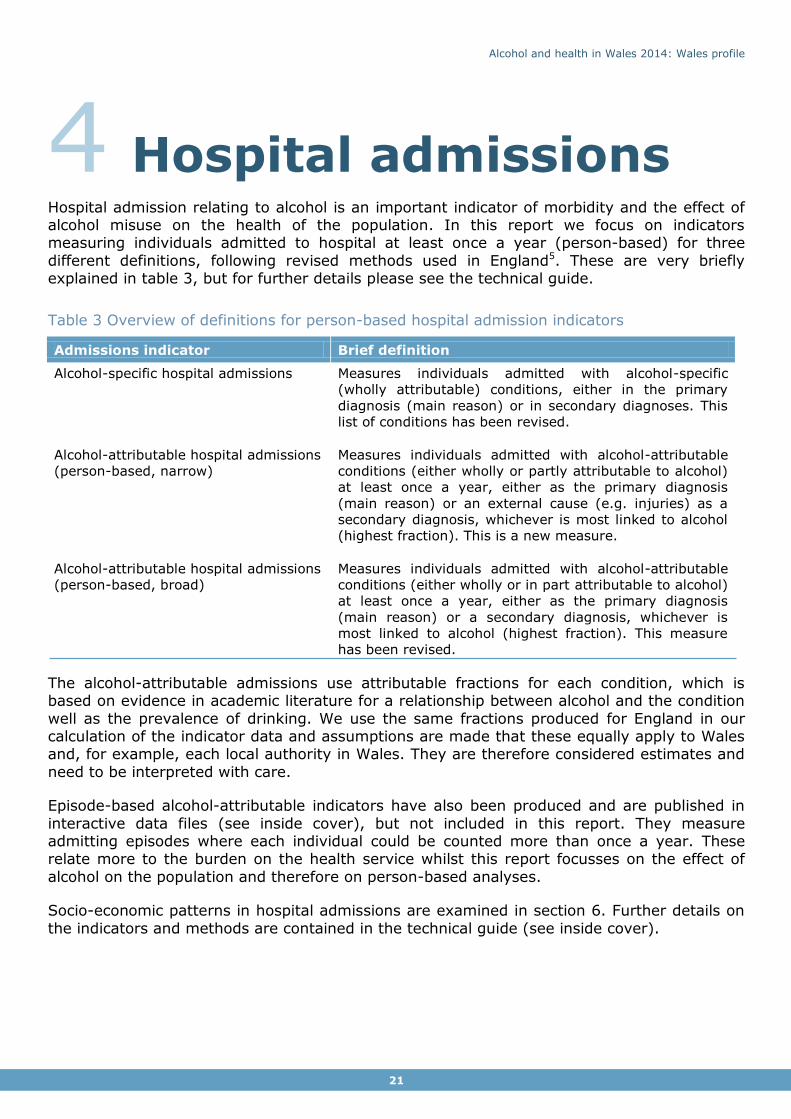
4 Hospital admissions Hospital admission relating to alcohol is an important indicator of morbidity and the effect of alcohol misuse on the health of the population. In this report we focus on indicators measuring individuals admitted to hospital at least once a year (person-based) for three
different definitions, following revised methods used in England5. These are very briefly explained in table 3, but for further details please see the technical guide.
Table 3 Overview of definitions for person-based hospital admission indicators
Admissions indicator Brief definition
Alcohol-specific hospital admissions
Measures individuals admitted with alcohol-specific
(wholly attributable) conditions, either in the primary
diagnosis (main reason) or in secondary diagnoses. This
list of conditions has been revised.
Alcohol-attributable hospital admissions
(person-based, narrow)
Measures individuals admitted with alcohol-attributable
conditions (either wholly or partly attributable to alcohol)
at least once a year, either as the primary diagnosis
(main reason) or an external cause (e.g. injuries) as a
secondary diagnosis, whichever is most linked to alcohol
(highest fraction). This is a new measure.
Alcohol-attributable hospital admissions
(person-based, broad)
Measures individuals admitted with alcohol-attributable
conditions (either wholly or in part attributable to alcohol)
at least once a year, either as the primary diagnosis
(main reason) or a secondary diagnosis, whichever is
most linked to alcohol (highest fraction). This measure
has been revised.
The alcohol-attributable admissions use attributable fractions for each condition, which is based on evidence in academic literature for a relationship between alcohol and the condition
well as the prevalence of drinking. We use the same fractions produced for England in our calculation of the indicator data and assumptions are made that these equally apply to Wales and, for example, each local authority in Wales. They are therefore considered estimates and
need to be interpreted with care.
Episode-based alcohol-attributable indicators have also been produced and are published in
interactive data files (see inside cover), but not included in this report. They measure admitting episodes where each individual could be counted more than once a year. These relate more to the burden on the health service whilst this report focusses on the effect of
alcohol on the population and therefore on person-based analyses.
Socio-economic patterns in hospital admissions are examined in section 6. Further details on
the indicators and methods are contained in the technical guide (see inside cover).
Alcohol and health in Wales 2014: Wales profile
22
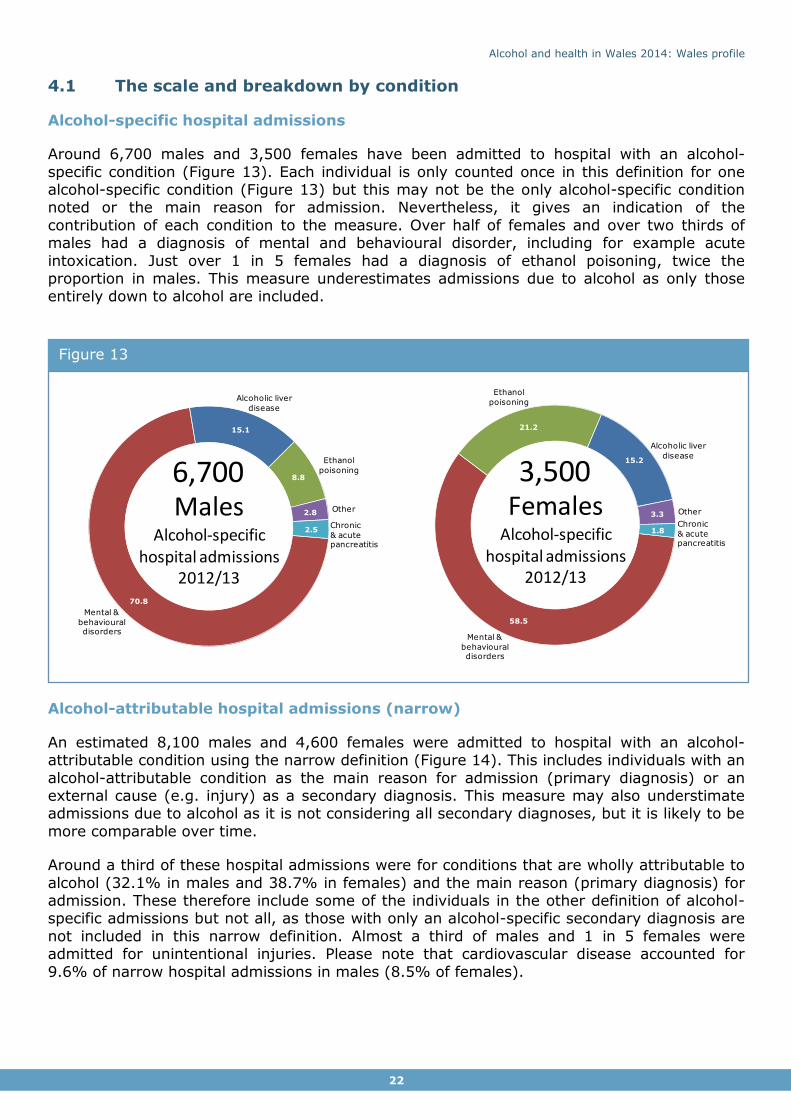
4.1 The scale and breakdown by condition
Alcohol-specific hospital admissions
Around 6,700 males and 3,500 females have been admitted to hospital with an alcohol-
specific condition (Figure 13). Each individual is only counted once in this definition for one alcohol-specific condition (Figure 13) but this may not be the only alcohol-specific condition noted or the main reason for admission. Nevertheless, it gives an indication of the
contribution of each condition to the measure. Over half of females and over two thirds of males had a diagnosis of mental and behavioural disorder, including for example acute
intoxication. Just over 1 in 5 females had a diagnosis of ethanol poisoning, twice the proportion in males. This measure underestimates admissions due to alcohol as only those entirely down to alcohol are included.
Alcohol-attributable hospital admissions (narrow)
An estimated 8,100 males and 4,600 females were admitted to hospital with an alcohol-attributable condition using the narrow definition (Figure 14). This includes individuals with an
alcohol-attributable condition as the main reason for admission (primary diagnosis) or an external cause (e.g. injury) as a secondary diagnosis. This measure may also understimate admissions due to alcohol as it is not considering all secondary diagnoses, but it is likely to be
more comparable over time.
Around a third of these hospital admissions were for conditions that are wholly attributable to
alcohol (32.1% in males and 38.7% in females) and the main reason (primary diagnosis) for admission. These therefore include some of the individuals in the other definition of alcohol-specific admissions but not all, as those with only an alcohol-specific secondary diagnosis are
not included in this narrow definition. Almost a third of males and 1 in 5 females were admitted for unintentional injuries. Please note that cardiovascular disease accounted for
9.6% of narrow hospital admissions in males (8.5% of females).
Figure 13
70.8
15.1
8.8
2.8
2.5
Mental &
behavioural disorders
Ethanol
poisoning
Alcoholic liver
disease
Other
Chronic
& acute pancreatitis
MalesAlcohol-specific
hospital admissions2012/13
6,700
58.5
21.2
15.2
3.3
1.8
Mental &
behavioural disorders
Ethanol
poisoning
Alcoholic liver
disease
Other
Chronic
& acute pancreatitis
FemalesAlcohol-specific
hospital admissions2012/13
3,500

Alcohol and health in Wales 2014: Wales profile
23
Alcohol-attributable hospital admissions (broad)
An estimated 21,700 males and 12,300 females were admitted to hospital with an alcohol-
attributable condition using the broad definition (Figure 15). This includes individuals with at least one diagnosis that relates to an alcohol-attributable condition, but not necessarily the main reason for attendance. It considers the admission with the condition with the strongest
link to alcohol i.e. the largest fraction. Coding of secondary diagnoses may vary locally and so this measure may vary in its ability of picking up all individuals with an admission related to
alcohol.
Almost half of the admissions had a diagnosis of cardiovascular disease, where a relatively high proportion are linked to alcohol and which is a common diagnosis. Any change to
hospital admissions for cardiovascular disease with a link to alcohol is therefore strongly reflected in the pattern of alcohol-attributable hospital admissions using the broad definition.
Please note that these groups only contain certain conditions that are linked to alcohol, for example, only some cardiovascular diseases. For a list of these please see the technical guide. Risk factors for cardiovascular disease are wide ranging, and any pattern in
cardiovascular disease could be the result of risk factors other than alcohol consumption. For these reasons this measure needs to be interpreted with caution, particularly when
considering a trend (see Section 4.2). Please also see the technical guide for further details. Just under a third of individuals were admitted with conditions that are wholly attributable to alcohol consumption. This measure contains all the individuals in the definition of alcohol-
specific hospital admission.
Figure 14
32.131.0
9.6
9.5 7.5
6.2
4.1
Wholly
attributable
Unintentional
injuries
Cardiovascular
Other
RespiratoryCancer
Intentional
injuries
MalesAlcohol-attributable admissions (narrow)
2012/13
8,100
38.7
21.5
13.4
8.6 8.5
5.5
3.8
Unintentional
injuries
Cardiovascular
Pregnancy &
childbirth
Respiratory
Cancer
Wholly
attributable
Other
FemalesAlcohol-attributable admissions (narrow)
2012/13
4,600

Alcohol and health in Wales 2014: Wales profile
24
… The rate of individuals admitted to hospital for alcohol specific -conditions has remained static since 2006/07, but in contrast the rate for the broad measure has increased steadily
over time ... ”
“
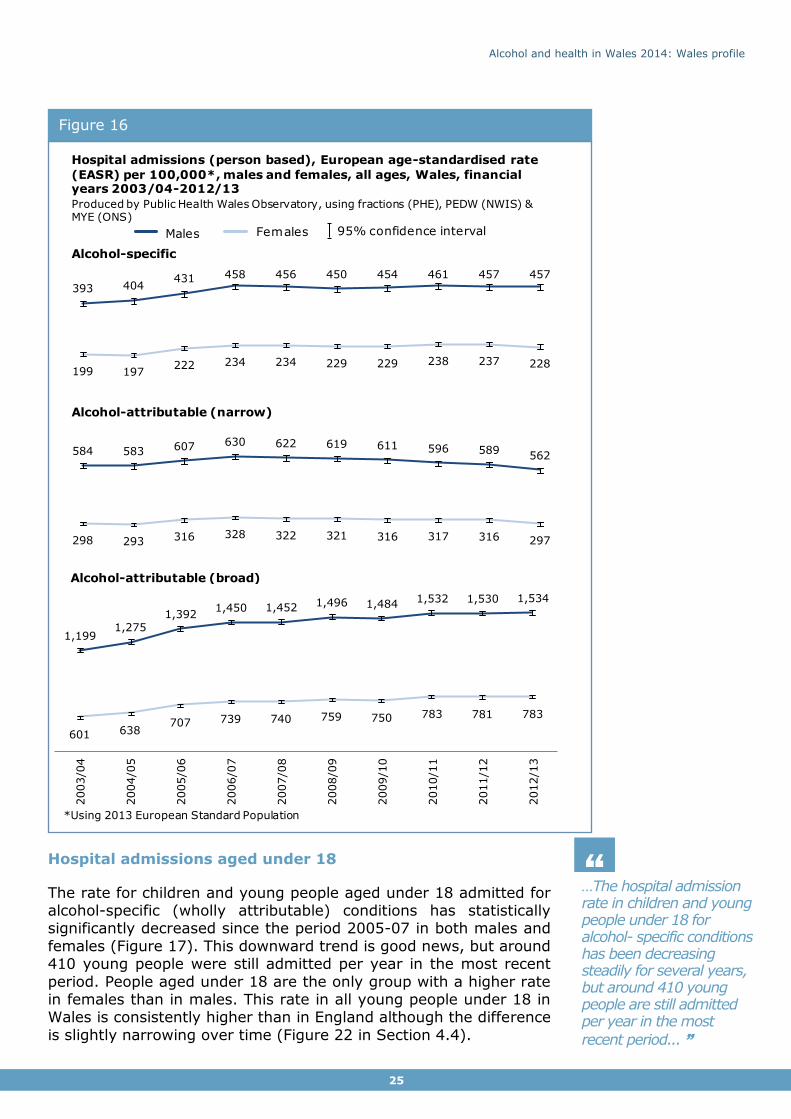
4.2 Hospital admission trends over time
The rate of individuals admitted to hospital for alcohol-specific (wholly attributable) conditions increased during the early years of the period shown but has remained stable since 2006/07. In our
previous publication A profile of alcohol and health in Wales3 we recommended that the alcohol-attributable trend (now called broad)
should be considered alongside the alcohol-specific measure to ensure that a trend over time is not merely reflecting a change in trend in one of the attributable conditions, rather than the impact of
alcohol in general over time. This is more complex with two alcohol-attributable definitions showing different trends. The rate of alcohol-
attributable admissions (narrow) has slowly decreased since 2006/07. This is in contrast to the broad measure which has steadily increased over time (Figure 16).
The broad admission indicator is heavily influenced by patterns in cardiovascular disease linked to alcohol (Section 4.3) with half of the individuals counted with cardiovascular disease
in either the primary or secondary diagnosis. Although not shown here, the trend in admissions with cardiovascular disease linked to alcohol has been rising over time and so this is reflected in the trend in the broad alcohol-attributable admissions. It may not, however,
reflect the impact of alcohol on cardiovascular disease as there are many risk factors other than alcohol and treatment may change over time. Also, coding of secondary diagnosis may
vary over time as well as between areas which needs to be taken into account when interpreting the broad alcohol-attributable admission measure. The narrow admissions measure is not affected in the same way and is therefore a more suitable measure for
tracking trends over time instead of the broad admission indicator. It is still advisable, however, to consider the alcohol-specific trend alongside the narrow measure.
The rate in males is consistently higher than the female rate, for all measures.
Figure 15
48.728.4
6.1
5.5
5.2 4.02.1
Unintentional
injuries
Cardiovascular
Digestive
Nervous
system
Cancer
Wholly
attributable
Other
FemalesAlcohol-attributable admissions (broad)
2012/13
12,300
48.9
30.9
8.0
4.33.2 3.0 1.7
Wholly
attributable
Unintentional
injuries
Cardiovascular
OtherDigestive
CancerNervous
system
MalesAlcohol-attributable admissions (broad)
2012/13
21,700
Alcohol and health in Wales 2014: Wales profile
25
…The hospital admission rate in children and young people under 18 for alcohol- specific conditions has been decreasing steadily for several years, but around 410 young people are still admitted per year in the most
recent period... ”
“
Hospital admissions aged under 18
The rate for children and young people aged under 18 admitted for alcohol-specific (wholly attributable) conditions has statistically significantly decreased since the period 2005-07 in both males and
females (Figure 17). This downward trend is good news, but around 410 young people were still admitted per year in the most recent
period. People aged under 18 are the only group with a higher rate in females than in males. This rate in all young people under 18 in Wales is consistently higher than in England although the difference
is slightly narrowing over time (Figure 22 in Section 4.4).
Figure 16
584 583 607 630 622 619 611 596 589562
298 293 316 328 322 321 316 317 316 297
393 404431 458 456 450 454 461 457 457
199 197222 234 234 229 229 238 237 228
1,1991,275
1,3921,450 1,452 1,496 1,484 1,532 1,530 1,534
601 638707 739 740 759 750 783 781 783
2003/0
4
2004/0
5
2005/0
6
2006/0
7
2007/0
8
2008/0
9
2009/1
0
2010/1
1
2011/1
2
2012/1
3
*Using 2013 European Standard Population
Hospital admissions (person based), European age-standardised rate
(EASR) per 100,000*, males and females, all ages, Wales, financialyears 2003/04-2012/13
Produced by Public Health Wales Observatory, using fractions (PHE), PEDW (NWIS) & MYE (ONS)
Males Females 95% confidence interval
Alcohol-attributable (broad)
Alcohol-attributable (narrow)
Alcohol-specific

Alcohol and health in Wales 2014: Wales profile
26
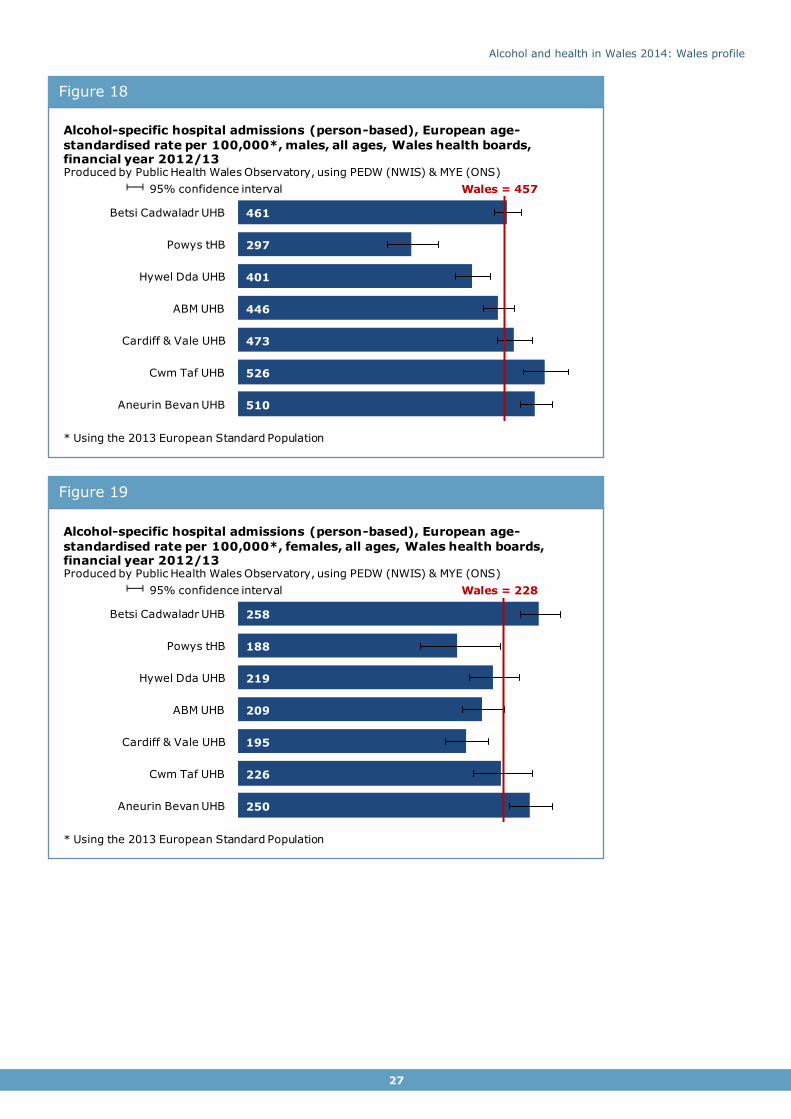
4.3 Geographical variation in hospital admissions
Alcohol-specific hospital admission rates vary locally, amongst health board areas and upper
super output areas. The rate for males in Powys tHB and Hywel Dda UHB is statistically significantly lower than for Wales, and statistically significantly higher in Aneurin Bevan UHB and Cwm Taf UHB (Figure 18). The rates for females are statistically significantly lower in
Powys tHB and in Cardiff and Vale UHB than for Wales, and statistically significantly higher in Betsi Cadwaladr UHB and Aneurin Bevan UHB (Figure 19). Other indicators, although not
shown here, are included in the health board summary documents (see inside cover).
Figure 17
8995 96
88
7468
6252
108
118126
117
103
9184
78
2003/04-2005/06
2004/05-2006/07
2005/06-2007/08
2006/07-2008/09
2007/08-2009/10
2008/09-2010/11
2009/10-2011/12
2010/11-2012/13
Males Females 95% confidence interval
Alcohol-specific hospital admissions, 3-year rolling crude rate per 100,000,
males and females aged under 18, Wales, financial years 2003/04-2012/13
Produced by Public Health Wales Observatory, using PEDW (NWIS) & MYE (ONS)
Alcohol and health in Wales 2014: Wales profile
27
Figure 19
Figure 18
461
297
401
446
473
526
510
Wales = 457
Betsi Cadwaladr UHB
Powys tHB
Hywel Dda UHB
ABM UHB
Cardiff & Vale UHB
Cwm Taf UHB
Aneurin Bevan UHB
Alcohol-specific hospital admissions (person-based), European age-
standardised rate per 100,000*, males, all ages, Wales health boards, financial year 2012/13Produced by Public Health Wales Observatory, using PEDW (NWIS) & MYE (ONS)
* Using the 2013 European Standard Population
95% confidence interval
258
188
219
209
195
226
250
Wales = 228
Betsi Cadwaladr UHB
Powys tHB
Hywel Dda UHB
ABM UHB
Cardiff & Vale UHB
Cwm Taf UHB
Aneurin Bevan UHB
Alcohol-specific hospital admissions (person-based), European age-
standardised rate per 100,000*, females, all ages, Wales health boards, financial year 2012/13Produced by Public Health Wales Observatory, using PEDW (NWIS) & MYE (ONS)
* Using the 2013 European Standard Population
95% confidence interval

Alcohol and health in Wales 2014: Wales profile
28
Rates for alcohol-specific hospital admissions vary considerably in smaller areas of Wales
(upper super output areas) and range from 165 to 613, see map (Figure 20). A separate map for each health board is included in the health board summary document (see inside cover).
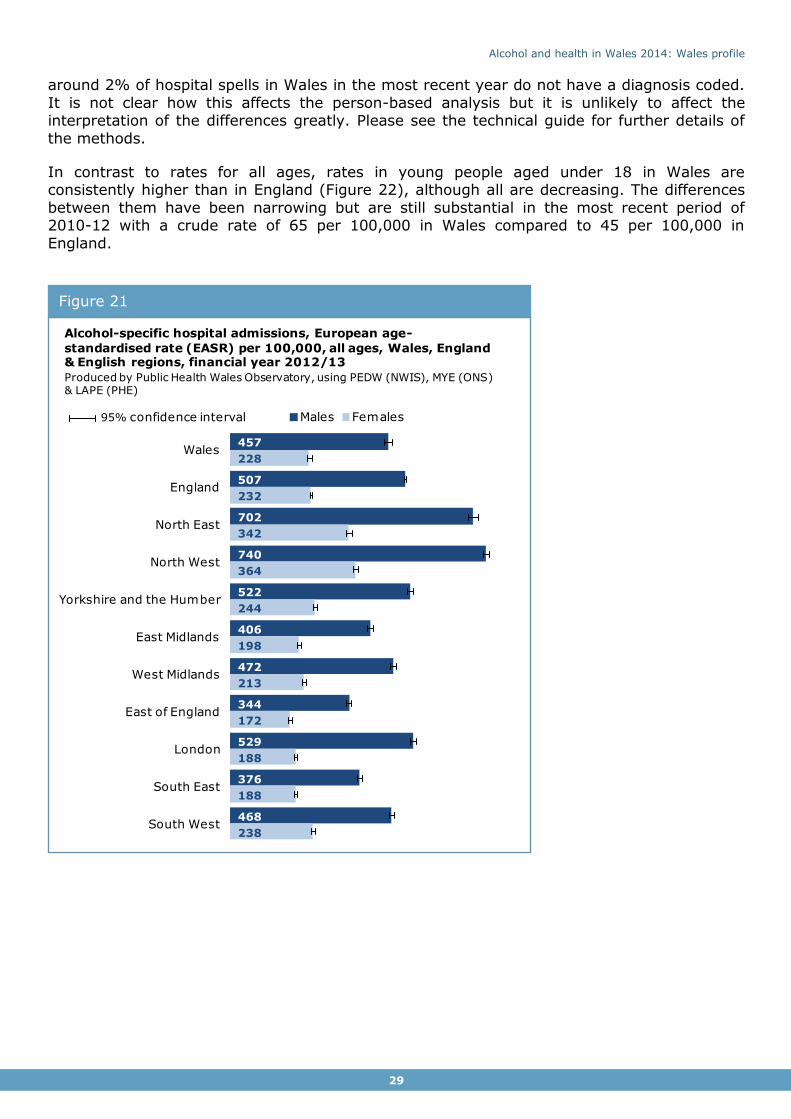
4.4 Comparison to England and English regions
Both the alcohol-specific hospital admission rates and alcohol-attributable admission rates for
all ages in males are lower in Wales than in England but more similar for females (Figure 21, 23 and 24). However, rates amongst the English regions vary considerably.
Alcohol-specific admission rates range from 344 per 100,000 in the East of England to 740 in the North West for males (from 172 to 364 respectively for females). The range is narrower for Wales health board areas, where rates vary from 297 to 526 for males and 188 to 258 for
females (Figure 18 and Figure 19 in Section 4.3).
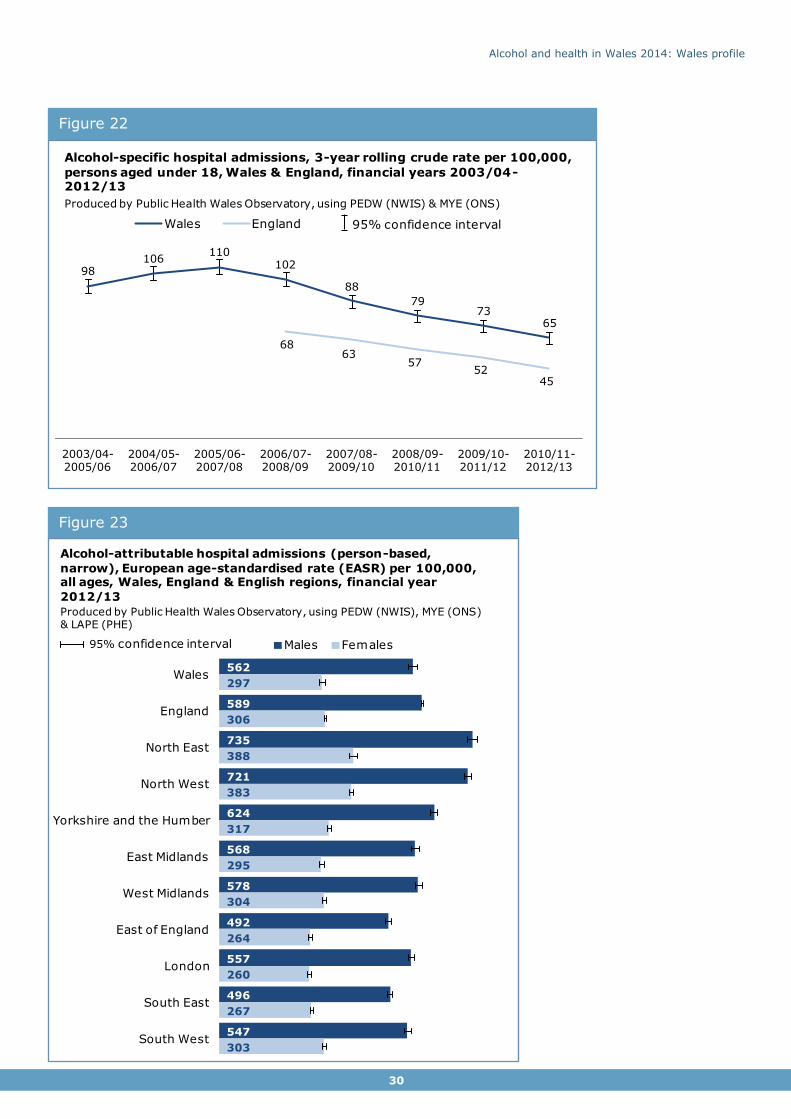
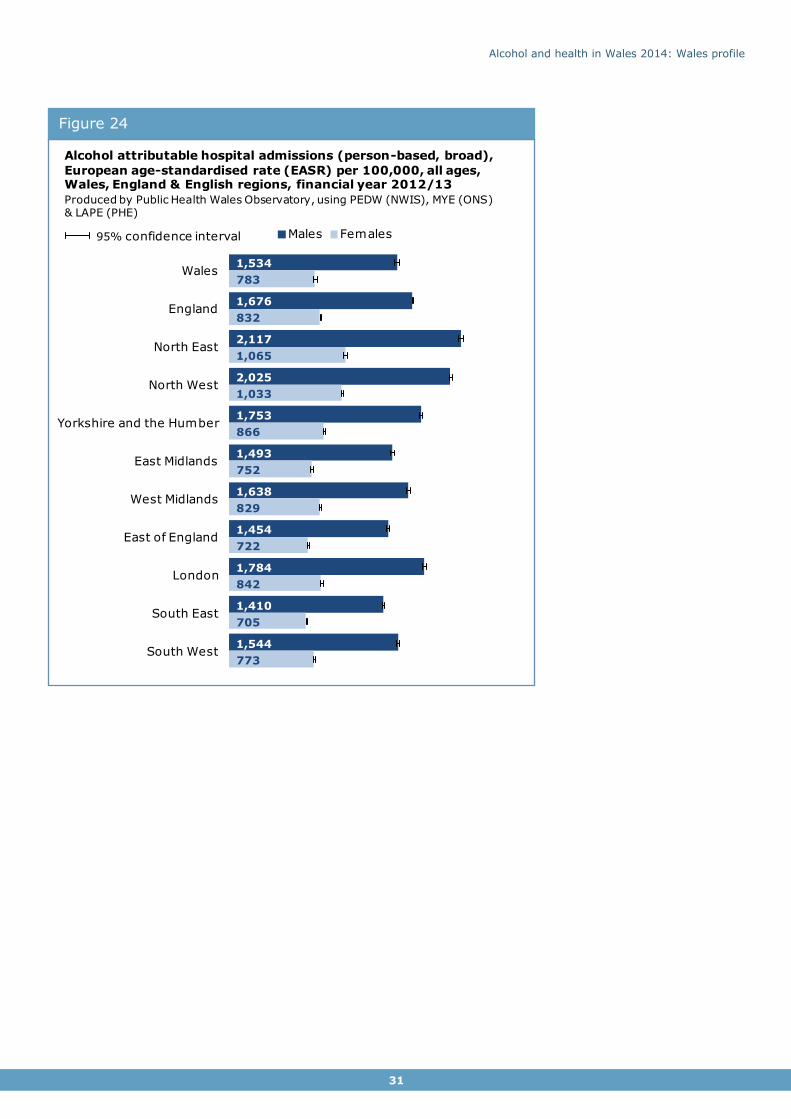
The patterns are similar for alcohol-attributable admissions although the Wales rate for
alcohol-attributable admissions (narrow) is only slightly lower than England. There are small differences in the method or data between the England and Wales rates. For example, English rates only consider patients in English hospitals, whereas the Wales rates include patients
resident in Wales but treated in English hospitals. Also, there are some coding issues where
Figure 20
Alcohol and health in Wales 2014: Wales profile
29
around 2% of hospital spells in Wales in the most recent year do not have a diagnosis coded.
It is not clear how this affects the person-based analysis but it is unlikely to affect the interpretation of the differences greatly. Please see the technical guide for further details of
the methods.
In contrast to rates for all ages, rates in young people aged under 18 in Wales are consistently higher than in England (Figure 22), although all are decreasing. The differences
between them have been narrowing but are still substantial in the most recent period of 2010-12 with a crude rate of 65 per 100,000 in Wales compared to 45 per 100,000 in
England.
Figure 21
457
507
702
740
522
406
472
344
529
376
468
228
232
342
364
244
198
213
172
188
188
238
Wales
England
North East
North West
Yorkshire and the Humber
East Midlands
West Midlands
East of England
London
South East
South West
Males Females
Alcohol-specific hospital admissions, European age-
standardised rate (EASR) per 100,000, all ages, Wales, England & English regions, financial year 2012/13
Produced by Public Health Wales Observatory, using PEDW (NWIS), MYE (ONS) & LAPE (PHE)
95% confidence interval
Alcohol and health in Wales 2014: Wales profile
30
Figure 23
Figure 22
98106
110102
88
7973
65
6863
5752
45
2003/04-2005/06
2004/05-2006/07
2005/06-2007/08
2006/07-2008/09
2007/08-2009/10
2008/09-2010/11
2009/10-2011/12
2010/11-2012/13
Wales England 95% confidence interval
Alcohol-specific hospital admissions, 3-year rolling crude rate per 100,000,
persons aged under 18, Wales & England, financial years 2003/04-2012/13
Produced by Public Health Wales Observatory, using PEDW (NWIS) & MYE (ONS)
562
589
735
721
624
568
578
492
557
496
547
297
306
388
383
317
295
304
264
260
267
303
Wales
England
North East
North West
Yorkshire and the Humber
East Midlands
West Midlands
East of England
London
South East
South West
Males Females
Alcohol-attributable hospital admissions (person-based,
narrow), European age-standardised rate (EASR) per 100,000, all ages, Wales, England & English regions, financial year
2012/13
Produced by Public Health Wales Observatory, using PEDW (NWIS), MYE (ONS) & LAPE (PHE)
95% confidence interval
Alcohol and health in Wales 2014: Wales profile
31
Figure 24
1,534
1,676
2,117
2,025
1,753
1,493
1,638
1,454
1,784
1,410
1,544
783
832
1,065
1,033
866
752
829
722
842
705
773
Wales
England
North East
North West
Yorkshire and the Humber
East Midlands
West Midlands
East of England
London
South East
South West
Males Females
Alcohol attributable hospital admissions (person-based, broad),
European age-standardised rate (EASR) per 100,000, all ages, Wales, England & English regions, financial year 2012/13
Produced by Public Health Wales Observatory, using PEDW (NWIS), MYE (ONS) & LAPE (PHE)
95% confidence interval
Alcohol and health in Wales 2014: Wales profile
32
5 Mortality 5.1 Alcohol-specific and alcohol-attributable mortality
Mortality linked to alcohol can be measured using different definitions. In this report we show alcohol-specific mortality and alcohol-attributable mortality. These are very briefly explained
in table 4, but for further details please see the technical guide.
Table 4 Overview of definitions for mortality indicators
Mortality indicator Brief definition
Alcohol-specific mortality
Includes deaths with an underlying cause of death that is
wholly attributable to alcohol e.g. alcoholic liver disease.
Additional causes of death were added in the revision of
methods.
Alcohol-attributable mortality Includes deaths with an underlying cause of death that is
either wholly or partly attributable to alcohol. Revised
attributable fractions for each cause of death are applied in
the calculation. This wider definition is an estimate based on
fractions assuming they apply equally to Wales.
Public Health England have recently published revised methods for these4. Data using the revised method is not comparable to previously published data. Alcohol-specific mortality has
been produced instead of alcohol-related mortality (ONS definition) in this updated report as it is easily comparable to England and English regions. Socio-economic inequalities in
mortality are examined in Section 6.
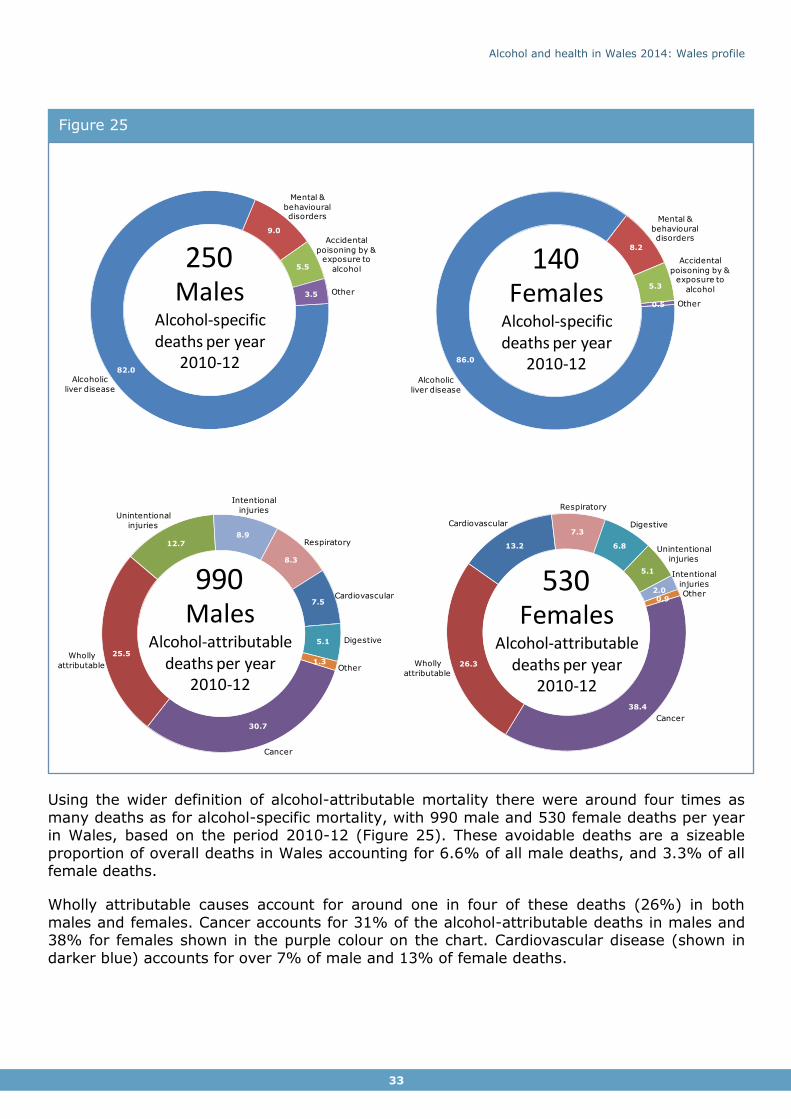
Around 250 males and 140 females die from an alcohol-specific condition per year in Wales, based on the period 2010-12 (Figure 25). Alcoholic liver disease accounts for the majority of
these deaths (82% for males, 86% for females) (Figure 25). Alcohol-specific mortality only includes deaths entirely caused by alcohol, which underestimates the impact of alcohol on
mortality in the population.
Alcohol and health in Wales 2014: Wales profile
33
Using the wider definition of alcohol-attributable mortality there were around four times as
many deaths as for alcohol-specific mortality, with 990 male and 530 female deaths per year in Wales, based on the period 2010-12 (Figure 25). These avoidable deaths are a sizeable
proportion of overall deaths in Wales accounting for 6.6% of all male deaths, and 3.3% of all female deaths.
Wholly attributable causes account for around one in four of these deaths (26%) in both
males and females. Cancer accounts for 31% of the alcohol-attributable deaths in males and 38% for females shown in the purple colour on the chart. Cardiovascular disease (shown in
darker blue) accounts for over 7% of male and 13% of female deaths.
Figure 25
82.0
9.0
5.5
3.5
Alcoholic
liver disease
Other
Mental &
behavioural disorders
Accidental
poisoning by & exposure to
alcohol
MalesAlcohol-specific deaths per year
2010-12
250
86.0
8.2
5.3
0.5
Alcoholic
liver disease
Other
Mental &
behavioural disorders
Accidental
poisoning by & exposure to
alcoholFemalesAlcohol-specific deaths per year
2010-12
140
30.7
25.5
12.78.9
8.3
7.5
5.1
1.3Wholly
attributable Other
Unintentional
injuries
Cancer
Intentional
injuries
Respiratory
Cardiovascular
Digestive
MalesAlcohol-attributable
deaths per year2010-12
990
38.4
26.3
13.2
7.3
6.8
5.1
2.00.9
Wholly
attributable
Other
Unintentional
injuries
Cancer
Intentional
injuries
Respiratory
Cardiovascular Digestive
FemalesAlcohol-attributable
deaths per year2010-12
530

Alcohol and health in Wales 2014: Wales profile
34
Trends over time
Rates vary slightly over time (Figure 26). Alcohol-specific mortality rates for males were rising slowly with the peak in 2007-09. The rates have since declined but overall are still
higher in the most recent period of 2010-12 compared to the earliest in 2003-05. The trend for females shows rates having risen slightly over time. Alcohol-attributable rates also vary a little over time with a slight decrease in recent years. The alcohol-attributable rates in 2010-
12 are slightly lower than in 2003-05 but this small difference is not statistically significant. Mortality rates for males are around twice those for females (Figure 26).
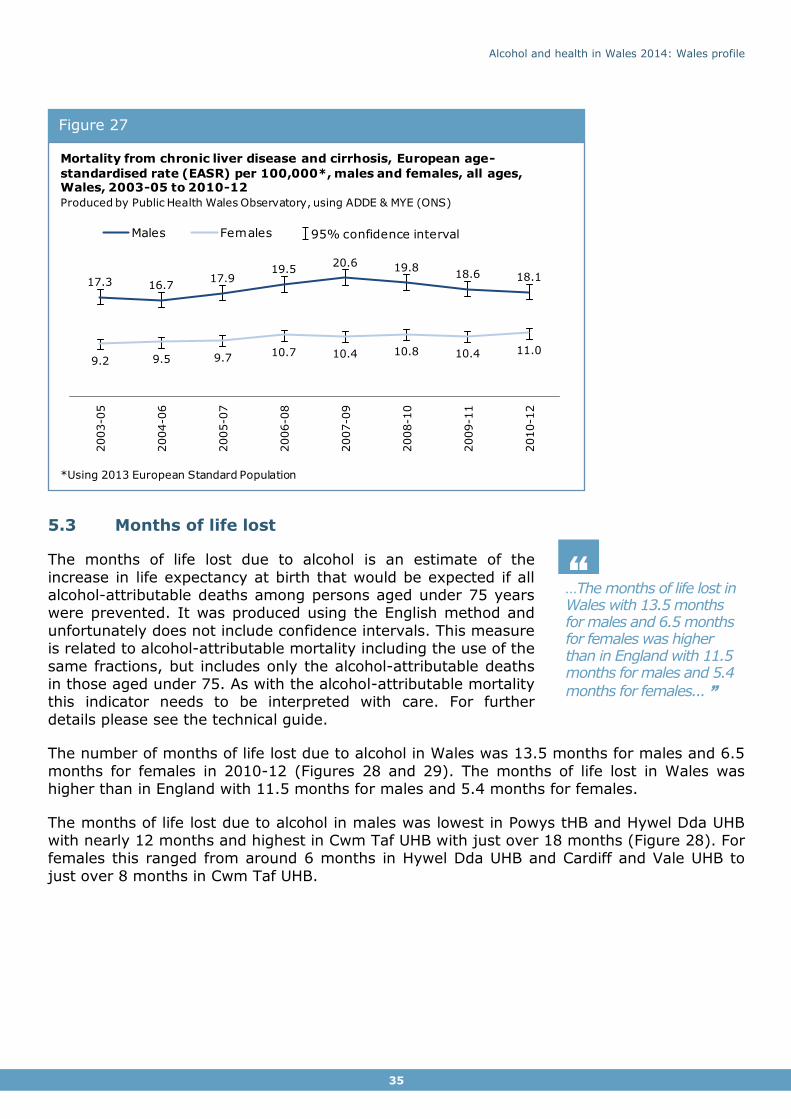
5.2 Chronic liver disease and cirrhosis
Around 260 males and 170 females die from chronic liver disease in Wales per year (based on 2010-12). The majority of these, just over 200 males and 120 females, died from alcoholic liver disease. The remainder have a cause of death of chronic hepatitis (not elsewhere
specified) or fibrosis and cirrhosis of the liver which in the large part of cases is due to alcohol but can also have other causes. There is only slight variation in rates over time and
differences are not statistically significant (Figure 27).
Figure 26
75.9 74.2 76.7 78.4 79.4 77.1 75.0 73.2
33.6 33.3 33.4 34.0 33.5 33.5 32.2 32.5
2003-0
5
2004-0
6
2005-0
7
2006-0
8
2007-0
9
2008-1
0
2009-1
1
2010-1
2
*Using 2013 European Standard Population
15.0 15.316.4
18.0 18.9 18.717.6 17.3
7.6 8.2 8.2 8.9 8.8 9.2 8.6 9.0
Mortality, European age-standardised rate (EASR) per 100,000*, males
and females, all ages, Wales, 2003-05 to 2010-12
Produced by Public Health Wales Observatory, using fractions (PHE), ADDE & MYE (ONS)
Males Females 95% confidence interval
Alcohol-attributable
Alcohol-specific
Alcohol and health in Wales 2014: Wales profile
35
…The months of life lost in Wales with 13.5 months for males and 6.5 months for females was higher than in England with 11.5 months for males and 5.4
months for females... ”
“
5.3 Months of life lost
The months of life lost due to alcohol is an estimate of the
increase in life expectancy at birth that would be expected if all alcohol-attributable deaths among persons aged under 75 years were prevented. It was produced using the English method and
unfortunately does not include confidence intervals. This measure is related to alcohol-attributable mortality including the use of the
same fractions, but includes only the alcohol-attributable deaths in those aged under 75. As with the alcohol-attributable mortality this indicator needs to be interpreted with care. For further
details please see the technical guide.
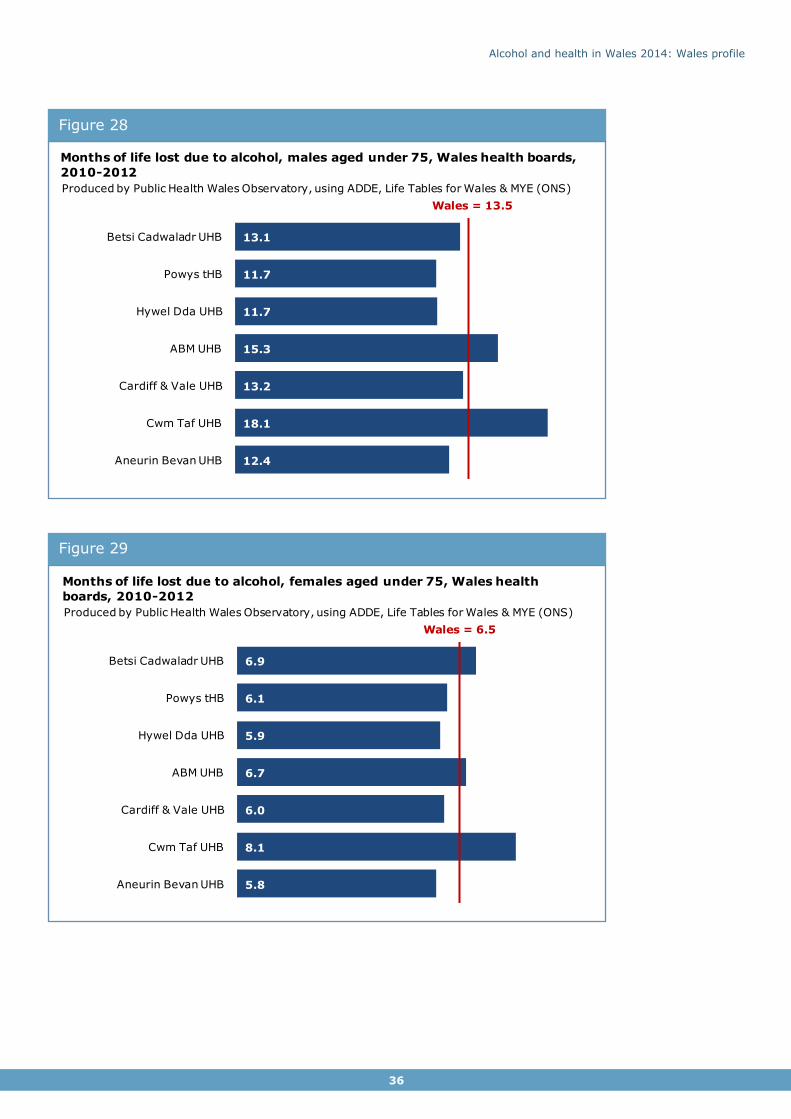
The number of months of life lost due to alcohol in Wales was 13.5 months for males and 6.5
months for females in 2010-12 (Figures 28 and 29). The months of life lost in Wales was higher than in England with 11.5 months for males and 5.4 months for females.
The months of life lost due to alcohol in males was lowest in Powys tHB and Hywel Dda UHB with nearly 12 months and highest in Cwm Taf UHB with just over 18 months (Figure 28). For females this ranged from around 6 months in Hywel Dda UHB and Cardiff and Vale UHB to
just over 8 months in Cwm Taf UHB.
Figure 27
17.3 16.717.9
19.520.6 19.8
18.6 18.1
9.2 9.5 9.710.7 10.4 10.8 10.4 11.0
2003-0
5
2004-0
6
2005-0
7
2006-0
8
2007-0
9
2008-1
0
2009-1
1
2010-1
2
Males Females 95% confidence interval
Mortality from chronic liver disease and cirrhosis, European age-
standardised rate (EASR) per 100,000*, males and females, all ages, Wales, 2003-05 to 2010-12
Produced by Public Health Wales Observatory, using ADDE & MYE (ONS)
*Using 2013 European Standard Population
Alcohol and health in Wales 2014: Wales profile
36
Figure 29
Figure 28
13.1
11.7
11.7
15.3
13.2
18.1
12.4
Wales = 13.5
Betsi Cadwaladr UHB
Powys tHB
Hywel Dda UHB
ABM UHB
Cardiff & Vale UHB
Cwm Taf UHB
Aneurin Bevan UHB
Months of life lost due to alcohol, males aged under 75, Wales health boards,
2010-2012
Produced by Public Health Wales Observatory, using ADDE, Life Tables for Wales & MYE (ONS)
6.9
6.1
5.9
6.7
6.0
8.1
5.8
Wales = 6.5
Betsi Cadwaladr UHB
Powys tHB
Hywel Dda UHB
ABM UHB
Cardiff & Vale UHB
Cwm Taf UHB
Aneurin Bevan UHB
Months of life lost due to alcohol, females aged under 75, Wales health
boards, 2010-2012
Produced by Public Health Wales Observatory, using ADDE, Life Tables for Wales & MYE (ONS)
Alcohol and health in Wales 2014: Wales profile
37
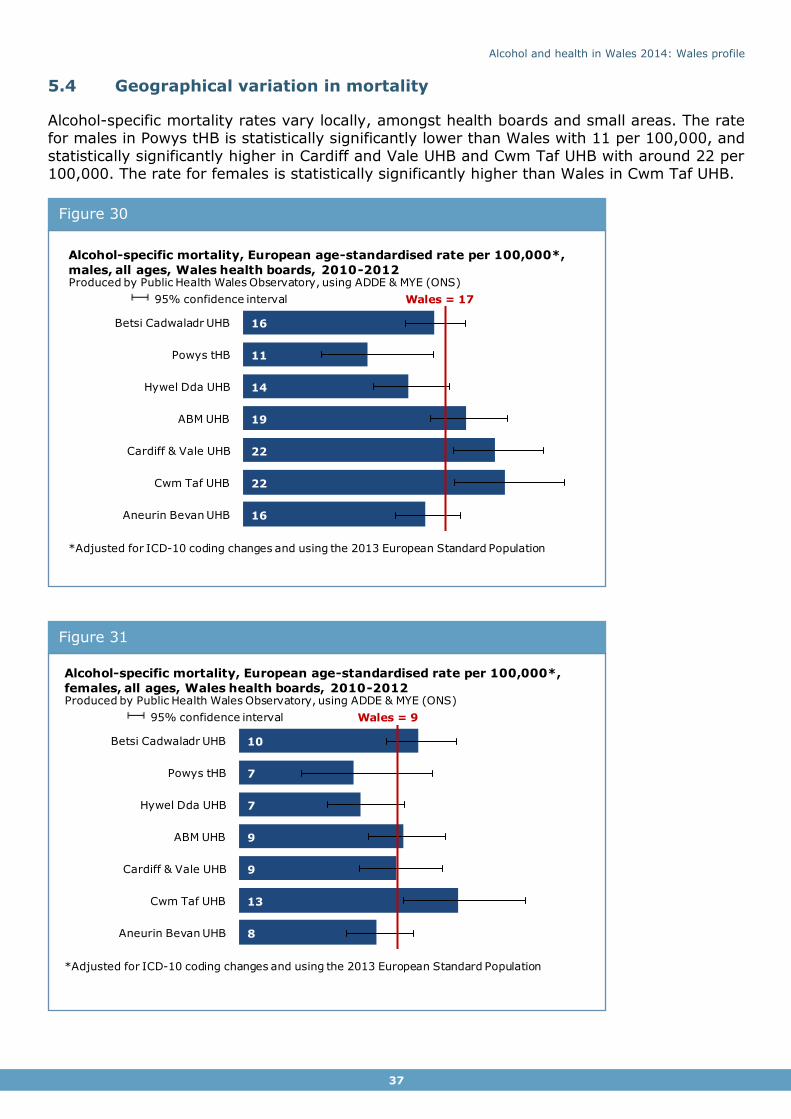
5.4 Geographical variation in mortality
Alcohol-specific mortality rates vary locally, amongst health boards and small areas. The rate for males in Powys tHB is statistically significantly lower than Wales with 11 per 100,000, and
statistically significantly higher in Cardiff and Vale UHB and Cwm Taf UHB with around 22 per 100,000. The rate for females is statistically significantly higher than Wales in Cwm Taf UHB.
Figure 31
Figure 30
16
11
14
19
22
22
16
Wales = 17
Betsi Cadwaladr UHB
Powys tHB
Hywel Dda UHB
ABM UHB
Cardiff & Vale UHB
Cwm Taf UHB
Aneurin Bevan UHB
Alcohol-specific mortality, European age-standardised rate per 100,000*,
males, all ages, Wales health boards, 2010-2012Produced by Public Health Wales Observatory, using ADDE & MYE (ONS)
*Adjusted for ICD-10 coding changes and using the 2013 European Standard Population
95% confidence interval
10
7
7
9
9
13
8
Wales = 9
Betsi Cadwaladr UHB
Powys tHB
Hywel Dda UHB
ABM UHB
Cardiff & Vale UHB
Cwm Taf UHB
Aneurin Bevan UHB
Alcohol-specific mortality, European age-standardised rate per 100,000*,
females, all ages, Wales health boards, 2010-2012Produced by Public Health Wales Observatory, using ADDE & MYE (ONS)
*Adjusted for ICD-10 coding changes and using the 2013 European Standard Population
95% confidence interval
Alcohol and health in Wales 2014: Wales profile
38
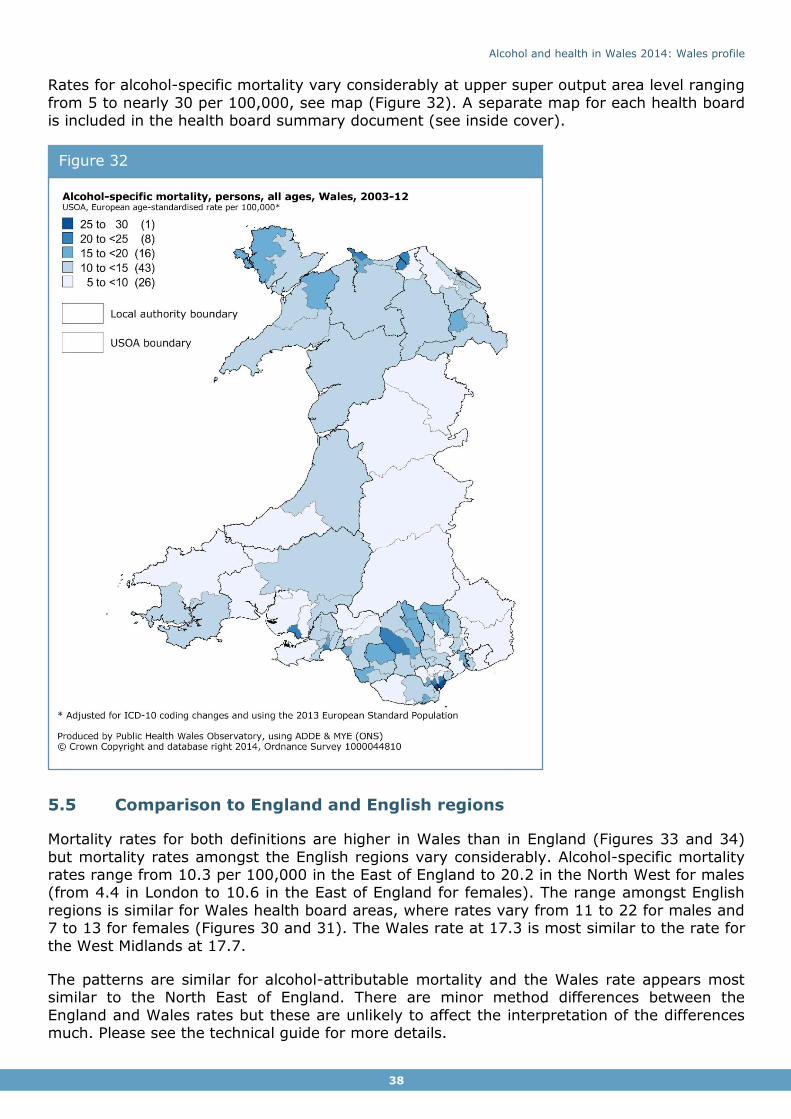
Rates for alcohol-specific mortality vary considerably at upper super output area level ranging
from 5 to nearly 30 per 100,000, see map (Figure 32). A separate map for each health board is included in the health board summary document (see inside cover).
5.5 Comparison to England and English regions
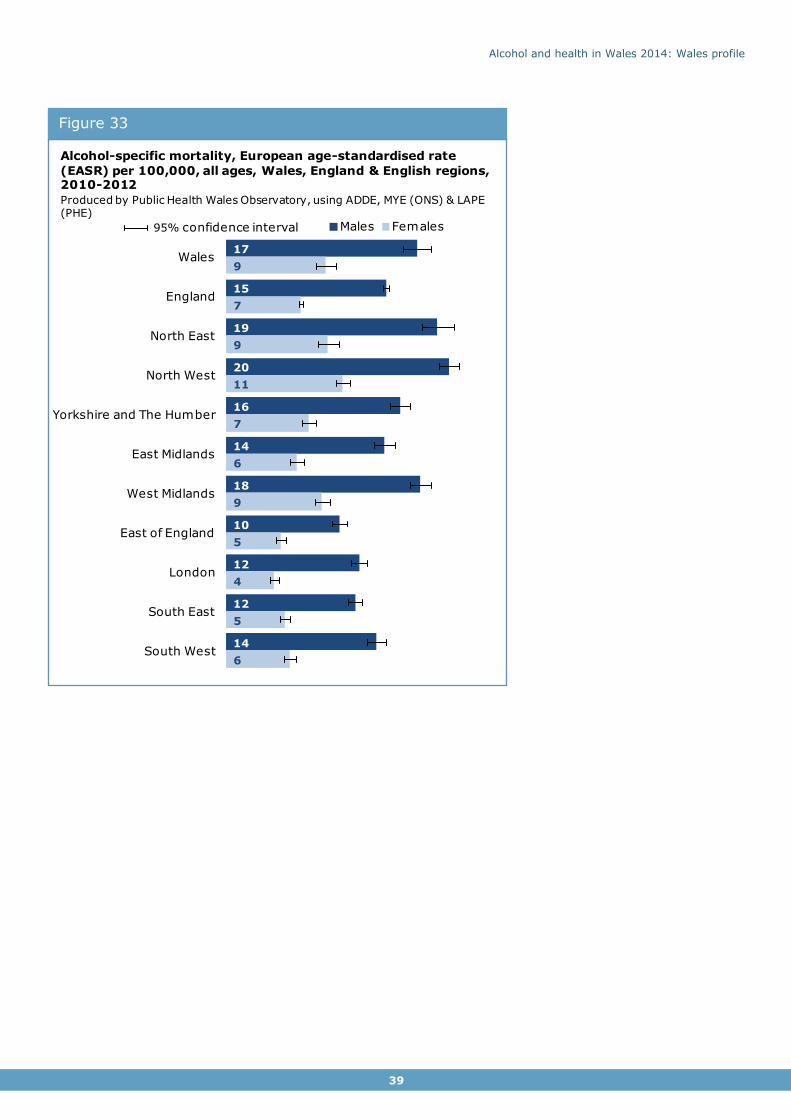
Mortality rates for both definitions are higher in Wales than in England (Figures 33 and 34)
but mortality rates amongst the English regions vary considerably. Alcohol-specific mortality rates range from 10.3 per 100,000 in the East of England to 20.2 in the North West for males (from 4.4 in London to 10.6 in the East of England for females). The range amongst English
regions is similar for Wales health board areas, where rates vary from 11 to 22 for males and 7 to 13 for females (Figures 30 and 31). The Wales rate at 17.3 is most similar to the rate for
the West Midlands at 17.7.
The patterns are similar for alcohol-attributable mortality and the Wales rate appears most similar to the North East of England. There are minor method differences between the
England and Wales rates but these are unlikely to affect the interpretation of the differences much. Please see the technical guide for more details.
Figure 32
Alcohol and health in Wales 2014: Wales profile
39
Figure 33 3
17
15
19
20
16
14
18
10
12
12
14
9
7
9
11
7
6
9
5
4
5
6
Wales
England
North East
North West
Yorkshire and The Humber
East Midlands
West Midlands
East of England
London
South East
South West
Males Females
Alcohol-specific mortality, European age-standardised rate
(EASR) per 100,000, all ages, Wales, England & English regions, 2010-2012
Produced by Public Health Wales Observatory, using ADDE, MYE (ONS) & LAPE (PHE)
95% confidence interval

Alcohol and health in Wales 2014: Wales profile
40
Figure 34
72
63
70
77
67
63
68
54
59
58
60
33
28
31
34
28
29
31
26
25
26
26
Wales
England
North East
North West
Yorkshire and The Humber
East Midlands
West Midlands
East of England
London
South East
South West
Males Females
Alcohol-attributable mortality, European age-standardised rate
(EASR) per 100,000, all ages, Wales, England & English regions, 2012
Produced by Public Health Wales Observatory, using ADDE, MYE (ONS) & LAPE (PHE)
95% confidence interval

Alcohol and health in Wales 2014: Wales profile
41
6 Socio-economic
patterns Alcohol is a source of socio-economic inequalities in health as shown in our previous
publication on inequalities10. This section looks at some key alcohol indicators and their relationship to area deprivation in the absence of suitable individual level socio-economic data. We use the Welsh Index of Multiple Deprivation 2011 (WIMD) to identify ‘fifths’ of
deprivation. The most deprived fifth contains the most deprived 20% of areas and the least deprived fifth the least deprived 20% of areas. As with all area-based deprivation measures,
not everyone living in a deprived area is necessarily living in deprived circumstances and equally, some people living in an area classed as least deprived may experience deprivation.
Generally, we found little difference in alcohol consumption between the deprivation fifths for
heavy (more than 8 units for males, 6 units for females) and very heavy drinking (more than 12 units for males, 9 units for females) (Figures 35 and 36). The exception is heavy drinking
in females which is slightly higher in the least deprived areas (25%) compared to all other deprivation fifths (20%-21%), although this is unlikely to be statistically significant. For heavy drinking and very heavy drinking we therefore found no apparent relationship to deprivation.
There is an inverse relationship for drinking above guidelines (more than 4 units for males, 3 units for females) where the proportion is higher in the least deprived areas (52% in males)
than in the most deprived areas (45% in males). This is slightly stronger in females with 44% in the least deprived areas compared to 32% in the most deprived.
A recent academic study using WHS data (2003/04-2007) found that deprivation acted
differently on the risk of binge drinking between males and females at different age groups11. The proportion of respondents drinking above guidelines showed the same inverse
relationship as in our analysis shown in Figures 35 and 36. In contrast to our results, the study found that binge drinking increased with increasing deprivation11. Our broad analysis looks at all WHS respondents aged 16 and over combined for 2011-2012 and so may mask
different relationships for some age groups, but also covers newer WHS data after the question change and adjustment for strength of drinks from 2008 onwards. The deprivation
measure may also have changed between the WIMD 2005 and the WIMD 2011. These patterns should therefore be interpreted with caution and further analysis would be needed to investigate the differing results.

Alcohol and health in Wales 2014: Wales profile
42
Figure 36
Figure 35
52 49 48 48 4532 32 31 32 3117 17 18 19 17
Least deprived Next least deprived Middle Next most deprived Most deprived
Drinking above guidelines Heavy (binge) drinking Very heavy drinking
Self-reported alcohol consumption, age-standardised percentage by deprivation fifth,
males aged 16+, Wales, 2011-12
Produced by Public Health Wales Observatory, using WHS & WIMD 2011 (WG)
95% confidence interval
44 39 36 34 3225 21 21 21 2013 11 11 13 12
Least deprived Next least deprived Middle Next most deprived Most deprived
Drinking above guidelines Heavy (binge) drinking Very heavy drinking
Self-reported alcohol consumption, age-standardised percentage by deprivation fifth,
females aged 16+, Wales, 2011-12
Produced by Public Health Wales Observatory, using WHS & WIMD 2011 (WG)
95% confidence interval
Alcohol and health in Wales 2014: Wales profile
43
…Mortality and hospital admissions are strongly related to deprivation. In contrast self-reported heavy and very heavy drinking is similar between the
deprivation fifths ...”
“ The pattern in alcohol consumption is in stark contrast to outcomes in
both mortality and hospital admissions which show a strong relationship to deprivation where rates in the most deprived areas are
much higher than in least deprived areas.
This report focuses on the rate ratio, a measure of relative inequality, as it can be compared between causes and between males and females
independent of scale. It is produced by dividing the rate for the most deprived areas by the rate in the least deprived areas. For comparisons
over time the absolute difference between the rates was also considered to ensure consistent interpretation of patterns.
Alcohol-specific indicators are more strongly related to deprivation than
alcohol-attributable indicators. Alcohol-specific mortality and hospital admissions have the largest rate ratios, with the rates in the most deprived areas for males between 3.3 and 4.6
times higher than the rates in the least deprived areas (between 2.5 and 3.1 times higher for females) (Figures 37 and 38).
The rate ratios were lower for alcohol-attributable mortality where the rates for males in the
most deprived areas were around twice those in least deprived areas (around 1.7 times higher for females) (Figure 37). The rate ratio is also higher for males than for females, and
mortality for both definitions is more strongly related to deprivation for males than females.
Inequalities in mortality have not changed significantly since 2003/05. Although there is variation in rates over time, mortality rates have increased overall with only a slight drop in
rates for males in the most recent years (Figure 37). They have increased more in the most deprived compared to the least deprived. The gap has therefore slightly widened, although
due to relatively small numbers of deaths and large confidence intervals this difference is not statistically significant. Changes in the gap for alcohol-attributable mortality are much smaller and similarly not statistically significant.

Alcohol and health in Wales 2014: Wales profile
44
… There is no sign of improvement in the gap in mortality between the most deprived and the least deprived areas over
time... ”
“
Interpreting inequalities trends in hospital admissions is more complex due to the nature of the three different definitions used.
Please see Section 4.1 for a discussion on the definitions or the technical guide for further details. Our analysis covers the
financial years 2003/04 to 2012/13.
The rates of individuals being admitted to hospital with alcohol-specific conditions varies over time, but rates have overall been
rising in both the most and the least deprived areas (Figure 38). The rates had increased relatively more in the most deprived in the first few years and so the
absolute rate difference had been rising. This difference narrowed again in the most recent years to a similar level to the first year. The rate ratio, the relative measure of inequalities, also fluctuated over time, but has dropped in the more recent years. The rate in the most
deprived areas for males has dropped from 4.4 times in the first period to 3.4 times the rate in the least deprived in the most recent period (3.4 to 2.8 in females). Relative inequalities
have therefore narrowed over time, although due to large confidence intervals this difference is not statistically significant in females. This suggests that a decrease in the most deprived
areas in recent years may have contributed to a slight narrowing of inequalities in alcohol-specific hospital admissions.
Figure 37
Alcohol-specific mortality
Mortality by deprivation fifth, European age-standardised rate (EASR) per 100,000*, all ages, Wales, 2003-05 to 2010-12
Produced by Public Health Wales Observatory, using ADDE, MYE (ONS), fractions (PHE) & WIMD 2011 (WG)
*Using the 2013 European Standard Population
3.3 4.6 3.9 3.5 3.4 3.9 4.0 3.60
5
10
15
20
25
30
35
40
45
2003-0
5
2004-0
6
2005-0
7
2006-0
8
2007-0
9
2008-1
0
2009-1
1
2010-1
2
rate ratio
2.5 3.4 3.1 3.1 2.7 2.8 2.8 3.00
5
10
15
20
2003-0
5
2004-0
6
2005-0
7
2006-0
8
2007-0
9
2008-1
0
2009-1
1
2010-1
2
rate ratio
2.0 2.2 2.1 2.1 2.0 2.1 2.1 2.10
20
40
60
80
100
120
140
2003-0
5
2004-0
6
2005-0
7
2006-0
8
2007-0
9
2008-1
0
2009-1
1
2010-1
2
rate ratio
1.6 1.8 1.7 1.7 1.6 1.7 1.7 1.80
10
20
30
40
502003-0
5
2004-0
6
2005-0
7
2006-0
8
2007-0
9
2008-1
0
2009-1
1
2010-1
2
rate ratio
Males
Males
Females
FemalesAlcohol-attributable mortality
95% confidence interval
3.3 4.6 3.9 3.5 3.4 3.9 4.0 3.60
5
10
15
20
25
30
35
40
45
2003-05 2004-06 2005-07 2006-08 2007-09 2008-10 2009-11 2010-12
Most deprived Wales Least deprived
Alcohol specific mortality by deprivation fifth, Eurpoean age-standardised rate (EASR) per
100,000*, males all ages, Wales, 2003-05 to 2010-12Produced by Public Health Wales Observatory, using ADDE, MYE (ONS) & WIMD 2011 (WG)
*Using 2013 European Standard Population
95% confidence interval
Rate ratio

Alcohol and health in Wales 2014: Wales profile
45
…Inequalities in alcohol-specific and alcohol-attributable (narrow) hospital admissions have slightly narrowed over time, but slightly widened for the alcohol-attributable
(broad) admissions... ”
“ The pattern for individuals admitted with alcohol-attributable
conditions using the narrow definition appears similar but far less pronounced with only a very slight narrowing in inequalities that
is not statistically significant (Figure 38). The absolute rate difference and the rate ratio have slightly decreased over time, again due to a larger decrease in rates in the most deprived
areas than in the least deprived most recently.
Some conditions are more linked to deprivation than others and
are more prevalent and therefore contribute differently to inequalities. Although the data is not shown here, wholly attributable conditions made the biggest contribution to inequalities in the narrow admissions,
with mental and behavioural disorders making up the majority of these. Cancer, cardiovascular disease and unintentional injuries had the opposite effect, where the
proportions of individuals admitted with these conditions were higher in least deprived areas and so were causing the inequalities to narrow. Please note that these condition groups only contain certain conditions that are linked to alcohol, for example, only some cardiovascular
diseases. For a list of these please see the technical guide.
The pattern of inequalities is slightly different for individuals admitted with alcohol-
attributable conditions using the broad definition. The rates in most deprived and least deprived areas have consistently risen over time with only slight variation. The rate ratios have fallen slightly from 2.2 to 1.9 for males and females, but the difference in females is not
statistically significant. The absolute rate difference has widened slightly over time, and the reduction in rate ratio is largely down to the rise in rates and the relatively larger rise in the
least deprived areas.
As with the narrow definition discussed earlier, the conditions have different effects on inequalities. Although the data is not shown here, wholly attributable conditions also make
the biggest contribution to inequalities in the broad admissions, with mental and behavioural disorders making up the majority of these. As discussed in Section 4 admissions with
cardiovascular disease as a diagnosis (primary or secondary) make up a large proportion of these admissions, but have a narrowing effect on inequalities. The proportion of individuals admitted with a cardiovascular disease linked to alcohol is actually higher in the least
deprived areas than the most deprived. Please note that the diagnosis may not be the main reason for admission in this definition.
The reasons why the outcomes measures are strongly related to deprivation but not to consumption indicators are unclear. There may be differences in individuals’ drinking patterns in the least and most deprived areas, for example there may be differences in the regularity
of heavy drinking episodes or the actual units consumed above the limit. It may also be that underestimation of consumption in surveys is proportionally greater in deprived areas, or
heavier drinkers are underrepresented in the survey. As discussed earlier our broad analysis may also mask relationships to deprivation by age groups. In addition the pattern in
outcomes due to alcohol may be influenced by other factors such as poorer general health and differences in individuals seeking treatment or help.
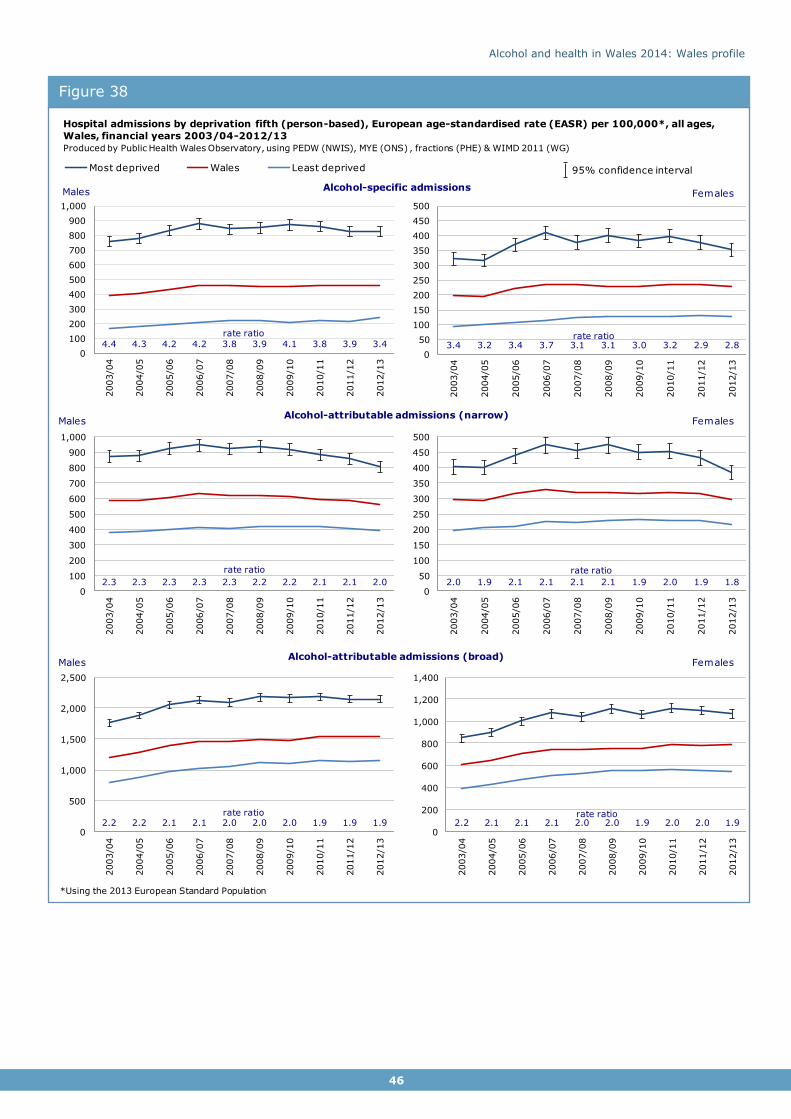
Alcohol and health in Wales 2014: Wales profile
46
Figure 38
Alcohol-specific admissions
Hospital admissions by deprivation fifth (person-based), European age-standardised rate (EASR) per 100,000*, all ages,
Wales, financial years 2003/04-2012/13
Produced by Public Health Wales Observatory, using PEDW (NWIS), MYE (ONS) , fractions (PHE) & WIMD 2011 (WG)
4.4 4.3 4.2 4.2 3.8 3.9 4.1 3.8 3.9 3.40
100
200
300
400
500
600
700
800
900
1,000
2003/0
4
2004/0
5
2005/0
6
2006/0
7
2007/0
8
2008/0
9
2009/1
0
2010/1
1
2011/1
2
2012/1
3
rate ratio
3.4 3.2 3.4 3.7 3.1 3.1 3.0 3.2 2.9 2.80
50
100
150
200
250
300
350
400
450
500
2003/0
4
2004/0
5
2005/0
6
2006/0
7
2007/0
8
2008/0
9
2009/1
0
2010/1
1
2011/1
2
2012/1
3
rate ratio
Males
Males
Females
FemalesAlcohol-attributable admissions (narrow)
*Using the 2013 European Standard Population
2.3 2.3 2.3 2.3 2.3 2.2 2.2 2.1 2.1 2.00
100
200
300
400
500
600
700
800
900
1,000
2003/0
4
2004/0
5
2005/0
6
2006/0
7
2007/0
8
2008/0
9
2009/1
0
2010/1
1
2011/1
2
2012/1
3
rate ratio
2.0 1.9 2.1 2.1 2.1 2.1 1.9 2.0 1.9 1.80
50
100
150
200
250
300
350
400
450
500
2003/0
4
2004/0
5
2005/0
6
2006/0
7
2007/0
8
2008/0
9
2009/1
0
2010/1
1
2011/1
2
2012/1
3
rate ratio
Males FemalesAlcohol-attributable admissions (broad)
2.2 2.2 2.1 2.1 2.0 2.0 2.0 1.9 1.9 1.90
500
1,000
1,500
2,000
2,500
2003/0
4
2004/0
5
2005/0
6
2006/0
7
2007/0
8
2008/0
9
2009/1
0
2010/1
1
2011/1
2
2012/1
3
rate ratio2.2 2.1 2.1 2.1 2.0 2.0 1.9 2.0 2.0 1.9
0
200
400
600
800
1,000
1,200
1,400
2003/0
4
2004/0
5
2005/0
6
2006/0
7
2007/0
8
2008/0
9
2009/1
0
2010/1
1
2011/1
2
2012/1
3
rate ratio
3.3 4.6 3.9 3.5 3.4 3.9 4.0 3.60
5
10
15
20
25
30
35
40
45
2003-05 2004-06 2005-07 2006-08 2007-09 2008-10 2009-11 2010-12
Most deprived Wales Least deprived
Alcohol specific mortality by deprivation fifth, Eurpoean age-standardised rate (EASR) per
100,000*, males all ages, Wales, 2003-05 to 2010-12Produced by Public Health Wales Observatory, using ADDE, MYE (ONS) & WIMD 2011 (WG)
*Using 2013 European Standard Population
95% confidence interval
Rate ratio
95% confidence interval
Alcohol and health in Wales 2014: Wales profile
47
7 References
1. World Health Organisation. Global status report on alcohol and health 2014. Geneva: WHO; 2014. Available at:
http://www.who.int/substance_abuse/publications/global_alcohol_report/en/ [Accessed: 23rd Sep 2014]
2. Welsh Assembly Government. Working together to reduce harm. The substance misuse strategy for Wales 2008-2018. Cardiff: WAG; 2008. Available at: http://wales.gov.uk/topics/people-and-
communities/safety/substancemisuse/publications/strategy0818/?skip=1&lang=en [Accessed: 23rd Sep 2014)
3. Gartner A et al. A profile of alcohol and health in Wales. Cardiff: Wales Centre for Health; 2009. Available at: http://www.wales.nhs.uk/sites3/Documents/749/Alcohol%20Profile%20for%20Wales
%20(E).pdf [Accessed: 23rd Sep 2014] 4. Public Health England. User guide: Local alcohol profiles for England. [Online]. 2014.
Available at: http://www.lape.org.uk/downloads/LAPE%20User%20Guide_Final.pdf [Accessed: 23rd Sep 2014)
5. Jones L, Bellis MA, Updating England-specific alcohol-attributable fractions. Liverpool:
John Moores University; 2014. Available at: http://www.cph.org.uk/wp-content/uploads/2014/03/24892-ALCOHOL-FRACTIONS-REPORT-A4-singles-
24.3.14.pdf [Accessed: 23rd Sep 2014) 6. NHS Choices. Alcohol units. [Online]. 2013. Available at:
http://www.nhs.uk/Livewell/alcohol/Pages/alcohol-units.aspx [Accessed: 23 Sep
2014] 7. NHS Choices. Should my child drink alcohol? [Online]. 2013. Available at:
http://www.nhs.uk/chq/pages/2595.aspx?categoryid=62 [Accessed: 23rd Sept 2014) 8. Goddard E. Obtaining information about drinking through surveys of the general
population. National Statistics Methodology Series No. 24. [Online]. 2001.
http://www.ons.gov.uk/ons/guide-method/method-quality/specific/gss-methodology-series/gss-methodology-series--24--obtaining-information-about-drinking-through-
surveys-of-the-general-population.pdf. [Accessed: 23rd Sep 2014] 9. Catto S, Gibbs D. How much are people in Scotland really drinking? Edinburgh: NHS
Health Scotland, ScotPHO; 2008. Available at:
http://www.scotpho.org.uk/publications/reports-and-papers/491-how-much-are-people-in-scotland-really-drinking-a-review-of-data-from-scotlands-routine-national-
surveys- [Accessed: 23rd Sep 2014] 10.Public Health Wales Observatory, 2011, Measuring inequalities 2011. Trends in
mortality and life expectancy in Wales. Public Health Wales NHS Trust; 2011. Available at: http://www.wales.nhs.uk/sitesplus/922/page/58379 [Accessed: 1st Oct 2014]
11.Fone D et al. Socioeconomic patterning of excess alcohol consumption and binge
drinking: a cross-sectional study of multilevel associations with neighbourhood deprivation. BMJ Open 2013:3:e002337. doi:10.1136/bmjopen-2012-002337.
Available at: http://bmjopen.bmj.com/content/3/4/e002337.full.pdf+html [Accessed: 23rd Sep 2014]