the psychology of uncertainty in scientific data analysis · chapter 19. psychology of uncertainty...
TRANSCRIPT

CHAPTER 19
The Psychology of Uncertainty in Scientific Data Analysis
Christian D. Schunn and J. Gregory Trafton
One of the reasons science is so complex is that it involves many layers of uncertainty, as scientists struggle to convert into fact that which is
not yet understood at all using instruments and techniques recently developed or newly applied. For this reason, the psychology of science is deeply connected to uncertainty, especially with studies of science in real contexts. As a research strategy, psychologists of science have often chosen to study situations with much uncertainty removed. But, in the end, there must be some consideration of how uncertainty complexities the psychology of the scientist, for every layer of science.
Studies of behavior in the real world have consistently found that uncertainty has a large influence on behavior. For example, there is a whole subdiscipline of naturalistic decision making focused on judgment under uncertainty (Klein, 1989). Scientific data analysis, as a relatively complex instance of judgment under uncertainty, similarly has a large role for uncertainty as something that needs to be represented (mentally and physically), as something that needs to be diagnosed in particular situations, and as something that needs to be addressed through problem solving. This chapter will address each of these elements beginning with a large contextual description of what uncertainty is.
WHAT IS UNCERTAINTY?
Uncertainty is not an undifferentiated concept. There is the subjective uncertainty a person feels, and there is the objective uncertainty in the information a person has, which we call information uncertainty. This objective uncertainty could be about the past, current, or future state of the world. Uncertainty in scientific data analysis is primarily about informational uncertainty for the past (i.e., the data in hand). However, as data analysis is often an ongoing iterative component and because the goals of some
461
462 SECTION V. APPLIED PSYCHOLOGIES OF SCIENCE
scientific data analyses involve predictions about the future, there can be informational uncertainty about the future component as well. Regardless of the cause, increases in objective uncertainty in the data makes scientific data analysis much more complex, requiring more time and producing lower rates of success (Gorman, 1986; Klayman, 1986; Penner & Klahr, 1996).
Schunn (2010) argued for a distinction not previously emphasized in discussions of uncertainty: the difference between psychological uncertainty and psychological approximation. Uncertainty is the lack of knowledge about possible states (e.g., is the temperature 18°C or 19°C?). Approximation declares a state as falling with a range (e.g., the temperature is between 18°C and 19°C). At first blush, this distinction appears bizarre and without conceptual merit. From a theoretical information or logical perspective, there is no difference between the two. However, a number of elements suggest it is a critical psychological distinction in science problem solving. Sometimes in science, an approximate level of precision is good enough, whereas sometimes it is not, and the uncertainty versus approximation distinction is critical for differentiating those circumstances. Several different datasets suggest that uncertainty and approximation are discriminable constructs in behavior (from both scientist speech and gestures), that they systematically occur in different places and that common problem solving strategies in science serve primarily to convert from uncertainty into approximation (Trickett & Trafton, 2007; Trickett, Trafton, & Schunn, 2009).
In this chapter, to organize the psychology of science literature on uncertainty and to characterize its bounds, we present comprehensive taxonomies of sources of informational uncertainty, strategies for diagnosing informational uncertainty, and strategies for reducing informational uncertainty. These taxonomies were developed from cognitive anthropological work (Hutchins, 1995; Suchman, 1987) we have done over several years, conducting careful observations of many scientists and scientists in training, working in scientific domains with high levels of informational uncertainty (e.g., astronomers, neuroscientists, physicists, and geologists). It came from hundreds of hours watching researchers analyze their data (Schunn, Saner, Kirschenbaum, Trafton, & Littleton, 2007; Trickett, Fu, Schunn, & Trafton, 2000; Trickett, Trafton, Saner, & Schunn, 2007; Trickett et al., 2009), interviews with dozens of experts about the ways in which uncertainty enters into their domain and how they deal with it, attending colloquia and conferences in the domains, and working with developers (e.g., computer scientists, physicists, and mathematicians) of new visualization tools.
Although the taxonomies were developed from observations of many domains, to be efficient here, it will be presented with concrete examples from two domains: cognitive neuroscience using functional magneti~ re~onance imaging (fMRI) and meteorological forecasting, one more baslC science and one more applied science, which are briefly described first to set the context. The goal of fMRI in cognitive neuroscience is to discover bo~h the location in the brain and the time course of processing underlying different cognitive processes. fMRI is a domain of high uncertainty because it has very noisy data with complex data analysis procedures. The procedure of fMRI is as follows: Imaging data are collected in research fMRI scanners hooked to computers that display experimental stimuli to their human
CHAPTER 19. PSYCHOLOGY OF UNCERTAINTY IN SCIENTIFIC DATA ANALYSIS 463
subjects. Generally, fMRI uses a subtractive logic technique, in which the magnetic activity observed in the brain during one task is subtracted from the magnetic activity observed in the brain during another task, with the assumption that the resulting difference can be attributed to whatever cognitive processes occur in the one task but not the other. Moreover, neuronal activity levels are not directly measured, but rather one measures the changes in magnetic fields associated with oxygen-rich blood relative to oxygendepleted blood. The main measured change is not the depletion due to neuronal activity, but rather the delayed overresponse of new oxygen-rich blood moving to active brain areas. The delay is on the order of 5 seconds, with the delay slightly variable by person and brain area. Data is analyzed visually by superimposing color-coded activity regions over a structural image of the brain, looking at graphs of mean activation level by region and/or over time or across conditions, or looking at tables of mean activation levels by region across conditions. Elaborate, multistepped, semiautomated computational procedures are executed to produce these various visualizations, and given the size of the data (gigabytes per subject), many steps can take up to several minutes per subject. Inferential statistical procedures (e.g., t-test, analysis of variance [ANOVA]) are applied to confirm trends seen visually.
The problem in weather forecasting is that there is considerable uncertainty in meteorology data, both in observations and numerical forecast models. Forecasters must make judgments that account for and accommodate that uncertainty, although uncertainty is not typically displayed in any of their tools. Weather forecasters examine observations, summaries of those observations, and predictive forecast models that use those observations as input. While they do explicitly examine actual observations by examining satellite pictures or local wind speed, the majority of their information comes from tools that summarize or use those observations. They see satellite images and loops uploaded onto the Internet. They view predictions made by complex models with varying underlying assumptions. The models are also based on possibly unreliable or sparsely sampled observations. Weather is also extremely chaotic (the "butterfly effect"), and no current numerical forecasting model is able to accurately depict the complete dynamic structure of the atmosphere. The associated uncertainty, unreliability, data sparsity, and underlying assumptions are not explicitly provided to the forecasters. The forecasters must infer the uncertainty, either from experience and training, or because the values are not stable across time or across different instances of the "same" data (e.g., different weather models). The data are transformed in one of many ways (e.g., direct transformation, modeling, combination, and multiple representations) and displayed to the decision maker as stimuli.
WHY DOES SCIENTIFIC DATA ANALYSIS INVOLVE UNCERTAINTY?
A Taxonomy of Sources of Scientific Uncertainty
There are several taxonomies of sources of uncertainty in existence. Some come from psychology and judgment and decision-making research
464 SECTION V. APPLIED PSYCHOLOGIES OF SCIENCE
(Berkeley & Humphreys, 1982; Howell & Burnett, 1978; Kahneman & Tversky, 1982; Krivohlavy, 1970; Lipshitz & Strauss, 1997; Musgrave & Gerritz, 1968; Trope, 1978). Others come from a broad array of particular disciplines, such as geography (Abbaspour, Delavar, & Batouli, 2003), finance (Rowe, 1994), law (Walker, 1991, 1998), medicine (Brashers et al., 2003; Hall, 2002), consumer choice (Sheer & Cline, 1995; Urbany, Dickson, & Wilkie, 1989), negotiation (Bottom, 1998), and military tactics (Cohen, Freeman, & Thompson, 1998). The taxonomies from the disciplines are typically armchair analyses rather than from observations of experts in the field.
We divide sources of information uncertainty into four broad classes: physics uncertainty, computational uncertainty, visualization uncertainty, and cognitive uncertainty. Experimental studies of uncertainty in scientific problem solving have focused on just a small subset of these sources; our taxonomy shows that informational uncertainty stems from many different complex sources and is the norm in science.
Physics Uncertainty
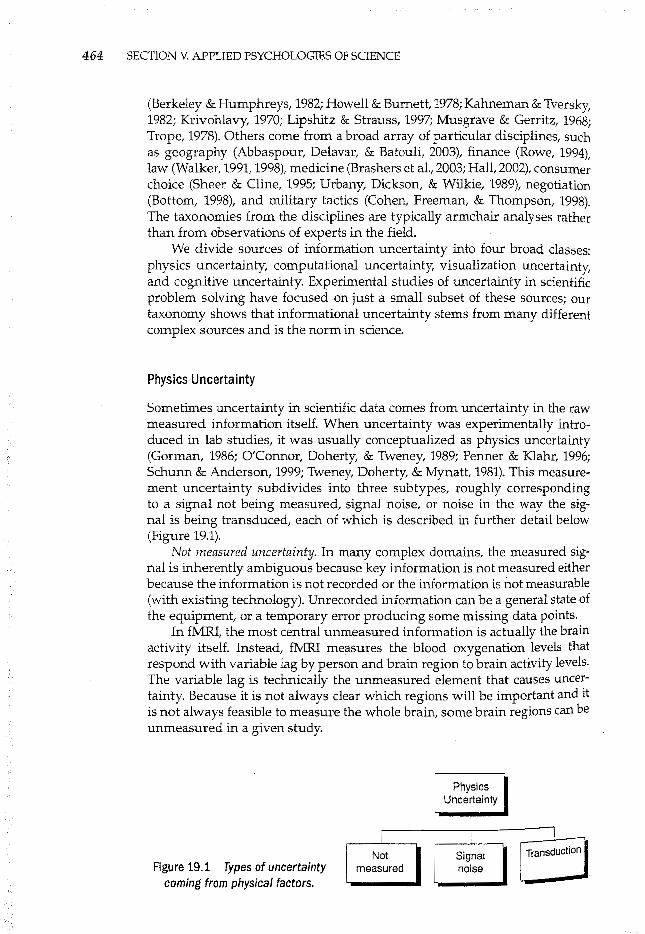
Sometimes uncertainty in scientific data comes from uncertainty in the raw measured information itself. When uncertainty was experimentally introduced in lab studies, it was usually conceptualized as physics uncertainty (Gorman, 1986; O'Connor, Doherty, & Tweney, 1989; Penner & Klahr, 1996; Schunn & Anderson, 1999; Tweney, Doherty, & Mynatt, 1981). This measurement uncertainty subdivides into three subtypes, roughly corresponding to a signal not being measured, signal noise, or noise in the way the signal is being transduced, each of which is described in further detail below (Figure 19.1).
Not measured uncertainty. In many complex domains, the measured signal is inherently ambiguous because key information is not measured either because the information is not recorded or the information is not measurable (with existing technology). Unrecorded information can be a general state of the equipment, or a temporary error producing some missing data points.
In fMRI, the most central unmeasured information is actually the brain activity itself. Instead, fMRI measures the blood oxygenation levels that respond with variable lag by person and brain region to brain activity levels. The variable lag is technically the unmeasured element that causes uncertainty. Because it is not always clear which regions will be important and it is not always feasible to measure the whole brain, some brain regions can be unmeasured in a given study.
Figure 19.1 Types of uncertainty coming from physical factors.
I Not
measured
Physics Uncertainty
I L
Signal noise
i -- .
I Transduction
-

CHAPTER 19. PSYCHOLOGY OF UNCERTAINTY IN SCIENTIFIC DATA ANALYSIS 465
In weather forecasting, weather models make very detailed predictions using previous measurements. These measurements can be very sparse due to weather satellite blind spots and other measurement device placements (especially at sea); point observations may not be very representative of what happens outside the point.
Signal noise uncertainty. The information signal, before it reaches the measurement device, can have stochastic variability, unknown levels of bias, and extraneous signal sources, which introduces additional information uncertainty. In fMRI, electromagnetic noise in the surrounding environment, the participant's body beyond the brain (especially the eyes), and the way the signal moves from the brain through the skull introduce considerable signal noise uncertainty. The bias produced from some of these effects is only partially predictable (e.g., there are weaker signals from deeper in the brain, and there are artifactual signals near the eyes due to eye movements). In weather forecasting, cloud base height (the bottom of the cloud deck) and cloud height are measured by a device called a ceilometer. The ceilometer measures particulates in the atmosphere and, thus, smoke, dust, and even precipitation can lead to an inaccurate reading. The reading may also be erroneous if there is a small break in the clouds above the instrument. Such problems are not the fault of the measurement device, but inherent in a noisy signal.
Transduction uncertainty. The third subtype of physical uncertainty is a function of the measurement device itself. In the process of transduction (converting incoming physical energies such as light, sound, magnetic fields, and heat into data), a measurement device may reduce the quality of the incoming information by simply misreading an incoming signal or compressing dimensionality. Alternatively, the instrument might just fail for a period of time; this form of transduction uncertainty appears to be especially difficult to resolve (O'Connor et al., 1989).
In fMRI, even the latest equipment is still not as spatially precise as some researchers would like and not as temporally precise as other researchers would like. Further, many fMRI researchers share the very expensive device, and this high-use equipment can move out of alignment across participants. In weather forecasting, a radiosonde (weather balloon) may transmit uncertain information about relative humidity under some situations. When the radiosonde gets very dry or very cold, its ability to transmit accurate relative humidity degrades by more than 10%.
Computational Uncertainty
When large amounts of data are measured, many scientists use a number of potentially elaborate computation procedures on that data before they see the data. These computational procedures can add new sources of uncertainty in three general ways (Figure 19.2). Psychology -of science has tended to ignore this source of uncertainty.
Future prediction uncertainty. Data is collected at a certain point in time, and the world continues to change beyond that point in time. The computational procedures either make no corrections for these changes or they make only partially accurate corrections, and this introduces a potentially large

466 SECTION V. APPLIED PSYCHOLOGIES OF SCIENCE
Figure 19.2 Types of uncertainty coming from computational factors.
Computational uncertainty
I I I
Future Statistical prediction artifact
I I
Aggregation/ Statistical smoothing assumption
..
I Fast+ cheap
source of uncertainty. Weather forecasting has a large degree of future prediction uncertainty because the forecasters must make predictions for times that are hours, days, weeks, or even months away. In fMRI, brain structural images are collected typically only at the beginning of a scanning session. These structural images are crucial for interpreting the functional location of a given area of activation. Yet, the head often moves slightly during the experiment and the brain itself undergoes minor deformations over time (e.g., the areas near the nasal passages deform during breathing). These changes over time since last measurement introduce uncertainty into the analyses.
Statistical artifact uncertainty. Many statistical algorithms/procedures are applied to scientific data to deal with physics or future prediction uncertainty. These statistical algorithms have the potential of introducing artifacts in the displayed data. We distinguish two main subtypes of statistical artifact uncertainty.
The first subtype is aggregation/smoothing uncertainty that removes real features from the data. Statistical algorithms typically try to find a simpler, smoother underlying explanation of the data, filtering out "noise" and possibly aggregating data across larger spatial or time scales than when the data was collected. However, sometimes the features being filtered out are in fact real features of the external world rather than noise. In weather forecasting, microclimates occur in protected valleys, atop high mountains, adjacent to large bodies of water, and so on. These may be more sharply defined than the analysis model predicts. In fMRI, the search for activated regions uses a statistical thresholding procedure that can require sustained activation. acr?ss time and across adjacent areas. Thus, single, very small areas of act1vatton are removed by this procedure.
The second subtype is statistical assumption uncertainty. To infer underlying properties or to further filter out the noise, the computational algorithms/procedures often depend upon certain statistical assumptions. T?ese assumptions can be globally very accurate (i.e., correct most of the twe), ?ut locally inaccurate (i.~., untrue for a particular time and place). They~ mtroduce false features mto the data, as well as remove true features. most common statistical assumptions across domains are linearity (changes over time and space are linear) and persistence (things tend to stay the same

CHAPTER 19. PSYCHOLOGY OF UNCERTAINTY IN SCIENTIFIC DATA ANALYSIS 467
over small units of time). In weather forecasting, a good predictor of future weather is current weather. Thus, persistence is included into weather models and all weather models make heavy use of the current weather in their predictions. Yet on a local basis, some areas can change weather much more quickly than the models would normally predict. In fMRI, there are algorithms that correct for head motion. The algorithms often assume linear movement over time (e.g., a head gradually sinking into a pillow). Yet, head movements can often be nonlinear (e.g., sudden or back-and-forth).
Fast+cheap uncertainty. In many complex domains, there exist elaborate algorithms that have very high levels of accuracy. Unfortunately, even on modern high-power computers, these elaborate algorithms require considerable time to complete and often longer than the problem solver usually wants to wait. Thus, in these scientific domains, there exist many algorithms that are more approximate in accuracy but much faster to run.
In fMRI, data analysis is very much an iterative process. Before conducting the most detailed and accurate analyses, researchers will typically use more approximate but significantly faster analyses. In weather forecasting, some weather models use exact, micro models of the physics of weather change, but it is not possible to run such models for even medium-sized regions. The time to run the algorithms for even medium-sized regions would introduce additional future prediction uncertainty because it will have been a long time since the last data input to the model.
Visualization Uncertainty
After data are measured and processed through procedures and algorithms, the information must be conveyed somehow to the problem solver, most typically with a visualization (e.g., map, table, graph). Correspondingly, a large spectrum of psychology of science work falls under the use of visual representations (Shah & Hoeffner, 2002). But sometimes the visualizations introduce informational uncertainty about what information can be logically derived from a visualization (this section), or uncertainty regarding human errors or confusions about how to interpret information from the visualization (see the next section on cognitive uncertainty) (Figure 19.3).
Non represented information. The most obvious form of visualization uncertainty occurs when information (that is logically necessary for developing an accurate understanding of a situation) is missing from the visualization entirely. In fMRI, sometimes key regions of activation may be missing from the current visualization because a subset of the brain slices is being displayed. In weather forecasting, some of the displayed measures are not very stable over the time window being displayed, but the visualization provides no information about the certainty of the displayed means.
Composite information uncertainty. Sometimes multiple dimensions that are typically correlated in value are represented with a single composite measure. When the functional combination and the correlation among values are not perfect, this composite measure introduces uncertainty. The most common composite is one that shows a combination of duration and amount so that one does not know whether it was actually a very large amount for a small percentage of the given time interval, or a smaller amount for the

468 SECTION V. APPLIED PSYCHOLOGIES OF SCIENCE
Figure 19.3 Sources of uncertainty in science coming
from the visualizations.
I Non-
represented
Visualization I uncertainty
1 I l
Composite Inconsistent information information
full time interval. In fMRI, one sometimes has tables that show total signal change of an area (relative to baseline); one does not know whether just a few voxels are very active or whether many voxels are moderately active. In weather forecasting, the display of rain levels does not tell you whether it was 1 em of rain gradually over 10 minutes, or an onslaught of 1 em in 1 minute followed by 9 minutes of no rain.
Inconsistent information uncertainty. In many complex domains, there are multiple visualizations shown at the same time. Similar to the joke about the man with two watches never knowing what time it is, multiple displays produce uncertainty when the displays do not match. In weather forecasting, the forecaster frequently examines predictions of different models and these predictions often do not agree in all their details. In fMRI, there are different ways of slicing the data. For example, one can examine which regions activate by time or which regions activate by condition. Sometimes these different visualizations do not agree.
Cognitive Uncertainty
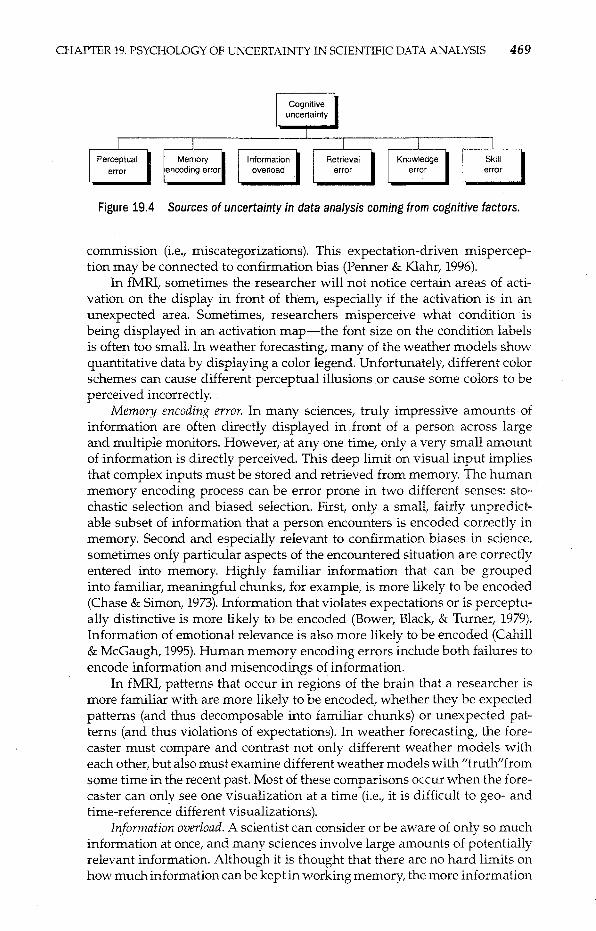
In most psychology of science investigations of uncertainty, the uncertainty sources that were explicitly discussed were external, as in the previous categories. However, humans are a key part of the information system, especially in the complexity of science situations. Humans act as encoding devices, information storage/retrieval devices, and procedure enactors. Correspondingly, they are also a common source of information uncertainty, as possible errors can be introduced in encoding, retrieval, or procedural enactment. In fact, one reaction to external uncertainty is to attribute it to cognitive factors like misencoding or other human error (Chinn & Brewer, 1992). Cognitive uncertainty can reside in the focal problem solver or it can come from the information that team members provide (Hutchins, 1995) (Figure 19.4).
Perceptual error. Early astronomers noted a human perceptual source of uncertainty, referring to a "personal equation" (Schaffer, 1988). In general, information from measurement devices and computers is conveyed to the scientist through perceptual input, typically visually. The scientist must then perceive this information, which includes a transduction process, an attention process and a pattern recognition process. Each step of perception. ~an introduce errors. Particularly important to science, the pattern recogmt: process is highly influenced by experience (Biederman, 1987; Polk & Far f 1995) and expectations (Brewer & Treyens, 1981) and can produce errors
0£
omission (i.e., failure to categorize a present complex object) and errors 0
CHAPTER 19. PSYCHOLOGY OF UNCERTAINTY IN SCIENTIFIC DATA ANALYSIS 469
Figure 19.4 Sources of uncertainty in data analysis coming from cognitive factors.
commission (i.e., miscategorizations). This expectation-driven misperception may be connected to confirmation bias (Penner & Klahr, 1996).
In fMRI, sometimes the researcher will not notice certain areas of activation on the display in front of them, especially if the activation is in an unexpected area. Sometimes, researchers misperceive what condition is being displayed in an activation map-the font size on the condition labels is often too small. In weather forecasting, many of the weather models show quantitative data by displaying a color legend. Unfortunately, different color schemes can cause different perceptual illusions or cause some colors to be perceived incorrectly.
Memory encoding error. In many sciences, truly impressive amounts of information are often directly displayed in front of a person across large and multiple monitors. However, at any one time, only a very small amount of information is directly perceived. This deep limit on visual input implies that complex inputs must be stored and retrieved from memory. The human memory encoding process can be error prone in two different senses: stochastic selection and biased selection. First, only a small, fairly unpredictable subset of information that a person encounters is encoded correctly in memory. Second and especially relevant to confirmation biases in science, sometimes only particular aspects of the encountered situation are correctly entered into memory. Highly familiar information that can be grouped into familiar, meaningful chunks, for example, is more likely to be encoded (Chase & Simon, 1973). Information that violates expectations or is perceptually distinctive is more likely to be encoded (Bower, Black, & Turner, 1979). Information of emotional relevance is also more likely to be encoded (Cahill & McGaugh, 1995). Human memory encoding errors include both failures to encode information and misencodings of information.
In fMRI, patterns that occur in regions of the brain that a researcher is more familiar with are more likely to be encoded, whether they be expected patterns (and thus decomposable into familiar chunks) or unexpected patterns (and thus violations of expectations). In weather forecasting, the forecaster must compare and contrast not only different weather models with each other, but also must examine different weather models with "truth" from some time in the recent past. Most of these comparisons occur when the forecaster can only see one visualization at a time (i.e., it is difficult to geo- and time-reference different visualizations).
Information overload. A scientist can consider or be aware of only so much information at once, and many sciences involve large amounts of potentially relevant information. Although it is thought that there are no hard limits on how much information can be kept in working memory, the more information
470 SECTION V. APPLIED PSYCHOLOGIES OF SCIENCE
that is kept in working memory, the harder it is to rehearse all the elements to keep them there. By organizing information into templates for a particular situation (e.g., like the method of loci), experts are able to include keep truly impressive amounts of information in working memory. However, even expert working memory has clear limits that complex domains often exceed, and disconfirming evidence that does not "fit" into an overall model might be more likely to be dropped.
In fMRI, there are many regions of the brain that can become active, and most thought processes activate a number of areas in the brain. A given participant's brain activation is displayed across 10 to 30 brain slice images, and a given study often has 10 or more participants. In weather forecasting, the forecaster has access to thousands of weather visualizations showing different weather models, blends, satellite images, time courses, and so on. Because many of these variables interact with other variables at different geographical or atmospheric levels, the forecaster needs to keep track not only of different weather models, but also different variables within each weather model.
Retrieval error. Once information is actually encoded in memory there is no guarantee the information will be retrieved at a later point in time due to either inference and/or decay processes (Baddeley & Scott, 1971; Gillund & Shiffrin, 1984). Moreover, not only can information fail to be retrieved at all but also erroneous information could be retrieved instead. In either case, the retrieval errors might reflect a stochastic factor reflecting neural firing variability, or a bias toward remembering particular information (e.g., consistent with current expectations or the current theory under test, or more recently or frequently encountered information).
In fMRI, data from participants are often examined from one participant at a time because each participant can generate gigabytes of data and the computers can often process only one participant at a time. These memory retrievals for across-participant comparisons are prone to error, and researchers will bring back on the screen old images (or recompute images) to double check for such errors. In weather forecasting, forecasters will frequently attempt to retrieve a similar situation to the current forecasting problem. For example, a hurricane forecaster may attempt to retrieve a similar case but because there are very few tools for this kind of case-based reasoning, the forecaster's memory will likely be quite faulty.
Background knowledge error. Uncertainty can also be caused by failing to bring in appropriate background knowledge that changes the interpretation or prediction for a particular situation. These errors contrast with retrieval errors in that retrieval errors are information about a particular state of the world, whereas background knowledge errors are either a lack of knowledge or failed retrievals of knowledge about the general state of the world. In general, the same factors that produce episodic memory retrieval err~rs also produce semantic memory retrieval errors, and similarly confirmatiOn biases can influence data analysis through selective retrieval of relevant semantic memories.
In fMRI, even experts will forget what particular regions on a brain map are. There are several different taxonomies for labeling brain are~s, a_nd r:; ticular researchers specialize in particular brain circuits. But activatiOn. t ~ occurs in a new experiment could involve a region not previously examme
CHAPTER 19. PSYCHOLOGY OF UNCERTAINTY IN SCIENTIFIC DATA ANALYSIS 471
by the particular researcher. In weather forecasting, background knowledge is required to adjust weather predictions, and experts sometimes forget (or not have) the relevant background knowledge for a particular situation. For example, one might not know that a given power plant is off on Sundays and this changes local weather patterns.
Skill error. Uncertainty can also arise from procedural errors in the data transformation or interpretation processes. For example, the scientist may fail to do a mental or external transformation step. Here the informational uncertainty is whether the transformation was done, not the error itself. Skill errors are more likely to occur in steps that are less practiced (Singley & Anderson, 1989; Woodrow & Stott, 1936), less recently practiced (Kyllonen & Alluisi, 1987), or when hurried (Grice & Spiker, 1979), fatigued (Krueger, 1994), or stressed (Alkov, Gaynor, & Borowsky, 1985; Beilcock & Carr, 2001).
In fMRI, the analysis process has many steps, is quite complex, has procedures that can vary depending on the situation, and is continually changing as new procedures are being introduced. Many researchers immediately want to use the latest innovations in analysis techniques. As a result, they will put up with having to do many steps by hand and suffer poorly designed and poorly documented software. In weather forecasting, coordination of weather models can be complex and errors occur in this coordination process. For example, predictions from the global weather model are provided as inputs to the mesoscale model. Sometimes forecasters, in their haste to develop a prediction, fail to verify accuracy of the global inputs before running the mesoscale model, or they (mistakenly) assume that their partner already validated the global inputs.
INDICATORS OF UNCERTAINTY IN SCIENTIFIC DATA ANALYSIS
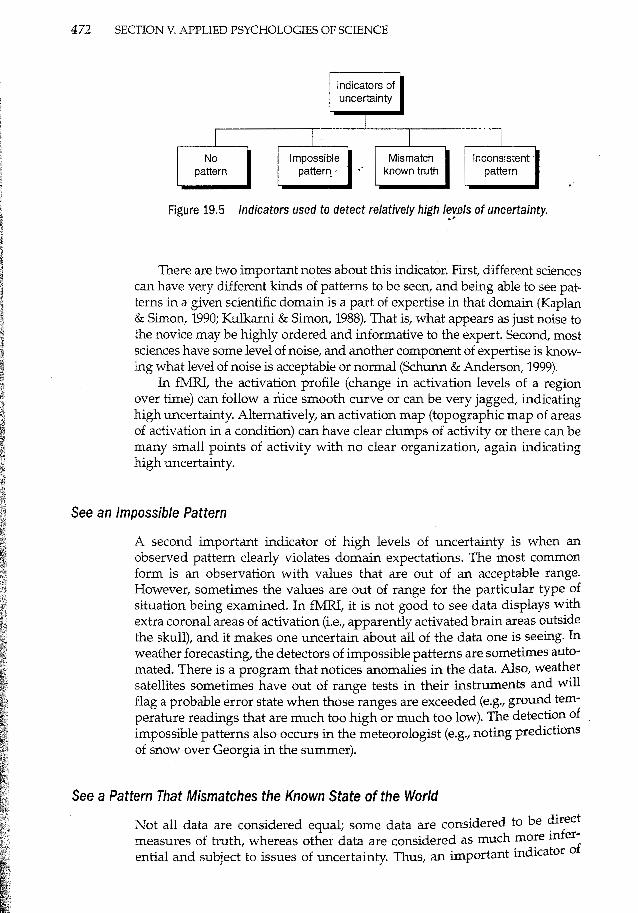
Although scientific data always have some level of informational uncertainty in them, the level of uncertainty does fluctuate over time. Indeed, one dimension of expertise is the ability to detect moments of relatively high uncertainty in data analysis (Schunn, 2010; Schunn & Anderson, 1999; Schunn et al., 2007). What kind of indicators do scientists use to track the level of informational uncertainty? Our cognitive anthropology suggests there are four general kinds of indicators that scientists can use, which can be cast in terms of a general process of trying to find meaningful patterns in the data (see Figure 19.5), although they al.so allow for systematic biases to be introduced by the scientists.
See No or Unusually Weak Pattern
Not seeing any pattern or highly noisy patterns in data are good indicators of informational uncertainty. The world around us contains innumerable patterns at various levels, and when we do not see patterns in the data, we have good grounds to be suspicious of what we are seeing-perhaps the sensory equipment is broken or disconnected, perhaps an analysis transformation step was forgotten, and so on.
472 SECTION V. APPLIED PSYCHOLOGIES OF SCIENCE
Indicators of uncertainty
I I I I I
No Impossible Mismatch Inconsistent · pattern pattern known truth pattern
Figure 19.5 Indicators used to detect relatively high lev.els of uncertainty. •'
There are two important notes about this indicator. First, different sciences can have very different kinds of patterns to be seen, and being able to see patterns in a given scientific domain is a part of expertise in that domain (Kaplan & Simon, 1990; Kulkarni & Simon, 1988). That is, what appears as just noise to the novice may be highly ordered and informative to the expert. Second, most sciences have some level of noise, and another component of expertise is knowing what level of noise is acceptable or normal (Schunn & Anderson, 1999).
In fMRI, the activation profile (change in activation levels of a region over time) can follow a nice smooth curve or can be very jagged, indicating high uncertainty. Alternatively, an activation map (topographic map of areas of activation in a condition) can have clear clumps of activity or there can be many small points of activity with no clear organization, again indicating high uncertainty.
See an Impossible Pattern
A second important indicator of high levels of uncertainty is when an observed pattern clearly violates domain expectations. The most common form is an observation with values that are out of an acceptable range. However, sometimes the values are out of range for the particular type of situation being examined. In fMRI, it is not good to see data displays with extra coronal areas of activation (i.e., apparently activated brain areas outside the skull), and it makes one uncertain about all of the data one is seeing. In weather forecasting, the detectors of impossible patterns are sometimes automated. There is a program that notices anomalies in the data. Also, weather satellites sometimes have out of range tests in their instruments and will flag a probable error state when those ranges are exceeded (e.g., ground temperature readings that are much too high or much too low). The detection of impossible patterns also occurs in the meteorologist (e.g., noting predictions of snow over Georgia in the summer).
See a Pattern That Mismatches the Known State of the World
Not all data are considered equal; some data are considered to be ~irect measures of truth, whereas other data are considered as much more mfer~ ential and subject to issues of uncertainty. Thus, an important indicator 0
CHAPTER 19. PSYCHOLOGY OF UNCERTAINTY IN SCIENTIFIC DATA ANALYSIS 473
uncertainty is when a pattern from one of the less direct measures mismatches the pattern considered a known state of the world-it makes the problem solver doubt all of the patterns being currently displayed in the mismatching display. The difference between mismatching the known state of the world and being an impossible pattern is that the impossible pattern requires no reference to other data collection or manipulation of the world, whereas the mismatch to the known state of the world does require reference to some other data about the current state that is considered truth. One of the strongest forms of known truth comes from a manipulation of the environment-if the problem solver manipulates the environment, the problem solver may have very clear expectations for some of the impacts of this manipulation and these expectations are considered a known truth about the state of the world (cf. Baker and Dunbar [2000] on known control trials). But sometimes the current facts and laws in science that are taken as known truths are not completely accurate, and requiring all new data to fit existing facts and laws can be problematic. Even more problematic is the case when a scientist considers his or her own theory as a "fact," ignoring disconfirming evidence (Chinn & Brewer, 1992; Mitro££, 1974).
In fMRI, good researchers typically include validity tests in their designs-conditions for which the impact on brain activation is so well established that it is treated as a known. For example, one might have a simple visual stimulus and expect to see activation in early visual areas of the brain. In weather forecasting, there is less opportunity for manipulation but some sources of data are considered truth. For example, forecasters will sometimes overlay weather model predictions for a current or past time on top of a satellite image for that same time to see whether the weather model predictions match the current "truth."
See a Pattern That Is Inconsistent Across Data Sources
Finally, scientists can also use mismatches across multiple (equal status) data sources or (equal status) analysis methods. If a mismatch across data sources or analysis methods is detected, then data from all sources/methods are considered uncertain until further problem solving resolves which source is more likely to be correct. In fMRI, a scientist might use different analysis procedures and see whether the different analysis procedures produce similar results. In weather forecasting, forecasters will compare different data sources (e.g., National Oceanic and Atmospheric Administration [NOAA] vs. Navy sources) or different weather model predictions.
TAXONOMY OF STRATEGIES FOR DEALING WITH UNCERTAINTY
Having diagnosed the situation as being uncertain, what kind of strategies do scientists use to deal with uncertainty? In scientific data with high levels of uncertainty, much of problem solving can be focused on reducing uncertainty. In generat actively manipulating one's environment allows for greater

474 SECTION V. APPLIED PSYCHOLOGIES OF SCIENCE
success in finding patterns in uncertainty data (Klayman, 1986). Strategies can be used to reduce uncertainty but they are heuristic and can introduce other forms of information uncertainty (e.g., statistical uncertainty or cognitive uncertainty). Thus, it is not surprising that there are at least seven different kinds of strategies that we have observed. There is" no strict chronological ordering or preference of use among these strategies. The order listed below, however, is roughly descriptive of the order in which strategies are likely to . be applied (Figure 19.6).
We use the term strategies to refer to the kinds of responses experts use to deal with or reduce uncertainty. We prefer the term strategies to heuristics, algorithms, procedures, or methods because the term strategies highlights the facts that (a) scientists typically have multiple behaviors they can and do use to deal with uncertainty in data, (b) the choice of behavior is influenced by situation features, and (c) the behaviors are generally adaptive but not necessarily optimal.
Check for Likely Errors
When results are particularly surprising and especially toward the beginning of a problem-solving episode, the common first step is to look for likely sources of error. The particular sources to look for can depend upon the particular tools one is using-not all tools have the exact same set of common errors. However, we list some typical kinds of errors to look for in each of the three domains.
In fMRI, problem solvers typically look for common skill errors. For example, problem solvers often double check the splitfile-the way the data is parsed by condition. Conditions can be mislabeled, copied to incorrect directories, or be out of temporal phase with the brain imaging data. Here, the problem solver will reexamine the process by which the data were generated, and perhaps redo the splitfile from scratch. Weather forecasters also will look for skill errors. For example, sometimes a satellite picture or weather model may be mislabeled either on a weather portal or on the title of the visualization.
Focus on More Reliable Sources
Some data sources are more reliable than others, and a common response to high levels of uncertainty is to focus on the sources or kinds of data considered more reliable. It is worth noting, however, that reducing the kinds
Figure 19.6 Strategies commonly used to reduce uncertainty in data analysis.

CHAPTER 19. PSYCHOLOGY OF UNCERTAINTY IN SCIENTIFIC DATA ANALYSIS 475
of information being examined can introduce other kinds of informational uncertainty or perhaps introduce confirmation biases (Gorman, 1992). In fMRI, scientists often focus on more reliable aspects of the data. For example, the scientist will typically adjust statistical thresholds in cases of high uncertainty so that only the most reliable results are displayed. Another common approach is to throw out high noise or low signal participants-in fact, it is not uncommon to throw out 10% to 40% of participants because of high noise or low signal problems. In weather forecasting, a forecaster will learn from experience that some weather models are particularly good at certain situations. For example, the forecaster may use weather model A when there is a low off the coast of Florida and a large Nor' easter (a storm blowing from the northeast) coming in December, but rely on weather model B when there is not a Nor' easter. Because of the relatively tight coupling between the forecast and truth (i.e., it is usually easy to determine if a forecast was correct), a forecaster quickly gains faith in certain models in certain conditions.
Adjust for Known Deviations From Truth
When some sources of data can be considered the true state of the world, then the expert problem solver often uses this information to adjust clear deviations from truth in more inferential, indirect sources of data. This adjustment can be done externally in software or it can be done mentally by the problem solver (Trickett & Trafton, 2007; Trickett et aL, 2007). In weather forecasting, there are cases of both external and mental adjustments. Some software allows the forecaster to move features on the display by hand (e.g., move the locations of predicted lows). Another key activity is adjusting past state descriptions that weather models take as input. But verbal protocols of forecasters also show that forecasters will mentally adjust features in a predicted model that they consider in need of adjustment. In fMRI, the manipulations are primarily mental because it is considered unethical to manipulate data subjectively by hand (rather than clearly described and objective algorithms).
Average Across Sources/Analyses
When there are multiple sources of data and they are equally suspect, problem solvers can average (weighted or unweighted) across the sources of data to produce what they consider a more certain outcome. This averaging process, like the adjustment process, can be done in software or mentally (Trickett et aL, 2007; Trickett et al., 2009). In fMRI, a common approach with high uncertainty is to move from individual participant data displays to group level average data displays, which is done in software. Weather forecasters will frequently average mentally across different weather models, producing not just a simple numerical average, but rather a complex combination mediated by a qualitative mental model of the overall situation that is developed (Trafton et al., 2000). Recently, forecasters have begun using statistical combinations of different models, a practice that is called ensemble forecasting.

476 SECTION V. APPLIED PSYCHOLOGIES OF SCIENCE
Acquire Additional Data of the Same Kind
To deal with uncertainty, often patience is required; the problem solver must merely wait for more data of the same kind to resolve the'·uncertainty. A common effect of introducing noise into data is that many more trials are required to discover a pattern (Gorman, 1986; Penner & Klahr, 1996). It is important to note that waiting for more data can introduce additional uncertainty in the form of possible retrieval errors (forgetting what happened before) and future prediction uncertainty (increasing temporal lag since last collection of key data, like just after a maneuver in submarine operations). In fMRI, the researcher will often decide to collect data from additional participants, in order to see whether unexpected trends will continue or noisy data will average out more clearly. A weather forecaster can examine more time slices of recent data, or even reexamine the same data again to refresh his/ her memory of the data.
Gather More Reliable Data
Some sources of data are less reliable than others, but may be used at a particular point in time because of cost/accuracy tradeoffs or may just happen to be the data that is currently available. When examining highly uncertain data that cannot be resolved through the simpler strategies described above, scientists often choose to gather more reliable data, which they may not have done prior to this point because of resource management issues. There have been some arguments about what kind of data is selected in response to the possibility of error, but in general there is not an increase in confirmation bias (or H+ tests), but there may be an increase in replication trials (Baker & Dunbar, 2000; Gorman, 1986; Penner & Klahr, 1996).
In fMRI, the researcher can use more detailed/accurate analysis procedures that are slower to run and thus not used first. Also, the researcher can decide to change the experiment to a more conservative structure and then collect more data (Schunn & Klahr, 2000). The more conservative experiment may have more trials per condition, collect baseline data more often (to deal with motion correction issues), or somehow make the manipulation stronger. A weather forecaster can request a weather balloon to be launched, which provides highly accurate and more recent information for a particular small region. Some more detailed models produce more accurate predictions, but are much slower to run, and thus are not typically used first.
Bound Uncertainty in Final Solution
Uncertainty does not always get resolved by the end of data analysis. Pap:rs must be submitted to conferences and journals, and complete resolutiOn of uncertainty is not necessary. The final common strategy that we ha~e observed scientists use is to give explicit bounds on the uncertainty of thell' final solution. In fMRI, observed results are categorized as clear or o:arginal. For example, the researcher might state that the location of a part~cular activated region may actually be in this or another adjacent brain region.

CHAPTER 19. PSYCHOLOGY OF UNCERTAINTY IN SCIENTIFIC DATA ANALYSIS 477
In weather forecasting, ranges of values are often given (e.g., winds between 4 and 7 knots).
MEASURING PSYCHOLOGICAL UNCERTAINTY IN SCIENTISTS
To measure psychological uncertainty during science, one can use surveys, speech cues, or gestures. Using surveys is relatively straightforward. Speech and gesture are more complex and this is described in more detail.
Speech Coding of Uncertainty
One approach to coding uncertainty and approximation is syntactical with verification. Uncertainty hedge words include "probably," "sort of," "guess," "maybe," "possibly," "don't know," "(don't) think," "(not) certain," and "believe." Each instance of the hedge words should be examined to make sure it was being used in an uncertainty sense.
For example, we have been involved in coding of speech uncertainty in two different domains of science (Schunn et al., 2007; Trickett et al., 2009). The first domain involved conversations of earth scientists working at the Jet Propulsion Lab analyzing data as it came down from Mars from two robotic rovers-the Mars Exploration Rovers. The coded conversations were of impromptu meetings held throughout the day between groups of 2 to 10 scientists from several different disciplines (soil and rock scientists, geochemists, geologists, and atmosphere scientists). There were a number of video cameras off to the sides of the large data analysis rooms. The scientists had given informed consent for this video collection but the cameras were relatively small, discretely located, and constantly present. Thus, the scientists generally forgot about the existence of the cameras and the transcripts likely capture very typical problem-solving behaviors in this context.
The second domain involved cognitive neuroscientists analyzing fMRI data. After 30 to 45 minutes of data analysis, they were then shown three or four different minute-long snippets of the videotape that corresponded to critical decision-making moments during data analysis. The scientists were asked to explain what they knew and didn't know at that moment in time. Sometimes problem solvers given think-aloud instructions fall silent exactly at the interesting moments in time, especially when the task is long and complex. This cued recall method was designed to capture additional information about these more interesting moments. Across these two domains, we used the same hedge word technique for coding uncertainty from the transcribed speech, with interrater reliability Kappas greater than 0.8.
One source of validation involves the temporal reoccurrence of uncertainty statements: If one line had an uncertainty word, the next line was more likely to have an uncertainty word-here approximation terms were also coded and these terms were not temporally associated with uncertainty terms. The know/don't know probes in the study of fMRI provide another validation of the uncertainty codes (and coding was done blind to question

478 SECTION V. APPLIED PSYCHOLOGIES OF SCIENCE
context). One would expect that there would be more uncertainty speech cues in response to the "what did you not know?" question than in response to the "what did you know?" question. This is exactly what was found.
Gesture Coding of Uncertainty
In science and engineering, much of the data is inherently visual-spatial or is displayed in spatial format (e.g., graphs of temperature varying with time). Thus, much of the uncertainty is expressed about visual-spatial quantities. Because sciences have usually formalized much if not all of the quantities and relationships in symbolic formats (e.g., terms for particular quantitative data patterns, equations to represent quantitative data patterns), much can be studied from coding speech from conversations and think-alouds. However, it is likely that considerable representing, reasoning, and problem solving in science are also happening in a visual-spatial, nonverbal format.
How does one measure internal problem solving on visual-spatial content? All measures of mental representations and problem solving are necessarily indirect. Verbal report is one general source of data regarding mental representation and problem solving. However, for visual-spatial content, it is a suspect source, as verbal data are generally thought to capture the contents of verbal working memory, not spatial working memory (Ericsson & Simon, 1993). Another approach is to use spontaneous gestures. In addition to serving a communicative act between speaker and listener, spontaneous gestures are thought to be an online measure of mental representations much like verbal protocols (Alibali, Bassok, Solomon, Syc, & Goldin-Meadow, 1999; Alibali & Goldin-Meadow, 1993; McNeill, 1992). In spatial tasks, in fact it is disruptive to the problem solver to prevent gesturing from occurring.
In addition to coding gestures for complex representational content, gestures can also be used as a measure of uncertainty or approximation. There are a number of taxonomies of gesture. One common distinction (McNeill, 1992) is between beat gestures (rhythmic, repetitive gestures often cotimed with speech), deictic gestures (pointing to things in the world around the speaker such as the clock on the wall over there), iconic gestures (gestures that are literal physical presentations of things absent, such as hand sh~pe holding an implied glass), and metaphoric gestures (a spatial representah~n of a nonspatial object, such as pointing behind oneself to represent back m . time). All of these gestures can have many phases (McNeill, 2005): preparation (optional), prestroke hold (optional), stroke (obligatory), stroke h?ld (obligatory if the stroke is static), poststroke hold (optional), and retr~ctiOn (optional). Uncertainty gestures are typically wiggling movements. m ~he stroke of an iconic or metaphoric gesture that represents some quantity (I.e., normally would be static). For example, a pinch indicating a size toge:her with wavering the size or wiggling the hand. In this way, the uncertam:; gesture is discriminable from a beat gesture in that there is content to he gesture beyond the movement in an uncertainty gesture of this type bu~ t e beat gesture does not have content beyond the movement (i.e., the hand oes

CHAPTER 19. PSYCHOLOGY OF UNCERTAINTY IN SCIENTIFIC DATA ANALYSIS 479
not indicate a size or distance or volume). However, another common form of an uncertainty gesture involves a shoulder shrug. In this case, one must rely on speech or perhaps another gesture to determine which quantity is producing uncertainty.
How do we know such gestures correspond to psychological uncertainty? We have examined the overlap between uncertainty gesture and speech in the four science/applied science domains mentioned earlier. In every case, uncertainty gestures were statistically more common when there was uncertainty in the speech than when there was not uncertainty in the speech.
SUMMARY
To further validate that there is indeed something called an uncertainty gesture that signals an internal state of uncertainty, we can examine gesture data from the fMRI study, focusing on the relative frequency of uncertainty gestures in response to the Know and Not-Know questions. Two percent of segments co-occurred with an uncertainty gesture during the response to the Know question. In response to the Not-Know question, rate of uncertainty gestures more than doubled.
Uncertainty plays a very complex role in basic and applied science. From the in-depth analysis of the sources of informational uncertainty, it is clear that uncertainty can come from many sources and is likely to be high in most basic and applied science domains-at least in the real world cases, as opposed to the more simplified cases studied in the lab. Importantly, the scientist himself/herself can act as a source of information uncertainty, and this source may be particularly relevant to cases of confirmation biases, in which simple misencodings or misrememberings may occur in favor of a tested hypothesis rather than unethical behaviors.
To influence behavior, the scientist must diagnose states of informational uncertainty, and there are number of strategies that scientists have for making this diagnosis. Here expertise in science overall and in a particular domain of science can play a large role. The second layer of behavior involves mitigation: actions taken to reduce the informational uncertainty. Studies that have manipulated noise in the data even in simple tasks have found large effects on number of trials or probability of success. In complex science domains, there· are many different strategies scientists can follow to reduce the informational uncertainty.
Finally, to measure psychological uncertainty, psychologists of science have many measurement tools at their disposal, most prominently speech and gesture. It is likely that the future of the psychology of science of uncertainty will include neuroscientific techniques, such as Evoke Response Potentials and fMRI, which have been used to study uncertainty in other domains such as language processing and simple task learning. And more cognitive anthropology, like the type that produced these presented taxonomies, will be useful to better understand how scientific tasks are constructed to deal with the ever-present informational uncertainty in science.

480 SECTION V. APPLIED PSYCHOLOGIES OF SCIENCE
THE FUTURE OF UNCERTAINTY IN SCIENCE
The taxonomies of uncertainty, especially the indicators and strategies taxonomies, can be used to guide the development of additional automation to support problem solving in science domains with high uncertainty. Consider the case of indicators. Each of the four categories of indicators in our taxonomy can be automated to some degree, and thus one now has four different kinds of indicators that one can try to automate in any domain of high uncertainty. There are already some measures of noise in many domains (e.g., error bars on graphs), but other measures of noise in more complex visual displays can be developed. For example, one can make use of information theoretic measures of the degree of patterns in data. One can develop measures of mismatch across data sources. One can develop measures of mismatch from a particular source that is considered the known current state of the world. Finally, one can develop measures of deviations from theoretically possible states.
Similarly, one can develop automation for the strategies for dealing with informational uncertainty, and our taxonomy provides a set of general strategies that one might wish to automate. The value of automating the strategies is not as clear as in the case of indicators because doing automation (like automatic error correction in typing) is always more controversial than informing automation (like automatic underlining of errors in typing). Whether a given strategy should be automated in a given domain will depend upon two factors: (a) how simple the strategy is to automate relative to how effective people are already at implementing the strategy on their own (e.g., people are good at spatial transformations) and (b) how accurate the automated transformations are.
Another use of the uncertainty taxonomies is for psychology science research. Many researchers are interested in behavior in science domains of high uncertainty but tend to focus on particular sources, particular indicators, or particular strategies. There is certainly nothing wrong with focusing on particular elements in a complex situation. But these taxonomies help specify the contrast set the set of alternative elements that might be considered as also contributing to performance and perhaps possible confounds in the research on the given element. For researchers beginning work in a previously unstudied domain with high uncertainty, these taxonomies provide a starting place for understanding the ecology of the presumably important uncertainty aspect of the domain.
REFERENCES
Abbaspour, R. A., Delavar, M. R., & Batouli, R. (2003). The issue of uncertainty propagation in spatial decision making. InK. Virrantaus and H. Tveite, (Eds.), ScanGIS'2003: Proceedings of the 9th Scandinavian Research Conference on Geographical Information Science (pp, 57-f>S). Espoo, Finland. Helsinki, Helsinki University of Technology.
Alipali •. M. W., Bassok, M., Solomon, K. 0., Syc, S. E., & Goldin-Meadow, S. (1999). Illuminating mental representations through speech and gesture. Psychological Science, 10(4), 327-333.
r I " f
CHAPTER 19. PSYCHOLOGY OF UNCERTAINTY IN SCIENTIFIC DATA ANALYSIS 481
Alibali, M. W., & Goldin-Meadow, 5. (1993). Gesture-speech mismatch and mechanisms of learning: What the hands reveal about a child's state of mind. Cognitive Psychology, 25(4), 468-523.
Alkov, R. A., Gaynor, J. A., & Borowsky, M. S. (1985). Pilot error as a symptom of inadequate stress coping. Aviation, Space, and Environmental Medicine, 56(3), 244-247.
Baddeley, A. D., & Scott, D. (1971). Short term forgetting in the absence of proactive interference. Quarterly Journal of Experimental Psychology, 23(3), 275-283.
Baker, L. M., & Dunbar, K. (2000). Experimental design heuristics for scientific discovery: The use of "baseline" and "known standard" controls. International Journal of Human Computer Studies, 53(3), 335-349.
Beilcock, S. L., & Carr, T. H. (2001). On the fragility of skilled performance: What governs choking under pressure? Journal of Experimental Psychology: General, 130(4), 701-725.
Berkeley, D., & Humphreys, P. (1982). Structuring decision problems and the "bias heuristic". Acta Psychologica, 50(3), 201-252.
Biederman, I. (1987). Recognition-by-components: A theory of human image understanding. Psychological Review, 94(2), 115-117.
Bottom, W. P. (1998). Negotiator risk: Sources of uncertainty and the impact of reference points on negotiated agreements. Organizational Behavior and Human Decision Processes, 76(2), 89-112.
Bower, G. H., Black, J. B., & Turner, T. J. (1979). Scripts in memory for text. Cognitive Psychology, 11(2), 177-220.
Brashers, D. E., Neidig, J. L., Russell, J. A., Cardillo, L. W., Haas, S.M., Dobbs, L., ... Nemeth, S. (2003). The medical, personal, and social causes of uncertainty in HIV illness. Issues in Mental Health Nursing, 24, 497-522.
Brewer, W. F., & Treyens, J. C. (1981). Role of schemata in memory for places. Cognitive Psychology, 13(2), 207-230.
Cahill, L., & McGaugh, J. L. (1995). A novel demonstration of enhanced memory associated with emotional arousal. Consciousness and Cognition: An International Journal, 4(4), 410-421.
Chase, W. G., & Simon, H. A. (1973). The mind's eye in chess. In W. G. Chase (Ed.), Visual information processing (pp. 215-281). New York, NY: Academic Press.
Chinn, C. A., & Brewer, W. F. (1992). Psychological responses to anomalous data. Paper presented at the 14th Annual Meeting of the Cognitive Science Society, Bloomington, IN.
Cohen, M. S., Freeman, J. T., & Thompson, B. (1998). Critical thinking skills in tactical decision making: A model and a training strategy. In J. A. Cannon-Bowers & E. Salas (Eds.), Making decisions under stress: Implications for individual and team training (pp. 155-189). Washington, DC: American Psychological Association.
Ericsson, K. A., & Simon, H. A. (1993). Protocol analysis: Verbal reports as data (2nd ed.). Cambridge, MA: MIT Press.
Gillund, G., & Shiffrin, R. M. (1984). A retrieval model for both recognition and recall. Psychological Review, 91, 1-67.
Gorman, M. E. (1986). How the possibility of error affects falsification on a task that models scientific problem solving. British Journal of Psychology, 77, 85-96.
Gorman, M. E. (1992). Simulating science: Heuristics, mental models and technoscientific thinking. Blpbmington, IN: Indiana University Press.
Grice, G. R., & Spiker, V. A. (1979). Speed-accuracy tradeoff in choice reaction time: Within conditions, between conditions, and between subjects. Perception and Psychophysics, 26(2), 118-126. . '
Hall, K. H. (2002). Reviewing intuitive decision-making and uncertainty: The implications for medical education. Medical Education, ·36, 216-224.
Howell, W. C., & B\.\rnett, S. A. (1978). Uncertainty measurement: A cognitive taxonomy. Organizational Behavior and Human Decision Processes, 22(1), 45-68.
Hutchins, E. (1995). Cognition in the wild. Cambridge, MA: MIT Press. Kahneman, D., & Tversky, A. (1982). Variants of uncertainty. Cognition, 11(2), 143-157. Kaplan, C. A., & Simon, H. A. (1990). In search of insight. Cognitive Psychology, 22,
374-419.
482 SECTION V. APPLIED PSYCHOLOGIES OF SCIENCE
Klayman, J. (1986). Cue discovery in probabilistic environments: Uncertainty and experimentation. Journal of Experimental Psychology: Learning, Memory and Cognition, 14(2), 317-330.
Klein, G. A. (1989). Strategies of decision making. Military Revieiv, May, 56-64. Krivohlavy, J. (1970). Subjective probability in experimental games. Acta Psychologica,
34(2,3), 229-240. Krueger, G. P. (1994). Fatigue, performance, and medical error. In M. S. Bogner (Ed.),
Human error in medicine (pp. 311-326). Hillsdale, NJ, England: Lawrence Erlbaum Associates, Inc.
Kulkarni, D., & Simon, H. A. (1988). The process of scientific discovery: The strategy of experimentation. Cognitive Science, 12, 139-176.
Kyllonen, P. C., & Alluisi, E. A. (1987). Learning and forgetting facts and skills. In G. Salvendy (Ed.), Handbook of human factors (pp. 124-153). Oxford, England: John Wiley & Sons.
Lipshitz, R., & Strauss, 0. (1997). Coping with uncertainty: A naturalistic decision-making analysis. Organizational Behavior and Human Decision Processes, 69(2), 149-163.
McNeill, D. (1992). Hand and mind: What gestures reveal about thought. Chicago, IL: University of Chicago Press.
McNeill, D. (2005). Gesture and thought. Chicago, IL: University of Chicago Press. Mitro££, I. I. (1974). The subjective side of science. New York, NY: Elsevier. Musgrave, B. S., & Gerritz, K. (1968). Effects of form of internal structure on recall and
matching with prose passages. Journal of Verbal Learning and Verbal Behavior, 7(6), 1088-1094.
O'Connor, R. M., Doherty, M. E., & Tweney, R. D. (1989). The effects of system failure error on predictions. Organizational Behavior and Human Decision Processes, 44(1), 1-11.
Penner, D. E., & Klahr, D. (1996). When to trust the data: Further investigations of system error in a scientific reasoning task. Memory & Cognition, 24(5), 655-668.
Polk, T. A., & Farah, M. J. (1995). Late experience alters vision. Nature, 376(6542), 648,649. Rowe, W. D. (1994). Understanding uncertainty. Risk Analysis, 14, 743-750. Schaffer, S. (1988). Astronomers mark time: Discipline and the personal equation. Science
in Context, 2(1), 115-145. Schunn, C. D. (2010). From uncertainly exact to certainly vague: Epistemic uncertainty
and approximation in science and engineering problem solving. In B. Ross (Ed.), Psychology of learning and motivation (Vol. 53, pp. 227-252).Burlington, IN: Academic Press.
Schunn, C. D., & Anderson, J. R. (1999). The generality/specificity of expertise in scientific reasoning. Cognitive Science, 23(3), 337-370.
Schunn, C. D., & Klahr, D. (2000). Discovery processes in a more complex task. In D. Klahr (Ed.), Exploring science: The cognition and development of discovery processes (pp. 161-199). Cambridge, MA: MIT Press.
Schunn, C. D., Saner, L. D., Kirschenbaum, S. K., Trafton, J. G., & Littleton, E. B. (2007). Complex visual data analysis, uncertainty, and representation. In M. C. Lovett & P. Shah (Eds.), Thinking with data (pp. 27-64). Mahwah, NJ: Erlbaum.
Shah, P., & Hoeffner, J. (2002). Review of graph comprehension research: Implications for instruction. Educational Psychology Review, 14(1), 47-69.
Sheer, V. C., & Cline, R. J. (1995). Testing a model of perceived information adequacy and uncertainty reduction in physician/patient interactions. Journal of Applied Communication Research, 23, 44-59.
Singley, M. K., & Anderson, J. R. (1989). The transfer of cognitive skill. Cambridge, MA: Harvard Press.
Suchman, L. A. (1987). Plans and situated action: The problem of human-machine communication. New York, NY: Cambridge University Press.
Trafton, J. G., Kirschenbaum, S. S., Tsui, T. L., Miyamoto, R. T., Ballas, J. A., & Raymond, P. D. (2000). Turning pictures into numbers: extracting and generating information from complex visualizations. International Journal of Human Computer Studies, 53(5), 827-850.

CHAPTER 19. PSYCHOLOGY OF UNCERTAINTY IN SOENTIFIC DATA ANALYSIS 483
Trickett, S. B., Fu, W. T., Schunn, C. D., & Trafton, J. G. (2000). From dipsy-doodles to streaming motions: Changes in representation in the analysis of visual scientific data. Proceedings of the 22nd Annual Conference of the Cognitive Science Society. Mahwah, NJ: Erlbaum.
Trickett, S. B., & Trafton, J. G. (2007). "What if ... ": The use of conceptual simulations in scientific reasoning. Cognitive Science, 31(5), 843-875.
Trickett, S. B., Trafton, J. G., Saner, L., & Schunn, C. D. (2007). "I don't know what's going on there": The use of spatial transformations to deal with and resolve uncertainty in complex visualizations. In M. C. Lovett & P. Shah (Eds.), Thinking with data (pp. 65-85). Mahwah, NJ: Erlbaum.
Trickett, S. B., Trafton, J. G., & Schunn, C. D. (2009). How do scientists respond to anomalies? Different strategies used in basic and applied science. Topics in Cognitive Science, 1(4), 711-729.
Trope, Y. (1978). Inferences of personal characteristics on the basis of information retrieved from one's memory. journal of Personality and Social Psychology, 36(2), 93-106.
Tweney, R. D., Doherty, M. E., & Mynatt, C. R. (Ed.). (1981). On scientific thinking. New York, NY: Columbia University Press.
Urbany, J. E., Dickson, P. R., & Wilkie, W. L. (1989). Buyer uncertainty and information search. Journal of Consumer Research, 16(2), 208-215.
Walker, V. R. (1991). The siren songs of science: Toward a taxonomy of scientific uncertainty for decision makers. ConnecticutLaw Review, 23, 567.
Walker, V. R. (1998). Risk regulation and the "faces" of uncertainty. Risk: Health, Safety, & Environment, 27, 27-38.
Woodrow, H., & Stott, L. H. (1936). The effect of practice on positive time-order errors. journal of Experimental Psychology, 19, 694-705.