the profitability of the mail division of deutsche post · the profitability of the mail division...
TRANSCRIPT

October 2006
The Profitability of The Mail Division of Deutsche Post A Final Report.
This report was commissioned by United Parcel Service, Inc (UPS).

Project Team
Dr Richard Hern Tomas Haug Phillippa Lowe Marco Schönborn Yves Gueron
NERA Economic Consulting 15 Stratford Place London W1C 1BE United Kingdom Tel: +44 20 7659 8500 Fax: +44 20 7659 8501 www.nera.com

The Profitability of The Mail Division of Deutsche Post
Executive Summary
NERA Economic Consulting i
Contents
Executive Summary i
1. Introduction 1
2. The Mail Division of Deutsche Post 2 2.1. The Regulatory Framework 2 2.2. Regulation of Postal Tariffs 2 2.3. The Importance of Mail for Deutsche Post 3
3. The Appropriate Profitability Measure 7 3.1. Measures of Profitability 7 3.2. “Return on Capital” versus “Return on Sales” 7 3.3. “Return on Capital Employed” versus “Return on Equity” 9 3.4. Interpreting ROCE and ROS 9
4. The Cost of Capital of DP’s Mail Division 15 4.1. Introduction to Cost of Capital and NERA Methodology 15 4.2. Estimate of Cost of Capital 15
5. The Profitability of DP’s Mail Division 17 5.1. Return on Capital Employed in the Mail Division 17 5.2. The Relationship between Returns in the Mail Division
and Returns in the Reserved Area 22
6. ROS Analysis 24
7. Conclusions 26
Appendix A. The Cost of Capital of DP’s Mail Division 27
A.1. Introduction to Cost of Capital and NERA Methodology 27 A.2. Risk-Free Rate 29 A.3. Beta 31 A.4. Equity Risk Premium 36 A.5. Taxation 38 A.6. The Cost of Debt 38 A.7. Estimate of Cost of Capital 39
Appendix B. DP’s Beta: Comparators 40

The Profitability of The Mail Division of Deutsche Post
Executive Summary
NERA Economic Consulting ii
Appendix C. Measurement of Capital Employed 43
Appendix D. Detailed Data 46

The Profitability of The Mail Division of Deutsche Post
Executive Summary
NERA Economic Consulting i
Executive Summary
This Report assesses the profitability of the mail division of Deutsche Post (DP) and updates our conclusions presented in two earlier NERA reports in 2003,1 and 2005.2 Our analysis relates to the most recent available data, which is contained in DP’s Annual Reports up to 2005.3 We consider estimates of profitability for 2005 and over a longer historical period, dating back to 1998.
Our estimates of the profitability of the mail division of Deutsche Post (DP) are based on calculations of the return on capital employed (ROCE) of the mail segment. We compare this to the cost of capital for DP’s mail segment. By comparing ROCE and the cost of capital over a period of time, it is possible to assess whether investment in the company is appropriately rewarded, under-rewarded or over-rewarded.
Our report calculates the ROCE for DP’s mail division to be significantly higher than the estimated cost of capital over a sustained period of time.
§ Over the six year period from 2000 to 2005, the ROCE for DP’s mail division has remained above 50 per cent and has trended higher over time.
§ Over the recent three year period from 2003 to 2005, the ROCE for DP’s mail division is in the region of 100 to 120 per cent. This is substantially above our estimated cost of capital of between 7.0 and 8.7 per cent.
Our estimates of ROCE in the mail division are shown for the period 1998 to 2005 in the Figure below.
1 NERA (2003), “The Profitability of the Mail Division of Deutsche Post”. 2 NERA (2005), “Response to the Commission on the Measurement of the Profitability of DP’s Mail Division”. 3 We also discuss the data contained in the 2006 Interim Report, noting that these numbers have to be treated with care.

The Profitability of The Mail Division of Deutsche Post
Executive Summary
NERA Economic Consulting ii
Figure 1.1 ROCE in DP’s Mail Division4
0%
20%
40%
60%
80%
100%
120%
1998 1999 2000 2001 2002 2003 2004 2005
Source: Calculated from Deutsche Post AG annual reports 1999-2005
In general we observe that EBIT has remained relatively stable over most of the period (with the exception of a significant increase from 1999 to 2000). In contrast, our measure of capital employed decreases over most of the years under investigation. Consequently, ROCE increases over most of the period. We point out that many changes in the level of the ROCE are due to accounting changes related to the reporting of data in the Annual Reports of DP. In our view the updated measures of capital employed are better measure of the ROCE than the earlier figures, for reasons that we explain in the report.
In summary, while DP has faced competition in other segments, our analysis shows that it was able to generate substantial profits in the mail division. We show that DP’s profits in the mail division are significantly higher than in other divisions and have been so over the whole period under investigation.
On the basis of evidence presented in this report, we conclude that ROCE for DP’s mail division has persistently exceeded its cost of capital by a substantial margin over the period since 1998.
4 The ROCE figures include the Other/Consolidation segment, allocated according to the share of revenues.

The Profitability of The Mail Division of Deutsche Post
Introduction
NERA Economic Consulting 1
1. Introduction
This Report assesses the profitability of the mail division of Deutsche Post (DP) and updates our conclusions presented in two earlier NERA reports in 2003,5 and 2005.6 Our analysis relates to the most recent available data, which is contained in Deutsche Post’s 2005 Annual Report. We consider estimates of profitability for 2005 and over a longer historical period, dating back to 1998.
We have produced this report on the basis of profitability data for DP that are available in the public domain. It is beyond the scope of our analysis to evaluate the accounting methodology and robustness of data presented by DP.
The remainder of this report is structured as follows:
§ Section 2 discusses key characteristics of DP’s mail division.
§ Section 3 evaluates the use of two key profitability measures, ROCE and ROS, in assessing the profitability of DP’s mail division.
§ Section 4 estimates the cost of capital for DP’s mail division.
§ Section 5 presents our calculations of ROCE for DP’s mail division.
§ Section 6 presents our calculation of ROS for DP’s mail division.
§ Section 7 concludes.
5 NERA (2003), “The Profitability of the Mail Division of Deutsche Post”. 6 NERA (2005), “Response to the Commission on the Measurement of the Profitability of DP’s Mail Division”.

The Profitability of The Mail Division of Deutsche Post
The Mail Division of Deutsche Post
NERA Economic Consulting 2
2. The Mail Division of Deutsche Post
2.1. The Regulatory Framework
The current regulatory framework applicable to postal services in Germany is characterised by the following key elements:
§ On the basis of Art. 5 of the Post Act (Postgesetz), a licence is required for the transport on behalf of others of all letters with a weight not exceeding 1000g. For the reserved area (see below), only DP has been granted a licence. For the transport of letters outside the reserved area, an unlimited number of licences are available and every operator meeting the prerequisites has a legal right to obtain a licence.
§ Until 31 December 2002, Deutsche Post enjoyed an exclusive licence for the transport of all letters weighing less than 200g and with a price of less than five times the rate for the lowest weight class. On 1 January 2003, the size of the reserved area was, following EC Directive 2002/39, reduced to letters weighing less than 100g and with a price less than three times the rate for the lowest weight class. In the ongoing phased course of liberalisation, the reserved area was further reduced on 1 January 2006 to letters weighting less than 50g and with a price less than two and a half times the rate for the lowest weight class. The postal regulator envisages removing the reserved area completely on 1 January 2008.7
§ A universal service obligation (USO) exists for letters up to 2kg, parcels up to 20kg and the delivery of newspapers and magazines (as far as these are delivered by postal services). The details of the USO have been specified by separate order8 and include details on the availability of letter boxes, post offices, frequency of collections, delivery times and frequency of deliveries. Until 2002, the USO was regarded as a guideline for the regulator and would only be imposed on individual companies if the services provided in the marketplace failed to meet the standards specified in it. However, in February 2002 the USO was explicitly imposed on Deutsche Post for the duration of its exclusive licence.
§ Tariffs for postal services subject to a licence are on the basis of Art 19 of the Post Act subject to approval by the postal regulator, but only if a licensee enjoys a dominant position in the relevant market. The requirement for approval of tariffs does not apply to bulk deliveries of 50 letters or more.
2.2. Regulation of Postal Tariffs
In July 2002, the regulatory authority (Federal Network Agency (Bundesnetzagentur), formerly the Regulatory Authority for Telecommunications and Posts (RegTP)) published its decision on the regulation of Deutsche Post’s tariffs for the period until 2007.
7 Postgesetz, 3rd Law of the amendment of the Postgesetz, available at:
http://www.bmwi.de/BMWi/Redaktion/PDF/Gesetz/PostG-Novelle3-weitere,property=pdf,bereich=bmwi,sprache=de,rwb=true.pdf
8 Post-Universaldienstleistungsverordnung, 15 December 1999, as amended by the second amendment to the Post Act of 30 January 2002.
The Profitability of The Mail Division of Deutsche Post
The Mail Division of Deutsche Post
NERA Economic Consulting 3
The decision groups Deutsche Post’s regulated tariffs into three categories:
§ postal services in the reserved area;
§ regulated postal services outside the reserved area; and
§ charges for access to various parts of Deutsche Post’s network.
On the basis of the decision, volume-weighted average tariffs in each of these categories will fall, in real terms, by 1.8 per cent per year between 2004 and 2007.
Deutsche Post’s tariffs are not cost oriented. The regulatory authority’s reason for this is based on encouraging entry to the market: i.e. that lower Deutsche Post tariffs could make it more difficult for new entrants to compete with Deutsche Post.
2.3. The Importance of Mail for Deutsche Post
2.3.1. Importance of Mail division
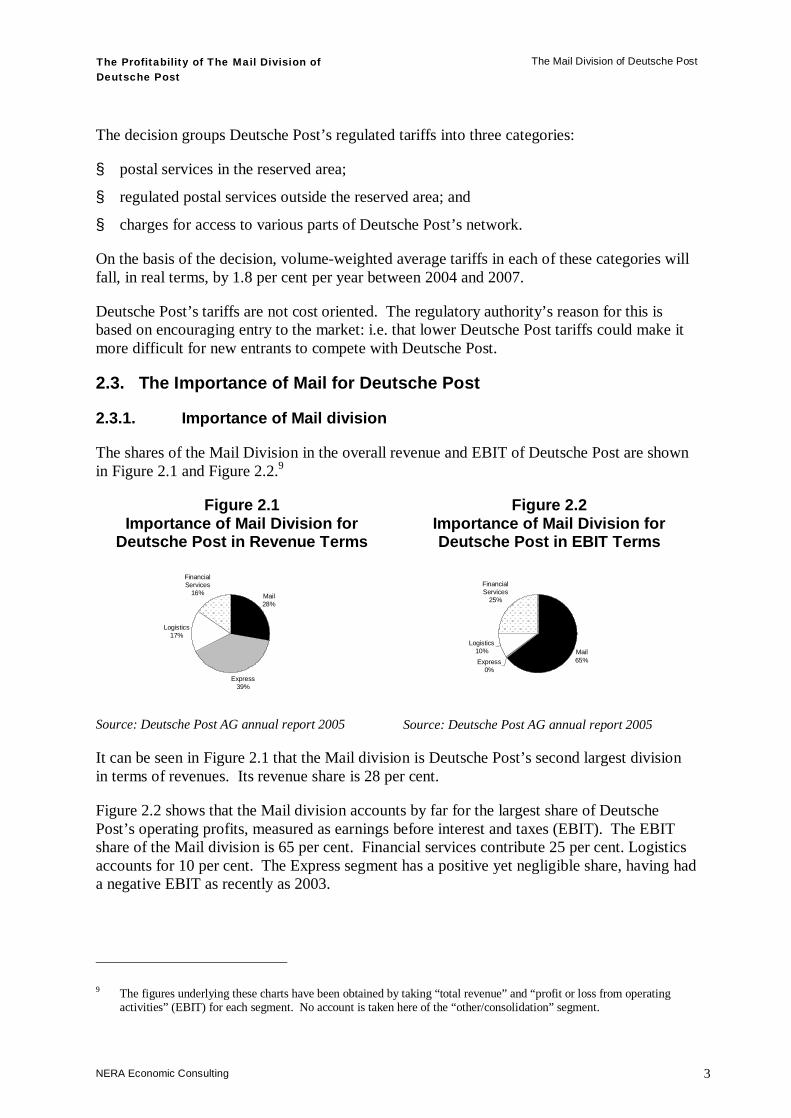
The shares of the Mail Division in the overall revenue and EBIT of Deutsche Post are shown in Figure 2.1 and Figure 2.2.9
Figure 2.1 Importance of Mail Division for
Deutsche Post in Revenue Terms
Mail28%
Express39%
Logistics17%
Financial Services
16%
Source: Deutsche Post AG annual report 2005
Figure 2.2 Importance of Mail Division for Deutsche Post in EBIT Terms
Mail65%Express
0%
Logistics10%
Financial Services
25%
Source: Deutsche Post AG annual report 2005
It can be seen in Figure 2.1 that the Mail division is Deutsche Post’s second largest division in terms of revenues. Its revenue share is 28 per cent.
Figure 2.2 shows that the Mail division accounts by far for the largest share of Deutsche Post’s operating profits, measured as earnings before interest and taxes (EBIT). The EBIT share of the Mail division is 65 per cent. Financial services contribute 25 per cent. Logistics accounts for 10 per cent. The Express segment has a positive yet negligible share, having had a negative EBIT as recently as 2003.
9 The figures underlying these charts have been obtained by taking “total revenue” and “profit or loss from operating
activities” (EBIT) for each segment. No account is taken here of the “other/consolidation” segment.

The Profitability of The Mail Division of Deutsche Post
The Mail Division of Deutsche Post
NERA Economic Consulting 4
In terms of market share, Deutsche Post World Net (DPWN), through its Deutsche Post brand, leads the German regular mail market with a 90 per cent share of the market at the end of 2005.10
2.3.2. Importance of reserved sector
In its 2005 market report,11 the regulatory authority (Bundesnetzagentur) presents turnover data for the various segments of the licensed market. Indicative estimates of the importance of the reserved sector for DP based on the regulator’s data for 2004 and data from DP’s 2005 annual report are shown in Figure 2.3.12
Figure 2.3 Importance of Licensed Sector for DP Mail and Share of DP Mail in Licensed
Sector, 2004 (indicative estimates)
0.00
10.00
DP Mail Division turnover Licensed sector turnover
DP Mail Division turnover in reserved sector DP Mail Division turnover in non-reserved but licensed sectorDP Mail Division turnover in non-licensed sector Third party turnover in non-reserved but licensed sector
reserved sector
non-reserved but
licensed sector
non-reserved but licensed sector
non-licensed sector
(bn €)
Source: Estimated from RegTP (2005)13, and Deutsche Post’s 2005 Annual Report
Key points to note from Figure 2.3 are the following:
10 Dow Jones Reuters Business Interactive LLC, 3 June 2006. 11 Regulierungsbehörde für Telekommunikation und Post (2005), “Achte Marktuntersuchung für den Bereich der
lizenzpflichtigen Postdienstleistungen”. 12 The 2004 numbers from the regulatory authority are only estimates and therefore need to be treated with caution. 13 Regulierungsbehörde für Telekommunikation und Post (2005), “Achte Marktuntersuchung für den Bereich der
lizenzpflichtigen Postdienstleistungen”.

The Profitability of The Mail Division of Deutsche Post
The Mail Division of Deutsche Post
NERA Economic Consulting 5
§ The left-hand column in Figure 2.3 shows the 2004 turnover of Deutsche Post’s Mail division of €12.7bn. Of this, around 52 per cent is derived from the reserved sector (i.e. the area where Deutsche Post enjoys a statutory monopoly), around 24 per cent from the non-reserved but licensed sector, and around 24 per cent from the non-licensed sector.
§ Deutsche Post accounts for some 95 per cent of the total estimated turnover in the licensed sector in 2004 of €10.1bn, shown in the right-hand column of Figure 2.3. In the area of the licensed sector which is open to competition (the non-reserved but licensed sector), Deutsche Post 2004 share was around 86 per cent.
The bar chart in Figure 2.4 presents a time series of Deutsche Post Mail’s turnover disaggregated by sector. The line shows the total size of the licensed sector, i.e. including third parties.
Figure 2.4 Importance of Licensed Sector for DP Mail: Time Series
0
2,000
4,000
6,000
8,000
10,000
12,000
14,000
2001 2002 2003 2004
Mill
ion
€
DP Mail Division turnover in Reserved sector DP Mail Division turnover in Non-reserved, but licensedDP Mail Division turnover in non-licensed sector Licensed sector turnover
Source: Estimated from RegTP (2005)14, and Deutsche Post’s 2005 Annual Report Note: 2004 data based on estimates.
Following the reduction of the area of the reserved sector on the 1st January 2003, the share of the reserved sector in DP Mail’s total revenue fell from 64 per cent in 2002 to 53 per cent in 2003. Over the time period 2001 to 2004 DP Mail has increased its total revenues by around 9 per cent.
14 Regulierungsbehörde für Telekommunikation und Post (2005), “Achte Marktuntersuchung für den Bereich der
lizenzpflichtigen Postdienstleistungen”.

The Profitability of The Mail Division of Deutsche Post
The Mail Division of Deutsche Post
NERA Economic Consulting 6
In summary, the majority of DP’s earnings accrue from the Mail division (65% in 2005). The next largest earning division is Financial Services (25%), followed by Logistics (10%). Comparing earnings shares with revenue shares indicates that the mail division has by far the highest ratio of earnings to sales: 2.3 compared with the next highest ratio division (Financial Services has a ratio of earnings to sales of 1.6. Logistics and Express both have a ratio lower than one). This implies that DP’s return on sales (ROS) is significantly higher in the mail division than in other sectors, all else equal.
Evidence on market turnover indicates that the majority (52%) of DP’s mail revenues are accrued from the reserved sector, in which it enjoys a statutory monopoly. The remainder of DP’s mail division revenues are split equally between the licensed (non-reserve) and non-licensed sector. In addition to its monopoly position in the reserve sector, DP also enjoys dominance in the non-reserve licence sector, (86% of non-reserve licence revenues). Overall, DP’s licensed mail revenues account for 95% of all licensed mail turnover in 2004.
On the basis of this analysis we can therefore conclude that ROS for DP’s mail division is significantly higher than for its other activities and that the vast majority of these profits accrue from activities in which DP enjoys either a statutory monopoly or market dominance.
However, we do not draw conclusions on DP’s mail division relative to other sectors on the basis of ROS evidence at this stage. As discussed in the following Section, there are a number of important reasons why ROS may not be the best proxy for profitability.

The Profitability of The Mail Division of Deutsche Post
The Appropriate Profitability Measure
NERA Economic Consulting 7
3. The Appropriate Profitability Measure
3.1. Measures of Profitability
An economic activity is typically characterised by initial capital outlays followed by a stream of cash flows in later periods. Cash flows can be discounted to yield the net present value (NPV) of an activity. The internal rate of return (IRR) is defined as the discount rate that yields a NPV of exactly zero. This IRR can then be compared with the cost of capital to assess whether the activity is profitable - if the outlays (investments) were invested in the market, they would yield a return equal to the cost of capital, for a given risk profile. Thus, the IRR needs to be equal or greater to the cost of capital to compensate for the returns forgone by not investing in an identically risky investment elsewhere in the market. Hence, the IRR is an appropriate economic measure of profitability for investment decisions.
Estimation of IRR requires data about the cash flows of the activity in question over the relevant time period, as well as about the asset values at the start and end of that period. In many cases, these data are difficult to obtain. In that case, accounting measures of profitability may be used instead. These essentially provide snapshots of a company’s performance at different points in time, based on accounting report data.15 Using accounting data, a close proxy for economic profitability, i.e. the IRR of an activity, is the return on capital employed (ROCE). ROCE can be defined as earnings before interest and taxes over capital employed (see below). It is worth noting in this context that this definition of ROCE is a pre-tax measure and therefore must be compared to a pre-tax cost of capital.
Besides ROCE, return on sales (ROS) is sometimes used as a profitability measure. Below, we discuss the economic rationale of the two measures as well as a number of estimation and interpretation issues. As will emerge, ROCE is conceptually closer to the economic measure of profitability.
3.2. “Return on Capital” versus “Return on Sales”
An accounting measure of profitability only acts as a proxy for the economic measure, which is the IRR. The appropriate benchmark should therefore approximate the IRR as closely as possible.
In economic terms, only the ROCE is relevant. Ultimately, the role of “profits” (we discuss the appropriate definition of profits below) is to reward the capital that is invested in a firm. Investors will only invest in a firm if they expect their investment to be rewarded at an appropriate rate given the risks they incur. ROCE is a measure of the ex-post rate of return while the cost of capital measures the (expected) return that is required in order to compensate for the risk of that investment. By comparing ROCE and the cost of capital over a period of time, it is possible to assess whether investment in the company is appropriately rewarded, under-rewarded or over-rewarded (although care needs to be taken when interpreting ROCE data for reasons explained in Section 3.4).
15 OFT (July 2003), “Assessing Profitability in Competition Policy Analysis”, OFT Discussion Paper.

The Profitability of The Mail Division of Deutsche Post
The Appropriate Profitability Measure
NERA Economic Consulting 8
Return on sales measures are widely used in management decisions, but do not have any meaning in the context of profitability assessments, The reason for this is that they do not relate the returns to the amount of capital invested in a firm, nor to the returns required by investors. Thus, a high ROS does not even guarantee that the company can raise sufficient debt and equity to finance its functions in the long run. Consider the following example: a product with a sales value of 10 million units at a low price cost margin of 10 per cent would generate a higher return on a given upfront investment than a product with a high price cost margin of 90 per cent but sales of just 1 million. This makes it difficult to interpret ROS measures of profitability in economic terms.
Thus, high returns on sales can be consistent with low returns on capital, and vice versa. At the most basic level, the return on sales and return on capital concepts relate to each other as follows:
capital) on (return salesprofit
sales on return xsales
capitalcapitalprofitx
salescapital
===
In other words, “return on sales” is related to “return on capital” via what might be regarded as an indicator of the capital intensity of the firm; the amount of capital required for each unit sold. If the capital intensity of a firm is high, a relatively low return on capital can translate into a relatively high return on sales. By contrast, if the capital intensity of a firm is low, a relatively low return on sales can translate into a relatively high return on capital. By extension, this implies that a low return on sales may be hiding high and excessive returns to capital, if the capital intensity is sufficiently low.
It is worth noting in this context that although the capital intensity of postal operators was traditionally regarded as low, it has now increased somewhat due to the introduction of automatic mail sorting.16
The case of National Grid provides a good example of the divergence between return on capital and return on sales. National Grid is an operator of utility networks with as its main activities the operation of the transmission network in England and Wales, and of transmission and distribution networks in the north-eastern US. Key financial indicators for the company for the year ending 31 March 2006 are shown in Table 3.1.
16 We discuss Deutsche Post’s capital intensity in greater detail in Section 3.4.2.2.

The Profitability of The Mail Division of Deutsche Post
The Appropriate Profitability Measure
NERA Economic Consulting 9
Table 3.1 National Grid Key Financial Indicators, 2005/6
Indicator Value (£m) Group turnover (i.e. sales) 9,193 Operating profit Before exceptional items and re-measurements 2,527 Total assets less current liabilities17 26,742 Return on turnover (sales) 27.49% Return on capital employed 9.45% Source: National Grid Annual Report 2005/06
The Table shows that National Grid achieved a return on its turnover of more than 27 per cent in 2005/06. However, due to the high level of assets invested in National Grid’s business (electricity networks), its return on capital employed is, at less than 10 per cent, much lower than its return on sales. Thus, judging the company’s profitability by the return on sales would give a misleading picture of the firm’s profitability.
3.3. “Return on Capital Employed” versus “Return on Equity”
Having determined that “return on capital” is the appropriate benchmark to use in profitability assessments, we note that there are other measures besides ROCE.
In particular, Return on Equity (ROE) is a ratio of earnings after interest, both post- and pre-tax, to shareholder funds. ROCE, on the other hand, focuses on the remuneration of the total capital invested in a firm.
In the present study, we are focusing on a single division of Deutsche Post (the Mail division). At the level of the individual division, it is not possible to identify shareholder funds separately, since financing decisions are taken at the level of the Group as a whole. For this reason, we focus in the present report on the ROCE and contrast this with the relevant benchmark.
Since the ROCE implicitly assumes a similar financing structure of the mail division to the total capital invested in a firm, the relevant benchmark must also be calculated assuming the same financing structure (i.e. taking account of the relative importance of debt and equity). This benchmark is the cost of capital of the Mail Division. We calculate Deutsche Post’s cost of capital in Section 4.
We now turn to the interpretation of ROCE and ROS as profitability measures. Our profitability calculations are contained in Section 5.
3.4. Interpreting ROCE and ROS
Care needs to be taken with interpreting ROCE and ROS as measures of economic profitability and we explain some of the issues in this section. 17 Average of 31 March 2005 and 31 March 2006.

The Profitability of The Mail Division of Deutsche Post
The Appropriate Profitability Measure
NERA Economic Consulting 10
3.4.1. ROS and Profitability
It is important to understand that ROS bears no direct relation with economic profitability and may not be interpreted by comparison with the cost of capital. ROS needs to be compared with some other case-specific benchmark to be meaningful. This case-specific benchmark could for example be the ROS of operators in the same or similar markets (but where it is undisputed that prices are not excessive). The need to identify an appropriate case-specific benchmark taking into account special factors that may distort comparisons complicates the assessment of ROS measures of profitability. Therefore, there are margins of error around the benchmark to be used for ROS (i.e. some reference ROS).
3.4.2. Measuring “Capital”
3.4.2.1. Tangible and Intangible Assets
What matters to the validity of ROCE is that the measure of capital used to calculate ROCE is a good proxy for the economic capital of the company. If the company’s assets are largely physical, it will be more straightforward to accurately measure its economic capital than if its fixed capital base is small and its assets largely consist of intangible and off-balance sheet items such as brand, intellectual property and learning by doing. Intangible assets are harder to observe and quantify than physical assets but they should and can still be included in a measure of ROCE. As long as true capital employed is carefully estimated, ROCE remains a valid measure of profitability even if capital intensity is low. Higher margins for error should be allowed for where quantification of intangible assets is required.
While intangible off-balance sheet assets undoubtedly play a role in all firms and sectors, they are particularly of importance in research and development (R&D) intensive sectors.18 As a service provider, Deutsche Post does not carry out any R&D19 and thus no adjustment for off-balance sheet assets due to R&D is necessary.
3.4.2.2. Capital Intensity
We are unable to assess the level and development of capital intensity for the mail division of DP, as we do not posses the necessary capital expenditure data at the segmental level. We therefore have to rely on other forms of evidence to evaluate the capital intensity of DP’s Mail division.
Figure 3.1 shows the automation rate of mail centres for DP from 1998 to 2005. We believe this variable to be a good proxy for capital intensity. It reflects the effort undergone by DP to improve efficiency by relying increasingly on capital goods. We can see that the percentage of letters processed automatically significantly increased, from 80% in 1998 to 89% in 2005.
18 According to US GAAP, research and development costs are generally to be recorded as an expense immediately.
According to IFRS, a difference is to be made between research and development. Research costs are to be entered immediately as an expense, whereas development costs that fulfil specific criteria are to be capitalized and amortized.
19 Deutsche Post Annual Report 2005, p. 46.

The Profitability of The Mail Division of Deutsche Post
The Appropriate Profitability Measure
NERA Economic Consulting 11
Figure 3.1 Automation Rate of Mail Centres20
74%
76%
78%
80%
82%
84%
86%
88%
90%
1998 1999 2000 2001 2002 2003 2004 2005
Source: NERA Analysis of Deutsche Post’s Annual Reports (1998 to 2005).
DP’s Annual Reports also provide us with some anecdotal evidence of significant capital investments made in the mail division since 2001, as can be seen in the following quotations:
“In the MAIL Corporate Division, we invested chiefly in technical equipment for our national mail centers and purchased replacement equipment relating to the operation of our mail network.”21
“In 2005, the MAIL Corporate Division invested mainly in technical equipment and the expansion of its information technology.”22
“The automation rate at our mail centres remains high at 89%. We use all available technical and operational options to ensure high-quality processing of mail, and to work efficiently. […] In February 2005, we introduced integrated route planning and optimisation software that enables better planning of mail delivery routes.” 23
“In the Mail Corporate Division, we invested in particular in vehicles and technical equipment.”24
20 Percentage of letters processed by automated systems. 21 Deutsche Post, Interim Report, 2006, p. 7. 22 Deutsche Post, Annual Report, 2005, p. 56. 23 Deutsche Post, Annual Report, 2005, pp. 35-36. 24 Deutsche Post, Annual Report, 2004, p. 57.

The Profitability of The Mail Division of Deutsche Post
The Appropriate Profitability Measure
NERA Economic Consulting 12
“In the MAIL Corporate Division, we renewed vehicles, machinery, and technical equipment, and had to procure additional vehicles for the expansion of our joint delivery system. In addition, we purchased sorting systems equipped with state-of-the-art scanner technology. We intend to use them to increase throughput times.”25
“Well over 90% of standard and compact letters were sorted by machine. Modern coding and sorting programs allowed us to further increase sorting quality and the proportion of addresses read automatically.”26
“In the Mail Corporate Division, we invested in operating assets and technical equipment for our mail sorting centres.”27
“Investments boost automation.”28
All these quotes show an increasing reliance on technology and capital goods in the mail service.
3.4.2.3. Operating Leases
We also need to consider the effect of operating leases on our ROCE figures. Operating leases do not appear on a company’s balance sheet; the existence of operating leases effectively “leverages” the company’s balance sheet. In order to adjust for this type of off-balance sheet finance, we need to adjust the numerator and denominator of the accounting ROCE figure:
§ Adjustment to numerator: the implicit interest component in the operating lease payment must be added back to EBIT (as EBIT is after operating lease payments, but before interest payments)
§ Adjustment to denominator: the capitalized value of the operating leases have to be added to the (accounting) capital employed, by taking the net present value of the operating lease payments.
The adjustment to the numerator has an effect of increasing ROCE and the adjustment to the denominator is of contrary nature, i.e. it decreases (accounting) ROCE. The overall effect of both adjustments is uncertain.
We note, however, that DP’s annual accounts do not disclose data on operating lease obligations on a segmental basis. Therefore, in our analysis, we did not account for operating leases. This is a point worth examining further if segmental data becomes available.
25 Deutsche Post, Annual Report, 2003, p. 71. 26 Deutsche Post, Annual Report, 2003, p. 36. 27 Deutsche Post, Annual Report, 2002, p. 35. 28 Deutsche Post, Annual Report, 2001, p. 66.

The Profitability of The Mail Division of Deutsche Post
The Appropriate Profitability Measure
NERA Economic Consulting 13
3.4.3. Defining an Excessive ROCE
In defining an “excessive” ROCE, we must assess reasons why ROCE could be higher than the cost of capital. We must ensure that our minimum ROCE benchmark takes account of those reasons which are unrelated to excess profitability.
§ Real option theory suggests that where sunk investment costs and uncertainty about its costs and payoffs matter, the value of the “option” to invest can drive a wedge between the admissible level of ROCE and the cost of capital. Essentially, companies will be reluctant to commit themselves today to a sunk investment unless the return from not waiting is in excess of the cost of the invested capital. This excess might then not indicate excessive pricing. However, we do not believe that the value of real options is significant in the context of an assessment of the profitability of DP’s mail division.
§ ROCE will equal the cost of capital only in a perfectly competitive or a perfectly contestable market. Perfectly competitive are markets with an extremely large number of sellers producing homogeneous products, an extremely large number of buyers, perfect information about products, prices and market conditions, no barriers to entry, no barriers to exit, and access to perfect capital markets. Perfectly contestable markets satisfy similar conditions except that the number of companies can be smaller than in perfectly competitive markets. What forces companies in perfectly contestable markets to keep prices at the competitive level is the threat of hit-and-run entry. Perfectly competitive and perfectly contestable markets are rarely found in practice. Yet, while small differences between ROCE and the cost of capital will be frequent, very large differences provide an indication for excessive profitability.
§ Economic profits can have a dynamic function of rewarding success and providing incentives for innovation. This dynamic benefit may to some extent compensate for static welfare losses associated with market power. Again, this suggests that ROCE can be above the cost of capital without being objectionable.
§ In a context of uncertainty, a distinction needs to be drawn between ex ante and ex post profitability. Some activities can have apparently high (low) ex-ante returns relative to assets due to the realisation of increases (decreases) in business risk over the period not captured within the cost of capital estimate. High ex post profits on particular activities relative to assets can therefore reflect business risk, at least in the short run, without indicating excessive pricing.
In light of these arguments, we agree with Derek Morris, the former Chairman of the UK Competition Commission, that
“There is no per se reason why profits in excess of the cost of capital represent anything other than the effective working of a competitive market. It is only where profitability is a) substantially above the cost of capital and b) across most or all companies in a market over c) a sustained period of time, that concerns arise. But when this does apply then arguably it is a clear indication that competition is not working properly and is not fully effective.”29
29 D. Morris (2003), “Dominant Firm Behaviour under UK Competition Law”, paper presented to the Fordham Corporate
Law Institute, p. 20ff.

The Profitability of The Mail Division of Deutsche Post
The Appropriate Profitability Measure
NERA Economic Consulting 14
Similar considerations would of course apply to an interpretation of ROS relative to a suitable benchmark, should this measure be used (despite our strongly held conviction that ROCE is a preferable measure). I.e. it is only where ROS is substantially and persistently above a suitable benchmark that concerns arise.

The Profitability of The Mail Division of Deutsche Post
The Cost of Capital of DP’s Mail Division
NERA Economic Consulting 15
4. The Cost of Capital of DP’s Mail Division
4.1. Introduction to Cost of Capital and NERA Methodology
In order to assess whether DP’s mail division is making excess profit, we must estimate the cost of capital as a benchmark for comparison with realised rates of return. The cost of capital represents the minimum rate of return that will compensate investors and lenders for the risks of providing finance to a company.
We estimate the cost of capital for DP’s mail division on the basis of an assumption that it is privately financed; excluding the impact of government ownership on the cost of capital. This will ensure that our estimate represents the rate of return that would be required by the market to provide finance for mail activities in Germany.
We detail key aspects of our methodology used to estimate the cost of capital for DP’s mail divisions in Appendix A. Section 4.2 presents a summary of our results.
4.2. Estimate of Cost of Capital
Table 4.1 summarises our findings on the cost of capital. Our estimates range between 7.0 and 8.7 per cent for the real pre-tax weighted average cost of capital (WACC).
Table 4.1 Cost of Capital
1 Year 5 Year Real risk-free rate 1.6% 2.7% Equity risk premium 5.9% 5.9% Asset beta 0.68 0.74 Equity beta 0.93 1.01 Cost of equity post-tax 7.1% 8.7% Cost of equity pre-tax 8.8% 10.8% Cost of Debt 2.0% 2.8% Gearing (D/(D+E)) 27% 27% D/E 37% 37% Effective Tax Rate for DP (2005) 20% 20% Real pre-tax weighted average cost of capital 7.0% 8.7%
Source: NERA. Numbers are rounded.
The weighted average cost of capital (WACC), derived from the cost of equity and the cost of debt, gives us estimates of 7.0 and 8.7 per cent on a one year and five year basis. In the

The Profitability of The Mail Division of Deutsche Post
The Cost of Capital of DP’s Mail Division
NERA Economic Consulting 16
Annual Report 2005, Deutsche Post presents their own estimate of the post-tax WACC as being 5.9 per cent.30 This corresponds to a pre-tax WACC of 7.4 per cent for 2005, assuming a tax rate of 19.82 per cent, which lies within the 7.0% to 8.7% range implied by our estimates. We are therefore confident that our range appropriately reflects the cost of capital of DP.
30 Deutsche Post Annual Report 2005, p. 47.

The Profitability of The Mail Division of Deutsche Post
The Profitability of DP’s Mail Division
NERA Economic Consulting 17
5. The Profitability of DP’s Mail Division
5.1. Return on Capital Employed in the Mail Division
Since 1999, Deutsche Post has provided a segmental breakdown of its accounts in accordance with the International Accounting Standards (IAS 14).31 In the segmental reporting according to IAS 14, EBIT is disclosed by segment. In addition, segment assets and segment liabilities are reported. The information at segment level is subject to changes and revisions. Given the restrictions on publicly available information we calculate and present what we accurately believe to capture the ROCE. We provide more detailed information in Appendix C.
Although Deutsche Post’s accounts provide a breakdown by business segment, it is not possible to allocate all revenues, costs, assets and liabilities to individual segments. This for example applies to certain intra-Group transactions that need to be eliminated when consolidating the segment accounts, and to certain overhead activities. To this end, an additional “other/consolidation” segment is included. Since 2006, Deutsche Post created a new corporate division called “services”. This partly replaces the former “other/consolidation” corporate division. This new segment pools so-called cross-divisional global business services.32 We caveat that Deutsche Post may have shifted income and expenses from its operating corporate divisions to the new Service segment which might have an impact on the 2006 interim profitability measure for DP’s Mail division.
It could be argued that when assessing the profitability of individual segments, “Services” segment and “Other/consolidation” segment should be allocated to the individual segments even if there is no clear method for doing so. For example, corporate overhead costs (e.g. investor relations) do not relate in a clear way to individual segments but do ultimately benefit them. On the other hand, as far as eliminating intra-Group transactions is concerned, the case for allocating the “other/consolidation” segment (and since 2006 the Services segment) is less clear.
We therefore analyse the profitability of the Mail division in two ways:
§ on the basis of the segmental figures provided in the accounts without allocating the “Services” and “other/consolidation” segment; and
§ on the basis of the segmental figures provided in the accounts plus an allocation of the “Services” and “other/consolidation” segment.
Various changes in accounting methodologies and reclassifications have led DP to restate their financial results in subsequent annual reports. In the tables below we report key financial indicators and profitability measures based on DP’s annual reports. If changes in DP’s accounting methodology led to a restatement of financial figures in subsequent annual reports, we re-state the relevant figures for the appropriate year using an (r).
31 Since the 1999 report also contained the segmental breakdown for 1998 for comparison purposes. 32 They include for example, the legal, procurement, IT services, real estate and fleet management units and those branch
offices that were not sold to Deutsche Postbank.

The Profitability of The Mail Division of Deutsche Post
The Profitability of DP’s Mail Division
NERA Economic Consulting 18
We present and analyse data from 1998 to 2006 H1. In general we observe that EBIT has remained relatively stable over most of the period (with the exception of a significant increase from 1999 to 2000). In contrast, our measure of capital employed decreases over most of the years under investigation. Consequently, ROCE increases over most of the period. We point out that many changes in the level of the ROCE are due to accounting changes related to the reporting of data in the Annual Reports of Deutsche Post.

The Profitability of The Mail Division of Deutsche Post
The Profitability of DP’s Mail Division
NERA Economic Consulting 19
Table 5.1 below contains the ROCE calculation without allocation of the “Services” and/or “Other/consolidation” segment.
Table 5.1 Key Financial Indicators for Deutsche Post’s Mail Division, 1998-2006H1 (€m)
(€m) 1998 1999 2000 2001 2001 (r) 2002 2002 (r) 2003 2003 (r) 2004 2005 2006 H1* Total Revenue 11,272 11,671 11,733 11,707 11,707 11,666 12,129 11,934 12,495 12,747 12,878 6,459 EBIT 944 1,008 2,003 1,958 1,958 1,656 2,138 2,026 2,067 2,072 2,030 1,024 Segment Assets 5,484 5,925 5,586 5,049 4,414 4,311 4,862 4,224 4,055 4,198 3,664 4,750 Segment Liabilities 1,084 1,341 1,405 1,246 1,020 1,027 1,763 2,040 2,040 2,076 1,926 2,096 Capital Employed 4,400 4,583 4,181 3,803 3,394 3,284 3,099 2,184 2,015 2,122 1,738 2,654 ROS 8.4% 8.6% 17.1% 16.7% 16.7% 14.2% 17.6% 17.0% 16.5% 16.3% 15.8% 15.9% ROCE 21.4% 22.0% 47.9% 51.5% 57.7% 50.4% 69.0% 92.8% 102.6% 97.6% 116.8% 38.6%
Source: Calculated from Deutsche Post AG annual reports 1999-2005; 2006H1 figures are taken form DB’s Interim Report (January to June) 2006 Note: (1) (r) stands for restated, due to changes in accounting methodologies and reclassifications, financial figures have ex-post been restated in the subsequent annual report; (2) Segment Liabilities include non-interest-bearing provisions from 2002 (r). * Figures should be treated with care, as they correspond to the first 6 months of DP’s financial year only. EBIT figures therefore only count the profits of 6 months.
The results of the second approach, allocating the “Services” and/or “Other/consolidation” segment to the individual segments, are shown in Table 5.2. We have allocated the “Services” and/or “Other/consolidation” segment on the basis of revenue shares of the individual segments. Details of the allocation can be found in Appendix C.

The Profitability of The Mail Division of Deutsche Post
The Profitability of DP’s Mail Division
NERA Economic Consulting 20
Table 5.2 Key Financial Indicators for Deutsche Post’s Mail Division: Mail with Other/Consolidation
and Services Allocation, 1998-2006H1 (€m)
(€m) 1998 1999 2000 2001 2001 (r) 2002 2002 (r) 2003 2003 (r) 2004 2005 2006 H1* Total Revenue 10,899 11,029 11,276 11,202 10,808 10,857 11,540 11,352 12,099 12,317 12,384 6,276 EBIT 868 919 1,893 1,869 1,871 1,566 2,051 1,958 1,993 2,050 2,199 969 Segment Assets 8,098 5,247 5,763 5,176 4,491 4,245 4,741 4,043 3,913 4,002 3,832 5,255 Segment Liabilities 1,955 703 1,527 1,420 1,172 1,312 2,220 2,130 2,136 2,325 1,974 2,247 Capital Employed 6,143 4,544 4,236 3,756 3,320 2,933 2,521 1,913 1,777 1,677 1,858 3,009 ROS 8.0% 8.3% 16.8% 16.7% 17.3% 14.4% 17.8% 17.2% 16.5% 16.6% 17.8% 15.4% ROCE 14.1% 20.2% 44.7% 49.8% 56.4% 53.4% 81.4% 102.4% 112.1% 122.2% 118.3% 32.2%
Source: Calculated from Deutsche Post AG annual reports 1999-2005; 2006H1 figures are taken form DB’s Interim Report (January to June) 2006 Note: (1) (r) stands for restated, due to changes in accounting methodologies and reclassifications, financial figures have ex-post been restated in the subsequent annual report; (2) Segment Liabilities include non-interest-bearing provisions from 2002 (r). * Figures should be treated with care, as they correspond to the first 6 months of DP’s financial year only. EBIT figures therefore only count the profits of 6 months.

The Profitability of The Mail Division of Deutsche Post
The Profitability of DP’s Mail Division
NERA Economic Consulting 21
In 1998 and 1999, the ROCE in the Mail division of Deutsche Post was between 17 and 22 per cent. The earnings before interest and taxes almost doubled in 2000 and as a result, the ROCE increased to almost 48 per cent. This large increase of the EBIT is mainly due to a decline in operating expenditure of €974m, following a reduction in contributions to the Deutsche Post Pensions Service.33 Until the end of 1999, Deutsche Post was obliged to pay a fixed amount into a Defined Contribution Plan. Since 2000 Deutsche Post pays an amount into the pension scheme equal to 33 per cent of the annual gross salary of civil servants employed, including those on leave. The change in the contribution scheme led to a fall of €1,362m in contributions.34
In 2001, ROCE was between 50 and 58 per cent. It is worth noting that the restated figures for 2001 are around 5 per cent higher; this is mainly due to the reallocation of retail outlets operations from Other/Consolidation to Financial Services. This affected the segment assets and liabilities reported. Between 2001 (restated) and 2002, ROCE decreased. The 2002 annual report notes that this fall was due to cost increases in the Mail division.
The 2003 annual report restates 2002 financial figures. The restated financial figures cause the ROCE to increase significantly to approximately 70 to 80 per cent (depending whether one includes the allocation of “other/consolidation” in the ROCE calculation). This increase is largely due to the change in the segmental reporting methodology: DP’s 2003 annual report states Segment Liabilities inclusive of non-interest-bearing provisions whereas the 2002 annual report excludes these provisions from the Segment Liabilities. The EBIT was also restated after the reclassification of interest cost on pension obligations and other interest-bearing provisions from EBITA to net finance costs. It is important to realise that the observed jump in the ROCE from 2002 to 2002 (r) is purely due to changes in the accounting methodology. We believe the restated figures to be a better measure of the ROCE than the original figures.
In 2003, ROCE increased once again compared to the ROCE based on the 2002 re-stated figures to more than 100 per cent (including Other/Consolidation) and to almost 93 per cent (excluding Other/Consolidation). This increase is largely due to a fall in segment assets. 2003 financial figures have also been restated in the subsequent financial accounts, causing the ROCE to increase to a level above 100 per cent (with and without Other/Consolidation).
In 2004, the ROCE stayed roughly constant at its 2003 level. If we account for the allocation of “other/consolidation” in calculating ROCE, the ROCE turns out be significantly higher at around 120 per cent, compared to 98 per cent if we exclude the “Other/consolidation” segment from our analysis.
In 2005, ROCE is above 100 per cent and at a comparable level to 2004. It is worth noting that the 2005 figures will be restated in the 2006 annual report on 31 December 2006.35 Following the acquisition of William Lea, Exel and BHW, adjustments in the purchase price allocation have to be done in accordance with IFRS3.36 These will affect the balance sheet. 33 Deutsche Post, Annual Report 2000, p. 44. 34 Deutsche Post, Annual Report 2000, p. 111. 35 We note that the DP’s 2006 Interim Report (January – June) does not report restated figures on a segmental basis. 36 Deutsche Post, Interim Report 2006, pp. 22-26.

The Profitability of The Mail Division of Deutsche Post
The Profitability of DP’s Mail Division
NERA Economic Consulting 22
The income statement will also be adjusted after changes in the accounting policy for the deferral of expenses relating to sales activities for mortgage loans were introduced. Furthermore, reclassifications between materials expenses and other operating expenses will have an impact.37 We estimate the impact on ROCE to be, however, immaterial and we expect the ROCE to be well above 100 per cent based on the restated financial figures.38
The 2006 H1 figures must be interpreted with caution as the EBIT represents only the six months from January to June. A rough estimate would suggest that the EBIT will be double the H1 amount at the end of the year. We do observe that the EBIT has fallen by 7.1 per cent as compared to H1 2005. We note this fall is mainly due to the fact that the 2nd quarter of 2006 had three working days less than the 2nd quarter 2005, and therefore does not represent a reduction in DB’s profitability.39
The ROCE figures according to both approaches are shown graphically in Figure 5.1 and Figure 5.2.
Figure 5.1 ROCE in Mail Division without
Other/Consolidation Allocation, 1998-2005
0.0%
20.0%
40.0%
60.0%
80.0%
100.0%
120.0%
140.0%
1998
19992000
2001
2001 (r
estated)
2002
2002 (restated
)2003
2003 (restated)
20042005
Figure 5.2 ROCE in Mail Division with
Other/Consolidation Allocation, 1998-2005
0.0%
20.0%
40.0%
60.0%
80.0%
100.0%
120.0%
140.0%
19981999
20002001
2001 (r
estated)
2002
2002 (r
estated)
2003
2003 (res
tated)2004
2005
Source: Calculated from Deutsche Post AG annual reports 1999-2005
5.2. The Relationship between Returns in the Mail Division and Returns in the Reserved Area
In the previous Section, we have provided estimates of the profitability of the Mail Division of Deutsche Post. A relevant question is also what the profitability in the reserved area is. Since no separate accounts for the reserved sector are currently available, this question cannot be answered at the present time.
37 Deutsche Post Interim Report 2006, p. 27. 38 All adjustments to the balance sheet add up to less than 1.4 per cent of all assets and liabilities (excluding receivables
and other securities from financial services, and liabilities from financial services). All adjustments to the income statements add up to €132 million in absolute value – compared to a total operating income of €48,279 million in 2005. (see Deutsche Post, Interim Report, pp. 26-27).
39 Deutsche Post Interim Report 2006, p. 10.
The Profitability of The Mail Division of Deutsche Post
The Profitability of DP’s Mail Division
NERA Economic Consulting 23
It is however worth repeating the importance of the reserved sector for the Mail division of Deutsche Post. As we have seen in Section 2.3.2, the reserved sector accounts for around 68 per cent of turnover in the Mail division.
The question is whether the fact that the reserved sector is protected from competition might suggest that returns in the reserved sector are higher than in the remainder of the Mail division, which faces some competition. Again, no data are available to us that can provide indications of this.
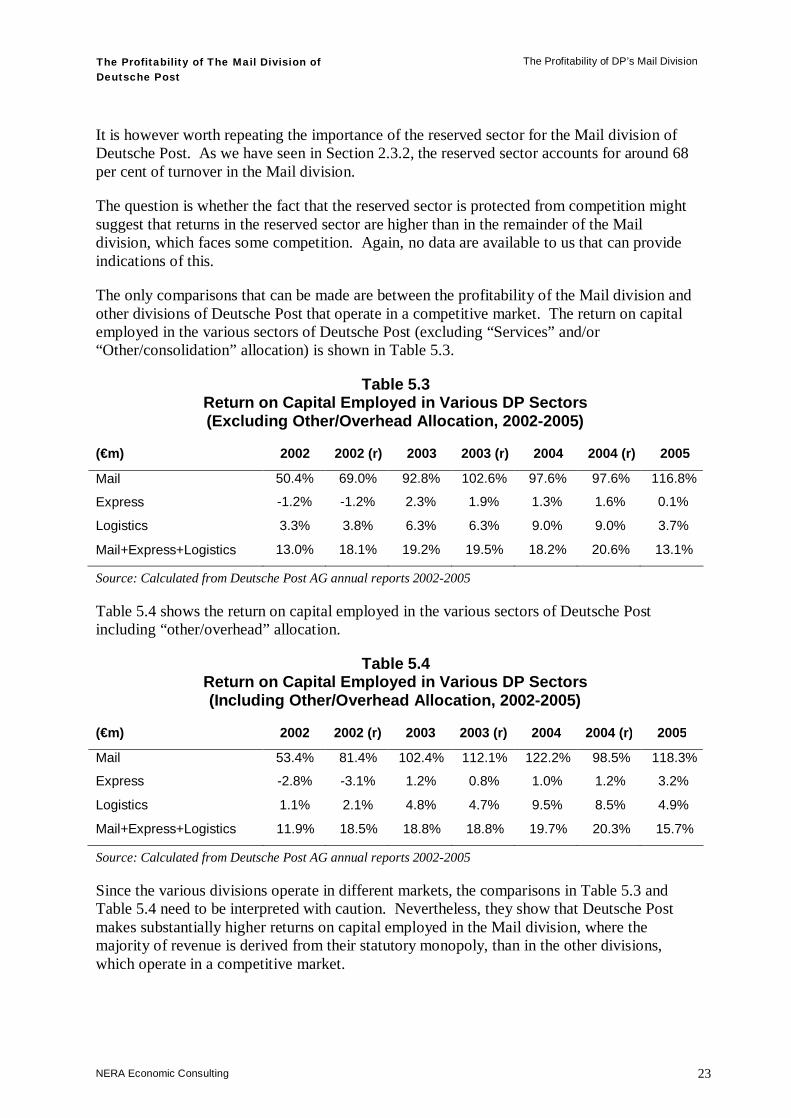
The only comparisons that can be made are between the profitability of the Mail division and other divisions of Deutsche Post that operate in a competitive market. The return on capital employed in the various sectors of Deutsche Post (excluding “Services” and/or “Other/consolidation” allocation) is shown in Table 5.3.
Table 5.3 Return on Capital Employed in Various DP Sectors (Excluding Other/Overhead Allocation, 2002-2005)
(€m) 2002 2002 (r) 2003 2003 (r) 2004 2004 (r) 2005
Mail 50.4% 69.0% 92.8% 102.6% 97.6% 97.6% 116.8%
Express -1.2% -1.2% 2.3% 1.9% 1.3% 1.6% 0.1%
Logistics 3.3% 3.8% 6.3% 6.3% 9.0% 9.0% 3.7%
Mail+Express+Logistics 13.0% 18.1% 19.2% 19.5% 18.2% 20.6% 13.1%
Source: Calculated from Deutsche Post AG annual reports 2002-2005
Table 5.4 shows the return on capital employed in the various sectors of Deutsche Post including “other/overhead” allocation.
Table 5.4 Return on Capital Employed in Various DP Sectors (Including Other/Overhead Allocation, 2002-2005)
(€m) 2002 2002 (r) 2003 2003 (r) 2004 2004 (r) 2005
Mail 53.4% 81.4% 102.4% 112.1% 122.2% 98.5% 118.3%
Express -2.8% -3.1% 1.2% 0.8% 1.0% 1.2% 3.2%
Logistics 1.1% 2.1% 4.8% 4.7% 9.5% 8.5% 4.9%
Mail+Express+Logistics 11.9% 18.5% 18.8% 18.8% 19.7% 20.3% 15.7%
Source: Calculated from Deutsche Post AG annual reports 2002-2005
Since the various divisions operate in different markets, the comparisons in Table 5.3 and Table 5.4 need to be interpreted with caution. Nevertheless, they show that Deutsche Post makes substantially higher returns on capital employed in the Mail division, where the majority of revenue is derived from their statutory monopoly, than in the other divisions, which operate in a competitive market.

The Profitability of The Mail Division of Deutsche Post
ROS Analysis
NERA Economic Consulting 24
6. ROS Analysis
In this section we compare DP’s ROS to that of the Royal Mail (RM), TNT and La Poste (France). The results for the last five years are summarised in Table 6.1. Deutsche Post’s ROS has been around 16 and 17 per cent over the period, taking the value of 15.8 per cent in 2005. TNT has a higher ROS than DP over the whole period considered. TNT’s ROS was 19.5 per cent in 2005. Royal Mail, in contrast, had a lower ROS than DP over the whole period considered. Royal Mail’s ROS was 3.9 per cent in 2005. La Poste’s ROS is lower than DP Mail’s. It is 4.4% during 2005.
As explained in Section 3.4.1, ROS may not be interpreted by comparison with the cost of capital. It may only be of value in a profitability study if contrasted with an appropriate benchmark. We believe that Royal Mail should serve as the benchmark when evaluating the profitability of a national mail regulator. Royal Mail has been closely regulated by Postcomm and as can be see in Table 6.2, it has low prices in an international comparison.
Noteworthy in Table 6.2 is also the pricing structure of Deutsche Post: DP’s prices are high as compared to the comparator companies up to and including the 100g category, but are lower than those of TNT and La Poste in the 150g section and above. DP’s prices are lower even than the Royal Mail’s prices in the 350g category. This compares with the reserved sector that corresponded to letters weighing less than 100g and with a price less than three times the rate for the lowest weight class during 2005 (the reference year of Table 6.2). While it would be wrong to draw any conclusions from such a simplistic comparison, it certainly appears that DP’s prices are competitive in the non-reserved sector, but high by international comparison in the reserved sector.
Deutsche Post’s ROS was substantially above the ROS of the Royal Mail throughout the whole period under investigation. In 2005 it was four times as high as that of RM.
Table 6.1 Return on Sales (ROS) Comparison
(%) 2001 2002 2003 2004 2005 DP 16.7% 17.6% 16.5% 16.3% 15.8% Royal Mail -2.4% 2.5% 6.0% 3.4% 3.9% TNT 20.0% 20.1% 20.9% 20.7% 19.5% La Poste 4.7% 3.8% 4.4% Source: Annual Reports. Notes: (1) Where restatements occurred, we used the latest available figures; (2) Royal Mail: (i) we used (total profit/(loss) from operations before exceptional items and pension deficit costs/pension surplus credits) divided by external sales; (ii) figures relate to financial year, e.g. 2005 relates to 26/3/2005-26/3/2006; (3) TNT: we used (operating income divided by total sales) for the mail segment; (4) La Poste: (i) segment profits not reported before Annual Report 2004; (ii) ROS was calculated by dividing mail segment profits by mail segment turnover; (iii) mail segment profits were calculated by taking net profits (as reported in the Annual Reports) and adding to them “non-allocated expenses” according to the mail segment’s share in total turnover; (iv) the calculation ignored “La Poste Grand Public”, which should, arguably, be added to the mail segment. Doing so decreases the ROS.

The Profitability of The Mail Division of Deutsche Post
ROS Analysis
NERA Economic Consulting 25
Table 6.2 Comparison of Basic Weight Postage Prices in Europe
Weight UK Netherlands Germany France
20g (3 sheets + envelope)
£0.30 £0.27 £0.38 £0.34
50g (9 sheets of paper)
£0.30 £0.55 £0.69 £0.51
100g £0.46 £0.81 £1.00 £0.76
150g £0.64 £1.08 £1.00 £1.31
200g £0.79 £1.08 £1.00 £1.31
350g (19 sheets of paper)
£1.21 £1.56 £1.00 £1.83
Source: House of Commons, Trade and Industry Second Report, Written Evidence, Supplementary Memorandum by Postcomm (Further Information Requested by the Committee on 15 November 2005), Table 6.
In Table 6.3 we present the ROS for the various segments of Deutsche Post. As is apparent, the Mail division’s ROS is greater than those of the other segments by some margin. In 2005, the ROS of Financial Services, which is the second most profitable division in terms of ROS, was almost a third lower than the ROS of the Mail segment.
Table 6.3 Return on Sales (ROS): Segment Comparison
(%) 2001 2002 2003 2004 2005 Mail 16.7% 17.6% 16.5% 16.3% 15.8% Express 2.0% -0.5% 1.0% 0.7% 0.1% Logistics 0.5% 1.4% 2.0% 2.7% 4.0% Financial Services 5.9% 7.8% 7.4% 9.7% 10.9% Source: Deutsche Post Annual Report 2005 (8-Year Review). ROS calculated as EBIT divided by Revenue.

The Profitability of The Mail Division of Deutsche Post
Conclusions
NERA Economic Consulting 26
7. Conclusions
In this report we have assessed the profitability of Deutsche Post’s mail division. We found a ROCE value of between 116.8 and 118.3 per cent in the mail division during the latest year, 2005. This is substantially above our estimated cost of capital of between 7.0 and 8.7 per cent. We presented profitability data reaching back to 1998 and found that DP’s ROCE has been substantially and persistently above our estimated cost of capital.
We argued that ROCE is the correct measure of profitability and that it is to be preferred to returns on sales (ROS). We argued that ROCE adequately measures the reward to capital and is the best available proxy for economic profitability. We can therefore compare it with the cost of capital to determine whether an investment is appropriately rewarded, under-rewarded, or over-rewarded.
We also presented DP’s ROS and compared it to other mail providers in Europe. We acknowledged that DP’s ROS is not out of line when compared to TNT of the Netherlands. However, we argued that UK’s Royal Mail ought to serve as the basis of comparison for DP’s ROS. Our analysis showed that DP’s ROS is four times the value of Royal Mail’s ROS during 2005 and has been persistently above Royal Mail’s ROS over the whole period 2001 to 2005.
Our results are in line with the findings of our earlier reports in 2003 and 2005.40 We note that the ROCE has increased substantially since the publication of our 2003 report. We acknowledge that this increase reflects to a large degree changes in accounting practices. We believe current levels and calculation of the ROCE to be an accurate measure of DP’s profitability. We also note that the increase in ROCE occurred at the same time as an increase in capital intensity.41
While DP has faced competition in other segments, it was able to generate substantial profits in the mail division. We showed that DP’s profits in the mail division are significantly higher than in other divisions and have been so over the whole period under investigation.
Deutsche Post will continue to benefit from its exclusive licence in the reserved area until the 1 January 2008.
40 NERA (2003), “The Profitability of the Mail Division of Deutsche Post”, and NERA (2005), “Response to the
Commission on the Measurement of the Profitability of DP’s Mail Division”. 41 See the discussion in Section 3.4.2.2.

The Profitability of The Mail Division of Deutsche Post
Appendix A
NERA Economic Consulting 27
Appendix A. The Cost of Capital of DP’s Mail Division
A.1. Introduction to Cost of Capital and NERA Methodology
In order to assess whether DP’s mail division is making excess profit, we must estimate the cost of capital as a benchmark for comparison with realised rates of return. The cost of capital represents the minimum rate of return that will compensate investors and lenders for the risks of providing finance to a company.
We estimate the cost of capital for DP’s mail division on the basis of an assumption that it is privately financed; excluding the impact of government ownership on the cost of capital. This will ensure that our estimate represents the rate of return that would be required by the market to provide finance for mail activities in Germany.
We detail key aspects of our methodology used to estimate the cost of capital for DP’s mail divisions in the following subsections.
A.1.1. Methodology for Estimating the Cost of Capital
In order to estimate the cost of capital we use the standard approach, which is the weighted average cost of capital (WACC). The WACC takes a weighted average of the cost of equity and the cost of debt. The weights of equity and debt are given by their respective shares in total capital.
A.1.2. Methodology for Estimating the Cost of Equity
The traditional framework for estimating the cost of equity is through use of the Capital Asset Pricing Model (CAPM). The CAPM is the most widely used method for calculating the cost of equity for European regulated utilities. Under the CAPM, the cost of equity is calculated as:
(1.1) E[re] = E[rf]+ βequity(E[rm]-E[rf])
where,
E[re] is the expected return on equity;
E[rf] is the expected return on a risk-free asset;
E[rm] is the expected rate of return for the market (and thus E[rm]-E[rf] is the expected risk premium); and,
Βequity is a measure of the systematic riskiness of the equity, the “equity beta”.
The CAPM estimates the appropriate cost of equity by only taking account of "systematic" (non-diversifiable) risks. This model is based on the premise that investors do not require a premium for company specific risks since these risks can be diversified away by holding a broad portfolio of assets.

The Profitability of The Mail Division of Deutsche Post
Appendix A
NERA Economic Consulting 28
In the CAPM framework, the direct measure of systematic riskiness is the beta coefficient, which is a measure of the co-movement of returns to a particular asset or portfolio with the overall market portfolio.
In order to estimate the company-specific component of the CAPM, the beta, we examine a range of evidence, in order to ensure that our estimate is robust:
§ Estimates of beta for DP
§ Regulatory precedent on beta for mail division
§ Estimates of beta for comparator companies
A.1.3. Measurement Period for Parameters
In estimating the WACC, we must decide on the historical time period used to estimate parameters. In the case of the equity risk premium, a robust estimate can typically only be derived from long run ex-post historical returns.42 The risk-free rate, beta and cost of debt estimates can be estimated using shorter run evidence.
Our primary objective is to ensure that our estimates are consistent with our estimates of the return on capital and return on sales that we use to assess DP’s mail profitability. Our primary estimates of ROCE and ROS are based on a one year measurement period December 2004 to December 2005.
However, evidence shows that CAPM parameters are interrelated: in particular the risk-free rate and equity risk premium are inversely correlated. Using a short term estimate of the risk-free rate and beta with a long term estimate of the equity risk premium may therefore lead to biases in the cost of capital estimate. Since we cannot use short term evidence on the equity risk premium, we must look at longer term evidence on the risk-free rate and beta. We typically consider a five year period as sufficiently long to ensure that estimates are not biased by short term cyclical factors or market volatility. This is particularly relevant at present, where real interest rates are at historically low levels.
Our primary estimate therefore considers one year evidence on the risk-free rate and beta for DP, but we also present secondary evidence based on five years. We do this to check that our recent estimates are not significantly different from those based on longer term evidence. Where there is a significant difference, we present both sets of estimates.
A.1.4. Choice of Reference Market
From an investor’s perspective, the cost of capital should be estimated with reference to the financial market that best represents their investment opportunity set, as the cost of capital for
42 This evidence may be supplemented with ex-ante estimates, but the latter should not be relied upon in isolation. This is
because typical approaches such as surveying market practitioners and DGM-based estimates are subject to a number of potential biases. In the case of surveys, respondents may have an incentive to over- or understate their true perception of the equity risk premium according to the purpose of the survey. In the case of DGM based evidence, the key long run growth parameter must be chosen by the analyst; the results are therefore necessarily open to biases arising from subjective choices.

The Profitability of The Mail Division of Deutsche Post
Appendix A
NERA Economic Consulting 29
any single investment is defined by the entire portfolio of investment opportunities to which an investor has access. This “set” is commonly referred to as the “market portfolio”.
In theory the “market portfolio” should include both traded and non-traded assets. However, in practice cost of capital parameters are calculated with respect to readily available stock market indices, and therefore the “market portfolio” only captures assets listed on a stock exchange, to the exclusion of unlisted assets.
The next key question is whether to use a domestic stock market index, or regional or worldwide indices. The Eurozone market is our preferred choice, given the relative lack of barriers to movement of capital within this market implied by the shared currency. On the other hand, the highly integrated nature of financial markets suggests that the opportunity set facing investors is wider than the Eurozone market.
Transaction costs and taxation barriers to investment in securities across countries have declined over time. It is now a simple matter to purchase and sell shares traded on exchanges in other countries. For example, the purchase of ADRs and ADSs (American Deposit Receipts/Shares) provides a simple means for accessing equity in foreign companies, as do a wide range of German funds that hold an international portfolio of equity investments.43
It is also true that by spreading risks among different domestic equity markets, investors can achieve lower risks and/or improve investment returns.
In short, the integration and linkages between the Eurozone, wider European and Worldwide capital markets have greatly solidified in the last decade. Whilst we consider Eurozone evidence as most relevant to DP’s investors, wider European and US data are both relevant to typical Eurozone investors.
A.2. Risk-Free Rate
The expected return on a risk-free asset, (E[rf]), or the “risk-free rate”, is the return on an asset which bears no systematic risk at all. Alternatively, the real risk-free interest rate can be thought of as the price that investors charge to exchange certain current consumption for certain future consumption. In part, it is determined by investors’ subjective preferences and in part by the nature and availability of investment opportunities in the economy.
Our estimate of the risk-free rate consistent with our estimates of ROCE and ROS is based on a one year average of index-linked government yield evidence. We also assess five year historical averages as a cross-check.
Our preferred methodology is based on the following principles:
Preference for the use of index-linked evidence where possible. First, ILG yields are by construction insulated from the effects of unanticipated inflation. Yields therefore by construction do not include premia for inflation risk. Second, it has been argued that the
43 To illustrate, low-cost foreign index funds called “WEBS”, an acronym for World Equity Benchmark Shares, eliminate
some of the guesswork and costs involved in investing internationally. Each WEBS Index Series seeks to match the performance of a specific Morgan Stanley Capital International (MSCI) index.

The Profitability of The Mail Division of Deutsche Post
Appendix A
NERA Economic Consulting 30
yields on index-linked government bonds are less correlated with the market than the yields on Treasury bills and other government bonds, and are therefore closer to satisfying the theoretical requirement of having a zero beta. ILG markets have substantially increased in size and liquidity in recent years; concerns regarding the presence of liquidity premia in yields are no longer significant. We therefore consider index-linked government bond yields as our preferred basis for the estimation of the real risk-free rate.
Use of maturities of ten years or greater. With regard to the appropriate bond term or maturity, there are three main options – i) the “investment horizon” or security holding period for a representative equity investor, equivalent to the CAPM horizon; ii) the “planning horizon”, that is the average life of projects that are to be assessed using the estimate of the cost of capital; and iii) the time-horizon of the periodic review is the appropriate measure, as this offers an opportunity to readjust the ex-ante return on the asset base. The preferred academic position - since the CAPM is a single period model - is to choose a maturity that is consistent with the investment horizon, as this represents the rate of return demanded by an investor over the lifetime of their investment. However, whilst the determination of the appropriate investment horizon is unclear,44 regulators globally are increasingly using securities with maturities of around 10 years as the appropriate measure of the risk-free rate.45
We estimate the risk-free rate for DP’s mail division using index-linked bonds with a maturity greater than ten years over our measurement horizons of i) five years and ii) one year. We use French index-linked bonds as our Eurozone proxy – Germany does not have index linked government bonds in issuance and the French market is the largest and most mature of other ILG markets with the Eurozone market.
Our estimates are shown in the Table below.
Table A.1 Estimates of Risk-Free Rate based on French ILGs
Issue Date Maturity Date 1Y Average Yield 5Y Average Yield 01/10/1999 25/07/2029 1.6% 2.7% 31/10/2002 25/07/2032 1.6% N/A 22/01/2004 25/07/2020 1.5% N/A
Source: Bloomberg. 1Y Average measured 1st January to 31st December 2005. 5Y Average measured 1st January 2001 to 31st December 2005.
44 A theoretical argument that is sometimes made in regulatory discussions is that "investment horizons" are heavily
influenced by the nature of the regulatory regime. The WSA/WCA (1991) argued: "The nature of the regulatory regime is such that each price review process represents an opportunity and indeed a requirement to redetermine the ex ante earnings potential of the assets….(T)o conclude the ten (or five) year time period between Periodic Reviews would seem to provide the most appropriate benchmark for determining the true time horizon to be used in estimating the risk-free rate." However, this argument overlooks the fact that in practice regulated companies issue bonds of considerably longer maturity than the periodicity of the price review, typically 5 years, and these bonds have to be serviced over their entire lifetime.
45 The main reason underlying this choice is that the 10-year bond is typically the security that has the closest maturity to the 15 year-plus investment profile of utility assets.

The Profitability of The Mail Division of Deutsche Post
Appendix A
NERA Economic Consulting 31
The average of 1Y average estimates is 1.6 per cent, whilst the 5Y average yield is 2.7 per cent. The significant difference in these estimates is attributable to the current historically low levels of real interest rates.
Our primary estimate of the cost of capital is based on the one year average yield, as this is consistent with our estimates of ROCE. However, we additionally present an upper bound, calculated on the basis of five years historical data on the risk-free rate.
A.3. Beta
Table A.2 below presents our estimates of Deutsche Post’s one and five-year beta against that of the Dow Jones Stoxx 600 index (DJ SXXP). Both adjusted equity beta estimates are very close to each other. We show the development of the equity beta over time in Figure A.1. As can be seen, the one-year equity beta has been on a downward trend since July 2005. It currently stands at 0.85. The current value of the five-year equity beta is 0.95.
Table A.2 DP One and Five-Year Equity and Asset Betas
Company Name
Index Adjusted Equity Beta
Debt / Equity Standard Error of Beta
Implied Asset Beta
1 Year DJ SXXP 0.93 0.37 0.22 0.68 5 Year DJ SXXP 0.93 0.25 0.09 0.74 Source: NERA analysis of Bloomberg data. Debt to Market Capitalisation from DP’s Annual Reports 2002-2005. Calculations for the 1 and 5 year betas are for the period 12/2004-12/2005 and 12/2001-12/2005 respectively.
Figure A.1 below sets out the movement of DP’s one year rolling equity beta since 2001.

The Profitability of The Mail Division of Deutsche Post
Appendix A
NERA Economic Consulting 32
Figure A.1 Deutsche Post Equity Beta
Source: NERA
The Figure shows that the beta jumped significantly in September 2002. This is associated with the removal of the effect of a large jump in DP’s share price in the week immediately following 9/11, whilst the price of the market index fell significantly over the same period. The movement of the DP stock price against that of the Dow Jones European Stoxx index is shown in Figure A.2.
0
.25
.5
.75
1
1.5
01jul2001 01jul2002 01jul2003 01jul2004 01jul2005 01jul2006
Adjusted Beta (1 year) Adjusted Beta (5 years)
1.25

The Profitability of The Mail Division of Deutsche Post
Appendix A
NERA Economic Consulting 33
Figure A.2 DP Share Price versus Dow Jones European Stoxx Index
0.0
20.0
40.0
60.0
80.0
100.0
120.0
Nov-00
Feb-01
May-01
Aug-01
Nov-01
Feb-02
May-02
Aug-02
Nov-02
Feb-03
May-03
Aug-03
Nov-03
Feb-04
May-04
Aug-04
Nov-04
Feb-05
May-05
Aug-05
Nov-05
Feb-06
May-06
Aug-06
Inde
x (2
4/11
/200
0 =
100)
Deutsche Post, last price Dow Jones Stoxx, Index
The Figure shows that DP’s share price fell immediately after the 9/11 attacks and then increased significantly in the following week (by over 20%), whilst the market faced a further fall during this week. This rebounding of DP’s share price, out of line with the movement of the market, appears to be associated with DP’s positive profit announcement and also a statement that DP would be eligible for compensation from the US Government relating to 9/11. This divergence between DP’s stock price and the price of the market represents a deviation from the typical co-movement under normal conditions, prompted by a combination of extraordinary factors.
Having examined the historical movement of the one year beta, we therefore note that the five year beta estimate may be distorted by atypical price movements in the period around 9/11. However, the influence of this atypical period on five years’ data is likely to be small. We therefore rely on both one year and five year estimates of DP’s beta in assessing the cost of equity.
Deutsche Post publishes two gearing ratios in their annual reports, as presented in Table A.3. The reporting of net gearing (column 2) was discontinued with the Annual Report 2004. The net gearing (Postbank at equity) (column 3) is available for the entire period under investigation. As Deutsche Post points out,46 the business activities of Postbank, DP’s financial services segment, are very different from those of the rest of the group. DP therefore reports the “Postbank at equity” scenario that treats the Postbank as a financial investment carried at equity. 46 Deutsche Post Annual Report 2005, p. 62.

The Profitability of The Mail Division of Deutsche Post
Appendix A
NERA Economic Consulting 34
In our calculations and in the presentation of the asset beta we have therefore used the net gearing (Postbank at equity). The level for 2005 is 26.8 per cent, and the five year average is 20.4 per cent. In order to derive an asset beta, we convert these gearing numbers into debt/market capitalisation ratios of 0.37 and 0.25 respectively.
Table A.3 Deutsche Post Gearing
Date Net Gearing (%) Net Gearing (%) Postbank at Equity 2001 5.4 24.6 2002 18.7 28 2002 11.8 22.7 2003 13.6 25.1 2004 -0.4 2005 26.8
Source: Deutsche Post Annual Reports 2002-2005.
Our forward looking estimate of gearing to be used in calculating the cost of capital is 26.8%, consistent with the most recent data on DP’s gearing. In order to estimate forward-looking values of the equity beta, we must re-lever our estimates of the asset beta for DP using a debt/market cap ratio commensurate with our forward looking gearing assumption of 26.8%.
The discussion above and the derivation of the beta were carried out by using the values that apply to Deutsche Post group as a whole. However, in order to contrast DP’s Mail division profitability with its cost of capital, we need an estimate of DP’s Mail division cost of capital. To obtain a Mail specific cost of equity we would require a Mail specific beta and cost of debt, i.e. the systematic risk factor that is specific to the Mail segment. The other parameters used in deriving the cost of equity apply to all DP segments equally.
Since we only observe stock price movements of DP as whole, the systematic risk estimate represents the average riskiness of all activities. We must therefore make a qualitative judgement regarding the relative riskiness of DP’s Mail activities with respect to its other activities.
Our general conclusion is that DP’s mail segment is likely to have been historically perceived as less exposed to general macro-economic risks than DP’s other activities. The Mail division has operated in a sheltered market. It enjoys a statutory monopoly with regulated tariffs, and low income and price elasticities of demand. The other divisions (Express, Logistics and Financial Services) are exposed to more competition in a market that is likely to be more price and income elastic, i.e. revenues in express, logistics and financial services are likely to be more sensitive to changes in economic conditions than the traditional mail business.47
However, on a forward-looking basis the difference between risk exposures of DP’s mail activities and other activities is significantly narrowed. Firstly, the Mail division will become 47 DP’s Annual Report 2003, for example, remarks: “The courier, express, and parcel services market is heavily dependent
on GDP growth in the most important economic regions” (p. 57).

The Profitability of The Mail Division of Deutsche Post
Appendix A
NERA Economic Consulting 35
more risky when the reserve area is ended in 2008 and the sector is fully opened to competition. This increase in risk exposure will impact current stock prices as it represents risks to near term cashflows. Secondly, an element of DP’s mail division sales faces increasing levels of competition with other forms of electronic communication. The risk of further competition is implied by technological developments in this area. In recent years, the internet has grown in popularity. Email, text messaging (SMS), and the availability of the internet are reducing demand for traditional mail services and increasing the price sensitivity of demand for those services. The postal mail business delivers information such as letters and bank statements as well as printed matter such as direct mail and periodicals, which can now be accessed faster through the Internet (e.g. electronic banking). If substitution of traditional mail by electronic alternatives continues, mail volumes will decrease, resulting in lower revenues. However, opportunities also arise with the advance of information technology: direct marketing and e-commerce offer potential for growth.
The Mail segment of Deutsche Post faces a regulatory risk that does not apply to the other three segments. The regulatory framework is currently subject to transition, with full liberalisation expected in 2008. As discussed above, this increases risk to mail division revenues. In Figure 2.4 we showed the importance of the licensed sector to DP. On the 1 January 2003 the reserved sector was decreased from the transport of all letters weighing less than 200g and with a price of less than five times the rate for the lowest weight class to all letters weighing less than 100g and with a price less than three times the rate for the lowest weight class. DP’s 2002 revenues in the licensed sector (i.e. in the reserved and in the non-reserved but licensed sector) were €9,882 million. In 2003 this figure decreased to €9,546 million, corresponding to a fall of 3.4 per cent. In the following year DP’s revenues in the licensed sector picked up and increased to €9,657 million, corresponding to a percentage change of 1.2 per cent. Deutsche Post has noted the loss of market share in particular in the regional market as a consequence of the liberalisation.48 However, they also remark that they “see the opening up of European mail markets as an opportunity to further expand [their] mail business internationally.”49
Competition will increase further with the full deregulation of the national mail market from 2008. We expect DP’s existing competitors to continue extending their market position in terms of presence and volumes.
On balance, we believe that the above factors imply that the difference in perceived risk associated with the mail division’s business relative to the risk exposure of DP’s other activities has narrowed significantly in recent years.
On a forward-looking basis, full competition in the mail sector in 2008 implies significantly higher risk to near term mail sector cash flows than experienced previously. In addition, other forms of communication are likely to exert further competitive pressures on demand for mail services. These factors imply higher current systematic risk to mail sector earnings than over recent years.
48 See remarks in DP’s Annual Report 2003, p. 56, and DP’s Annual Report 2004, p. 44. 49 Deutsche Post Annual Report 2005, p. 25.

The Profitability of The Mail Division of Deutsche Post
Appendix A
NERA Economic Consulting 36
We therefore conclude that the upper bound of DP’s mail beta is equal to the beta for DP as a whole – this assumes that DP’s mail services are at most as risky as other DP activities. This is therefore a conservative assumption made in assessing DP’s mail division profitability.
We are satisfied with DP’s equity beta as accurately reflecting the riskiness of the DP group. However, in order to maximise robustness of our estimate we also examine betas of comparator firms as a further source of evidence. This is set out in Appendix A. We find that TNT, our main comparator to DP, has a higher asset beta than DP (0.89 compared to 0.68 (one year) and 0.81 compared to 0.74 over five years).
As a further source of evidence on the appropriate beta for DP’s mail division we also examine recent regulatory precedent. Some information on regulatory precedent is available for the UK and the Netherlands. Following Royal Mail’s price control review for 2006-2010, a new licence was agreed and sealed on the 25 May 2006.50 Postcomm’s initial proposal set a value of 0.7 to 0.9 for the equity beta of Royal Mail.51 We note that the Royal Mail challenged this decision and suggested an equity beta of between 1.25 and 1.50.52 We understand that the final proposal set a value of 0.65 to 0.75 for the asset beta of the Royal Mail.53 Our estimates of the asset beta for DP, 0.68 to 0.74, lie completely within this range.
According to a survey of Price Waterhouse Coopers (PWC) (2006) the Dutch post regulator, Opta, set in 2002 an equity beta of 0.76 for TPG, now known as TNT.54 PWC remarks that the regulator used the beta for the group (TNT) as a whole and did not see the necessity to adjust it downward or otherwise to derive a mail specific beta.
The analysis of DP’s equity beta, in conjunction with regulatory precedence and evidence from comparator firms leads us to conclude on an asset beta of 0.68 to 0.74, based on one year and five year beta estimates. This range is closely in line with the beta set by Postcomm for UK mail activities in 2006. Based on a gearing assumption of 26.8% (2005 gearing for DP), our asset beta estimates for DP imply an equity beta range of 0.93 to 1.01. This is higher than the equity beta allowed by the Dutch regulator for TNT’s mail activities.
A.4. Equity Risk Premium
The equity risk premium (ERP) is the difference between the expected return on the market portfolio and the expected return on a risk-free asset (formally stated as E[rm] – E[rf] i.e. it is
50 Source: Regulator’s webpage (http://www.psc.gov.uk/policy-and-consultations/consultations/price-control.html) 51 See Royal Mail (2005), “Response to Postcomm’s Initial Proposals for the 2006 Price and Service Quality Review –
Detailed Response”, p. 56. 52 See Royal Mail (2005), “Response to Postcomm’s Initial Proposals for the 2006 Price and Service Quality Review –
Detailed Response”, p. 59. 53 See Royal Mail (2006), “Royal Mail’s Response to Postcomm’s Final Proposals and Draft Licence Modifications”, p.
19. 54 PriceWaterhouseCoopers (2006), “TenneT TSO, Comparison Study of the WACC”, p. 15. Note that the study itself
refers to the “Financieel Dagblad” as a source. We were not able to independently verify the accuracy of this statement. The survey is available on the Dutch energy regulator’s webpage (http://www.dte.nl/images/Comparison%20study%20of%20the%20WACC-%20Mei%202006_tcm7-87013.pdf#search=%22financieel%20dagblad%20beta%20tpg%22).

The Profitability of The Mail Division of Deutsche Post
Appendix A
NERA Economic Consulting 37
the reward investors demand for bearing the risk they expose themselves to by investing in equity markets.
A.4.1. Regulatory Precedents on the Equity Risk Premium
Table A.4 presents recent European regulatory precedent on the equity risk premium (ERP).
Table A.4 European Regulatory Precedent on ERP
Regulator Country Date Company/Activity ERP CER Ireland 2001 ESB Transmission 5.40% Ofgem UK 2001 Transco 3.50% DTe Netherlands 2001 Gas distribution 5.50% CAR Ireland 2001 Aer Rianta 6.00% CER Ireland 2001 Best New Entrant Price
2002 5.30%
Oftel UK 2001 BT retail and network charges
5.00%
OPTA Netherlands 2002 TPG (Post) 6.00% ECK Austria 2003 Gas transmission 5.00% CER Ireland 2003 BGT 5.00% CREG Belgium 2003 Gas transmission 3.50% CER Ireland 2003 Gas Distribution 5.00% CER Ireland 2004 Best New Entrant Price
2005 5.30%
Ofgem UK 2004 DNOs 4.75% Ofcom UK 2004 Private Circuit Charging
Controls 5.00%
Ofwat UK 2004 Water companies 4.90% Ofgem UK 2004 Scots RO 4.75% EMA Finland 2004 Gas Transmission 5.00% CER Ireland 2005 Best New Entrant Price
2006 5.50%
CAR Ireland 2005 DAA 6.00% CER Ireland 2005 Electricity Distribution 5.25% CER Ireland 2005 Electricity Transmission 5.25% Postcomm UK 2005 Royal Mail 3.50% -
5.00% Ofgem UK 2006 Electricity Transmission
(Proposals) 5.20%
As can be seen in Table A.4, the equity risk premium ranges from 3.5 per cent to 6 per cent. Recent decisions have tended to be at the upper end of this range. Continental European ERPs are generally in range of 5 per cent to 6 per cent. A notable exception is CREG in Belgium which set the ERP at 3.5 per cent in 2003.
Dimson, Marsh and Staunton (2005) reports the returns on equity markets for 15 countries around the world over the last 101 years, and compares them against the returns on short term bills and bonds. Dimson, Marsh and Staunton (2005) is widely quoted and referenced to by regulators. We summarise Dimson, Marsh and Staunton’s estimates of equity market returns relative to bonds for the Eurozone in Table A.5.

The Profitability of The Mail Division of Deutsche Post
Appendix A
NERA Economic Consulting 38
Table A.5 Dimson, Marsh, Staunton (2005) Estimates of the Equity Risk Premium,
Relative to Bonds (Based on Arithmetic Average)
Belgium 4.2% France 5.8% Germany 8.3% Ireland 5.1% Italy 7.7% Netherlands 5.8% Spain 4.1% Eurozone Average 5.9%
Source: LBS / ABN AMRO (Dimson, Marsh and Staunton) (2005) “Global Investment Returns Yearbook 2005”.
Given the cross-border nature of today’s markets, we believe it to be appropriate to use a Eurozone ERP, as opposed to a purely German measure. Dimson, Marsh and Staunton (2001) is the benchmark for ERP. We therefore adopt their Eurozone average of 5.9 per cent for our purpose. This value is broadly consistent with regulatory precedent presented in Table A.4 above, particularly the typical 5 to 6 per cent range of Eurozone regulatory precedent.
A.5. Taxation
Table A.6 presents the effective tax rate of DP over the last six years. On this basis we have assumed an effective tax rate of 19.82% in deriving a pre-tax cost of capital from our observed post-tax figure.
Table A.6 DP's Effective Tax Rate (2000-2005)
Effective Tax Rate (%) 2000 25.07 2001 26.01 2002 25.92 2003 29.92 2004 20.18 2005 19.82
Source: Bloomberg.
A.6. The Cost of Debt
We estimate the cost of debt on a one (five) year basis by taking a one (five) year nominal historical yield on a Eurozone, single A rated corporate bond index, with a 10 year maturity. We deflated the one (five) year yield by a one (five) year historical Eurozone inflation forecast to obtain a real estimate.55 The resulting cost of debt is listed in Table 4.1.
55 Source of the inflation forecast is Consensus Forecasts. Thus we used an inflation forecast of 2.2 per cent to deflate the
one year nominal bond yield, and 1.9 per cent to deflate the five year nominal bond yield.

The Profitability of The Mail Division of Deutsche Post
Appendix A
NERA Economic Consulting 39
A.7. Estimate of Cost of Capital
Table 4.1 summarises our findings on the cost of capital. Our estimates range between 7.0 and 8.7 per cent for the real pre-tax weighted average cost of capital (WACC).
Table A.7 Cost of Capital
1 Year 5 Year Real risk-free rate 1.6% 2.7% Equity risk premium 5.9% 5.9% Asset beta 0.68 0.74 Equity beta 0.93 1.01 Cost of equity post-tax 7.1% 8.7% Cost of equity pre-tax 8.8% 10.8% Cost of Debt 2.0% 2.8% Gearing (D/(D+E)) 27% 27% D/E 37% 37% Effective Tax Rate for DP (2005) 20% 20% Real pre-tax weighted average cost of capital 7.0% 8.7%
Source: NERA. Numbers are rounded.
The weighted average cost of capital (WACC), derived from the cost of equity and the cost of debt, gives us estimates of 7.0 and 8.7 per cent on a one year and five year basis. In the Annual Report 2005, Deutsche Post presents their own estimate of the WACC, after tax, as being 5.9 per cent.56 This corresponds to a pre-tax WACC of 7.4 per cent for 2005, assuming a tax rate of 19.82 per cent, which lies within the 7.0% to 8.7% range implied by our estimates. We are therefore confident that our range appropriately reflects the cost of capital of DP.
56 Deutsche Post Annual Report 2005, p. 47.

The Profitability of The Mail Division of Deutsche Post
Appendix B
NERA Economic Consulting 40
Appendix B. DP’s Beta: Comparators
We have identified TNT as the main comparator company to DP. TNT was selected because it is a major quoted European mail operator, and it derives a substantial part of its profits and revenues from its mail segment (see Table B.2 and Table B.3). Like DP, it also undertakes express and logistics services57. A brief description of TNT is given in Table B.1.
Table B.1 TNT: Description of Operations
Company Company Description
TNT TNT NV collects, transports, stores, sorts, and distributes letters, printed matter, parcels, documents, and freight items. The Company provides mail and logistics services domestically and internationally.
Source: Bloomberg.
Table B.2 TNT Product Segmentation: Operating Income (2004-2005)
2004 2005 €m % €m % Mail 806 72 777 67 Express 375 34 474 41 Freight Management 6 1 11 1 Non-Allocated -71 -6 -103 -9 Total 1,116 100 1,159 100 Source: TNT 2005 Annual Report
Table B.3 TNT Product Segmentation: Operating Revenue (2004-2005)
2004 2005 €m % €m % Mail 3,892 43 3,984 39 Express 4,923 54 5,334 53 Freight Management 279 3 789 8 Non-Allocated 12 0 -2 0 Total 9,106 100 10,105 100 Source: TNT 2005 Annual Report
Table B.4 sets out the key financial indicators of TNT compared to DP.
57 In the course of 2005 TNT announced its decision to sell most of its logistics business. On 23 August 2006 TNT
announced the sale of its logistics division to Apollo Management, L.P.. (See the TNT press release from the 23 August 2006 and the company website: http://www.tntlogistics.com/en/.)

The Profitability of The Mail Division of Deutsche Post
Appendix B
NERA Economic Consulting 41
Table B.4 Financial Indicators for TNT Compared to DP
Company Current market cap,
€bn(1)
Net Debt/market
cap(2)
Moody’s issuer rating
Sovereign ownership
Main equity listing
DP 22.84 0.37 A2 35.5% Frankfurt (DAX)
TNT 13.09 0.07 A3 10% Amsterdam (AEX)
Source: Bloomberg (1)On 25/08/2006. (2) On 31/12/2005.
Like DP, TPG derives the majority of its earnings from mail services. The remainder is made up by express and freight management. Our estimates of TNT’s equity and asset betas are presented in Table B.5 and Table B.6. The equity betas turn out to be quite close to those of DP. DP’s one-year equity beta was estimated at 0.93, while TNT’s equity beta for the same period is 0.95. The asset betas differ more significantly due to different gearing ratios. TNT’s one-year asset is 0.89, whereas that of DP is 0.68.
Like Deutsche Post, TNT engages in riskier activities such as express. In order to derive a “pure” estimate of a mail beta, we need to look at express and logistics to gain an idea on how much riskier these activities are than mail activities.
Table B.5 and Table B.6 also present the betas of UPS and FedEx, both of which are predominantly active in the express and logistics market. The equity and asset beta estimates of FedEx are higher than those of UPS. UPS’s one-year equity beta is 0.86, while that of FedEx is 1.13. The five-year equity beta of UPS is very low at 0.65. FedEx has a five-year equity beta of 0.91.
TNT’s one year beta lies between those of UPS and FedEx. TNT’s five year beta lies just above that of FedEx.
Table B.5 DP and Comparator Companies: One-Year Equity and Asset Betas
Company Name
Index Adjusted Equity Beta
Debt to Market
Capitalisation
Standard Error of Beta
Implied Asset Beta
Deutsche Post
DJ SXXP 0.93 0.37 0.22 0.68
TNT DJ SXXP 0.95 0.07 0.27 0.89
UPS S&P 500 0.86 0.01 0.22 0.86
FedEx S&P 500 1.13 0.04 0.24 1.09
Source: NERA analysis of Bloomberg data. DP’s Debt to Market Capitalisation based on DP’s Annual Reports 2002-2005. All calculations are for the period 01/2005-12/2005 (1) DJ SXXP in Euros (2) S&P 500 Index in US Dollars

The Profitability of The Mail Division of Deutsche Post
Appendix B
NERA Economic Consulting 42
Table B.6 DP and Comparator Companies: Five-Year Equity and Asset Betas
Company Name
Index Adjusted Equity Beta
Debt to Market
Capitalisation
Standard Error of Beta
Implied Asset Beta
Deutsche Post
DJ SXXP 0.93 0.25 0.09 0.74
TNT DJ SXXP 0.92 0.14 0.08 0.81
UPS S&P 500 0.65 0.02 0.05 0.64
FedEx S&P 500 0.91 0.09 0.08 0.83
Source: NERA analysis of Bloomberg data. DP’s Debt to Market Capitalisation based on DP’s Annual Reports 2002-2005. All calculations are for the period 12/2001-12/2005 (1) DJ SXXP in Euros (2) S&P 500 Index in US Dollars

The Profitability of The Mail Division of Deutsche Post
Appendix C
NERA Economic Consulting 43
Appendix C. Measurement of Capital Employed
Return on Capital Employed (ROCE) is defined as earnings before interest and taxes (EBIT) divided by (total assets minus current liabilities). Only limited information is available at the segment level and it is subject to changes and revisions. We calculate and present what we accurately believe to capture the ROCE.
We are satisfied with the profit measure (EBIT), however, we lack the necessary information to obtain capital employed. Capital employed should only include the total of intangible and tangible fixed assets plus working capital, that is, capital employed is non-current assets plus current assets minus current liabilities. Deutsche Post does not report non-current and current assets, and current liabilities at segment level. Any measure we use will therefore only be an approximation.
Table C.1 reports all the definitions of segment assets and segment liabilities that have been used. Where changes in the definition have occurred, we italicised the element that have changed. Note that the annual report of a certain year will report the figure for the year in question and the previous year (possibly restated). For example, the annual report 2005 reports figures for 2005 and for 2004 restated.
The segment assets are a measure of non-current and current assets, subject to some exclusion. The exact wording of the definition has changed over the years. We believe, however, the content not to have changed substantially.
Until the Annual Report 2003, segment liabilities are defined as non-interest bearing liabilities. In virtue of being non-interest bearing, they capture (mainly) current liabilities. From the publication of AR2003, non-interest bearing provisions have been included in liabilities. We believe these non-interest bearing provisions to be current and that therefore they should not be counted in working capital. Their subtraction from total assets is therefore correct.
Through all years considered, segment liabilities include liabilities from financial services. We believe that these will be ascribed to the financial services segment and therefore do not affect the liabilities of other segments. Thus, we view segment liabilities as being a measure of current liabilities.
To derive the ROCE, we divide EBIT by (segment assets minus segment liabilities). From the Annual Report 2003, the liabilities include non-interest bearing provisions. Albeit the definitions of the constituting elements of ROCE have changed, we believe our estimates to accurately capture the return on capital.

The Profitability of The Mail Division of Deutsche Post
Appendix C
NERA Economic Consulting 44
Table C.1 Definition of Segment Assets and Segment Liabilities
Report Segment Assets Segment Liabilities
AR 1999 Non-current assets (intangible assets, property, plants and equipment) and current assets (excluding cash and cash equivalents and marketable securities) including receivables from financial services. Purchased goodwill is allocated to the corporate divisions.
Non-interest bearing liabilities and liabilities from financial services.
AR 2000 Non-current assets (intangible assets, property, plants and equipment) and current assets (excluding income tax receivables, cash and cash equivalents and marketable securities) including receivables from financial services. Purchased goodwill is allocated to the corporate divisions.
Non-interest bearing liabilities (excluding income tax liabilities) and liabilities from financial services.
AR 2001 Non-current assets (intangible assets, property, plants and equipment) and current assets (excluding income tax receivables, cash and cash equivalents, and current financial instruments) including receivables from financial services. Purchased goodwill is allocated to the corporate divisions.
Same as AR 2000
AR 2002 Non-current assets (excluding non-current financial assets) and current assets (excluding income tax receivables, cash and cash equivalents, and current financial instruments) including receivables from financial services. Purchased goodwill is allocated to the corporate divisions.
Same as AR 2000
AR 2003 Same as AR 2002 Non-interest bearing provisions and liabilities (excluding income tax liabilities) and liabilities from financial services.
AR 2004 Non-current assets (excluding non-current financial assets) and current assets (excluding income tax receivables, cash and cash equivalents, and current financial instruments) including receivables and other securities from financial services. Purchased goodwill is allocated to the corporate divisions.
Same as AR 2003
AR 2005 Non-current assets (excluding non-current financial assets) and current assets (excluding income tax receivables, cash and cash equivalents, and current financial instruments). The receivables and other securities from financial services are reported under the Financial Services segment. Purchased goodwill is allocated
Same as AR 2003

The Profitability of The Mail Division of Deutsche Post
Appendix C
NERA Economic Consulting 45
to the corporate divisions.
IR 2006 Same as AR 2005 Same as AR 2003
Source: Annual Reports (AR) 1999-2005, Interim Report (IR) 2006.

The Profitability of The Mail Division of Deutsche Post
Appendix D
NERA Economic Consulting 46
Appendix D. Detailed Data
Table D.1 to Table D.5 below contains key financial indicators for the Mail, Express, Logistics and Financial Services divisions as reported in the annual reports of Deutsche Post AG, and the sum of first three of these. In the tables we include our calculations of the ROCE. ROCE is calculated as EBIT divided by capital employed. Capital employed is segment assets minus segment liabilities.
We note the following changes to accounting methodologies which led DP to restate their financial results in subsequent annual reports:
§ In 2002, Retail outlet operations, which were previously allocated to the Other/Consolidation segment, are now part of the Financial Services segment. As a result, the 2001 figures have been restated. A consequence of the change in accounting methodology is that the return on capital employed (ROCE) in the Mail segment is now higher than previously reported. The Tables below provide both the original and the restated 2001 figures.
§ From 2003, the reported segment liabilities include non-interest-bearing provisions.
§ In 2003, DP restructured the Mail International Business Division and engaged in other portfolio maximisation measures. The Express and Logistics corporate divisions were restructured. Interest costs on pension obligations and other interest-bearing provisions were reclassified from EBITA to net finance costs. As a result, the 2002 figures were restated.
§ In 2004, DP restructured the Mail International Business Division and engaged in other portfolio maximisation measures. Deutsche Post Com GmbH was reclassified from Other/Consolidation to the Mail division. InterServ Desellschaft für Personal- und Beraterdienstleistungen mbH was reclassified from the Mail to the Other/Consolidation division. DHL Fulfilment GmbH was reclassified from Other/Consolidation to the Express division. As a result, the 2003 figures were restated.
§ In 2005, cross-segment service functions were no longer included in the corporate divisions but moved to the Other/Consolidation division. The Airborne Logistics Services business area was reclassified from Express to the Logistics division. The Wilmington (USA) hub was reclassified from Express to the Other/Consolidation division. As a result, the 2004 figures were restated.
§ In 2006, DP changed its accounting rules to IFRS. Moreover, Deutsche Post acquired a 100 per cent interest in the logistics company Exel plc, Bracknell, UK in December 2005. Exel was provisionally included in the consolidated financial statements as of December 31, 2005 at its IFRS carrying amount. As a result of the purchase price allocation of Exel, the amounts in the consolidated financial balance sheet changed as of December 31, 2005. There were various other reclassifications relating to a change in accounting policy for the deferral of expenses relating to sales activities for mortgage loans.58 In DB’s 2006 interim report (January to June 2006), DP restates its December 31, 2005 consolidated
58 DP, Interim Report 2006, p. 27.

The Profitability of The Mail Division of Deutsche Post
Appendix D
NERA Economic Consulting 47
financial statement figures; the 2006 interim report, however, does not restate 2005 financial statement figures on a segmental basis. We therefore are not able to calculate restated 2005 profitability measures.

The Profitability of The Mail Division of Deutsche Post
Appendix D
NERA Economic Consulting 48
Table D.1 Key Financial Indicators: Mail, 1998-2006
(€m) 1998 1999 1999 (r) 2000 2001 2001 (r) 2002 2002 (r) 2003 2003 (r) 2004 2004 (r) 2005 2006 H1* Total Revenue 11,272 11,671 11,671 11,733 11,707 11,707 11,666 12,129 11,934 12,495 12,747 12,747 12,878 6,459 EBIT 944 1,008 1,008 2,003 1,958 1,958 1,656 2,138 2,026 2,067 2,072 2,072 2,030 1,024 Segment Assets 5,484 5,925 5,924 5,586 5,049 4,414 4,311 4,862 4,224 4,055 4,198 4,198 3,664 4,750 Segment Liabilities 1,084 1,341 1,341 1,405 1,246 1,020 1,027 1,763 2,040 2,040 2,076 2,076 1,926 2,096 Capital Employed 4,400 4,583 4,583 4,181 3,803 3,394 3,284 3,099 2,184 2,015 2,122 2,122 1,738 2,654 ROS 8.4% 8.6% 8.6% 17.1% 16.7% 16.7% 14.2% 17.6% 17.0% 16.5% 16.3% 16.3% 15.8% 15.9% ROCE 21.4% 22.0% 22.0% 47.9% 51.5% 57.7% 50.4% 69.0% 92.8% 102.6% 97.6% 97.6% 116.8% 38.6% Source: Calculated from Deutsche Post AG annual reports 1999-2005; 2006H1 figures are taken form DB’s Interim Report (January to June) 2006 Note: (1) (r) stands for restated, due to changes in accounting methodologies and reclassifications, financial figures have ex-post been restated in the subsequent annual report; (2) Segment Liabilities include non-interest-bearing provisions from 2002 (r). * Figures should be treated with care, as they correspond to the first 6 months of DP’s financial year only. EBIT figures therefore only count the profits of 6 months.

The Profitability of The Mail Division of Deutsche Post
Appendix D
NERA Economic Consulting 49
Table D.2 Key Financial Indicators: Express, 1998-2006
(€m) 1998 1999 1999 (r) 2000 2001 2001 (r) 2002 2002 (r) 2003 2003 (r) 2004 2004 (r) 2005 2006 H1* Total Revenue 3,818 4,904 4,775 6,022 6,421 6,421 12,489 14,637 16,443 15,293 17,792 17,557 18,273 9,209 EBIT -11 35 31 33 126 126 -79 -79 190 152 111 117 11 5 Segment Assets 2,761 4,607 4,498 4,272 4,112 3,954 8,651 9,716 11,814 11,814 12,597 10,864 11,595 11,010 Segment Liabilities 574 1,220 1,192 934 957 901 2,043 3,056 3,678 3,678 3,768 3,524 3,947 3,449 Capital Employed 2,186 3,387 3,306 3,338 3,155 3,053 6,608 6,660 8,136 8,136 8,829 7,340 7,648 7,561 ROS -0.3% 0.7% 0.6% 0.5% 2.0% 2.0% -0.6% -0.5% 1.2% 1.0% 0.6% 0.7% 0.1% 0.1% ROCE -0.5% 1.0% 0.9% 1.0% 4.0% 4.1% -1.2% -1.2% 2.3% 1.9% 1.3% 1.6% 0.1% 0.1% Source: Calculated from Deutsche Post AG annual reports 1999-2005; 2006H1 figures are taken form DB’s Interim Report (January to June) 2006 Note: (1) (r) stands for restated, due to changes in accounting methodologies and reclassifications, financial figures have ex-post been restated in the subsequent annual report; (2) Segment Liabilities include non-interest-bearing provisions from 2002 (r). * Figures should be treated with care, as they correspond to the first 6 months of DP’s financial year only. EBIT figures therefore only count the profits of 6 months.

The Profitability of The Mail Division of Deutsche Post
Appendix D
NERA Economic Consulting 50
Table D.3 Key Financial Indicators: Logistics, 1998-2002
(€m) 1998 1999 1999 (r) 2000 2001 2001 (r) 2002 2002 (r) 2003 2003 (r) 2004 2004 (r) 2005 2006 H1* Total Revenue 0 4,218 4,450 8,289 9,153 9,153 9,152 5,817 5,878 5,878 6,786 6,786 7,949 9,918 EBIT 0 10 -67 13 42 42 100 80 116 116 182 182 315 324 Segment Assets 0 3,070 3,072 5,355 5,330 5,330 4,601 3,159 2,910 2,910 3,156 3,156 12,563 12,469 Segment Liabilities 0 2,161 2,184 2,213 2,097 2,097 1,602 1,080 1,074 1,074 1,132 1,132 4,027 3,794 Capital Employed 0 909 888 3,142 3,233 3,233 2,999 2,079 1,836 1,836 2,024 2,024 8,536 8,675 ROS 0.0% 0.2% -1.5% 0.2% 0.5% 0.5% 1.1% 1.4% 2.0% 2.0% 2.7% 2.7% 4.0% 3.3% ROCE 0.0% 1.1% -7.5% 0.4% 1.3% 1.3% 3.3% 3.8% 6.3% 6.3% 9.0% 9.0% 3.7% 3.7% Source: Calculated from Deutsche Post AG annual reports 1999-2005; 2006H1 figures are taken form DB’s Interim Report (January to June) 2006 Note: (1) (r) stands for restated, due to changes in accounting methodologies and reclassifications, financial figures have ex-post been restated in the subsequent annual report; (2) Segment Liabilities include non-interest-bearing provisions from 2002 (r). * Figures should be treated with care, as they correspond to the first 6 months of DP’s financial year only. EBIT figures therefore only count the profits of 6 months.

The Profitability of The Mail Division of Deutsche Post
Appendix D
NERA Economic Consulting 51
Table D.4 Key Financial Indicators: Financial Services, 1998-2006
(€m) 1998 1999 1999 (r) 2000 2001 2001 (r) 2002 2002 (r) 2003 2003 (r) 2004 2004 (r) 2005 2006 H1* Total Revenue 81 2,871 2,871 7,990 7,604 8,876 8,872 8,676 7,813 7,661 7,349 7,349 7,272 4,573 EBIT -5 67 58 505 520 520 620 678 565 567 690 714 790 464 Segment Assets 69 59,769 57,739 130,130 136,117 137,051 140,135 140,135 131,080 131,080 126,804 126,517 138,787 180,267 Segment Liabilities 34 56,212 56,212 127,752 133,147 133,479 133,776 133,861 124,194 124,194 117,959 117,723 129,136 168,249 Capital Employed 35 3,558 1,527 2,378 2,970 3,572 6,359 6,274 6,886 6,886 8,845 8,794 9,651 12,018 ROS -5.8% 2.3% 2.0% 6.3% 6.8% 5.9% 7.0% 7.8% 7.2% 7.4% 9.4% 9.7% 10.9% 10.1% ROCE -13.4% 1.9% 3.8% 21.2% 17.5% 14.6% 9.7% 10.8% 8.2% 8.2% 7.8% 8.1% 8.2% 3.9% Source: Calculated from Deutsche Post AG annual reports 1999-2005; 2006H1 figures are taken form DB’s Interim Report (January to June) 2006 Note: (1) (r) stands for restated, due to changes in accounting methodologies and reclassifications, financial figures have ex-post been restated in the subsequent annual report; (2) Segment Liabilities include non-interest-bearing provisions from 2002 (r). * Figures should be treated with care, as they correspond to the first 6 months of DP’s financial year only. EBIT figures therefore only count the profits of 6 months.

The Profitability of The Mail Division of Deutsche Post
Appendix D
NERA Economic Consulting 52
Table D.5 Key Financial Indicators: Mail+Express+Logistics, 1998-2006
(€m) 1998 1999 1999 (r) 2000 2001 2001 (r) 2002 2002 (r) 2003 2003 (r) 2004 2004 (r) 2005 2006 H1* Total Revenue 15,090 20,793 20,896 26,044 27,281 27,281 33,307 32,583 34,255 33,666 37,325 37,090 39,100 25,586 EBIT 933 1,052 972 2,049 2,126 2,126 1,677 2,139 2,332 2,335 2,365 2,371 2,356 1,353 Segment Assets 8,244 13,602 13,494 15,213 14,491 13,698 17,563 17,737 18,948 18,779 19,951 18,218 27,822 28,229 Segment Liabilities 1,658 4,722 4,717 4,552 4,300 4,018 4,672 5,899 6,792 6,792 6,976 6,732 9,900 9,339 Capital Employed 6,586 8,880 8,777 10,661 10,191 9,680 12,891 11,838 12,156 11,987 12,975 11,486 17,922 18,890 ROS 6.2% 5.1% 4.7% 7.9% 7.8% 7.8% 5.0% 6.6% 6.8% 6.9% 6.3% 6.4% 6.0% 5.3% ROCE 14.2% 11.8% 11.1% 19.2% 20.9% 22.0% 13.0% 18.1% 19.2% 19.5% 18.2% 20.6% 13.1% 7.2% Source: Calculated from Deutsche Post AG annual reports 1999-2005; 2006H1 figures are taken form DB’s Interim Report (January to June) 2006 Note: (1) (r) stands for restated, due to changes in accounting methodologies and reclassifications, financial figures have ex-post been restated in the subsequent annual report; (2) Segment Liabilities include non-interest-bearing provisions from 2002 (r). * Figures should be treated with care, as they correspond to the first 6 months of DP’s financial year only. EBIT figures therefore only count the profits of 6 months.

The Profitability of The Mail Division of Deutsche Post
Appendix D
NERA Economic Consulting 53
In addition to these segment figures, the Deutsche Post AG accounts include an “other/consolidation” segment. By means of this segment, transactions between the corporate divisions are eliminated and non-allocable items such as corporate overhead costs are allocated. In H1 2006 we also include the newly created “Services” segment. The Services segment includes cross-segment service functions and exists since the fiscal year 2006.59
Table D.6 contains the key financial indicators for the “other/consolidation” segment from 1998 to 2002.
Table D.6 Key Financial Indicators: Other/Consolidation and Services, 1998-2006
(€m) 1998 1999 1999 (r) 2000 2001 2001 (r) 2002 2002 (r) 2003 2003 (r) 2004 2004 (r) 2005 2006 H1* Total Revenue -501 -1,301 -1,404 -1,326 -1,506 -2,778 -2,924 -2,004 -2,051 -1,310 -1,506 -1,271 -1,778 -856 EBIT -101 -179 -179 -319 -264 -270 -325 -297 -241 -246 -78 -84 609 -259 Segment Assets 3,518 -1,374 -1,339 513 379 238 -238 -412 -638 -469 -687 1,198 606 2,360 Segment Liabilities 1,172 -1,295 -1,288 354 518 468 1,030 1,555 319 319 871 1,351 173 704 Capital Employed 2,346 -79 -51 159 -139 -230 -1,268 -1,967 -957 -788 -1,558 -153 433 1,656 ROS 20.2% 13.8% 12.7% 24.1% 17.5% 9.7% 11.1% 14.8% 11.8% 18.8% 5.2% 6.6% -34.3% 30.3% ROCE -4.3% 226.8% 351.0% -200.6% 189.9% 117.4% 25.6% 15.1% 25.2% 31.2% 5.0% 54.9% 140.6% -15.6% Source: Calculated from Deutsche Post AG annual reports 1999-2005; 2006H1 figures are taken form DB’s Interim Report (January to June) 2006 Note: (1) (r) stands for restated, due to changes in accounting methodologies and reclassifications, financial figures have ex-post been restated in the subsequent annual report; (2) Segment Liabilities include non-interest-bearing provisions from 2002 (r). * Figures should be treated with care, as they correspond to the first 6 months of DP’s financial year only. EBIT figures therefore only count the profits of 6 months.
59 See Deutsche Post, Interim Report 2006, p.5.

The Profitability of The Mail Division of Deutsche Post
Appendix D
NERA Economic Consulting 54
We have allocated the items of the “Other/Consolidation” and the Services segment in Table D.6 to the individual segments on the basis of the revenue of each individual segment. The revenue figures in Table D.1 to Table D.4 above have been used as basis for the allocation. Table D.7 to Table D.11 below contain the key financial indicators for each segment after the allocation of the “Other/Consolidation” and the Services figures, and the sum of these.
Table D.7 Key Financial Indicators: Mail with Other/Consolidation and Services Allocation, 1998-2006
(€m) 1998 1999 1999 (r) 2000 2001 2001 (r) 2002 2002 (r) 2003 2003 (r) 2004 2004 (r) 2005 2006 H1* Total Revenue 10,899 11,029 10,982 11,276 11,202 10,808 10,857 11,540 11,352 12,099 12,317 12,382 12,384 6,276 EBIT 868 919 920 1,893 1,869 1,871 1,566 2,051 1,958 1,993 2,050 2,048 2,199 969 Segment Assets 8,098 5,247 5,266 5,763 5,176 4,491 4,245 4,741 4,043 3,913 4,002 4,542 3,832 5,255 Segment Liabilities 1,955 703 709 1,527 1,420 1,172 1,312 2,220 2,130 2,136 2,325 2,464 1,974 2,247 Capital Employed 6,143 4,544 4,558 4,236 3,756 3,320 2,933 2,521 1,913 1,777 1,677 2,078 1,858 3,009 ROS 8.0% 8.3% 8.4% 16.8% 16.7% 17.3% 14.4% 17.8% 17.2% 16.5% 16.6% 16.5% 17.8% 15.4% ROCE 14.1% 20.2% 20.2% 44.7% 49.8% 56.4% 53.4% 81.4% 102.4% 112.1% 122.2% 98.5% 118.3% 32.2% Source: Calculated from Deutsche Post AG annual reports 1999-2005; 2006H1 figures are taken form DB’s Interim Report (January to June) 2006 Note: (1) (r) stands for restated, due to changes in accounting methodologies and reclassifications, financial figures have ex-post been restated in the subsequent annual report; (2) Segment Liabilities include non-interest-bearing provisions from 2002 (r). * Figures should be treated with care, as they correspond to the first 6 months of DP’s financial year only. EBIT figures therefore only count the profits of 6 months.

The Profitability of The Mail Division of Deutsche Post
Appendix D
NERA Economic Consulting 55
Table D.8 Key Financial Indicators: Express with Other/Consolidation and Services Allocation, 1998-2006
(€m) 1998 1999 1999 (r) 2000 2001 2001 (r) 2002 2002 (r) 2003 2003 (r) 2004 2004 (r) 2005 2006 H1* Total Revenue 3,692 4,634 4,493 5,787 6,144 5,928 11,623 13,926 15,641 14,808 17,192 17,055 17,572 8,948 EBIT -36 -3 -5 -23 77 78 -175 -184 96 61 80 84 251 -74 Segment Assets 3,646 4,322 4,229 4,363 4,182 3,996 8,581 9,570 11,565 11,640 12,323 11,337 11,834 11,731 Segment Liabilities 869 951 933 997 1,052 984 2,348 3,608 3,803 3,796 4,115 4,058 4,015 3,664 Capital Employed 2,777 3,371 3,296 3,366 3,129 3,012 6,233 5,962 7,762 7,844 8,209 7,280 7,819 8,067 ROS -1.0% -0.1% -0.1% -0.4% 1.3% 1.3% -1.5% -1.3% 0.6% 0.4% 0.5% 0.5% 1.4% -0.8% ROCE -1.3% -0.1% -0.2% -0.7% 2.5% 2.6% -2.8% -3.1% 1.2% 0.8% 1.0% 1.2% 3.2% -0.9% Source: Calculated from Deutsche Post AG annual reports 1999-2005; 2006H1 figures are taken form DB’s Interim Report (January to June) 2006 Note: (1) (r) stands for restated, due to changes in accounting methodologies and reclassifications, financial figures have ex-post been restated in the subsequent annual report; (2) Segment Liabilities include non-interest-bearing provisions from 2002 (r). * Figures should be treated with care, as they correspond to the first 6 months of DP’s financial year only. EBIT figures therefore only count the profits of 6 months.

The Profitability of The Mail Division of Deutsche Post
Appendix D
NERA Economic Consulting 56
Table D.9 Key Financial Indicators: Logistics with Other/Consolidation and Services Allocation, 1998-2006
(€m) 1998 1999 1999 (r) 2000 2001 2001 (r) 2002 2002 (r) 2003 2003 (r) 2004 2004 (r) 2005 2006 H1* Total Revenue 0 3,986 4,187 7,966 8,758 8,450 8,518 5,534 5,591 5,692 6,557 6,592 7,644 9,636 EBIT 0 -22 -101 -65 -27 -26 29 38 82 81 170 169 419 239 Segment Assets 0 2,825 2,821 5,480 5,429 5,390 4,549 3,101 2,821 2,843 3,052 3,339 12,667 13,245 Segment Liabilities 0 1,930 1,943 2,299 2,233 2,215 1,825 1,299 1,119 1,119 1,264 1,338 4,057 4,026 Capital Employed 0 895 878 3,181 3,197 3,175 2,724 1,802 1,702 1,724 1,787 2,001 8,610 9,220 ROS 0.0% -0.6% -2.4% -0.8% -0.3% -0.3% 0.3% 0.7% 1.5% 1.4% 2.6% 2.6% 5.5% 2.5% ROCE 0.0% -2.5% -11.4% -2.0% -0.9% -0.8% 1.1% 2.1% 4.8% 4.7% 9.5% 8.5% 4.9% 2.6% Source: Calculated from Deutsche Post AG annual reports 1999-2005; 2006H1 figures are taken form DB’s Interim Report (January to June) 2006 Note: (1) (r) stands for restated, due to changes in accounting methodologies and reclassifications, financial figures have ex-post been restated in the subsequent annual report; (2) Segment Liabilities include non-interest-bearing provisions from 2002 (r). * Figures should be treated with care, as they correspond to the first 6 months of DP’s financial year only. EBIT figures therefore only count the profits of 6 months.

The Profitability of The Mail Division of Deutsche Post
Appendix D
NERA Economic Consulting 57
Table D.10 Key Financial Indicators: Financial Services with Other/Consolidation and Services Allocation, 1998-2006
(€m) 1998 1999 1999 (r) 2000 2001 2001 (r) 2002 2002 (r) 2003 2003 (r) 2004 2004 (r) 2005 2006 H1* Total Revenue 78 2,713 2,701 7,679 7,276 8,194 8,257 8,255 7,432 7,418 7,101 7,139 6,993 4,443 EBIT -5 45 36 430 462 454 552 616 520 521 677 700 886 425 Segment Assets 88 59,603 57,577 130,250 136,200 137,109 140,085 140,048 130,962 130,993 126,691 126,715 138,882 180,625 Segment Liabilities 40 56,055 56,056 127,835 133,260 133,594 133,993 134,188 124,253 124,253 118,102 117,946 129,163 168,356 Capital Employed 48 3,548 1,521 2,415 2,940 3,516 6,092 5,860 6,708 6,740 8,589 8,769 9,719 12,269 ROS -6.7% 1.7% 1.3% 5.6% 6.4% 5.5% 6.7% 7.5% 7.0% 7.0% 9.5% 9.8% 12.7% 9.6% ROCE -11.0% 1.3% 2.4% 17.8% 15.7% 12.9% 9.1% 10.5% 7.8% 7.7% 7.9% 8.0% 9.1% 3.5% Source: Calculated from Deutsche Post AG annual reports 1999-2005; 2006H1 figures are taken form DB’s Interim Report (January to June) 2006 Note: (1) (r) stands for restated, due to changes in accounting methodologies and reclassifications, financial figures have ex-post been restated in the subsequent annual report; (2) Segment Liabilities include non-interest-bearing provisions from 2002 (r). * Figures should be treated with care, as they correspond to the first 6 months of DP’s financial year only. EBIT figures therefore only count the profits of 6 months.

The Profitability of The Mail Division of Deutsche Post
Appendix D
NERA Economic Consulting 58
Table D.11 Key Financial Indicators: Mail+Express+Logistics with Other/Consolidation and Services Allocation, 1998-2006
(€m) 1998 1999 1999 (r) 2000 2001 2001 (r) 2002 2002 (r) 2003 2003 (r) 2004 2004 (r) 2005 2006 H1* Total Revenue 14,591 19,650 19,662 25,029 26,103 25,185 30,998 31,000 32,585 32,599 36,067 36,029 37,601 24,860 EBIT 832 895 815 1,805 1,920 1,922 1,420 1,904 2,136 2,135 2,300 2,301 2,869 1,133 Segment Assets 11,744 12,395 12,317 15,606 14,787 13,878 17,375 17,412 18,428 18,397 19,377 19,218 28,333 30,231 Segment Liabilities 2,824 3,584 3,585 4,823 4,705 4,371 5,485 7,127 7,052 7,052 7,704 7,860 10,046 9,936 Capital Employed 8,920 8,810 8,732 10,783 10,082 9,506 11,890 10,285 11,377 11,345 11,673 11,358 18,287 20,295 ROS 5.7% 4.6% 4.1% 7.2% 7.4% 7.6% 4.6% 6.1% 6.6% 6.5% 6.4% 6.4% 7.6% 4.6% ROCE 9.3% 10.2% 9.3% 16.7% 19.0% 20.2% 11.9% 18.5% 18.8% 18.8% 19.7% 20.3% 15.7% 5.6% Source: Calculated from Deutsche Post AG annual reports 1999-2005; 2006H1 figures are taken form DB’s Interim Report (January to June) 2006 Note: (1) (r) stands for restated, due to changes in accounting methodologies and reclassifications, financial figures have ex-post been restated in the subsequent annual report; (2) Segment Liabilities include non-interest-bearing provisions from 2002 (r). * Figures should be treated with care, as they correspond to the first 6 months of DP’s financial year only. EBIT figures therefore only count the profits of 6 months.

NERA Economic Consulting 15 Stratford Place London W1C 1BE United Kingdom Tel: +44 20 7659 8500 Fax: +44 20 7659 8501 www.nera.com
NERA UK Limited, registered in England and Wales, No 3974527 Registered Office: 15 Stratford Place, London W1C 1BE