the profile of people using trussell trust food banks ... households (hbai 2014/15) food bank...
TRANSCRIPT

Financial insecurity, food insecurity, and disability: the profile of people receiving emergency food assistance from The Trussell Trust Foodbank Network in Britain.
Dr Rachel Loopstra
King’s College London
@rloopstra

Acknowledgements• Participating Trussell Trust foodbank managers and volunteers
• Study participants
• Doireann Lalor (Research Coordinator)
• Trussell Trust Public Affairs and Press Team
• Advisory group members
Funding provided by:


0
200000
400000
600000
800000
1000000
1200000
2008/09 2009/10 2010/11 2011/12 2012/13 2013/14 2014/15
Numbers receiving emergency food parcels from the Trussell Trust
* Data from Trussell Trust Foodbank Network, est. 2004. First year systematic data collection in 2008/09 .

Reasons for
foodbankuse
Debt
Food prices
Benefit delays
Low- paid work
Sanctions
Mental illness
“The reasons for foodbank use are complex, so it’s misleading to link them to any one issue. Employment is the best route out of poverty, and there are now record numbers of people in work.” (Government spokesperson, 2017)

For most foodbanks, referral forms the only quantitative source of information about their clients.
0
10
20
30
40
50
60
70
No Have in the past, but not regularly Regularly collect additional data
Perc
ent
of
foo
db
anks
su
rvey
(n
=18
6)
Other than information collected on referral vouchers, has your foodbank collected any additional information from clients who visit your foodbank?
(Survey of Trussell Trust Foodbanks, 2016)

Key aims of the research
• Provide more detail behind headline, routine data collected across The Trussell Trust Network
• Questionnaire enabling comparison with household surveys conducted in UK
• Random sample of foodbanks
• Covering every region, rural and urban areas
• Pilot a method of volunteer-facilitated recruitment of participants
Only possible with you!

Research objectives
• To describe the socio-demographic and economic profile of people receiving food parcels.
• To understand foodbank clients’ access to social security, where gaps in support may exist, or where support may not be sufficient.
• To explore the prevalence of recent short-term income and expenditure shocks, and describe the causes of these shocks.
• To understand the severity and chronicity of household food insecurity and how frequently people received food from Trussell Trust foodbanks.
• To explore the prevalence of health conditions and disabilities and the nature of these challenges.

Methods
• Stratified cluster sample of 24 foodbanks in Trussell Trust Foodbank Network (9 regions in England, and Scotland and Wales)
• Collaborative research model: foodbank volunteers trained in ethics, recruitment, tracking participation
• Recruitment: after foodbank intake interview, and as tablet(s) became free.
• Ineligible: unable to complete questionnaire in English, visible distress or incapacity, pick-up for someone else
• Clients inputted their data directly into questionnaire using a tablet• About 13% received had survey read by a volunteer
Wirral Foodbank covered a record number of distribution centres!

• Data from first 18 foodbanks that completed data collection over October-December 2016
• Descriptive statistics
• Compare sample estimates to population data:• Low income households (HBAI
2014/15 and 2015/16)
• Benefit claimants (DWP)
Report available from: https://www.trusselltrust.org/what-we-do/research-advocacy/oxford-university-report/

• Highlight key differences for the three foodbanks that participated in the North-West (n=96 households)
• Sample was too small to look at Wirral Foodbank on its own

Findings

60% median incomeAHC BHC
Households using foodbanks (n=413)
Household incomes are in the very bottom of the income distribution.

Household-types using Trussell Trust foodbanks
0.0
10.0
20.0
30.0
40.0
50.0
60.0
Single adult (livingalone or with non-
householdmembers)
Lone parentfamily with
dependent or non-dependent
children
Couple withdependent or non-
dependentchildren
Couple familywithout dependentor non-dependent
children
Multi-familyhousehold
Single adult orcouple living withsiblings or other
adults
Living withunspecifiedhouseholdmembers
Pro
port
ion o
f household
s (
%)
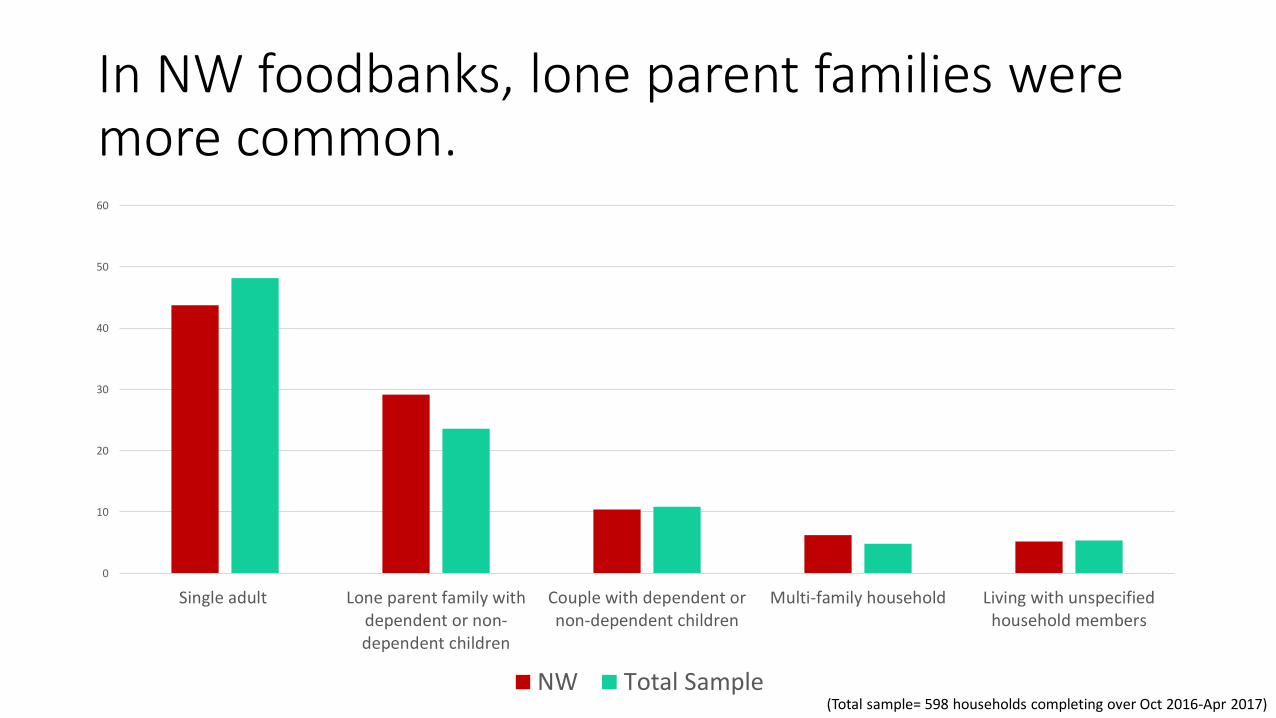
In NW foodbanks, lone parent families were more common.
0
10
20
30
40
50
60
Single adult Lone parent family withdependent or non-dependent children
Couple with dependent ornon-dependent children
Multi-family household Living with unspecifiedhousehold members
NW Total Sample(Total sample= 598 households completing over Oct 2016-Apr 2017)
0
5
10
15
20
25
30
35
40
45
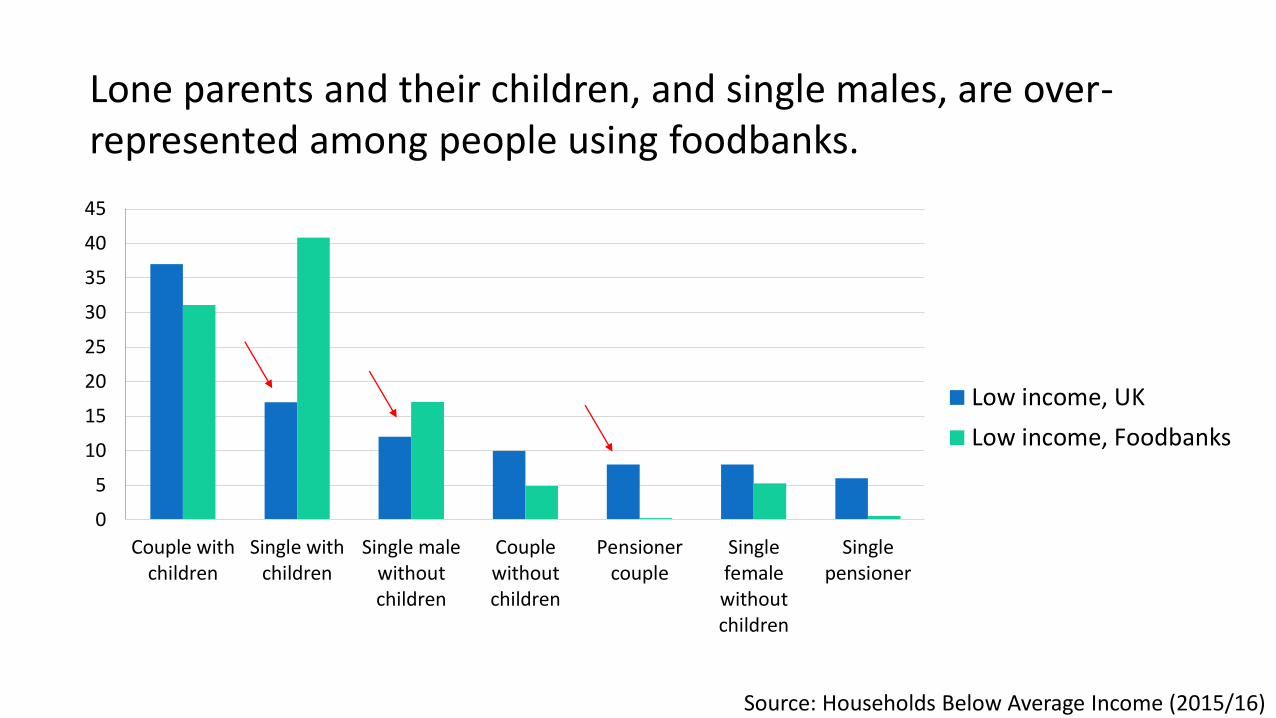
Couple withchildren
Single withchildren
Single malewithoutchildren
Couplewithoutchildren
Pensionercouple
Singlefemalewithoutchildren
Singlepensioner
Low income, UK
Low income, Foodbanks
Lone parents and their children, and single males, are over-represented among people using foodbanks.
Source: Households Below Average Income (2015/16)

15% of households with employment incomes or with adults employed, but almost all work part-time or self-employment.
84.2
14.8
1.0
No employment indicated
One or more adultsemployed or reportedemployment income
Missing information on bothemployment and earnings

Employment Support Allowance (work preparation/assessment) and Jobseeker’s Allowance claimants are over-represented among households using foodbanks.
0
5
10
15
20
25
30
35
40
45
ESA (Supportgroup)/IB
ESA (WRAG) ESA(Assessment)
Jobseeker'sallowance
Incomesupport (IS)
Universalcredit (not inemployment)
Pro
po
rtio
n o
f b
en
efit
cla
iman
ts/h
ou
seh
old
s (%
)
Proportion of claimants (DWP)
Proportion of claimants in food banks
Source: Nomis Labour Statistics.

75% of households reported health conditions, 35% specified one or more types of mental health conditions.
0.0%
5.0%
10.0%
15.0%
20.0%
25.0%
30.0%
35.0%
40.0%
Pro
po
rtio
n o
f h
ou
seh
old
s w
ith
hea
lth
co
nd
itio
n (
%)
Conditions coded based on Labour Force Survey, with additional categories added.

Depression was more prevalent in the NW foodbanks.
Total
Sample
NW
% %
Depression 24.9 30.2
Anxiety 11.7 8.3
Other common mental health disorders
(CMDs)
2.8 3.1
Serious mental health conditions 3.3 4.2
Unspecified mental health condition 5.5 3.1
One or more of the above 35.6 36.5
Missing 17.1 21.9
(Total sample= 598 households completing over Oct 2016-Apr 2017)

Households with a disability almost three times more prevalent among households using foodbanks.
0%
10%
20%
30%
40%
50%
60%
Householdwith
employmentincome
Householdwith a
disability
Householdwith
pensioner
Other Lone parenthousehold
Disabilitystatus
unknown
Low-income households (HBAI 2014/15) Food bank households
(Source: Analysis by New Policy Institute of HBAI data, Monitoring Poverty and Social Exclusion. 2016).
Poverty
Disability

Income crisis in context of low income or chronic insufficient incomes

Over 1/3 of foodbank clients waiting on a decision or payment from recent benefit application.
Benefit applied for:
%
Employment and Support Allowance 32.1
Jobseeker's Allowance 24.8
Child tax credit 14.5
Housing benefit 13.0
Personal Independence Payment 12.1
Income support 9.12
Working tax credit 7.41
Universal credit 6.66
Child benefit 5.04
Missing 3.66
Yes38%
No61%
Missing1%
Households waiting on benefit application: n=151

How long have applicants been waiting?
%
< 1 week 13.1
1 week 6.80
2 weeks 29.2
3 weeks 9.81
4 weeks 14.7
5 weeks 1.77
6 weeks 1.94
7 weeks or more 21.1
Missing 1.75
Households waiting on benefit application: n=151

1/3 of households reported their income was less in past month than three months ago.
No longer receiving a benefit payment you had previously 20.8%
Benefit sanction 16.8%
Moved from one benefit type to another 16.3%
Change in benefit allowance 14.8%
Loss of a job 14.1%
Separated or divorced from a partner 6.39%
Fewer work hours 6.18%
Wages not paid by employer 4.70%
Sick leave <3%
A pay cut <3%
Maternity leave <3%
Benefit payment capped <3%
Other reason 6.69%

2/3 of households indicated unexpected expenses or rising expenses in past three months.
%
A rise in expenses related to your housing, such as heating,
utilities or rent. 28.3
A rise in food expenses. 25.4
Unexpected expenses related to transportation, such as car
repair or increased transit costs. 13.5
A rise in living expenses due to a new health condition. 10.3
Unexpected expenses related to an accident, injury, or medical
emergency. 9.48
Unexpected expenses due to a necessary housing repair. 7.65
A rise in living expenses due to a new baby. 4.96
Other changes specified to have increased household expenses. 15.1
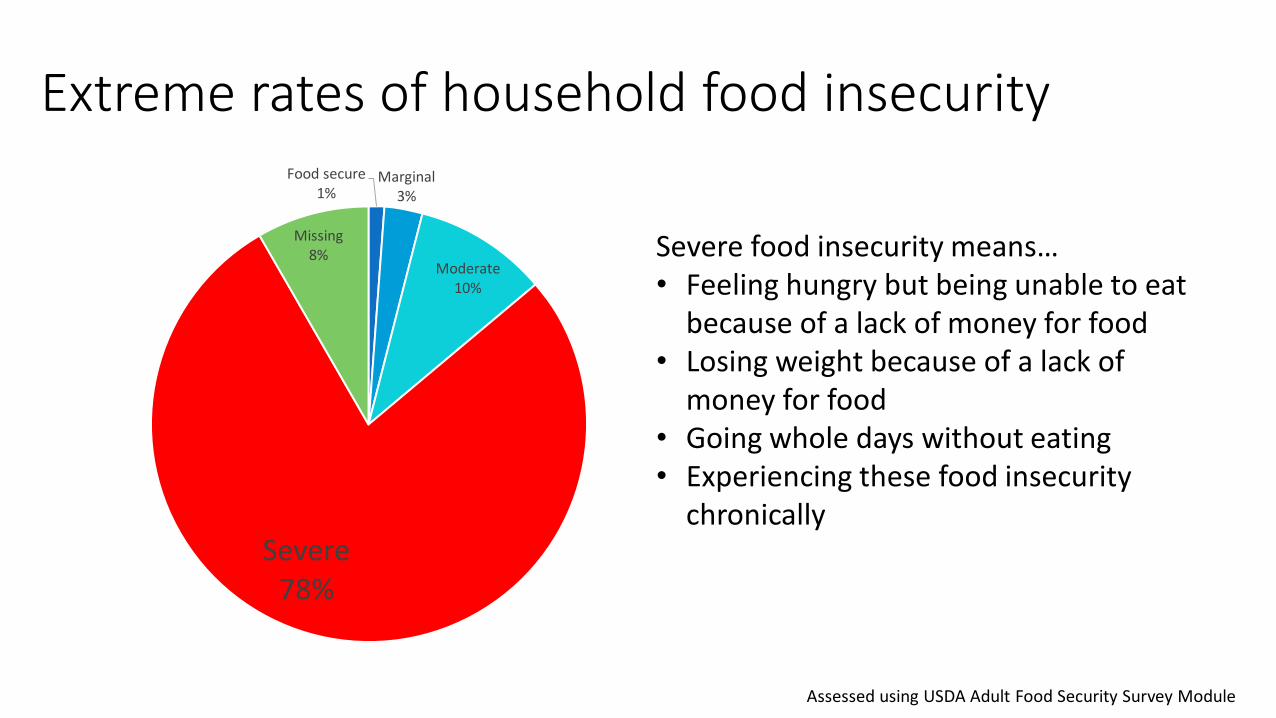
Extreme rates of household food insecurityFood secure
1%Marginal
3%
Moderate10%
Severe78%
Missing8%
Assessed using USDA Adult Food Security Survey Module
Severe food insecurity means…• Feeling hungry but being unable to eat
because of a lack of money for food• Losing weight because of a lack of
money for food• Going whole days without eating• Experiencing these food insecurity
chronically

In NW, foodbank users indicated more experiences of chronic severe food insecurity.
0 5 10 15 20 25 30 35 40 45
Only 1 or 2 months
Some months but not every month
Almost every month
Never
Missing information
Frequency of being unable to eat for a whole day in the past 12 months
Total Sample NW
(Total sample= 598 households completing over Oct 2016-Apr 2017)

Number of foodbank visits in the past 12 months
0
5
10
15
20
25
30
35
None One Two Three Four or five Six or seven Eight or nine Ten or more Missing
NW Total Sample
(Total sample= 598 households completing over Oct 2016-Apr 2017)

Households experienced multiple forms of destitution in past 12 months:
0.0% 10.0% 20.0% 30.0% 40.0% 50.0% 60.0%
Couldn't afford heating
Couldn't afford toiletries
Unable to dress appropriate for weather
Slept rough
Couldn't afford lighting

Multiple forms of financial hardship
Up-to-date on household bills?n %
Up-to-date with all payments 131 30.5
Less than 2 months behind with some or all
payments122 31.8
2-3 months behind with some or all
payments52 12.4
4-5 months behind with some or all
payments13 3.26
6 or more months behind with some or all
payments54 11.9
Missing 41 10.1
Owing money for a personal/household loan:
n %
No money owing for a personal loan 195 47.4
Loan and very/fairly easy to make
minimum payments31 9.06
Loan and fairly difficult to make
minimum payments61 13.1
Loan and very difficult to make
minimum payments94 23.0
Loan but not making loan payments 6 1.45
Missing 22 5.95

More private renters among NW foodbankusers and harder time affording rent.
0
5
10
15
20
25
30
35
40
45
50
Socially rented Homelessaccommodation
provided bylocal authority
Staying withfriends
Privately rented Sleeping rough Other Missing
NW Total Sample
(Total sample= 598 households completing over Oct 2016-Apr 2017)

What do these findings mean for public policy?• Universal credit: 6 weeks until first benefit payment comes through, during
which time many low-income households cannot afford to eat.
• Child tax credit: households with 3+ dependent children– from now, these families will be more vulnerable in the UK.
• ESA for people in work-related activity group: reduced since April 2017, also losing access to Personal Independence Payments.
• Benefit freeze: life is becoming less affordable as prices rise. Benefits unable to meet costs of living.
• Sanctions continue to cause destitution.
• Benefit delays in context of low income: families have no buffer to cope.

What do these findings mean for frontline foodbank practice?• Continued need for advocacy to address upstream, systematic drivers.
• Advocacy within local areas:• Access to local welfare schemes?• Council tax relief schemes?• Local Jobcentres?
• Diversifying nature of support (continue to do as you’re doing!):• Signposting: housing, mental health, debt relief, short-term financial assistance.• Provision of toiletries, clothing, fuelbank.
• Raise questions about access to, and appropriateness of, emergency food for people with disability, people in work, people experiencing chronic food insecurity and low income.

Any questions or comments?
Many thanks again to:• Participating foodbanks and study participants• The Trussell Trust Foodbank Network Public Affairs and Media Team and Head Office• Doireann Lalor• Oxford University and The Trussell Trust for funding this work.
Contact: Rachel Loopstra, King’s College [email protected]@rloopstra