the professional constructor...views expressed by them or the editor do not represent the official...
TRANSCRIPT

IN THIS ISSUE:
Impact of Motivation and Preparation on AC Exam Scores
A Case Study of Visualizing Building Renovation with Laser Scanning and Mixed Reality
Towards an Assessment of SLO9: Working in a Multi-Disciplinary Team
Enrollment, Retention, and Graduation Patterns of Higher-Education Construction Science Students at Texas A&M University: A Comparative Study
The Professional ConstructorJournal of the American Institute of Constuctors
Spring 2018 | Volume 43 | Number 1

The American Institute of Constructors | 19 Mantua Road | Mount Royal, NJ 08061 | Tel: 703.683.4999 | www.professionalconstructor.org— Page 2 —
Fall 2017 | Volume 42 | Number 02
OUR MISSION
• To promote individual professionalismand excellence throughout the relatedfields of construction.
• A qualifying body to serve the individual inconstruction, the Constructor, who has achieveda recognized level of professional competence;
• Opportunities for the individual constructor toparticipate in the process of developing qualitystandards of practice and to exchange ideas;
• Leadership in establishing and maintaininghigh ethical standards;
• Support for construction education and research;
• Encouragement of equitable and professionalrelationships between the professionalconstructor and other entities in theconstruction process; and
• An environment to enhance the overallstanding of the construction profession.
ABOUT THE AIC
Founded in 1971, the American Institute of Constructors
mission is to promote individual professionalism and
excellence throughout the related fields of construction.
AIC supports the individual Constructor throughout their
careers by helping to develop the skills, knowledge,
professionalism and ethics that further the standing
of the construction industry. AIC Members participate
in developing, and commit to, the highest standards
of practice in managing the projects and relationships
that contribute to the successful competition of the
construction process. In addition to membership,
the AIC certifies individuals through the Constructor
Certification Commission. The Associate Constructor
(AC) and Certified Professional Constructor (CPC)
are internationally recognized certifications in the
construction industry. These two certifications give
formal recognition of the education and experience
that defines a Professional Constructor. For more
information about the AIC please visit their website at
www.professionalconstructor.org.
The Professional ConstructorJournal of the American Institute of Constuctors

Spring 2018 | Volume 43 | Number 1
The American Institute of Constructors | 19 Mantua Road | Mount Royal, NJ 08061 | Tel: 703.683.4999 | www.professionalconstructor.org— Page 3 —
AIC PAST PRESIDENTS1971-74 Walter Nashert, Sr., FAIC 1975 Francis R. Dugan, FAIC 1976 William Lathrop, FAIC 1977 James A. Jackson, FAIC 1978 William M. Kuhne, FAIC 1979 E. Grant Hesser, FAIC 1980 Clarke E. Redlinger, FAIC 1981 Robert D. Nabholz, FAIC 1982 Bruce C. Gilbert, FAIC 1983 Ralph. J. Hubert, FAIC1984 Herbert L. McCaskill Jr., FAIC 1985 Albert L Culberson, FAIC 1986 Richard H. Frantz, FAIC1987 L.A. (Jack) Kinnaman, FAIC 1988 Robert W. Dorsey, FAIC 1989 T.R. Benning Jr., FAIC1990 O.L. Pfaffmann, FAIC 1991 David Wahl, FAIC 1992 Richard Kafonek, FAIC 1993 Roger Baldwin, FAIC 1994 Roger Liska, FAIC1995 Allen Crowley, FAIC 1996 Martin R. Griek, AIC 1997 C.J. Tiesen, AIC1998-99 Gary Thurston, AIC2000 William R. Edwards, AIC 2001-02 James C. Redlinger, FAIC 2003-04 Stephen DeSalvo, FAIC 2005-06 David R. Mattson, FAIC2007-09 Stephen P. Byrne, FAIC, CPC2009-11 Mark E. Giorgi, FAIC2011-12 Andrew Wasiniak, FAIC, CPC 2012-13 Tanya Matthews, FAIC, DBIA 2013-14 David Fleming, CPC, DBIA 2014-15 Paul Mattingly, CPC2015-16 Joe Rietman, CPC
PresidentGreg Carender, CPCEdgeConnex
Vice PresidentBrian Holley, CPCVScenario
TreasurerMark Hall, CPCHall Construction
AIC BOARD OF DIRECTORS 2017National Elected DirectorsJoe Burgett (Elected) (2016-2019)Paul Christian (Elected) (2016-2019) Ihab Saad (Elected) (2015-2018) James Hogan (Elected) (2015-2018)Greg Carender (Elected) (2015-2018)Saeed Goodman (Elected) (2015-2018)Bradley Monson (Elected) (2017-2020)Lana Coble (Elected (2017-2020)Thad Nicholson (Elected) (2017-2020)Robert Aniol (Elected)(2017-2020)Scott Cuthbertson (Elected) (2017-2020)Roger Liska (Chair, Constructor Certification Commission)Jim Nissen (Chair, Membership Committee)Chris Clifford (Chair, AIC Ethics Commission)
Non-Voting Past-President DirectorsJoe Rietman, (Past-President) Paul Mattingly (Past-President)David Fleming (Past-President)Tanya C. Matthews (Past-President)Andrew Wasiniak (Past-President)Mark Giorgi (Past-President)David Mattson (Past-President)Steve DeSalvo (Past-President)Jim Redlinger (Past-President)
SecretaryTerry Foster, FAIC, CPCUniversity of Nebraska
Past-PresidentJoe Rietman, CPCvScenario
The Professional ConstructorJournal of the American Institute of Constuctors

Spring 2018 | Volume 43 | Number 1
The American Institute of Constructors | 19 Mantua Road | Mount Royal, NJ 08061 | Tel: 703.683.4999 | www.professionalconstructor.org— Page 4 —
ARTICLESPAGE 5
Impact of Motivation and Preparation on AC Exam Scores Julia L. SharpJoseph M. Burgett and
PAGE 30
A Case Study of Visualizing Building Renovation with Laser Scanning and Mixed Reality Yilei Huang
PAGE 40
Towards An Assessment of SLO9: Working in a Multi-Disciplinary Team Ihab M. H. Saad
PAGE 48
Enrollment, Retention, and Graduation Patterns of Higher-Education Construction Science Students at Texas A&M University: A Comparative Study
Edelmiro F. Escamilla, Mohammadreza Ostadalimakhmalbaf, Fatemeh Pariafsai,
Carlos Gragera, and Mohammadhossein N. Alizadeh
EDITORJason D. Lucas, Ph.D.
Assistant Professor, Clemson University
The Professional Constructor (ISSN 0146-7557) is the official publication of the American Institute of Constructors (AIC), 19 Mantua Road, Mount Royal, NJ 08061. Telephone 703.683.4999, Fax 703.683.5480, www.professionalconstructor.org.
This publication or any part thereof may not be reproduced in any form without written permission from AIC. AIC assumes no responsibility for statements or opinions advanced by the contributors to its publications. Views expressed by them or the editor do not represent the official position of the The American Professional Constructor, its staff, or the AIC.
The Professional Constructor is a refereed journal. All papers must be written and submitted in accordance with AIC journal guidelines available from AIC. All papers are reviewed by at least three experts in the field.
The Professional ConstructorJournal of the American Institute of Constuctors

Spring 2018 | Volume 43 | Number 1
— Page 5 —The American Institute of Constructors | 19 Mantua Road | Mount Royal, NJ 08061 | Tel: 703.683.4999 | www.professionalconstructor.org
Impact of Motivation and Preparation on AC Exam ScoresJoseph M. Burgett, Clemson University | [email protected]
Julia L. Sharp, Colorado State University | [email protected]
ABSTRACT
The Associate Constructor (AC) Exam is a standardized test that certifies that the test taker has the skills and knowledge necessary to manage the process of construction. While the intention of the exam is to access knowledge, it has been well documented that exam scores are a function of knowledge and motivation. To better understand the impact of student preparation and motivation on exam scores, two surveys were conducted. The first survey was included with the AC exam package and was completed by 475 students. The second survey was completed by 26 department heads, which accounted for 67% of the test sites. The results from the surveys found that the average score of students who studied for the exam 5 or more hours was significantly higher than those who did not study at all. In addition, the surveys found that the average exam score for students who perceived that their department viewed the exam as “very important” compared to “not important” was also significantly higher. No relationship was found between the students’ personal view or their perception of the industry’s view of the exam and exam scores. The data collected suggest that the perception of importance was related to the incorporation of the exam into a course and requiring students to retake the exam if they did not receive an acceptable score.
Keywords: AC Exam, Prparation, Motivation, ACCE
Joe Burgett, PhD CPC is an assistant professor at Clemson University’s Construction Science and Management. Dr. Burgett is on the Board of the American Institute of Constructors and a member of the Exam Writing Committee.
Julia Sharp, PhD is an associate professor, and Franklin A. Graybill Statistical Laboratory director at Colorado State University

Impact of Motivation and Preparation on AC Exam Scores
Spring 2018 | Volume 43 | Number 1
— Page 6 —The American Institute of Constructors | 19 Mantua Road | Mount Royal, NJ 08061 | Tel: 703.683.4999 | www.professionalconstructor.org
INTRODUCTIONThe professional constructor is aware that electrical power is quantified by the volt-amp, which is simply voltage multiplied by amperage. Both are required to power equipment. However, the absence of one will lead to equipment failure even with an abundance of the other. This is a good analogy to standardized testing, in which, instead of voltage and amperage, the latent variables are knowledge and motivation. The absence of either will lead to failure. Standardized tests, such as the Associate Constructor Level 1 (AC) exam, are often used as a direct assessment of students’ knowledge. However, without understanding and managing the impact of motivation, the scores can inaccurately reflect student learning. This is of particular interest to construction management (CM) programs using the AC exam as a third-party assessment of their program. By surveying department heads and student AC exam takers, this study shows how programs are currently addressing student motivation and examines the relationship between motivation and preparation on exam scores.
AC ExamSince 1971, the American Institute of Constructors (AIC) has advanced the professionalism and ethics of the construction professional (American Institute of Constructors [AIC] 2017a; Sylvester 2011). In 1993, the AIC, along with 10 other trade and professional associations, created the Constructor Certification Commission (Commission) with the express purpose of developing a nationally recognized qualifying body of professional constructors (Hauck & Rockwell 1997; Sylvester 2011). The Commission has two levels of certification: Level 1, the level of an AC, and Level 2, that of the certified professional constructor (CPC). Since the first certification was awarded in 1996, over 25,000 individuals have received their AC or CPC certifications or both under the Commission’s leadership (AIC 2017a). Individuals can earn the AC certification with a combination of a 4-year CM degree or 4 years of qualifying experience and passing the AC exam (AIC 2016). The AC exam is a paper-based exam given in two 4-hour segments, administered once in late fall and once in late spring of the academic calendar. Students generally take the exam during the final year of their CM degree program (MacDonald & Sessoms 2012). The exam consists of 300 questions
related to 10 weighted content areas identified by industry professionals as necessary to manage the construction process (AIC 2016). The exam is accredited by the American National Standards Institute (ANSI), which mandates in part that educators have no prior knowledge of exam questions (AIC 2017b). Educators may submit potential questions for consideration; however, industry professionals on the Exam Writing Committee (subcommittee of the Commission) must vet all questions for appropriateness before they are included in an exam.
Low-Stakes TestsBeing able to assess student learning using standardized tests is a well-documented challenge (Cole et al 2008; Erwin & Wise 2002; Flowers et al. 2001). This problem is particularly acute when the consequences for failure are low for students but high for the students’ institution. The literature has referred to exams given where the stakes are low from the students’ perspective as “low-stakes tests” (Cole et al. 2008; Finn 2015). Depending on how the exam is administered, the AC exam can be easily classified as a low-stakes test. The AC exam is by no means alone in facing the challenge of depressed student motivation. The Collegiate Assessment of Academic Proficiency, College Outcomes Measures Program, College Basic Academic Subjects Examination, and Collegiate Learning Assessment are all standardized higher education cognitive tests that are challenged by low student motivation (Cole et al. 2008). As the economy improves, graduating students are receiving more employment offers and are under increasing pressure to accept jobs earlier without necessarily completing or passing industry exams. This can further deflate students’ motivation to perform well on the AC exam. Erwin and Wise (2002) put it succinctly: “the challenge to motivate our students to give their best effort when there are few or no personal consequences is probably the most vexing assessment problem we face.”
Expectancy-Value TheoryA well-cited model to explain testing results is Wigfield and Eccle’s (2000) expectancy-value theory (Cole et al. 2008; Finn 2015). The expectancy-value theory claims that the motivation for students to try hard on low-stakes tests comes from a) the expectation for success and b) the value

Impact of Motivation and Preparation on AC Exam Scores
Spring 2018 | Volume 43 | Number 1
— Page 7 —The American Institute of Constructors | 19 Mantua Road | Mount Royal, NJ 08061 | Tel: 703.683.4999 | www.professionalconstructor.org
they place on the task. The expectancy-value theory predicts that when the exam is easier or harder than the test takers believed it would be, their assessment scores are reduced (Finn 2015). When students have a proper expectation of the exam’s difficulty, their overall scores will improve and more accurately access their understanding of the material.
The AIC provides a study guide, which includes a practice test so that students can gauge the type, style, and difficulty of exam questions (AIC 2016). It is unknown at this time if this resource sufficiently negates the “expectation for success” component as an influential factor in exam results. This aspect of the AC exam is beyond the scope of this study. This study will focus on the value students place on the exam. There are many benefits from passing the AC exam, which each student may value differently. The potential benefits seem to be prestige with potential employers, AC exam scores incorporated into a course grade, perceived benefit to their department, and intrinsic personal achievement (Burgett 2017). The value students place on the AC exam has a relationship with exam scores. Specifically, this study found that student’s find value in the exam when they perceive their department view the exam as having high value. This will be explored further in this paper.
METHODOLOGYThe data collected for this study came from two separate surveys. The first student survey was an eight-question student survey included with the fall 2016 AC Exam. The questions on the student survey were provided to the students on the back of the exam answer sheet. Exam proctors made the students aware of the survey and of the logistics for completing it. Of the 649 students who took the exam, 475 (73%) completed the survey. The third-party testing service that administered the exam compiled the survey results. The testing service paired the completed student surveys with their raw exam scores. Student names and the schools they attended were replaced with non-identifying ID codes. After all identifiers were removed, the survey results paired with exam scores were transferred to the authors by AIC administration.
The second survey was sent to department heads of
CM programs that use the AC exam (department head survey). (Raw findings published in Burgett 2017) The term department heads also includes program coordinators, department chairs, and those with other similar titles. An online survey instrument was used for the department head survey. Skip logic was incorporated into the survey, and appropriate follow-up questions were asked to clarify responses. The survey included over 40 dichotomous, multi-response, 5-point Likert scale, open-ended questions. The survey was administered by the AIC, distributed to all department heads from test site universities, and sent out immediately before the fall 2016 AC exam cycle, with responses collected at the end of the year. There were 26 completed surveys received from 23 universities. Students from these universities account for 67% of the semester’s 649 AC exam test takers. The department head survey respondents were asked their university affiliation; however, this information was replaced with the same non-identifying ID codes used in the student survey before being transmitted to the authors by AIC administration. Because the same ID codes were used, the authors could pair the student’s survey with the surveys completed by their department heads while still maintaining the anonymity of all parties.
STATISTICAL ANALYSISDescriptive statistics (frequencies and relative frequencies) were computed to summarize each question on the questionnaires. A mixed effects analysis was conducted for each student question using the exam score as the dependent variable, each student question as a fixed factor, and school as a random effect to account for students nested within school. Using the school as a random effect allowed the variation within and between schools to be estimated. Mixed effects models were also used to examine the relationship between the student perception of importance of the AC exam to the construction management program (dependent variable) and each department head question (independent variable). When the overall test indicated a significant difference in the averages, Tukey’s Honest Significant Difference (HSD) adjustment was used to compare each pair of means. A significance level of 0.05 was used for all tests of significance.
Impact of Motivation and Preparation on AC Exam Scores
Spring 2018 | Volume 43 | Number 1
— Page 8 —The American Institute of Constructors | 19 Mantua Road | Mount Royal, NJ 08061 | Tel: 703.683.4999 | www.professionalconstructor.org
RESULTS OF THE SURVEYTable 1 provides the descriptive statistics of the eight questions asked on the student survey. As the question responses were categorical, the middle value of the range was used to calculate the average, median and standard deviation. Student question (SQ) 1 showed that 44.8% of the test takers did not participate in a university-sponsored exam review session. Students engaged in some department sponsored test preparation lasting 3.1 hours on average. Approximately 80% of the students indicated that they studied 1 hour or more for the exam with approximately 60% responding that they had studied at least 5 hours (SQ2).
SQ3, 4, and 5 addressed student motivation and asked about how important the exam was to them personally, to their department, and to potential employers. Over 72% of the students indicated that the exam was important or very important to them personally and to their department. The students did not perceive that the industry viewed the exam as important, with only 34% indicating that they felt the industry viewed it as important or very important. Approximately forty percent (40%) indicated that their impression was that the industry (construction companies that hire from their program) viewed the AC exam as not important.
The AIC recently updated the AC exam study guide and provided an online study course to help prepare students for the exam. From the results of SQ7, 79% of the students found the new study guide slightly useful, useful, or very useful. Only 7% of those surveyed viewed the new study guide as not useful. In the fall of 2016, the AIC made available at no cost a new online study course. At the time of the student survey, the online study course had been available for only one exam cycle. This likely contributed to 56% of the students’ indicating that they did not use the online study course. Of those that did use the online study course, 92% found it either slightly or more useful.
Student Preparation and Exam ScoresIn two of the eight student questions, there were meaningful statistical differences in the mean exam scores. These two questions were related to how long the student studied (SQ2) and how important the students perceived the exam was to their CM
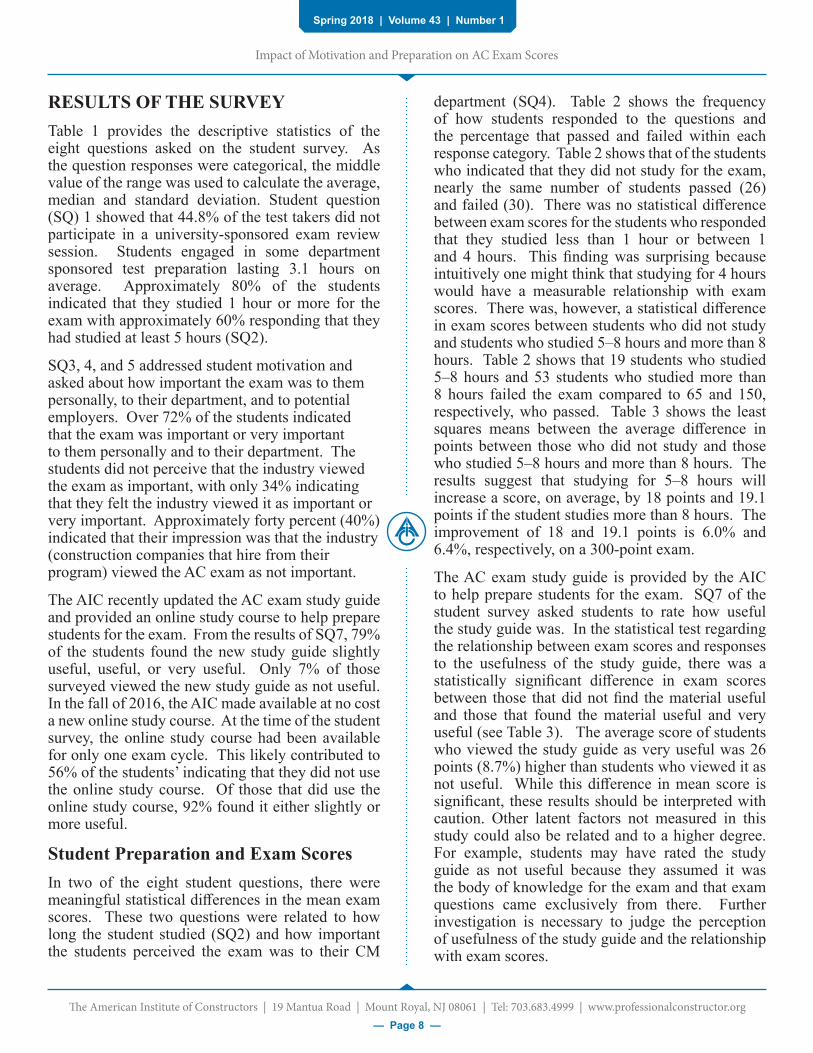
department (SQ4). Table 2 shows the frequency of how students responded to the questions and the percentage that passed and failed within each response category. Table 2 shows that of the students who indicated that they did not study for the exam, nearly the same number of students passed (26) and failed (30). There was no statistical difference between exam scores for the students who responded that they studied less than 1 hour or between 1 and 4 hours. This finding was surprising because intuitively one might think that studying for 4 hours would have a measurable relationship with exam scores. There was, however, a statistical difference in exam scores between students who did not study and students who studied 5–8 hours and more than 8 hours. Table 2 shows that 19 students who studied 5–8 hours and 53 students who studied more than 8 hours failed the exam compared to 65 and 150, respectively, who passed. Table 3 shows the least squares means between the average difference in points between those who did not study and those who studied 5–8 hours and more than 8 hours. The results suggest that studying for 5–8 hours will increase a score, on average, by 18 points and 19.1 points if the student studies more than 8 hours. The improvement of 18 and 19.1 points is 6.0% and 6.4%, respectively, on a 300-point exam.
The AC exam study guide is provided by the AIC to help prepare students for the exam. SQ7 of the student survey asked students to rate how useful the study guide was. In the statistical test regarding the relationship between exam scores and responses to the usefulness of the study guide, there was a statistically significant difference in exam scores between those that did not find the material useful and those that found the material useful and very useful (see Table 3). The average score of students who viewed the study guide as very useful was 26 points (8.7%) higher than students who viewed it as not useful. While this difference in mean score is significant, these results should be interpreted with caution. Other latent factors not measured in this study could also be related and to a higher degree. For example, students may have rated the study guide as not useful because they assumed it was the body of knowledge for the exam and that exam questions came exclusively from there. Further investigation is necessary to judge the perception of usefulness of the study guide and the relationship with exam scores.

Impact of Motivation and Preparation on AC Exam Scores
Spring 2018 | Volume 43 | Number 1
— Page 9 —The American Institute of Constructors | 19 Mantua Road | Mount Royal, NJ 08061 | Tel: 703.683.4999 | www.professionalconstructor.org
Table 1: Student Questionnaire Overview
Survey Question Possible Responsesa (% Frequency)
Sample Size Averageb Medianb
Stand Devb
SQ1) If you participated in a structured AC exam review session(s) that was sponsored by your institution, how many total hours did you participate in the session(s)?
I did not participate in a review session (44.8%) Less than an hour (2.7%) 1 to 3 hours (12.4%) 4 to 6 hours (11.1%) Longer than 6 hours (28.8%)
475 3.1 hrs.
1 to 3 hrs. 3.5hrs.
SQ2) How many hours outside of a structured course or review session(s) did you spend studying for the AC exam?
I did not study for the exam (11.8%) Less than 1 hour (8.8%) 1 to 4 hours (19.0%) 5 to 8 hours (17.7%) More than 8 hours (42.7%)
475 6.8 hrs.
5 to 8 hrs. 4.9 hrs.
SQ3) How important is it for you personally to do well on the AC exam?
1-Not important (7.2%) 2-Slightly important (20.5%) 3-Important (29.8%) 4-Very important (42.6%)
474 3.1 3.0 1.0
SQ4) How important is your performance on the AC exam to your construction management program?
1-Not important (6.8%) 2-Slightly important (17.0%) 3-Important (30.3%) 4-Very important (45.8%)
469 3.2 3.0 0.9
SQ5) How important is the AC exam to construction companies hiring from your construction management program?
1-Not important (40.1%) 2-Slightly important (25.8%) 3-Important (26.2%) 4-Very important (7.9%)
469 2.0 2.0 1.0
SQ6) How similar were the concepts tested on in this exam to the material taught in your courses?
1-Not similar (1.9%) 2-Slightly similar (22.0%) 3-Similar (51.7%) 4-Very similar (24.4%)
464 3.0 3.0 0.7
SQ7) How useful was the AC Exam Study Guide?
Did not use the Study Guide (14.4%) 1-Not useful (6.9%) 2-Slightly useful (26.7%) 3-Useful (38.1%) 4-Very useful (14.0%)
465 2.7 3.0 0.8
SQ8) How useful were the AC Exam online learning tutorials?
Did not use the online learning tutorials (56.1%) 1-Not useful (4.8%) 2-Slightly useful (15.7%) 3-Useful (15.9%) 4-Very useful (7.6%)
460 2.6 3.0 0.9
aThe second column of the table indicates the possible responses as well as frequency. The frequency is provided as a percentage of the sample size.
bThe third column provides the basic descriptive statistics of each of the eight questions. Middle value used to calculate average, median and standard deviation for ranged categorical responses.

Impact of Motivation and Preparation on AC Exam Scores
Spring 2018 | Volume 43 | Number 1
— Page 10 —The American Institute of Constructors | 19 Mantua Road | Mount Royal, NJ 08061 | Tel: 703.683.4999 | www.professionalconstructor.org
Table 2: Frequency Table for SQ2 and SQ4
SQ2) How many hours outside of a structured course or review session(s) did you spend studying for the AC exam?Frequency/Percentage Mean Exam Score*
Did not study <1hr 1–4hrs 5–8hrs >8hrs TotalFail 26/5.5%
160
18/3.8%
186
38/8.0%
185
19/4.0%
184
53/11.2%
182
154/32.4%
180Pass 30/6.3%
233
24/5.1%
234
52/11.0%
238
65/13.7%
235
150/31.6%
237
321/67.6%
236Total 56/11.8% 42/8.8% 90/19.0% 84/17.7% 203/42.7% 475/100.0%
203 220 215 221 222 218 SQ4) How important is your performance on the AC exam to your construction management program?
Frequency/Percentage Mean Exam Score*
Not
ImportantSlightly
Important Important Very Important Total
Fail 15/3.2%
150
37/7.9%
175
43/9.2%
180
59/12.6%
191
154/32.8%
180Pass
17/3.6%
230
43/9.2%
237
99/21.11%
235
156/33.3%
237
315/67.2%
236
Total 32/6.8% 80/17.1% 142/30.3% 215/45.8% 469/100.0%
193 208 219 224 218*Least squares means presented in total across study hours and importance categories.
Table 3: Difference of Least Squares Mean
Question Comparable Responses
Least Squares Average
Difference in Score Standard Error DF
Tukey’s Adj p-value
Q2 5–8 hours Did not Study 18.0 5.7 461 0.015Q2 >8 hours Did not Study 19.1 5.2 462 0.002Q4 Very Important Not Important 19.2 6.6 437 0.021Q4 Very Important Slightly Important 13.4 4.7 451 0.021Q7 Useful Not Useful 24.1 5.9 444 0.001Q7 Very Useful Not Useful 26.0 6.6 446 0.001
Impact of Motivation and Preparation on AC Exam Scores
Spring 2018 | Volume 43 | Number 1
— Page 11 —The American Institute of Constructors | 19 Mantua Road | Mount Royal, NJ 08061 | Tel: 703.683.4999 | www.professionalconstructor.org
Student Motivation and Exam Scores
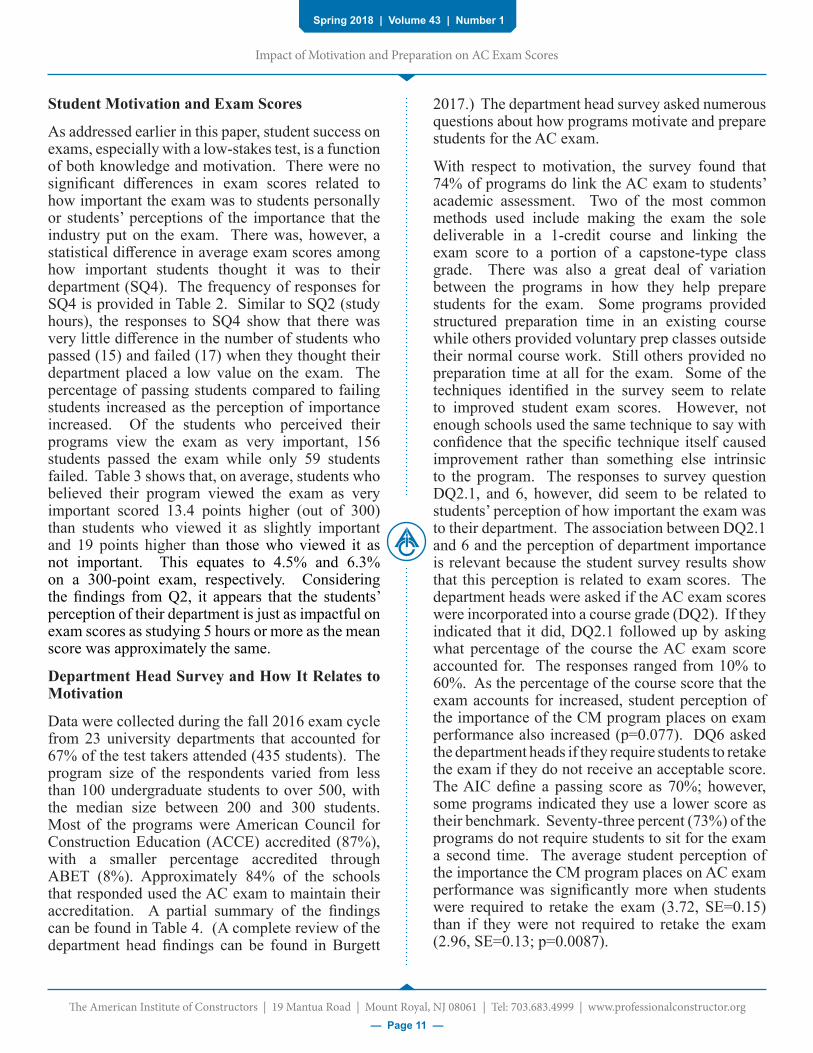
As addressed earlier in this paper, student success on exams, especially with a low-stakes test, is a function of both knowledge and motivation. There were no significant differences in exam scores related to how important the exam was to students personally or students’ perceptions of the importance that the industry put on the exam. There was, however, a statistical difference in average exam scores among how important students thought it was to their department (SQ4). The frequency of responses for SQ4 is provided in Table 2. Similar to SQ2 (study hours), the responses to SQ4 show that there was very little difference in the number of students who passed (15) and failed (17) when they thought their department placed a low value on the exam. The percentage of passing students compared to failing students increased as the perception of importance increased. Of the students who perceived their programs view the exam as very important, 156 students passed the exam while only 59 students failed. Table 3 shows that, on average, students who believed their program viewed the exam as very important scored 13.4 points higher (out of 300) than students who viewed it as slightly important and 19 points higher than those who viewed it as not important. This equates to 4.5% and 6.3% on a 300-point exam, respectively. Considering the findings from Q2, it appears that the students’ perception of their department is just as impactful on exam scores as studying 5 hours or more as the mean score was approximately the same.
Department Head Survey and How It Relates to Motivation
Data were collected during the fall 2016 exam cycle from 23 university departments that accounted for 67% of the test takers attended (435 students). The program size of the respondents varied from less than 100 undergraduate students to over 500, with the median size between 200 and 300 students. Most of the programs were American Council for Construction Education (ACCE) accredited (87%), with a smaller percentage accredited through ABET (8%). Approximately 84% of the schools that responded used the AC exam to maintain their accreditation. A partial summary of the findings can be found in Table 4. (A complete review of the department head findings can be found in Burgett
2017.) The department head survey asked numerous questions about how programs motivate and prepare students for the AC exam.
With respect to motivation, the survey found that 74% of programs do link the AC exam to students’ academic assessment. Two of the most common methods used include making the exam the sole deliverable in a 1-credit course and linking the exam score to a portion of a capstone-type class grade. There was also a great deal of variation between the programs in how they help prepare students for the exam. Some programs provided structured preparation time in an existing course while others provided voluntary prep classes outside their normal course work. Still others provided no preparation time at all for the exam. Some of the techniques identified in the survey seem to relate to improved student exam scores. However, not enough schools used the same technique to say with confidence that the specific technique itself caused improvement rather than something else intrinsic to the program. The responses to survey question DQ2.1, and 6, however, did seem to be related to students’ perception of how important the exam was to their department. The association between DQ2.1 and 6 and the perception of department importance is relevant because the student survey results show that this perception is related to exam scores. The department heads were asked if the AC exam scores were incorporated into a course grade (DQ2). If they indicated that it did, DQ2.1 followed up by asking what percentage of the course the AC exam score accounted for. The responses ranged from 10% to 60%. As the percentage of the course score that the exam accounts for increased, student perception of the importance of the CM program places on exam performance also increased (p=0.077). DQ6 asked the department heads if they require students to retake the exam if they do not receive an acceptable score. The AIC define a passing score as 70%; however, some programs indicated they use a lower score as their benchmark. Seventy-three percent (73%) of the programs do not require students to sit for the exam a second time. The average student perception of the importance the CM program places on AC exam performance was significantly more when students were required to retake the exam (3.72, SE=0.15) than if they were not required to retake the exam (2.96, SE=0.13; p=0.0087).

Impact of Motivation and Preparation on AC Exam Scores
Spring 2018 | Volume 43 | Number 1
— Page 12 —The American Institute of Constructors | 19 Mantua Road | Mount Royal, NJ 08061 | Tel: 703.683.4999 | www.professionalconstructor.org
Table 4: Department Head Survey Results
Question Percentage Median Standard Deviation
Sample Size
DQ1) Are students required to take (or penalized for not taking) the AC Exam?
Yes = 73% No = 27% 22
DQ2) Are the AC exam scores incorporated into a course grade? Yes = 74% No = 26% 23
DQ2.1) Skip Logic Follow-Up: What percentage of the course grade does the AC exam account for? 28% 23% 19% 10
DQ3) Do the students in your program need to earn a minimum score on the AC exam to graduate?
Yes = 26% No = 74% 23
DQ3.1) Skip Logic Follow-Up: What is the minimum score required on the AC exam to graduate? 62% 60% 8% 6
DQ4) Is preparing for and taking the AC exam a stand-alone course with a unique course number?
Yes = 17% No = 83% 23
DQ4.1) Skip Logic Follow-Up: What is the minimum score required on the AC exam to pass a stand-alone course? 62% 60% 5% 4
DQ5) Who pays the examination fee to take the AC exam?
Program all = 28%
Program some = 10%
Student = 62%
21
DQ6) Are students required to retake the AC exam if they do not obtain an acceptable score?
Yes = 27% No = 73% 22
DQ7) Does your program assist students in preparing for the AC exam? Examples include exam review during class or optional exam review study sessions outside of class.
Yes = 74% No = 26% 23
DQ8) Is there time devoted during an existing course to prepare students for the AC exam?
Yes = 48% No = 52% 23
DQ8.1) Skip Logic Follow-Up: How many hours of class time of an existing course are devoted to preparing students for the AC exam?
13hrs. 10hrs. 12hrs. 11
DQ9) Is preparing for and taking the AC exam a stand-alone course with a unique course number?
Yes = 17% No = 83% 23
DQ10) Does your program provide instructor-led exam preparation classes outside the classroom?
Yes = 12% No = 88% 23

Impact of Motivation and Preparation on AC Exam Scores
Spring 2018 | Volume 43 | Number 1
— Page 13 —The American Institute of Constructors | 19 Mantua Road | Mount Royal, NJ 08061 | Tel: 703.683.4999 | www.professionalconstructor.org
DISCUSSIONCommonalities in Highest Performing Departments
The AC exam certifies those that have the “skills and knowledge necessary to manage the process of construction” (AIC 2017a). By its very nature, it forms a natural pair with the American Council for Construction Education (ACCE) as its mission is to “promote, support, and accredit quality construction education programs” (ACCE 2017a). Because of this natural pairing, many schools are using the exam as direct and indirect measures for the ACCE’s 20 student-learning outcomes (SLO). The ACCE accepts the AC exam in particular as a direct measure for 12 of the 20 SLOs (ACCE 2017b). With exam performance tied to accreditation, the importance of students’ performance has never been higher for CM programs. This has led to discussions over the best ways to prepare and motivate students for the exam. The feedback from the department head survey shows that there is a great deal of variation in how programs address preparing and motivating students. While this study does not suggest that a particular prescriptive path leads to higher pass rates on the AC exam, there do appear to be commonalities in techniques between the top performing schools (defined by qualitatively considering the similarities in practices among the schools with the highest raw AC exam score. From the data collected, 12 schools had 10 or more students take the exam in the fall semester. Of these schools, the highest performing 5 schools had very similar responses to the survey regarding AC exam integration with curricula. These commonalities can be found below:
• Departments make taking the AC exam a requirement.
• Passing the AC exam is not a requirement to graduate. Alternative paths to graduating are available to the students.
• The AC exam is incorporated as a graded component of a required course.
• Structured preparation session(s) are provided by the department.
• The AC exam is used as a measure for SLOs for accreditation.
As many of the SLOs are tied directly to specific
courses, the faculty who teach those courses are stakeholders in their students’ performance. It is sometimes difficult to quantify the impact faculty have on students but it is reasonable to conclude that when faculty care about the exam it will often be mirrored by the students. This is especially true when there is a positive relationship between the faculty and student. The faculty are there to prepare students for the industry and the students may perceive the AC exam experience as an extension of that and thus take it more seriously.
Magnitude of Effect of Preparation
Again, while this study cannot show which technique to increase motivation or preparation is best, it can quantify the magnitude of the effect. Based on the survey results of 73% (N=475) of the students that took the fall 2016 exam, students who studied 5 hours or more earned approximately 18 of 300 points (6%) more than those who did not study at all. To put this into perspective, for this exam cycle, approximately 67% of the students earned a passing score of 210 points or better. However, 81% of the test takers scored better than 192 points (18 points less than 210); 6% or 18 points would have made the difference for 88 students or 14% of the test takers who did not pass. This seems a desirable position for the AIC. Studying should have a relationship with exam score, but being able to dramatically improve a student’s score by studying would call into question the rigor and comprehensiveness of the exam designed to test the skills and knowledge learned over a 4-year education.
Effect of Department’s View of Exam on Student Performance
As previously discussed, for tests that have low stakes for the test taker but high stakes for the institution, motivation is critical for accurate assessment. It was interesting that of the motivation questions asked of the students, it was the perception of how important the exam was to their department that had a statistical relationship with exam scores. Students who believed their department viewed the exam as very important scored on average 6% better than those who believed their program viewed it as unimportant. Personal importance or the importance of potential employers did not have a significant relationship with exam scores. Perhaps this should not be surprising given the more communal team-
Impact of Motivation and Preparation on AC Exam Scores
Spring 2018 | Volume 43 | Number 1
— Page 14 —The American Institute of Constructors | 19 Mantua Road | Mount Royal, NJ 08061 | Tel: 703.683.4999 | www.professionalconstructor.org
success orientation of the millennial generation. Understanding why the students valued what their department valued is beyond the scope of this study. However, what this study does reveal is that what faculty and staff say and do related to the exam may impact students’ perception, and that perception has a relationship with exam score. The data collected imply that including the exam as a part of a course and requiring students to retake the exam may be related to the perception of the department’s view of the exam. However, extrapolating from this, one can see a host of other measures that faculty have at their disposal to relay to students that they value the exam. Talking about the exam to underclassmen so that there are years of buildup is one example. Telling students during a lecture to “pay attention because this is something that may be on the AC exam” is another. Again, this study does not support any particular motivation technique; it only suggests that students can be motivated and that motivation may be related to exam scores.
Industry’s View of AC Exam
A observation from the department head survey was that when industry was aware of the exam they perceived it favorably but recognition of the exam beyond the universities sphere of influences was low (Burgett 2017). This was consistent to how the students responded to student survey question SQ5 (table 1). Increasing awareness of the AC exam and the value it brings to the industry remains a challenge for the AIC. This challenge is likely a limiting factor in more universities incorporating it into their curriculum. This is an area where further research is recommended.
Exam Material and Curriculum Content
Question SQ6 of the student survey asked how similar the concepts on the exam were to the questions asked in the exam. Seventy-six percent (76%) of the students responded that the concepts tested on were either similar or very similar to the material taught in their courses. This high percentage speaks favorably of the exam because it appears to be testing on concepts taught in most CM programs. This percentage also speaks well of the students’ CM program, as the exam questions are created by industry practitioners and are based on what they view as critical for entry-level managers to know. It appears that the curriculum of the test takers aligns
to what industry feels they need to know before entering the industry.
CONCLUSIONSThis study presented the findings from two distinct surveys related to the AC exam. The first survey was given as part of the fall 2016 AC exam and was completed by 475 students. The second survey was completed by 26 department heads. Approximately 67% of the students attended a university who participated in the department head survey. The results from the surveys found that the average score of students who studied for the exam 5 or more hours was significantly higher than those who did not study at all. In addition, the surveys found that the average exam score for students who perceived that their department viewed the exam as “very important” compared to “not important” was also significantly higher. No relationship was found between the students’ personal view or their perception of the industry’s view of the exam and exam scores. The data collected suggest that the perception of importance was related to the incorporation of the exam into a course and requiring students to retake the exam if they did not receive an acceptable score.
FUTURE STUDYWhile conducting this study on preparation and motivation of the AC exam, several new questions arose after analyzing the data. This study found that the average exam score was significantly higher for those that studied 5-hours or more. This study did not explore the factors that influenced the time students invested in preparing for the exam. For example, of the students that indicated that they did not study at all, nearly the same number of students passed that failed. Perhaps, academically gifted students did not feel that they needed to study. Further exploration into the factors influencing study time is recommended. This study also found that students who felt that their department viewed the exam as “very important” performed statistically better on the exam. The surveys did not address the factors that contributed to the students’ perception of what made the exam important to their departments. Perhaps it was that the exam was included as part of a class or maybe it was the personal interaction with the faculty. This would be a useful future study especially for departments wishing to improve

Impact of Motivation and Preparation on AC Exam Scores
Spring 2018 | Volume 43 | Number 1
— Page 15 —The American Institute of Constructors | 19 Mantua Road | Mount Royal, NJ 08061 | Tel: 703.683.4999 | www.professionalconstructor.org
student motivation on the exam. The student survey revealed that 40% of the test takers perceive that industry views the exam as “not important.” Another future study explaining why the students have this perception would also be valuable.
ReferencesAmerican Council of Construction Education. (2017a). Mission and purpose. Retrieved from http://www.acce-hq.org/about/mission-and-purpose/
American Council of Construction Education. (2017b). Listing of AIC certification testing support of ACCE’s student learning outcomes (SLOs). Retrieved from http://www.acce-hq.org/images/uploads/Listing_of_AIC_Certification_Testing_Support_of_ACCE_SLO_010317.pdf
American Institute of Constructors. (2016). Associate constructor exam official study guide. Alexandria, VA: The American Institute of Constructors.
American Institute of Constructors. (2017a). America Institute of Constructors. Retrieved from http://www.professionalconstructor.org/
American Institute of Constructors. (2017b). America Institute of Constructors—ANSI Accreditation. Retrieved from http://www.professionalconstructor.org/?page=ANSI
Burgett, J. B. (2017). Measures to motivate and prepare students taking the AC exam: A survey of universities. The professional Cosntructor, 42(2):5-14.
Cole, J. S., Bergin, D. A., & Whittaker T. A. (2008). Predicting student achievement for low stakes tests with effort and task value. Contemporary Educational Psychology, 33, 609–624.
Erwin, T. D., & Wise, S. L. (2002). A scholar-practitioner model for assessment. In T. W. Banta (Ed.), Building a scholarship of assessment (pp. 67–81). San Francisco: Jossey-Bass.
Finn, B. (2015). Measuring motivation in low-stakes assessments. Educational Testing Service Research Report Series ISSN 2330-8516. Princeton, NJ.
Flowers, L., Osterlind, S. J., Pascarella, E. T., & Pierson, C. T. (2001). How much do students learn in college? Cross-sectional estimates using the College BASE. Journal of Higher Education, 72, 565–583.
Hauck, A. J., & Rockwell, Q. T. (1997). Desirable characteristics of the professional constructor: The results of the Constructor Certification Skills and Knowledge Survey. International Journal of Construction Education, 2(1), 24–36.
MacDonald, R. R., &Sessoms E. C. (2012). Survey of undergraduate construction programs use of AC exam as an assessment tool. Retrieved from https://www.asee.org/papers-and-publications/papers/section-proceedings/northeast/2012
Sylvester, K. (2011). Using the constructor qualification examination to assess student learning. ASC Proceedings of the 47th Annual Associated Schools of Construction Conference, Omaha, NE.
Wigfield, A., & Eccles, J. S. (2000). Expectancy-value theory of achievement motivation. Contemporary Educational Psychology, 25, 68–81.

Spring 2018 | Volume 43 | Number 1
The American Institute of Constructors | 19 Mantua Road | Mount Royal, NJ 08061 | Tel: 703.683.4999 | www.professionalconstructor.org— Page 30 —
A Case Study of Visualizing Building Renovation with Laser Scanning and Mixed Reality
Yilei Huang, Ph.D., Sout Dakota State University | [email protected]
ABSTRACTWhile Building Information Modeling (BIM) has been increasingly applied in the architecture, engineering, and construction (AEC) industry, its benefits have not been fully achieved in the building renovation sector due to the unavailability of BIM models for many existing buildings. This paper presents a case study of utilizing BIM to visualize building renovation with laser scanning and mixed reality technologies. Laser scanning was first employed to capture the area to be renovated in an existing building, and a BIM model of the renovation area was created based on the captured point clouds. Renovation designs were then modeled to meet the physical constraints and match the existing environment. Finally, completed renovation design models were displayed through a mixed reality headset and building users were able to observe the renovation designs in the physical renovation area at 1:1 scale. This approach allows building users to make quick and accurate decisions on renovation designs by visually comparing the renovation models in the existing environment. This case study provides an example of how BIM was applied in building renovation to maximize design efficiency.
Keywords: Building Information Modeling, Visualization, Building Renovation, Laser Scanning, Mixed Reality
Dr. Yilei Huang is an Assistant Professor in the Department of Construction and Operations Management at South Dakota State University. His research interests include the applications of building information modeling, laser scanning, virtual reality, and mixed reality in construction management.

Spring 2018 | Volume 43 | Number 1
The American Institute of Constructors | 19 Mantua Road | Mount Royal, NJ 08061 | Tel: 703.683.4999 | www.professionalconstructor.org— Page 31 —
A Case Study of Visualizing Building Renovation with Laser Scanning and Mixed Reality
then modeled to meet the physical constraints and match the existing environment. Finally, completed renovation design models were displayed through a mixed reality headset and building users were able to observe the renovation designs in the physical renovation area at 1:1 scale. This approach allows building users to make quick and accurate decisions on renovation designs by visually comparing the renovation models in the existing environment. This case study provides an example of how BIM was applied in building renovation to maximize design efficiency.
BACKGROUNDBIM in Building Renovation
Building renovation is a large portion of the overall building construction market, and the renovation sector continues to grow as more existing buildings age (Cattano et al. 2013). Despite the numerous advantages of BIM, BIM implementation and research have mainly focused on new construction, and the majority of existing buildings are not maintained or renovated with BIM yet (Volk et al. 2014). The major challenges of BIM implementation in existing buildings included: 1) no associated BIM models (Grussing and Liu 2014), 2) high modeling and conversion efforts from captured building data into BIM objects (Volk et al. 2014), and 3) outdated or inaccurate BIM models due to previous maintenance and renovations (Wang et al. 2015).
The preparation of an as-is BIM model of existing buildings is usually a time-consuming, labor-intensive, and costly process (Wang et al. 2015). Recapturing the information of existing buildings into a BIM model is mainly a manual reverse engineering process. A BIM model can be developed by tracing back the spatial location of each building component found in the 2D drawing set. A more commonly used practice is the points-to-BIM or scan-to-BIM approach with the help of a laser scanner (Volk et al. 2014). Once a BIM model has been created for the existing building, the model
INTRODUCTIONBuilding Information Modeling (BIM) is a process of generating and managing the digital representation of a building throughout its life-cycle. During the past decade, BIM has been developing quickly in the architecture, construction, and engineering (AEC) industry due to its numerous advantages. Compared with the traditional 2D building design process, BIM not only contains 3D spatial information, but also includes time as 4D and cost as 5D, as well as other functional characteristics for further analysis in digital format (Yang and Kang 2014). The benefits of BIM have also been widely recognized as reduced project costs, fewer design errors, improved construction coordination, and enhanced visualization and simulation, etc. (Wang et al. 2013).
With such advantages to construction projects, the use of BIM is no longer an optional value-added feature, but rather a soon-to-be standard in the AEC industry (Zhao et al. 2015). The McGraw-Hill SmartMarket Reports showed that according to the survey results of 582 stakeholders, BIM was adopted by 71% of AEC firms in North America in 2012, a 75% surge over five years (McGraw-Hill Construction 2012; Zhao et al. 2015), and 86% of them had been using BIM for more than three years by 2013 (McGraw-Hill Construction 2014). In sectors like mechanical, electrical, and plumbing (MEP) coordination, the adoption is projected to be 100% within the next few years (Dossick et al. 2014).
Although BIM has been increasingly applied in the AEC industry, its benefits have not been fully achieved in the building renovation sector for various reasons, for example, the unavailability of BIM models for many existing buildings. This paper presents a case study of utilizing BIM to visualize building renovation with laser scanning and mixed reality technologies. In this project, laser scanning was first employed to capture the area to be renovated in an existing building, and a BIM model of the renovation area was created based on the captured point clouds. Renovation designs were

Spring 2018 | Volume 43 | Number 1
The American Institute of Constructors | 19 Mantua Road | Mount Royal, NJ 08061 | Tel: 703.683.4999 | www.professionalconstructor.org— Page 32 —
A Case Study of Visualizing Building Renovation with Laser Scanning and Mixed Reality
can be used for its later life cycle stages, such as operations, maintenance, and renovation (Grussing and Liu 2014).
Laser Scanning
Laser scanning has been used more often in recent years to recapture the digital information of existing buildings because of its automated process. A laser scanner first transmits laser beams in all directions and record the spatial positions of every point in the existing building that a laser beam meets. The collection of all the points is referred as a point cloud and represents the shape of the existing building. The laser scanner then takes photos in all directions and match the colors of the existing building to the point cloud. A large scanning area requires the combination of several point clouds recorded at different locations in an existing building by registering individual targets, usually checker markers or spheres placed in the scanned area.
Laser scanner software is able to process and combine the point clouds, for example, FARO Scene, Trimble RealWorks, and Leica Cyclone. Other software is available for further point cloud processing and editing, such as Autodesk ReCap Pro. Once the point cloud is finalized, a BIM model can be developed by either manually tracing the building components or with the assistance of automated scan-to-BIM software, such as IMAGINiT Scan to BIM, ClearEdge3D EdgeWise, and FARO PointSense. These software programs are able to recognize the point clouds of building components and automatically place matching building components with minimal manual adjustment needed.
Mixed Reality
The use of BIM on construction sites has been quite limited (Meža et al. 2014). One of the primary reasons is that fully utilizing BIM usually requires a workstation computer and a mouse to navigate the model, which is not always practical in the site environment (Yang and Kang 2014). The uses of mobile devices for BIM have also been very limited due to their small display and low performance. As
a result, building end-users are often not able to be effectively involved in the design stage and visualize the final product, which has been identified as a major issue in current building design approaches (Heydarian et al. 2015).
Mixed reality is an emerging technology capable of overlaying digital contents onto physical objects through a head-mounted display. A mixed reality headset allows its user to see and manipulate BIM models right in the site environment by using embedded sensors to identify user hand gestures as well as the physical surroundings. Microsoft HoloLens, DAQRI Smart Helmet and Smart Glasses, and Meta 2 are the only available mixed reality headsets as of mid-2017. While Meta 2 requires cable connections to a computer, HoloLens and DAQRI devices are both standalone computers running Windows 10-based Mixed Reality platform and Linux-based Visual Operating System, respectively, and use Wi-Fi connection to receive data from the Internet. Available BIM software for mixed reality include Microsoft 3D Viewer Beta and Trimble SketchUp Viewer for HoloLens and Autodesk BIM 360 for Smart Helmet, all of which are capable of overlaying design models onto the construction site at 1:1 scale and thus allow its user to visualize the final product on-site.
THE CASE STUDY: VISUALIZATION OF BUILDING RENOVATIONEnvironment Capture
The building renovation project in this study was to install two storefront walls to enclose an open hallway in a building as a fishbowl room. A partition wall on top of the glass panels in each storefront wall was also to be installed for the renovation since it was an open ceiling area with overhead piping. The existing site environment is shown in Figure 1. The partition walls had however already been installed when this picture was taken.

Spring 2018 | Volume 43 | Number 1
The American Institute of Constructors | 19 Mantua Road | Mount Royal, NJ 08061 | Tel: 703.683.4999 | www.professionalconstructor.org— Page 33 —
A Case Study of Visualizing Building Renovation with Laser Scanning and Mixed Reality
A FARO Focus3D S120 was used to scan the existing site environment. To ensure that the scan was complete with the most points captured within the fishbowl room, three scans were performed at each storefront wall location as well as the center of the room, as indicated in Figure 2 a), b), and c). Sphere targets were used to establish connections between each two adjacent scans, and the three scans were
combined with FARO Scene by automatic target registration, as displayed in Figure 2 d).
Model Development
The combined scan was next edited with Autodesk ReCap Pro to remove unneeded points in the combined raw scan, including other rooms captured outside of the fishbowl room and any objects
Figure 1. Existing site environment and storefront walls to be installed.
a) Laser scanner location 1 b) Laser scanner location 2
c) Laser scanner location 3 d) Combined scan of the renovation areaFigure 2: Laser scans of the existing site environment.

Spring 2018 | Volume 43 | Number 1
The American Institute of Constructors | 19 Mantua Road | Mount Royal, NJ 08061 | Tel: 703.683.4999 | www.professionalconstructor.org— Page 34 —
A Case Study of Visualizing Building Renovation with Laser Scanning and Mixed Reality
captured within the fishbowl room. Figure 3 a) shows an exterior view of the fishbowl room with all other adjacent rooms removed. Figure 3 b) shows an interior view of the fishbowl room where the points of all interior objects had been removed. The existing columns, windows, beams, joists, and overhead piping can be also observed in the interior view.
The edited point cloud was then imported to Autodesk Revit to develop a BIM model of the existing site environment. Since the renovation project was to install two storefront walls, existing walls, windows, beams, and columns were required to be modeled in order to identify the positions of the new walls, and joists and overhead piping were not needed in the BIM model. Due to the relatively small amount of modeling, no automated scan-to-BIM software was used and all modeling was done by manually tracing the point clouds of existing
building components. Figure 4 a) displays the BIM model created from point cloud with existing walls, windows, beams, and columns. Figure 4 b) shows the BIM model of the new storefront walls created based on the positions of existing building components, including glass panels, a glass door, and a partition wall above the storefront wall on both sides of the fishbowl room. After turning off the point cloud, the BIM model of the final renovation design of the fishbowl room is presented in Figure 5.
Model Visualization
Microsoft HoloLens was used for model visualization through mixed reality, and 3D Viewer Beta was the only available BIM software for HoloLens at the time this project was carried out. The completed BIM model of the fishbowl room, a Revit file, had to be opened with Autodesk Navisworks and exported as an fbx file to be usable with 3D Viewer Beta. A
a) Exterior view b) Interior viewFigure 3. Edited scan of the fishbowl room.
a) BIM model of existing building components created from point cloud
b) BIM model of new storefront walls created based on existing building components
Figure 4. Development of BIM model of the fishbowl room from point cloud.

Spring 2018 | Volume 43 | Number 1
The American Institute of Constructors | 19 Mantua Road | Mount Royal, NJ 08061 | Tel: 703.683.4999 | www.professionalconstructor.org— Page 35 —
A Case Study of Visualizing Building Renovation with Laser Scanning and Mixed Reality
direct exporting to fbx from Revit would cause the model to lose all colors in 3D Viewer Beta. The fbx file was then uploaded to Microsoft OneDrive to be able to access from HoloLens.
3D Viewer Beta first displayed the BIM model at a miniature scale, and allowed the user to move, rotate, scale the model, as well as anchor it to a physical horizontal surface, such as a floor or table, with hand gestures. Figure 6 a) shows the completed BIM model of the fishbowl room observed through HoloLens at a miniature scale placed on a table. The picture was a snapshot within a video clip recorded directly by HoloLens as taking photos with HoloLens was not as convenient as recording videos. The miniature BIM model was then moved to the renovation site
and scaled to its true size. 3D Viewer Beta did not provide direct scaling ratios, therefore the user had to either use the scaling slider to visually find the right size of the model on-site, or calculate a scaling number for a 1:1 scale. The scaling number in 3D Viewer Beta appeared to be the overall model height in centimeters, which resulted a conversion factor of 2.54 for a Revit model with an imperial unit of foot and inch. SketchUp Viewer offers direct scaling at different ratios including 1:1, which makes the scaling process much more convenient than 3D Viewer Beta.
Once the BIM model was scaled at its true size, rotation and fine movement were needed to ensure that the direction and position of the model exactly matched the physical renovation site. Since rotation and movement were performed by hand gestures, it was rather difficult to precisely place the model at where it should exactly be. Figure 6 b) illustrated the fine movement process by matching a wall corner of the BIM model to the physical wall corner on-site.
After the BIM model was placed to match the existing site environment, a final visual inspection was performed to ensure the accuracy of the model by checking other building components. Figure 7 demonstrates the visual inspection between the BIM model and the physical objects on-site, and it was observed that the sizes and positions of columns and windows of the BIM model matched closely to the physical building components. Once placing the BIM model was finalized, the model remained the
Figure 5. BIM model of the final renovation design of the fishbowl room.
a) BIM model observed in mixed reality at a miniature scale on a table
b) Matching a wall corner in mixed reality to the physical wall corner with hand gestures
Figure 6. BIM model observed in mixed reality.

Spring 2018 | Volume 43 | Number 1
The American Institute of Constructors | 19 Mantua Road | Mount Royal, NJ 08061 | Tel: 703.683.4999 | www.professionalconstructor.org— Page 36 —
A Case Study of Visualizing Building Renovation with Laser Scanning and Mixed Reality
same place on-site, and the user was able to observe it from various perspectives based on the standing position. The building user was now able to evaluate the renovation design of the two storefront walls by either walking through both virtual doors observed in mixed reality, examining the connections between the storefront walls and existing columns and walls, or viewing the renovation design from a distance to evaluate the use of the space.
Figure 7. Visual inspection of columns and windows between BIM model and physical
objects.
Figure 8. Final product of the storefront wall of the fishbowl room.
By visually comparing the renovation BIM models created from point clouds in the existing site environment, building users are able to make quick and accurate decisions on whether to proceed with the current design. Design issues are able to be easily identified during the visual comparison with mixed reality, such as glass panels being too wide for the
space, overhead piping going through glass panels, inappropriate door positions, etc. Since the current renovation design was considered appropriate for the fishbowl room in this project, installation proceeded and Figure 8 shows the final product of the storefront wall of the fishbowl room, which appeared to be identical to the BIM model observed in mixed reality in Figure 7.
DISCUSSIONAlthough effective in allowing quick and accurate decision making, several challenges were identified to lower its efficiency with either HoloLens or 3D Viewer Beta during this project.
1) Although not officially released, the field of view of HoloLens is believed to be about 32 degrees horizontally by 17 degrees vertically, compared to the horizontal field of view of 114 degrees for human binocular vision. The relatively small field of view results in partial views of a BIM model when the user observes it at a close distance. The user is able to observe the BIM model only in a small box area about one third of the sight horizontally, and the BIM model outside that box area is not visible. The user has to either move or turn to let the rest of the BIM model fall into that box to be able to see it. This shortcoming of HoloLens lowers user experience to some degree.
2) As mentioned above, 3D Viewer Beta does not provide direct scaling ratios for BIM models, such as 1:1 or 1:10 scales. The user usually has to use the scaling slider to visually find the right size of the model on-site, which limits the accuracy of placing the model. The scaling slider comes with a number, which appears to be the overall model height in centimeters. Therefore, instead of adjusting the scaling slider manually, the model height in centimeters at different scaling ratios can also be calculated first and then adjusted in 3D Viewer Beta. SketchUp Viewer offers

Spring 2018 | Volume 43 | Number 1
The American Institute of Constructors | 19 Mantua Road | Mount Royal, NJ 08061 | Tel: 703.683.4999 | www.professionalconstructor.org— Page 37 —
A Case Study of Visualizing Building Renovation with Laser Scanning and Mixed Reality
new technology by developing or integrating their products in the mixed reality platform, including Autodesk BIM 360 for Smart Helmet, and Trimble SketchUp Viewer and Procore RFI Prototype for HoloLens.
Microsoft HoloLens has received more attention from AEC firms than the other mixed reality devices at the current time, and it is likely because HoloLens is a Windows-based standalone computer running the Mixed Reality platform. Existing construction software can therefore be migrated into the platform without a complete reengineering process, such as the above mentioned Trimble and Procore products. Trimble SketchUp Viewer is a commercial mixed reality program for HoloLens priced at $1,500 per license, comparable to the free-licensed Microsoft 3D Viewer Beta used in this case study, and provides more advanced features specifically for construction applications. Advanced features of SketchUp Viewer include direct model importing from SketchUp Pro, saved models, direct scaling, distance measurement, layers information, immersive mode, elevator to selected floors, and multiple user collaboration. The collaboration feature is particularly valuable for a project team in that it allows everyone to review and examine a design model at the same time and place. As demonstrated in Figure 9, the project team is able to see each other’s focus point on the model, and it therefore ensures better communication when the entire project team is discussing about a virtual model that cannot be pointed at.
The workflow of laser scanning plus mixed reality is recommended for building renovation projects where a current BIM model of the building is not readily available to use. Automated scan-to-BIM software is recommended if the renovation area is beyond several rooms, overhead piping needs to be modeled, or time is concerned when creating a BIM model from the scan manually. The BIM model does not have to show all existing building components, but does need to be developed to include certain key components such as walls, columns, windows, and doors, for location references when visualizing the model on-site, so that the renovation components will be tied into the physical environment. For renovation
direct scaling at different ratios including 1:1, which makes the scaling process much more convenient than 3D Viewer Beta.
3) While HoloLens is able to map the existing site environment, it is not able to automatically match a BIM model to the environment. The manual process of placing the BIM model into a site is time-consuming and requires find adjustments of rotating and moving the model. Even so, it is still almost impossible to perfectly match a BIM model to an existing environment with only hand gestures. In addition, BIM models should not include a floor to allow the walls and columns in the BIM model to anchor on the physical floor.
RECOMMENDATIONSLaser scanners have become an increasingly important asset to AEC firms in recent years due to their superior ability in capturing the digital information of existing structures. Popular laser scanners for such uses include the FARO Focus series, Leica ScanStation series, and Trimble TX series products, with the price range starting from $30,000 up to over $100,000.
While laser scanning is no longer a new technology, mixed reality has just opened its door to the AEC industry in 2017. Meta 2, as a computer-depended headset, costs $1,500. Microsoft HoloLens starts at $3,000 for the development edition and goes up to $5,000 for a commercial suite. DAQRI Smart Glasses starts at $5,000 and DAQRI Smart Helmet costs as much as $15,000. Although emerging and still at a high cost, AEC firms around the world have already started to try this new technology out in their construction projects. Mortenson Construction has experimented with the DAQRI Smart Helmet, and Interstates Construction in Iowa, Gilbane Building Company in Rhode Island, and NCC Construction and EDR Medeso in Sweden have applied HoloLens in their projects. In addition, construction software companies have also been highly involved in the

Spring 2018 | Volume 43 | Number 1
The American Institute of Constructors | 19 Mantua Road | Mount Royal, NJ 08061 | Tel: 703.683.4999 | www.professionalconstructor.org— Page 38 —
A Case Study of Visualizing Building Renovation with Laser Scanning and Mixed Reality
projects not involving building components such as replacing or relocating furniture, laser scanning will not be needed since the BIM models of furniture can be placed freely and visualized directly in the physical environment without being attached to existing building components. In either case, Trimble SketchUp Viewer with Microsoft HoloLens is recommended for an enhanced and collaborative visualization experience in mixed reality.
CONCLUSIONSAlthough BIM has been increasingly applied in the AEC industry, its benefits have not been fully achieved in the building renovation sector for various reasons, for example, the unavailability of BIM models for many existing buildings. This paper presents a case study of utilizing BIM to
visualize building renovation with laser scanning and mixed reality technologies. In this project, laser scanning was first employed to capture the area to be renovated in an existing building, and a BIM model of the renovation area was created based on the captured point clouds. Renovation designs were then modeled to meet the physical constraints and match the existing environment. Finally, completed renovation design models were displayed through a mixed reality headset and building users were able to observe the renovation designs in the physical renovation area at 1:1 scale. This approach allows building users to make quick and accurate decisions on renovation designs by visually comparing the renovation models in the existing environment. This case study provides an example of how BIM was applied in building renovation to maximize design efficiency.
Figure 9. Project team collaboration through SketchUp Viewer using HoloLens.

Spring 2018 | Volume 43 | Number 1
The American Institute of Constructors | 19 Mantua Road | Mount Royal, NJ 08061 | Tel: 703.683.4999 | www.professionalconstructor.org— Page 39 —
A Case Study of Visualizing Building Renovation with Laser Scanning and Mixed Reality
REFERENCESCattano, C., Valdes-Vasquez, R., Plumblee, J., II, and Klotz, L. (2013). Potential Solutions to Common Barriers Experienced during the Delivery of Building Renovations for Improved Energy Performance: Literature Review and Case Study. Journal of Architectural Engineering, 19, Special Issue: Emerging Trends of Sustainable Engineering, Design, and Construction, 164-167.
Dossick, C.S., Lee, N., and Foleyk, S. (2014). Building Information Modeling in Graduate Construction Engineering and Management Education. Proceedings of the 2014 International Conference on Computing in Civil and Building Engineering, Orlando, FL, June 23-25, 2014, pp 2176-2183.
Grussing, M. and Liu, L. (2014). Knowledge-Based Optimization of Building Maintenance, Repair, and Renovation Activities to Improve Facility Life Cycle Investments. Journal of Performance of Constructed Facilities, 28 (3), 539-548.
Heydarian, A., Carneiro, J.P., Gerber, D., Becerik-Gerber, B., Hayes, T., and Wood, W. (2015). Immersive Virtual Environments versus Physical Built Environments: A Benchmarking Study for Building Design and User-Built Environment Explorations. Automation in Construction, 54, 116-126.
McGraw-Hill Construction. (2012). The Business Value of BIM in North America: Multi-Year Trend Analysis and User Ratings (2007-2012). McGraw-Hill Construction, Bedford, MA.
McGraw-Hill Construction. (2014). The Business Value of BIM for Construction in Major Global Markets: How Contractors Around the World Are Driving Innovation With Building Information Modeling. McGraw-Hill Construction, Bedford, MA.
Meža, S., Turk, Ž., and Dolenc, M. (2014). Component Based Engineering of a Mobile BIM-Based Augmented Reality System. Automation in Construction, 42, 1-12.
Volk, R., Stengel, J., and Schultmann, F. (2014). Building Information Modeling (BIM) for Existing Buildings - Literature Review and Future Needs. Automation in Construction, 38, 109-127.
Wang, C., Cho, Y.K., and Kim, C. (2015). Automatic BIM Component Extraction from Point Clouds of Existing Buildings for Sustainability Applications. Automation in Construction, 56, 1-13.
Wang, X., Love, P.E.D., Kim, M.J., Park, C.S., Sing, C.P., and Hou, L. (2013). A Conceptual Framework for Integrating Building Information Modeling with Augmented Reality. Automation in Construction, 34, 37-44.
Yang, C. and Kang, S. (2014). BIM Navigation with Hand-Based Gesture Control on Sites. Proceedings of the 2014 International Conference on Computing in Civil and Building Engineering, Orlando, FL, June 23-25, 2014, 785-792.
Zhao, D., McCoy, A.P., Bulbul, T., Fiori, C., and Nikkhooa, P. (2015). Building Collaborative Construction Skills through BIM-integrated Learning Environment. International Journal of Construction Education and Research, 11(2), 97-120.

Towards an Assessment of SLO9: Working in a Multi-Disciplinary Team
Spring 2018 | Volume 43 | Number 1
— Page 40 —The American Institute of Constructors | 19 Mantua Road | Mount Royal, NJ 08061 | Tel: 703.683.4999 | www.professionalconstructor.org
Towards an Assessment of SLO9: Working in a Multi-Disciplinary Team
Ihab M. H. Saad, Northern Kentucky University | [email protected]
ABSTRACT
The American Council for Construction Education (ACCE) started the implementation of its new standards for accreditation focusing on measuring the student learning outcomes (SLOs) based on Bloom’s taxonomy of learning domains. Initial feedback from the visited programs reflects the fact that some of the measured outcomes are easier to exhibit than others. One of the SLOs that is less direct in its assessment is SLO number 9: “Apply construction management skills as an effective member of a multi-disciplinary team.” This paper aims at shedding some light on possible interpretations of this outcome, and different suggested opportunities at exhibiting the required level of achievement expected by ACCE visiting teams. The paper illustrates a case study displaying such efforts in a construction contracts class setting.
Key Words: ACCE, Accreditation, Multi-Disciplinary Teams, Student Learning Outcomes
Dr. Ihab Saad is a Professor and former Department Chair of Construction Management at the Haile/US Bank College of Business at Northern Kentucky University. He has over thirty years of experience in construction project engineering and management and an extensive teaching career in private and public universities.

Towards an Assessment of SLO9: Working in a Multi-Disciplinary Team
Spring 2018 | Volume 43 | Number 1
— Page 41 —The American Institute of Constructors | 19 Mantua Road | Mount Royal, NJ 08061 | Tel: 703.683.4999 | www.professionalconstructor.org
INTRODUCTION AND HISTORICAL BACKGROUND
The American Council for Construction Education (ACCE) represents the main accreditation body for construction management programs in the United States. Since 1974, it has been accrediting both baccalaureate, associate, and master’s degree programs. Currently, 73 baccalaureate programs are accredited in the United States, as well as 13 associate degree programs and 5 master’s programs (ACCE, 2017). The accredited programs are housed, within their respective institutions, in different colleges ranging from colleges of engineering, technology, architecture, business, agriculture, professional studies, natural resources, etc.
In the fall of 2016 ACCE started the compulsory implementation of its newly formulated and approved accreditation standards. These standards have been in the works for several years prior to the first implementation, and a few programs elected to undergo accreditation under the new standards on a voluntary basis starting spring 2016. The new standards represent a major shift from the older prescriptive version that focused on curriculum topical content (CTC) and counting the number of hours dedicated to different courses/topics.
The new standards, following other accreditation norms and responding to public demands calling for more accountability, focus on learning outcomes achieved through the academic curriculum as evidenced by displays of student work gauging the students’ learning. Following an extensive and iterative effort of consultation with different stakeholders conducted through a series of workshops and listening to different focus groups, ACCE settled on a list of 20 learning outcomes for baccalaureate programs, and 13 outcomes for associate degree programs. The learning outcomes followed a breakdown based on the Bloom’s taxonomy of learning domains (1956). For baccalaureate programs, the student learning outcomes (SLOs) were ranked from highest to lowest according to four different levels of mastery: Create [5], Analyze [3], Apply [3], and Understand [9], whereas the associate degree’s 13 SLOs included Demonstrate (equivalent to Apply) [7] and Discuss (equivalent to Understand) [6].
The final list of the 20 learning outcomes for baccalaureate programs is shown hereunder:
1. Create written communications appropriate to the construction discipline.
2. Create oral presentations appropriate to the construction discipline.
3. Create a construction project safety plan. 4. Create construction project cost estimates. 5. Create construction project schedules. 6. Analyze professional decisions based on
ethical principles. 7. Analyze construction documents for
planning and management of construction processes.
8. Analyze methods, materials, and equipment used to construct projects.
9. Apply construction management skills as a member of a multidisciplinary team.
10. Apply electronic-based technology to manage the construction process.
11. Apply basic surveying techniques for construction layout and control.
12. Understand different methods of project delivery and the roles and responsibilities of all constituencies involved in the design and construction process.
13. Understand construction risk management. 14. Understand construction accounting and
cost control. 15. Understand construction quality assurance
and control. 16. Understand construction project control
processes. 17. Understand the legal implications of
contract, common, and regulatory law to manage a construction project.
18. Understand the basic principles of sustainable construction.
19. Understand the basic principles of structural behavior.
20. Understand the basic principles of mechanical, electrical and piping systems.
Some of the learning outcomes are relatively direct and easily measured, particularly at the highest level; Create, which includes deliverables such as a construction project safety plan, construction project cost estimates, and construction project schedules (SLOs 3, 4, and 5 respectively). On the other hand, some of the outcomes are not as directly or easily measured, and are not necessarily represented by one

Towards an Assessment of SLO9: Working in a Multi-Disciplinary Team
Spring 2018 | Volume 43 | Number 1
— Page 42 —The American Institute of Constructors | 19 Mantua Road | Mount Royal, NJ 08061 | Tel: 703.683.4999 | www.professionalconstructor.org
clear evidence or deliverable such as the previous examples. Among this second group of outcomes is SLO number 9 “Apply Construction Management Skills as a Member of a Multi-disciplinary Team”. From preliminary anecdotal reporting, some of the programs visited during the fall semester of 2016 and the spring semester of 2017 faced some difficulties documenting this particular learning outcome, resulting in noted weaknesses or areas of concern. This paper, coming from one of the visited institutions, presents the efforts of that institution to provide documentation for the satisfactory achievement of this learning outcome. The narrative presented hereafter addresses this effort starting with the identification of the underlying conceptual knowledge to be provided to the students. The process thereafter built upon this knowledge in order to achieve the proper understanding of the value of teamwork, and enabling the students to work effectively as members of a multi-disciplinary project team.
UNDERLYING CONCEPTUAL KNOWLEDGE
For a student to be able to apply construction management skills as a member of a multi-disciplinary team, some conceptual knowledge has to be provided. Elements of this knowledge include, but are not limited to:
1- Types of construction projects (Residential, commercial, heavy civil, etc.)
2- Project management functions (Estimating, scheduling, contract administration, etc.)
3- Project phases (Planning, design, procurement, execution, commissioning, etc.)
4- Project management stakeholders (Owners, designers, contractors, subcontractors, regulators, financiers, etc.)
5- Project management team (Client, A/E, GC, CM, etc.)
6- Types of construction contracts (Lump sum, unit price, cost +, etc.)
7- Project delivery methods (Design-bid-build, design build, integrated project delivery, etc.)
8- Skills and competencies necessary for a construction manager (management skills, communication skills, technical skills, etc.)
9- Regulatory project environment (contract law, types of organizations, etc.)
This pre-requisite knowledge can be addressed at different levels (Introduce, Reinforce, and Assess) in different classes through the active Bloom’s verbs as illustrated in Figure 1. A sample of the distribution of these topics and their allocation to different classes within the curriculum is illustrated in Table 1 below.
A topic may be introduced for the first time in one class, reinforced later in one or more classes, and finally assessed, both directly and indirectly in one or more classes. This assessment is concluded with the capstone class and the independent Associate in Construction national exam provided twice a year by the American Institute of Constructors (AIC). From AIC provided literature and test results, it appears that updates of the AIC exam are aiming at mapping the exam, as much as possible, to match the ACCE 20 learning outcomes, thus making it a valid source of independent and indirect assessment.
Case Study 1: Role playing and the ethics case study
One of the author’s attempts to assess SLO 9 was the introduction of a case study developed by the AGC education foundation, dealing with ethics in construction contracting and construction management. The case study follows a public construction project along its different project development phases. It gives a detailed narrative of the decisions made by different project parties involved in these phases, asking the students to identify any unethical behavior, and requiring them to suggest an alternative course of action. The case study was assigned to a construction contracts class of 36 students offered in the first semester of their junior year, and teams of 3 students were formed. Each team included a member representing the owner, another member representing the Architect/Engineer, and the third team member representing the Contractor (including the General Contractor, subcontractors and the Construction Manager).
Following the narrative of each phase, a series of questions were asked, and each team member was required to provide his/her own individual answers, evaluation, and assessment of the decisions made therein based on the role they were playing and the interests of the parties they were representing. Following the first individual submittal, where the

Towards an Assessment of SLO9: Working in a Multi-Disciplinary Team
Spring 2018 | Volume 43 | Number 1
— Page 43 —The American Institute of Constructors | 19 Mantua Road | Mount Royal, NJ 08061 | Tel: 703.683.4999 | www.professionalconstructor.org
Figure 1: Contributing pre-requisite knowledge
Table 1: Allocation of different topics to curriculum classes.

Towards an Assessment of SLO9: Working in a Multi-Disciplinary Team
Spring 2018 | Volume 43 | Number 1
— Page 44 —The American Institute of Constructors | 19 Mantua Road | Mount Royal, NJ 08061 | Tel: 703.683.4999 | www.professionalconstructor.org
team members were to work independently, a second round of evaluation was performed, answering the same questions, but allowing for the team to discuss and negotiate their answers and come, as much as possible, with a consensus decision on each ethical situation / dilemma. As opinions and analysis results changed, team members were required to highlight the thought process and the reasons decisions were changed based on the discussions among the role-playing team members. A rubric for the evaluation and grading of the case study included the individual assessment (round one) and the team assessment (round two). This rubric is shown in Table 2 hereunder.
The learning outcomes for this exercise were described as follows:
1- Identify different project stakeholders and the impact of their decisions on the project outcomes.
2- Recognize ethical behavior and develop
awareness of compromising situations leading to unethical decisions.
3- Implement a proper communications strategy leading to better sharing of information which will result in better decision-making.
4- Analyze substantive issues while eliminating unimportant bits of information, and craft recommended solutions based on the provided facts related to the delineated scenarios in the case study.
5- Recognize that many issues that are considered to be unethical are perceived by the construction industry to be acceptable practice. It is important for someone joining the construction workforce to recognize these inconsistencies as he/she matriculates through their professional career.
Upon the completion of the case study, the team members highlighted the importance of role playing and
Grading Element4 3 2 1
Project party represented and his/her role in the project development cycle
Clearly and completely identified the project party represented and a full listing of his/her role in the project development cycle according to the provided information.
Identified the project party represented with limited definition of his/her role in the project development cycle according to the provided information.
Identified the project party represented with no definition of his/her role in the project development cycle according to the provided information
Failed to identify the project party represented and his / her role in the project development cycle according to the rovided information
Key ethical questions/dilemmas in the project phase under consideration
Provided a complete listing of the key ethical questions / dilemmas for the project phase
Provided a partial listing of the key ethical questions / dilemmas for the project phase
Missed many of the key ethical questions / dilemmas for the project phase
Failed to identify the key ethical questions / dilemmas for the project phase
Unethical Behavior and the Party (ies) involved
Identified the unethical behavior and the party (ies) involved with a clear and complete explanation of why is that behavior unethical
Identified the unethical behavior and the party (ies) involved with an incomplete explanation of why is that behavior unethical
Identified the unethical behavior and the party(ies) involved with no explanation of why is that behavior unethical
Failed to identify the unethical behavior and / or the party(ies) involved
Proper ethical behavior / corrective action and methods of enforcing it
Clearly and completely identified the proper ethical bhavior / corrective actions and methods of enforcing it
Partially identified the proper ethical behavior /corrective action and methods of enforcing it
Partially identified the proper ethical behavior / corrective action without the methods of enforcing it
Failed to identify the proper ethical behavior / corrective action or the methods of enforcing it
GradeConstruction Ethics Case study Grading Rubric
Table 2: Grading Rubric for the Ethics Case Study

Towards an Assessment of SLO9: Working in a Multi-Disciplinary Team
Spring 2018 | Volume 43 | Number 1
— Page 45 —The American Institute of Constructors | 19 Mantua Road | Mount Royal, NJ 08061 | Tel: 703.683.4999 | www.professionalconstructor.org
addressing the discussed issues from different project team members’ perspectives. They emphasized the importance of the timely communication among real project team members. Having taught the same class in the past without this role-playing exercise, the author could see the qualitative difference of class discussions, and gauge a better performance of the students enrolled in this class. This heightened understanding was retained and manifested through their capstone project quality improvement.
Case Study 2: Contract Analysis
Within the framework of the same class, student teams were asked to alternate their roles, and to compare and analyze two different forms of contracts (the AIA A201 and the ConsensusDocs 300 series). These two forms were selected to represent a standard form of agreement for a traditional design-bid-build project versus a project performed through Integrated Project Delivery (IPD). Each team was required to produce and present a PowerPoint presentation with a comparison and analysis of the two forms of contracts highlighting their similarities and differences along the following points:
1- Duties and responsibilities of different project parties (to include at least the Owner, A/E or CM, and GC)2- Role of the AE (for example: adjudicating disputes, reviewing shop drawings, evaluating payments, etc.)3- Notices (anything related to notifying the other parties including the type of notice and any time limits for filing it)4- Claims process5- Payment procedures6- Delays7- Dispute resolution8- Scheduling requirements9- Substantial completion10- Suspension of works11- Contract termination12- Liquidated damages
Each team member represented one of the main contract parties (Owner, A/E, and GC), and compared and contrasted the two types of contracts
based on the general scope of the contract, and particularly on the abovementioned 12 points. Each team was required to comment collectively on the comparison highlighting the advantages and disadvantages of the use of each type. A rubric was designed to assess and evaluate both team and individual student performances, emphasizing the comprehensive coverage of the listed points and the ability to distinguish between transactional and relational contracts. As an added bonus, both case studies (Ethics and contract comparison) contained elements to assess SLOs 1 and 2 dealing with written and verbal communication.
Other Opportunities to Document SLO 9
Capstone project
The capstone course is taken by all the students in the program in the second semester of their senior year. Student teams are formed to tackle a comprehensive construction management problem in the form of developing a response to a request for proposals (RFP) soliciting services for construction management of a commercial project. Student teams of 4 were formed with limited or no interference from the course instructor, and students were expected to meet interim deadlines in the development of their proposal, ending with the final presentation of the complete proposal. This proposal has to include, as a minimum, the following:
- A detailed electronic cost estimate
- A detailed electronic schedule
- A project-specific safety plan
- A risk management plan
- A project quality plan
Additional elements can include a sustainability plan, value engineering change proposals (VECP), a site utilization and construction phasing plan, etc.
All of these elements are primary assessment tools for many SLOs, and the project proposal and its presentation serve as assessments of SLOs 1 and 2 in particular. Student roles are identified at the beginning of the semester, and their contribution is documented, while timely feedback is provided along the semester to the interim submittals reflecting

Towards an Assessment of SLO9: Working in a Multi-Disciplinary Team
Spring 2018 | Volume 43 | Number 1
— Page 46 —The American Institute of Constructors | 19 Mantua Road | Mount Royal, NJ 08061 | Tel: 703.683.4999 | www.professionalconstructor.org
gradual progress.
Chinowski et al. (2006) concluded that the acquired skills through project-based courses are reflected through better student understanding and retention of the discussed subjects in class, and correlate to better performance upon graduation. Auchey et al. (2000) advocated for horizontal and vertical integration of construction concepts through a learning outcome template (LOT) in the capstone course.
Internships, Community Outreach, and Service Learning
Through a requirement to document at least 600 working hours prior to graduation, students participate in employment opportunities provided through paid internships and co-ops. Students have the opportunity to either work for a construction-related employer or in a community outreach program performing community service on construction oriented projects as service learning. Students interact with different stakeholders in the construction process, allowing them to be exposed to different members of a construction team. A survey of the job and the student’s responsibilities are approved by the parties involved including the student, the academic supervisor, and the job supervisor. Achievement goals are identified prior to the start of the internship or co-op, and assessed upon its completion. An evaluation of the student’s strengths and areas of improvement is also performed and documented. An online survey is sent to the employers upon the completion of the internship requesting feedback on the suggested areas of improvement in the construction curriculum, if any, based on their observation of the student performance. As documented by Astin et al. (2000), service learning projects increase students’ interest in the subject matter and both their communication and leadership skills.
Scholastic Competitions
The program had additional opportunities to document student achievements related to SLO 9 through different venues including but not limited to scholastic student competitions.
Among these student competitions is the National Association of Home Builders (NAHB) student competition that takes place every year as part of the NAHB national exhibition. Historically,
student teams had to compete at two different levels: Baccalaureate and Associate. Each team consists of five members and an alternate member. The competition information (the problem) was disseminated in the fall semester, allowing for the student team to work on a solution including a project schedule, an estimate, a marketing plan, and a financing plan. Each team utilized the NAHB supplied documents to prepare a comprehensive proposal that the team had to present to a panel of judges during the NAHB show at the beginning of the spring semester. Recently, the focus of the competition has shifted to emphasize the business aspects of home building rather than the focus on the technical aspects. This focus change had necessitated seeking assistance from subject matter experts represented by members on the team from departments or disciplines other than construction management. The team added a student member from the marketing department to assist with the marketing plan, and a student member from the finance department to assist with detailed financial analysis, mimicking large home builders where such multi-disciplinary teams are formed including both technical and business skills. This hybrid team formation, advocated by McDonald et al (2013) and described as an IPD approach to construction education, was facilitated by the fact that the construction management program was located in the college of Business, providing the required space for student deliberations and enabling smoother communication. Feedback from the participating team focused on the added value to all team members through this multi-disciplinary exposure, and emphasized the positive aspects of addressing the problem from different angles that might not have been covered by a team of construction management students alone.
Similar efforts can be duplicated through other student competitions such as the Design Build Institute of America (DBIA) or the Associated Schools of Construction (ASC) regional and national competitions covering the design-build delivery system, and allowing for students from different disciplines such as architecture, architectural engineering, civil engineering, construction engineering, and construction management to collaborate on a design build proposal. The existence of such programs under the same college, and sometimes under the same department, facilitates the

Towards an Assessment of SLO9: Working in a Multi-Disciplinary Team
Spring 2018 | Volume 43 | Number 1
— Page 47 —The American Institute of Constructors | 19 Mantua Road | Mount Royal, NJ 08061 | Tel: 703.683.4999 | www.professionalconstructor.org
scheduling coordination, faculty course loads, and credit transfer among different programs. However, one caveat that has to be taken into consideration when using data from scholastic competitions is that this performance data can only be used as secondary, or supporting evidence, since not all students in a program participate in such competitions, and that usually self-motivated and high-performing students are usually members of such teams.
Conclusion
In its first cycle of implementation, the new ACCE standards, focusing on student learning outcomes rather than curriculum topical content, are facing wide acceptance in the construction education environment. While some outcomes are relatively direct to document and assess, others prove more
complicated and indirect. This paper aimed at providing several complementary venues assisting in measuring, documenting, and assessing one outcome of the latter group. While the current set of outcomes is considered version 1.0 of the new standards, it is expected that the feedback from visited programs in the next few years may help provide more clarity and some standardization in the understanding of the 20 learning outcomes used for baccalaureate programs. This feedback may result in future updates and versions of the standards. Collaboration and multi-disciplinary student teams and practices are a step in the right direction, preparing the students, through role playing and hybrid teams, to interact successfully and productively with other team members in the construction industry.
References
American Council for Construction Education ACCE (2017), http://www.acce-hq.org
Bloom, B., Englehart, M., Furst, E., Hill, W., Krathwohl, D. (1956). “The Taxonomy of Educational Objectives”, The Classification of Educational Goals, Handbook I: Cognitive Domain, David McKay Company, New York, NY.
American Council for Construction Education ACCE (2016). “Document 103, Standards and Criteria for Accreditation of Postsecondary Construction Education Degree Programs”.
Astin, A., Vogelgesang, L., Ikeda, E, and Yee, J. (2000). “How Service Learning Affects Students”. Higher Education, Paper 144. http://digitalcommons.unomaha.edu/slcehighered/144
Chinowski, P, Brown, H., Szajnman, A., and Realph, A. (2006). “Developing Knowledge Landscapes through Project-Based Learning”. Journal of Professional Issues in Engineering Education and Practice, Vol. 132, Issue 2
Auchey, F., Mills, T., Beliveau, Y., Auchey, G. (2000). “Using the learning outcomes template as an effective tool for evaluation of the undergraduate building construction program”. Journal of Construction Education, 5(3):244-59.
MacDonald, J., Mills, J. (2013). “An IPD approach to construction education”, Construction Economics and Building, 13(2), 93-103.

Spring 2018 | Volume 43 | Number 1
— Page 48 —The American Institute of Constructors | 19 Mantua Road | Mount Royal, NJ 08061 | Tel: 703.683.4999 | www.professionalconstructor.org
Enrollment, Retention, and Graduation patterns of Higher-Education Construction Science Students at Texas A&M
University: A Comparative StudyEdelmiro F. Escamilla, Texas A&M University | [email protected]
Mohammadreza Ostadalimakhmalbaf, Texas A&M University | [email protected] Fatemeh Pariafsai, Texas A&M University | [email protected]
Carlos Gragera, Gulf Interstate Engineering | [email protected] Mohammadhossein N. Alizadeh, Texas A&M University | [email protected]
ABSTRACT
This study compares the enrollment, retention, and graduation patterns of Hispanic and White students in the Department of Construction Science at Texas A&M University from 2008 to 2012 with three objectives: (1) to analyze demographic and scholastic databases of students enrolled in the department; (2) and to use the databases to identify any significant trends in Hispanic student enrollment in the department. The study demonstrates that there should be a concerted effort to recruit, retain, and graduate greater numbers of Hispanics in the department in order to keep up with the expected rise in Hispanic population in the State of Texas. The literature and data suggest that the best option requires recruitment efforts in midsize urban areas, as well as collaboration with public two-year colleges, especially those that are Hispanic-serving institutions, in order to increase the number of Hispanic transfer students. Also, a mentoring program is essential to promote healthy and positive factors that enhance a student’s psychological well-being, leading to better academic performance and higher graduation rates. These efforts would, of course, require strategic investment by Texas A&M University, College of Architecture, and Department of Construction Science resources.
Keywords: Enrollment, Retention, Graduation, Construction Science, Hispanic Students
Edelmiro F. Escamilla, PhD, is an instructional Assistant Professor in the Department of Construction Science at Texas A&M University. His research focuses on Hispanic issues in construction, workforce shortages, and construction education.
Mohammadreza Ostadalimakhmalbaf is a PhD candidate in the department of Construction Science at Texas A&M University. His research interests include capacity building for sustainable workforce in the US Construction Industry.
Fatemeh Pariafsai is a PhD candidate in the department of Construction Science at Texas A&M University. Her research interests include effectiveness of using games in construction education.
Carlos Gragera is graduated from the department of Construction Management at Texas A&M University. He is a Sr. project control specialist at Gulf Interstate Engineering.
Mohammadhossein Naderi Alizadeh is a PhD candidate in the department of Electrical and Computer Engineering at Texas A&M University. His research interests include statistical data analysis and data converters.

Enrollment, Retention, and Graduation Patterns of Higher-Education Construction Science Students at Texas A&M University: A Comparative Study
Spring 2018 | Volume 43 | Number 1
— Page 49 —The American Institute of Constructors | 19 Mantua Road | Mount Royal, NJ 08061 | Tel: 703.683.4999 | www.professionalconstructor.org
INTRODUCTION
BackgroundSince the late 20th century, growth of the Hispanic population in the United States has been exponen-tial. According to the United States Census Bureau, there were about 50.5 million Hispanics in 2010 (Ennis, Ríos-Vargas, & Albert 2011). Of this num-ber, Texas had the second largest population of His-panics of the 50 states, accounting for 9.5 million persons, or 19% of the total Hispanic population of the country (Ennis et al. 2011). With the rise in Tex-as’s population, the education of Hispanic students is of critical concern to its business, cultural, and political leaders. As a result, institutions of higher education, including Texas A&M University, are being challenged to do all they can do to enroll and educate Hispanic students in greater numbers than in the recent past.
In 2012, Hispanic students at Texas A&M Univer-sity made up 14% of the student body population of nearly 50,000 students. Even though this per-centage has increased in the university as a whole, there were some departments that hold a rate above the institutional average. This was the case in the Department of Construction Science, in which, in 2012, 16.9% (103 0f 609) of enrolled undergraduate students were Hispanic (DARS 2012).
Problem Statement The Department of Construction Science at Texas A&M University has traditionally enrolled limited numbers of Hispanic students into its program, and even though enrollment is above the university av-erage, it is not yet enough considering the Hispanic population growth in Texas. This paper explores the factors affecting the enrolled number of Hispanic students. The analysis is based on enrollment infor-mation for the Department of Construction Science from 2008 to 2012.
Research Objectives This study has three objectives: (1) to analyze de-mographic and scholastic databases of students en-rolled in the department; and (2) to use the databases
to identify any significant trends in the enrollment of Hispanics in the department.
Significance of the Study This study may yield invaluable insight into un-derstanding the factors that affect Hispanic student enrollment and their success in the Department of Construction Science at Texas A&M University, as well as point to possible solutions to increase en-rollment numbers. Utilizing data provided by the Department of Construction Science will help to find patterns of Hispanic student enrollment and success, as well as any limitations or barriers.
The Hispanic population is expected to increase to 119 million in 2060. By 2060, more than one-quar-ter of the total population of the United States is projected to be Hispanic (Colby & Ortman 2015). And children will be a driving factor in its growth, with more than one of three children in the United States being Hispanic, about equal to the proportion who will be non-Hispanic white (Murphey, Guz-man, & Torres 2014). For higher education institu-tions, such as Texas A&M University, it is a neces-sity to create education opportunities for Hispanic students.
Limitations This study is limited to Hispanic and White students enrolled in the Department of Construction Science at Texas A&M University from 2008 to 2012. Be-cause the number of Black and Asian students was very low, their analysis in this study is not includ-ed. However, data for both Black and Asian student graduation rates are included in this study’s tables. The study is based on admitted and enrolled stu-dents in the five-year period.
LITERATURE REVIEW
Background The purpose of this study is to try to find out why in 2012, the Hispanic student rate in the Construction Science program at Texas A&M University was 16.9% and how this number could increase. This is important because Hispanics constitute the largest

Enrollment, Retention, and Graduation Patterns of Higher-Education Construction Science Students at Texas A&M University: A Comparative Study
Spring 2018 | Volume 43 | Number 1
— Page 50 —The American Institute of Constructors | 19 Mantua Road | Mount Royal, NJ 08061 | Tel: 703.683.4999 | www.professionalconstructor.org
minority in the United States, and according to the United States Census (2010), the general statistics of the Hispanic population who are 25 and older with a bachelor’s degree or higher is very low compared to the rest of the United States population who are 25 and older with a bachelor’s degree; only 13% of Hispanics meet these criteria (Newsroom 2012).
The central concern in this study is to look at the number of Hispanics in the Department of Construc-tion Science by raising key questions:
1. Are Hispanic students being recruited? How is their retention; are they staying in the pro-gram?
2. To what extent is lack of support part of the problem?
Many factors affect a student’s decision to attend a higher education institution. Factors such as race, socioeconomic status, college generational status, and gender influence the decision that students make in selecting a college (Perez & McDonough 2008).
Fry (2002) with the Pew Hispanic Center conduct-ed an analysis based on population survey data col-lected by the United States Census Bureau between 1997 and 2000. The data were combined and aver-aged to create a solid statistical basis for assessing different forms of college attendance for Hispanics as compared to other groups and for making distinc-tions among subgroups of the Hispanic population. The report showed that a large number of Hispan-ics are enrolled in postsecondary education, but few graduate with a degree (Fry 2002).
Adverse factors affecting Hispanic student suc-cess in college
Part-Time Enrollment Often Leads to Low Proba-bility to Graduate, Limiting Transfer Opportunities
Fry (2002) argued that the problem is not enrollment, but that Hispanic students do not finish school. He said that about 42% of second-generation of Hispan-ics in the 18-to-24 age range attend college, which is
close to the rate for Whites at 46%. However, he ex-plained that most Hispanics pursue paths associated with lower chances of attaining a bachelor’s degree (Fry 2002). In fact, attending school part-time may be a key factor in why Hispanics do not finish their degrees. The United States Department of Educa-tion considers part-time college enrollment a “risk factor” for dropping out of postsecondary education (Fry 2002). A United States Department of Educa-tion study of college persistence followed a cohort of Hispanic college students for three years after ini-tial enrollment in postsecondary education. Among students who initially attended part-time, nearly half had no degree after three years and had dropped out (Fry 2002). And in the same time period, only one-quarter of the students who initially attended full-time had no degree and were no longer enrolled. No matter what postsecondary study a college stu-dent enters, part-time college enrollment represents a greater probability that a student will leave before completing a degree (Fry 2002).
Transferring from a Two-Year to a Four-Year Col-lege Is a Low Probability for Hispanics
There are some problems or limitations in the “ed-ucation pipeline” impacting the low enrollment of Hispanics in a four-year university. Transferring from a two-year college appears to be a low proba-bility for several reasons. Two-year institutions offer courses that aim at improving job skills rather than at advancing a student toward a degree. Such pro-grams are often designed to accommodate part-time students, leaving very little room for students to ex-plore programs offered at a four-year college (Fry 2002). Also, high school students who enroll in two-year Hispanic-serving institution (HSI) come from high schools with higher proportions of Hispanic teachers and minority students, indicating a possible organizational habitus that is more oriented toward an HIS (Núñez & Bowers 2011). Recent United States Department of Education tabulations of stu-dent persistence rates suggest that Hispanic students are more likely to drop out if they begin their col-lege studies at two-year colleges (NCES 2013). Data show that more than half of Hispanic students who

Enrollment, Retention, and Graduation Patterns of Higher-Education Construction Science Students at Texas A&M University: A Comparative Study
Spring 2018 | Volume 43 | Number 1
— Page 51 —The American Institute of Constructors | 19 Mantua Road | Mount Royal, NJ 08061 | Tel: 703.683.4999 | www.professionalconstructor.org
initially enroll in two-year colleges never complete a postsecondary degree, whereas almost 6 of 10 four-year college Hispanics complete at least a bachelor’s degree (Fry 2002). This situation impedes the like-lihood of transferring to a four-year college since nearly half of Hispanic college enrollment in the United States is in a two-year college (NCES 2013). This number is even more alarming in Texas, where 60% of Hispanic higher education enrollment occurs in a two-year college (Cortez 2011).
If a family has limited knowledge of how to navigate through the higher education system, a two-year col-lege could represent a viable option. Because tuition is usually lower at a two-year school than at a four-year school and because the process is easier to nav-igate, parents and students might chose a two-year college to attend.
Family Factors Restrict Hispanic Student Success
Family support is a critical ingredient in fostering student success in college. While Hispanic families place a high level of importance on higher education (Escamilla et al. 2016; F. E. Escamilla & Ostadali-makhmalbaf 2016), the reality for many Hispanic students is that they lack a viable support system, something that most White college students take for granted.
For Hispanic students unfamiliar with the process of navigating the university system, finding someone to help them with such a task is a major concern. Parents generally know little about the American ed-ucation system and often are not able to help them with college-related issues (Ceballo 2004). Many parents are not familiar with the registration process of a university. Since they cannot turn to their par-ents, students often seek out others for guidance.
According to researchers Perez and McDonough, the idea of being alone or without family support leads to anxiety for students. Consequently, when it comes to college planning, Hispanics rely heavily on siblings, peers, relatives, and high school contacts as resources for information on college admission pro-
cesses. Hispanic students rely on these persons for guidance in deciding which institutions to consider, apply, and select. For example, one student reported to Perez and McDonough that “my mom has a friend that went there and she said it’s a good school and it might take me longer to take the required cours-es. I might have to be there more years, but I think that would be my first choice” (Perez & McDonough 2008). Other Hispanics tend to apply and attend col-lege where they have older friends or where siblings attend or have attended school. The authors cited an example of a high school 11th grader who wrote in his application, “[Public University], I don’t want to leave [home], [Private University], my brother went there, [Private University], because a sister of mine went there and she’s always telling me how nice it is.” The authors stress that exposure to a college through family members is often a key factor in the decision-making process.
Seeking help from family members produces pos-itive psychological effects on Hispanic youth and serves as an added benefit (Desmond & López Tur-ley 2009).
Cultural Factors Restrict Hispanic Student Suc-cess
Cultural differences also have an adverse effect on Hispanic students. For instance, Hispanic parents tend to prioritize obligations to help with family chores over studying (Phinney, Torres Campos, Pa-dilla Kallemeyn, & Kim 2011). The persistence of such cultural (and economic) factors among Hispan-ic students compared to other students suggests that the former may require more help in understanding and negotiating the demands of college, especially in their early years of school.
Economic Factors Restrict Hispanic Student Suc-cess
For Hispanics, economic factors can severely lim-it success in college. Hispanics have lower socio-economic statuses than other ethnic groups and thus have great financial need (Swail, Cabrera, &

Enrollment, Retention, and Graduation Patterns of Higher-Education Construction Science Students at Texas A&M University: A Comparative Study
Spring 2018 | Volume 43 | Number 1
— Page 52 —The American Institute of Constructors | 19 Mantua Road | Mount Royal, NJ 08061 | Tel: 703.683.4999 | www.professionalconstructor.org
Lee 2004). They tend to attend schools with lower academic standards and therefore may be less pre-pared for college (Fry 2002). A large percentage of Hispanic parents have low education levels and/or are unfamiliar with the American education system. Proportionally, more Hispanics have parents who did not attend college (Wawrzynski & Sedlacek 2003).
The strong commitment to work and family does not prevent Hispanics from attending college, but it does help explain why very few enroll full-time (Fry 2002). According to Fry and Lowell in “Work or Study: Different Fortunes of Hispanic Genera-tions”, there is a high labor force participation rate for Hispanic young adults, including school-age youth who work at the same time as being enrolled in school . This is particularly true in immigrant households and would appear to be a simple func-tion of economic need. Among low-skilled Hispan-ic immigrants, household incomes are often built to acceptable levels by combining the earnings of several workers who each might be taking home limited wages. There is intense pressure on young people, especially males, to contribute to the family welfare as soon as they are old enough to work. As a result, economic necessity forces a high proportion of immigrant youth to end their education before high school graduation and work full-time instead (Fry & Lowell 2002).
While it is true that students from lower socioeco-nomic backgrounds attend selective universities pri-marily through academic ability, inequalities persist for them. Scholars believe that perceptions of op-portunities and knowledge of the educational mar-ketplace remain rooted in a student’s background or habitus. Thus, youth excel in higher education be-cause they have superior information about the ac-ademic marketplace, knowledge of fields that offer lucrative financial rewards, and knowledge of how to acquire competitive advantages (Boudon 1974; OstadaliMakhmalbaf 2014). As a result, students from disadvantaged origins have lower probabili-ties of success as they advance through the different stages of the education system.
First-Generation Students Have Serious Limita-tions That Place Them at Risk
First-generation students often may have parents with limited education, and they lack knowledge of how to maneuver within the university system. Some Hispanic students also lack the social knowledge of how to navigate the college environment successful-ly and do not recognize when they should be asking questions (Torres & Hernandez 2009); consequently, there is a strong need for proper academic guidance and mentoring upon enrollment.
According to Cortez (2011), for first-generation His-panic students, the college transfer process can seem like a maze. The need for guidance on the university experience is critical to their ability to stay and suc-ceed in college (Torres & Hernandez 2009). Research has traditionally focused on the development of ac-ademic skills through tutoring. However, programs that promote psychological factors are perhaps as important as remedial and tutoring opportunities for students from psychological diverse backgrounds (Sedlacek 2004).
Positive factors affecting Hispanic student success in college
Hispanic-Serving Institutions Are a Model for Suc-cess
Enrollment of Hispanics in HSIs appears to be more promising. According to the United States Depart-ment of Education, an HSI is defined as an institution of higher education that has at least 25% Hispanic students in its total enrollment of full-time or part time undergraduate students at the end of the award year immediately preceding the date of application (Ed.gov 2017). This type of institution brings hope to Hispanic students, their families, and many prac-titioners and researchers who are directly and indi-rectly involved with and invested in the education-al progress of these students (Perrakis & Hagedorn 2010). High rates of degree completion are a striking feature of HSIs, with 40% of all Hispanics in these institutions completing their Associate of Arts or

Enrollment, Retention, and Graduation Patterns of Higher-Education Construction Science Students at Texas A&M University: A Comparative Study
Spring 2018 | Volume 43 | Number 1
— Page 53 —The American Institute of Constructors | 19 Mantua Road | Mount Royal, NJ 08061 | Tel: 703.683.4999 | www.professionalconstructor.org
Associate of Science degree (Perrakis & Hagedorn 2010).
According to the Hispanic Association of Colleges and Universities, in 2011 to 2012, there were a to-tal of 356 HSIs responsible for enrolling 1,480,722 Hispanic undergraduate and graduate students in postsecondary (nonprofit) schools. Of these 356 HSIs, 169 (47.5%) represented public two-year in-stitutions, 70 (19.7%) represented public four-year institutions, 99 (27.8%) represented private four-year institutions, and 18 (5.1%) represented private two-year institutions, meaning 67% served as pub-lic institutions and 32.9% served as private institu-tions (HACU 2013).
Researcher Laura Cortez examined what helps Hispanic students succeed at an HSI in Texas. She based her study on students who attend University of Texas—Pan American, ranked third among col-leges nationwide in awarding the most undergrad-uate and graduate degrees to Hispanics. She found five major factors promoting Hispanic success:
1. A campus climate that values and validates His-panic culture
2. Academic programs that promote collaboration
3. Clear procedures to simplify the transfer process
4. A well-articulated pathway to a degree
5. Strong faculty advising to help students make connections between degrees and careers (Cor-tez 2011)
Cortez reported that Hispanics identify the trans-fer process as being especially difficult with regard to course requirements needed for transfer (Cortez 2011). Close collaboration among South Texas Col-lege, the community college in McAllen, Texas, and University of Texas—Pan American in Edin-burg, Texas has facilitated transferring. Students in the study explained that transfer advisers made the transition easier for them because they guided them through the process and made sure they had both the required courses and the grades to be able to transfer. To what degree a non-HSI, such as Texas
A&M University, can offer a similar opportunity to promote success is a matter that deserves more at-tention (Cortez 2011).
Community Colleges Could Be a Source of Addi-tional Students
Attending community college can be very appealing to Hispanics because of their strong family ties. A community college allows students to stay at home or close to home. In a study conducted by educa-tors Desmond and Lopez Turley, 74% of Hispanic students reported that the ability to attend school while living at home is important (Desmond & López Turley 2009). These authors concluded that the number of Hispanic students would increase at a significant pace if more of them were able to stay home while attending college. They explained that effective policy initiatives aimed at improving the state of Hispanic education would attempt to bring postsecondary educational offerings to communi-ties that are not too far from college campuses (Des-mond & López Turley 2009). They suggested that this could be accomplished by establishing satellite campuses in rural areas or through Internet-based or video-transmitted instruction.
Mentoring Hispanic Students Could Make the Difference
While the goal of every student entering a college or a university is to earn a degree, mentoring is often essential for minority students. Jaffe offers a good definition of a mentor: “teachers or role models who establish a personal connection with young people, help them acquire practical skills or information, provide encouragement and emotional support, and guide them through unfamiliar situations” (L. Jaffe, 1998). Mentoring programs may be particularly well-suited for Hispanics because mentors can pro-vide personal support that addresses psychological as well as academic needs (Phinney et al. 2011).
Phinney, Torres Campos, Padilla Kallemeyn, and Kim provided invaluable insight on the positive effects of mentoring Hispanic freshmen students. The research consisted of two longitudinal studies
Enrollment, Retention, and Graduation Patterns of Higher-Education Construction Science Students at Texas A&M University: A Comparative Study
Spring 2018 | Volume 43 | Number 1
— Page 54 —The American Institute of Constructors | 19 Mantua Road | Mount Royal, NJ 08061 | Tel: 703.683.4999 | www.professionalconstructor.org
in a predominantly minority urban university and compared nonmentored students (nonmentees) with at-risk Hispanic freshmen (mentees) who were men-tored for two semesters by upper division or grad-uate students from psychology and counseling ma-jors. In both studies, mentees showed improvement in psychological factors that underlie academic per-formance. In one of the studies, mentees also expe-rienced a decrease in depression and stress, and they were less likely than nonmentees to be classified as at risk for poor academic outcomes (Phinney et al. 2011).
In another study, Torres and Hernandez examined the importance of having someone who supports and advises students about their academic and personal choices. They found that having a mentor to serve as a guide and with whom to discuss issues yields positive effects for students. Their study focused on understanding the influence of a mentor n the fac-tors influencing Hispanic student intent to persist in school. The results of the study also confirmed that mentors are an integral part of adolescents’ lives, specifically pertaining to their decision to attend col-lege. Seventy-percent of the respondents reported having a mentor who was influential in their deci-sion-making (Phinney et al. 2011).
Summary The literature suggests that the best options to in-crease the number of Hispanics in the Department of Construction Science involve new approaches to recruitment and retention of Hispanic students. Augmenting recruitment efforts in midsize urban ar-eas, as well as collaboration with public two-year colleges, especially HSIs, in order to increase the rate of Hispanic transfer students, represent viable strategies. Also, a mentoring program is essential to promote healthy and positive factors that enhance a student’s psychological well-being and academic skills. These efforts would, of course, require stra-tegic investment of university and Department of Construction Science resources.
METHODOLOGY
Data collection This study used student enrollment data in the De-partment of Construction Science at Texas A&M University from 2008 to 2012. These data were collected from the Texas A&M University Website Accountability and DARS (Data And Research Ser-vices) Reports.
Data were tabulated using the Microsoft Excel pro-gram. The information from the Texas A&M Uni-versity Website Accountability was filtered by just showing information from the Department of Con-struction Science, and tables were created to summa-rize the data. With the information from the DARS Reports, some tables were created in order to present the data.
Data Analysis To organize the data, a table was created for the stu-dents admitted into the program during the years 2008 to 2012. An applicant is identified by his or her ethnicity and his or her gender. The table is di-vided into categories, which at the same time break into different sections. The categories are divided as follows:
• Application—divided into number, term, and major
• Student Identification—divided into ethnicity and gender
• Enroll in the Department of Construction Sci-ence
• High School Identification and Geographic Location—divided into country, school state, school city, institution name, and size of city (data gathered from the 2010 Census: Popula-tion of Texas Cities)
Another pivot table was created showing the number of students in each city where the admitted student is from; this table was fixed by ethnicity. Data on the enrolled students for the period 2008 to 2012 were the bases for analysis. The data for those who are Hispanic served as the dependent variable, and
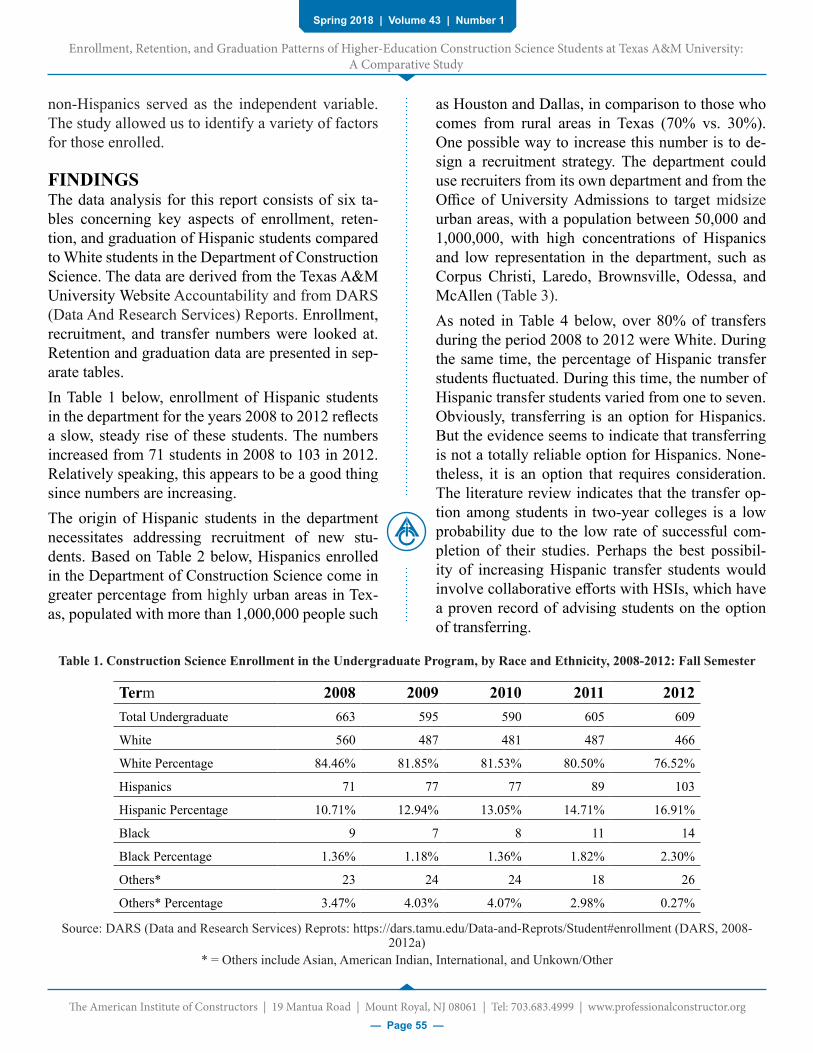
Enrollment, Retention, and Graduation Patterns of Higher-Education Construction Science Students at Texas A&M University: A Comparative Study
Spring 2018 | Volume 43 | Number 1
— Page 55 —The American Institute of Constructors | 19 Mantua Road | Mount Royal, NJ 08061 | Tel: 703.683.4999 | www.professionalconstructor.org
non-Hispanics served as the independent variable. The study allowed us to identify a variety of factors for those enrolled.
FINDINGSThe data analysis for this report consists of six ta-bles concerning key aspects of enrollment, reten-tion, and graduation of Hispanic students compared to White students in the Department of Construction Science. The data are derived from the Texas A&M University Website Accountability and from DARS (Data And Research Services) Reports. Enrollment, recruitment, and transfer numbers were looked at. Retention and graduation data are presented in sep-arate tables. In Table 1 below, enrollment of Hispanic students in the department for the years 2008 to 2012 reflects a slow, steady rise of these students. The numbers increased from 71 students in 2008 to 103 in 2012. Relatively speaking, this appears to be a good thing since numbers are increasing.The origin of Hispanic students in the department necessitates addressing recruitment of new stu-dents. Based on Table 2 below, Hispanics enrolled in the Department of Construction Science come in greater percentage from highly urban areas in Tex-as, populated with more than 1,000,000 people such
as Houston and Dallas, in comparison to those who comes from rural areas in Texas (70% vs. 30%). One possible way to increase this number is to de-sign a recruitment strategy. The department could use recruiters from its own department and from the Office of University Admissions to target midsize urban areas, with a population between 50,000 and 1,000,000, with high concentrations of Hispanics and low representation in the department, such as Corpus Christi, Laredo, Brownsville, Odessa, and McAllen (Table 3).As noted in Table 4 below, over 80% of transfers during the period 2008 to 2012 were White. During the same time, the percentage of Hispanic transfer students fluctuated. During this time, the number of Hispanic transfer students varied from one to seven. Obviously, transferring is an option for Hispanics. But the evidence seems to indicate that transferring is not a totally reliable option for Hispanics. None-theless, it is an option that requires consideration. The literature review indicates that the transfer op-tion among students in two-year colleges is a low probability due to the low rate of successful com-pletion of their studies. Perhaps the best possibil-ity of increasing Hispanic transfer students would involve collaborative efforts with HSIs, which have a proven record of advising students on the option of transferring.
Table 1. Construction Science Enrollment in the Undergraduate Program, by Race and Ethnicity, 2008-2012: Fall Semester
Term 2008 2009 2010 2011 2012Total Undergraduate 663 595 590 605 609
White 560 487 481 487 466
White Percentage 84.46% 81.85% 81.53% 80.50% 76.52%
Hispanics 71 77 77 89 103
Hispanic Percentage 10.71% 12.94% 13.05% 14.71% 16.91%
Black 9 7 8 11 14
Black Percentage 1.36% 1.18% 1.36% 1.82% 2.30%
Others* 23 24 24 18 26
Others* Percentage 3.47% 4.03% 4.07% 2.98% 0.27%
Source: DARS (Data and Research Services) Reprots: https://dars.tamu.edu/Data-and-Reprots/Student#enrollment (DARS, 2008-2012a)
* = Others include Asian, American Indian, International, and Unkown/Other

Enrollment, Retention, and Graduation Patterns of Higher-Education Construction Science Students at Texas A&M University: A Comparative Study
Spring 2018 | Volume 43 | Number 1
— Page 56 —The American Institute of Constructors | 19 Mantua Road | Mount Royal, NJ 08061 | Tel: 703.683.4999 | www.professionalconstructor.org
Table 2. Enrollment of Students in Construction Science, Spring 2013, high Urban Vs. Small Towns and Cities, by Race and Ethnicity
Asian American Blacks Hispanics Others* Whites
Grand Total
Total Number of Enrolled 1 0 10 1 18 30
Urban Area** 0 0 7 0 13 17
Small Town and Small City Area
1 0 3 1 5 10
Percentage of Urban 0% 0% 70% 0% 72% 67%
Percentage of Rural 100% 0% 30% 100% 28% 33%
Source: Report for Construction Science Department of Admitted Students, Fall 2012 * = Others include Asian, American Indian, International, and Unknown/Other**= Cities with a population of 50,000 people or over (United States Census)
Table 4. Transfer Students into Construction Science, by Race and Ethnicity, 2008–2012
2008 2009 2010 2011 2012Total Transfer 38 35 37 36 53White 34 28 30 32 44White % from transfer 89.47% 80.00% 81.08% 88.89% 83.02%Hispanic 1 6 4 3 7Hispanic % from transfer 2.63% 17.14% 10.81% 8.33% 13.21%Black 0 1 1 0 0Black % from transfer 0.00% 2.86% 2.70% 0.00% 0.00%Others* 3 0 2 1 2Others* % from transfer 7.89% 0.00% 5.41% 2.78% 3.77%
Source: Texas A&M University Website, University Metrics - Student Demographics: http//accountabili-ty.tamu.edu/content/metrics-studentdemographics
* = Others include Asian Americans, Native Americans, and International Students.
Table 3. Size Based on Population of Some Urban Areas in Texas, Their Counties’ Percentage of Hispanic Population
Urban Area Population Size County Percentage of Hispanic PopulationLaredo 236,091 midsize Webb 95.7McAllen 129,877 midsize Hidalgo 90.6Brownsville 175,023 midsize Cameron 88.1Corpus Christi 305,215 midsize Nueces 60.6Odessa 99,940 midsize Ector 52.7Houston 2,099,451 highly Harris 40.8%Dallas 1,197,816 highly Dallas 38.3
Source: https://www.census.gov/censusexplorer/censusexplorer-popest.html (CensusExplorer, 2015)

Enrollment, Retention, and Graduation Patterns of Higher-Education Construction Science Students at Texas A&M University: A Comparative Study
Spring 2018 | Volume 43 | Number 1
— Page 57 —The American Institute of Constructors | 19 Mantua Road | Mount Royal, NJ 08061 | Tel: 703.683.4999 | www.professionalconstructor.org
Table 5. Retention and Graduation rates of ALL Students in Construction Science, by Race and Ethnicity, 2008–2012; Cumulative percentage **
Group Year Headcount % 1-yr Retained % 4-yr % 5-yr % 6-yr
ALL 2008 113 75.2% 46.0% 67.3% 67.3%ALL 2009 98 76.5% 52.0% 68.4% 69.4%ALL 2010 87 81.6% 60.9% 69.0% 69.0%ALL 2011 82 79.3% 52.4% 65.9% -ALL 2012 116 73.3% 55.2% - -White 2008 87 80.5% 52.9% 71.3% 71.3%White 2009 73 79.5% 60.3% 76.7% 78.1%White 2010 70 82.9% 65.7% 72.9% 72.9%White 2011 64 82.8% 54.7% 65.6% -White 2012 78 78.2% 65.4% - -Hispanic 2008 19 52.6% 21.1% 52.6% 52.6%Hispanic 2009 19 63.2% 26.3% 42.1% 42.1%
Hispanic 2010 14 71.4% 35.7% 50.0% 50.0%
Hispanic 2011 16 68.8% 50.0% 68.8% -Hispanic 2012 27 74.1% 40.7% - -Black 2008 1 100.0% 0.0% 0.0% 0.0%Black 2009 2 100.0% 50.0% 50.0% 50.0%Black 2010 1 100.0% 100.0% 100.0% 100.0%Black 2011 1 100.0% 0.0% 100.0% -Black 2012 3 0.0% 0.0% - -OTHERS* 2008 6 66.67% 33.3% 66.67% 66.67%OTHERS* 2009 4 75.0% 25.0% 50.0% 50.0%OTHERS* 2010 2 100.0% 50.0% 50.0% 50.0%OTHERS* 2011 1 0.0% 0.0% 0.0% -OTHERS* 2012 8 50.0% 25.0% - -
Source: DARS (Data And Research Services) Reports: https://dars.tamu.edu/Data-and-Reports/Student/Retention-Grad-uation (DARS, 2008-2012b)
* = Others include Asian, American Indian, International, Multi-racial excluding Black, and Other/Unknown.
** = Only fall semesters are considered for retention calculations; however, graduation data are taken from all three com-mencements during that academic year (December, May, and August)

Enrollment, Retention, and Graduation Patterns of Higher-Education Construction Science Students at Texas A&M University: A Comparative Study
Spring 2018 | Volume 43 | Number 1
— Page 58 —The American Institute of Constructors | 19 Mantua Road | Mount Royal, NJ 08061 | Tel: 703.683.4999 | www.professionalconstructor.org
Table 6. Average Years Taken to Obtain a Degree in Construction Science, by Race and Ethnicity, by Gender, 2007–2012
Hispanics Whites Blacks Others* Total # of GraduatesYear period Description M F M F M F M F M F Grand Total
2007– 2008
Number of graduates 19 3 164 13 0 0 2 0
185 16 201Average years taken 5.18 4.2 4.98 4.9 0 0 4.75 0
Total average years taken 5.05 4.97 0 4.75
2008– 2009
Number of graduates 12 0 166 22 2 0 7 0
187 22 209Average years taken 4.83 0 4.89 5 4.5 0 4.86 0
Total average years taken 4.83 4.91 4.5 4.86
2009– 2010
Number of graduates 16 0 109 14 2 0 1 2
28 16 144Average years taken 5.25 0 4.91 4.4 5.8 0 5 4.5
Total average years taken 5.25 4.85 5.75 4.67
2010– 2011
Number of graduates 12 4 125 15 0 0 7 0
144 19 163Average years taken 4.71 6.3 4.81 4.3 0 0 4.86 0
Total average years taken 5.09 4.76 0 4.86
2011– 2012
Number of graduates 16 4 141 14 1 0 4 1
162 19 181Average years taken 5.22 4.8 4.78 4.3 4.5 0 4.88 4
Total average years taken 5.13 4.73 4.5 4.7
Source: DARS (Data And Research Services) Reports: https://dars.tamu.edu/Data-and-Reports/Student/Retention-Graduation
* = Others include Asian, American Indian, International, Multi-racial excluding Black, and Other/Unknown

Enrollment, Retention, and Graduation Patterns of Higher-Education Construction Science Students at Texas A&M University: A Comparative Study
Spring 2018 | Volume 43 | Number 1
— Page 59 —The American Institute of Constructors | 19 Mantua Road | Mount Royal, NJ 08061 | Tel: 703.683.4999 | www.professionalconstructor.org
As Table 5 below demonstrates, in the period 2008 to 2012, the number of Hispanic students remaining in the Department of Construction Science after their first year was lower than White students. However, the results comparison of these two populations was undertaken with caution since the headcounts of these two populations are imbalanced. As a matter of fact, during 2008, the worse year for retention of Hispanic students, about half (47.4%) left. While the exact reasons for the low retention rate of Hispan-ic students are unclear, it is an issue that should be addressed. As noted above, researchers have shown that mentoring Hispanic students is a successful strategy in promoting learning and positive psycho-logical factors that foster academic success. Such a strategy could easily be adopted in the department.
Table 6 below compares the average years taken to obtain a degree in the Department of Construction Science by the various student population groups. It demonstrates that during the period from 2008 to 2012, Hispanics took an average of 5.07 years ver-sus 4.84 years for White students. While the differ-ence is not very large, the issue of time to graduation requires intervention. Again, mentoring Hispanic students early on in their careers may be a useful strategy to reduce the time to graduation.
Summary of results
This comparative study of the Hispanic and White populations in the Department of Construction Sci-ence at Texas A&M University resulted in four key findings:
1. There is a slow, steady rise in the enrollment of Hispanic students in the program for the years 2008 to 2012. Their number increased from 71 students in 2008 to 103 in 2012.
2. Hispanics enrolled in the program are usual-ly high school graduates from highly urban ar-eas, such as Houston and Dallas, with a smaller percentage from small towns. None come from important midsize urban areas, such as Laredo, Brownsville, Corpus Christi, and other simi-lar-size cities in Texas.
3. With regard to enrollment in Construction Sci-ence, transferring is an option for Hispanics. But the numbers vary widely from year to year; between 2008 and 2012, the average number of Hispanic transfer students was 10.42%, while during the same time for White students, the average was 84.49%. The literature cited above indicates that the transfer option among students in two-year colleges is a low probability due to the low rate of successful completion of their studies. A possible way, however, to increase Hispanics transfer students would involve col-laborative efforts with HSIs.
4. The retention and graduation rates of Hispanics in Construction Science are comparatively lower than for White students in the department. While it is unclear what the exact reasons are for the low retention and graduation rates, it is an issue that should be addressed, with mentoring of stu-dents as the most relevant intervention.
CONCLUSIONS AND RECOMMENDATIONS
The significance of this comparative study of the Hispanic and White student populations in the De-partment of Construction Science at Texas A&M University is that it demonstrates that, while specific factors adversely limit the probability of Hispanic student success in academic study, these students have had some success with Texas A&M Univer-sity’s degree of Construction Science. This success could be greater under certain conditions, especially the adoption of recruitment efforts in midsize urban areas and the implementation of a mentor program. Partnership with HSI colleges is also an ideal op-tion to facilitate increasing the number of Hispanic students. Because there should be a concerted effort to recruit, retain, and graduate Hispanics in the De-partment of Construction Science, it is important to undertake further research.

Enrollment, Retention, and Graduation Patterns of Higher-Education Construction Science Students at Texas A&M University: A Comparative Study
Spring 2018 | Volume 43 | Number 1
— Page 60 —The American Institute of Constructors | 19 Mantua Road | Mount Royal, NJ 08061 | Tel: 703.683.4999 | www.professionalconstructor.org
REFERENCES
Accountability. (2012). Applied, Admitted, & Enrolled. Retrieved from https://accountability.tamu.edu/All-Metrics/Mixed-Metrics/Applied,-Admitted,-Enrolled
Boudon, R. (1974). Education, opportunity, and social inequality: Changing prospects in western society. New York: Wiley.
Ceballo, R. (2004). From barrios to Yale: The role of parenting strategies in Latino families. Hispanic Journal of Behavioral Sciences, 26(2), 171-186.
CensusExplorer. (2015). Population Estimates Edition. Retrieved from https://www.census.gov/censusexplor-er/censusexplorer-popest.html
Colby, S. L., & Ortman, J. M. (2015 ). Projections of the Size and Composition of the U.S. Population: 2014 to 2060. Retrieved from Washington, D.C.:
Cortez, L. J. (2011). A Road Map to Their Future: What Latino Students Need to Graduate. Diversity in Aca-deme 2013. Retrieved from http://www.chronicle.com/article/A-Road-Map-to-Their-Future-/129091/
DARS. (2008-2012a). Enrollment Profile Report. Retrieved from College Station, Texas: https://dars.tamu.edu/Data-and-Reports/Student#enrollment
DARS. (2008-2012b). Retention & Graduation. Retrieved from College Station, Texas: https://dars.tamu.edu/Data-and-Reports/Student/Retention-Graduation
DARS. (2012). Enrollment Profile – Fall 2012. Retrieved from College Station, Texas: https://dars.tamu.edu/Data-and-Reports/Student/files/EPFA12_Certified.aspx
Desmond, M., & López Turley, R. N. (2009). The role of familism in explaining the Hispanic-White college application gap. Social Problems, 56(2), 311-334. doi:https://doi.org/10.1525/sp.2009.56.2.311
Ed.gov. (2017). Hispanic-Serving Institutions (HSIs). Retrieved from https://sites.ed.gov/hispanic-initiative/hispanic-serving-institutions-hsis/
Ennis, S. R., Ríos-Vargas, M., & Albert, N. G. (2011). The Hispanic Population: 2010 Retrieved from http://www.census.gov/prod/cen2010/briefs/c2010br-04.pdf
Escamilla, E., Ostadalimakhmalbaf, M., & Bigelow, B. F. (2016). Factors Impacting Hispanic High School Stu-dents and How to Best Reach Them for the Careers in the Construction Industry. International Journal of Construction Education and Research, 12(2), 82-98. doi:10.1080/15578771.2015.1077296
Escamilla, F. E., & Ostadalimakhmalbaf, M. (2016). Capacity Building for Sustainable Workforce in the Con-struction Industry. The Professional Constructor, 41(1), 51-71.
Fry, R. (2002). Latinos in Higher Education: Many Enroll, Too Few Graduate. Retrieved from Washington, D.C.: https://eric.ed.gov/?id=ED468848
Fry, R., & Lowell, B. L. (2002). Work or Study: Different Fortunes of US Latino Generations. Pew Hispanic Center Report. Retrieved from Washington, D.C.: https://eric.ed.gov/?id=ED465849
HACU. (2013). 2013 Fact Sheet Hispanic Higher Education and HSIs. Retrieved from http://www.hacu.net/im-ages/hacu/OPAI/2013_HSI_FactSheet.030613.pdf
L. Jaffe, M. (1998). Adolescence. New York: John Wiley & Sons.

Enrollment, Retention, and Graduation Patterns of Higher-Education Construction Science Students at Texas A&M University: A Comparative Study
Spring 2018 | Volume 43 | Number 1
— Page 61 —The American Institute of Constructors | 19 Mantua Road | Mount Royal, NJ 08061 | Tel: 703.683.4999 | www.professionalconstructor.org
Murphey, D., Guzman, L., & Torres, A. (2014). America’s Hispanic Children: Gaining Ground, Looking For-ward Retrieved from Wisconsin: https://www.childtrends.org/?publications=americas-hispanic-chil-dren-gaining-ground-looking-forward
NCES. (2013). Fast Facts. Retrieved from https://nces.ed.gov/fastfacts/display.asp?id=40
Newsroom. (2012 ). Facts for Features: Hispanic Heritage Month 2012: Sept. 15 — Oct. 15. Retrieved from https://www.census.gov/newsroom/releases/archives/facts_for_features_special_editions/cb12-ff19.html
Núñez, A.-M., & Bowers, A. J. (2011). Exploring what leads high school students to enroll in Hispanic-serv-ing institutions: A multilevel analysis. American Educational Research Journal, 48(6), 1286-1313. doi:https://doi.org/10.3102/0002831211408061
OstadaliMakhmalbaf, M. (2014). Identifying and Prioritizing the Fundamental Factors that Lead to Inaccurate Perceptions of the Construction Industry. (Master of Science Master’s thesis), Texas A & M University. Retrieved from http://hdl.handle.net/1969.1/153607
Perez, P. A., & McDonough, P. M. (2008). Understanding Latina and Latino college choice: A social capital and chain migration analysis. Journal of Hispanic higher education, 7(3), 249-265. doi:https://doi.org/10.1177/1538192708317620
Perrakis, A., & Hagedorn, L. S. (2010). Latino/a student success in community colleges and Hispanic-serving institution status. Community College Journal of Research and Practice, 34(10), 797-813. doi:http://dx.doi.org/10.1080/10668921003723110
Phinney, J. S., Torres Campos, C. M., Padilla Kallemeyn, D. M., & Kim, C. (2011). Processes and outcomes of a mentoring program for Latino college freshmen. Journal of Social Issues, 67(3), 599-621. doi:10.1111/j.1540-4560.2011.01716.x
Sedlacek, W. E. (2004). Why we should use noncognitive variables with graduate and professional students. National Association of Advisors for the Health Professions, 24 (2), 32-39.
Swail, W. S., Cabrera, A. F., & Lee, C. (2004). Latino Youth and the Pathway to College. Retrieved from Wash-ington, D.C.: https://eric.ed.gov/?id=ED485304
Torres, V., & Hernandez, E. (2009). Influence of an identified advisor/mentor on urban Latino students’ col-lege experience. Journal of College Student Retention: Research, Theory & Practice, 11(1), 141-160. doi:https://doi.org/10.2190/CS.11.1.h
Wawrzynski, M. R., & Sedlacek, W. E. (2003). Race and gender differences in the transfer student experience. Journal of College Student Development, 44(4), 489-501. doi:10.1353/csd.2003.0045