the productivity effects of worker replacement in young...
TRANSCRIPT
Dis cus si on Paper No. 17-010
The Productivity Effects of Worker Replacement in Young Firms
Martin Murmann

Dis cus si on Paper No. 17-010
The Productivity Effects of Worker Replacement in Young Firms
Martin Murmann
Download this ZEW Discussion Paper from our ftp server:
http://ftp.zew.de/pub/zew-docs/dp/dp17010.pdf
Die Dis cus si on Pape rs die nen einer mög lichst schnel len Ver brei tung von neue ren For schungs arbei ten des ZEW. Die Bei trä ge lie gen in allei ni ger Ver ant wor tung
der Auto ren und stel len nicht not wen di ger wei se die Mei nung des ZEW dar.
Dis cus si on Papers are inten ded to make results of ZEW research prompt ly avai la ble to other eco no mists in order to encou ra ge dis cus si on and sug gesti ons for revi si ons. The aut hors are sole ly
respon si ble for the con tents which do not neces sa ri ly repre sent the opi ni on of the ZEW.
The Productivity Effects of Worker Replacement in Young Firms
Martin Murmann∗
February 8, 2017
Abstract
Existing management research has so far dealt with the consequences of labor turnover
for established firms, but has not addressed its effect on young entrepreneurial businesses.
In this paper I assess, both theoretically and empirically, the productivity effects of worker
replacement in young firms. Worker replacement isolates labor turnover due to employee
replacement as a separate category of turnover and has been shown to positively affect the
productivity of established firms in previous research. Using a large and representative sam-
ple of German start-ups, I show that worker replacement has negative effects on young firms’
productivity that remain even when controlling for moderating factors. These effects are even
more negative when the founder does not have prior managerial experience.
ddddddddddddddddddddddddddddddddddddddddddddddddddddddddddddddddddddddddd
Keywords: Firm productivity, Labour turnover, Churning, Entrepreneurship dddddddddddddddddd
JEL classifications: L26, M13, J24, J63, D22
Acknowledgements I thank Petra Andries, Mathias Beck, Aiophy Brophy, Nazanin Efftekhari, Helmut
Fryges, Carlos Gomez Gonzalo, Martin Hud, Katrin Hussinger, Ulrich Kaiser, Bettina Klose, Heli Koski,
Georg Licht, Matt Marx, Jose Mata, William McKinley, Manuela Morf, Stevo Pavicevic, Bettina Peters,
Vivien Procher, Michael Ribers, Mark Roberts, Kathrin Schopen, Pernille Schulze, Jochen Spath, Konrad
Stahl, Irina Stoller, the participants of a lunch-time seminar at the Centre for European Economic Research
in Mannheim, the participants of a session at the ZEW Conference on the Dynamics of Entrepreneurship,
and the participants of a session at the DRUID Conference in Rome for sharing valuable ideas and comments
regarding this research project with me.
∗Centre for European Economic Research (ZEW), Mannheim, Germany and Institute for Employment Re-search (IAB), Nuremberg, Germany and University of Zurich, Switzerland. Email: [email protected]
1
1 Introduction
Young firms are particularly sensitive to frequent replacements of employees (Haltiwanger et al.,
2012; Lane, Isaac and Stevens, 1996). Replacements are caused by the employer - when the
employer decides to replace an employee, or by the employee - when s/he decides to move to an-
other company. Either way, a replacement leads to two worker flows - one into the firm and one
out of the firm - that have to be managed. Literature on organizational learning suggests that
the replacement of an employee can have positive or negative effects on a firm’s performance.
The inflow of human capital due to the new employee can bring new knowledge and capabilities
into the firm (Rosenkopf and Almeida, 2003; Parrotta and Pozzoli, 2012), while the outflow of
human capital due to the replaced employee, is associated with the loss of (tacit) knowledge and
capabilities (Phillips, 2002; Wezel et al., 2006; Corredoira and Rosenkopf, 2010). In addition,
the replacement leads to adjustment costs, such as recruitment costs for new employees or costs
associated with the training of new employees (Nickell, 1986; Burgess et al., 2000a). However,
besides the managerial importance and a growing political awareness of the relevance of young
firms for the economy (cf. the 2020 Action Plan of the European Commission), the conditions
under which the positive or negative consequences of worker replacement prevail in young firms
are not yet known. I address this topic both theoretically and empirically in this paper.
I choose productivity as a broad and direct measure of firm performance to isolate the effects of
worker replacement on firms’ performance as effectively as possible. Productivity is less affected
by mediating factors than are other frequently used performance measures, such as return on
assets or profits. I concentrate on young, owner-managed entrepreneurial firms during their first
years of existence and term them “young firms”.1 The empirical analyses in this paper are based
on firms that are up to eight years’ old with at least one dependent employee. The effects of
labor turnover on firms’ performance in such young entrepreneurial firms are rarely considered
by the existing literature.
Studies on the consequences of labor turnover for the performance of established firms have
been burgeoning over the past two decades in the fields of management, sociology, psychology,
and personnel economics, but their results depend strongly on the measures for labor turnover
and the performance measures chosen. Most studies conclude that labor turnover is negatively
associated with longer-term performance measures such as growth, profit, or return on assets
(Lane, Isaac and Stevens, 1996; Burgess et al., 2000a,b; Baron et al., 2001; Park and Shaw,
2013). By contrast, the results are more mixed with regard to short-term, productivity-related
performance measures for established firms. When, as in the present study, the pure worker
replacement component of labor turnover is considered as a measure for labor turnover, prior
evidence even points to a strictly positive relationship between worker replacement and a firm’s
productivity (Ilmakunnas et al., 2005).2 This positive productivity effect is attributed to an
increase in the quality of the employer-employee match. In this paper, I argue that the diverse
findings in prior studies might, at least to some extent, be driven by methodological issues
1I use the terms new venture, start-up, and young firm interchangeably.2The measurement of labor turnover is discussed in the next section.
2
concerning the measurement of labor turnover and the identification of causal effects of labor
turnover on firm performance.
Apart from methodological issues, the transferability of results regarding the consequences of la-
bor turnover - from established firms to young firms - is generally very limited. First, hierarchies
in most new ventures can be considered to be flat, and processes within these ventures are often
informal and not yet standardized (Rajan and Zingales, 2001). An individual employee might
have a much larger share of relevant tacit knowledge in a young, small firm than he or she might
bear in a larger established firm. Hence, the inflow or outflow of a single employee might trigger
much greater friction for a new venture (Baron et al., 2001). Second, small firms are not covered
by most studies on labor turnover and most young firms are still small. To avoid bias in the
analyses, small firms are often systematically excluded from the samples. Third, young firms are
particularly sensitive to risk factors identified in the previous literature for high rates of worker
replacement that are unintended by the firm. Worker replacement that is not part of the per-
sonnel strategy of a firm might be thought of as a driver of unfavorable consequences of worker
replacement. Important sources of unintended worker replacement are a lack of experience in
recruitment and strong employment growth in earlier periods (Burgess et al., 2000a; Lane, Isaac
and Stevens, 1996). Both result in a suboptimal quality of employer-employee matches, which
then need to be resolved. Young firms differ from established firms with regard to these risk
factors: the firm’s growth is often particularly strong in the early years and the routines for
recruitment decisions have not yet been established. Thus, young firms should be less able to
secure good employer-employee matches than are established firms. In addition, most young
firms are financially restricted when competing with established firms for the best employees
(Brixy et al., 2007; Cabral and Mata, 2003). Hence, young firms’ most productive employ-
ees - who can be considered to be most likely to have outside options with higher remuneration
- might be responsible for a disproportionately high share of employee resignation in young firms.
The main contribution of this paper is therefore to unravel how worker replacement affects the
productivity of young firms. Thus, this paper has important managerial implications for the
personnel strategies of young firms. In addition, this paper connects strands in the literature in
management and personnel economics that address the effects of labor turnover on firm perfor-
mance and are currently experiencing parallel evolution.
For the empirical analyses, I use data from the KfW/ZEW Start-Up Panel. This dataset is
representative of young German businesses in almost all industries and was developed jointly by
the KfW, the world’s largest national development bank, and the Centre for European Economic
Research (ZEW). Using structural identification to address methodological concerns regarding
reverse causality between worker replacement and productivity, I find that, overall, worker re-
placement has negative effects on the productivity of young firms. Groups of firms for which
worker replacement is positively related to productivity cannot be identified. The negative pro-
ductivity effect of worker replacement is stronger for firms in which the founders lack managerial
experience. Most importantly, replacements that are initiated by a young firm itself seem to
3
be as harmful for the productivity of a young firm as quits by employees. These findings are
important in management terms and suggest that the loss of tacit knowledge and adjustment
costs are very high when workers are replaced in young firms.
The remainder of this paper is organized as follows: I summarize the most relevant concepts
and the results in the related literature in Chapter 2. I develop hypotheses in Chapter 3. In
Chapter 4, I present the empirical model, data I use, and identification strategy. In Chapter 5,
I present the results. Conclusions and limitations are discussed in Chapter 6.
2 Related literature: concepts, measures, and results
While there seems to be a consensus in the management literature that labor turnover is more
negatively than positively related to a firm’s performance (Park and Shaw, 2013), there is still
an on-going discussion about the correct measure for turnover to use, the exact shape of the
relationship, the direction of causality, and the underlying mechanisms and moderators that
drive the results (Hausknecht and Holwerda, 2013; Yanadori and Kato, 2007; Shaw et al., 2005).
This leaves open questions concerning whether specific groups of firms are affected to different
extents by labor turnover and the factors that cause such differences. Despite the progress that
has been made, there is still no study that addresses the effects of labor turnover on the perfor-
mance of young firms. To the best of my knowledge, the only exception is Baron et al. (2001),
who study a sample of young high-tech firms in Silicon Valley and highlight the potentially
disruptive nature of labor turnover, especially in the early years of a firm’s existence. However,
when being included in their sample, the firms are already up to six years’ old and have at least
10 employees. The average employment size is even almost 70 employees. Thus, their sample is
highly selective and their results are hardly representative of young entrepreneurial firms.
Shaw et al. (2005) and Shaw (2011) roughly differentiate the performance measures chosen by
previous studies into “proximal” dimensions that measure the performance of the workforce di-
rectly (such as productivity or customer satisfaction) and more “distal” performance measures,
which are affected by labor turnover via the proximal outcomes (such as profits or return on as-
sets). Since no prior studies have analyzed how labor turnover affects young firms’ performance,
I concentrate on the “proximal” performance measure productivity as a first step in understand-
ing the effects of labor turnover on young firms’ performances in this paper. A proximal measure
should be less affected by additional mediating factors than should distal measures, and should
allow to identify effects of worker replacement in the most accurate way (Yanadori and Kato,
2007).
While meta-analyses (Park and Shaw, 2013) and surveys (Shaw, 2011) in the existing research
show that the effects of labor turnover on distal performance measures are clearly negative, the
picture concerning productivity or other more proximal measures is less decisive. While some
studies report a negative linear relationship between labor turnover and productivity (Baron
4
et al., 2001; Yanadori and Kato, 2007; Sels, De Winne, Maes, Delmotte, Faems and Forrier,
2006; Shaw et al., 2005; Huselid, 1995), other studies report evidence of an inverted u-shape
(Glebbeek and Bax, 2004; Muller and Peters, 2010), attenuated negative shapes (Shaw et al.
2005, Shaw et al. 2013), or no significant direct relationship at all (Sels, De Winne, Delmotte,
Maes, Faems and Forrier, 2006; Siebert and Zubanov, 2009; Arthur, 1994; Guthrie, 2001; McEl-
roy et al., 2001).
I argue that the indecisiveness concerning shorter term performance measures for established
firms might be related to two main drawbacks that have been noted in the existing research,
namely reverse causality between labor turnover and a firm’s performance, and issues concerning
the measurement of labor turnover. First, up to now, no study has dealt comprehensibly with
reverse causality between a firm’s performance and labor turnover: labor turnover could as easily
be a consequence of a firm’s poor performance rather than its cause. Yanadori and Kato (2007)
demonstrate the problem by showing that lower firm performance is a significant predictor of
higher labor turnover in their study. The problem of reverse causality is frequently addressed
as a limitation (Yanadori and Kato, 2007; Shaw et al., 2013), but is not approached beyond
the use of lagged turnover measures. Using lagged turnover rates, however, does not resolve the
issue in the event that firms act forward looking or when it takes some time to fire unproductive
employees. Thus, the problem of reverse causality could be one reason that negative effects are
more pronounced for more distal performance measures: management is more likely to react by
firing and/or replacing employees when distal measures such as profit or return on assets decline
than when productivity declines in the short run.
Second, existing management studies use either total separation rates or the voluntary (from
the perspective of the employee) separation rates of employees as measures for labor turnover.
Both measures have drawbacks (McElroy et al., 2001; Hausknecht and Holwerda, 2013). On one
hand, results for total separations and voluntary resignations are hardly comparable and differ-
ent authors have argued that more work is necessary in order to differentiate between the results
for different measures (Shaw, 2011; McElroy et al., 2001). On the other hand, separation rates
are particularly likely to be influenced by the problem of reverse causality mentioned above.
Since they also include separations due to downsizing, separation rates are by definition larger
for contracting firms with, most likely, performance that is deteriorating simultaneously. The
same is also true for voluntary quit rates, as employees are likely to leave deteriorating firms. In
line with this concern, McElroy et al. (2001) found that labor turnover is particularly harmful
in downsizing firms.
In a simultaneously evolving strand of literature that addresses the consequences of labor
turnover on firm performance in personnel economics, Burgess et al. (2000a) suggest a measure
for turnover that reduces the sensitivity to reverse causality to some extent, namely worker re-
placement (or “worker churning” in their terms). According to their notion, total labor turnover
encompasses all worker flows in and out of firms, all hirings and all separations. Worker replace-
ment isolates the part of turnover that is solely due to the replacement of existing employees and
5
thus due to re-matching between firms and employees. Hence, this turnover type is the point
at which personnel strategies of firms have the highest potential to intervene. Labor turnover
due to replacement hiring has shown to be sizeable (Hamermesh et al., 1996; Lane, Stevens and
Burgess, 1996), particularly in young firms (Haltiwanger et al., 2012). By its definition, worker
replacement is independent of changes to a firm’s size. I argue that this makes the measure par-
ticularly valuable when it comes to an analysis of new ventures. New ventures often have marked
employment growth or contraction during their first years in business. To isolate productivity
effects due to labor turnover from productivity effects due to firm growth or contraction, it seems
reasonable to concentrate on the pure replacement component.
Ilmakunnas et al. (2005) contrast the effects of total turnover with the effects of (pure) worker
replacement on (total factor) productivity in a sample of established Finnish manufacturing
firms. Total turnover (including worker flows due to hires) has an inverted u-shaped effect
on productivity, but the pure worker replacement component is strictly positively related to
productivity. Replacing employees leads to productivity gains, which the authors attribute to
an increase in the employer-employee match quality. This clearly contradicts the implications
derived from analyses of (voluntary) separation rates in management research. Unfortunately,
while Ilmakunnas et al. (2005) argue that worker replacement is less affected by reverse causality
than is total turnover they do not address this issue in more detail. Hence, the robustness of
their results also remains undetermined.
3 Theory
In the following, I build on the resource-based view of the firm (Barney, 1991) and organiza-
tional learning literature, as well as on previous literature regarding the consequences of worker
replacement in established firms, to derive a baseline hypothesis for the effects of worker replace-
ment on the productivity of young firms (Hypothesis 1). Subsequently, I derive expectations
concerning boundary conditions for this baseline hypothesis to hold on the founder and on the
firm level (Hypothesis 2 and Hypothesis 3).
The replacement of an employee involves two worker flows, one into the firm (the new employee)
and one out of the firm (the replaced employee). These worker flows have costs (loss of human
capital and adjustment costs) and benefits (inflow of new human capital and an increase in the
quality of the employer-employee match). The open question is whether the costs or the benefits
predominate with regard to the productivity of young firms.
While existing research on established firms is somewhat indecisive concerning the impact of
separation rates on productivity, it provides evidence of a positive relationship between (pure)
worker replacement and productivity. Hence, at least in the short run, the positive effects of
labor turnover seem to predominate in established firms in a significant number of cases.
I argue that this outcome is different for young firms, and that the negative effects of worker
6
replacement are also likely to prevail in young firms in the short run. This is for two reasons:
firstly, as argued above, young firms can be expected to be sensitive to high worker replacement
because of low initial qualities of employer-employee matches. Reasons for this could be that
young firms do not yet have established processes for making hiring decisions and seldom use
human capital programs (Klaas et al., 2010; Kerr et al., 2007). Thus, personnel strategies de-
pend strongly on the founder (Burton, 2001; Baron et al., 1996). If the founder lacks relevant
experience in recruiting (for example, about 30 % of the founders in the sample used in this study
had neither managerial experience as employed managers nor prior experience as entrepreneurs),
this will probably negatively affect the efficiency of the hiring process and the resulting match
quality. Hence, search and adjustment costs should be particularly high on average for young
firms and it even remains unclear whether the new hiring decisions will lead to an improvement
in match quality.
Second, whether the positive or negative consequences of worker replacement prevail should
depend on which side of the market (the employee or the employer) initiates the replacement:
in other words, whether the leaving employee resigns or is dismissed by the firm. When firms
dismiss workers and replace them, they are likely to replace employees from the bottom end of
the productivity distribution. The inflow of new human capital might therefore outweigh the
costs of the replacement (McElroy et al., 2001). When workers quit and leave, these workers
are likely to come from the top end of the productivity distribution since it should be easier
for these workers to find employment with better remuneration in other companies. Hence, the
outflow of human capital is likely to be greater than the inflow of human capital, and negative
consequences should predominate (Burgess et al., 2000a).
The latter is a particularly likely scenario in young firms. On one hand, information asymme-
tries are high when starting as an employee in a young firm and thus the initial sorting is likely
to be suboptimal. This should lead to a resolution of the match (Jovanovic, 1979). Second,
young firms are often financially restricted when competing for the best employees (Brixy et al.,
2007; Cabral and Mata, 2003). Thus, they often pay comparatively low wages, which makes it
likely that the most productive employees will leave. In summary, I argue that, on average, the
negative consequences of worker replacement prevail in young firms.
Hypothesis 1: Worker replacement negatively affects the productivity of young
firms.
Existing research on established firms in personnel economics suggests that the extent of la-
bor turnover and its impact on a firm’s performance depend on the abilities of its managers
to manage worker flows in and out of the firm (Lane, Isaac and Stevens, 1996; Burgess et al.,
2000a). The quality of the management is crucial to the quality of the employer-employee match
and determines both whether a potentially costly resolution of a match becomes necessary and
whether the replacement leads to an improvement in match quality.
7
As argued above, in young entrepreneurial firms, employment models and hiring decisions can
be expected to depend strongly on the firm’s founder (Burton, 2001; Baron et al., 1996). Man-
agerially experienced founders should be better able to prevent costly worker replacement by
ensuring good initial matches and by being able to find better new matches if worker replace-
ment still becomes necessary. Regarding different types of managerial experience Stuart and
Abetti (1990) show that, in young firms, prior management experience as an entrepreneur is of
particular importance.
By contrast, the “HRM-moderated” view of the relationship between labor turnover and firm
performance in the management literature suggests that, when firms invest more in HRM, they
have more to lose when labor turnover occurs. Hence, the use of some HRM practices was shown
to negatively moderate the relationship between labor turnover and firm performance (Arthur,
1994; Guthrie, 2001; Park and Shaw, 2013). Translating this into the context of a start-up, this
view might suggest that more experienced founders might be better able to train their employ-
ees and thus managerially experienced founders should have more to lose when these employees
need to be replaced.
I argue that, given the necessarily short average tenure of employees in a new firm, their firm-
specific capital should still be low on average and better hiring decisions - which are facilitated
through prior managerial experience, as well as prior professional networks that might be avail-
able to managerially experienced founders and facilitate recruiting - outweigh the potential
negative consequences.
Hypothesis 2: The effect of worker replacement on the productivity of a young
firm is more negative when the founder of the firm has no prior managerial or en-
trepreneurial experience.
Building on the argument of Hypothesis 2, a firm’s age can be expected to be a double-edged
sword with regard to its effects on worker replacement. On one hand, the managerial experience
of the founder increases with the increase in a firm’s age and routines for hiring decisions in a
firm become more established and formalized. At the same time, financial restrictions to offer
competitive wages decrease (Brixy et al., 2007). In addition, as a firm becomes older, more
information about the firm becomes publicly available, which decreases information asymme-
tries between the firm and its prospective employees. Thus, with the increase in the firm’s age,
the average quality of employer-employee matches should improve and the firm’s position in
the labor market should become stronger. This should help young firms to prevent unintended
worker replacement and manage worker replacement that still occurs, or is intended by the firm.
On the other hand, since hierarchies can be expected to be flat, especially at the beginning of a
firm’s life (Rajan and Zingales, 2001), the tacit knowledge accumulated by the first employees
of a young firm can be expected to be crucial for a firm’s performance. Furthermore, the value
8
of the firm-specific human and social capital of the employees to the firm should increase in
their tenure (Hausknecht and Holwerda, 2013). Since, for a start-up, a firm’s age should be
highly correlated with the job tenures of its employees, unconditional on tenure, the potential
for worker replacement to harm young firms can be expected to increase during the first years
of a firm’s existence.
It seems reasonable to assume that founders learn managerial competency at decreasing rates,
and that valuable firm-specific human capital and tacit knowledge on the employees’ side ac-
cumulate as firms start to grow during the first years of their existence. Hence, I expect that,
during the first years of a firm’s life, the firm’s age initially moderates the effect of worker re-
placement positively, but that the moderating effect attenuates as the firm grows older:
Hypothesis 3: Firm age positively moderates the effect of worker replacement on
the productivity of young firms at a decreasing rate.
4 Empirical setup
4.1 Productivity model
To assess the effects of worker replacement on (total factor) productivity, I model output as value
added (total revenues minus intermediate goods) by an augmented Cobb-Douglas production
function. I estimate the production function in the log-linear form:
lnYit = α+ βlnLit + γlnKit + ρlnWRRit +Xitθ + uit
where Y denotes real value added, L is the full-time equivalent size of the labor force, K denotes
the capital stock, and WRR denotes the worker replacement rate. X contains additional control
variables. uit represents a firm-specific and time-varying error component. Details concerning
the measurement of the variables are provided in Section 4.4 and Table 6 in the Appendix A.
4.2 Estimation & identification strategies
In addition to reverse causality between worker replacement and productivity, I consider unob-
served heterogeneity with regard to factors that might influence both worker replacement and
productivity as the main obstacle to the identification of causal effects in this study.
Estimation strategy The problem of reverse causality can be more broadly thought of as a
problem of the simultaneous determination of a decrease in a firm’s productivity and an increase
in worker replacement (Wooldridge, 2015). As a result of decreasing productivity, firms might
simultaneously produce less output and start to replace employees that they perceive as being
9

unproductive. Equivalently, employees could resign in such a situation, for example because they
anticipate lower future wages in a firm with decreasing productivity. If the expected decrease in
productivity is not controlled for in the productivity model, estimates will be biased. The litera-
ture on the estimation of production functions refers to this situation as a negative productivity
“shock” to the firm, which is not observed in the productivity model (Ackerberg et al., 2015).
A negative productivity shock - which could be anticipated by the firm but is not observed in
the model - could include a mechanical breakdown or severe local weather conditions, as well as
internal problems such as a mismatch between the firm and its employees.
Traditionally, the literature on production function estimation has been concerned with incon-
sistency of the estimates for the production factors labor and capital (see Ackerberg et al., 2006,
2015, for a survey and detailed explanations on procedures to address the endogeneity problem).
Firms are assumed to be more flexible when adjusting labor inputs than when adjusting capital
inputs, since the latter depends on longer-term investment decisions. Hence, in anticipation of a
productivity shock, firms might adjust the “variable” input of labor but not the “static” input
of capital. This would lead to biased estimates for both of these inputs. As a solution to this
problem, Levinsohn and Petrin (2003) suggest using the firm’s use of intermediate inputs in the
production process (e.g. raw materials and energy) to model the unobserved productivity shock
as a function of such intermediate inputs and the available capital stock. Intermediate inputs
are, as with labor, argued to be variably adjustable. The estimated productivity shock is then
included in the estimation of the production function to obtain unbiased estimates, net of the
influence of the productivity shock.
In this paper, I consider worker replacement as an additional component of labor input. Thus,
I transfer the arguments by Levinsohn and Petrin (2003) and Ackerberg et al. (2006, 2015) for
an identification of the effects of the variable input of labor to the identification of the effect of
worker replacement. This has been done comparably for example by Parrotta and Pozzoli (2012)
for a measure of ”learning-by-hiring” and by Iranzo et al. (2008) for a measure of worker diversity.
In order for the estimation procedure by Levinsohn and Petrin (2003) to be valid, assumptions
regarding the behavior of firms in the production process have to be made. I present technical
details regarding the estimation procedures used in this study and their assumptions in Appendix
B. The most critical assumption in the context of this study might be that firms’ choices of
labor inputs are assumed to be freely variable. In general, this might be difficult to justify
in the rigid German labor market. However, there is an exclusion from dismissal protection
for small firms in German law, which is known as the “small firm clause”: Firms that employ
10 employees or fewer are not restricted by dismissal protection. Roughly 90 % of the sample
used in this study falls under this special legislation. As a robustness check, firms that do
not fall under the small firm clause were deleted from the sample. This does not change the
results qualitatively. To address the problem more formally, I double-check the main results
for robustness using an estimation approach suggested by Ackerberg et al. (2006, 2015), who
refine the procedure suggested by Levinsohn and Petrin (2003) and relax the timing assumptions
10

concerning variable inputs. More specifically, they allow labor inputs in the production function
to influence productivity for more than one period and hence for the presence of adjustment costs
(e.g. in terms of cancellation periods). This might present a more realistic scenario regarding
the impact of employment decisions (including worker replacement) on productivity.
Control strategy for unobserved heterogeneity I control for a firm’s age and size, as well
as for the managerial, entrepreneurial, and industry experience of the firm’s founder in all the
models since these factors might affect both the productivity of young firms and how they are
able to manage worker replacement. A further obstacle to the identification of causal effects in
this study might be that the data used in this study lack information about the HRM practices
implemented by the firms in the sample. According to the HRM-moderated view discussed
earlier, the use of such practices could influence the degree of worker replacement and the pro-
ductivity of the employees (e.g. by influencing the motivation or the abilities of the employees),
and impair the identification of a causal effect of worker replacement on productivity. However,
I consider the potential bias to be very small in young firms, since their employment models
are shaped by the firms’ founders (Burton, 2001; Baron et al., 1996) and they adopt measures
such as human capital programs very infrequently (Klaas et al., 2010; Kerr et al., 2007). Hence,
I argue that such factors are reflected adequately by controlling for the human capital of the
founders, as well as a firm’s age and size.
Finally, the causes and consequences of worker replacement might differ significantly between
expanding businesses and contracting businesses, or between situations in which worker replace-
ment is caused by the firm (through a dismissal) and situations in which worker replacement
is caused by the employee (through a resignation) (Shaw et al., 2005). I address such differing
mechanisms via robustness checks.
4.3 Data
I base the empirical analyses on the first six survey waves of the KfW/ZEW Start-Up Panel,
an annual survey of newly established German firms. The KfW/ZEW Start-Up Panel is a joint
research project undertaken by the KfW-Bankengruppe, the world’s and Germany’s largest na-
tional publicly owned development bank, the Centre for European Economic Research (ZEW),
and Creditreform, Germany’s largest credit rating agency. The dataset is designed to be rep-
resentative of young German firms from almost all industries (the primary sector, the public
sector, and the energy sector are excluded) and contains information about 15,300 firms founded
between 2005 and 2012. Each year, a sample of new firms that have been founded within the
previous three years included in the dataset. In addition, a follow-up survey of firms that have
already participated in the survey is conducted in each of the subsequent years until firms are
eight years’ old or refuse to take part in the survey for two subsequent years.
The sample is a stratified random sample drawn from the population of all firm creations that
are recorded by Creditreform (see Bersch et al. (2014) for details about the population database
11
and Fryges et al. (2010) for detailed information concerning the survey design of the KfW/ZEW
Start-Up Panel). The stratification criteria are the first year of business, the industry, and
funding by the KfW. The main goal of the stratification is an oversampling of start-ups from
high-tech industries, which allows to conduct separate analyses for this group of new firms.
Stratification is controlled for by the inclusion of dummy variables for the stratification cells in
all regressions. Detailed information about the human capital of the founders, the firms’ labor
demands, and other indicators of firm performance are retrieved by computer-assisted telephone
interviews. Firms within the largest percentiles of revenues, employment sizes, and investments
are double-checked manually during the data processing to guarantee that only genuinely new
entrepreneurial ventures remain in the dataset (even if misreports by the interviewees occur).
The following restrictions and adjustments apply to the sample used in this study: Since costs of
materials can only be identified from the third survey wave onwards, I use firm-year observations
from 2009 onwards only. Since the worker replacement rate can only be derived for start-ups
with at least one dependent employee, I exclude start-ups without dependent employees from
the sample. In addition, I exclude temporary work agencies from the sample since their pro-
duction function with regard to labor inputs is not comparable to that of other firms. Including
temporary work agencies for a robustness check does not alter the results qualitatively. All
variables measured in monetary units are converted to 2010 prices using a GDP price deflator
series provided by the German Federal Statistical Office. Aggregate data for gross value added
on the federal state level is derived from data provided by the Statistical Office of the Federal
State of Baden-Wurttemberg. The estimates are based on a resulting unbalanced panel of 6224
observations of 3453 firms.
4.4 Measures
Value added (dependent variable) I measure value added as total revenues minus inter-
mediate inputs. The inspection of a histogram of the dependent variable, logarithmic real value
added, indicates that the distribution of logarithmic real value added seems to be reasonably
close to a normal distribution. Using OLS as baseline model and, at the first stage of the struc-
tural procedure suggested by Levinsohn and Petrin (2003), thus seems a justifiable choice with
regard to the distribution of the dependent variable.
Worker replacement I use a slightly adjusted version of the churning rate introduced by
Burgess et al. (2000a) to measure worker replacement. The aim of this measure is to isolate
labor turnover that is only due to worker replacement and therefore occurs in addition to the
labor turnover that occurs due to a firm’s contraction or growth. In contrast to the present paper,
Burgess et al. (2000a) study worker flows that occur in a firm at the employee level. In their
notion, the replacement of one worker leads to two churning flows: one hiring and one separation.
My focus is on the effects of worker replacement on a firm’s performance. Accordingly, I divide
the churning rate by two to get a measure for a firm’s proportion of replaced employees that is
easy to interpret at the firm level. A comparable measure has been used by Albaek and Sorensen
12
(1998), as well as by Muller and Peters (2010).
Worker Replacement Rate it =Hiringsit + Separationsit − |Hiringsit − Separationsit|
#Employeesit + #Employeesit−1
Following Burgess et al. (2000a), I measure worker flows using headcounts and divide the total
worker replacement (gross worker flows minus absolute change in employment size) by the av-
erage (dependent) employment in a given period to relate the number of replacements to the
number of employees at risk of being replaced. I consider worker flows of full- and part-time
employees subject to social security contributions as well as atypical employees (“mini-jobbers”)
since young firms might rely disproportionately on atypical forms of employment.3 I double-
checked the main results for regular full-time employees only and found the results to be robust.
Since the distribution of the worker replacement is highly skewed, I apply a logarithmic trans-
formation to the variable. To provide insights for the entire sample, including observations with
zero values for the worker replacement rate, I apply a dummy variable adjustment as performed
in Bloom et al. (2013). I set the zero values in the untransformed worker replacement rate to the
mean value of the logarithmically transformed variable and control for replaced values with a
dummy variable whenever the transformed variable is used. Using this procedure, the estimated
slope of the logarithmic worker replacement rate is independent of the value that is chosen to
set the zero values of the original worker replacement rate to. However, the estimated coefficient
of the added dummy variable that controls for the replaced values depends on the choice of
the replacement value. Hence, it cannot be interpreted meaningfully and is not reported in the
output tables.
Control variables Labor input Lit is measured as the full-time equivalent workforce size of a
firm in period t. Since founders contribute to value added, they are included in the measurement
for labor input. Following Levinsohn and Petrin (2003), a firm’s capital stock Kit in period t is
calculated as the sum of the depreciated capital stock in period t− 1 and investments in period
t. Since no detailed information on depreciation rates is available for the firms, the capital stock
of the previous period is always depreciated by 10 %. Other depreciation rates have been tested
as a robustness check and do not alter the results qualitatively.
As suggested by Burgess et al. (2000a), further control variables included in Xit are chosen to
encompass firm level, employee level and industry level factors. Details on the measurement
of all control variables are presented in Table 6 in Appendix A. Firm/founder level controls
include the logarithmic age of a firm and dummy variables indicating whether a firm is a limited
liability corporation, whether one of the founders had prior experience in the same industry, and
whether one of the founders had managerial experience as an entrepreneur or gained managerial
experience as an employee. Employee level controls include the share of employees with a uni-
3“Mini jobs” are a mode of employment in Germany where the wages of employees who earn up to a maximumof 450 EUR per month are not subject to social insurance contributions but only to a much lower lump sum.
13
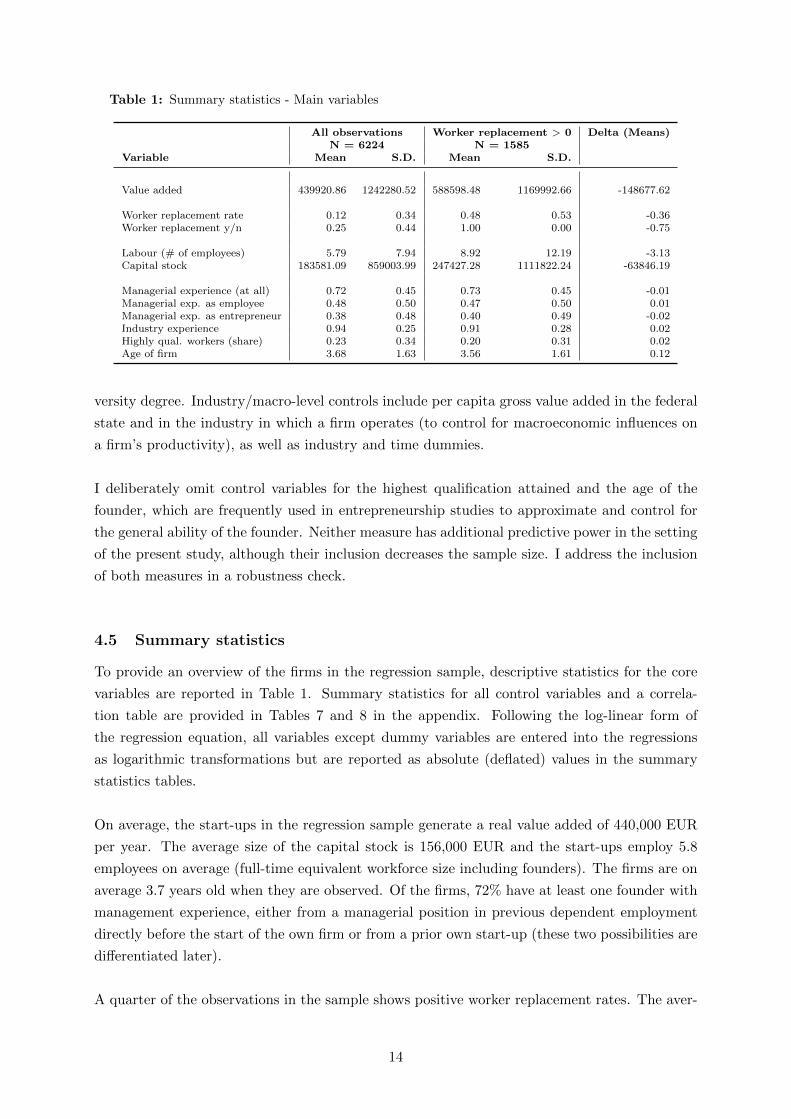
Table 1: Summary statistics - Main variables
All observations Worker replacement > 0 Delta (Means)N = 6224 N = 1585
Variable Mean S.D. Mean S.D.
Value added 439920.86 1242280.52 588598.48 1169992.66 -148677.62
Worker replacement rate 0.12 0.34 0.48 0.53 -0.36Worker replacement y/n 0.25 0.44 1.00 0.00 -0.75
Labour (# of employees) 5.79 7.94 8.92 12.19 -3.13Capital stock 183581.09 859003.99 247427.28 1111822.24 -63846.19
Managerial experience (at all) 0.72 0.45 0.73 0.45 -0.01Managerial exp. as employee 0.48 0.50 0.47 0.50 0.01Managerial exp. as entrepreneur 0.38 0.48 0.40 0.49 -0.02Industry experience 0.94 0.25 0.91 0.28 0.02Highly qual. workers (share) 0.23 0.34 0.20 0.31 0.02Age of firm 3.68 1.63 3.56 1.61 0.12
versity degree. Industry/macro-level controls include per capita gross value added in the federal
state and in the industry in which a firm operates (to control for macroeconomic influences on
a firm’s productivity), as well as industry and time dummies.
I deliberately omit control variables for the highest qualification attained and the age of the
founder, which are frequently used in entrepreneurship studies to approximate and control for
the general ability of the founder. Neither measure has additional predictive power in the setting
of the present study, although their inclusion decreases the sample size. I address the inclusion
of both measures in a robustness check.
4.5 Summary statistics
To provide an overview of the firms in the regression sample, descriptive statistics for the core
variables are reported in Table 1. Summary statistics for all control variables and a correla-
tion table are provided in Tables 7 and 8 in the appendix. Following the log-linear form of
the regression equation, all variables except dummy variables are entered into the regressions
as logarithmic transformations but are reported as absolute (deflated) values in the summary
statistics tables.
On average, the start-ups in the regression sample generate a real value added of 440,000 EUR
per year. The average size of the capital stock is 156,000 EUR and the start-ups employ 5.8
employees on average (full-time equivalent workforce size including founders). The firms are on
average 3.7 years old when they are observed. Of the firms, 72% have at least one founder with
management experience, either from a managerial position in previous dependent employment
directly before the start of the own firm or from a prior own start-up (these two possibilities are
differentiated later).
A quarter of the observations in the sample shows positive worker replacement rates. The aver-
14

age worker replacement rate is 12 % (48 % in firms with positive replacement rates). Information
about worker flows, in addition to changes in firm size, has been taken from survey questions and
is, as is all other firm-level information in this study, self-reported by the firms’ owners. Firms
with positive worker replacement rates are larger on average in terms of employment size, capital
stock, and value added than are firms with no worker replacement. Differences with regard to
firms’ age, the qualification structure of the workforce, and the experience of the founders are
minor.
The correlation table shows that there is a relatively high negative correlation between the log-
arithmic size of the workforce and the logarithmic worker replacement rate of -0.379 when the
entire sample is considered, and of -0.698 when only the positive values of worker replacement
are considered. The mean value of a variance inflation test (VIF) is 1.55 (1.76 in the restricted
sample of firms with positive worker replacement rates). Hence, the test does not indicate a
problem of multicollinearity (Kutner et al., 2004). Nonetheless, I double-check the validity of
my results for the untransformed worker replacement rate, which shows a distinctly weaker cor-
relation pattern, as a robustness check.
5 Results
Main results - Hypothesis 1 The main regression results for the full sample show that, in
general, worker replacement affects the productivity of young firms negatively (Table 2; detailed
results are provided in Table 9 in Appendix A). When I estimate the baseline model using
pooled OLS with cluster robust standard errors (columns A and C) or when using the struc-
tural approach suggested by Levinsohn and Petrin (2003) (columns B and D), the estimated
coefficient for worker replacement is negative and significant (at a 1% level). Squared worker
replacement is insignificant, which suggests a strictly negative and non-curvilinear relationship.
Estimated coefficients for labor and capital inputs are in a plausible range. Older start-ups, lim-
ited liability corporations, and start-ups of which the founders had prior managerial experience
or prior industry experience are significantly more productive.
When estimated via the structural approach, the labor coefficient decreases and the capital
coefficient increases. This is the expected effect when the endogeneity of the variable inputs
is controlled for. The estimated coefficient of worker replacement decreases only slightly, from
-0.087 to -0.074, when endogeneity is taken into account. A 1% increase in worker replacement
leads to a 0.074% decrease in value added. When I derive estimates using the structural ap-
proach suggested by Ackerberg et al. (2006, 2015), which relaxes the assumption of Levinsohn
and Petrin (2003) that labor and worker replacement are freely adjustable at any time, the
results confirm my previous findings qualitatively.4 An increase in worker replacement by one
standard deviation from the mean value (from 0.12 to 0.46) leads to an average loss in value
added of 22,000 EUR. This increase by one standard deviation corresponds to an (additional)
4The results of the robustness check are available from the author upon request.
15

Table 2: Productivity Effects of Worker Replacement - Full sample
Dependent variable: A - OLS B - Lev.Pet. C - OLS D - Lev.Pet.Value Added Coef. (S.E.) Coef. (S.E.) Coef. (S.E.) Coef. (S.E.)
Worker replacement rate (log) -0.087 (0.023)*** -0.074 (0.022)*** -0.132 (0.047)*** -0.104 (0.048)**Worker replacement sq. (log) -0.020 (0.016) -0.013 (0.017)
Capital stock 0.217 (0.014)*** 0.424 (0.076)*** 0.217 (0.014)*** 0.425 (0.075)***Labour (# of employees) 0.781 (0.022)*** 0.712 (0.023)*** 0.783 (0.022)*** 0.713 (0.023)***
Managerial experience 0.081 (0.029)*** 0.075 (0.028)*** 0.081 (0.029)*** 0.075 (0.028)***Industry experience 0.237 (0.057)*** 0.246 (0.055)*** 0.238 (0.057)*** 0.246 (0.055)***Highly qual. workers (share) 0.111 (0.043)** 0.135 (0.040)*** 0.111 (0.043)** 0.134 (0.040)***Age of firm (log) 0.107 (0.026)*** 0.092 (0.025)*** 0.107 (0.026)*** 0.092 (0.025)***Limited liability corporation 0.240 (0.029)*** 0.174 (0.028)*** 0.239 (0.029)*** 0.173 (0.028)***
Control variables Yes Yes Yes YesConstant Yes Yes Yes Yes
Observations / R-sq. 6,224 / 0.533 6,224 6,224 / 0.533 6,224
Notes: *** 1%, ** 5%, * 10%. Lev.Pet.: Estimates derived using the structural approach of Levinsohn and Petrin.Cluster robust (OLS)/bootstrapped (Lev.Pet) standard errors in parentheses. Additional control variable in allregressions: Funding by the KfW bank.
replacement of approximately one third of the workforce of a young firm. Thus, in summary, the
results strongly support Hypothesis 1, namely that worker replacement harms the productivity
of young firms.
I run several extensions and robustness checks to assess the validity of the overall negative effect
of worker replacement on the productivity of young firms. The results presented in Table 3 (Ta-
ble 10 in Appendix A for detailed results) reproduce the prior estimates when only the subset
of observations with positive worker replacement is considered. The negative effect of worker
replacement on productivity is slightly higher (-0.121 for OLS results; -0.106 for structural es-
timates) in the restricted sample but, again, no curvilinear relationship is detected. Further
extensions confirm that the negative effect of worker replacement on productivity seems to hold
across the entire distribution of the worker replacement rate (Table 11 in Appendix A). When
I include a dummy variable for positive worker replacement rates only, the estimated effect is
negative and significant at a 1% level. All else being equal, having positive worker replacement
leads to an average decrease of 6.7% in value added. When I include worker replacement without
applying a logarithmic transformation, all implications and significance levels remain unchanged.
This latter robustness check addresses concerns regarding the somewhat high correlation of log-
arithmic worker replacement with firm size and assesses the robustness of the results with regard
to the dummy variable correction for zero values of worker replacement that is applied to the
logarithmic worker replacement in the full sample.
The focus of Hypotheses 2 and 3 is on differences in the way that new ventures manage the
worker replacement that actually occurs. Therefore, I concentrate on results for firms with posi-
tive worker replacement and present the results from the full sample as a robustness check. Since
differences between pooled OLS and the structural estimates are minor for all specifications and
16
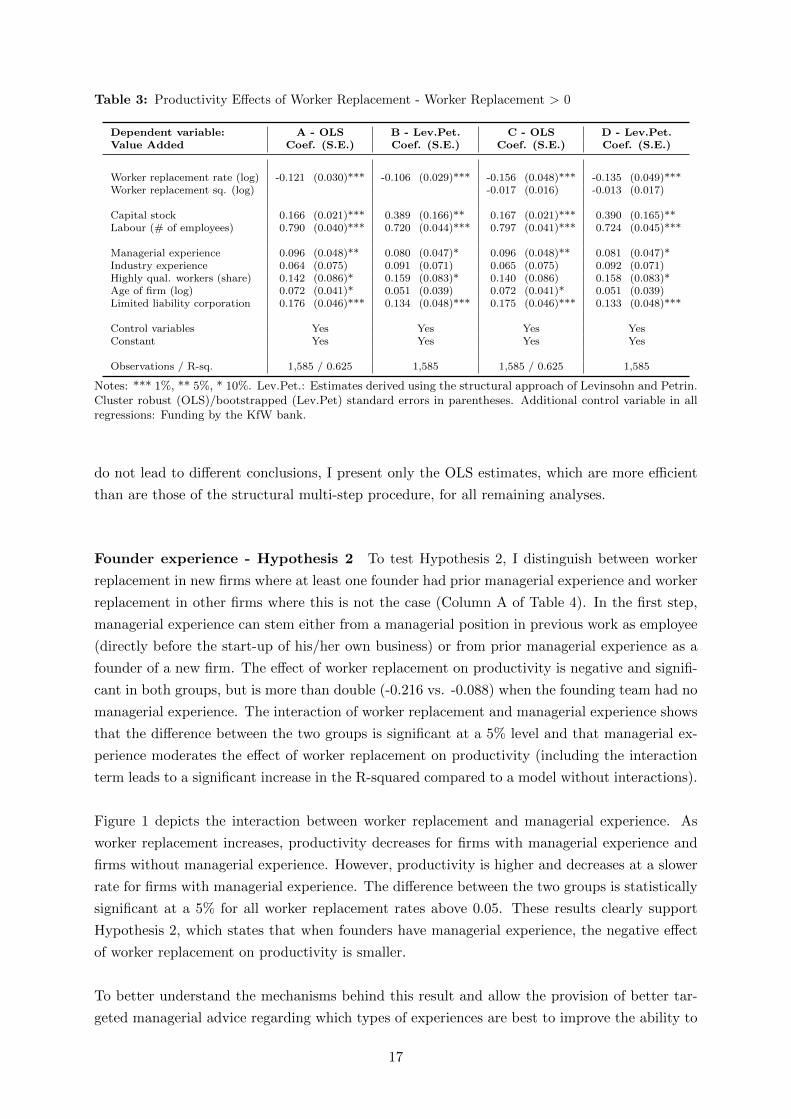
Table 3: Productivity Effects of Worker Replacement - Worker Replacement > 0
Dependent variable: A - OLS B - Lev.Pet. C - OLS D - Lev.Pet.Value Added Coef. (S.E.) Coef. (S.E.) Coef. (S.E.) Coef. (S.E.)
Worker replacement rate (log) -0.121 (0.030)*** -0.106 (0.029)*** -0.156 (0.048)*** -0.135 (0.049)***Worker replacement sq. (log) -0.017 (0.016) -0.013 (0.017)
Capital stock 0.166 (0.021)*** 0.389 (0.166)** 0.167 (0.021)*** 0.390 (0.165)**Labour (# of employees) 0.790 (0.040)*** 0.720 (0.044)*** 0.797 (0.041)*** 0.724 (0.045)***
Managerial experience 0.096 (0.048)** 0.080 (0.047)* 0.096 (0.048)** 0.081 (0.047)*Industry experience 0.064 (0.075) 0.091 (0.071) 0.065 (0.075) 0.092 (0.071)Highly qual. workers (share) 0.142 (0.086)* 0.159 (0.083)* 0.140 (0.086) 0.158 (0.083)*Age of firm (log) 0.072 (0.041)* 0.051 (0.039) 0.072 (0.041)* 0.051 (0.039)Limited liability corporation 0.176 (0.046)*** 0.134 (0.048)*** 0.175 (0.046)*** 0.133 (0.048)***
Control variables Yes Yes Yes YesConstant Yes Yes Yes Yes
Observations / R-sq. 1,585 / 0.625 1,585 1,585 / 0.625 1,585
Notes: *** 1%, ** 5%, * 10%. Lev.Pet.: Estimates derived using the structural approach of Levinsohn and Petrin.Cluster robust (OLS)/bootstrapped (Lev.Pet) standard errors in parentheses. Additional control variable in allregressions: Funding by the KfW bank.
do not lead to different conclusions, I present only the OLS estimates, which are more efficient
than are those of the structural multi-step procedure, for all remaining analyses.
Founder experience - Hypothesis 2 To test Hypothesis 2, I distinguish between worker
replacement in new firms where at least one founder had prior managerial experience and worker
replacement in other firms where this is not the case (Column A of Table 4). In the first step,
managerial experience can stem either from a managerial position in previous work as employee
(directly before the start-up of his/her own business) or from prior managerial experience as a
founder of a new firm. The effect of worker replacement on productivity is negative and signifi-
cant in both groups, but is more than double (-0.216 vs. -0.088) when the founding team had no
managerial experience. The interaction of worker replacement and managerial experience shows
that the difference between the two groups is significant at a 5% level and that managerial ex-
perience moderates the effect of worker replacement on productivity (including the interaction
term leads to a significant increase in the R-squared compared to a model without interactions).
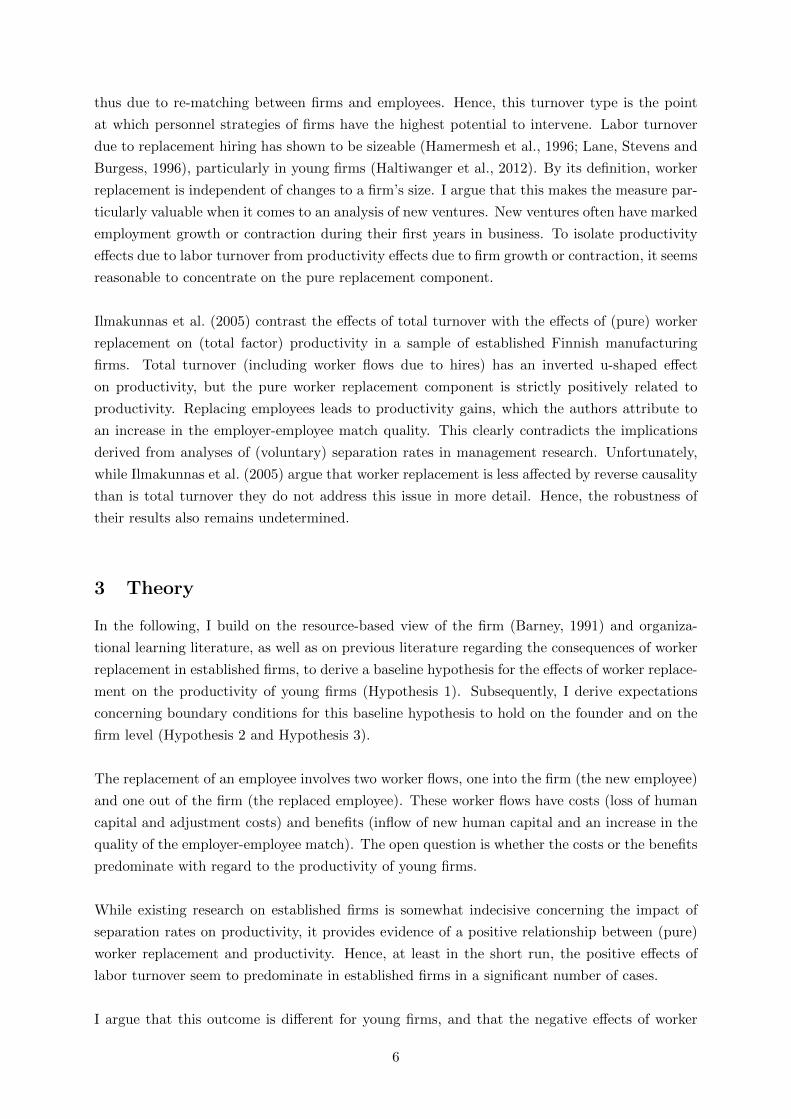
Figure 1 depicts the interaction between worker replacement and managerial experience. As
worker replacement increases, productivity decreases for firms with managerial experience and
firms without managerial experience. However, productivity is higher and decreases at a slower
rate for firms with managerial experience. The difference between the two groups is statistically
significant at a 5% for all worker replacement rates above 0.05. These results clearly support
Hypothesis 2, which states that when founders have managerial experience, the negative effect
of worker replacement on productivity is smaller.
To better understand the mechanisms behind this result and allow the provision of better tar-
geted managerial advice regarding which types of experiences are best to improve the ability to
17
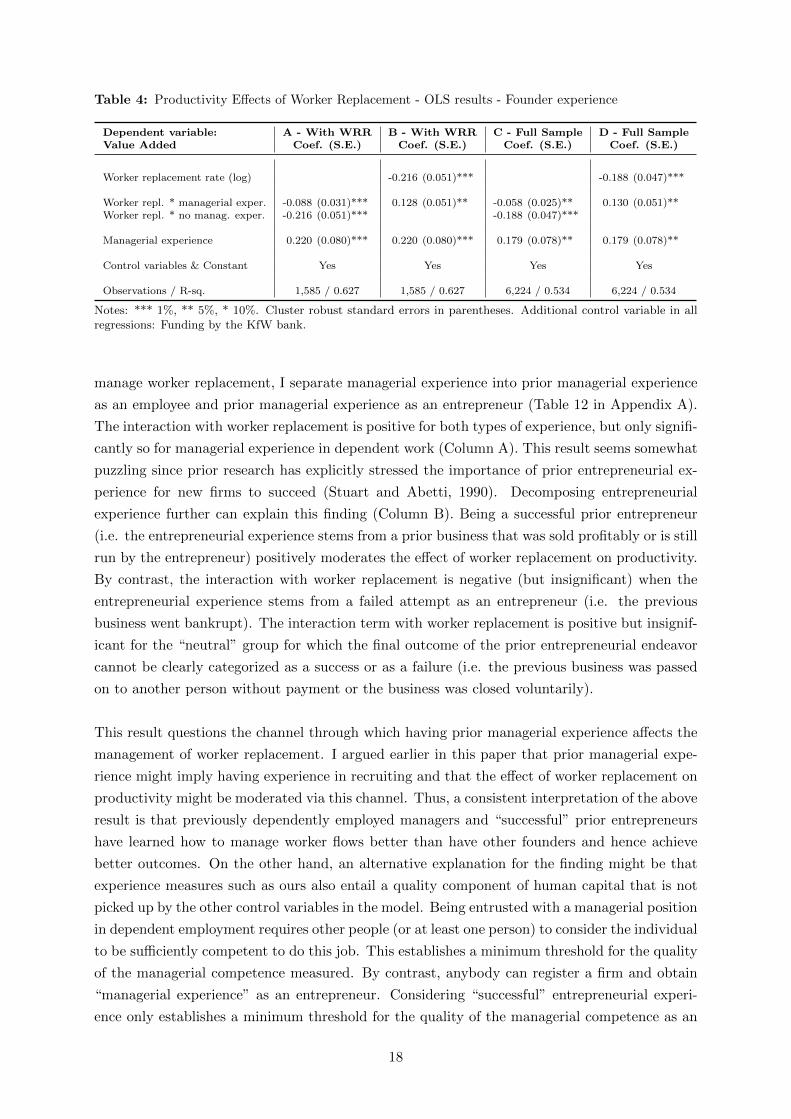
Table 4: Productivity Effects of Worker Replacement - OLS results - Founder experience
Dependent variable: A - With WRR B - With WRR C - Full Sample D - Full SampleValue Added Coef. (S.E.) Coef. (S.E.) Coef. (S.E.) Coef. (S.E.)
Worker replacement rate (log) -0.216 (0.051)*** -0.188 (0.047)***
Worker repl. * managerial exper. -0.088 (0.031)*** 0.128 (0.051)** -0.058 (0.025)** 0.130 (0.051)**Worker repl. * no manag. exper. -0.216 (0.051)*** -0.188 (0.047)***
Managerial experience 0.220 (0.080)*** 0.220 (0.080)*** 0.179 (0.078)** 0.179 (0.078)**
Control variables & Constant Yes Yes Yes Yes
Observations / R-sq. 1,585 / 0.627 1,585 / 0.627 6,224 / 0.534 6,224 / 0.534
Notes: *** 1%, ** 5%, * 10%. Cluster robust standard errors in parentheses. Additional control variable in allregressions: Funding by the KfW bank.
manage worker replacement, I separate managerial experience into prior managerial experience
as an employee and prior managerial experience as an entrepreneur (Table 12 in Appendix A).
The interaction with worker replacement is positive for both types of experience, but only signifi-
cantly so for managerial experience in dependent work (Column A). This result seems somewhat
puzzling since prior research has explicitly stressed the importance of prior entrepreneurial ex-
perience for new firms to succeed (Stuart and Abetti, 1990). Decomposing entrepreneurial
experience further can explain this finding (Column B). Being a successful prior entrepreneur
(i.e. the entrepreneurial experience stems from a prior business that was sold profitably or is still
run by the entrepreneur) positively moderates the effect of worker replacement on productivity.
By contrast, the interaction with worker replacement is negative (but insignificant) when the
entrepreneurial experience stems from a failed attempt as an entrepreneur (i.e. the previous
business went bankrupt). The interaction term with worker replacement is positive but insignif-
icant for the “neutral” group for which the final outcome of the prior entrepreneurial endeavor
cannot be clearly categorized as a success or as a failure (i.e. the previous business was passed
on to another person without payment or the business was closed voluntarily).
This result questions the channel through which having prior managerial experience affects the
management of worker replacement. I argued earlier in this paper that prior managerial expe-
rience might imply having experience in recruiting and that the effect of worker replacement on
productivity might be moderated via this channel. Thus, a consistent interpretation of the above
result is that previously dependently employed managers and “successful” prior entrepreneurs
have learned how to manage worker flows better than have other founders and hence achieve
better outcomes. On the other hand, an alternative explanation for the finding might be that
experience measures such as ours also entail a quality component of human capital that is not
picked up by the other control variables in the model. Being entrusted with a managerial position
in dependent employment requires other people (or at least one person) to consider the individual
to be sufficiently competent to do this job. This establishes a minimum threshold for the quality
of the managerial competence measured. By contrast, anybody can register a firm and obtain
“managerial experience” as an entrepreneur. Considering “successful” entrepreneurial experi-
ence only establishes a minimum threshold for the quality of the managerial competence as an
18

Figure 1: Effect of managerial experience over worker replacement rate
1111
.512
12.5
13V
alue
Add
ed (l
inea
r pre
dict
ion)
0 0.25 0.5 1 2 3 4 5 6Worker replacement rate
Without Managerial experience With Managerial experience
Notes: Including 95% confidence intervals.
entrepreneur as well. Hence, the estimates might measure a composite effect of experience and
general ability, and may thus impair the identification of a causal effect of managerial experience
on the relationship between worker replacement and productivity. However, having managerial
experience as an employee or having experience as a successful entrepreneur would still remain
valid signals that a founder is able to manage worker replacement better than can other founders.
To rule out the alternative explanation, I ran two robustness checks. First, I added a dummy
variable for founders with a university degree as a measure of general ability and interacted
the dummy with worker replacement. Second, I repeated the robustness check with the age of
the oldest founder as a general ability measure. In both cases, the main effects of the ability
measures and the interactions are insignificant. Hence, I regard it as unlikely that the results
for Hypothesis 2 are driven by differences in ability rather than in experience.
Firm age - Hypothesis 3 To test Hypothesis 3, I divide the young firms in the sample
into three age groups: “very young” firms (below the 25th percentile of the age distribution
of the sample - below 2.4 years of age), “middle-aged” young firms (within the 25th and the
75th percentile of the age distribution) and “old” young firms (above the 75th percentile of the
age distribution - above 4.9 years of age). The results are shown in Table 5. The effect of
worker replacement on productivity is negative and significant in all three age groups, but is
largest for very young firms (columns A and C). In contrast to the remarkable decrease in the
negative effect of worker replacement as firms change from being very young firms to becoming
19
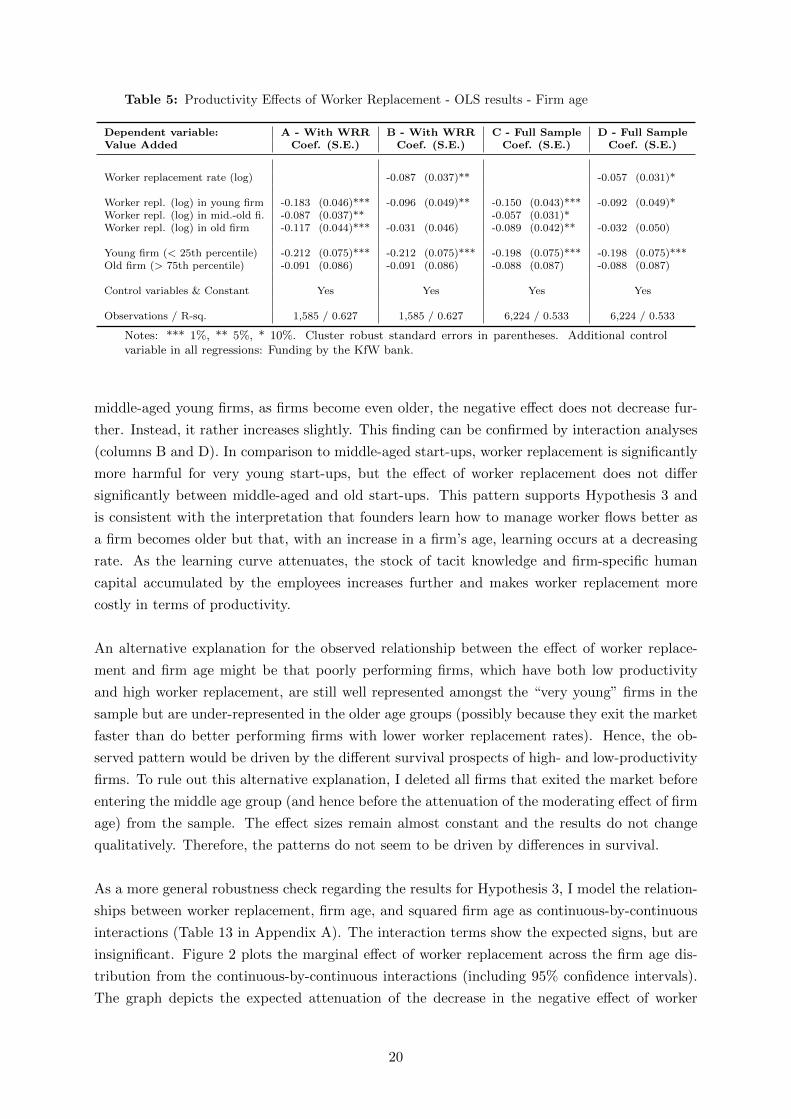
Table 5: Productivity Effects of Worker Replacement - OLS results - Firm age
Dependent variable: A - With WRR B - With WRR C - Full Sample D - Full SampleValue Added Coef. (S.E.) Coef. (S.E.) Coef. (S.E.) Coef. (S.E.)
Worker replacement rate (log) -0.087 (0.037)** -0.057 (0.031)*
Worker repl. (log) in young firm -0.183 (0.046)*** -0.096 (0.049)** -0.150 (0.043)*** -0.092 (0.049)*Worker repl. (log) in mid.-old fi. -0.087 (0.037)** -0.057 (0.031)*Worker repl. (log) in old firm -0.117 (0.044)*** -0.031 (0.046) -0.089 (0.042)** -0.032 (0.050)
Young firm (< 25th percentile) -0.212 (0.075)*** -0.212 (0.075)*** -0.198 (0.075)*** -0.198 (0.075)***Old firm (> 75th percentile) -0.091 (0.086) -0.091 (0.086) -0.088 (0.087) -0.088 (0.087)
Control variables & Constant Yes Yes Yes Yes
Observations / R-sq. 1,585 / 0.627 1,585 / 0.627 6,224 / 0.533 6,224 / 0.533
Notes: *** 1%, ** 5%, * 10%. Cluster robust standard errors in parentheses. Additional controlvariable in all regressions: Funding by the KfW bank.
middle-aged young firms, as firms become even older, the negative effect does not decrease fur-
ther. Instead, it rather increases slightly. This finding can be confirmed by interaction analyses
(columns B and D). In comparison to middle-aged start-ups, worker replacement is significantly
more harmful for very young start-ups, but the effect of worker replacement does not differ
significantly between middle-aged and old start-ups. This pattern supports Hypothesis 3 and
is consistent with the interpretation that founders learn how to manage worker flows better as
a firm becomes older but that, with an increase in a firm’s age, learning occurs at a decreasing
rate. As the learning curve attenuates, the stock of tacit knowledge and firm-specific human
capital accumulated by the employees increases further and makes worker replacement more
costly in terms of productivity.
An alternative explanation for the observed relationship between the effect of worker replace-
ment and firm age might be that poorly performing firms, which have both low productivity
and high worker replacement, are still well represented amongst the “very young” firms in the
sample but are under-represented in the older age groups (possibly because they exit the market
faster than do better performing firms with lower worker replacement rates). Hence, the ob-
served pattern would be driven by the different survival prospects of high- and low-productivity
firms. To rule out this alternative explanation, I deleted all firms that exited the market before
entering the middle age group (and hence before the attenuation of the moderating effect of firm
age) from the sample. The effect sizes remain almost constant and the results do not change
qualitatively. Therefore, the patterns do not seem to be driven by differences in survival.
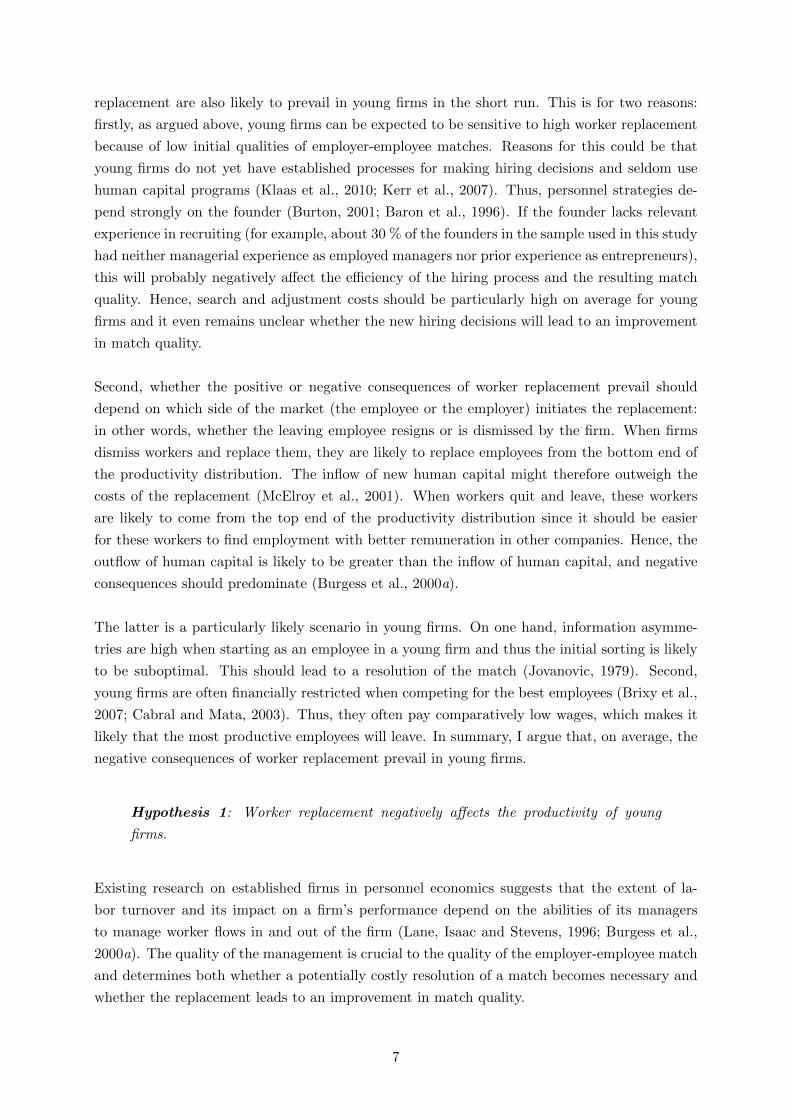
As a more general robustness check regarding the results for Hypothesis 3, I model the relation-
ships between worker replacement, firm age, and squared firm age as continuous-by-continuous
interactions (Table 13 in Appendix A). The interaction terms show the expected signs, but are
insignificant. Figure 2 plots the marginal effect of worker replacement across the firm age dis-
tribution from the continuous-by-continuous interactions (including 95% confidence intervals).
The graph depicts the expected attenuation of the decrease in the negative effect of worker
20

Figure 2: Marginal effect of worker replacement across firm age
-.4-.3
-.2-.1
0.1
Mar
gina
l Eff
ect o
f Wor
ker R
epla
cem
ent (
log)
11 2 3 4 5 6 7 8Firm age in years
Notes: Including a 95% confidence interval.
replacement as firms become older. The continuous-by-continuous interactions are probably
rendered insignificant since estimates for both the youngest and the oldest firms in the sample
are rather noisy. Hence, the overall patterns in the data are suggestive of Hypothesis 3 but, since
the continuous-by-continuous interactions lack significance, Hypothesis 3 cannot be confirmed
unequivocally.
Further robustness checks In further robustness checks, I differentiate between various
mechanisms that can cause worker replacement and test the consistency of the negative overall
effect of worker replacement in several sub-groups of the sample (Table 14 in Appendix A).
First, to test whether basis effects in the worker replacement rate for very small firms bias the
results, I distinguish between the effects of worker replacement above and below the sample me-
dian in terms of employment size. The estimated effect of worker replacement for smaller firms
is slightly higher but less significant than it is for older firms. The difference is not significant;
thus, basis effects do not seem to be a major problem.
Second, prior research has shown that the frequency and the consequences of worker replacement
in established firms vary among industries (Burgess et al., 2000a; Lane, Isaac and Stevens, 1996)
and that worker replacement is higher in service than it is in manufacturing industries. Sectoral
differences seem reasonable since tacit knowledge, which is lost due to the replacement of an
employee, can be expected to be of greater or lesser importance depending on the industry. To
rule out the negative overall effect being driven only by some sectors and to allow the provision
21
of managerial advice that is targeted more appropriately, I distinguish between effects of worker
replacement on firms in manufacturing industries (including construction) versus service indus-
tries (including retailers), as well as between firms in knowledge-intensive and other industries.
The effect of worker replacement is negative, significant, and of comparable magnitude for all
the sub-groups. Hence, worker replacement seems to be harmful to firms’ productivity across
and within industries.
Third, one might expect the negative overall effect of worker replacement on productivity to
be driven by contracting firms. Differentiating the effects of worker replacement in contracting,
steady, and growing firms shows that this is not the case. The negative effect is almost equal
for all three types of firms. This is in line with Burgess et al. (2000a), who showed that fast
growth can be a driver of worker replacement. These authors argue that fast growth leads to
a decrease in the quality of every single match, which triggers subsequent and costly replacement.
Fourth, two possible general explanations are in line with the observed negative effect of worker
replacement on productivity. On one hand, the negative effect might stem from employees
choosing to leave. As argued earlier in this paper, it seems reasonable to assume that the most
productive employees are the first to leave a firm voluntarily and that young firms might find
it difficult to replace this outflow equivalently. On the other hand, the negative productivity
effect could stem from the replacement of employees who were dismissed by the firm. The neg-
ative effect would then reflect an underestimation of the adjustment costs associated with the
replacements. Both explanations seem to be within the realm of possibility in the context of
young firms that have a comparatively weak position in the labor market and limited experience
of recruitment. The information in the data allows addressing the issue for the purposes of a
robustness check. For firms that were surveyed for the year 2012, the questionnaire contained
questions about the number of separations that were resignations and on the number of sep-
arations that were dismissals. Using this information reduces the size of the sample strongly.
When I distinguish between worker replacement in firms with more resignations compared to
dismissals and worker replacement in firms with more (or an equal amount of) dismissals com-
pared to resignations, the effect is negative and of comparable magnitude in both parts of the
sample, but is only significant in the part where there are more resignations. By contrast, when
I further restrict the sample to firms that only had dismissals and firms that only had resig-
nations, the negative effect is somewhat larger and is only significant for firms that only had
dismissals. However, the difference between the two groups is not significant in either case. In
summary, the robustness check does not suggest that either worker replacement triggered by
resignations or worker replacement triggered by dismissals is more harmful, but that both have
a similarly negative effect on young firms.
6 Concluding discussion
In this paper, I show that the overall effect of worker replacement on the productivity of young
firms is negative. This result is independent of the extent of the observed worker replacement
22

and I do not find any conditions under which worker replacement triggers statistically significant
positive effects on young firms’ productivity. The negative productivity effects are particularly
strong when founders lack managerial experience and new businesses are still very young. Most
importantly, even when worker replacements are initiated by the firms themselves, the impact
on the firm performance remains significantly negative.
A 1% increase in worker replacement is associated with a decrease in value added of 0.074%.
A more easily catchable example might be the following: If the median employment size young
firm in the sample (with three employees) replaces (or has to replace) one of its three employees
during a given period, this is associated with an average loss in value added of approximately
22,000 EUR. The losses are more than twice as large for firms in which the founders have no
managerial experience. These losses only encompass short-term costs in terms of productivity.
Since research on established firms suggests that worker replacement is negatively associated
with longer term performance measures, the total costs of worker replacement in the long run
can be expected to be even higher.
The negative effect of worker replacement on young firm performance has two main explana-
tions, namely the comparatively weak position of young firms in the labor market and defi-
ciencies of young firms to secure good employer-employee matches. It is interesting that prior
managerial experience in dependent work and prior experience as a successful entrepreneur are
both effective sources of managerial competence for young firms (as far as the management of
worker replacement is concerned). However, founders who were not successful in their previous
entrepreneurial attempts do not manage worker replacement better than completely inexpe-
rienced founders. This suggests that prior entrepreneurial attempts are best understood as
trial-and-error or learning processes and that being a successful prior entrepreneur can serve
as signal that learning was successful. In line with my theoretical expectations, the empirical
analyses in this paper also provide some suggestive (although not robust) evidence that worker
replacement becomes less disruptive, but never positively associated with productivity, as firms
become older. Increases in financial resources to retain productive employees and entrepreneurs
experience in managing worker flows lead to an initial decrease in the negative consequences of
worker replacement. However, as firms continue to age, losses of firm-specific capital and tacit
knowledge due to worker replacement seem to play an increasing role and offset the positively
moderating effect of firm age.
For young firms, a firm’s age is likely to be correlated with its employees’ job tenure. Therefore,
an interesting starting point for future research would be to disentangle how firm age and how
individuals’ job tenures, and thus their accumulated tacit knowledge, moderate the relationship
between worker replacement and the productivity of young firms. In addition, a more thor-
ough analysis on the level of the individuals who are replaced, which is beyond the scope of the
present study, would be important to better understand the effects of worker replacement on
firm performance. Hence, the results of the present study call for an identification of further
moderating effects at the individual level of the employees in further research.
23

In addition, while I use a structural estimation model for production functions to ensure that
my results are not driven by an endogenous relationship between worker replacement and pro-
ductivity, limitations remain. Most importantly, while I can approximate and control for the
use of human resource management practices by the firms in the sample, I cannot disentangle
the effects of different HRM practices that may have been used. Since my results show that
managerially experienced founders are more successful in avoiding the negative consequences of
worker replacement, identifying the best management practices to prevent the negative conse-
quences of worker replacement in young firms would be an additional interesting starting point
for future research.
Important managerial guidelines and policy advice can be derived from my results. First, the
continuous replacement of employees is not a favorable equilibrium personnel strategy for young
firms. Instead, worker replacement seems to disrupt the development of young firms and should
be avoided. Second, the managerial staff of start-ups should carefully select their first employ-
ees and consider increasing the efforts made to avoid worker replacement. A useful path for
founders/managers to take might be to develop or reconsider their firms’ strategies to increase
the job embeddedness of their employees. Particularly for founders without prior managerial
experience or with a previous failure in an entrepreneurial enterprise, it might be worth con-
sidering seeking the assistance of personnel consultants to develop better hiring and human
resource management strategies. For policy makers, it is important to note that young en-
trepreneurial firms, which seem to be of major interest from a policy perspective, suffer strongly
from worker replacement. Since the detrimental effects stem mainly from managerially inexpe-
rienced founders, a useful strategy might be to improve entrepreneurial education and shift the
focus in entrepreneurship courses to skills such as personnel management.
References
Ackerberg, D. A., Caves, K. and Frazer, G. (2006), Structural identification of productionfunctions, MPRA Paper 38349, University Library of Munich, Germany.
Ackerberg, D. A., Caves, K. and Frazer, G. (2015), ‘Identification properties of recent productionfunction estimators’, Econometrica 83(6), 2411–2451.
Albaek, K. and Sorensen, B. E. (1998), ‘Worker flows and job flows in Danish manufacturing,1980-91’, The Economic Journal 108(451), 1750–1771.
Arthur, J. B. (1994), ‘Effects of human resource systems on manufacturing performance andturnover’, Academy of Management Journal 37(3), 670–687.
Barney, J. (1991), ‘Firm resources and sustained competitive advantage’, Journal of Management17(1), 99–120.
Baron, J. N., Burton, M. D. and Hannan, M. T. (1996), ‘The road taken: Origins and evolutionof employment systems in emerging companies’, Industrial and Corporate Change 5(2), 239–275.
24
Baron, J. N., Hannan, M. T. and Burton, M. D. (2001), ‘Labor pains: Change in organizationalmodels and employee turnover in young, high-tech firms’, American Journal of Sociology106(4), 960–1012.
Bersch, J., Gottschalk, S., Muller, B. and Niefert, M. (2014), The Mannheim Enterprise Panel(MUP) and Firm Statistics for Germany, Technical Report 14-104.
Brixy, U., Kohaut, S. and Schnabel, C. (2007), ‘Do newly founded firms pay lower wages? firstevidence from Germany.’, Small Business Economics 29(1/2), 161–171.
Burgess, S., Lane, J. and Stevens, D. (2000a), ‘Job flows, worker flows, and churning’, Journalof Labor Economics 18(3), 473 – 502.
Burgess, S., Lane, J. and Stevens, D. (2000b), ‘The reallocation of labour and the lifecycle offirms’, Oxford Bulletin of Economics and Statistics 62(5), 885–907.
Burton, M. D. (2001), ‘The company they keep: Founders’ models for organizing new firms’,Cornell Unversity Articles & Chapters .
Cabral, L. M. B. and Mata, J. (2003), ‘On the evolution of the firm size distribution: Facts andtheory’, The American Economic Review 93(4), 1075 – 1090.
Corredoira, R. A. and Rosenkopf, L. (2010), ‘Should auld acquaintance be forgot? the reversetransfer of knowledge through mobility ties’, Strategic Management Journal 31(2), 159–181.
Fryges, H., Gottschalk, S. and Kohn, K. (2010), ‘The KfW/ZEW Start-up Panel: Designand research potential’, Schmollers Jahrbuch/Journal of Applied Social Sciences Studies130(1), 117–131.
Glebbeek, A. C. and Bax, E. H. (2004), ‘Is high employee turnover really harmful? an empiricaltest using company records’, Academy of Management Journal 47(2), 277–286.
Guthrie, J. P. (2001), ‘High-involvement work practices, turnover, and productivity: Evidencefrom new zealand’, Academy of Management Journal 44(1), 180–190.
Haltiwanger, J., Hyatt, H., McEntarfer, E. and Sousa, L. (2012), ‘Job creation, worker churning,and wages at young businesses: Seventh in a series of reports using data from the U.S. CensusBureau’s Business Dynamics Statistics’, Ewing Marion Kauffman Foundation .
Hamermesh, D. S., Hassink, W. H. J. and van Ours, J. (1996), ‘Job turnover and labor turnover:A taxonomy of employment dynamics’, Annales d’Economie et de Statistique (41-42), 21–40.
Hausknecht, J. P. and Holwerda, J. A. (2013), ‘When does employee turnover matter? Dy-namic member configurations, productive capacity, and collective performance’, OrganizationScience 24(1), 210–225.
Huselid, M. A. (1995), ‘The impact of human resource management practices on turnover, pro-ductivity, and corporate financial performance’, Academy of Management Journal 38(3), 635–672.
Ilmakunnas, P., Maliranta, M. and Vainiomki, J. (2005), ‘Worker turnover and productivitygrowth’, Applied Economics Letters 12(7), 395 – 398.
Iranzo, S., Schivardi, F. and Tosetti, E. (2008), ‘Skill dispersion and firm productivity: Ananalysis with employer-employee matched data’, Journal of Labor Economics 26(2), 247–285.
Jovanovic, B. (1979), ‘Job matching and the theory of turnover’, Journal of Political Economy87(5), 972 – 990.
25

Kerr, G., Way, S. A. and Thacker, J. (2007), ‘Performance, HR practices and the HR managerin small entrepreneurial firms’, Journal of Small Business & Entrepreneurship 20(1), 55–68.
Klaas, B. S., Klimchak, M., Semadeni, M. and Holmes, J. J. (2010), ‘The adoption of humancapital services by small and medium enterprises: A diffusion of innovation perspective’,Journal of Business Venturing 25(4), 349 – 360.
Kutner, M. H., Nachtsheim, C. and Neter, J. (2004), Applied linear regression models, McGraw-Hill/Irwin.
Lane, J. I., Isaac, A. G. and Stevens, D. W. (1996), ‘Firm heterogeneity and worker turnover’,Review of Industrial Organization 11(3), 275–291.
Lane, J., Stevens, D. and Burgess, S. (1996), ‘Worker and job flows’, Economics Letters51(1), 109 – 113.
Levinsohn, J. and Petrin, A. (2003), ‘Estimating production functions using inputs to controlfor unobservables’, Review of Economic Studies 70(2), 317 – 341.
McElroy, J. C., Morrow, P. C. and Rude, S. N. (2001), ‘Turnover and organizational perfor-mance: A comparative analysis of the effects of voluntary, involuntary, and reduction-in-forceturnover.’, Journal of Applied Psychology 86(6), 1294.
Muller, K. and Peters, B. (2010), Churning of R&D personnel and innovation, Center for Euro-pean Economic Research Discussion Paper 10-032.
Nickell, S. (1986), ‘Dynamic models of labour demand’, Handbook of Labor Economics 1, 473–522.
Park, T.-Y. and Shaw, J. D. (2013), ‘Turnover rates and organizational performance: A meta-analysis.’, Journal of Applied Psychology 98(2), 268.
Parrotta, P. and Pozzoli, D. (2012), ‘The effect of learning by hiring on productivity’, TheRAND Journal of Economics 43(1), 167–185.
Petrin, A., Poi, B. P. and Levinsohn, J. (2004), ‘Production function estimation in Stata usinginputs to control for unobservables’, Stata Journal 4(2), 113 – 123.
Phillips, D. J. (2002), ‘A genealogical approach to organizational life chances: The parent-progeny transfer among Silicon Valley law firms, 1946–1996’, Administrative Science Quarterly47(3), 474–506.
Rajan, R. G. and Zingales, L. (2001), ‘The firm as a dedicated hierarchy: A theory of the originsand growth of firms’, The Quarterly Journal of Economics 116(3), 805–851.
Rosenkopf, L. and Almeida, P. (2003), ‘Overcoming local search through alliances and mobility’,Management Science 49(6), 751–766.
Sels, L., De Winne, S., Delmotte, J., Maes, J., Faems, D. and Forrier, A. (2006), ‘LinkingHRM and small business performance: An examination of the impact of HRM intensity onthe productivity and financial performance of small businesses’, Small Business Economics26(1), 83–101.
Sels, L., De Winne, S., Maes, J., Delmotte, J., Faems, D. and Forrier, A. (2006), ‘Unravelling theHRM–Performance link: Value-creating and cost-increasing effects of small business HRM’,Journal of Management Studies 43(2), 319–342.
26

Shaw, J. D. (2011), ‘Turnover rates and organizational performance review, critique, and researchagenda’, Organizational Psychology Review 1(3), 187–213.
Shaw, J. D., Gupta, N. and Delery, J. E. (2005), ‘Alternative conceptualizations of the relation-ship between voluntary turnover and organizational performance’, Academy of ManagementJournal 48(1), 50–68.
Shaw, J. D., Park, T.-Y. and Kim, E. (2013), ‘A resource-based perspective on human capitallosses, HRM investments, and organizational performance’, Strategic Management Journal34(5), 572–589.
Siebert, W. S. and Zubanov, N. (2009), ‘Searching for the optimal level of employee turnover:A study of a large UK retail organization’, Academy of Management Journal 52(2), 294–313.
Stuart, R. W. and Abetti, P. A. (1990), ‘Impact of entrepreneurial and management experienceon early performance’, Journal of Business Venturing 5(3), 151–162.
Wezel, F. C., Cattani, G. and Pennings, J. M. (2006), ‘Competitive implications of interfirmmobility’, Organization Science 17(6), 691–709.
Wooldridge, J. (2015), Introductory Econometrics: A Modern Approach, Nelson Education.
Yanadori, Y. and Kato, T. (2007), ‘Average employee tenure, voluntary turnover ratio, andlabour productivity: Evidence from Japanese firms’, The International Journal of HumanResource Management 18(10), 1841–1857.
27

A Appendix: Tables
Table 6: Derivation of Measures - Details
Variable Unit Construction
Value added log Total revenue - intermediate consumption (material inputs)
Worker replacement rate log See main Text
Labour (# of employees) log Full-time equivalent size of the workforce including the founders.
Capital log Sum of the depreciated capital stock of the last period and in-vestments in the current period (depriciation rate is 10 %).
Intermediate inputs log Costs for materials, energy, and other inputs (e.g. semifinishedproducts or merchandise). Used to derive value added and tomodel unobserved productivity shocks following Levinsohn andPetrin (2003) and Ackerberg et al. (2015).
Managerial experience as employee y/n One if the founder (or at least one founder in the team) tran-sitioned from a managerial or executive position in private orpublic company.
Entrepreneurial experience y/n One if the founder (or at least one founder in the team) startedup an own company before.
Managerial experience y/n One if the founder (or at least one founder in the team) haseither managerial experience as employee or entrepreneurial ex-perience.
Industry experience y/n One if the founder (or at least one founder in the team) has priorexperience in the industry of the startup (industry digit level isundefined in the question).
Highly qual. workers (share) share Share of dependent employees with tertiary degree.
28
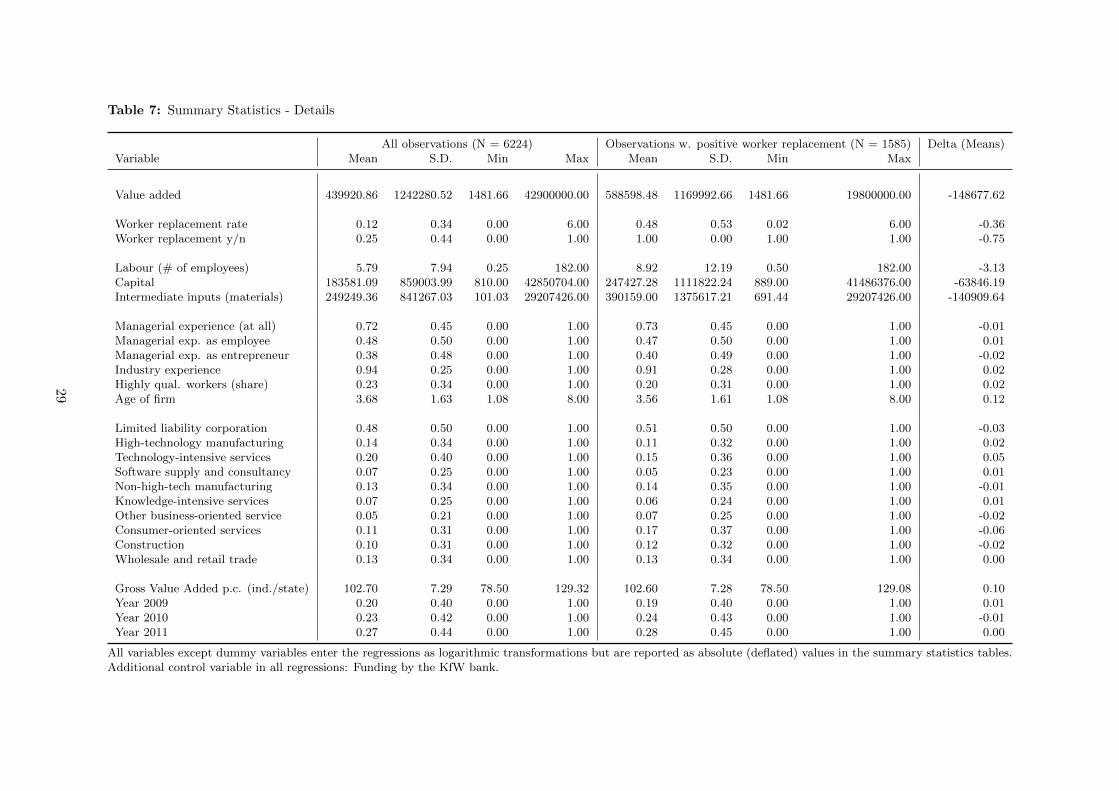
Table 7: Summary Statistics - Details
All observations (N = 6224) Observations w. positive worker replacement (N = 1585) Delta (Means)Variable Mean S.D. Min Max Mean S.D. Min Max
Value added 439920.86 1242280.52 1481.66 42900000.00 588598.48 1169992.66 1481.66 19800000.00 -148677.62
Worker replacement rate 0.12 0.34 0.00 6.00 0.48 0.53 0.02 6.00 -0.36Worker replacement y/n 0.25 0.44 0.00 1.00 1.00 0.00 1.00 1.00 -0.75
Labour (# of employees) 5.79 7.94 0.25 182.00 8.92 12.19 0.50 182.00 -3.13Capital 183581.09 859003.99 810.00 42850704.00 247427.28 1111822.24 889.00 41486376.00 -63846.19Intermediate inputs (materials) 249249.36 841267.03 101.03 29207426.00 390159.00 1375617.21 691.44 29207426.00 -140909.64
Managerial experience (at all) 0.72 0.45 0.00 1.00 0.73 0.45 0.00 1.00 -0.01Managerial exp. as employee 0.48 0.50 0.00 1.00 0.47 0.50 0.00 1.00 0.01Managerial exp. as entrepreneur 0.38 0.48 0.00 1.00 0.40 0.49 0.00 1.00 -0.02Industry experience 0.94 0.25 0.00 1.00 0.91 0.28 0.00 1.00 0.02Highly qual. workers (share) 0.23 0.34 0.00 1.00 0.20 0.31 0.00 1.00 0.02Age of firm 3.68 1.63 1.08 8.00 3.56 1.61 1.08 8.00 0.12
Limited liability corporation 0.48 0.50 0.00 1.00 0.51 0.50 0.00 1.00 -0.03High-technology manufacturing 0.14 0.34 0.00 1.00 0.11 0.32 0.00 1.00 0.02Technology-intensive services 0.20 0.40 0.00 1.00 0.15 0.36 0.00 1.00 0.05Software supply and consultancy 0.07 0.25 0.00 1.00 0.05 0.23 0.00 1.00 0.01Non-high-tech manufacturing 0.13 0.34 0.00 1.00 0.14 0.35 0.00 1.00 -0.01Knowledge-intensive services 0.07 0.25 0.00 1.00 0.06 0.24 0.00 1.00 0.01Other business-oriented service 0.05 0.21 0.00 1.00 0.07 0.25 0.00 1.00 -0.02Consumer-oriented services 0.11 0.31 0.00 1.00 0.17 0.37 0.00 1.00 -0.06Construction 0.10 0.31 0.00 1.00 0.12 0.32 0.00 1.00 -0.02Wholesale and retail trade 0.13 0.34 0.00 1.00 0.13 0.34 0.00 1.00 0.00
Gross Value Added p.c. (ind./state) 102.70 7.29 78.50 129.32 102.60 7.28 78.50 129.08 0.10Year 2009 0.20 0.40 0.00 1.00 0.19 0.40 0.00 1.00 0.01Year 2010 0.23 0.42 0.00 1.00 0.24 0.43 0.00 1.00 -0.01Year 2011 0.27 0.44 0.00 1.00 0.28 0.45 0.00 1.00 0.00
All variables except dummy variables enter the regressions as logarithmic transformations but are reported as absolute (deflated) values in the summary statistics tables.Additional control variable in all regressions: Funding by the KfW bank.
29
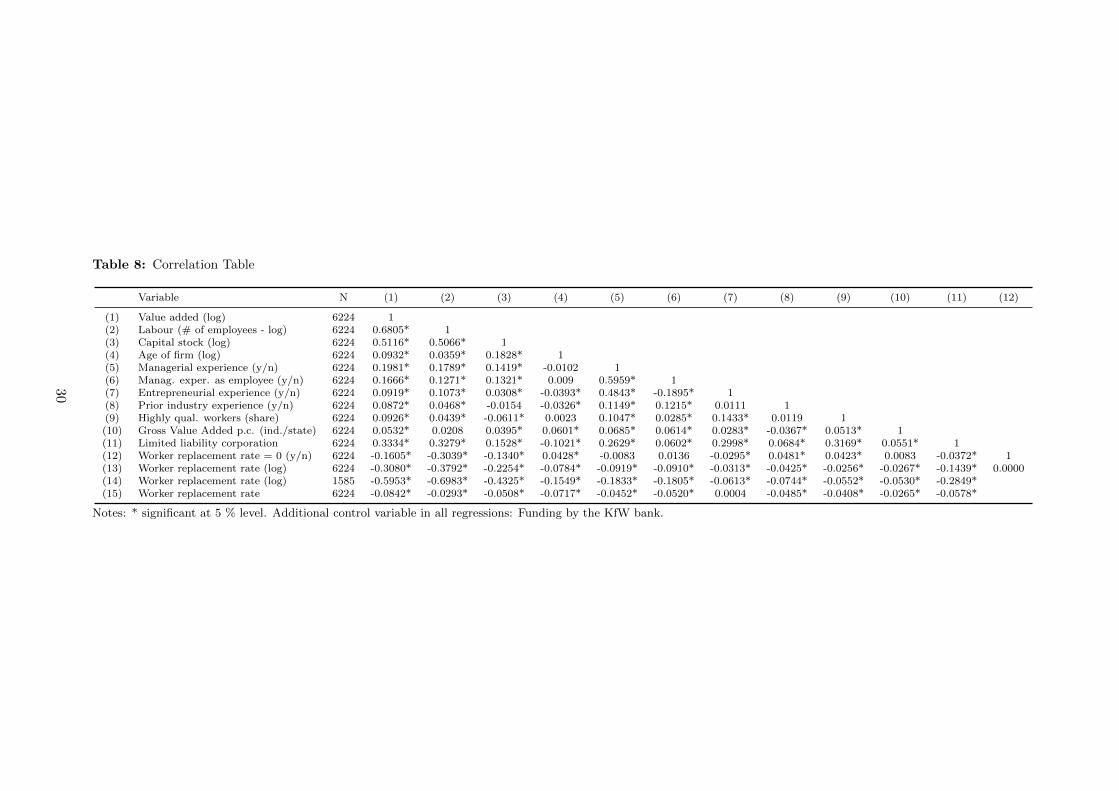
Table 8: Correlation Table
Variable N (1) (2) (3) (4) (5) (6) (7) (8) (9) (10) (11) (12)
(1) Value added (log) 6224 1(2) Labour (# of employees - log) 6224 0.6805* 1(3) Capital stock (log) 6224 0.5116* 0.5066* 1(4) Age of firm (log) 6224 0.0932* 0.0359* 0.1828* 1(5) Managerial experience (y/n) 6224 0.1981* 0.1789* 0.1419* -0.0102 1(6) Manag. exper. as employee (y/n) 6224 0.1666* 0.1271* 0.1321* 0.009 0.5959* 1(7) Entrepreneurial experience (y/n) 6224 0.0919* 0.1073* 0.0308* -0.0393* 0.4843* -0.1895* 1(8) Prior industry experience (y/n) 6224 0.0872* 0.0468* -0.0154 -0.0326* 0.1149* 0.1215* 0.0111 1(9) Highly qual. workers (share) 6224 0.0926* 0.0439* -0.0611* 0.0023 0.1047* 0.0285* 0.1433* 0.0119 1(10) Gross Value Added p.c. (ind./state) 6224 0.0532* 0.0208 0.0395* 0.0601* 0.0685* 0.0614* 0.0283* -0.0367* 0.0513* 1(11) Limited liability corporation 6224 0.3334* 0.3279* 0.1528* -0.1021* 0.2629* 0.0602* 0.2998* 0.0684* 0.3169* 0.0551* 1(12) Worker replacement rate = 0 (y/n) 6224 -0.1605* -0.3039* -0.1340* 0.0428* -0.0083 0.0136 -0.0295* 0.0481* 0.0423* 0.0083 -0.0372* 1(13) Worker replacement rate (log) 6224 -0.3080* -0.3792* -0.2254* -0.0784* -0.0919* -0.0910* -0.0313* -0.0425* -0.0256* -0.0267* -0.1439* 0.0000(14) Worker replacement rate (log) 1585 -0.5953* -0.6983* -0.4325* -0.1549* -0.1833* -0.1805* -0.0613* -0.0744* -0.0552* -0.0530* -0.2849*(15) Worker replacement rate 6224 -0.0842* -0.0293* -0.0508* -0.0717* -0.0452* -0.0520* 0.0004 -0.0485* -0.0408* -0.0265* -0.0578*
Notes: * significant at 5 % level. Additional control variable in all regressions: Funding by the KfW bank.
30

Table 9: Productivity Effects of Worker Replacement - Main Results - Full Sample
Dependent variable: A - OLS B - Lev. Pet. C - OLS D - Lev. Pet.Value Added Coef. (S.E.) Coef. (S.E.) Coef. (S.E.) Coef. (S.E.)
Worker replacement rate (log) -0.087 (0.023)*** -0.074 (0.022)*** -0.132 (0.047)*** -0.104 (0.048)**Worker replacement sq. (log) -0.020 (0.016) -0.013 (0.017)
Capital stock 0.217 (0.014)*** 0.424 (0.076)*** 0.217 (0.014)*** 0.425 (0.075)***Labour (# of employees) 0.781 (0.022)*** 0.712 (0.023)*** 0.783 (0.022)*** 0.713 (0.023)***
Managerial experience 0.081 (0.029)*** 0.075 (0.028)*** 0.081 (0.029)*** 0.075 (0.028)***Industry experience 0.237 (0.057)*** 0.246 (0.055)*** 0.238 (0.057)*** 0.246 (0.055)***Highly qual. workers (share) 0.111 (0.043)** 0.135 (0.040)*** 0.111 (0.043)** 0.134 (0.040)***Age of firm (log) 0.107 (0.026)*** 0.092 (0.025)*** 0.107 (0.026)*** 0.092 (0.025)***Limited liability corporation 0.240 (0.029)*** 0.174 (0.028)*** 0.239 (0.029)*** 0.173 (0.028)***
Technology-intensive services 0.209 (0.042)*** 0.246 (0.041)*** 0.210 (0.042)*** 0.246 (0.041)***Software supply and consultancy 0.031 (0.055) 0.141 (0.055)*** 0.031 (0.055) 0.141 (0.055)***Non-high-tech manufacturing 0.038 (0.043) 0.030 (0.040) 0.039 (0.043) 0.031 (0.040)Knowledge-intensive services 0.114 (0.052)** 0.197 (0.050)*** 0.114 (0.052)** 0.196 (0.050)***Other business-oriented services 0.068 (0.067) 0.121 (0.061)** 0.067 (0.067) 0.121 (0.061)**Consumer-oriented services 0.006 (0.061) 0.062 (0.058) 0.005 (0.061) 0.061 (0.058)Construction 0.091 (0.049)* 0.046 (0.045) 0.092 (0.048)* 0.047 (0.045)Wholesale and retail trade 0.258 (0.051)*** 0.147 (0.049)*** 0.259 (0.051)*** 0.147 (0.049)***
Gross Value Added p.c. (ind./state) 0.449 (0.166)*** 0.393 (0.161)** 0.447 (0.166)*** 0.391 (0.161)**Year 2010 -0.028 (0.029) -0.016 (0.029) -0.027 (0.029) -0.016 (0.029)Year 2011 -0.042 (0.031) -0.044 (0.030) -0.042 (0.031) -0.044 (0.030)Year 2012 -0.027 (0.031) -0.020 (0.030) -0.026 (0.031) -0.019 (0.030)
Constant Yes Yes Yes Yes
Observations / R-sq. 6,224 / 0.533 6,224 6,224 / 0.533 6,224
Notes: *** 1%, ** 5 %, * 10 %. Lev.Pet.: Estimates derived with structural approach of Levinsohn and Petrin. Cluster robust(OLS)/bootstrapped (Lev.Pet) standard errors in parentheses. Additional control variable in all regressions: Funding by the KfWbank.
31

Table 10: Productivity Effects of Log Worker Replacement - Main Results - Worker replacement > 0
Dependent variable A - OLS B - Lev. Pet. C - OLS D - Lev. Pet.Value Added Coef. (S.E.) Coef. (S.E.) Coef. (S.E.) Coef. (S.E.)
Worker replacement rate (log) -0.121 (0.030)*** -0.106 (0.029)*** -0.156 (0.048)*** -0.135 (0.049)***Worker replacement sq. (log) -0.017 (0.016) -0.013 (0.017)
Capital stock 0.166 (0.021)*** 0.389 (0.166)** 0.167 (0.021)*** 0.390 (0.165)**Labour (# of employees) 0.790 (0.040)*** 0.720 (0.044)*** 0.797 (0.041)*** 0.724 (0.045)***
Managerial experience 0.096 (0.048)** 0.080 (0.047)* 0.096 (0.048)** 0.081 (0.047)*Industry experience 0.064 (0.075) 0.091 (0.071) 0.065 (0.075) 0.092 (0.071)Highly qual. workers (share) 0.142 (0.086)* 0.159 (0.083)* 0.140 (0.086) 0.158 (0.083)*Age of firm (log) 0.072 (0.041)* 0.051 (0.039) 0.072 (0.041)* 0.051 (0.039)Limited liability corporation 0.176 (0.046)*** 0.134 (0.048)*** 0.175 (0.046)*** 0.133 (0.048)***
Technology-intensive services 0.163 (0.075)** 0.266 (0.074)*** 0.166 (0.075)** 0.267 (0.073)***Software supply and consultancy -0.077 (0.101) 0.085 (0.104) -0.077 (0.101) 0.084 (0.104)Non-high-tech manufacturing 0.032 (0.074) 0.055 (0.070) 0.033 (0.074) 0.056 (0.070)Knowledge-intensive services 0.073 (0.097) 0.178 (0.101)* 0.068 (0.097) 0.174 (0.102)*Other business-oriented services 0.090 (0.106) 0.201 (0.109)* 0.087 (0.106) 0.198 (0.109)*Consumer-oriented services -0.152 (0.076)** -0.055 (0.075) -0.156 (0.076)** -0.058 (0.076)Construction 0.046 (0.071) 0.045 (0.071) 0.045 (0.071) 0.045 (0.071)Wholesale and retail trade 0.324 (0.088)*** 0.268 (0.087)*** 0.324 (0.088)*** 0.267 (0.087)***
Gross Value Added p.c. (ind./state) 0.400 (0.290) 0.331 (0.276) 0.392 (0.291) 0.320 (0.277)Year 2010 -0.043 (0.060) -0.039 (0.058) -0.041 (0.060) -0.037 (0.058)Year 2011 -0.024 (0.059) -0.043 (0.061) -0.023 (0.059) -0.042 (0.061)Year 2012 -0.012 (0.062) -0.025 (0.064) -0.008 (0.062) -0.022 (0.064)
Constant Yes Yes Yes Yes
Observations / R-sq. 1,585 / 0.625 1,585 1,585 / 0.625 1,585
Notes: *** 1%, ** 5 %, * 10 %. Lev.Pet.: Estimates derived with structural approach of Levinsohn and Petrin. Cluster robust(OLS)/bootstrapped (Lev.Pet) standard errors in parentheses. Additional control variable in all regressions: Funding by the KfWbank.
32

Table 11: Productivity Effects of Worker Replacement - Robustness Checks I - Full Sample
Dependent variable A - OLS B - Lev. Pet. C - OLS D - Lev. Pet. E - OLS F - Lev. Pet.Value Added Coef. (S.E.) Coef. (S.E.) Coef. (S.E.) Coef. (S.E.) Coef. (S.E.) Coef. (S.E.)
Worker replacement y/n -0.067 (0.024)*** -0.067 (0.024)***Worker replacement rate -0.136 (0.034)*** -0.123 (0.034)*** -0.172 (0.055)*** -0.162 (0.055)***Worker replacement sq. 0.018 (0.020) 0.019 (0.023)
Capital stock 0.218 (0.014)*** 0.425 (0.077)*** 0.217 (0.014)*** 0.426 (0.075)*** 0.217 (0.014)*** 0.426 (0.075)***Labour (# of employees) 0.803 (0.021)*** 0.730 (0.023)*** 0.790 (0.021)*** 0.717 (0.022)*** 0.791 (0.021)*** 0.719 (0.022)***
Managerial experience 0.082 (0.029)*** 0.075 (0.028)*** 0.081 (0.029)*** 0.075 (0.028)*** 0.081 (0.029)*** 0.075 (0.028)***Industry experience 0.240 (0.057)*** 0.248 (0.055)*** 0.238 (0.057)*** 0.246 (0.055)*** 0.238 (0.057)*** 0.246 (0.055)***Highly qual. workers (share) 0.109 (0.043)** 0.133 (0.040)*** 0.110 (0.043)** 0.134 (0.040)*** 0.110 (0.043)** 0.134 (0.040)***Age of firm (log) 0.111 (0.026)*** 0.096 (0.025)*** 0.108 (0.026)*** 0.094 (0.025)*** 0.107 (0.026)*** 0.093 (0.025)***Limited liability corporation 0.240 (0.030)*** 0.173 (0.028)*** 0.240 (0.029)*** 0.173 (0.028)*** 0.239 (0.029)*** 0.173 (0.028)***
Technology-intensive services 0.213 (0.042)*** 0.249 (0.041)*** 0.212 (0.042)*** 0.248 (0.041)*** 0.211 (0.042)*** 0.247 (0.041)***Software supply and consultancy 0.035 (0.055) 0.145 (0.054)*** 0.032 (0.055) 0.141 (0.054)*** 0.032 (0.055) 0.142 (0.054)***Non-high-tech manufacturing 0.046 (0.043) 0.036 (0.040) 0.041 (0.043) 0.032 (0.040) 0.042 (0.043) 0.033 (0.040)Knowledge-intensive services 0.120 (0.052)** 0.202 (0.050)*** 0.114 (0.052)** 0.196 (0.050)*** 0.115 (0.052)** 0.197 (0.050)***Other business-oriented services 0.070 (0.068) 0.123 (0.061)** 0.068 (0.067) 0.120 (0.061)** 0.070 (0.067) 0.122 (0.061)**Consumer-oriented services 0.006 (0.061) 0.063 (0.058) 0.005 (0.060) 0.059 (0.057) 0.007 (0.061) 0.062 (0.057)Construction 0.088 (0.049)* 0.043 (0.045) 0.092 (0.048)* 0.046 (0.045) 0.093 (0.048)* 0.047 (0.045)Wholesale and retail trade 0.260 (0.051)*** 0.147 (0.049)*** 0.259 (0.051)*** 0.147 (0.049)*** 0.260 (0.051)*** 0.148 (0.049)***
Gross Value Added p.c. (ind./state) 0.446 (0.166)*** 0.388 (0.161)** 0.445 (0.166)*** 0.388 (0.161)** 0.444 (0.166)*** 0.387 (0.161)**Year 2010 -0.027 (0.029) -0.015 (0.029) -0.027 (0.029) -0.015 (0.028) -0.027 (0.029) -0.015 (0.029)Year 2011 -0.042 (0.031) -0.043 (0.030) -0.042 (0.031) -0.044 (0.030) -0.042 (0.031) -0.043 (0.030)Year 2012 -0.025 (0.031) -0.018 (0.030) -0.025 (0.031) -0.018 (0.030) -0.025 (0.031) -0.018 (0.030)
Constant Yes Yes Yes Yes Yes Yes
Observations / R-sq. 6,224 / 0.532 6,224 6,224 / 0.533 6,224 6,224 / 0.533 6,224
Notes: *** 1%, ** 5 %, * 10 %. Lev.Pet.: Estimates derived with structural approach of Levinsohn and Petrin. Cluster robust (OLS)/bootstrapped (Lev.Pet) standard errorsin parentheses. Additional control variable in all regressions: Funding by the KfW bank.
33
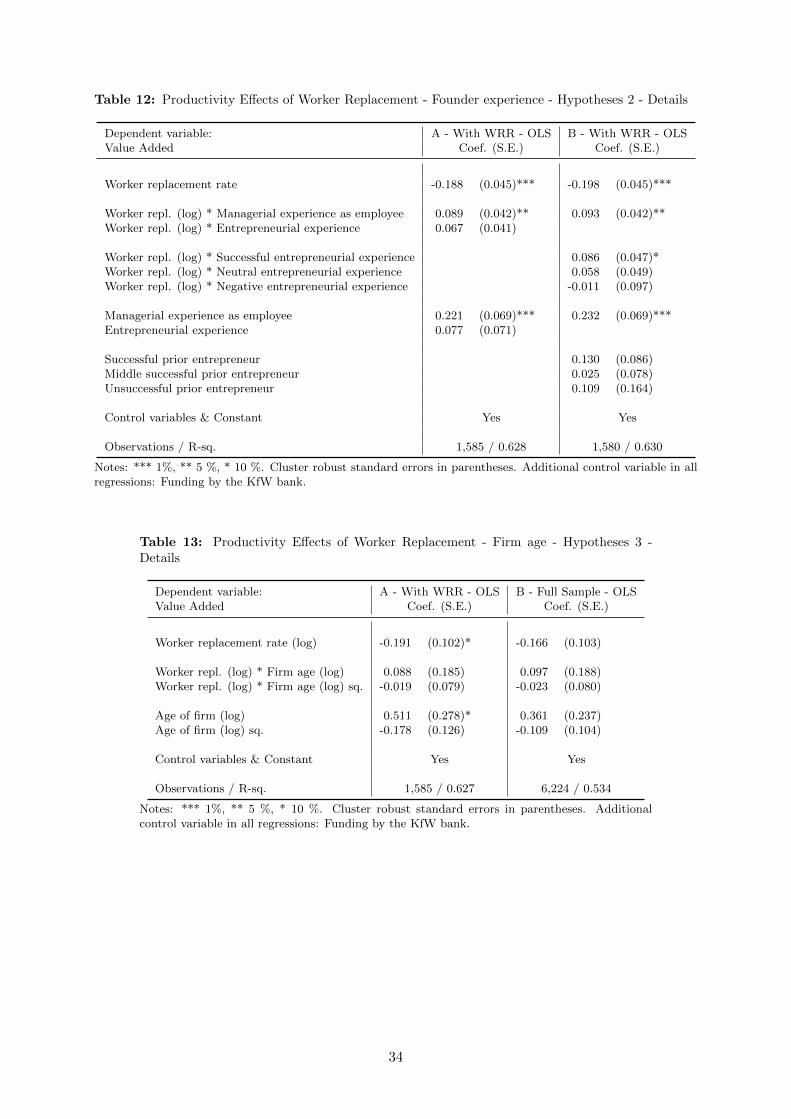
Table 12: Productivity Effects of Worker Replacement - Founder experience - Hypotheses 2 - Details
Dependent variable: A - With WRR - OLS B - With WRR - OLSValue Added Coef. (S.E.) Coef. (S.E.)
Worker replacement rate -0.188 (0.045)*** -0.198 (0.045)***
Worker repl. (log) * Managerial experience as employee 0.089 (0.042)** 0.093 (0.042)**Worker repl. (log) * Entrepreneurial experience 0.067 (0.041)
Worker repl. (log) * Successful entrepreneurial experience 0.086 (0.047)*Worker repl. (log) * Neutral entrepreneurial experience 0.058 (0.049)Worker repl. (log) * Negative entrepreneurial experience -0.011 (0.097)
Managerial experience as employee 0.221 (0.069)*** 0.232 (0.069)***Entrepreneurial experience 0.077 (0.071)
Successful prior entrepreneur 0.130 (0.086)Middle successful prior entrepreneur 0.025 (0.078)Unsuccessful prior entrepreneur 0.109 (0.164)
Control variables & Constant Yes Yes
Observations / R-sq. 1,585 / 0.628 1,580 / 0.630
Notes: *** 1%, ** 5 %, * 10 %. Cluster robust standard errors in parentheses. Additional control variable in allregressions: Funding by the KfW bank.
Table 13: Productivity Effects of Worker Replacement - Firm age - Hypotheses 3 -Details
Dependent variable: A - With WRR - OLS B - Full Sample - OLSValue Added Coef. (S.E.) Coef. (S.E.)
Worker replacement rate (log) -0.191 (0.102)* -0.166 (0.103)
Worker repl. (log) * Firm age (log) 0.088 (0.185) 0.097 (0.188)Worker repl. (log) * Firm age (log) sq. -0.019 (0.079) -0.023 (0.080)
Age of firm (log) 0.511 (0.278)* 0.361 (0.237)Age of firm (log) sq. -0.178 (0.126) -0.109 (0.104)
Control variables & Constant Yes Yes
Observations / R-sq. 1,585 / 0.627 6,224 / 0.534
Notes: *** 1%, ** 5 %, * 10 %. Cluster robust standard errors in parentheses. Additionalcontrol variable in all regressions: Funding by the KfW bank.
34
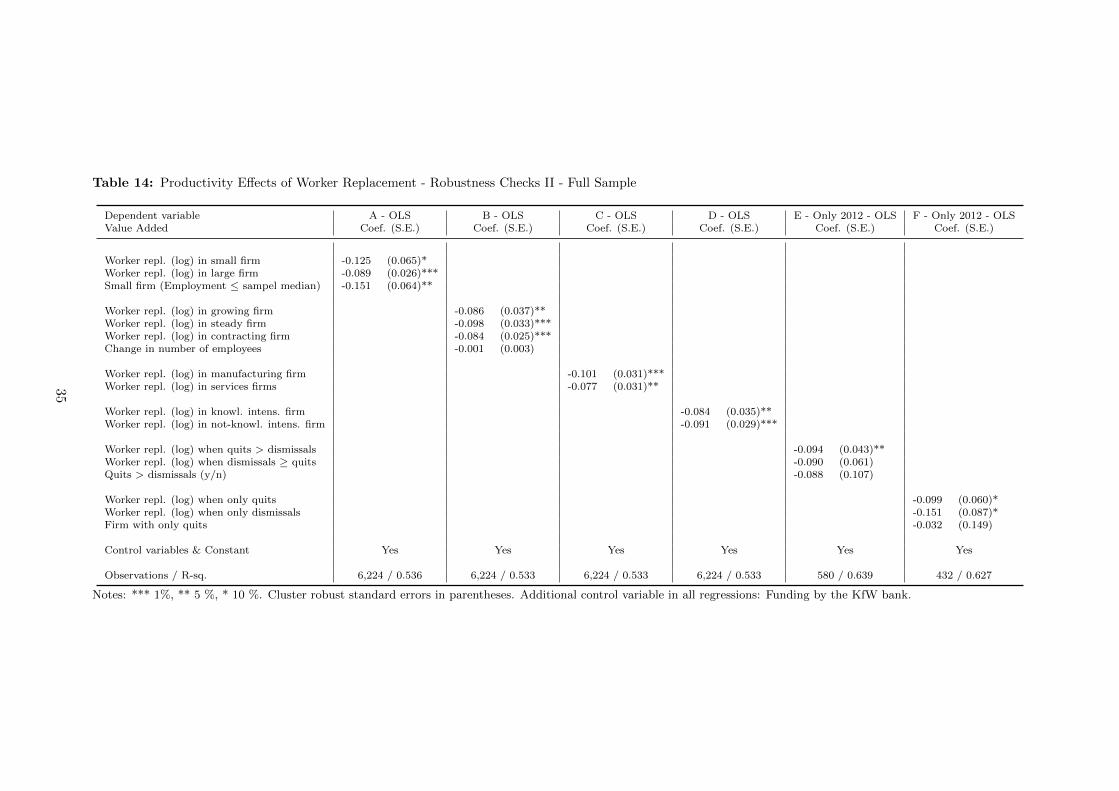
Table 14: Productivity Effects of Worker Replacement - Robustness Checks II - Full Sample
Dependent variable A - OLS B - OLS C - OLS D - OLS E - Only 2012 - OLS F - Only 2012 - OLSValue Added Coef. (S.E.) Coef. (S.E.) Coef. (S.E.) Coef. (S.E.) Coef. (S.E.) Coef. (S.E.)
Worker repl. (log) in small firm -0.125 (0.065)*Worker repl. (log) in large firm -0.089 (0.026)***Small firm (Employment ≤ sampel median) -0.151 (0.064)**
Worker repl. (log) in growing firm -0.086 (0.037)**Worker repl. (log) in steady firm -0.098 (0.033)***Worker repl. (log) in contracting firm -0.084 (0.025)***Change in number of employees -0.001 (0.003)
Worker repl. (log) in manufacturing firm -0.101 (0.031)***Worker repl. (log) in services firms -0.077 (0.031)**
Worker repl. (log) in knowl. intens. firm -0.084 (0.035)**Worker repl. (log) in not-knowl. intens. firm -0.091 (0.029)***
Worker repl. (log) when quits > dismissals -0.094 (0.043)**Worker repl. (log) when dismissals ≥ quits -0.090 (0.061)Quits > dismissals (y/n) -0.088 (0.107)
Worker repl. (log) when only quits -0.099 (0.060)*Worker repl. (log) when only dismissals -0.151 (0.087)*Firm with only quits -0.032 (0.149)
Control variables & Constant Yes Yes Yes Yes Yes Yes
Observations / R-sq. 6,224 / 0.536 6,224 / 0.533 6,224 / 0.533 6,224 / 0.533 580 / 0.639 432 / 0.627
Notes: *** 1%, ** 5 %, * 10 %. Cluster robust standard errors in parentheses. Additional control variable in all regressions: Funding by the KfW bank.
35

B Appendix: Structural identification of production functions
I briefly describe the estimation procedure suggested by Levinsohn and Petrin (2003) and theextension to this procedure suggested by Ackerberg et al. (2006, 2015) in this Appendix. Formore complete explanations, I refer to the original work of the authors. The basic intuitionbehind both procedures is to make timing assumptions about the behavior of profit maximizingfirms in the production process and to use these assumptions to identify estimates of the pro-duction factors that are unbiased by a productivity shock that is observed by the firm but notby the econometrician. Following Levinsohn and Petrin (2003) and Petrin et al. (2004) the basictiming assumptions that need to be made for this are that the capital stock of a firm in periodt is assumed to be a fixed input in t that is not affected by a potential, unobserved productivityshock (because investment decisions depend on longer time horizons). By contrast, variableinputs into the production function (such as labor and intermediate inputs) are considered tobe freely adjustable in t and are therefore potentially affected by an unobserved productivityshock. For better readability, I consider only labor as variable input of interest in this outline.As discussed in the main text, the same arguments as for labor also extend to other variableinput factors like the worker replacement rate.
Levinsohn and Petrin (2003) assume that the error term of the production function equation uitconsists of two parts, such that
uit = vit + εit.
vit is known by the firm but unknown by the economist, while εit is an innovation unknown toboth the firm and the economist. Assuming that an optimizing firm’s demand for intermediateinputs depends on its fixed capital level and is strictly increasing in the productivity shock, thedemand for materials can be expressed as a function of capital and the productivity shock:
lnMit = f(vit, lnKit).
Under the condition that the demand for materials increases monotonically for all levels of theproductivity shock, this function can be inverted as
vit = f−1(lnMit, lnKit)
to obtain a measurement for the unobserved productivity shock. Levinsohn and Petrin suggestapproximating vit with a third-order polynomial in lnMit and lnKit, and including this proxyin the first stage of the estimation procedure to obtain unbiased OLS estimates for the variableinputs. Following (Levinsohn and Petrin, 2003), to test whether the monotonicity assumptionholds, I plotted and checked a graph of the relationship between materials, capital and the es-timated productivity shock from the data used in this study. The use of materials is higher forall levels of capital input and all levels of the estimated productivity shock. Therefore, makingthe monotonicity assumption seems to be justifiable in the context of this study.
The coefficients for capital and materials are disentangled in the second step of the estimationprocedure. This requires that the additional assumption that the productivity shock follows afirst-order Markov process such that
vit = E[vt|vt−1] + ξit
where ξit is an innovation to the productivity shock. Two moment conditions to identify thecoefficients for capital and materials can then be formulated assuming that both the capital
36
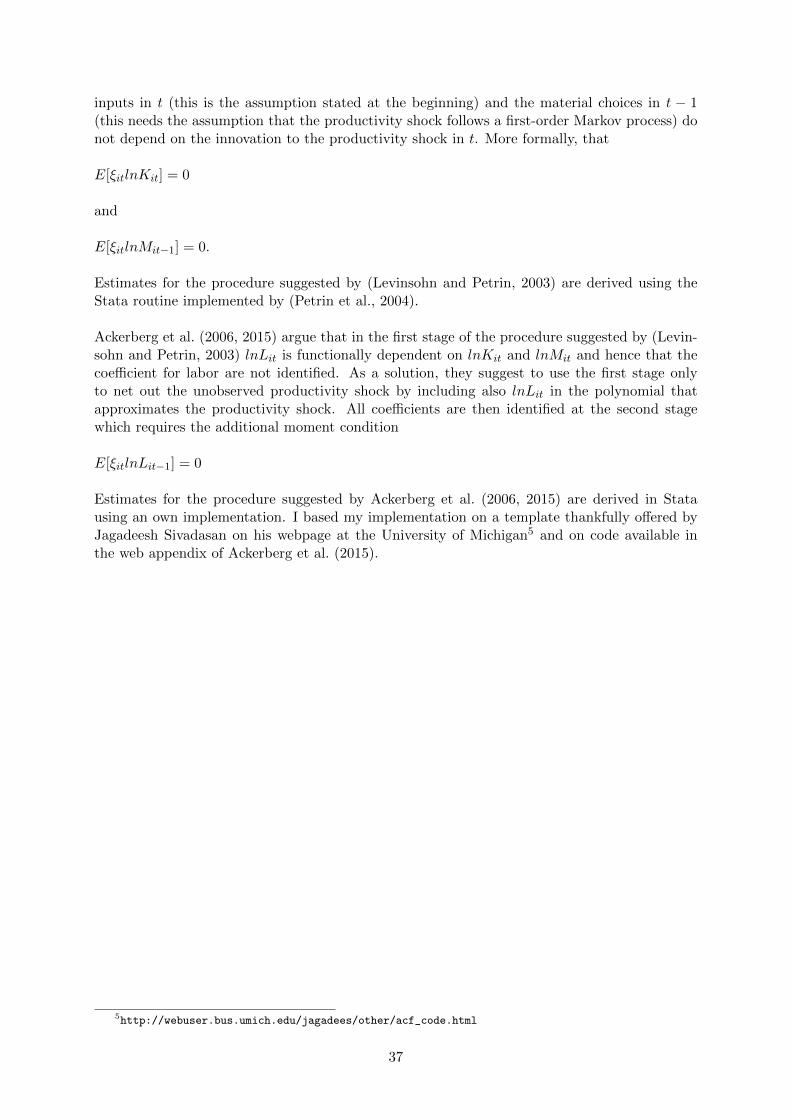
inputs in t (this is the assumption stated at the beginning) and the material choices in t − 1(this needs the assumption that the productivity shock follows a first-order Markov process) donot depend on the innovation to the productivity shock in t. More formally, that
E[ξitlnKit] = 0
and
E[ξitlnMit−1] = 0.
Estimates for the procedure suggested by (Levinsohn and Petrin, 2003) are derived using theStata routine implemented by (Petrin et al., 2004).
Ackerberg et al. (2006, 2015) argue that in the first stage of the procedure suggested by (Levin-sohn and Petrin, 2003) lnLit is functionally dependent on lnKit and lnMit and hence that thecoefficient for labor are not identified. As a solution, they suggest to use the first stage onlyto net out the unobserved productivity shock by including also lnLit in the polynomial thatapproximates the productivity shock. All coefficients are then identified at the second stagewhich requires the additional moment condition
E[ξitlnLit−1] = 0
Estimates for the procedure suggested by Ackerberg et al. (2006, 2015) are derived in Statausing an own implementation. I based my implementation on a template thankfully offered byJagadeesh Sivadasan on his webpage at the University of Michigan5 and on code available inthe web appendix of Ackerberg et al. (2015).
5http://webuser.bus.umich.edu/jagadees/other/acf_code.html
37