the production of nitric oxide in the · pdf filethe production of nitric oxide in the...
TRANSCRIPT

NASA TECHNICAL NOTE
CO
NASA TN D-8137
THE PRODUCTION OF NITRIC OXIDEIN THE TROPOSPHERE AS A RESULTOF SOLID-ROCKET-MOTOR AFTERBURNING
Roger B. Stewart and Richard I. Gomberg
Langley Research Center
Hampton, Va. 23665
NATIONAL AERONAUTICS AND SPACE ADMINISTRATION • WASHINGTON, D. C. • MARCH 1976
https://ntrs.nasa.gov/search.jsp?R=19760013092 2018-05-08T00:54:08+00:00Z

1 Report No
NASA TN D-81372 Government Accession No 3 Recipient's Catalog No
4 Title and Subtitle
THE PRODUCTION OF NITRIC OXIDE IN THE TROPOSPHEREAS A RESULT OF SOLID-ROCKET-MOTOR AFTERBURNING
5 Report DateMarch 1976
6 Performing Organization Code
7 Author(s)
Roger B. Stewart and Richard I. Gomberg8 Performing Organization Report No
L-10594
9 Performing Organization Name and Address
NASA Langley Research CenterHampton, Va. 23665
10 Work Unit No
197-40-02-01
11 Contract or Grant No
12 Sponsoring Agency Name and Address
National Aeronautics and Space AdministrationWashington, D.C. 20546
13 Type of Report and Period Covered
Technical Note14 Sponsoring Agency Code
15 Supplementary Notes
16 Abstract
As part of an ongoing assessment of the environmental effects of sohd-rocket-motoroperations in the troposphere, estimates are made of the nitric oxide produced in thetroposphere by the space shuttle and Titan ni-C boosters. The calculations made withthe low-altitude plume program (LAPP) include the effects of coupled finite-rate chem-istry and turbulent mixing. A recent measurement of nitric oxide taken in the effluentcloud of a Titan in-C booster is compared with calculations made with this computercode.
17 Key Words (Suggested by Author(s))
Environmental effectsSpace shuttleTroposphere pollution
18 Distribution Statement
Unclassified — Unlimited
Subject Category 1619 Security Classif (of this report)
Unclassified20 Security Classif (of this page)
Unclassified21 No of
43
22 Price*
$3.75
For sale by the National Technical Information Service, Springfield, Virginia 22161

THE PRODUCTION OF NITRIC OXIDE IN THE TROPOSPHERE AS
A RESULT OF SOLID-ROCKET-MOTOR AFTERBURNING
Roger B. Stewart and Richard I. GombergLangley Research Center
SUMMARY
As part of an ongoing assessment of the environmental effects of solid-rocket-motor operations in the troposphere, estimates are made of the nitric oxide producedin the troposphere by the space shuttle and Titan III-C boosters. The calculationsmade with the low-altitude plume program (LAPP) include the effects of coupled fmite-rate chemistry and turbulent mixing. A recent measurement of nitric oxide taken inthe effluent cloud of a Titan III-C booster is compared with calculations made with thiscomputer code,
INTRODUCTION
The National Aeronautics and Space Administration is carrying out a continuingprogram of environmental assessment of the effects of solid-rocket-motor operations inthe troposphere and stratosphere. The present study deals with the production of nitricoxide in the troposphere from space shuttle and Titan III-C solid rocket motors. Nitricoxide (NO) enters directly into the catalytic destruction of ozone in the stratosphere and,as such, presents a possible environmental hazard. (See ref. 1.) Calculations of the netproduction of NO from shuttle booster operations in the stratosphere are in progress.(See ref. 2.) The low-altitude production of NO is also of interest for comparison withongoing tropospheric measurements (ref. 3) in order to give confidence in the plumemodeling. At some intermediate altitude, the low-altitude NO results must be able tomatch smoothly the NO predictions of the stratospheric code for a given configuration.
The primary tool used in the investigation was the low-altitude plume program,the LAPP code. (See ref. 4.) This code can model a reacting, turbulent shear flow andis suitable for relatively low-altitude computational studies of NO production in rocketplumes. Above an altitude of 15 km, the rocket nozzle flow becomes increasingly under-expanded and a shock pattern develops in the plume that is not accounted for by the code.This report describes the use of the LAPP code and the computational studies carriedout. In addition, recent measurements of NO made within a Titan III-C "ground cloud"by NASA Langley Research Center and Dr. D. Davis of the University of Maryland aredescribed and a comparison is made between the measurements and model predictions.

SYMBOLS
A area of plume
M Mach number
p pressure
R effective nozzle exit radius (derived from true exit radius by meansof an isentropic expansion)
Rg universal gas constant
T temperature
t time in minutes
U velocity of particle within plume
X distance downstream of nozzle exit plane
Y radial distance
p density of plume
X concentration
( )^i o Quantity appropriate to Al^Oo
ANALYTICAL STUDIES
The LAPP Code
Figure 1 is a diagram of a typical low-altitude rocket plume assumed by the LAPPcode. The LAPP code used in this study is an axisymmetric model that divides the hydro-dynamic flow into stream tubes. The unperturbed atmosphere or free stream is the outer-most stream tube; the remaining stream tubes comprise the plume. In each stream tubethe governing differential equations are the reacting boundary-layer equations. (Seeref. 5.) Finite-rate chemistry enters into the hydrodynamic description through theenergy terms.

Several eddy -viscosity models are presently available which describe the turbulententrainment of air into the plume. The Donaldson -Gray model (ref. 6) was used in thisinvestigation because of its success in prior studies by other investigators (ref. 7).
As inputs to the code, it is necessary to specify the conditions at the nozzle exitplane, the conditions in the unperturbed atmosphere, the chemical reactions to be con-sidered, and all the pertinent thermochemical data. The nozzle exit plane conditions forthe space shuttle solid-rocket motor (SRM) were furnished by Marshall Space FlightCenter and the data for the Titan ni-C SRM by Aero -Space Corporation. (See tables Iand n.) The unperturbed atmospheric conditions were taken from U.S. Standard Atmo-sphere (ref. 8), thermochemical data were taken from the JANAF reports (ref. 9), andchemical reaction rate coefficients were taken from references 2 and 10 to 14.
Because the reaction mechanism used in the code is not appropriate for tempera-tures below 600 K, the code cuts off all chemical kinetic reactions below this temperature.At tropospheric altitudes both the shuttle and Titan motors produce regions extendingabout 750 meters downstream of the nozzle exit plane in which temperatures are wellabove 600 K. The preponderance of NO is produced in these regions so that use of theLAPP code is appropriate here.
The chemical reactions and the rate coefficients used in this study are given intable in. These reactions are descriptive of processes occurring above 600 K. Certainspecies which react primarily at temperatures below this value are also considered andlisted in table III. They are important for their thermodynamic properties. All constit-uents of the plume are taken to be ideal gases.
Modifications to LAPP Code
Three modifications were made to the LAPP code in the course of this study toimprove on certain weaknesses in the original model. In order to study the overall effectsof high -temperature chemical reactions, the plume calculations had to be carried to dis-tances on the order of 750 meters downstream of the nozzle exit plane. Calculations tothese distances have shown that mass is not conserved within the plume.
Consider, for example, figure 2 which shows the mass flow rate of the inert speciesAl2C"3 plotted against downstream distance in the exhaust of a shuttle motor at an altitudeof 15 km. Since A^Og is one of the inert species in the model, this quantity should be con-served. If X is the distance downstream, the mass flow rate of A^Og is (pUAK, Qand should be constant for all X. As can be seen in figure 2, the quantity is actuallydecreasing with downstream distance because mass is being lost. The mass loss iscaused by the failure of the model to account adequately for the expansion of the plume.The model expands the plume by adding stream tubes whenever the temperature of second

to outermost stream tube Tn_i and the outermost tubes temperature Tn satisfyI T1 — T 1 I•— ,n" > 0.050. At distances far downstream of the exit plane, where the mass loss
I rp *• '\ J-nloccurs, this criterion does not allow enough stream tubes to be added for sufficient expan-sion to occur. As a result, the species found in the plume but not in the atmosphere aretruncated at the free atmosphere boundary and mass is lost.
Pergament and Thorpe (ref. 2) have suggested an empirical scheme which correctsfor this deficiency. Their method, which is used in the present study, is essentially tonormalize the mass flow of all species at a given downstream distance by the ratio of theA12O3 mass flow at that same distance to the mass flow of A^Og at the exit plane. Theirstudies indicate that this is a satisfactory approach.
Another problem encountered in using the LAPP code is a continuation error. Forcomplicated chemistry the computer time required for a given problem can be severalhours. Because of computer scheduling, it is practical to run only part of the problem ata time, punch out a continuation deck, and resubmit this deck at a later time. Indeed, thisis an option in the LAPP code. However, for each new deck, the code's boundary condi-tions force the second to the outermost stream tube to be identical to the outermost streamtube which is the unperturbed atmosphere. Any compounds such as Al2C>3, NO, or NO2
not found in the atmosphere are deleted from the tube and this deletion introduces a smallerror each time the problem is "continued." If many continuations are made, the cumu-lative differences can become large as seen in figure 3.
The center-line temperature is plotted as a function of distance downstream of theexit plane for a Titan motor at an altitude of 1.2 km in figure 3. If one, two, or threecontinuations are used, the profile shown with the solid line results; the three cases areindistinguishable. For 28 continuations, the profile is changed as shown by the dashedline though identical inputs were used. To avoid this spurious effect, all cases used inthis study were run by using three or less continuations.
At high altitudes when the pressure of the gases at the exit plane is on the order of1 atmosphere, whereas the ambient pressure is about 0.1 atmosphere, there are very fewcollisions involving the plume gases as they stream out of the nozzle until they reach apressure match with the atmosphere. For these high altitudes a hand-calculated isen-tropic expansion is used to gain effective nozzle exit plane conditions. This approachwas used for the shuttle motor at altitudes of 5 and 15 km and for the Titan motors at5 and 18 km. The chemical composition at the effective nozzle exit plane was assumedto be identical to those in tables I and n. By use of the mass flow rates taken from ref-erence 15, those furnished by Battelle Columbus Laboratories, and the isentropic assump-tion, the complete set of effective exit plane conditions necessary to start the code at thesehigher altitudes is given in table IV.

Results
Calculations were made for a Titan solid-propellant booster at altitudes of 1.2, 5,and 18 km and for a shuttle motor at altitudes of 0.7, 5, and 15 km. The calculationsneglect the shock structure present in the plume at very high altitudes and introducesome uncertainties in the 15- and 18-km cases. With increasing X/R, the temperaturesin the plume decrease, the chemical reactions begin to slow down, and the velocitiesdecrease. As X/R approaches the value where the center-line temperature dropsbelow 600 K, an asympotic state is assumed. At a given X/R in this "asymptotic"region, a 1-meter-long section of plume in the X-direction contains a certain number ofgrams of NO, NC>2, A^C^, and so on. Knowing the number of grams of NO per meter ofplume in the X-direction in this slowly varying region is a reasonable indication of howmuch NO will be transferred from the afterburning region to that part of the plume forwhich temperatures are below 600 K.
In figure 4 the NO produced in a Titan solid-booster plume at three altitudes isshown. At 1.2 km, the amount of NO transferred to the cool part of the plume will beabout 550 g/m for each motor, at 5 km it will be about 50 g/m for each motor, and at18 km, 33 g/m for each motor. Since there are two solid boosters for a Titan III-Cvehicle, and since at tropospheric altitudes there is very little interaction between theplumes, the total amounts of NO transferred from the afterburning region of the Titanare twice these numbers.
A similar analysis is carried out for a shuttle booster in figure 5. As can be seen,the asymptotic value of the shuttle motor at 0.7 km is about 900 g/m of NO for each motor,at 5 km it is 70 g/m of NO for each motor, and at 15 km, less than 11 g/m for each motor.
It is surprising that in spite of the fact that the mass flow rate of the space shuttleis twice that of a Titan, its high altitude production of NO is less than half of that of theTitan. The reason for this anomalous behavior of the NO production curve is the pres-ence of a thrust vector control (TVC) system in the Titan which is not present in theshuttle. The Titan motor contains a set of jets which inject streams of ^04 into thenozzle flow. These injectors are used to make fine course corrections in the boosterascent. At the high temperatures in the nozzle, much of this fluid breaks down into NO.As a conservative estimate for computational purposes, it is reasonable to assume thatall of the fluid breaks down into NO and 02- This assumption is made in the second col-umn of table II.
In figure 6 the mole fraction of NO and other species along the plume center line ofa Titan at 18 km is plotted as a function of the dimensionless downstream distance X/R.The NO mole fraction drops from its initial value as the plume expands and entrains air,steadies off as the chemical afterburning produces enough NO to compensate for the plume

dilution, and finally drops as the reactions slow and dilution becomes dominant. In fig-ure 7 the same plot is made, the NO produced by the thrust vector control (TVC) systembeing neglected. The afterburning peak still brings the mole fraction up to a reasonablylarge value at X/R =100, but clearly the TVC results in substantial contribution of NO.Figure 8 shows the amount of NO in grams per meter for the Titan at 18 km with TVC.Figure 9, without TVC, again reflects the importance of this additional NO.
Figures 10 to 14 describe various aspects of the Titan plume at 1.2 km. Figure 10shows the fall off of CO as it afterburns to produce CO2- Figure 11 follows the produc-tion of NO and other nitrogen and oxygen species. Figure 12 traces the production ofseveral important afterburning products, and figures 13 and 14 show the development ofthe cross-sectional temperature and velocity profiles at various downstream stations.
A similar set of curves is shown for the Titan at 5 km in figures 15 and 16. TheNO mole fraction plotted against dimensionless downstream distance (fig. 15) shows thedouble peak which seems to be characteristic of the Titan. The NO resulting from TVCis dominant at X/R near zero, whereas a second contribution results at X/R =100from the chemical afterburning. As shown in figure 16, combustion proceeds much asin the 1.2-km case. The temperature and velocity profiles are similar to the 1.2-kmcase and are not presented.
The center-line mole fraction profile of NO as a function of X/R in the shuttlemotor differs significantly from that of the Titan. Profiles for NO and other nitrogenspecies mole fractions for the 0.7-km shuttle motor are plotted in figure 17. Note, inparticular, that the NO mole fraction starts out at an extremely small value, in contrastto the Titan cases, but reaches a high level at X/R = 60 as a result of afterburning.This behavior is followed closely at higher altitudes as shown in figures 18 and 19, wherethe same profiles are presented for the 5- and 15-km shuttle motors. Note that for the15-km shuttle case, the afterburning NO production reaches a peak at X/R = 90. Becauseof the lower densities at this altitude than at 0.7 km, the processes are "stretched out"over a longer distance and time.
The combustion of CO to CO2 for the shuttle, on the other hand, is similar to thatfor the Titan. In figure 20 the center-line mole fractions of various combustible mate-rials in the 0.7-km shuttle case show little qualitative difference between this case andthe Titan case at 1.2 km. For the 15-km altitude shuttle case (fig. 21), the same com-ments apply, although the "stretching out" process still occurs.
Consider now figures 22 and 23, the velocity and temperature profiles for the0.7-km shuttle. Comparison with figures 13 and 14 show strong similarities betweenthese curves and those for the Titan at a similar altitude. In figures 24 and 25, thevelocity and temperature profiles are presented at various downstream stations for the

shuttle solid-rocket motor at a 15-km altitude. Note again that the major differencebetween this case and the 0.7-km shuttle case is the slower rate of change as a functionof X/R.
MEASUREMENTS
At the present time there are no measurements available for the production of efflu-ents from the full-scale space shuttle boosters. As a general approach toward compari-son of the plume calculations and measured production of chemical species, Titan III-Csolid boosters have been selected as test vehicles. The Titan in-C booster motors areof similar chemical composition to the shuttle boosters and have about one-half the massflow rate of the shuttle boosters.
After a Titan m-C launch in May 1974 at John F. Kennedy Space Center, a seriesof ground cloud penetrations were made with an instrumented aircraft under the LangleyResearch Center launch vehicle effluent monitoring program. The comparisons betweenthe plume code predictions and measurements within the cloud were made by use of thefollowing techniques. The ground cloud volume as a function of time was calculated byusing visible photographs of the cloud from three separate camera sites. By using theknown cloud position, the cloud images were divided into elliptical slabs and the volumewas calculated. The Titan III trajectory and motor mass flow rate are then known func-tions of time so that by using time-sequenced visible spectrum photographs, the totalamount of exhaust material in the ground cloud can be calculated.
Figure 26 is a plot of the Titan ffl-C ground cloud volume as a function of timefollowing the May 20, 1974 launch at Kennedy Space Center. The cloud volume wasobtained by using the technique described previously. The calculations were repeatedwith a different camera site location and the resulting calculated volume is also shownin figure 26 as the curve of the lower volume plotted against time. Figure 27 indicatesthe total mass in the cloud and shows several mass dilution ratios at different times.
The aircraft used for the cloud measurements was an instrumented Cessna 402.This aircraft made eight penetrations of the cloud and sampled the gaseous NO and NC>2by using a commercially available NO-NO2~NOX analyzer. The response time of theinstrument is within a second. It can measure concentration as low as 5 parts per billionwith an accuracy within 10 percent.
Ozone was also measured during the aircraft penetrations. Again, a commerciallyavailable instrument was used, in this case, a chemiluminescent ozone detector. It canmeasure concentration to 5 parts per billion with a response time of 1 second.
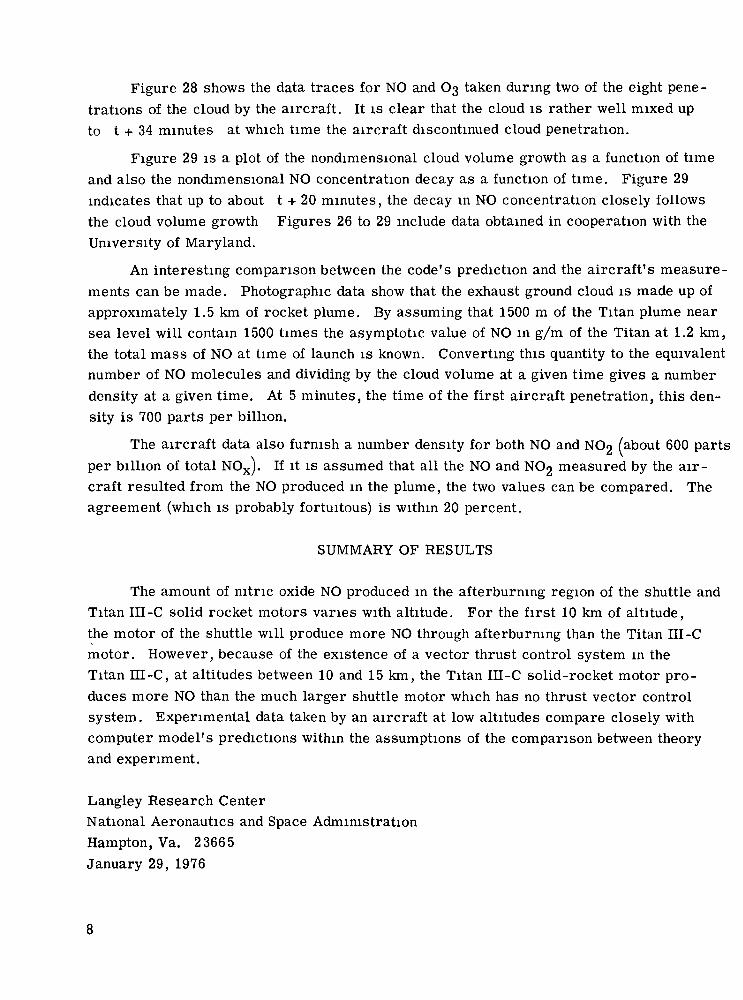
Figure 28 shows the data traces for NO and 03 taken during two of the eight pene-trations of the cloud by the aircraft. It is clear that the cloud is rather well mixed upto t + 34 minutes at which time the aircraft discontinued cloud penetration.
Figure 29 is a plot of the nondimensional cloud volume growth as a function of timeand also the nondimensional NO concentration decay as a function of time. Figure 29indicates that up to about t + 20 minutes, the decay in NO concentration closely followsthe cloud volume growth Figures 26 to 29 include data obtained in cooperation with theUniversity of Maryland.
An interesting comparison between the code's prediction and the aircraft's measure-ments can be made. Photographic data show that the exhaust ground cloud is made up ofapproximately 1.5 km of rocket plume. By assuming that 1500 m of the Titan plume nearsea level will contain 1500 times the asymptotic value of NO in g/m of the Titan at 1.2 km,the total mass of NO at time of launch is known. Converting this quantity to the equivalentnumber of NO molecules and dividing by the cloud volume at a given time gives a numberdensity at a given time. At 5 minutes, the time of the first aircraft penetration, this den-sity is 700 parts per billion.
The aircraft data also furnish a number density for both NO and NO2 (about 600 partsper billion of total NOX). If it is assumed that all the NO and NO2 measured by the air-craft resulted from the NO produced in the plume, the two values can be compared. Theagreement (which is probably fortuitous) is within 20 percent.
SUMMARY OF RESULTS
The amount of nitric oxide NO produced in the afterburning region of the shuttle andTitan III-C solid rocket motors varies with altitude. For the first 10 km of altitude,the motor of the shuttle will produce more NO through afterburning than the Titan III-Cmotor. However, because of the existence of a vector thrust control system in theTitan III-C, at altitudes between 10 and 15 km, the Titan III-C solid-rocket motor pro-duces more NO than the much larger shuttle motor which has no thrust vector controlsystem. Experimental data taken by an aircraft at low altitudes compare closely withcomputer model's predictions within the assumptions of the comparison between theoryand experiment.
Langley Research CenterNational Aeronautics and Space AdministrationHampton, Va. 23665January 29, 1976

REFERENCES
1. Kellogg, W. W.: Pollution of the Upper Atmosphere by Rockets. Space Sci. Rev.,vol. HI, no. 2, Aug. 1964, pp. 275-316.
2. Pergament, Harold S.; and Thorpe, Roger D.: NOX Deposited in the Stratosphere bythe Space Shuttle. AeroChem TN-161 (Contract NAS 1-13544), AeroChem Res.Labs., Inc., July 1975. (Available as NASA CR-132715.)
3. Gregory, Gerald L.; and Storey, Richard W., Jr.: Effluent Sampling of Titan III CVehicle Exhaust. NASA TM X-3228, 1975.
4. Pergament, H. S.; and Calcote, H. F.: Thermal and Chemi-Iomzation Processes inAfterburning Rocket Exhausts. Eleventh Symposium (International) on Combustion,Combustion Inst. (Pittsburgh, Pa.), 1967, pp. 597-611.
5. Vincenti, Walter G.; and Kruger, Charles H., Jr.: Introduction to Physical GasDynamics, John Wiley & Sons, Inc., c.1965.
6. Donaldson, Coleman duP.; and Gray, K. Evan: Theoretical and Experimental Inves-tigation of the Compressible Free Mixing of Two Dissimilar Gases. AIAA J.,vol. 4, no. 11, Nov. 1966, pp. 2017-2025.
7. Pergament, H. S.; and Mikatarian, R. R.: Calculation of Nonequihbrium Nozzle andExhaust Plume Properties for Saturn Launch Vehicles. AeroChem TP-160, Aero-Chem Res. Labs., Inc., Aug. 1967. (Available as NASA CR-61704.)
8. U.S. Standard Atmosphere, 1962; NASA, U.S. Air Force, and U.S. Weather Bur.,Dec.1962.
9. JANAF Thermochemical Tables. Second ed., NSRDS-NBS 37, U.S. Dep. Com.,June 1971.
10. Pergament, H. S.; and Jensen, D. E.: Influence of Chemical Kinetic and TurbulentTransport Coefficients on Afterburning Rocket Plumes. J. Spacecraft & Rockets,vol. 8, no. 6, June 1971, pp. 643-649.
11. Jensen, D. E.; and Jones, G. A.: Gas-Phase Reaction Rate Coefficients for RocketryApplications. RPE-TR-71/9, Rocket Propulsion Establishment (Westcott, England),Oct. 1971.
12. Garvin, David; and Hampson, R. F., eds.: Chemical Kinetics Data Survey Vn. Tablesof Rate and Photochemical Data for Modelling of the Stratosphere (Revised).NBSIR 74-430, Nat. Bur. Standards, U.S. Dep. Com., Jan. 1974. (SupersedesNBSIR 73-203.)

13. Garvin, David, ed.: Chemical Kinetics Data Surve'y V. Sixty-Six Contributed Rateand Photochemical Data Evaluations on Ninety-Four Reactions. NBSIR 73-206,Nat. Bur. Standards, U.S. Dep. Com., May 1973.
14. Bowman, Craig T.: Investigation of Nitric Oxide Formation Kinetics in CombustionProcesses: The Hydrogen-Oxygen-Nitrogen Reaction. Combust. Sci. & Technol.,vol. 3, no. 1, Apr. 1971, pp. 37-45.
15. Solid Propellant Engineering Staff: Nozzle Exit Exhaust Products From Space ShuttleBoost Vehicle (November 1973 Design). Tech. Memo. 33-712, Jet Propulsion Lab.,California Inst. Technol., Feb. 1975. (Available as NASA CR-136747.)
10

TABLE I.- SPACE SHUTTLE SOLID-ROCKET EXIT PLANE
MOTOR AVERAGE VALUES
[Space shuttle data obtained from Ben Shackleford,Marshall Space Flight Center, Mar. 1974. Thesedata are appropriate for altitudes less than 1 km]
Exit planespecies
AIC1A1C12
A1C13
A1OC1A1203
COC02
ClFeFeClFeCl2
H
HC1
Mole fractions
3 x ID'5
812
7 975
23 2052 120
225111
122556
15 442
Exit planespecies
H2
H20NON2
O
OH
CIO
C12
H02
N02
N20
02N
Mole fractions
27 812 x ID'5
14 0681
8 4011
468.1 x 10-96.9 x lO'7
1.2 x 10-U5.8 x 10-128.6 x 10-U2.0 x lO'7
0.0
Exit plane conditions based on an equilibrium model:Pexit, atmTexit> K
MexitRexit> m •Uexit> m/s
0.83452308
2.7791.810
2433.8
11

TABLE II.- TITAN MOTOR DATA
[These data are based on an equilibrium model and areappropriate for altitudes of approximately 1 km; incolumn three it is assumed that the injectedbreaks down into NO and O2~j
Exit planespecies
COOHC02
HO2
H02
H2
H20NON02
N
N2
HC1
N20
Cl
C12
CIO
A1203
0
Without TCV
2.468 x 10-19.000 x lO-5
1.811 x lO-2
3.200 x 10-31.035 x 10-35.858 x 10-113.157 x 10-11.058 x 10-19.000 x lO-5
2.002 x 10-H1.884 x 10-88.105 x 10-21.510 x 10-11.090 x 10-81.150 x ID'3
3.293 x 10-62.392 x ID'8
7.680 x ID'2
6.959 x 10⁻⁷
With TCV (based on50 Ib/sec per motor)
2.452 x 10-19.000 x 10-51.811 x lO-2
3.200 x 10-31.034 x ID'3
5.585 x 10-H3.136 x 10-11.051 x 10-16.680 X10-32.002 x 10-H1.884 x 10-88.051 x ID'2
1.500 xlO-11.090 x ID'8
1.150 x ID'3
3.293 x 10-62.392 x ID'8
7.170 x ID'2
6.959 x lO'7
Exit plane conditions:Mass flow at exit, g/secTexit> K
Pexif atm
Rexit> m
1.84 x 10⁶
. . 1921
. . 0.702
. . 1.35
12

TABLE III.- CHEMICAL SCHEME
Reaction Rate coefficient
(1) H + Cl + M = HC1 + M(2) H + HC1 = Cl + H2
(3) HC1 + OH = H2O + Cl(4) H + H + M = H2 + M
(5) H + OH + M = H2O + M
(6) OH + OH = H2O + O
(7) OH + H2 = H2O + H
(8) CO + OH = CO2 + H
(9) O + O + M = O2 + M
(10) CO + O + M = CO2 + M
(11) O + H2 = OH +H
(12) H + O2 = OH + O
(13) O + H + M = OH + M
(14) O + N2 = NO + N
(15) N +O2 = NO + O
(16) NO + O + M = NO2 + M
(17) NO + OH - NO2 + H
(18) Cl + OH = HC1 + O
(19) Cl + Cl + M = C12 + M
3
8.87.211145
1
53312.31.14.172.83.01.6
x 10-x 10x 10x 10x 10x 10x 10x 10x 10x 10x 10x 10x 10x 10x 10x 10x 10x l Ox 10
-29T-1-H exp(-4 622/RgT)-12 exp(-3 250/RgT)-29-r-i-28-r-i-H exp(-l 000/RgT)-H exp(-5 500/RgT)-13 exp(-600/ReT)
\ O /
-29-r-i-29T-1 exp(-4 000/RgT)-11 exp(-8 200/RgT)-10 exp(-16 500/RgT)-29T-1
-10 exp(-75 400/RgT)-14T exp(-6 250/RgT)-33 exp(+l 860/RgT)-12 exp(-30 000/RgT)-11 exp(-9 900/RgT)-33 exp(+l 600/RgT)
aRate coefficient units are in terms of molecules, cm3, sec. A1C1,A1C12, and A12O3 are included in the plume as inert species. Coefficientsfor reactions 1 and 4 to 13 are from reference 10; reactions 2 and 3, fromreference 2; reactions 14 and 15, from reference 14; reactions 16 and 17,from reference 13; and reactions 18 and 19 from reference 11. The ratecoefficients from reactions 16, 18, and 19 were modified slightly from thevalues given in the references after discussions with Dr. H. Hoshizaki ofLockheed Aircraft Corporation.
13

TABLE IV.- TEST CONDITIONS
(a) Ambient conditions
Sea -level Titan5 -km Titan18 -km TitanSea -level shuttle5 -km shuttle15 -km shuttle
Ambientpressure,
atm
0.702.536.0797.8345.536.119
Ambienttemperature ,
K
300260207
300260216
Free -streamvelocity,m/sec
30.48275.8537.630.48
259.3552.2
(b) Exit plane conditions
Sea-level Titan5 -km Titan18 -km TitanSea -level shuttle5 -km shuttle15 -km shuttle
Effective exitradius,
m
1.351.353.631.811.813.56
Effective exittemperature,
K
192119211375230823081726
Effective exitvelocity,m/sec
250125013496243324332864
14

Plume boundary
Motor exhaust
Ambient airentrainment
Initiation ofturbulent mixing
Figure 1.- Diagram of plume during tropospheric afterburning.
15

O-4->Oa0>
CO
ID
01
Q.C
•I— (
O
CQrta00
OCVI
o>Si
g)
Xin
Xo
xoITS
oas/3 <
16

Cfl s:c CM3 i-T5
•^ oJJ
§ I° 3
00 aCM 5
•i-ibn -y
013
- ,„3 52" S—I Ort J
3 £ qO £j O^ I °O 2 co
oCMCO
oooCM
O
CM
Oo(M
X
8«*H
I00
ri
o
o
5TO
to§rH
- *->.r* rtH 3ri S
oto
oCM
Ooo
ni
1w
1o
73
0)os-2COr*
Q
o0>a3
F-H
O.
O
CO
^rH"S
CP5-1
rto>o.a0)H
o
•sQJ
a3CCO3O
rt>
CO
(Uf-l
PM
ooooo
oo
ooeg(M
oooo
oo
ooo
31
17

10° r-
NO, g/m
10* -
10 —,
20 40 60 80X/R
100 120
Figure 4.- NO production for the Titan in-C at three altitudes.
140
18

CO
o>
rt
0)
oi
- ^ iCO
OrH
O3
O
aO
iin
drH
PM
I
g
19

10Or—
:ID'
1_ X
CD
cCDObC
O13COCDuCD
GO
U
IC 3
0)"oa -4
10
TemperatureNO
10'5
0
i / . / i
10
10
10
o
3 °
_o"rtCD
1CD
s10
10
1020 40 60 80 100 120 140
X/R
Figure 6.- Center-line mole fractions and temperature as function ofdownstream distance for plume of a Titan ni-C motor at an altitudeof 18 km with thrust vector control.
20

10°
lo-1
2
OJobD
O
13CO
&M
o• I-H
ort!H
CUi—iO
-3
io-5
-a 10:
/
•II
'/ // /
---NO
i *
i /./ i i i
IO
rt0)aaa;
102|0)U
io
2010
40 60 80X/R
100 120 140
Figure 7.- Center-line mole fractions and temperature as function ofdownstream distance for plume of a Titan III-C motor at an altitudeof 18 km without thrust vector control.
21

120 140
Figure 8.- Amount of species produced by a Titan III-C motor as function ofdownstream distance at an altitude of 18 km with thrust vector control.
22

10
10
CO2
20 40 60 80X/R
100 120 140
Figure 9.- Amount of species produced by a Titan III-C motor as function ofdownstream distance at an altitude of 18 km without thrust vector control.
23

H20
50 100 150 200X/R
250 300 350
Figure 10.- Center-line mole fractions of species appropriate to combustionas function of downstream distance for a Titan IEI-C motor at an altitudeof 1.2 km.
24

10°
10-1
.si—4
FH
I
o•SCOcuo0>
CO
10-2
-3o 10
Ioci
a;i—io
10-4
_c
I i
I
TemperatureNO
02
O
NO0
I
10*
10
10
50 100 150 200 250 300X/R
350
Figure 11.- Center-line mole fractions and temperature as function ofdownstream distance for plume of Titan III-C motor at an altitudeof 1.2 km.
Il-i
&Sa)CD
0)-4-J
0)O

300 350
Figure 12.- Amount of species produced in plume of a Titan HI-C motor asfunction of downstream distance at an altitude of 1.2 km.
26

3000,-
2400 -
2400 r-
1800
£•8s-i0)£Xa
1200
600
I I
X/R = 0 X/R = 50
a 180013tn0>aa£ 1200
600
o
_
—
1 1 1 i i 13 2 1 0 1 2 3
Y/R
1 I I24 16 8 0 8
Y/R16 24
X/R = 100 X/R = 150
I I I
36 24 12 0 12 24 36Y/R
48 32 16 0 16 32 48Y/R
Figure 13.- Cross-sectional temperature profiles at various downstreamdistances for a Titan III-C at 1.2 km.
27

3000 r—
2000Velocity,m/sec
1000
X/R = 0
X/R = 50
1 0 1Y/R
24 16 8 0 8 16 24Y/R
2000,—
Velocity, 1000m/sec
_b
X/R - 100 X/R = 150
36 24 12 0 12 24 36 48 32 16 0 16 32 48Y/R Y/R
Figure 14.- Cross-sectional velocity profiles at various downstreamdistances for a Titan IH-C at 1.2 km.
28

10°
10"1
0).s!-,
H U T 2<D0bOCOcJwQ)0
8,enIH 1 rv~"o 10c.2ort
<4H
CD
io-4
10-5
• I
— -*• —+*
S/
../ ,^""^- / _
//___^
/ """""""""""-— — . ~/ "" " ' —/
t_ / _I /" "" ~ — / ~
"~ - ^ / x ' "~^> . 2"* — -/ ^^^
/ X" ^N " - / ' N ~~ ^
/ \ ^/ ' \
/
\
\
1 /' ~
/ ^: \ ://// Temperature \
j N° \_// oa \ -// 2 V/' o \: /: N _
~ //i i // i . i i i i i . i i
5
io4
oTSH.3oj
3 v
&H
IO2
io1
1no0 20 40 60 80 100 120 140
X/R
Figure 15.- Center-line mole fractions and temperatures as functions of downstreamdistance for plume of a Titan III-C motor at an altitude of 5 km.
29

20 40 60 80X/R
120 140
Figure 16.- Center-line mole fractions of species appropriate to combustionas function of downstream distances for plume of a Titan III-C motor atan altitude of 5 km.
30

10
10"1
3
ic 2
c<i>obC
o13w(U
•I-Ho
cs30)
"o
10
ID'5
/ /X
Temperature^NO
02
O
t
\
I
^
1 1
10^
10
10I
g
H
10
10
20 40 60 80X/R
10100 120 140
Figure 17.- Center-line mole fractions and temperature as functions of downstream
distance for plume of a shuttle motor at an altitude of 0.7 km.
31

10
10'1
§*-| 10QJ 1U
-4-»
sO)obOGO
•aw<L>
•l-lo0)
& 10
I-4_>
3
-2
_ -3
o>i—io -4
10
10"5
V
/ ,?
/ // ',
,
I 1 I I
TemperatureNO
-O
-Cl
-N2
i I
\
l ,\
10:
io
O>aSo>
IO
io
20 40 60 80X/R
100 120 140
Figure 18.- Center-line mole fractions and temperature as functions of downstreamdistance for plume of a shuttle motor at an altitude of 5 km.
32

0)c
§0
bflC
CQ0)
8*
o3ortSH
«(H
0>^^o
20 40 60 80X/R
100 120 140
Tem
per
atu
re,
K
Figure 19.- Center-line mole fractions and temperature as functions of downstreamdistance for plume of a shuttle motor at an altitude of 15 km.
33

x— H
20 40 60 80X/R
100 140
Figure 20.- Center -line mole fractions of species appropriate to combustionas function of downstream distance for plume of a shuttle motor at analtitude of 0.7 km.
34

CD-M
CDU
o•a01CD•iHU0)aCO
o• rH-4->U
g
"4H
(U
40 80 120 160X/R
200 240 280
Figure 21.- Center-line mole fractions of species appropriate to combustionas function of downstream distance in plume of a shuttle motor at analtitude of 15 km.
35

3000
2000•rH Ql
1000
X/R - 0
I
X/R = 50
3 2 1 0 1Y/R
2 3 21 14 7 0 7Y/R
14 21
2000 r—
« 1000"s X/R = 100
i t- • i i
X/R = 150
33 22 11 0 11 22 33 36 24 12 0 12 24 36Y/R Y/R
Figure 22.- Cross-sectional velocity profiles at various downstream distancesfrom a shuttle motor at an altitude of 0.7 km.
36

30001—
2400
1800o>
Ia? 1200Q.a
600
0
X/R = 0
j_ I I Ii o
Y/R
X/R = 50
I21 14 7 0 7 14 21
Y/R
1800
I0)
IH
1200
600
X/R = 100 X/R - 150
1 133 22
I 1 l11 0 11
Y/R
1 122 33
I36 24 12 0 12 24 36
Y/R
Figure 23.- Cross-sectional temperature profiles at various downstream distancesfrom a shuttle motor at an altitude of 0.7 km.
37

3000
2000
$•r-i o
2 m
1000
0
—
1 1 , 1
X/R =
i 13 2 1 0 1 2 3
Y/R
X/R = 50
2 0 2Y/R
2000
oo
r-H0)
g 1000
X/R = 100
6 4f
0Y/R
2 4 6
X/R = 150
6 4 2 0Y/R
2 4 6
Figure 24.- Cross-sectional velocity profiles at various downstream distancesfrom a shuttle motor at an altitude of 15 km.
38

2400 i—
1800o
<3 1200a,a0>H
600
X/R = 0
I I I3 2 1 0 1
Y/R2 3 6 4
X/R = 50
2 0 2 4Y/R
24001-
1800
0)^1 1200
0)
600
X/R = 100 X/R - 150
I i I I I I I I
6 4 2 0 2 4 6 6 4 2 0 2 4 6Y/R Y/R
Figure 25.- Cross-sectional temperature profiles at various downstream distancesfrom a shuttle motor at an altitude of 15 km.
39

ai—io
73
Oi-O
73
Of-,
O
44 x 10
40
36
32
28
8
24
20
16
12
Aircraft penetration
Volume calculated fromcamera sites 9 and 26
Aircraft penetration
Land-ocean- interface
Least squares fit tomeasured data(extrapolated)
Volume calculated fromcamera sites 2 and 9
4 6
Time after launch, min
Figure 26.- Ground cloud volume as a function of time.
40

Total cloud mass, g
12
Relative humidity,
percent
2 3 4 5 6 7
Time after launch, min
Figure 27.- Ground cloud mass and mass dilution ratio as a function of time.
41

• c-l
s•*CO
+
crHain
oCO
qdd
- s
ooCD
§ o o oo o o•f ,. .v « <M
qdd <xotf pire QN
0o
--rtCQ0)ort
-s«rt(HO
OOCM
0)
oCD
o(M
qdd 'So
42

1 . O
1.6
x0fcX
s 1 - 4
s+ 1.2
-4-1
0*1.0X
•o -8a
.3a«+
-w
"Sacc
D
.6
"3.4o*-HU
I-3
.2
0
1 XNOX
at t + 5
- I
\ ucloud at t + 5
I U cloud\\ Least squares fit to measured cloud
_ L volume growth
\
\
\
\\\\
0 \\
\ O~ o -»
'*"•'-.
^ o"1 , 1 , 1 , 1 , 1 I...J — 1 — 1 — i — 124 280 4 8 12 16 20
Time after launch, min
Figure 29.- Ground cloud NOX concentration as a function of time.
32
NASA-Langley, 1976 L-10594 43

NATIONAL AERONAUTICS AND SPACE ADMINISTRATION
WASHINGTON. DC 2O546
OFFICIAL BUSINESS
PENALTY FOR PRIVATE USE $3OO SPECIAL FOURTH-CLASS RATEBOOK
POSTAGE AND FEES PAIDNATIONAL AERONAUTICS AND
SPACE ADMINISTRATION451
POSTMASTER If Undeliverable (Section 158Postal Manual) Do Not Return
"The aeronautical and space activities of the United States shall beconducted so as to contribute . to the expansion of human knowl-edge of phenomena in the atmosphere and space The Administrationshall provide for the widest practicable and appropriate disseminationof information concerning its activities and the results thereof"
—NATIONAL AERONAUTICS AND SPACE ACT OF 1958
NASA SCIENTIFIC AND TECHNICAL PUBLICATIONSTECHNICAL REPORTS Scientific andtechnical information considered important,complete, and a lasting contribution to existingknowledge
TECHNICAL NOTES Information less broadin scope but nevertheless of importance as acontribution to existing knowledge
TECHNICAL MEMORANDUMSInformation receiving limited distributionbecause of preliminary data, security classifica-tion, or other reasons Also includes conferenceproceedings with either limited or unlimiteddistribution.
CONTRACTOR REPORTS Scientific andtechnical information generated under a NASAcontract or grant and considered an importantcontribution to existing knowledge
TECHNICAL TRANSLATIONS Informationpublished in a foreign language consideredto merit NASA distribution in English
SPECIAL PUBLICATIONS Informationderived from or of value to NASA activities.Publications include final reports of majorprojects, monographs, data compilations,handbooks, sourcebooks, and specialbibliographies
TECHNOLOGY UTILIZATIONPUBLICATIONS Information on technologyused by NASA that may be of particularinterest in commercial and other non-aerospaceapplications Publications include Tech Briefs,Technology Utilization Reports andTechnology Surveys
Details on the availability of these publications may be obtained from:
SCIENTIFIC AND TECHNICAL INFORMATION OFFICE
N A T I O N A L A E R O N A U T I C S A N D S P A C E A D M I N I S T R A T I O N
Washington, D.C. 20546