the production and characterization of ceramic carbon ... · water electrolysis. the electrolysis...
TRANSCRIPT
The Production and Characterization
of Ceramic Carbon Electrode
Materials for CuCl-HCl Electrolysis
By
Patrick Edge
A Thesis Submitted in Partial Fulfillment
of the Requirements for the Degree of
Master of Science
In
The Faculty of Science
Materials Science
University of Ontario Institute of Technology
July 2013
© Patrick Edge, 2013
i
Abstract
Current H2 gas supplies are primarily produced through steam methane
reforming and other fossil fuel based processes. This lack of viable large scale and
environmentally friendly H2 gas production has hindered the wide spread adoption of H2
fuel cells. A potential solution to this problem is the Cu-Cl hybrid thermochemical cycle.
The cycle captures waste heat to drive two thermochemical steps creating CuCl as well
as O2 gas and HCl from CuCl2 and water. The CuCl is oxidized in HCl to produce H2 gas
and regenerate CuCl2, this process occurs at potentials well below those required for
water electrolysis.
The electrolysis process occurs in a traditional PEM fuel-cell. In the aqueous
anolyte media Cu(I) will form anionic complexes such as CuCl2- or CuCl3
2-. The slow
transport of these species to the anode surface limits the overall electrolysis process.
To improve this transport process we have produced ceramic carbon electrode (CCE)
materials through a sol-gel method incorporating a selection of amine containing silanes
with increasing numbers of primary and secondary amines. When protonated these
amines allow for improved transport of anionic copper complexes.
The electrochemical and physical characterization of these CCE materials in a
half and full-cell electrolysis environment will be presented. Electrochemical analysis
was performed using cell polarization, cyclic voltammetry, and electrochemical
impedance spectroscopy.
Keywords: CuCl-HCl electrolysis, ceramic carbon electrode, sol-gel, amine
functionalization

ii
Acknowledgements
I would like to give my deepest thanks to my supervisor Dr. Brad Easton for the
opportunity to work with him on my master’s thesis. You have been a tremendous help to me
in my studies for both my graduate and undergraduate schooling. I would also like to thank Dr.
Ranganathan Santhnam for the help he has given me in starting my research as well as the
foundations of the project which he laid before I started. Thank you to the rest of my
supervisory committee Dr. Igor Svishchev and Dr. Liliana Trevani as well as my external
supervisor Dr. Brian Ikeda for your input and comments; this is a far better document as a result.
To the rest of the faculty of the UOIT science department, thank you for making the last three
years of my life fly by. You have certainly made my graduate school experience memorable.
Thank you to the members of the Easton research group past and present. You have
been exceptionally helpful to me either through insightful comments or simply listening to me
ramble until I sort out the answer to my own problem. Specifically, thank you to Jennie Eastcott
for your continued help and expertise.
To my friends and family I would like to thank you for your overwhelming love and
support over the years. To my parents in particular, in any moment of doubt you have kept me
on the straight and narrow. Tremendous thanks to my wonderful fiancee Stephanie Mavilla
who has been wonderfully understanding while I have been slogging away and my work. I can
only hope to repay her in kind when she needs it. Additionally, thank you Aunt Tori for your
advice and encouragement.
Finally, I would like to acknowledge our research collaborators in the faculty of
Engineering and at AECL. I am only a small corner of this massive project and I am very happy to
have been a part of it.

iii
Contents Abstract ................................................................................................................................... i
Acknowledgements ................................................................................................................. ii
Table of Tables ....................................................................................................................... vi
Table of Figures ..................................................................................................................... vii
Common Abbreviations ......................................................................................................... xvi
Chapter 1 : Introduction to Hydrogen Production and Electrochemical Characterization
Techniques ................................................................................................................................. 1
1.1: Current H2 Production Methods ....................................................................................... 2
1.1.1: Production from fossil fuels. ...................................................................................... 2
1.1.2 Hydrogen production from water electrolysis. ............................................................ 4
1.2: Introduction to Thermochemical Cycles ............................................................................ 7
1.2.1: Conventional Thermochemical Cycles ........................................................................ 8
1.2.2: Hybrid Thermochemical Cycles .................................................................................. 9
1.2.3: Three Step Hybrid CuCl-HCl Thermochemical Cycle .................................................. 10
1.2.4: Research Targets for the Hybrid CuCl-HCl Thermochemical Cycle ............................. 14
1.3: CCE Materials ................................................................................................................. 14
1.3.1: Sol-Gel Method ....................................................................................................... 15
1.3.2: Ceramic Carbon Electrodes ...................................................................................... 18
1.4: Electrochemical Characterization Techniques ................................................................. 21
1.4.1: DC Voltammetry Techniques ................................................................................... 22
1.4.2: AC Electrochemical Impedance Spectroscopy .......................................................... 23
1.5: Thesis Objectives ............................................................................................................ 26
Chapter 2 : Experimental Methods and Instrumentation ........................................................... 28
2.1: Electrode Preparation .................................................................................................... 29
2.1.1: Sol Gel Production ....................................................................................................... 29
2.1.2: Half-Cell Electrode Production ................................................................................. 29
2.1.3: Full-Cell Electrode Production .................................................................................. 29
2.1.4: Cathode Pt/C Electrode Production ......................................................................... 30
2.2: Materials Characterization ............................................................................................. 31
2.2.1: TGA Weight Characterization ................................................................................... 31
2.2.2: SEM Imaging ............................................................................................................ 31

iv
2.2.3: TEM Imaging ............................................................................................................ 31
2.3: Full-Cell Production and Design ...................................................................................... 31
2.3.1: Original Design ........................................................................................................ 32
2.3.2: Iterative Designs ...................................................................................................... 32
2.3.3: Catholyte/Anolyte Preparation ................................................................................ 35
2.3.4: Membrane Electrode Assembly Fabrication and Full-Cell Construction .................... 35
2.4: Electrochemical Characterization ................................................................................... 36
2.4.1: Half-Cell Electrochemical Techniques ....................................................................... 36
2.4.2: Full-Cell Electrochemical Techniques ....................................................................... 37
2.4.3: Ultra Micro Electrode Measurements ...................................................................... 37
Chapter 3 : Materials for Half Cell Electrolysis ........................................................................... 38
3.1: Materials Characterization Results ................................................................................. 39
3.2: Electrochemical Characterization Results ....................................................................... 41
3.2.1: Electrochemical Results for 1N Materials ................................................................. 42
3.2.2: Electrochemical Results for 2N Materials ................................................................. 47
3.2.3: Electrochemical Results for 3N Materials ................................................................. 52
3.3: Discussion of Half-Cell Materials ..................................................................................... 57
3.3.1: 1N Materials ............................................................................................................ 57
3.3.2: 2N Materials ............................................................................................................ 58
3.3.3: 3N Materials ............................................................................................................ 59
3.3.4: Comparison of Varied Silane Types .......................................................................... 60
Chapter 4 : Materials for Full-Cell Electrolysis ............................................................................ 62
4.1: Results ........................................................................................................................... 66
4.1.1: Results for 1N Materials .......................................................................................... 66
4.1.2: Results for Varied CCE Loadings (1N) ....................................................................... 81
4.1.3: Results for Varied Silanes ......................................................................................... 92
4.2: Discussion .................................................................................................................... 112
4.2.1: 1N Materials .......................................................................................................... 112
4.2.2: Varied CCE Loadings (1N) ....................................................................................... 115
4.2.3: 2N Materials .......................................................................................................... 117
4.2.4: 3N Materials .......................................................................................................... 118
4.2.5: Comparison of Varied Silane Types ........................................................................ 120

v
Chapter 5 : Materials Durability and Copper Crossover Resistance .......................................... 130
5.1: Copper Crossover Identification ................................................................................... 132
5.2: Comparison of materials crossover resistances ............................................................. 133
5.3: Cell Regeneration ......................................................................................................... 136
5.4: Ultra-Micro Electrode Measurements .......................................................................... 138
Chapter 6 : Conclusions and Future Directions ........................................................................ 141
6.1: Conclusions .................................................................................................................. 142
6.2: Future Directions .......................................................................................................... 144
Chapter 7 : References ............................................................................................................ 146
Chapter 8 : Appendices ........................................................................................................... 153

vi
Table of Tables
Table 1-1: General Half-Cell reactions for the electrolysis of water in alkaline and acidic liquid
environments 5. .......................................................................................................................... 4
Table 1-2: The general Half-Cell reactions for the electrolysis of water for high temperature solid
oxide electrolysis cells with O2- as the mobile ion ........................................................................ 6
Table 1-3: The stepwise chemical reactions for the production of H2 and O2 gas in the Sulfur-
Iodine thermochemical cycle ...................................................................................................... 8
Table 1-4: The stepwise chemical reactions and electrochemical half-cell reactions for the Hybrid
Sulfur thermochemical cycle13. .................................................................................................... 9
Table 1-5: The stepwise chemical and electrochemical half-cell equations for the three, four, and
five step hybrid CuCl-HCl thermochemical cycle4. ...................................................................... 11
Table 3-1: Compositions of CCE materials for half-cell testing produced with 1N, 2N, and 3N
silane precursors. ...................................................................................................................... 41
Table 3-2: Total Resistance of 1N CCE materials. As determined from Warburg region of
impedance plots. ...................................................................................................................... 43
Table 3-3: Total Resistance of 2N CCE materials. As determined from Warburg region of
impedance plots. ...................................................................................................................... 49
Table 3-4: Total Resistance of 3N CCE materials. As determined from Warburg region of
impedance plots. ...................................................................................................................... 55
Table 4-1: 1N CCE materials for full-cell electrolysis compositional information. ....................... 66
Table 4-2: 1N CCE materials with varied total mass loadings for full-cell electrolysis:
compositional information. ....................................................................................................... 82
Table 4-3: 2N and 3N CCE materials for full-cell electrolysis: compositional Information. .......... 92
Table 5-1: Bare CFP and CCE materials for full-cell electrolysis: Cu crossover resistance and
sample compositional information. ......................................................................................... 134

vii
Table of Figures
Figure 1-1: Schematic Diagram of PEM Electrolyzer with associated half-cell equations. ............ 6
Figure 1-2: Schematic of general thermochemical cycle processes. ............................................. 7
Figure 1-3: Schematic Diagram for the electrolysis of SO2 and production of H2 gas in a PEM style
electrolyzer for the Hybrid Sulfur thermochemical cycle. Diagram based on work of Staser JA and
Weidner JW 13. ............................................................................................................................ 9
Figure 1-4: Schematic Diagram for the electrolysis of CuCl in the presence of HCl and the
production of H2 gas in a PEM style electrolyzer Hybrid three step CuCl-HCl thermochemical
cycle18. ...................................................................................................................................... 12
Figure 1-5: An overview of the sol-gel process and the reaction pathways to the various
products30. Reproduced with permission of TAYLOR & FRANCIS GROUP LLC in the format
Republish in a thesis/dissertation via Copyright Clearance Center. ............................................ 16
Figure 1-6: The base catalyzed hydrolysis of a silane monomer. ................................................ 16
Figure 1-7: The acid catalyzed hydrolysis of a silane precursor. ................................................. 17
Figure 1-8: The base catalyzed condensation reaction between two silane monomers. ............. 17
Figure 1-9: The acid catalyzed condensation reaction between two silane monomers. ............. 17
Figure 1-10: Silane monomers from top to bottom: (3-Aminopropyl)triethoxysilane, N-[3-
(Trimethoxysilyl)propyl]ethylenediamine, and N1-(3-Trimethoxysilylpropyl)diethylenetriamine.
1N, 2N, 3N respectively. ............................................................................................................ 20
Figure 1-11: The Finite Transmission Line Model Circuit for modeling a PEM electrode. Diagram
based on work of Li, G. and Pickup, P. 41. ................................................................................... 24
Figure 1-12 : Nyquist plot at 0 V vs. OCV of ceramic carbon electrode with Warburg region
detailed and RMembrane = 0. ......................................................................................................... 25
Figure 2-1: Serpentine flow path for the spray coating of CCE materials onto CFP backings ....... 30
Figure 2-2: Initial Electrolysis Cell Design with analogue pump, 5 cm2 cell, and barbed fittings
(Not Pictured: Recirculated Flow Lines). .................................................................................... 32
Figure 2-3: Iterative Electrolysis Cell Design with digital peristaltic pump, 5 cm2 cell, barbed
fittings, and recirculated electrolyte flow. ................................................................................. 33
Figure 2-4: Full Electrolysis Cell Schematic Diagram. Coloured lined are included to identify
individual flow paths. ................................................................................................................ 34
Figure 2-5: Current Electrolysis Cell Design with digital peristaltic pump, 5 cm2 cell, barbed
fittings, and recirculated electrolyte flow (temperature controller not pictured). ...................... 35

viii
Figure 3-1: Example TGA spectra of 1N CCE Materials under flowing air with temperatures
ramped from 20-1000 °C at 20 °C min-1. Mass percent normalized at 200 °C. ........................... 39
Figure 3-2: Capacitive CV of CCE materials with varied 1N silane loading and normalized for
geometric surface area (SA). Experiment performed in 1.5 M HCl under N2 atmosphere. Scan
from 0.15 to 0.85 V vs. RHE at 50 mv s-1. ................................................................................... 42
Figure 3-3: Impedance and capacitance plots of CCE materials with varied 1N silane content.
Collected in 1.5 M HCl under N2 atmosphere. (A) Nyquist plot (B) High frequency region (C)
Capacitance plot normalized for the total mass of carbon present in the CCE sample................ 44
Figure 3-4: Potential stair step measurement of CCE materials with varied 1N silane
compositions. Scanned from 0.35-0.85 V vs. RHE with 10 mV steps and 3 s dwell times.
Electrochemical measurement were collected in 1 mM CuCl in 1.5 M HCl under N2 atmosphere
electrolyte. ............................................................................................................................... 45
Figure 3-5: Potentiostatic measurements of CCE materials with varied 1N silane compositions.
Potential held at 0.6 V vs. RHE. Collected in 1 mM CuCl in 1.5 M HCl under N2 atmosphere
electrolyte. ............................................................................................................................... 46
Figure 3-6: Relationship between 1N silane composition and current response from
potentiostatic holds. Value taken from current at 150 s. .......................................................... 47
Figure 3-7: Capacitive CV of CCE materials with varied 2N silane loading and normalized for
Geometric SA. Collected in 1.5 M HCl under N2 atmosphere. Scan from 0.15 to 0.85 V vs. RHE at
50 mv s-1. .................................................................................................................................. 48
Figure 3-8: Impedance and Capacitance plots of CCE materials with varied 2N silane content.
Tests were performed in 1.5 M HCl under N2 atmosphere at 0 V vs. OCV. (A) Nyquist plot (B)
High frequency region (C) Capacitance plot. .............................................................................. 50
Figure 3-9: Potential stair step measurement of CCE materials with varied 2N silane
compositions. Scanned from 0.35-0.85 V vs. RHE with 10 mV steps and 3 s dwell times.
Collected in 1 mM CuCl in 1.5 M HCl under N2 atmosphere electrolyte. (A) Working plots (B)
Transient current plot included. ................................................................................................ 51
Figure 3-10: Potentiostatic measurements of CCE materials with varied 2N silane compositions.
Potential held at 0.6 V vs. RHE. Experiments performed in 1 mM CuCl in 1.5 M HCl under N2
atmosphere electrolyte. (A) Scaled to show difference between materials (B) Scaled to keep the
same maximum current as shown in Figure 3-5 for comparison. ............................................... 52

ix
Figure 3-11: Capacitive CV of CCE materials with varied 3N silane loading and normalized for
geometric SA. Collected in 1.5 M HCl under N2 atmosphere. Scan from 0.15 to 0.85 V vs. RHE at
50 mv s-1. .................................................................................................................................. 53
Figure 3-12: Impedance and capacitance plots of CCE materials with varied 3N silane content.
Tests were performed in 1.5 M HCl under N2 atmosphere at 0 V vs. OCV. (A) Nyquist plot (B)
High frequency region (C) Capacitance plot. .............................................................................. 54
Figure 3-13: Potential stair step Measurement of CCE materials with varied 3N silane
compositions. Scanned from 0.35-0.85 V vs. RHE with 10 mV steps and 3 s dwell times.
Collected in 1 mM CuCl in 1.5 M HCl under N2 atmosphere electrolyte. (A) Working plots (B)
Transient current plot included. ................................................................................................ 56
Figure 3-14: Potentiostatic measurements of CCE materials with varied 3N silane compositions.
Potential held at 0.6 V vs. RHE. Tests were performed in 1 mM CuCl in 1.5 M HCl under N2
atmosphere electrolyte. ............................................................................................................ 57
Figure 3-15: Potentiostatic measurements of CCE materials produced with 1N, 2N and 3N silane
precursors. Potential held at 0.6 V vs. RHE. Tests were performed in 1 mM CuCl in 1.5 M HCl
under N2 atmosphere electrolyte. ............................................................................................. 61
Figure 4-1: Comparison of CuCl and H2O electrolysis with a Pt/C anode and cathode catalyst.
CuCl electrolysis collected in 0.2 M CuCl in 2 M HCl anolyte and DI H2O catholyte both under N2
atmosphere at 14 mL min-1 electrolyte flow rate. Water electrolysis collected in DI H2O
electrolyte at cathode and anode under N2 atmosphere at 14 mL min-1 flow rate. .................... 64
Figure 4-2: Comparison of linear sweep and potential stair step measurements at equivalent
scan rates. Tests were performed in 0.2 M CuCl in 2 M HCl anolyte and DI H2O catholyte both
under N2 atmosphere at 60 mL min-1 electrolyte flow rate. ....................................................... 65
Figure 4-3: SEM images taken of CCE samples B1P73S2, B1P69S1, B1P69S2, and B1P69S3 at 100
and 2500 x magnification. ......................................................................................................... 68
Figure 4-4: Capacitive CV of CCE materials with varied 1N silane loading. 10 mV s-1 scan rate
from 0.2 to 1.0 V vs. RHE. Current normalized for geometric SA and for mass of carbon. In 2 M
HCl under N2 atmosphere at 60 mL min-1 anolyte flow rate. (A) Area specific (B) Carbon mass
normalized. ............................................................................................................................... 70
Figure 4-5: Nyquist plots of varied 1N silane content CCEs. Collected at 0 V vs. OCV in 2 M HCl
anolyte under N2 atmosphere at 60 mL min-1 anolyte flow rate and 25 mL min-1 H2 gas provided
to the cathode. (A) Nyquist plot (B) High frequency region. ....................................................... 71

x
Figure 4-6: Capacitance plots of varied 1N silane content CCEs. Tests were performed at 0 V vs.
OCV in 2 M HCl anolyte under N2 atmosphere at 60 mL min-1 anolyte flow rate and 25 mL min-1
H2 gas provided to the cathode. (A) Area specific capacitance (B) Mass of carbon normalized (C)
Capacitance normalized to 1. .................................................................................................... 72
Figure 4-7: Potential stair step measurements of 27.2 wt% CCE at varied flow rates. Scanned
from 0.2 to 1.2 V with 5 mV steps and 0.5 s dwell time per step. Tests were performed in 0.2 M
CuCl in 2 M HCl anolyte and DI H2O catholyte both under N2 atmosphere at 60 mL min-1
electrolyte flow rate. ................................................................................................................ 73
Figure 4-8: Potential stair step measurements of CCE’s with varied 1N silane composition.
Scanned from 0.2-1.2 V with 5 mV steps and 0.5 s dwell time per step. Experiment performed in
in 0.2 M CuCl in 2M HCl anolyte and DI H2O catholyte both under N2 atmosphere at 60 mL min-1
electrolyte flow rate. (A) Enlarged onset potential region from 0.3 to 0.5 V vs. RHE. ................ 74
Figure 4-9: Current Trends of CCEs with varied 1N silane content at 0.7 and 1.1 V and varied flow
rates. The experiments were performed in 0.2 M CuCl in 2 M HCl anolyte and DI H2O catholyte
both under N2 atmosphere at 40, 60, 80, and 100 mL min-1 electrolyte flow rate. Scanned from
0.2 to 1.2 V vs. RHE with 5 mV steps and 0.5 s dwell time per step. (A) Current density at 0.7 V
vs. RHE (B) Current density at 1.1 V vs. RHE. .............................................................................. 76
Figure 4-10: Potentiostatic Holds of the 27.18 wt% CCE at 0.7 V. The experiments were
performed in 0.2 M CuCl in 2 M HCl anolyte and DI H2O catholyte both under N2 atmosphere at
40, 60, 80, and 100 mL min-1 electrolyte flow rate. .................................................................... 77
Figure 4-11: Comparison of current response dependence on flow rate at 0.7 V for 27.18 wt% Si
CCE. Both experiments were performed in 0.2 M CuCl in 2 M HCl anolyte and DI H2O catholyte
both under N2 atmosphere at 40, 60, 80, and 100 mL min-1 electrolyte flow rate. ..................... 78
Figure 4-12: Potentiostatic holds at 0.7 V for the 32.4 wt% Si CCE. Experiments performed in 0.2
M CuCl in 2 M HCl anolyte and DI H2O catholyte both under N2 atmosphere at 40 and 60 mL min-
1 electrolyte flow rate. Copper crossover visible after approximately 400 s. ............................. 79
Figure 4-13: Potentiostatic hold current trends of CCEs with varied 1N silane content at 0.7 V
and varied flow rates. The experiments were performed in 0.2 M CuCl in 2 M HCl anolyte and DI
H2O catholyte both under N2 atmosphere at 40, 60, 80, and 100 mL min-1 electrolyte flow rate.
Potential held at 0.7 V vs. RHE, current value taken at 150 s. (A) Area specific (B) Carbon mass
normalized. ............................................................................................................................... 80

xi
Figure 4-14: Relationship of 1N silane composition to current response in potentiostatic holds
taken at 0.7 V. Experiment was performed in 0.2 M CuCl in 2 M HCl anolyte and DI H2O
catholyte both under N2 atmosphere at 40 mL min-1 electrolyte flow rate. ................................ 81
Figure 4-15: Capacitive CV of CCE materials with 30±3% 1N silane loading and varied total CCE
mass loadings. 10 mV s-1 scan rate from 0.2 to 1.0 V vs. RHE. Current normalized for geometric
SA and for mass of carbon. In 2 M HCl under N2 atmosphere at 60 mL min-1 anolyte flow rate.
(A) Area specific (B) Carbon mass normalized. ........................................................................... 84
Figure 4-16: Nyquist plots of CCE’s with 30±3% 1N silane content and varied total mass loadings.
Experiments were performed in 2 M HCl anolyte under N2 atmosphere at 60 mL min-1 anolyte
flow rate and 25 mL min-1 H2 gas provided to the cathode. (A) Nyquist plot (B) High frequency
region. ...................................................................................................................................... 85
Figure 4-17: Capacitance plots of 30±3% 1N silane content CCEs with varied total mass loadings.
Experiment was performed in 2 M HCl anolyte under N2 atmosphere at 60 mL min-1 anolyte flow
rate and 25 mL min-1 H2 gas provided to the cathode. (A) Area specific capacitance (B) Mass of
carbon normalized. ................................................................................................................... 86
Figure 4-18: Potential stair step measurements of CCEs with 30±3% 1N silane composition and
varied total CCE mass loadings. Scanned from 0.2 to 1.2 V with 5 mV steps and 0.5 s dwell time
per step. Experiment performed in 0.2 M CuCl in 2 M HCl anolyte and DI H2O catholyte both
under N2 atmosphere at 60 mL min-1 electrolyte flow rate. ....................................................... 87
Figure 4-19: Current Trends of CCEs with 30±3% 1N silane composition and varied total CCE
mass loading at 0.7 and 1.1 V and varied flow rates. Tests performed in 0.2 M CuCl in 2 M HCl
anolyte and DI H2O catholyte both under N2 atmosphere at 40, 60, 80, and 100 mL min-1
electrolyte flow rate. Scanned from 0.2-1.2 V vs. RHE with 5 mV steps and 0.5s dwell time per
step. (A) Current density at 0.7 V vs. RHE (B) Current density at 1.1 V vs. RHE. ......................... 89
Figure 4-20: Potentiostatic hold current trends of CCEs with 30±3% 1N silane composition and
varied total CCE mass loadings at 0.7 V vs. RHE and varied flow rates. Tests performed in 0.2 M
CuCl in 2 M HCl anolyte and DI H2O catholyte both under N2 atmosphere at 40, 60, 80, and 100
mL min-1 electrolyte flow rate. Potential held at 0.7 V, current value taken at 150 s. ................ 90
Figure 4-21: Relationship of total CCE mass loading to current response in potentiostatic holds
taken at 0.7 V. Collected in 0.2 M CuCl in 2 M HCl anolyte and DI H2O catholyte both under N2
atmosphere at 40 mL min-1 electrolyte flow rate. ...................................................................... 91

xii
Figure 4-22: Normalized capacitance plot of 30±3% 1N silane content CCEs with varied total
mass loadings. Tests performed at 0 V vs. OCV in 2 M HCl anolyte under N2 atmosphere at 60
mL min-1 anolyte flow rate and 25 mL min-1 H2 gas provided to the cathode. ............................. 91
Figure 4-23: TEM Images of B1P69S1 1N material (A) and B1P83S1 2N material (B) at 92000 and
180000x magnification respectively. ......................................................................................... 93
Figure 4-24: SEM images taken of CCE samples B1P81S1, B1P81S2, and B1P83S1 at 100 and
2500 x magnification ................................................................................................................. 94
Figure 4-25: SEM images taken of CCE samples B1P85S2, B1P85S1, and B1P85S3 at 100 and
2500 x magnification. ................................................................................................................ 95
Figure 4-26: Capacitive CV of CCE materials with varied 2N silane loading. 10 mV s-1 scan rate
from 0.2 to 1.0 V vs. RHE. Current normalized for geometric SA and for mass of carbon. In 2 M
HCl under N2 atmosphere at 60 mL min-1 anolyte flow rate. (A) Area specific (B) Carbon mass
normalized. ............................................................................................................................... 97
Figure 4-27: Nyquist plots of varied 2N silane content CCEs. Tests performed at 0 V vs. OCV in 2
M HCl anolyte under N2 atmosphere at 60 mL min-1 anolyte flow rate and 25 mL min-1 H2 gas
provided to the cathode. (A) Nyquist plot (B) High frequency region. ....................................... 98
Figure 4-28: Capacitance plots of CCEs with varied 2N silane content. Experiments performed at
0 V vs. OCV in 2 M HCl anolyte under N2 atmosphere at 60 mL min-1 anolyte flow rate and 25 mL
min-1 H2 gas provided to the cathode. (A) Area specific capacitance (B) Mass of carbon
normalized (C) Capacitance normalized to 1.............................................................................. 99
Figure 4-29: Potential stair step measurements of CCE’s with varied 2N silane composition.
Scanned from 0.2 to 1.2 V with 5 mV steps and 0.5 s dwell time per step. Tests performed in 0.2
M CuCl in 2 M HCl anolyte and DI H2O catholyte both under N2 atmosphere at 60 mL min-1
electrolyte flow rate. .............................................................................................................. 100
Figure 4-30: Current Trends of CCEs with varied 2N silane content at 0.7 and 1.1 V and varied
flow rates. Tests performed in 0.2 M CuCl in 2 M HCl anolyte and DI H2O catholyte both under
N2 atmosphere at 40, 60, 80, and 100 mL min-1 electrolyte flow rate. Scanned from 0.2 to 1.2 V
vs. RHE with 5 mV steps and 0.5 s dwell time per step. (A) Current density at 0.7 V vs. RHE (B)
Current density at 1.1 V vs. RHE. ............................................................................................. 101
Figure 4-31: Potentiostatic hold current trends of CCEs with varied 2N silane content at 0.7 V
and varied flow rates. Tests performed in 0.2 M CuCl in 2 M HCl anolyte and DI H2O catholyte

xiii
both under N2 atmosphere at 40, 60, 80, and 100 mL min-1 electrolyte flow rate. Potential held
at 0.7 V vs. RHE, current value taken at 150 s. (A) Area specific (B) Carbon mass normalized. . 102
Figure 4-32: Relationship of 2N silane composition to current response in potentiostatic holds
taken at 0.7 V. Experiments performed in 0.2 M CuCl in 2 M HCl anolyte and DI H2O catholyte
both under N2 atmosphere at 40 mL min-1 electrolyte flow rate. ............................................. 104
Figure 4-33: Capacitive CV of CCE materials with varied 3N silane loading. 50 mV s-1 scan rate
from 0.2 to 1.0 V vs. RHE. Current normalized for geometric SA and for mass of carbon. In 2 M
HCl under N2 atmosphere at 60 mL min-1 anolyte flow rate. (A) Area specific (B) Carbon mass
normalized. ............................................................................................................................. 105
Figure 4-34: Nyquist plots of varied 3N silane content CCEs. Experiment performed at 0 V vs.
OCV in 2 M HCl anolyte under N2 atmosphere at 60 mL min-1 anolyte flow rate and 25 mL min-1
H2 gas provided to the cathode. (A) High frequency region (B) Full nyquist plot. .................... 107
Figure 4-35: Capacitance plots of CCEs with varied 3N silane content. Experiment performed at
0 V vs. OCV in 2 M HCl anolyte under N2 atmosphere at 60 mL min-1 anolyte flow rate and 25 mL
min-1 H2 gas provided to the cathode. (A) Area specific capacitance (B) Mass of carbon
normalized (C) Capacitance normalized to 1............................................................................ 108
Figure 4-36: Potential stair step measurements of CCEs with varied 3N silane composition.
Scanned from 0.2-1.2 V with 5 mV steps and 0.5 s dwell time per step. Collected in 0.2 M CuCl in
2 M HCl anolyte and DI H2O catholyte both under N2 atmosphere at 60 mL min-1 electrolyte flow
rate. ........................................................................................................................................ 109
Figure 4-37: Current Trends of CCEs with varied 3N silane content at 0.7 and 1.1 V and varied
flow rates. Experiments performed in 0.2 M CuCl in 2 M HCl anolyte and DI H2O catholyte both
under N2 atmosphere at 40, 60, 80, and 100 mL min-1 electrolyte flow rate. Scanned from 0.2 to
1.2 V vs. RHE with 5 mV steps and 0.5 s dwell time per step. (A) Current density at 0.7 V vs. RHE
(B) Current density at 1.1 V vs. RHE. ........................................................................................ 110
Figure 4-38: Potentiostatic hold current trends of CCEs with varied 3N silane content at 0.7 V
and varied flow rates. Experiments performed in 0.2 M CuCl in 2 M HCl anolyte and DI H2O
catholyte both under N2 atmosphere at 40, 60, 80, and 100 mL min-1 electrolyte flow rate.
Potential held at 0.7 V vs. RHE, current value taken at 150 s. (A) Area specific (B) Carbon mass
normalized. ............................................................................................................................. 111

xiv
Figure 4-39: Relationship of 3N silane composition to current response in potentiostatic holds
taken at 0.7 V. Collected in 0.2 M CuCl in 2 M HCl anolyte and DI H2O catholyte both under N2
atmosphere at 40 mL min-1 electrolyte flow rate. .................................................................... 112
Figure 4-40: Nyquist and Capacitance plots of CCEs with representative compositions from 1N,
2N, and 3N silane precursors. Representative compositions of the silanes were used. Collected
in 2 M HCl anolyte under N2 atmosphere at 60 mL min-1 anolyte flow rate and 25 mL min-1 H2 gas
provided to the cathode. (A) High frequency region Nyquist plot (B) Mass of carbon normalized
capacitance plot. ..................................................................................................................... 121
Figure 4-41: Example of the integrated area for the forward scan integration of capacitive CVs.
............................................................................................................................................... 122
Figure 4-42: Total charge from capacitive CV measurements taken at 50 mV s-1 in relation to the
molar loading of silane in the CCE material. ............................................................................ 123
Figure 4-43: Total charge from capacitive CV measurements taken at 50 mV s-1 in relation to the
molar content of amines in the CCE material. ......................................................................... 124
Figure 4-44: Comparison of best potential stair step mearuements for 1N, 2N, and 3N CCEs as
well as bare CFP and standard Pt/C catalyst materials. Scanned from 0.2 to 1.2 V with 5 mV
steps and 0.5 s dwell time per step. Collected in 0.2 M CuCl in 2 M HCl anolyte and DI H2O
catholyte both under N2 atmosphere at 60 mL min-1 electrolyte flow rate. .............................. 125
Figure 4-45: Relationship between silane loading and mass of carbon normalized limiting current
taken from potentiostatic measurements. .............................................................................. 126
Figure 4-46: Comparison of CCE capacitance and mass of carbon specific limiting current taken
from potentiostatic holds. ....................................................................................................... 127
Figure 4-47: Comparison of area normalized current response to potentiostatic holds for all 1N,
2N, and 3N materials. ............................................................................................................. 128
Figure 4-48: Comparison of best area normalized current responses to potentiostatic holds from
1N, 2N, and 3N CCE materials as well as control electrodes. .................................................... 128
Figure 5-1: 18000x magnification TEM image of Pt/C cathode catalyst before operation (A) and
after Cu plating had occurred (B). ........................................................................................... 131
Figure 5-2: SEM Images of Cu Dendrites grown on 0.3 mg Pt cm-2 catalyst cathode (A) and Cu
metal impregnated into the Nafion 115 PEM (B) after electrolysis cell failure. ........................ 132

xv
Figure 5-3: Picture of 0.3 mg Pt cm-2 catalyst cathode (A) and cathode side of the Nafion 115
PEM (B) for the CuCl-HCl electrolysis process after significant Cu crossover and plating has
occurred (Red/brown colour is Cu metal). ............................................................................... 132
Figure 5-4 : Examples of transient currents during potentiostatic measurements. ................... 133
Figure 5-5: Total charge at time of cell failure for CCE materials and Bare CFP control. ............ 136
Figure 5-6: Example crossover and cell regeneration of the 50 wt% 1N CCE (B1P69S2) during 0.7
V potentiostatic holds (Red) with 0 V regeneration holds (Blue). Experiments performed in 0.2
M CuCl in 2 M HCl anolyte and DI H2O catholyte both under N2 atmosphere at 60 mL min-1
electrolyte flow rate. .............................................................................................................. 138
Figure 5-7: Linear sweep voltammetry from 0.1 to 1.0 V at 20 mV s-1 scan rate of CuCl at varied
concentrations in 2 M HCl under N2 atmosphere. .................................................................... 139
Figure 5-8: Relationship between Cu concentration in 2 M HCl and current amplitude. Low
concentration values expanded and inset. Data taken from Figure 5-7. .................................. 140

xvi
Common Abbreviations 1N - (3-Aminopropyl)triethoxysilane,
2N - N-[3-(Trimethoxysilyl)propyl]ethylenediamine
3N - N1-(3-Trimethoxysilylpropyl)diethylenetriamine
AC – Alternating Current
Ag/AgCl – Silver/Silver Chloride Electrode
CCE – Ceramic Carbon Electrode
CFP – Carbon Fiber Paper
CV – Cyclic Voltammetry
DC – Direct Current
EIS – Electrochemical Impedance Spectroscopy
gCarbon – Grams of Carbon
HER – Hydrogen Evolution Reaction
LSV – Linear Sweep Voltammetry
M – Mols L-1
MEA – Membrane Electrode Assembly
mmol - milimole
OCV/OCP – Open Circuit Voltage / Open Circuit Potential
PEM – Proton Exchange Membrane / Polymer Electrolyte membrane
POX – Partial Oxidation
Pt/C – Platinum on Carbon Support
RHE – Reversible Hydrogen Electrode
RΣ – Sum of Ionic and Electronic Resistance
SCE – Saturated Calomel Electrode
SEM – Scanning Electron Microscopy
SHE – Standard Hydrogen Electrode

xvii
TEM – Transmission Electron Microscopy
TGA – Thermogravimetric Analysis
Z’ – Real Impedance
Z” – Imaginary Impedance

1
Chapter 1 : Introduction to Hydrogen Production and
Electrochemical Characterization Techniques

2
Currently the bulk of the world’s power demands are met by non-renewable
technologies such as gas or coal fire power plants1,2. In the case of distributed power supplies
such as vehicles and generators, gasoline consumption creates a considerable amount of volatile
organic compounds as well as nitrous oxide and carbon monoxide1. This is combined with the
consumption of a non-renewable resource. The overall energy demands of the world are also
expected to increase by an amount more than double the projected population increase by
20502. Compounding this, in America alone, it has been shown that pollutants could be
affecting the lives and/or the surrounding environment of half of the population1.
There is an obvious need for a renewable energy technology to replace existing non-
renewables and to meet growing demands. While this would in essence free us from non-
renewable fuels, there is also need to develop technologies to carry the energy produced2.
Hydrogen gas has potential as a fuel for distributed power sources, as it can be produced from a
wide variety of fuel sources both through the consumption of renewable products such as
biomass or through various electrolysis procedures1,2. In the interim, hydrogen can also be
produced from fossil fuels in a non-renewable manner. When consumed within a standard PEM
fuel cell or combusted, the sole product is water (Equation 1-1)3.
Equation 1-1
Additionally, hydrogen gas can be reacted with carbon dioxide to produce liquid hydrocarbons,
alcohols, or other high value products via the Fisher-Tropsch process amongst others1.
1.1: Current H2 Production Methods
There are a variety of technologies that allow for the production of hydrogen gas,
though there are associated drawbacks with each. The most widely adopted method is the
steam reforming of fossil fuels. In addition to this method there is the gasification of biomass,
the production of biological hydrogen, and finally the electrolysis of water.
1.1.1: Production from fossil fuels.
Conversion of fossil fuels to H2 gas currently accounts for approximately 97% of the
world’s H2 production4. For most of the fossil fuel conversion, steam reforming is used. The
reforming process can use a wide variety of fossil fuel products, but most often simple methane
is used, accounting for more than half of the world’s reforming process5. In its most basic sense
3
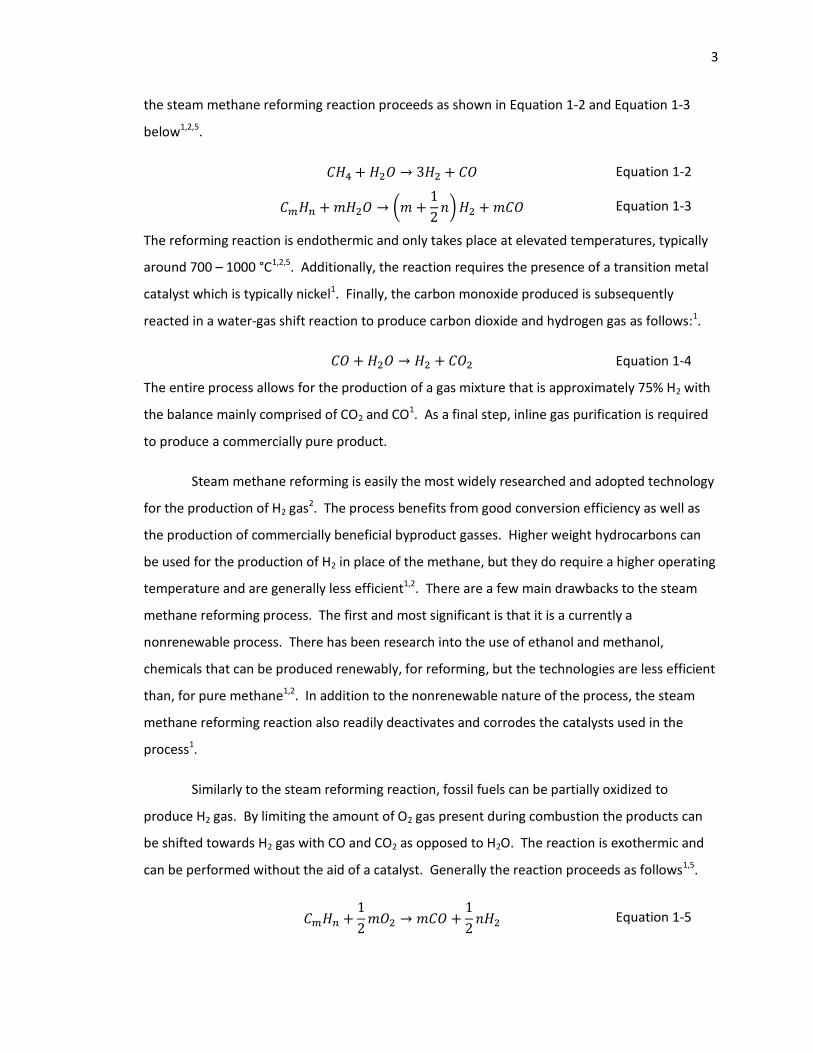
the steam methane reforming reaction proceeds as shown in Equation 1-2 and Equation 1-3
below1,2,5.
Equation 1-2
(
) Equation 1-3
The reforming reaction is endothermic and only takes place at elevated temperatures, typically
around 700 – 1000 °C1,2,5. Additionally, the reaction requires the presence of a transition metal
catalyst which is typically nickel1. Finally, the carbon monoxide produced is subsequently
reacted in a water-gas shift reaction to produce carbon dioxide and hydrogen gas as follows:1.
Equation 1-4
The entire process allows for the production of a gas mixture that is approximately 75% H2 with
the balance mainly comprised of CO2 and CO1. As a final step, inline gas purification is required
to produce a commercially pure product.
Steam methane reforming is easily the most widely researched and adopted technology
for the production of H2 gas2. The process benefits from good conversion efficiency as well as
the production of commercially beneficial byproduct gasses. Higher weight hydrocarbons can
be used for the production of H2 in place of the methane, but they do require a higher operating
temperature and are generally less efficient1,2. There are a few main drawbacks to the steam
methane reforming process. The first and most significant is that it is a currently a
nonrenewable process. There has been research into the use of ethanol and methanol,
chemicals that can be produced renewably, for reforming, but the technologies are less efficient
than, for pure methane1,2. In addition to the nonrenewable nature of the process, the steam
methane reforming reaction also readily deactivates and corrodes the catalysts used in the
process1.
Similarly to the steam reforming reaction, fossil fuels can be partially oxidized to
produce H2 gas. By limiting the amount of O2 gas present during combustion the products can
be shifted towards H2 gas with CO and CO2 as opposed to H2O. The reaction is exothermic and
can be performed without the aid of a catalyst. Generally the reaction proceeds as follows1,5.
Equation 1-5

4
Equation 1-6
While exothermic, the partial oxidation reaction must be carried out at high temperatures
between 1200 and 1450°C, to drive the formation of H2 gas. The reaction produces H2 in a lower
concentration than the steam methane reforming reaction, but can easily use heavier
hydrocarbons for the oxidation. The partial oxidation reaction also uses nonrenewable
resources, relying on the consumption of fossil fuels1,5. Building on this technology, the
gasification of biomass products also works in the same way as partial oxidation. In the case of
biomass gasification a biological feed stock is used in place of the fossil fuel to produce H2
through a similar partial oxidation reaction and subsequent water-gas shift reaction1. While this
process can tackle some of the nonrenewable aspects of the partial oxidation process, the
associated thermal efficiency of biomass gasification is much lower at 35 – 50% compared to
60-75% efficiencies from the POX process1.
1.1.2 Hydrogen production from water electrolysis.
In contrast to the conversion of fossil fuels, the electrolysis of water provides a
renewable method to produce H2 gas. The electrolysis of water is an established process, with
commercial production as far back as the 1890’s5. There are two main methods of performing
water electrolysis; alkaline electrolysis and proton exchange membrane electrolysis (in an acidic
environment). In both cases H2 gas is the primary product with a byproduct of O2 gas. The two
methods of electrolysis typically operate at temperatures under 80 °C6. The primary difference
between the two methods is simply which type of intermediate ion is produced during the
reaction. The intermediate ion is what will travel between the anode and cathode to produce
the H2 and O2 gas separately. The anode and cathode reactions associated with both types of
electrolysis are shown below.
Table 1-1: General Half-Cell reactions for the electrolysis of water in alkaline and acidic liquid environments 5.
Reaction Location Alkaline Reactions E° (V) Acidic Reactions E° (V)
Anode
-0.40
-1.23
Cathode -0.83 0.00
Alkaline water electrolysis is a process that was first developed in the 1980’s5. The
anode and cathode are both held in an alkaline electrolyte solution (typically ~30 wt% KOH)5.

5
The electrodes are separated by a porous membrane to allow OH- anions to flow from the
cathode to the anode. To provide sufficient current density the cell voltage in alkaline
electrolysis ranges between 1.8 and 2.2 V vs. SHE5. This voltage is made up of the redox
potential of water at 1.23 V vs. SHE as well as ohmic loss and added anodic and cathodic
overpotentials6. This overall process has been well developed and is currently a commercial
technology1.
In contrast to alkaline water electrolysis, proton exchange membrane (PEM)
electrolyzers perform acidic water electrolysis, with H+ cations transported from the anode to
the cathode. A proton exchange membrane separates the anode and cathode electrodes
selectively allowing transport of protons between the electrodes. This is done in place of an
anionic liquid electrolyte in alkaline water electrolysis and allows for the separation of the H2
and O2 gas products1,2,5. Operating voltages for the acidic PEM electrolysis are also similar in
range to that of alkaline electrolysis. This large voltage is again due to the presence of ohmic
losses and the overpotentials at the anode and cathode. A particular issue with PEM electrolysis
is the transport of protons from the anode to the cathode as they must pass through a solid
membrane5.
Typically the PEM is made of Nafion polymer. In some cases other heavily sulfonated
polymer materials can also be used1. In PEM electrolysis systems the anode, cathode, and PEM
are sandwiched together with high pressures. This creates a zero gap construction providing
good contact between the PEM and electrode surfaces. This allows for quick movement of the
protons through the PEM1. This contact can also create a corrosive environment at the surface
of the electrode, creating some electrode design constraints5. In all, the PEM electrolysis
process has similar benefits and draw backs when compared to alkaline water electrolysis. It
also produces high purity H2 gas from a renewable source but also suffers from poorer efficiency
when compared to fossil fuel reforming.
In a process that reverses a solid oxide fuel cell, hydrogen can be produced. These solid
oxide electrolysis cells (SOEC) are the third and final form of direct hydrogen production through
electrolysis. The use of SOEC’s allows for the production of the H2 gas at higher overall
temperatures between 750 and 1050 °C1. A SOEC uses a solid electrolyte that allows for the
migration of O2- ions to facilitate the production of H2 gas. The two electrode reactions can be
summarized in the following way (Table 1-2)1,2.

6
Figure 1-1: Schematic Diagram of PEM Electrolyzer with associated half-cell equations.
Table 1-2: The general Half-Cell reactions for the electrolysis of water for high temperature solid oxide electrolysis
cells with O2-
as the mobile ion
Materials choices for this method of H2 production are constrained by the high temperatures of
reactions1. In addition to this there is the need for a high temperature heat source. With all this
taken into consideration there is still a dramatic increase in efficiency for SOEC’s over PEM and
alkaline electrolysis systems. This is mainly due to the high temperature of operation decreasing
in the anodic and cathodic overpotentials7.
Reaction Location Reaction Equation
Cathode
Anode

7
Of the processes reviewed the primary industrial installations of these technologies
focus on fossil fuel reforming, as well as alkaline electrolysis. Biomass gasification and PEM
electrolysis are also being deployed by companies such as Proton Onsite and Hydrogenics8,9.
When summarizing the drawbacks of the primary H2 production methods either a lack of
renewability or a low efficiency become the common problems. A notable alternative to the
previously mentioned technologies is the use of thermochemical cycles.
1.2: Introduction to Thermochemical Cycles
Thermochemical cycles allow for the production of H2 and O2 gas from H2O though a
series of chemical intermediates10,11. Under ideal conditions without catalysis, water will
decompose into H2 and O2 gas at a 2500 °C1. The chemical intermediates are chosen to reduce
the overall temperature required. In addition to the reduced temperatures for decomposition,
the chemical intermediates are selected such that they can be regenerated. Regenerating the
chemical intermediates means that the net equation for thermochemical cycles is simply the
decomposition of H2O into H2 and O2. There are several potential thermochemical cycles that
can be employed in this manner but the general structure of their reactions is shown in Figure
1-2.
Figure 1-2: Schematic of general thermochemical cycle processes.
The temperature required for uncatalyzed H2O decomposition for industrial production
of H2 gas has significant materials and power source constraints. These challenges spurred the
investigation of thermochemical cycles. There are over 200 potential thermochemical cycles of
which a select few have been isolated for research purposes4,10,11. These cycles can be selected
for the materials used as well as the overall temperature requirements.

8
1.2.1: Conventional Thermochemical Cycles
Of the multiple thermochemical cycles only a few have received significant research.
The most common cycle is the Sulfur-Iodine cycle. The cycle is comprised of three steps shown
below (Table 1-3)5,12.
Table 1-3: The stepwise chemical reactions for the production of H2 and O2 gas in the Sulfur-Iodine thermochemical
cycle
# Reaction Equation
1
2
3
Only step 1 from the above list occurs at a low temperature and is also exothermic. This
highlights a significant hurdle involved in the operation of the sulfur iodine cycle. Both of the
remaining two reactions require a high temperature to proceed. Reaction 3 requires a
temperature of 400 °C and reaction 2 requires 900 °C5. These high temperatures are common
throughout the most viable thermochemical cycles. For example, the Ispra Mark 10 reactions
requires temperatures of 870 °C and the ZnO/Zn cycle requires 1800 °C temperatures for one
step1. Even with these large thermal requirements the cycles still report reasonable efficiencies.
In the case of the Sulfur-Iodine cycle there is a reported total efficiency of 47%1. This is again
comparable to the efficiencies seen for water the electrolysis processes. The advantage that can
be gained by thermochemical cycles is the potential for capture of waste heat to at least partly
drive the thermochemical cycles. While these additions will not improve the physical efficiency
of the reaction the processes will be necessarily more economical, offsetting the poorer reaction
efficiency. One final issue with standard thermochemical cycles is the potentially highly
corrosive reaction steps. The mixture of high temperatures and strong acids limits the materials
choices12. This extends beyond problems seen with SOEC’s. In the case of the Sulfur-Iodine
cycle the 2nd reaction takes place in 50-98% H2SO4 at the previously mentioned 900 °C. In
addition to the specific examples listed for the Sulfur-Iodine cycle, similar problems are common
to all thermochemical cycles. There has been a large amount of research into reducing the
temperatures and associated corrosive environments with thermochemical cycles. One notable
method is through the development of hybrid thermochemical cycles.

9
1.2.2: Hybrid Thermochemical Cycles
Hybrid thermochemical cycles incorporate one or more electrochemical steps to replace
existing reactions that could have proven too challenging or costly to complete traditionally.
This brings with it two features. The first is that in many cases the temperature of the
electrochemical step is at ambient or only slightly elevated temperatures4,11,13. Additionally, the
electrolysis steps allow for the hybrid cycles to draw from existing technologies. It is important
to note that the electrical input required does present a potential drawback.
As an example, the Sulfur-Iodine cycle outlined previously (1.2.1: Conventional
Thermochemical Cycles) has been altered to include an electrolysis step. In this case the
decomposition of H2SO4 is maintained, but the electrolysis of SO2 in the presence of water
facilitates the production of H2 (Figure 1-3). The whole cycle is reduced to only two steps.
Table 1-4: The stepwise chemical reactions and electrochemical half-cell reactions for the Hybrid Sulfur
thermochemical cycle13
.
# Reaction Equation
1
Anode E° (V) Cathode E° (V)
2 -0.17 0.00
Figure 1-3: Schematic Diagram for the electrolysis of SO2 and production of H2 gas in a PEM style electrolyzer for
the Hybrid Sulfur thermochemical cycle. Diagram based on work of Staser JA and Weidner JW 13
.

10
By both eliminating a step and reducing the overall temperature requirement the thermal
efficiency of the reaction can be maintained. This reaction does, however, have a direct
competition from alkaline electrolysis. This is again a point where the concept of waste heat
capture must be considered to account for potential inefficiencies in the hybrid cycle. In
particular, when comparing Figure 1-1 and Figure 1-3 it can be seen that the hybrid sulfur cycle
electrochemical step is very similar to PEM electrolysis. Where the water would normally be
split to produce O2 and H+ ions, instead SO2, is oxidized to produce the H2SO4 and H+ ions.
Taking advantage of existing technologies, the electrolysis step occurs in a zero gap PEM
electrolyzer system (with modification to the electrolyte solutions). There are however
restrictions limiting the effectiveness of Nafion over other materials13. At the cathode the cycle
can benefit from existing technologies as the production of H2 gas is identical to a standard PEM
electrolyzer process. The main advantage of this electrolysis process over water electrolysis is
that the thermodynamic onset potential for the oxidation of SO2 is 0.17 V vs. SHE as opposed to
1.23 V vs. SHE for the oxidation of H2O1. This smaller reversible potential decreases the cell
voltage required for operation which allows the Hybrid Sulfur Cycle, as well as other hybrid
cycles, to compete with simple water electrolysis. As with the traditional thermochemical
cycles, the Hybrid sulfur cycle was provided as an example cycle owing to the significant
research on the topic. The problems that where addressed in this example can be expected to
carry through to other hybrid cycles. Finally, one additional problem associated with
thermochemical cycles is the conversion ratios of the different reactions. With incomplete
conversion of the reactants, thermal inefficiencies begin to arise. The removal of steps,
streamlining the thermochemical cycle is one method by which to combat this problem1,2,5.
There is also potential to gain insight into the electrolysis process by examining redox flow cells.
These are power generating systems oxidizing H2 gas and using a closed loop of reactions to
provide a reducible catholyte solution. This is in essence the reverse of hybrid cycles
electrochemical steps.14
1.2.3: Three Step Hybrid CuCl-HCl Thermochemical Cycle
Another hybrid thermochemical cycle is the CuCl-HCl cycle. Specific investigations into
this cycle are the total focus of the research presented in this thesis. As such a more in depth
description and investigation of this cycle follows. The CuCl-HCl cycle has multiple variations
with different numbers of steps as well as varied electrochemical steps. The current cycle
11
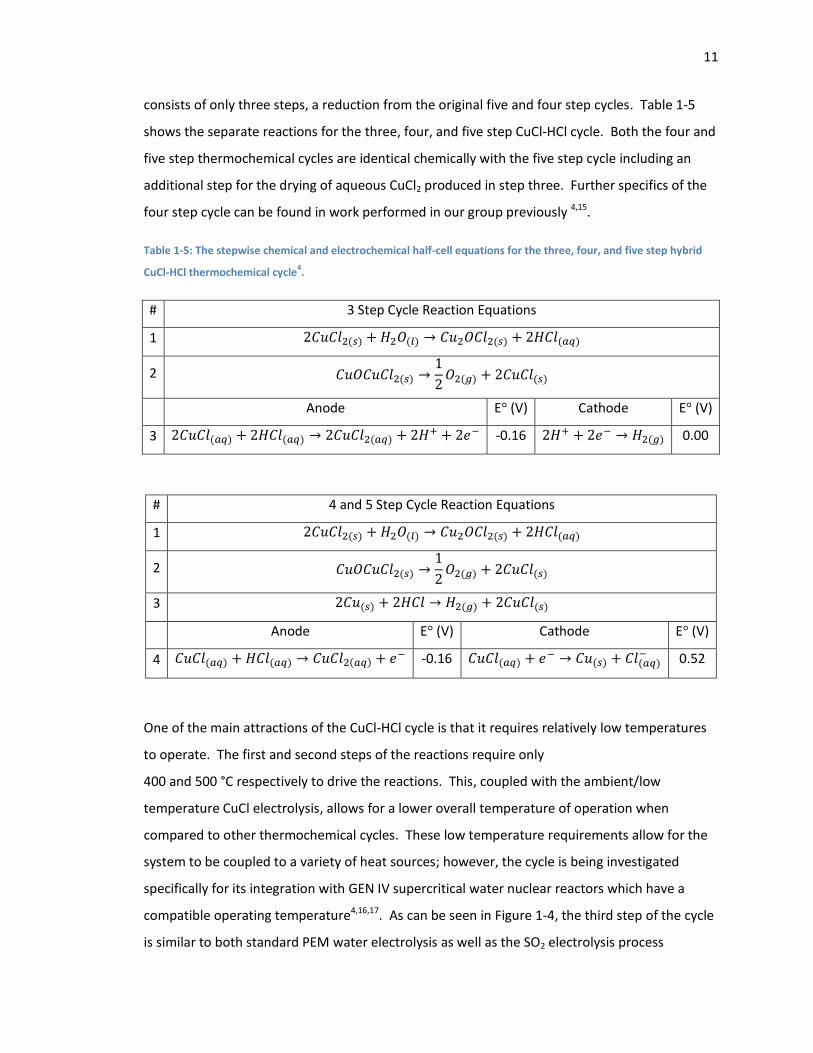
consists of only three steps, a reduction from the original five and four step cycles. Table 1-5
shows the separate reactions for the three, four, and five step CuCl-HCl cycle. Both the four and
five step thermochemical cycles are identical chemically with the five step cycle including an
additional step for the drying of aqueous CuCl2 produced in step three. Further specifics of the
four step cycle can be found in work performed in our group previously 4,15.
Table 1-5: The stepwise chemical and electrochemical half-cell equations for the three, four, and five step hybrid
CuCl-HCl thermochemical cycle4.
# 3 Step Cycle Reaction Equations
1
2
Anode E° (V) Cathode E° (V)
3 -0.16 0.00
# 4 and 5 Step Cycle Reaction Equations
1
2
3
Anode E° (V) Cathode E° (V)
4 -0.16 0.52
One of the main attractions of the CuCl-HCl cycle is that it requires relatively low temperatures
to operate. The first and second steps of the reactions require only
400 and 500 °C respectively to drive the reactions. This, coupled with the ambient/low
temperature CuCl electrolysis, allows for a lower overall temperature of operation when
compared to other thermochemical cycles. These low temperature requirements allow for the
system to be coupled to a variety of heat sources; however, the cycle is being investigated
specifically for its integration with GEN IV supercritical water nuclear reactors which have a
compatible operating temperature4,16,17. As can be seen in Figure 1-4, the third step of the cycle
is similar to both standard PEM water electrolysis as well as the SO2 electrolysis process

12
associated with the Hybrid Sulfur Cycle1,13. Another advantage of the CuCl-HCl thermochemical
cycle is that H2 gas is produced through the same mechanism at the cathode as SO2 electrolysis
and standard PEM water electrolysis. This allows the CuCl-HCl reaction to borrow from existing
H+ reduction catalyst technologies.
Figure 1-4: Schematic Diagram for the electrolysis of CuCl in the presence of HCl and the production of H2 gas in a
PEM style electrolyzer Hybrid three step CuCl-HCl thermochemical cycle18
.
A distinct difference in the CuCl-HCl cycle when compared to PEM electrolysis and the
hybrid sulfur cycle is that the primary oxidation reaction occurs at a transition metal center4,16,17.
This inclusion of the Cu atom allows for easy oxidation. Ideally, the onset potential of the Cu(I)
oxidation occurs at 0.159 V vs. SHE19. As with the hybrid sulfur cycle this is a much lower onset
potential when compared to H2O oxidation. Realistically, the onset potential for the cell during
testing is actually around 0.4 V vs. SHE which is still more than a volt lower than the average
onset potential of 1.5-1.8 V vs. SHE required for water splitting20. This energy difference again
translates into a large gain for the CuCl-HCl cycle.
While oxidation can occur easily at a copper center the overall electrolysis process can
be limited by the diffusion of the CuCl to the electrode surface. In the case of water electrolysis

13
the redox species is the electrolyte solution. For CuCl electrolysis the copper species must first
diffuse to the surface of the electrode for the oxidation to occur. This diffusion limits the overall
rate of the electrolysis project21. By comparison the diffusion of H+ ions through the PEM and
the production of H2 gas can be considered fast. The other main challenge with the CuCl
electrolysis step is the crossover of Cu+ to the cathode. If this occurs then the cationic copper
can be reduced to copper metal (Equation 1-7)4. This parasitic form of the reaction is also
present in the hybrid sulfur cycle, where SO2 can be reduced to sulfur and O2 gas as seen in
Equation 1-813.
Equation 1-7
Equation 1-8
The overall negative effects of SO2 are not fully known. In the case of Cu crossover it has been
shown that it causes plating on the cathode electrode as well as negative effects for the overall
CuCl-HCl electrolysis process4.
Along with the challenges faced in the electrochemical step there are a number of other
challenges associated with the CuCl thermochemical cycle. The primary concern is that both
steps one and two of the reaction require a solid copper species which must be transported.
This is a non-ideal scenario when compared to other cycles such as the Sulfur-Iodine cycle where
all the involved reagents are either liquids or gasses. In addition to this the molar mass of CuCl
is ~99 g mol-1. When considering that two molecules of CuCl must be oxidized to produce one
molecule of H2 gas a reactant to product mass ratio of 100:1. This means that to produce
~1 Kg of H2 ~100 Kg of CuCl must be moved through the thermochemical cycle. All of these
considerations limit the overall heat to hydrogen efficiency of the hybrid CuCl-HCl
thermochemical cycle to approximately 43% 4,22. While this efficiency is not as high as those
listed previously it has been shown to outperform comparable electrolysis from the same
nuclear power source. As with other hybrid thermochemical cycles the increase in net efficiency
stems from the removal of some intermediate power generation. The inefficiencies associated
with the production of electricity for use in direct water electrolysis can be avoided when the
direct capture of heat is used to drive some of the cycles’ steps.
14
1.2.4: Research Targets for the Hybrid CuCl-HCl Thermochemical Cycle
The department of energy in the United States outlined a need for high throughput
renewable hydrogen production sources. To meet these demands a large scale research project
encompassing many research groups as well as industry partners has been developed4,20,23,24.
The overall project encompasses many disciplines of chemistry, and engineering. Specific to our
research, the eventual goal for the electrochemical step is to produce H2 gas through CuCl
electrolysis with a current density of 500 mA cm-2 at 0.7 V vs. SHE applied4,25. This is an
aggressive goal that is not meant to be met until the year 2025. This is in part to coincide with
the deployment of the associated Gen IV Supercritical Water Nuclear reactors which have
operating temperatures appropriate for powering the thermochemical cycle. Before this time
there are also a series of milestone goals. The most recent of these was to produce a sustained
current of 300 mA cm-2 at 0.7 V vs. SHE26.
1.3: CCE Materials
Within the zero gap PEM electrolyzer there are three main components, the anode and
cathode electrodes as well as the proton conducting membrane. For the purposes of most
research the membrane is Nafion, a standard PEM material. The Nafion thickness can be
altered, however the general material is kept constant across most testing18,20,21. The electrode
materials offer more room for modification.
At the cathode of the electrolysis cell the production of H2 gas behaves similarly to
standard electrolysis systems. With this in mind the cathode materials are often comprised of
standard platinum on carbon (Pt/C) catalyst materials18,20. At the anode there are a few
significant challenges, the first is to provide a large active surface area for the copper oxidation
to occur. The second challenge is to produce a durable electrode material to withstand the
harsh acidic electrolyte21,26. Currently the anode materials are also derived from standard Pt/C
electrolysis electrodes20, however it has been shown that the Pt catalyst is not required for
oxidation to occur27,28. The production and characterization of novel anode electrode materials
is the primary goal of our work. Specifically our work is done in the absence of a Pt catalyst. To
produce durable electrode materials we have examined the use of ceramic carbon electrodes
derived from a sol-gel synthesis coupled with a high surface area carbon.
15
1.3.1: Sol-Gel Method
Sol-Gel chemistry is a process involving the transition from a sol to a gel. A sol is a
colloidal suspension of solid particles in a liquid and a gel is a suspension of a liquid inside a solid
interlocking structure. The liquid contained in the gel is not at equilibrium and thus pushes
outward on the solid structure preventing its collapse. Balancing this outward force, the solid
structure pushes in on the liquid keeping it in place29. Through this balance the gel is able to
keep its shape that would not exist if the liquid was not present.
The Sol-gel process is used to make metal oxide compounds. They are made by linking
together inorganic compounds that can potentially contain organic functional groups. Typically
silicon and titanium are used for the production of these compounds, though other atoms such
as boron or vanadium can be used29. For our research we produced sol-gels strictly from silicon
based precursors. When silicon is added to the solution it is often in the form Si(OR)4. In this
case the R group in an organic group that will either serve a purpose in the characteristics of the
gel or be replaced by another functional group later. Two common silicon precursors are
tetramethoxysilane and tetraethoxysilane (TMOS and TEOS respectively)29.
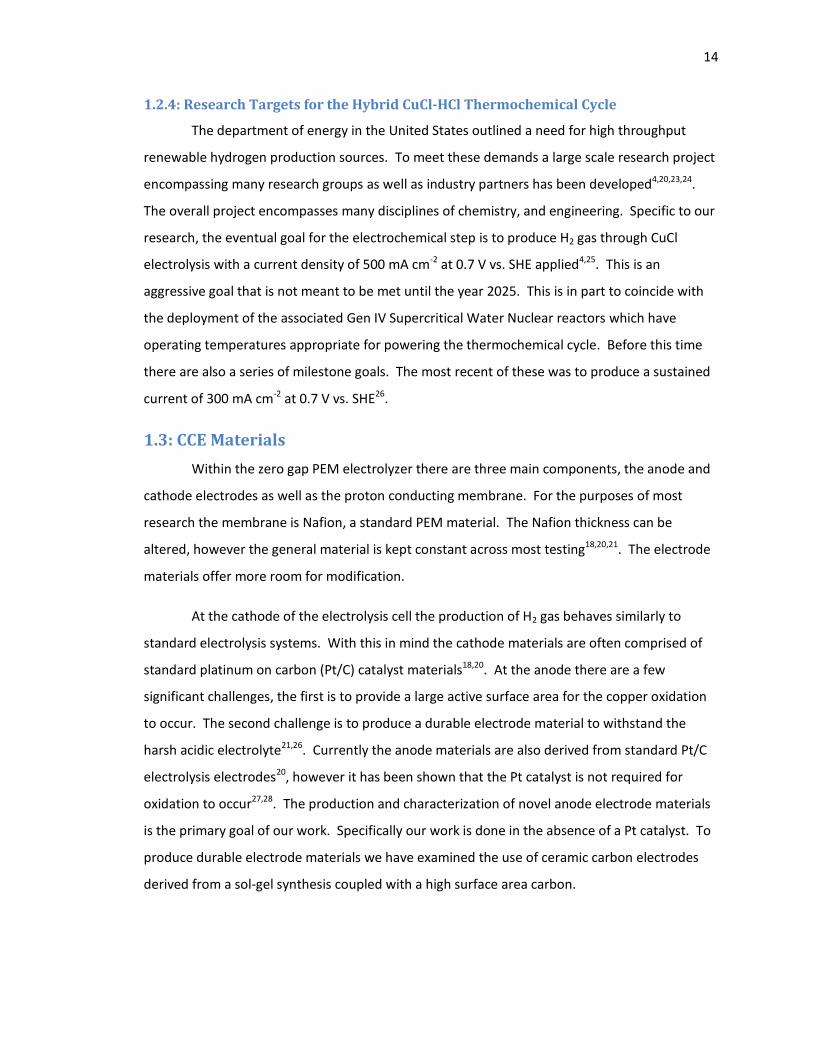
The sol-gel process is very broad and can be used for a large number of applications
(Figure 1-5). After a gel has been formed it can be dried to form a xerogel or aerogel material.
These products can also be heated to form dense ceramics. Before the gel is completely formed
the solution can be dried to form a series of uniform colloidal particles. These particles can also
be made by grinding xerogels and aerogels. Again before the gel has completely formed the
solution can be sprayed or otherwise coated to create thin films, sometimes only a monolayer
thick. The solutions can also be pulled into gel fibres. These films and fibres can also be made
into dense ceramics fibres and films30. Using a combination of spray coating a not fully formed
gel and a subsequent heating we have produced our thin coated ceramic materials18.
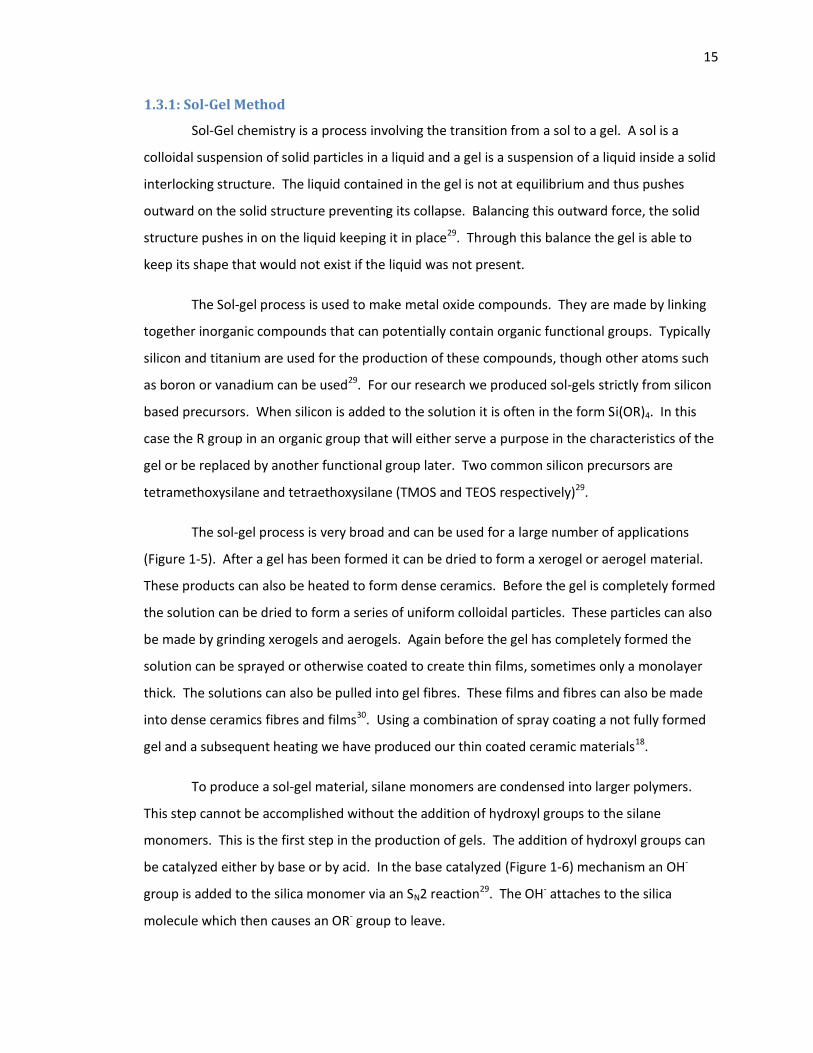
To produce a sol-gel material, silane monomers are condensed into larger polymers.
This step cannot be accomplished without the addition of hydroxyl groups to the silane
monomers. This is the first step in the production of gels. The addition of hydroxyl groups can
be catalyzed either by base or by acid. In the base catalyzed (Figure 1-6) mechanism an OH-
group is added to the silica monomer via an SN2 reaction29. The OH- attaches to the silica
molecule which then causes an OR- group to leave.
16
Figure 1-5: An overview of the sol-gel process and the reaction pathways to the various products30
. Reproduced
with permission of TAYLOR & FRANCIS GROUP LLC in the format Republish in a thesis/dissertation via Copyright
Clearance Center.
Figure 1-6: The base catalyzed hydrolysis of a silane monomer.
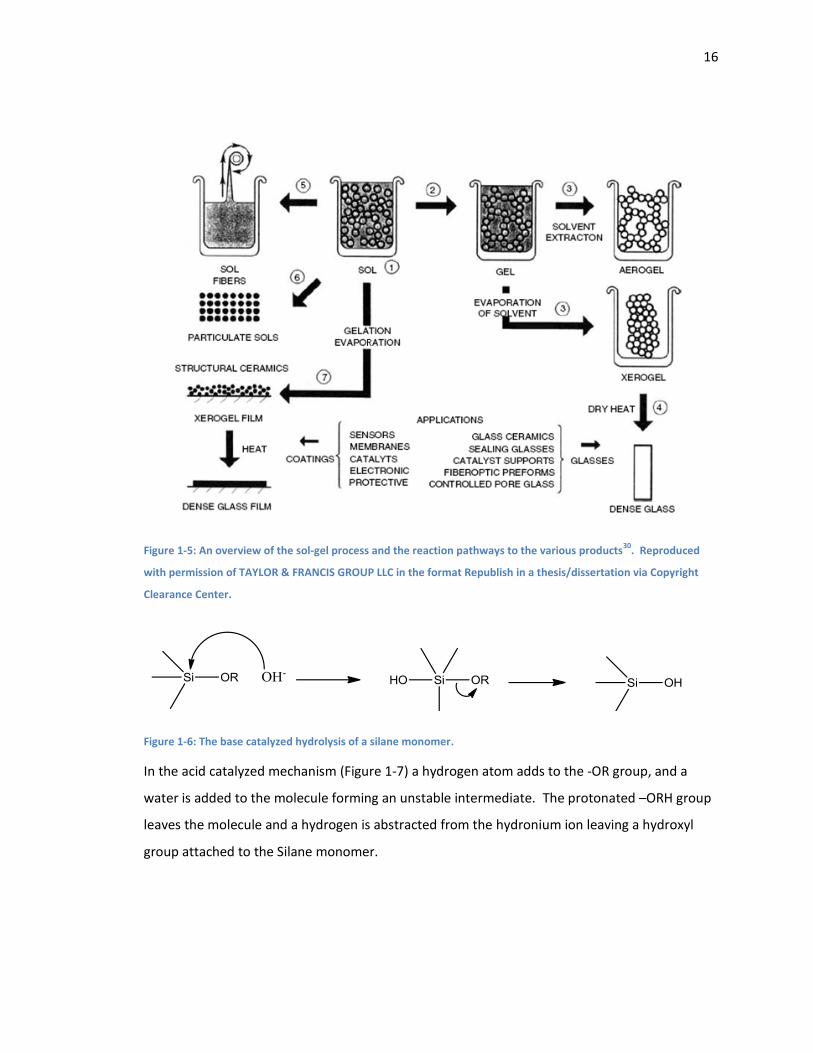
In the acid catalyzed mechanism (Figure 1-7) a hydrogen atom adds to the -OR group, and a
water is added to the molecule forming an unstable intermediate. The protonated –ORH group
leaves the molecule and a hydrogen is abstracted from the hydronium ion leaving a hydroxyl
group attached to the Silane monomer.

17
Figure 1-7: The acid catalyzed hydrolysis of a silane precursor.
Importantly, in both mechanisms the acid and base added are simply catalysts. The amount of
OR groups that will be replaced is related to the ratio of silica molecules to water molecules, the
timeframe of the reaction, as well as the pH, and the concentration of the catalyst. The number
of hydroxyl groups on the silica monomer will dictate the overall characteristics of the gel. If
there are a large number of hydroxyl groups on the silica there will be more branching than
when fewer OH groups are present.
Concurrent with the production of the hydroxyl groups on the silane monomers,
condensation reactions between existing hydroxyl groups will cause the gelation of the reaction
creating larger polymers. The bonds between the silica monomers are an ether linkage, Si-O-Si,
again catalyzed by either base or acid (Figure 1-8 and Figure 1-9 respectively). In the base
catalyzed mechanism a proton is abstracted from a hydroxyl group on the silane. This produces
a Si-O- group which readily attacks another silicon atom, again in an SN2 fashion1 forcing the
removal of an OH- group.
Figure 1-8: The base catalyzed condensation reaction between two silane monomers.
In the acid catalyzed mechanism Si-OH groups are protonated causing them to leave. This
stimulates the addition of another Si-OH. With the formation of the Si-O-Si bond, the final
hydrogen atom is abstracted to produce the desired product.
Figure 1-9: The acid catalyzed condensation reaction between two silane monomers.

18
Once most of the hydroxyl groups have been consumed the condensation reactions can
continue as alcoholyses. In this reaction an alcohol molecule is produced instead of water. The
use of either an acid or base catalyst can have a large effect on the overall shape of the
molecule. The use of a base catalyst gives more condensed, highly branched chains that have a
more fractal-like geometry. The use of an acid catalyst will produce gels with longer more
randomly branched chains29. Additionally, in the same way the hydrolysis is affected, the
condensation reactions are affected by heat, time, pH, concentration of the catalyst, and the
ratio of silicon to water. For this research the sol-gel processes were catalysed by the addition
of ammonium hydroxide base. This caused cluster aggregation from monomers as seen in base
catalysed reactions. The formation of large particles was driven by Ostwald ripening30. This
method of aggregation will continue until the difference in the energies of the large and small
particles is negligible giving uniform particle size distribution. Overall this leads to very dense
structures with a high degree of branching. The cluster aggregation leads to denser gels with a
more uniform pore size.
Once the wet gel has been set it can be dried out to form either a xerogel or an aerogel.
Only under special circumstances not applicable to our research can an aerogel be formed and
as such will not be discussed. The drying process is simply the evaporation of solvent from the
gel. As the drying occurs and the solvent is evaporated there will be less liquid to hold the gel in
shape causing the structure to shrink. This shrinking will decrease the volume of the gel which
will force the liquid to the surface of the gel to be evaporated. This process will continue until
the gel is too stiff to shrink any more. During this drying, strain on different parts of the gel can
also lead to cracking and breaking of the gel. Ultimately a xerogel structure can be achieved
with a high surface area and porosity. It is this feature that allows them to be used as high
surface area electrodes. From here the xerogel materials can be sintered to produce ceramic
materials. When coupled with high surface area carbons high surface area carbon ceramics are
produced. These materials can have a host of interesting properties as well as challenges
associated with their production31.
1.3.2: Ceramic Carbon Electrodes
Above, the process of creating a variety of basic sol-gel structures was discussed. Of
particular interest to us is the use of sol-gels to produce carbon electrodes. Specifically, these
ceramic carbon electrodes (CCE) offer good physical and chemical properties for the electrolysis

19
of CuCl24,32. The production of CCEs is not a new process and a large amount of research exists
covering the wide range of areas they can be used33.
To produce CCEs a procedure similar to that of a generic sol-gel procedure is employed.
A solution of high surface area carbon such as Vulcan XC-72 or Black Pearls is mixed with a
solvent including water and a catalytic amount of either base or acid. To this mixture a varying
amount of the selected silane precursor is added. This solution is then allowed to react and
evaporate over a period of hours to days. Techniques such as painting or spray coating can be
used to produce a thin coating of the carbon sol-gel mixture on an appropriate backing structure
such as carbon fiber paper. With the coating in place the carbon sol-gel mixture can be dried
and heated to produce the aforementioned ceramic carbon surface24.
These materials work well together as they allow for the combination of the best
features of both the carbon and sol-gel materials. From the carbon a large electrically
conducting surface is provided34. A sol-gel material will be naturally resistive making it
unsuitable for an electrochemical application33. From the sol-gel a strong backbone is produced
that holds the carbon material in place. This is a feature that could be provided by any number
of polymer materials such as Teflon, and in many cases it is35,36. Another feature of the sol-gel
material, after conversion to a ceramic, is its high thermal stability37. CCE’s can also have their
conductive and structural properties modified by simply altering the amounts of silane added.
The final advantage of the sol-gel materials is its easy customizability.
Silicon is a tetravalent molecule. TEOS and TMOS, the two most basic silane precursors
both have four silyl ether connections made to them. This means that the silane precursors will
be able to make four separate Si-O-Si bonds creating a very cross-linked polymer. By replacing
only one of the silyl ether linkages with a various functional group the silane monomer can take
on an expansive array of properties while still maintaining a good crosslinking characteristic.
The stable nature of the Si-C bond also ensures that the functionality that is attached will be
stable under thermally and chemically harsh conditions38.
As previously mentioned, the ways in which a silane precursor can be modified are vast.
These modifications have led to their use as gas electrodes, hydrophobic surfaces, and even bio
sensors31,38. Three materials that we have used are (3-Aminopropyl)triethoxysilane, N-[3-
(Trimethoxysilyl)propyl]ethylenediamine, and N1-(3-Trimethoxysilylpropyl)diethylenetriamine

20
which are hereafter referred to as 1N, 2N, and 3N silanes. These three silanes are functionalized
with amine groups. All three materials have one primary amine with the second and third
silanes having one and two additional secondary amines respectively. The three silanes will be
referred to as 1N, 2N, and 3N for the 1, 2, and 3 nitrogen atoms in their amine functionalities
(Figure 1-10).
Figure 1-10: Silane monomers from top to bottom: (3-Aminopropyl)triethoxysilane,
N-[3-(Trimethoxysilyl)propyl]ethylenediamine, and N1-(3-Trimethoxysilylpropyl)diethylenetriamine. 1N, 2N, 3N
respectively.
The (3-Aminopropyl)triethoxysilane has been previously18,24,32 shown to have a positive impact
on the activity of a CCE material used in CuCl oxidation.
When producing a normal sol-gel material cracking during drying can be a problem
disrupting the otherwise homogeneous surface area. This cracking can be prevented by
incorporating a means to slow drying or, alternatively, by lowering the barrier for evaporation
with a co solvent. Even with a slow reaction time and a co solvent cracking can occur. In the
case of CCEs the relatively low volume of sol-gel limits the large scale cracking that can occur.
However, at a smaller scale cracking can still be observed. On a larger scale the low volume of

21
binder can also lead to unstable CCE materials. The stability of the materials can be improved
and controlled by the proper selection of silane precursors as well as the silane to carbon ratio.
1.4: Electrochemical Characterization Techniques
To evaluate the electrolysis properties of the CCE materials and indeed any electrode,
there are a suite of standard measurements that can be made. These measurements can be
used to determine onset potential, current response, electrode stability, surface area, and other
properties of the electrode as well as the electrolysis system as a whole. The measurements can
be split into two main groups based on their current type, either direct or alternating current.
Generally speaking electrochemical tests can be performed in either a two or three
electrode environment. In the case of the two electrode environment a working and counter
electrode are used. Both potential and current are measured between the two electrodes
which are directly related to the redox processes happening at the anode and cathode. Two
electrode measurement is a direct measurement technique. It has the problem of changing
chemical conditions at the two electrodes during testing. If the effective redox potential
changes during the experiment then the potential applied at the two electrodes will change.
This is given by the following equation.
Equation 1-9
If the chemical environment in the cell remains constant then the redox potentials will not
change. This is the principle behind full-cell electrolysis measurements. The high flow rate of
the electrolyte solutions ensures that there should be no change in redox potentials. In
addition, if one electrode can be the reversible hydrogen electrode (RHE) with its associated
potential of 0 meV then then it can act as a reference electrode19. The reference electrode will
maintain a fixed potential within the cell allowing for accurate measure of ECell cell potential is
directly related to the potential at the other electrode.
Three electrode systems avoid the problem of shifting redox potentials by adding a third
electrode to the system. The three electrode system includes a working electrode where the
electrode of interest is located, a counter electrode which will balance the current from the
working electrode, and a reference electrode to measure the potential of the working electrode.
The reference electrode will have a stable and known redox potential associated with it. This
allows the working electrodes potential to be measured in reference to it without causing redox

22
potential drift. Both the AC and DC techniques can be used in the two and three electrode
systems and both electrochemical cells were used for our investigations.
1.4.1: DC Voltammetry Techniques
Direct current measurements are the more straightforward of the two measurement
types. The single direction of flow within the system in question ensures that effects from
electrode charging, and cell capacitance can be mitigated to allow easier evaluation of solution
based processes. Typical DC measurement techniques are cyclic voltammetry or potentiostatic.
Both of these measurements examine the current response to an electric potential being
applied across the cell.
In cyclic voltammetry a potential is applied from the working to the counter electrode.
The cell potential is scanned to larger magnitudes and then reversed back to the original
potential value. The potential scan occurs at a constant rate between high and low potential
vertices. Once a redox potential is met the current will move to more anodic values as the
species is oxidized. Once the concentration near the electrode is depleted the overall anodic
current will decrease. This process will give peaks at different potentials for different redox
species. As the potential scan is reversed if the redox reaction that occurred was reversible then
another peak corresponding to the reduction of the species will be present. From this, CV
measurements can be used to determine both the onset potential, and reversibility of a system.
If a system is simply scanned in one direction then the measurement can be called linear sweep
voltammetry (LSV). This process follows identical behavior to a CV allowing for observation of
onset potentials as well as overall current response.
The drop in current as potential is scanned represents a longer time for the analyte to
diffuse to the surface of the electrode than the rate of consumption. This is a result of a local
drop in analyte concentration near the electrode surface. This depletion creates a diffusion
zone which the analytes must cross from the bulk solution to be oxidized or reduced. In the
case of normal electrodes the diffusion layer is very small in comparison to the width of the
electrode allowing us to treat it as a region with a uniform width. To reduce and remove this
change in current, ultra-microelectrode measurements have been developed39. These
electrodes are typically 25 µm in diameter. At this electrode width the diffusion layer can no
longer be considered linear. Instead a process called hemispherical diffusion can occur. The
hemispherical diffusion allows for much faster transport of the analyte to the solution of the

23
electrode surface, reducing or eliminating a drop off in current as the potential is scanned
higher. This allows for additional information about the electrochemical system to be
determined by both CV and LSV measurements.
Another useful voltammetry technique is that of potentiostatic and galvanostatic holds.
In these measurements either potential or current are held constant over time. These
procedures allow for the measurement of either current or potential as the other is held
constant over time. For potentiostatic measurements the potential should be applied above a
given redox potential to allow for a solution to be reduced or oxidized. In cells where the
electrolyte solution is replenished frequently these measurements allow for a long term
observation of the cell’s behavior.
1.4.2: AC Electrochemical Impedance Spectroscopy
In a standard DC circuit the relationship between potential and current can be modeled
by Ohm’s law, Equation 1-10. Simply, as potential is increased under a constant electrical
resistance the current will also increase.
Equation 1-10
In an alternating current (AC) circuit the direction is current flow is alternated based on a given
frequency. As the direction of the current flow changes different elements in the circuit will
impede the flow of electrons. This gives us the new term of impedance (Z). By modifying
Equation 1-10 we can replace the resistance with impedance to give us Equation 1-11. In this
new equation the relationship between current and potential can be seen at constant
impedance in the same way that current and potential are related in Equation 1-10.
Equation 1-11
Apart from DC circuits where the resistance remains constant, the impedance of a system will
change dependent on the frequency of the AC signal. Under an AC frequency electronic
features such as capacitors and charge transfer processes take on characteristics different than
resistors. These features will cause a phase shift (lag) between the potential and the current
signal40. This variation is dependent upon frequency which, when varied at a known rate, allows
for investigations into the electronic properties of materials.
Electrochemical Impedance Spectroscopy (EIS) records the real and imaginary
impedance at a fixed DC potential with a super-imposed AC signal. The AC signal has it’s

24
frequency modulated from high to low during the measurement. The signals are plotted in a
complex plane impedance plot or “Nyquist” plot. Typically an equivalent circuit is used to model
the system that is being measured. With this model, the shape of the graph when compared to
the idea model can then be used to extract valuable information about the electronic properties
of the system. For a PEM electrolysis cell the electrodes are modeled by the “Finite
Transmission Line” model41 (Figure 1-11). In this model two resistive rails are connected to one
another across a series of capacitors. The two resistive rails represent the resistance for
transmission of electrons through the carbon electrode and the transmission of ions through
porous electrode. The capacitors are used to describe the differential capacitance between the
electrode and the electrolyte. Finally a resistor representing the electrolyte resistance (e.g. the
PEM) is connected in series to the end of the model circuit.
Figure 1-11: The Finite Transmission Line Model Circuit for modeling a PEM electrode. Diagram based on work of
Li, G. and Pickup, P. 41
.
When plotted on a Nyquist plot the impedance spectra for a PEM electrode takes on a
distinctive shape. With frequency increasing from right to left in the high frequency region a
linear section of the plot follows a 45° slope. This is known as the Warburg region (Figure 1-12).
When using the finite transmission line model as an equivalent circuit the length of the Warburg
region along the real axis is proportional to 1/3 of the total resistance within the electrode (R).
This means that in a general sense, the longer the Warburg region is, the higher the resistance is
within the electrode layer42. The use of AC electrochemical impedance spectroscopy in

25
combination with previously mentioned DC electrochemical techniques allow for a full
characterization of the electronic properties of CCE electrodes as well as a host of other
materials.
Figure 1-12 : Nyquist plot at 0 V vs. OCV of ceramic carbon electrode with Warburg region detailed and
RMembrane = 0.
In addition to traditional Nyquist plots, EIS data can be manipulated into capacitance
plots. In these plots the real impedance is plotted with the inverse of the imaginary impedance
multiplied by the AC frequency of the measurement (1/Z”ω). Capacitance plots can be used to
show the relative total capacitance of the sample. The capacitance can also be normalized with
respect to geometric surface area as well as mass of sample. In addition to the total
capacitance, the initial charging portion of the capacitance plots can be used to show
conductivity within the sample. For these investigations a steeper slope in the charging current
region indicates greater conductivity. To better visualize the charging region of capacitance
0.00
0.01
0.02
0.03
0.04
0.05
0.00 0.01 0.02 0.03 0.04 0.05
Z" (
Ωcm
2)
Z' (Ω cm2)
47 wt% 2N Silane
Warburg Region = R /3

26
plots with disparate limiting capacitances’ the data can be normalized to a maximum of 1. This
normalization better shows which sample has the steepest initial slope and thus the highest
conductivity.
1.5: Thesis Objectives
The primary goal of this thesis is to produce and characterize new materials to improve
the electrolysis of CuCl in HCl. These will be compared to existing data on CuCl electrolysis,
specifically work by Balashov et al who have produced initial testing of Pt containing catalysts at
a variety of full-cell conditions20. Additionally, we will construct a full-cell liquid electrolysis test
station for the characterization of the produced materials. Specifically we aim to improve the
anode electrode for CuCl-HCl electrolysis. This portion of the MEA allows the most room for
improvement of the overall conversion rates and efficiencies. The cathode electrode works in a
manner identical to those seen in H2O or SO2 electrolysis in PEM electrolysis and the hybrid
sulfur cycle respectively. These topics among others have provided extensive research into the
hydrogen evolution reaction (HER) making it difficult to provide substantial improvements. The
CuCl oxidation step is comparatively novel leaving large room for improvements.
We will be producing CCE materials for use in the anode of the electrolysis cell. These
materials will be produced in a standard sol-gel method. The silanes used will contain amine
functionalities. These amine functional groups when protonated in the acidic electrolyte will
provide enhanced ionic conductivity. In addition to the characterization of the electrodes
abilities to oxidize CuCl we will also investigate the ability of the electrodes to resist cationic
copper crossover within the materials. These investigations will only be preliminary and the
crossover resistance can be considered secondary to achieving better overall activity from the
electrode materials. The primary source of Cu crossover resistance within the electrolysis cell
will likely come from the PEM material. The production and characterization of PEM materials
was outside of the scope of this project and as such will not be discussed in this thesis.
Chapter 3 of this thesis outlines the initial testing of the CCE materials in a three
electrode half-cell environment. Both traditional voltametric techniques and EIS measurements
were used to investigate the properties of these materials. The bulk physical properties were
also characterized by thermogravimetric analysis. Chapter 4 details the development of a full-
cell test station as well as a standard testing protocol. Materials based on those characterized in

27
the half-cell are tested in the full-cell. In addition to these tests the materials were also
investigated using SEM and TEM microscopy. Finally, in chapter 5, the copper crossover
resistances of the materials produced are discussed. As well as diagnostic methods related to
copper crossover detection and cell regeneration are discussed in chapter 5. The sum of this
investigation is to present our materials as potential candidates for integration into further CuCl
electrolysis tests for the three step hybrid CuCl-HCl thermochemical cycle.

28
Chapter 2 : Experimental Methods and Instrumentation

29
2.1: Electrode Preparation
Electrodes were prepared through a standard sol-gel method to produce a high surface
area CCE material. Three different silane precursors were used during the production of the CCE
materials; (3-Aminopropyl)triethoxysilane, N-[3-(Trimethoxysilyl)propyl]ethylenediamine, and
N1-(3-Trimethoxysilylpropyl)diethylenetriamine (All 99% pure Sigma Aldrich). Hereafter the
silanes will be referred to as 1N, 2N, and 3N respectively.
2.1.1: Sol Gel Production
The sol-gels were prepared using a base catalyzed method. In a beaker, 400 mg Vulcan
XC-72 carbon black (Cabot Corp.) was combined with 2.5 mL of DI H2O and 13.5 mL of MeOH.
To this solution 5.2 µL of 6 M NH4OH was added. The solution was allowed to stir uncovered for
15 minutes. Amounts of silane monomer (detailed in 2.1) ranging from 0.2-1.2 mL were added
drop wise to the carbon solution. The solutions were stirred, covered, at room temperature for
16 hours. After stirring, the vessels were covered and vented slightly to allow for a slow
evaporation of the solvent liquids. The reactions were left at room temperature to stir until a
desired consistency was reached.
2.1.2: Half-Cell Electrode Production
The gel was allowed to dry to partial completion until a thick mud consistency was
reached. Bare carbon fiber paper (TGP-H-090 Toray Paper, Fuel Cell Earth LLC) (CFP) was cut
into strips 1 cm wide and approximately 5 cm long. The gels produced were painted in thin
layers onto both sides of a 1 cm2 section of the CFP, the coated samples were kept at a mass
loading of 3 mg/cm2. After coating, the samples were hung and allowed to dry at room
temperature for 16 hrs followed by a further 12 hrs at 80 °C. For each sample produced a
portion of the gel was reserved for characterization. The characterization samples were
subjected to identical drying conditions. The dried electrodes were used as prepared in half-cell
testing. The characterization samples were ground into a powder and reserved.
2.1.3: Full-Cell Electrode Production
For full-cell electrodes, the CCE gels were spray coated onto bare CFP. To facilitate this,
the gels were allowed to dry to a thick liquid state. If required, the gel solutions were diluted
with methanol to the desired milky consistency for spray coating was reached. Unless otherwise
noted, the gels were spray coated onto a 90 cm2 target of both bare CFP and non-wet proofed
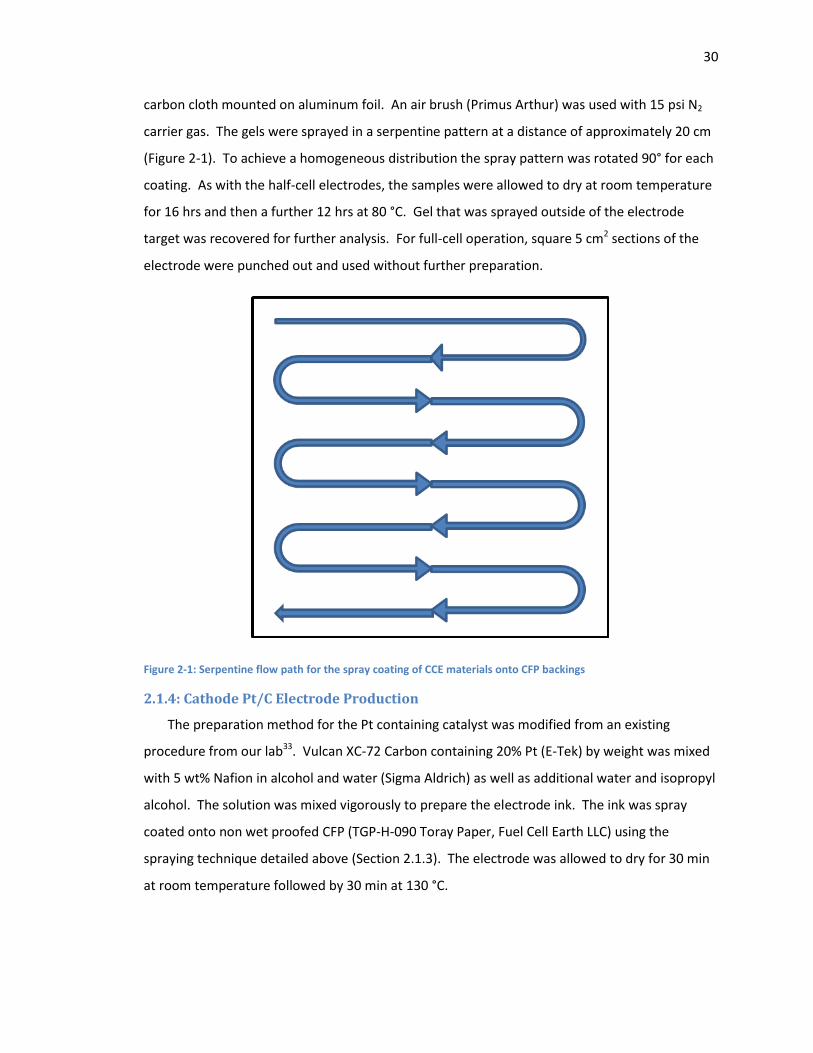
30
carbon cloth mounted on aluminum foil. An air brush (Primus Arthur) was used with 15 psi N2
carrier gas. The gels were sprayed in a serpentine pattern at a distance of approximately 20 cm
(Figure 2-1). To achieve a homogeneous distribution the spray pattern was rotated 90° for each
coating. As with the half-cell electrodes, the samples were allowed to dry at room temperature
for 16 hrs and then a further 12 hrs at 80 °C. Gel that was sprayed outside of the electrode
target was recovered for further analysis. For full-cell operation, square 5 cm2 sections of the
electrode were punched out and used without further preparation.
Figure 2-1: Serpentine flow path for the spray coating of CCE materials onto CFP backings
2.1.4: Cathode Pt/C Electrode Production
The preparation method for the Pt containing catalyst was modified from an existing
procedure from our lab33. Vulcan XC-72 Carbon containing 20% Pt (E-Tek) by weight was mixed
with 5 wt% Nafion in alcohol and water (Sigma Aldrich) as well as additional water and isopropyl
alcohol. The solution was mixed vigorously to prepare the electrode ink. The ink was spray
coated onto non wet proofed CFP (TGP-H-090 Toray Paper, Fuel Cell Earth LLC) using the
spraying technique detailed above (Section 2.1.3). The electrode was allowed to dry for 30 min
at room temperature followed by 30 min at 130 °C.

31
2.2: Materials Characterization
2.2.1: TGA Weight Characterization
A TA Instruments Q600 SDT-TGA was used for thermogravimetric analysis of our CCE
materials. Between 5 and 20 mg of powdered sample was heated in alumina pans in an extra
dry air atmosphere flowing at 50 mL min-1 (Praxair). The temperature was ramped from 20 to
1000 °C at a constant rate of 20 °C min-1. Data analysis was performed using TA Universal
Analysis Software.
2.2.2: SEM Imaging
SEM images were acquired using a JEOL JSM 6400 scanning electron microscope at a
working distance of 8 mm and an accelerating voltage of 20 keV. Images were taken to assess
porosity, thickness of CCE coatings, and to physically identify microscopic Cu plating.
2.2.3: TEM Imaging
MilliQ 18 MΩ water was sterile filtered through a 0.2 µM pore size filter to remove
contaminants. A small amount of the powdered nanomaterial on the end of a clean weighing
spatula was added to 500 µL of sterile water in a microcentrifuge tube. Each sample was hand
mixed to gently stir the particles into the water until the suspension was a uniform grey colour.
10-20 µL of sample was immediately transferred onto a Formvar Grid held level by locking
forceps. The samples were allowed to settle onto the grid surface for 1-2 minutes. Excess water
was then slowly drawn off from above the settled particles using small triangles of filter paper,
and the grids were transferred onto clean filter paper and dried under a heat lamp for a
minimum of 30 minutes before imaging
2.3: Full-Cell Production and Design
The full-cell electrolysis system was constructed in house. The electrolysis cell was
designed to allow a robust range of operation conditions including those developed by Lvov et
al20. In all designs a 5 cm2 full graphite PEM electrolysis cell was used (FC-05-02 ElectroChem
Hardware with Teflon fittings). The particular electrolysis cell was selected because of its full
graphite flow channels which resist corrosion in liquid HCl and CuCl. In all iterations of the
design 0.2 M CuCl in 2 M HCl liquid electrolyte was used as the anolyte solution and DI H2O was
used as the catholyte solution.
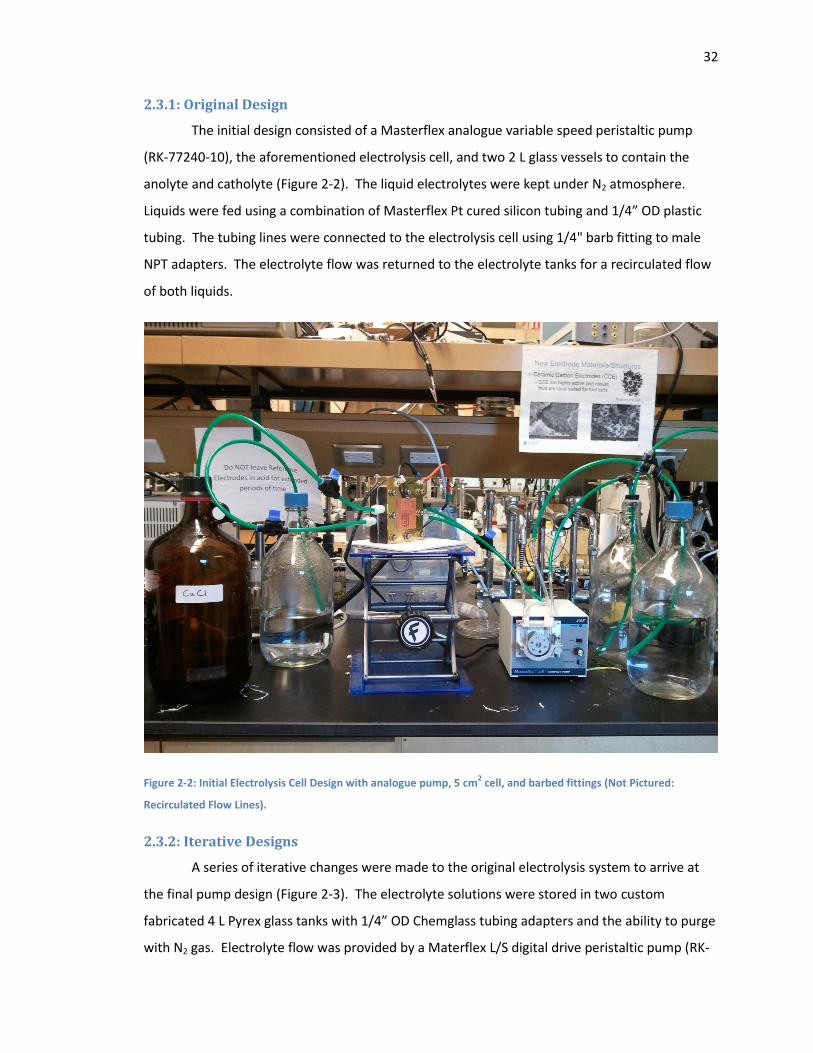
32
2.3.1: Original Design
The initial design consisted of a Masterflex analogue variable speed peristaltic pump
(RK-77240-10), the aforementioned electrolysis cell, and two 2 L glass vessels to contain the
anolyte and catholyte (Figure 2-2). The liquid electrolytes were kept under N2 atmosphere.
Liquids were fed using a combination of Masterflex Pt cured silicon tubing and 1/4” OD plastic
tubing. The tubing lines were connected to the electrolysis cell using 1/4" barb fitting to male
NPT adapters. The electrolyte flow was returned to the electrolyte tanks for a recirculated flow
of both liquids.
Figure 2-2: Initial Electrolysis Cell Design with analogue pump, 5 cm2 cell, and barbed fittings (Not Pictured:
Recirculated Flow Lines).
2.3.2: Iterative Designs
A series of iterative changes were made to the original electrolysis system to arrive at
the final pump design (Figure 2-3). The electrolyte solutions were stored in two custom
fabricated 4 L Pyrex glass tanks with 1/4” OD Chemglass tubing adapters and the ability to purge
with N2 gas. Electrolyte flow was provided by a Materflex L/S digital drive peristaltic pump (RK-
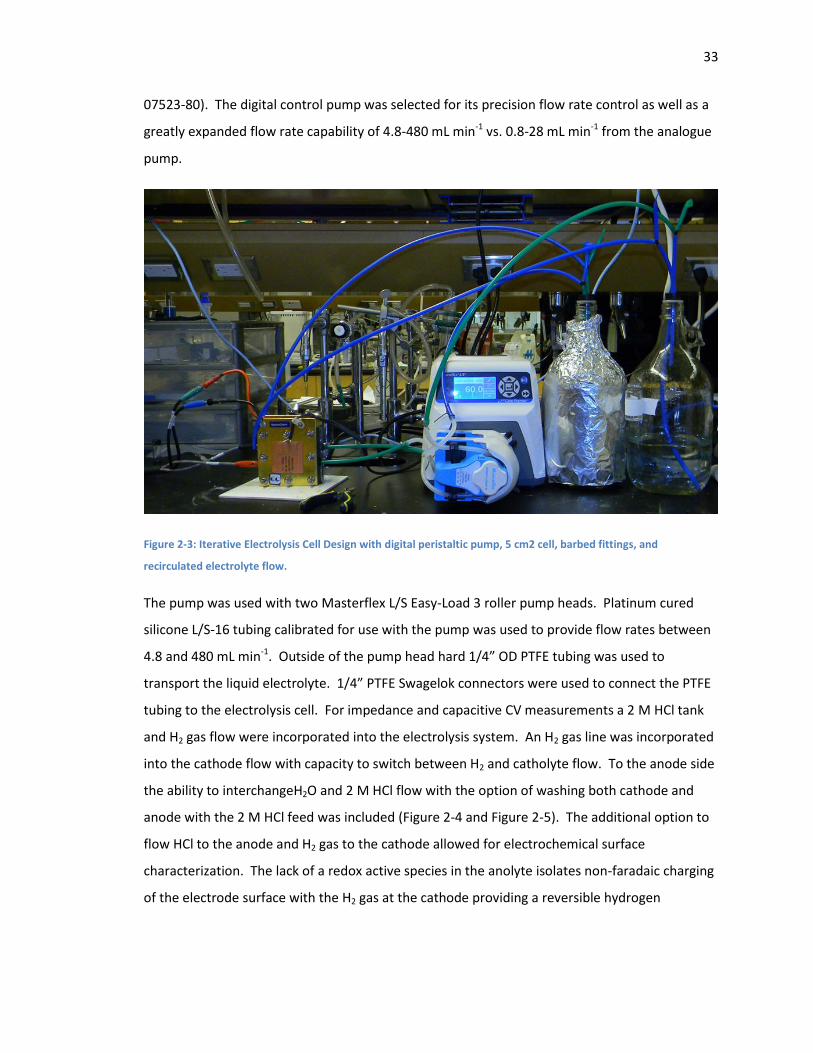
33
07523-80). The digital control pump was selected for its precision flow rate control as well as a
greatly expanded flow rate capability of 4.8-480 mL min-1 vs. 0.8-28 mL min-1 from the analogue
pump.
Figure 2-3: Iterative Electrolysis Cell Design with digital peristaltic pump, 5 cm2 cell, barbed fittings, and
recirculated electrolyte flow.
The pump was used with two Masterflex L/S Easy-Load 3 roller pump heads. Platinum cured
silicone L/S-16 tubing calibrated for use with the pump was used to provide flow rates between
4.8 and 480 mL min-1. Outside of the pump head hard 1/4” OD PTFE tubing was used to
transport the liquid electrolyte. 1/4” PTFE Swagelok connectors were used to connect the PTFE
tubing to the electrolysis cell. For impedance and capacitive CV measurements a 2 M HCl tank
and H2 gas flow were incorporated into the electrolysis system. An H2 gas line was incorporated
into the cathode flow with capacity to switch between H2 and catholyte flow. To the anode side
the ability to interchangeH2O and 2 M HCl flow with the option of washing both cathode and
anode with the 2 M HCl feed was included (Figure 2-4 and Figure 2-5). The additional option to
flow HCl to the anode and H2 gas to the cathode allowed for electrochemical surface
characterization. The lack of a redox active species in the anolyte isolates non-faradaic charging
of the electrode surface with the H2 gas at the cathode providing a reversible hydrogen
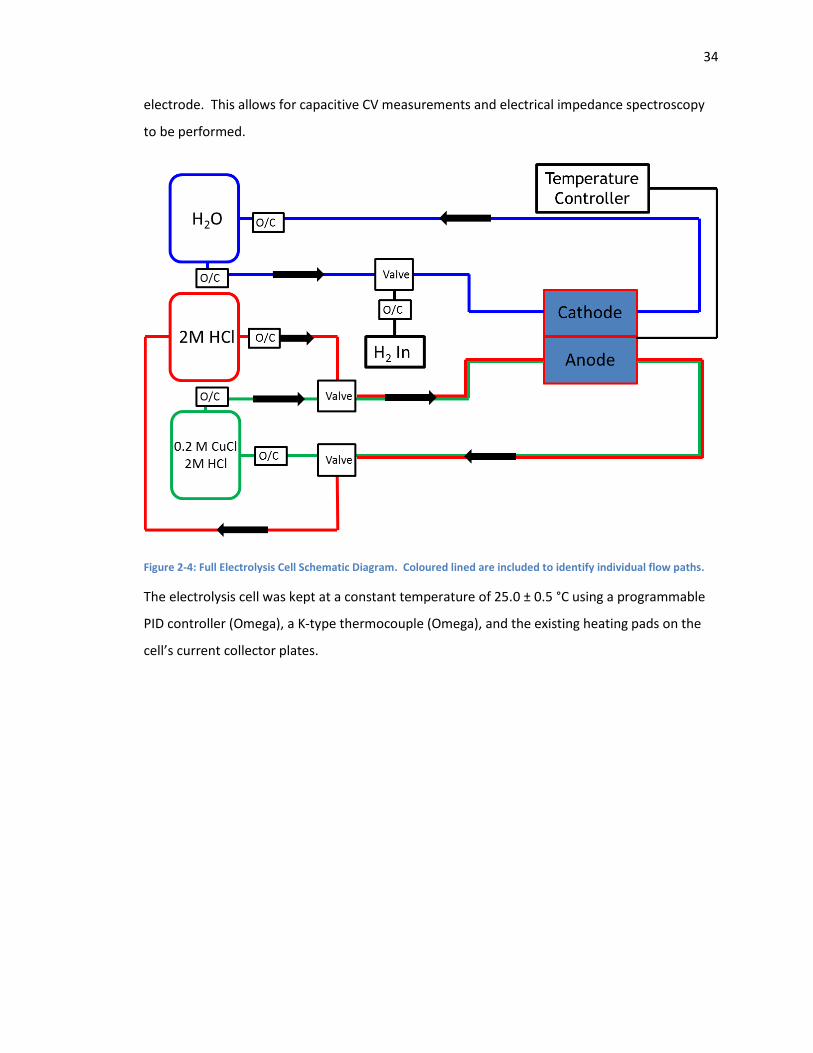
34
electrode. This allows for capacitive CV measurements and electrical impedance spectroscopy
to be performed.
Figure 2-4: Full Electrolysis Cell Schematic Diagram. Coloured lined are included to identify individual flow paths.
The electrolysis cell was kept at a constant temperature of 25.0 ± 0.5 °C using a programmable
PID controller (Omega), a K-type thermocouple (Omega), and the existing heating pads on the
cell’s current collector plates.

35
Figure 2-5: Current Electrolysis Cell Design with digital peristaltic pump, 5 cm2 cell, barbed fittings, and recirculated
electrolyte flow (temperature controller not pictured).
2.3.3: Catholyte/Anolyte Preparation
For the anolyte solution approximately 325 mL of concentrated HCl was diluted to 2 L
with DI H2O to produce 2 M HCl. The solution was sparged with N2 gas for 30 minutes to remove
any dissolved O2 gas. To the 2 M HCl solution 39.6 g of 97% CuCl (Sigma Aldrich) was added.
The solution was stirred under N2 atmosphere until the CuCl had been completely dissolved.
The solution was stored (with stirring) under N2 atmosphere. When noted, to the solution of
CuCl/HCl, 25 g of solid copper wire was added to convert excess Cu2+ to Cu+. The Catholyte
solution was simply 2 L of type 1 deionized water (18 MΩ cm resistance).
2.3.4: Membrane Electrode Assembly Fabrication and Full-Cell Construction
Membrane electrode assemblies (MEA) were fabricated from in house materials. A
5 cm2 section of cathode catalyst (detailed in 2.1.4) was combined with a 3.5 cm x 5 cm section
of cleaned Nafion 115 in a hot press. The samples were compressed under a load of 200 kg m-2

36
at a temperature of 125 °C for 75 s. The combined cathode and membrane were placed
immediately onto a prepared 5 cm2 section of anode material in the full-cell.
The full-cell was assembled by placing a 5 cm2 section of anode material over the anode
flow channels. The anode electrode was surrounded by a piece of 10 mil (1 mil = 0.001”)
silicone gasket material that completely covered the electrolysis cell’s graphite plates. As
described above the membrane and cathode materials were placed over the anode electrode.
The cathode electrode was also surrounded by a piece of 10 mil silicone gasket material cut to
match the existing gasket. The cathode graphite plate was placed on top of the completed MEA
and the electrolysis cell bolts were tightened to 30 in lb (3.4 N m) of torque. This compression
ensured proper contact between the electrodes and the Nafion 115 membrane.
2.4: Electrochemical Characterization
For both full and half-cell characterizations, solutions of CuCl in HCl were produced. The
working electrode/anode in all cases was a high surface CCE material coated onto non-wet
proofed CFP (TGP-H-090). In all tests an atmosphere of N2 gas was used to prevent spontaneous
oxidation of Cu+ to Cu2+. Half and full-cell electrochemical measurements were acquired using a
combination of a Solartron 1470 E multichannel potentiostat and Solartron SI 1260 Impedance
Analyzer controlled using Multi-Stat software.
2.4.1: Half-Cell Electrochemical Techniques
The half-cell electrochemical tests took place in a standard three electrode cell. A
saturated calomel (SCE) reference electrode was used along with a Pt wire counter electrode.
The working electrodes in all cases were 2 cm2 sections of CCE materials coated onto bare
carbon fiber paper as discussed in 2.1.2. Impedance and capacitive CV measurements were
taken at ambient temperature in 100 mL of 1.5 M HCl under quiescent conditions and with
380 RPM stirring. Impedance spectra were collected over a range of 100000 Hz to 0.1 Hz at
0.0 V vs. open circuit potential (OCV). Capacitive CV measurements were taken at scan rates of
20, 50, and 100 mv s-1 across a range of 0.15 to 0.85 V vs RHE. Potential stair step and
potentiostatic measurements were taken in identical conditions with the addition of CuCl to
produce an electrolyte solution of 1 mM CuCl in 1.5 M HCl. Potential stair step measurements
were taken from 0.35 to 0.85 V vs RHE with 10 mV steps and varied dwell times at each
potential. Potentiostatic measurements were taken at 0.50 V vs. RHE for 600 s.
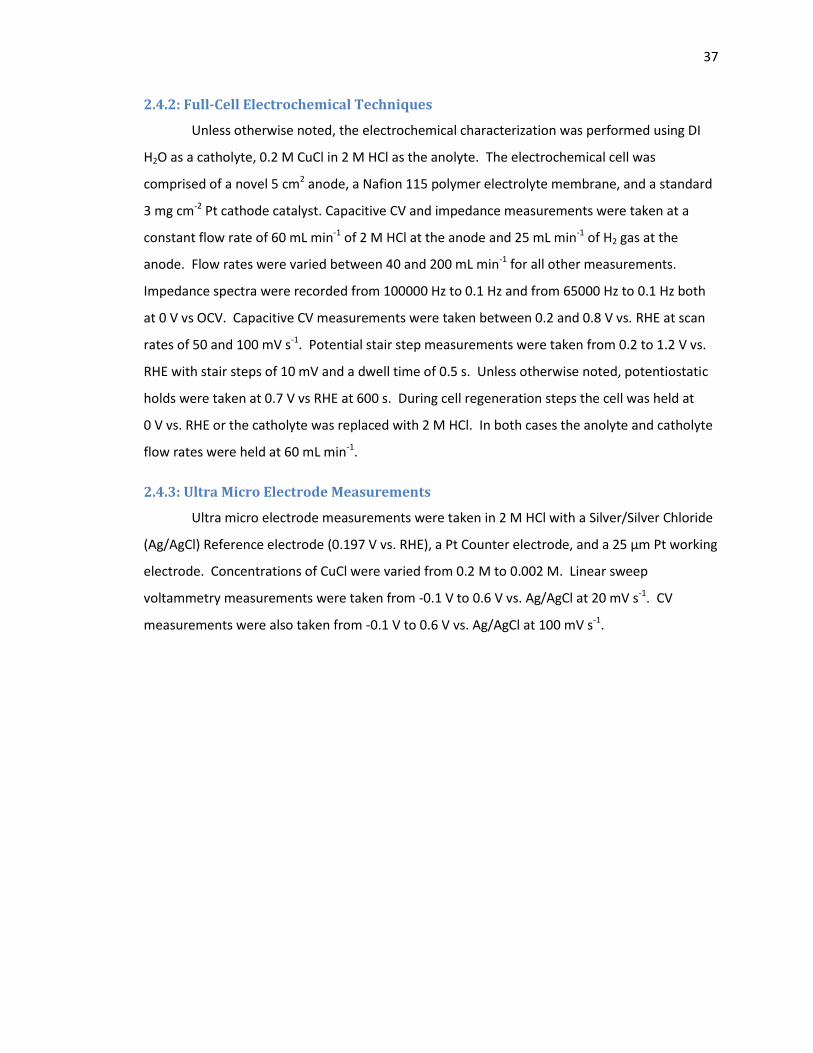
37
2.4.2: Full-Cell Electrochemical Techniques
Unless otherwise noted, the electrochemical characterization was performed using DI
H2O as a catholyte, 0.2 M CuCl in 2 M HCl as the anolyte. The electrochemical cell was
comprised of a novel 5 cm2 anode, a Nafion 115 polymer electrolyte membrane, and a standard
3 mg cm-2 Pt cathode catalyst. Capacitive CV and impedance measurements were taken at a
constant flow rate of 60 mL min-1 of 2 M HCl at the anode and 25 mL min-1 of H2 gas at the
anode. Flow rates were varied between 40 and 200 mL min-1 for all other measurements.
Impedance spectra were recorded from 100000 Hz to 0.1 Hz and from 65000 Hz to 0.1 Hz both
at 0 V vs OCV. Capacitive CV measurements were taken between 0.2 and 0.8 V vs. RHE at scan
rates of 50 and 100 mV s-1. Potential stair step measurements were taken from 0.2 to 1.2 V vs.
RHE with stair steps of 10 mV and a dwell time of 0.5 s. Unless otherwise noted, potentiostatic
holds were taken at 0.7 V vs RHE at 600 s. During cell regeneration steps the cell was held at
0 V vs. RHE or the catholyte was replaced with 2 M HCl. In both cases the anolyte and catholyte
flow rates were held at 60 mL min-1.
2.4.3: Ultra Micro Electrode Measurements
Ultra micro electrode measurements were taken in 2 M HCl with a Silver/Silver Chloride
(Ag/AgCl) Reference electrode (0.197 V vs. RHE), a Pt Counter electrode, and a 25 µm Pt working
electrode. Concentrations of CuCl were varied from 0.2 M to 0.002 M. Linear sweep
voltammetry measurements were taken from -0.1 V to 0.6 V vs. Ag/AgCl at 20 mV s-1. CV
measurements were also taken from -0.1 V to 0.6 V vs. Ag/AgCl at 100 mV s-1.

38
Chapter 3 : Materials for Half Cell Electrolysis

39
3.1: Materials Characterization Results
After production of the CCE materials the composition of the electrode structure as well
as bulk chemical characteristics were examined. To maintain the same physical and chemical
composition the excess ceramic carbon materials were processed in the same manner that we
used to produce the CCE materials.
Initially thermogravimetric analysis (TGA) analysis was performed on excess ceramic
carbon material left over from the production of the CCE materials. The mass of the samples
were assessed before and after the combustion of the sample to determine bulk composition. A
sample TGA graph is shown in Figure 3-1 where weight percent of the original sample is
recorded as a function of temperature.
Figure 3-1: Example TGA spectra of 1N CCE Materials under flowing air with temperatures ramped from 20-1000 °C
at 20 °C min-1
. Mass percent normalized at 200 °C.
During the production of the sol-gel network water is produced as a byproduct. The water
produced can become trapped within the sol-gel networks and pores. To account for the
0
20
40
60
80
100
120
0 200 400 600 800 1000
Mas
s (w
t%)
Temperature (°C)
B1P73S2
B1P69S1
B1P69S2
B1P69S3
40
variation in moisture content within the CCE materials the TGA data was normalized to the
weight percent at 200 °C, explaining the greater than 100% weight percents shown in Figure 3-1.
The CCE’s relatively simple chemical composition (silane and carbon only) allowed the mass
percent of silane to be determined from the remaining SiO2 after the sample was combusted in
an air environment. Mass percent of SiO2 gives moles of silicone per gram of CCE (assuming 1 g
total). Weight percent of silane in the CCE was taken as the moles per gram of silane multiplied
by the silanes polymerized molar mass. The chemical formula of polymerized silane monomer
was taken as
SiO1.5R where R is the silane monomers side chain. The O1.5 is representative of the fact that
each of the three bonded oxygen atoms is shared with a neighboring silane monomer within the
branched Si-O-Si network.
As mentioned in chapter 2 the half-cell electrodes were prepared by coating them onto
strips of bare CFP. This provided us with a CCE working electrode that could be inserted into a
standard 3 electrode cell environment for testing. Both the EIS measurements and capacitive CV
measurements were taken in the absence of CuCl to assess the electrodes total conductivity and
capacitive surface area. It is assumed that if the electrode has a larger capacitive surface area
then it should have a larger limiting current when normalized for geometric surface area for the
conversion of CuCl to CuCl2. This rational is supported because there is no catalyst component
required for the oxidation of Cu+; therefore, it can take place at any free and accessible section
of the electrode structure27,28. Additionally, the capacitive CV measurements were used to
assess the degassed state of the electrode and the cleanliness of the electrode surface. In an
ideal case the capacitive CV measurement will be characterized by steep onset at the initial
potential followed by a horizontal scan at a constant current to the upper potential, the reverse
scan the shows the mirrored response. Any slope in the CV shape as the potential is scanned
will indicate that the sample is resistive and requires a further break in period. Additionally, the
appearance of peaks at approximately 0.4 V vs. RHE indicate the presence of surface quinones
on the CCE electrode also indicating that further break in is required.
There were only two main measurements made of the actual ability for the CCE’s to
oxidize Cu, potential stair step measurements and potentiostatic holds. For the full-cell testing,
potential stair step measurements were adapted from previous work to replace standard linear
sweep voltammetry24,32. At 0.4 V applied vs. RHE the Cu+ species will be oxidized to Cu2+. This

41
characterizes the onset of the current response. Onset potentials higher than 0.4 V vs. RHE can
indicate a destruction of our anode or a chemical change in our cathode counter electrode in
the case of full-cell electrolysis. Ultimately, an onset potential at 0.4 V is expected and larger
current responses are favorable.
3.2: Electrochemical Characterization Results
Half-cell measurements were taken to initially characterize the varied silanes effects as
well as to compare them to previous work from our lab24,32. The varied silanes were tested in
the half cell conditions previously used in our lab. Multiple iterations of the 1N silane were
produced initially to validate our testing methods through comparison of the electrochemical
test data to previous work24,32. To compliment these samples we produced CCE materials with
similar molar loadings of the 2N and 3N silanes. The discussed silane CCE materials produced
with the 1N, 2N, and 3N materials are listed in Table 3-1.
Table 3-1: Compositions of CCE materials for half-cell testing produced with 1N, 2N, and 3N silane precursors.
Sample Code Silane Type mMol Silane/g C Wt% Silane
B1P12S1 1N 4.28 47.0
B1P12S2 1N 5.56 61.2
B1P12S3 1N 6.29 69.2
B1P13S1 2N 3.83 58.6
B1P13S2 2N 4.92 75.4
B1P13S3 2N 5.19 79.4
B1P15S1 3N 3.62 70.9
B1P15S2 3N 4.26 83.4
B1P15S3 3N 4.61 90.3
All of the composition data was determined using TGA analysis as described above. The CCE
structures were comprised of solely Vulcan XC-72 carbon and the silane binders. In all cases
only one type of silane monomer precursor was used in each gel reaction. This was done to
allow for individual characterization of the different silanes effects on the CCE electrochemical
activity.
The CCE materials were prepared as described in section 2.1.2: Half-Cell Electrode
Production. The double sided CCE allowed for a 2 cm2 area of electrode to be tested. To test
only the CCE coated area of the electrodes samples were held partially submerged in the

42
electrolyte solution for the duration of the testing, the double sided coating additionally
prevented an uncoated back of the electrode from being coated.
Each set of CCE materials consisted of three gels, with the aim to produce a “low”,
“medium”, and “high” wt% silane CCE. The samples were originally intended to have
comparable silane loadings to those produced by our lab previously24. The original target
compositions were 22, 36, and 56 wt% silane respectively. As listed above (Table 3-1), all of the
samples produced had relative silane compositions above the 22 and 36 wt% samples produced
previously in our lab. Across the low, medium, and high loading samples produced with each
silane precursor the silane content had a relative standard deviation of 8.6, 13.3, and 16.0%
respectively. With these samples we were able to compare the effects of the type and amount
each silane precursor on the electrochemical properties of the CCE’s.
3.2.1: Electrochemical Results for 1N Materials
The 1N samples were initially characterized in the absence of CuCl to assess
electrochemical impedance characteristics and electrode surface area (Figure 3-2). The surface
area was estimated by the magnitude of the capacitive current observed during the CV
measurements. The relative sizes of the capacitive CVs were compared to estimate relative
surface areas.
Figure 3-2: Capacitive CV of CCE materials with varied 1N silane loading and normalized for geometric surface area
(SA). Experiment performed in 1.5 M HCl under N2 atmosphere. Scan from 0.15 to 0.85 V vs. RHE at 50 mv s-1
.
-1
-0.5
0
0.5
1
1.5
0 0.2 0.4 0.6 0.8 1
Cu
rre
nt
De
nsi
ty (
mA
cm
-2)
Potential (V vs. RHE)
47.0 wt% Silane
61.2 wt% Silane
69.2 wt% Silane
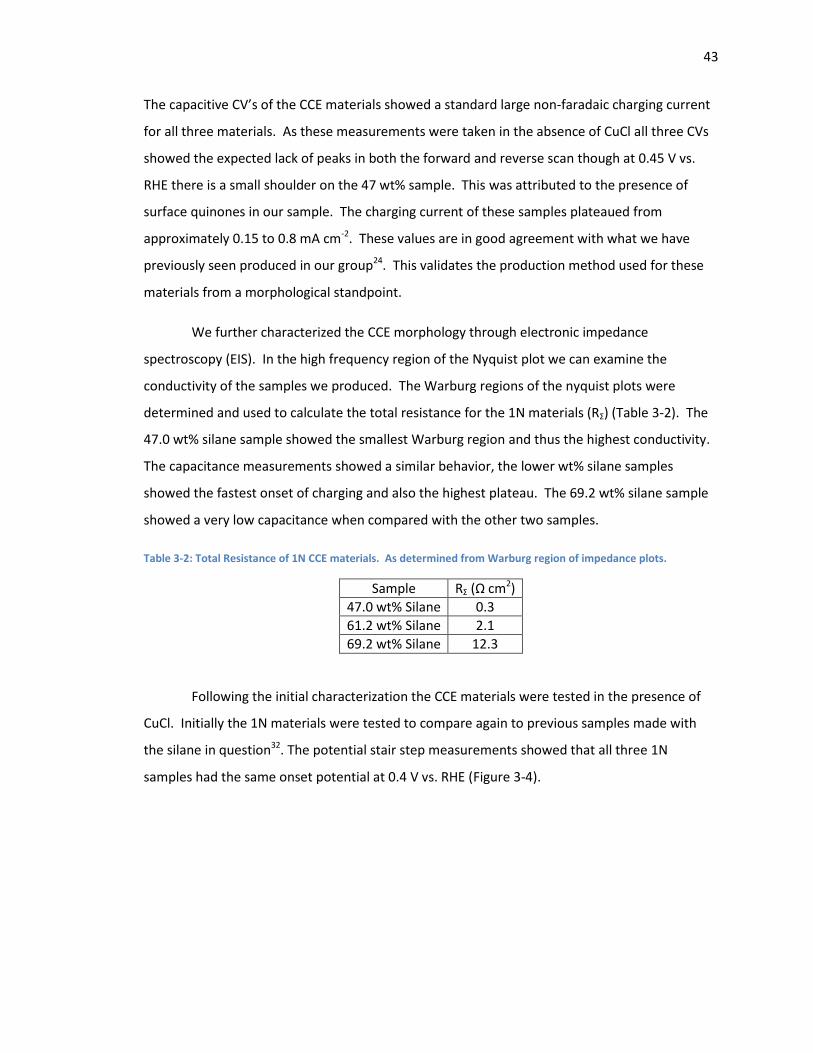
43
The capacitive CV’s of the CCE materials showed a standard large non-faradaic charging current
for all three materials. As these measurements were taken in the absence of CuCl all three CVs
showed the expected lack of peaks in both the forward and reverse scan though at 0.45 V vs.
RHE there is a small shoulder on the 47 wt% sample. This was attributed to the presence of
surface quinones in our sample. The charging current of these samples plateaued from
approximately 0.15 to 0.8 mA cm-2. These values are in good agreement with what we have
previously seen produced in our group24. This validates the production method used for these
materials from a morphological standpoint.
We further characterized the CCE morphology through electronic impedance
spectroscopy (EIS). In the high frequency region of the Nyquist plot we can examine the
conductivity of the samples we produced. The Warburg regions of the nyquist plots were
determined and used to calculate the total resistance for the 1N materials (RΣ) (Table 3-2). The
47.0 wt% silane sample showed the smallest Warburg region and thus the highest conductivity.
The capacitance measurements showed a similar behavior, the lower wt% silane samples
showed the fastest onset of charging and also the highest plateau. The 69.2 wt% silane sample
showed a very low capacitance when compared with the other two samples.
Table 3-2: Total Resistance of 1N CCE materials. As determined from Warburg region of impedance plots.
Sample RΣ (Ω cm2)
47.0 wt% Silane 0.3
61.2 wt% Silane 2.1
69.2 wt% Silane 12.3
Following the initial characterization the CCE materials were tested in the presence of
CuCl. Initially the 1N materials were tested to compare again to previous samples made with
the silane in question32. The potential stair step measurements showed that all three 1N
samples had the same onset potential at 0.4 V vs. RHE (Figure 3-4).

44
Figure 3-3: Impedance and capacitance plots of CCE materials with varied 1N silane content. Collected in 1.5 M HCl
under N2 atmosphere. (A) Nyquist plot (B) High frequency region (C) Capacitance plot normalized for the total mass
of carbon present in the CCE sample.
0
10
20
30
40
50
60
70
80
0 20 40
Z" (
Ω)
Z' (Ω)
47.0 wt% Silane61.2 wt% Silane
69.2 wt% Silane
0
0.05
0.1
0.15
0.2
0.25
0.3
0.35
0.4
0.45
0.5
0 0.2 0.4
Z" (
Ω)
Z' (Ω)
47.0 wt% Silane
61.2 wt% Silane69.2 wt% Silane
0
5
10
15
20
25
30
35
40
45
0 10 20 30 40
Cap
acit
ance
(m
F g C
arb
on
-1)
Z' (Ω)
47.0 wt% Silane61.2 wt% Silane69.2 wt% Silane
A
B
C

45
Figure 3-4: Potential stair step measurement of CCE materials with varied 1N silane compositions. Scanned from
0.35-0.85 V vs. RHE with 10 mV steps and 3 s dwell times. Electrochemical measurement were collected in 1 mM
CuCl in 1.5 M HCl under N2 atmosphere electrolyte.
Each of the materials had a similar current response and plateau time. The overall plateau
current provides insight into the relative limiting operating currents of the three materials when
their currents are controlled by diffusion. In this set we saw that the highest weight percent
sample had the highest limiting current while the sample at 61.2 wt% had the lowest limiting
current, performing the worst. It was shown that these samples performed comparably to
those produced previously in our lab with limiting currents within 0.02 mA cm-2 of previous
values32. The linear shape of the diffusion limited current also indicated that there were no
further faradaic processes occurring at the electrode surface.
To better simulate sustained full-cell operation, the 1N materials were held at a
constant potential of 0.60 V vs. RHE for 10 min (600 s) (Figure 3-5). At this potential the
oxidation of CuCl can occur allowing for the production of H2 gas at Pt wire counter electrode.
This hold was performed to assess each of the different materials abilities to produce H2 gas
over time. The linear shape of the three materials current responses indicate that the electrode
materials did not degrade over the time scale of the experiments. This initial stability is
0
0.01
0.02
0.03
0.04
0.05
0.06
0 0.2 0.4 0.6 0.8 1
No
rmal
ized
Cu
rren
t (m
A c
m-2
)
Potential (V vs. RHE)
47.0 wt% Silane
61.2 wt% Silane
69.2 wt% Silane

46
promising as the electrodes will be expected to perform reliably over long time frames when
integrated into the full CuCl-HCl electrolysis cycle. The potentiostatic holds showed the same
trend in activity that we observed in the potential stair step measurements. Taking the current
of the potentiostatic hold at 150 seconds to be representative of each material’s current
response we can examine the effects of the CCE composition on the electrodes current response
(Figure 3-6).
Figure 3-5: Potentiostatic measurements of CCE materials with varied 1N silane compositions. Potential held at 0.6
V vs. RHE. Collected in 1 mM CuCl in 1.5 M HCl under N2 atmosphere electrolyte.
The current responses were normalized for the mass of carbon in the CCE to better compare
electrode performance. As mentioned above there is very little dependence of the current on
the composition of the silane outside of a slight positive correlation (Figure 3-6).
0
0.01
0.02
0.03
0.04
0.05
0.06
0.07
0 100 200 300 400 500 600 700
Cu
rre
nt
(mA
cm
-2)
Time (s)
47.0 wt% Silane61.2 wt% Silane69.2 wt% Silane

47
Figure 3-6: Relationship between 1N silane composition and current response from potentiostatic holds. Value
taken from current at 150 s.
3.2.2: Electrochemical Results for 2N Materials
The 2N and 3N materials were tested in the same fashion as the 1N materials. We can
see in Figure 3-7 that the 2N materials showed a similar trend in capacitive surface area and
silane composition to the previously tested 1N materials (Figure 3-2). In our impedance
measurements of the samples we once again see that the highest conductivity comes from the
lowest wt% silane CCE at 58.6 wt% silane (Figure 3-8 and Table 3-3). In this case we also see a
comparable conductivity from the 75.4 wt% silane. After the second sample there is a marked
decrease in the conductivity for the 79.4 wt% sample. This indicates that there is a sharp
increase in the electronic resistance between 75.4 and 79.4 wt% 2N silane as the only notable
change is the increase in the electrically resistive silane. This high electronic resistance in the
79.4 wt% CCE can be seen in the comparatively shallow slope on the initial charging region of
the capacitance plot as well. There is a much lower plateau for the 79.4 wt% silane sample than
was observed for the other two samples. This is consistent with the capacitive CV
measurements shown in Figure 3-7 which showed the same trend in the capacitive surface
areas.
0.00
0.01
0.02
0.03
0.04
40 60 80
Cu
rre
nt
(mA
gC
cm
-2)
Silane Composition (wt%)

48
Figure 3-7: Capacitive CV of CCE materials with varied 2N silane loading and normalized for Geometric SA. Collected
in 1.5 M HCl under N2 atmosphere. Scan from 0.15 to 0.85 V vs. RHE at 50 mv s-1
.
Under potential stair step measurements there was a significant transient current
recorded for the 75.4 wt% 2N sample (Figure 3-9 (B)). For this reason the sample was removed
from further examination during comparison between different 2N samples and between
different silanes. As with the 1N materials there is a similar shape to the current onset and
eventual plateau. Transient currents were observed for the remaining two CCE’s shown by the
steady increase in current after the expected plateau of the potential stair step. Visual
inspection of the Pt counter electrode determined the transient currents to be due to plating of
Cu from Cu+ or Cu2+ at the Pt counter electrode. It was assumed that the initial plateau current
was still representative of the CCE’s performances.
-2
-1
0
1
2
3
4
0 0.2 0.4 0.6 0.8 1
Cu
rre
nt
De
nsi
ty (
mA
cm
-2)
Potential (V vs. RHE)
58.6 wt% Silane
75.4 wt% Silane
79.4 wt% Silane
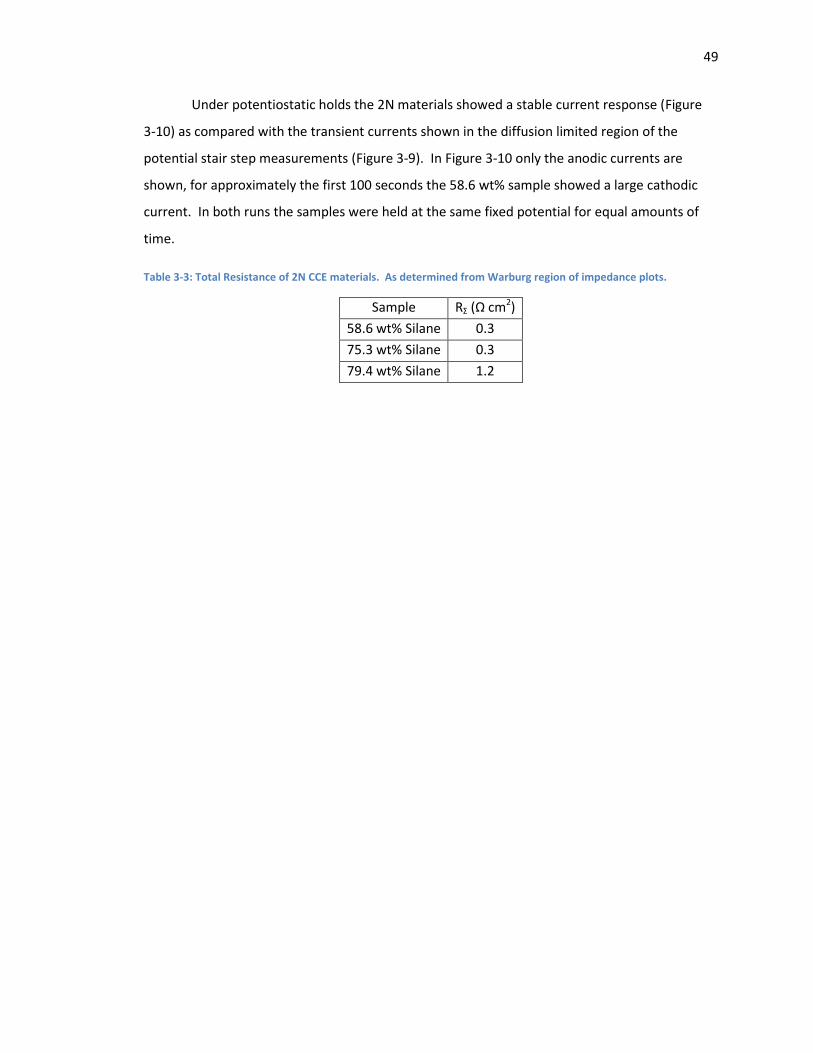
49
Under potentiostatic holds the 2N materials showed a stable current response (Figure
3-10) as compared with the transient currents shown in the diffusion limited region of the
potential stair step measurements (Figure 3-9). In Figure 3-10 only the anodic currents are
shown, for approximately the first 100 seconds the 58.6 wt% sample showed a large cathodic
current. In both runs the samples were held at the same fixed potential for equal amounts of
time.
Table 3-3: Total Resistance of 2N CCE materials. As determined from Warburg region of impedance plots.
Sample RΣ (Ω cm2)
58.6 wt% Silane 0.3
75.3 wt% Silane 0.3
79.4 wt% Silane 1.2

50
Figure 3-8: Impedance and Capacitance plots of CCE materials with varied 2N silane content. Tests were performed
in 1.5 M HCl under N2 atmosphere at 0 V vs. OCV. (A) Nyquist plot (B) High frequency region (C) Capacitance plot.
0
2
4
6
8
10
12
14
16
18
20
0 5 10 15 20
Z" (
Ω)
Z' (Ω)
58.6 wt% Silane75.4 wt% Silane79.4 wt% Silane
0
0.05
0.1
0.15
0.2
0.25
0.3
0.35
0.4
0.45
0.5
0 0.2 0.4
Z" (
Ω)
Z' (Ω)
58.6 wt% Silane75.4 wt% Silane79.4 wt% Silane
0
20
40
60
80
100
120
140
160
0 5 10 15 20
Cap
acit
ance
(m
F g C
arb
on
-1)
Z' (Ω)
58.6 wt% Silane75.4 wt% Silane79.4 wt% Silane
A
B
C

51
Figure 3-9: Potential stair step measurement of CCE materials with varied 2N silane compositions. Scanned from
0.35-0.85 V vs. RHE with 10 mV steps and 3 s dwell times. Collected in 1 mM CuCl in 1.5 M HCl under N2
atmosphere electrolyte. (A) Working plots (B) Transient current plot included.
0
0.01
0.02
0.03
0.04
0.05
0.06
0.07
0 0.5 1
Cu
rren
t (m
A c
m-2
)
Potential (V vs. RHE)
58.6 wt% Silane
79.4 wt% Silane
0
0.05
0.1
0.15
0.2
0.25
0.3
0.35
0.4
0.45
0.5
0 0.5 1
Cu
rren
t (m
A c
m-2
)
Potential (V vs. RHE)
58.6 wt% Silane
75.3 wt% Silane
79.4 wt% Silane
A
B

52
Figure 3-10: Potentiostatic measurements of CCE materials with varied 2N silane compositions. Potential held at
0.6 V vs. RHE. Experiments performed in 1 mM CuCl in 1.5 M HCl under N2 atmosphere electrolyte. (A) Scaled to
show difference between materials (B) Scaled to keep the same maximum current as shown in Figure 3-5 for
comparison.
3.2.3: Electrochemical Results for 3N Materials
The 3N materials also showed a decrease in capacitive area with increased silane
content (Figure 3-11) similar to what was seen for the 1N and 2N materials). All three CVs
showed a lack of significant faradaic processes, though the linear increase in current with
potential during the entire CV measurement of the 83.4 wt% sample did display significant
0
0.002
0.004
0.006
0.008
0.01
0.012
0 100 200 300 400 500 600 700
Cu
rre
nt
(mA
cm
-2)
Time (s)
58.6 wt% Silane
79.4 wt% Silane
0
0.01
0.02
0.03
0.04
0.05
0.06
0.07
0 100 200 300 400 500 600 700
Cu
rre
nt
(mA
cm
-2)
Time (s)
58.6 wt% Silane
79.4 wt% Silane
A
B
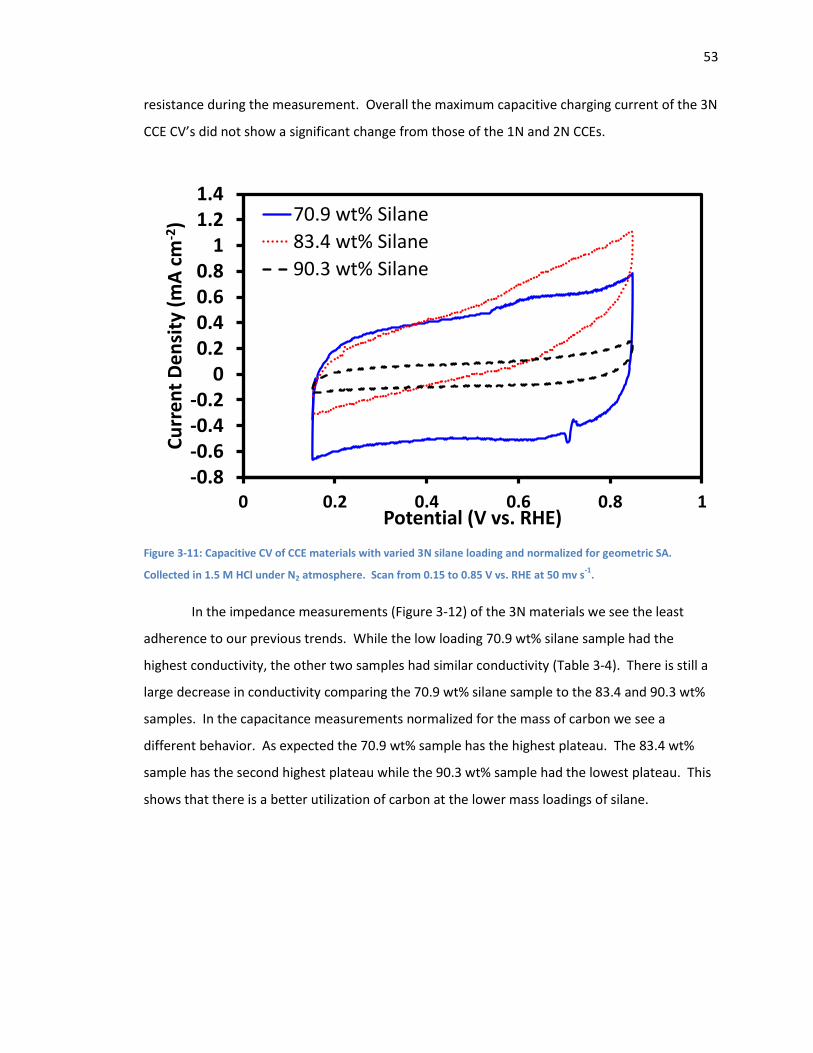
53
resistance during the measurement. Overall the maximum capacitive charging current of the 3N
CCE CV’s did not show a significant change from those of the 1N and 2N CCEs.
Figure 3-11: Capacitive CV of CCE materials with varied 3N silane loading and normalized for geometric SA.
Collected in 1.5 M HCl under N2 atmosphere. Scan from 0.15 to 0.85 V vs. RHE at 50 mv s-1
.
In the impedance measurements (Figure 3-12) of the 3N materials we see the least
adherence to our previous trends. While the low loading 70.9 wt% silane sample had the
highest conductivity, the other two samples had similar conductivity (Table 3-4). There is still a
large decrease in conductivity comparing the 70.9 wt% silane sample to the 83.4 and 90.3 wt%
samples. In the capacitance measurements normalized for the mass of carbon we see a
different behavior. As expected the 70.9 wt% sample has the highest plateau. The 83.4 wt%
sample has the second highest plateau while the 90.3 wt% sample had the lowest plateau. This
shows that there is a better utilization of carbon at the lower mass loadings of silane.
-0.8-0.6-0.4-0.2
00.20.40.60.8
11.21.4
0 0.2 0.4 0.6 0.8 1
Cu
rre
nt
De
nsi
ty (
mA
cm
-2)
Potential (V vs. RHE)
70.9 wt% Silane
83.4 wt% Silane
90.3 wt% Silane

54
Figure 3-12: Impedance and capacitance plots of CCE materials with varied 3N silane content. Tests were
performed in 1.5 M HCl under N2 atmosphere at 0 V vs. OCV. (A) Nyquist plot (B) High frequency region (C)
Capacitance plot.
0
10
20
30
40
50
60
0 20 40 60
Z" (
Ω)
Z' (Ω)
70.9 wt% Sample83.4 wt% Sample90.3 wt% Sample
0
0.05
0.1
0.15
0.2
0.25
0.3
0.35
0.4
0.45
0.5
0 0.2 0.4
Z" (
Ω)
Z' (Ω)
70.9 wt% Sample83.4 wt% Sample90.3 wt% Sample
0
10
20
30
40
50
60
70
0 20 40 60
Cap
acit
ance
(m
F g C
arb
on
-1)
Z' (Ω)
70.9 wt% Sample83.4 wt% Sample90.3 wt% Sample
A
B
C

55
Table 3-4: Total Resistance of 3N CCE materials. As determined from Warburg region of impedance plots.
Sample RΣ (Ω cm2)
70.9 wt% Silane 0.3
83.4 wt% Silane 1.2
90.3 wt% Silane 1.2
The potential stair step measurements showed transient currents for the 83.4 wt% 3N
sample masking any of the CuCl oxidation current (Figure 3-13 (A)). Again for this reason the
83.4 wt% sample was discarded for comparisons of the potential stair steps. The two samples
that were successfully run both show onset potential as well as current response similar to the
1N and 2N materials tested (Figure 3-4 and Figure 3-9 respectively). In these samples there was
a flatter current response in the diffusion limited region indicating that there were no non
faradaic processes occurring (Figure 3-13(B)). With regards to the diffusion limited current, we
can see that the 3N materials behaved in a similar fashion to the 2N materials with the higher
wt% silane samples exhibiting a higher current response than the lower ones. The 3N materials
did show a lower overall current response in the potential stair step measurements than was
observed for the 1N and 2N materials (Figure 3-13).
While the 3N materials did behave in a manner that was consistent with previous
measurements the current response in the potentiostatic hold measurements was also seen to
be lower. Again for the 3N materials, a potential hold was applied at 0.60 V vs. RHE for a total
time of 600 s; however, a cathodic current was recorded for the initial approximately 100 s and
was not shown in Figure 3-14.
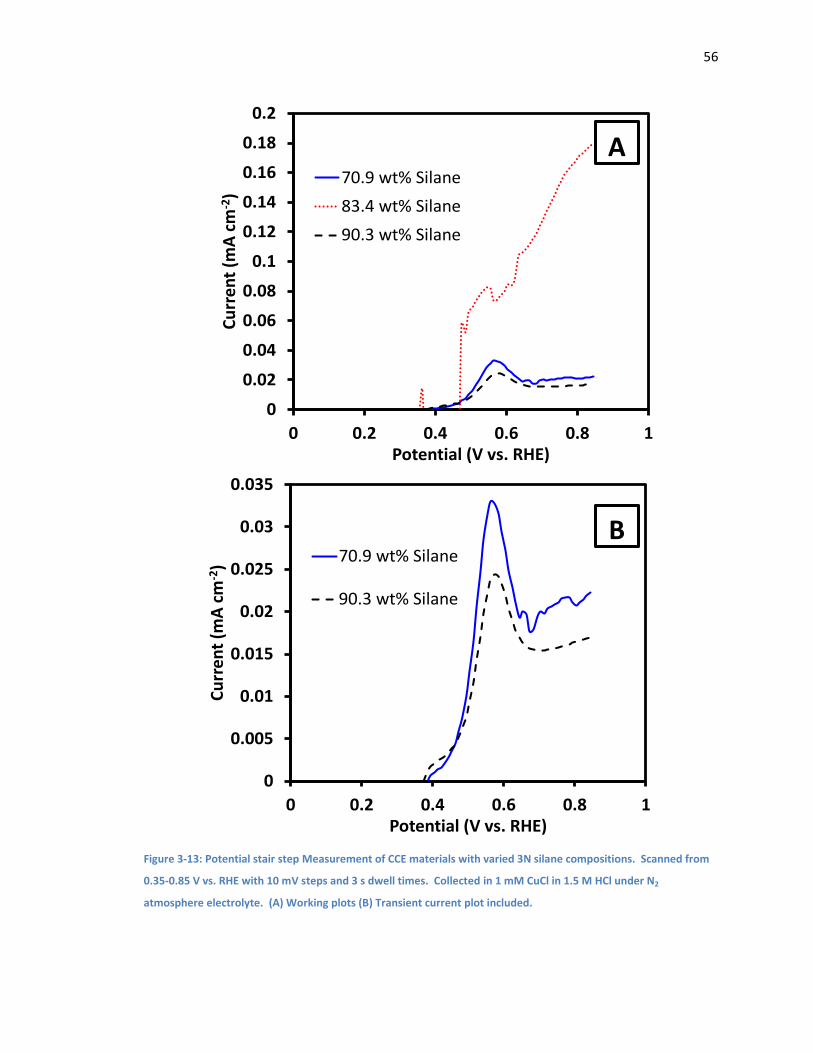
56
Figure 3-13: Potential stair step Measurement of CCE materials with varied 3N silane compositions. Scanned from
0.35-0.85 V vs. RHE with 10 mV steps and 3 s dwell times. Collected in 1 mM CuCl in 1.5 M HCl under N2
atmosphere electrolyte. (A) Working plots (B) Transient current plot included.
0
0.02
0.04
0.06
0.08
0.1
0.12
0.14
0.16
0.18
0.2
0 0.2 0.4 0.6 0.8 1
Cu
rren
t (m
A c
m-2
)
Potential (V vs. RHE)
70.9 wt% Silane
83.4 wt% Silane
90.3 wt% Silane
0
0.005
0.01
0.015
0.02
0.025
0.03
0.035
0 0.2 0.4 0.6 0.8 1
Cu
rren
t (m
A c
m-2
)
Potential (V vs. RHE)
70.9 wt% Silane
90.3 wt% Silane
A
B

57
Figure 3-14: Potentiostatic measurements of CCE materials with varied 3N silane compositions. Potential held at
0.6 V vs. RHE. Tests were performed in 1 mM CuCl in 1.5 M HCl under N2 atmosphere electrolyte.
3.3: Discussion of Half-Cell Materials
As shown in Table 3-1 the various silane materials were all produced with similar molar
loadings of the 1N, 2N, and 3N silane materials. This allowed for the easy comparison of the
materials to one another to assess their relative electrochemical properties. The standardized
testing protocol also allowed for easy comparison between silane materials. Of the actual
electrochemical results the most important metric was the ability for the materials to oxidize
CuCl. The potentiostatic holds were performed to assess the CCE’s performance under
conditions as close to approximating the conditions to be used during full-cell testing as can be
performed in the half-cell. Potentiostatic holds provided good insight into the under load
operation of the CCE working electrodes. Holds made at 0.6V vs. RHE were used to compare the
electrodes performance to one another. Observing the drop off in current over time in the
potentiostatic holds also gave an insight into the CCE’s overall lifetime and stability. While still
operating properly the potentiostatic hold gave a linear current response for the oxidation of
Cu+, deviations from this linear response are related to transient current processes such as the
plating of Cu+ at the Pt Counter electrode.
3.3.1: 1N Materials
From the initial Capacitive CV measurements (Figure 3-2), a decrease in capacitive
current was observed as silane content increased. As the carbon surface area dominates the
0
0.001
0.002
0.003
0.004
0.005
0.006
0 200 400 600
Cu
rre
nt
(mA
cm
-2)
Time (s)
70.9 wt% Silane
90.3 wt% Silane

58
CCE structure, the lower capacitive current was attributed to the lower carbon composition in
the higher wt% silane samples. Additionally, it was assumed that with the higher resistance
from the silicate backbone will also cause a lower rate of capacitive charging on the existing
carbon in the higher wt% silane samples. This trend of lower overall capacitance was also
displayed in the capacitance plots of the 1N materials (Figure 3-3 (C)). Further confirming the
resistive nature of the high silane content materials, the EIS measurements the samples with
higher silane content were shown to have a larger Warburg region and therefore a higher
resistance (Figure 3-3 (A and B)). The protonated amines present on the silane materials should
provide an increased ionic conductivity. With this in mind it would be expected for the sample
with the highest silane content (69 wt%) to have the highest ionic conductivity, which was not
the case. The explanation for this is that the increased silane content causes the higher wt%
silane samples to become more electronically resistive. As the Warburg region can only be used
to identify the total resistance, the increased electronic resistance from the silane content was
too large for the CCE to benefit from the increased ionic conductivity.
As mentioned above, the potentiostatic measurements were used to examine the under
load operation of the different CCEs. Both the potentiostatic and potential stair step
measurements showed that there were no transient processes occurring during the CuCl
oxidation process (Figure 3-4, Figure 3-5). This was expected as there was no catalytic material
present on the electrode to facilitate side reactions. As seen in Figure 3-6 there was a low
correlation between the wt% of silane and the mass normalized current response. This
indicated that either the limiting current was being reached for the electrodes in question or
that there is another factor affecting the current response such as the CCE microstructure.
3.3.2: 2N Materials
As with the 1N samples, the capacitive CV measurements of the 2N materials (Figure
3-7) showed higher capacitive currents were present in the samples with lower wt% of silane.
This again indicates that there was a better utilization of the carbon surface area in the samples
with a lower silane wt% composition. In addition to this, we can see that the total charging
current from the 58 and 75 wt% samples was approximately double that of the associated 1N
materials, with the high loading samples also showing increased current. This indicates that the
2N materials are allowing better access to the carbon surface area when compared to 1N
materials with similar silane loadings. Additionally, this increased capacitive current should

59
result in a better electrode performance. Despite this we can see that there is a very poor
utilization of the carbon surface from the 79.4 wt% sample which could be indicative of high
electronic resistance from the large amount of silane present in the sample, as well as the silane
obstructing access to the carbon surface.
During the EIS measurements, an increase in resistance for the 79.4 wt% 2N silane
sample was observed (Figure 3-8 (A and B)). This sharp increase can be explained by the silane
finally destroying the majority of electron pathways at 79.4 wt% silane while there are still many
free electron pathways at 75.4 wt% silane. Regardless, this dramatic increase in resistance also
reinforces the notion that the increase in resistance is limiting the charging of the 79.4 wt%
silane material during the capacitive CV measurements. Additionally, the capacitance plot
(Figure 3-8 (C)) shows the same trend in total capacitance as seen in the capacitive CV
measurements (Figure 3-7).
The large transient current observed for the 75.3 wt% 2N CCE during the potential stair
step measurement (Figure 3-9) was attributed to a large deposition of copper at the cathode.
By discarding this sample from the subsequent testing there was little that could be drawn from
the potentiostatic holds (Figure 3-10). What can be observed was that the higher wt% sample
outperformed the lower wt% one by a margin similar to the differences between 1N materials
(Figure 3-5). The better performance of the 79.4 wt% is opposite of what can be seen in the
potential stair step measurements (Figure 3-9). It is assumed that the increase seen in the
potential stair step measurements was due to Cu plating artificially increasing the current
recorded for the 58.6 wt% sample. The potentiostatic measurements were assumed to be
representative of CuCl oxidation as there were no visible transient current regions.
3.3.3: 3N Materials
For the 3N materials there was once again a decrease in capacitive current with
increasing silane content (Figure 3-11). This decrease was consistent with the 1N and 2N
materials capacitive CV measurements and supports the idea that there is a large increase in
electronic resistance for the higher wt% silanes. The EIS measurements (Figure 3-12 (A and B))
also showed an increase in resistance with increasing silane content. This increase also agrees
with EIS measurements taken of the 1N and 2N materials (Figure 3-3 and Figure 3-8). From this
it was again assumed that while there should be an increase in ionic conductivity from the
increased protonated amine content, the increased silane content increased electronic
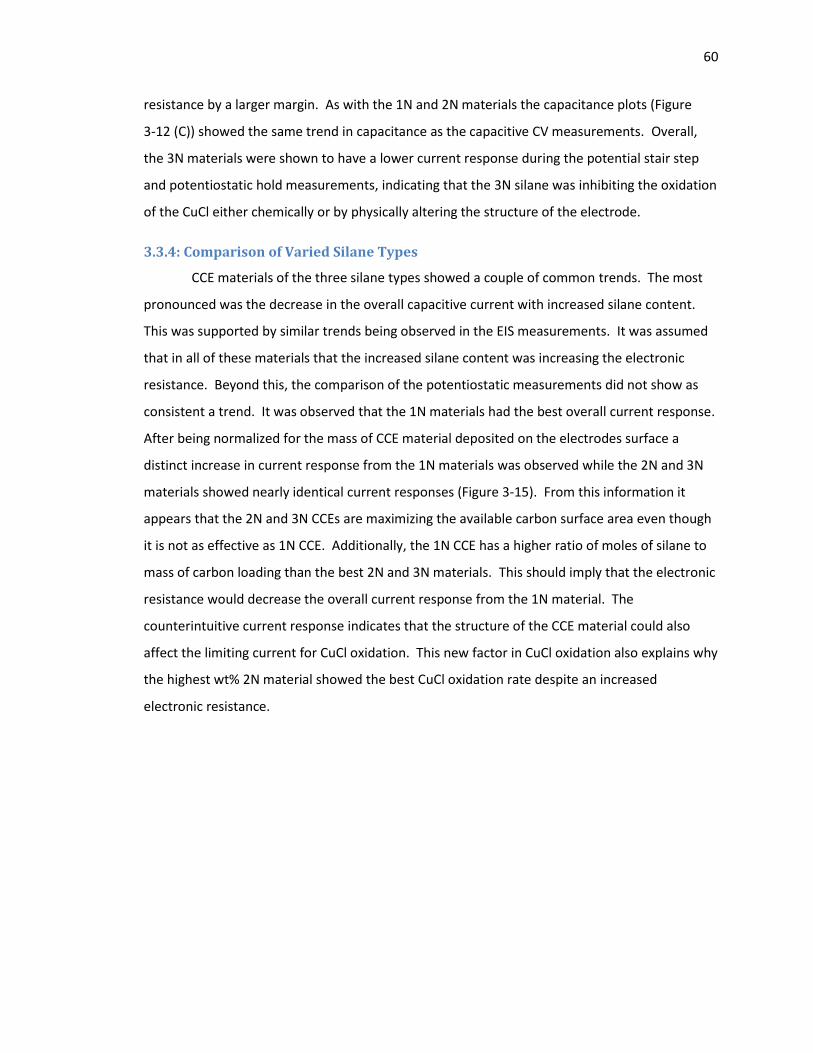
60
resistance by a larger margin. As with the 1N and 2N materials the capacitance plots (Figure
3-12 (C)) showed the same trend in capacitance as the capacitive CV measurements. Overall,
the 3N materials were shown to have a lower current response during the potential stair step
and potentiostatic hold measurements, indicating that the 3N silane was inhibiting the oxidation
of the CuCl either chemically or by physically altering the structure of the electrode.
3.3.4: Comparison of Varied Silane Types
CCE materials of the three silane types showed a couple of common trends. The most
pronounced was the decrease in the overall capacitive current with increased silane content.
This was supported by similar trends being observed in the EIS measurements. It was assumed
that in all of these materials that the increased silane content was increasing the electronic
resistance. Beyond this, the comparison of the potentiostatic measurements did not show as
consistent a trend. It was observed that the 1N materials had the best overall current response.
After being normalized for the mass of CCE material deposited on the electrodes surface a
distinct increase in current response from the 1N materials was observed while the 2N and 3N
materials showed nearly identical current responses (Figure 3-15). From this information it
appears that the 2N and 3N CCEs are maximizing the available carbon surface area even though
it is not as effective as 1N CCE. Additionally, the 1N CCE has a higher ratio of moles of silane to
mass of carbon loading than the best 2N and 3N materials. This should imply that the electronic
resistance would decrease the overall current response from the 1N material. The
counterintuitive current response indicates that the structure of the CCE material could also
affect the limiting current for CuCl oxidation. This new factor in CuCl oxidation also explains why
the highest wt% 2N material showed the best CuCl oxidation rate despite an increased
electronic resistance.
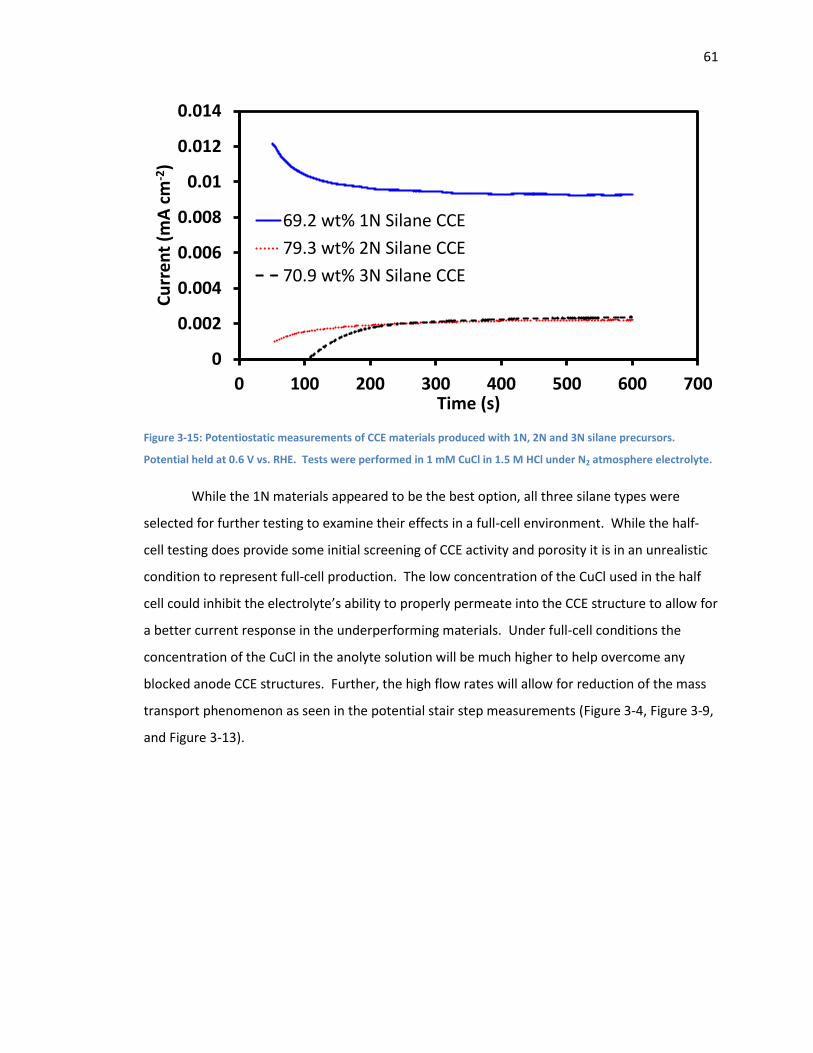
61
Figure 3-15: Potentiostatic measurements of CCE materials produced with 1N, 2N and 3N silane precursors.
Potential held at 0.6 V vs. RHE. Tests were performed in 1 mM CuCl in 1.5 M HCl under N2 atmosphere electrolyte.
While the 1N materials appeared to be the best option, all three silane types were
selected for further testing to examine their effects in a full-cell environment. While the half-
cell testing does provide some initial screening of CCE activity and porosity it is in an unrealistic
condition to represent full-cell production. The low concentration of the CuCl used in the half
cell could inhibit the electrolyte’s ability to properly permeate into the CCE structure to allow for
a better current response in the underperforming materials. Under full-cell conditions the
concentration of the CuCl in the anolyte solution will be much higher to help overcome any
blocked anode CCE structures. Further, the high flow rates will allow for reduction of the mass
transport phenomenon as seen in the potential stair step measurements (Figure 3-4, Figure 3-9,
and Figure 3-13).
0
0.002
0.004
0.006
0.008
0.01
0.012
0.014
0 100 200 300 400 500 600 700
Cu
rre
nt
(mA
cm
-2)
Time (s)
69.2 wt% 1N Silane CCE
79.3 wt% 2N Silane CCE
70.9 wt% 3N Silane CCE

62
Chapter 4 : Materials for Full-Cell Electrolysis

63
CCE materials with silane and carbon compositions similar to those described in chapter
3 (Table 3-1) were produced for testing in a full-cell environment. This was done to examine the
CCE materials in an environment closer in design to what will be required for integration into a
full CuCl-HCl cycle. Additionally, the full-cell environment was used to validate the predictive
capabilities of the half-cell measurements. The full-cell testing station and test protocol
underwent several design revisions through the full extent of testing. Unless noted, the results
were produced using the full-cell described in section 2.3.2 as well as the standard full-cell
protocol in section 2.4.2.
The initial cell design (Section 2.3.1) was used to verify the electrochemical activity of
the CuCl electrolysis and the purity of the prepared anolyte. Both the anode and cathode were
composed of 5 cm2 sections of standard Pt/C carbon CCE. To test water electrolysis, a solution
of deionized water was provided to both the anode and cathode at flow rate of 14 mL min-1 per
side. A potential stair step measurement was taken from 1.0 – 2.0 V vs. RHE. An onset potential
of 1.75 V vs. RHE was observed, a value expected for water electrolysis when accounting for
thermodynamic and resistive losses5. Below the onset potential value there was no appreciable
current response recorded. To evaluate the CuCl-HCl electrolysis process in our initial full-cell
system, deionized water was passed to the cathode and 0.2 M CuCl in 2M HCl was passed to the
anode, both at a flow rate of 14 mL min-1. A potential stair step measurement was taken from
0.05-1.4 V vs. RHE. In this case the onset potential was calculated to be 0.41 V vs. RHE. Again,
below this value there was no recoded current response (Figure 4-1). Both onset potentials
appeared at expected values5,27. From this measurement it can be seen that the CuCl-HCl
electrolysis process is performing as expected with a marked drop in onset potential over water
electrolysis. Additionally, a drop in current response can be observed at 0.86 V vs RHE for the
CuCl-HCl electrolysis process. This can be attributed to mass transport limitations for the
electrochemical cell. Beyond this initial testing, the characterization of the CCE materials
performed on the initial cell configuration (Section 2.3.1) were discarded in favor of test results
collected on the full-cell systems with design improvements (Section 2.3.2).

64
Figure 4-1: Comparison of CuCl and H2O electrolysis with a Pt/C anode and cathode catalyst. CuCl electrolysis
collected in 0.2 M CuCl in 2 M HCl anolyte and DI H2O catholyte both under N2 atmosphere at 14 mL min-1
electrolyte flow rate. Water electrolysis collected in DI H2O electrolyte at cathode and anode under N2 atmosphere
at 14 mL min-1
flow rate.
The primary concern with the initial full-cell design was the low flow rates provided by
the analogue pump. At 14 mL per minute maximum flow rate data acquired in the full-cell
design was not reasonable comparable data reported in literature which acquired at much
higher flow rates20,21. Given this, the pump system was changed to the Masterflex L/S digital
drive peristaltic pump (RK-07523-80). With this replacement the full-cell system remained
effectively unchanged throughout testing as tubing and electrolyte vessel changes had no
discernible impact on the maximum performance of the cell, and only helped to improve
electrolyte stability and long term cell operation.
A Potential stair step methodology was validated as a replacement for a linear sweep
voltammetry. A potential stair step measurement with 5 mV steps and 0.5 s dwell times at each
step (10 mV s-1 effective) was made from 0.2 to 1.2 V vs. RHE. Additionally, an LSV scan from 0.2
to 1.2 V vs. RHE at 10 mV s-1 was taken (Figure 4-2). The two scan methods produced similar
current responses. Importantly, the onset potential, when extrapolated, is very similar for both
the CV and potential stair step. Both plots also show the onset of the diffusion limited current
process at a similar potential. The only notable difference between the two graphs is a broad
0
0.02
0.04
0.06
0.08
0.1
0.12
0.14
0.16
0.18
0 0.5 1 1.5 2 2.5
Cu
rre
nt
(A c
m-2
)
Cell Potential (V)
CuCl Electrolysis
Water Electrolysis

65
peak from approximately 0.2 to 0.65 V vs. RHE on the 10 mV s-1 LSV scan. This peak can be
attributed to electrolyte preloading within the highly porous electrode structure.
Figure 4-2: Comparison of linear sweep and potential stair step measurements at equivalent scan rates. Tests were
performed in 0.2 M CuCl in 2 M HCl anolyte and DI H2O catholyte both under N2 atmosphere at 60 mL min-1
electrolyte flow rate.
To electrochemically characterize the CCEs produced a standard series of
electrochemical experiments were developed. The electrochemical test parameters were based
on the initial work in the half-cell. Impedance and capacitance measurements were taken in the
absence of CuCl to assess the conductivity of the MEA as well as the relative electrochemically
active surface area. Capacitive CV’s were also taken in the absence of CuCl to estimate the
overall surface area of the CCE as well as to ensure that electrode surface was clean. Potential
stair step measurements were taken to assess the onset potential as well as the onset of the
diffusion limited current response. Finally, both galvanostatic and potentiostatic measurements
were taken to examine the operational current responses of the MEA’s as well as there long
term stability and resistance to copper crossover. Standard materials were used for the proton
conducting membrane (Nafion 115) and the cathode electrode (0.3 mg cm-1 Pt/C). This was
done to isolate the electrochemical changes produced by the varied CCE anode electrodes.
Electrolyte flow rate was also varied at both the anode and cathode. At consistent
electrochemical parameters varied flow rates can be used to change the effective concentration

66
of CuCl at the anode electrode, from this we expect to see an increase in current response with
higher flow rates.
The method for physical characterization of the CCE materials was also drawn from the
half-cell electrode production. The bulk composition of the electrodes was determined through
TGA analysis. Excess powder was scraped off of the aluminum foil spray coat backing. This
controlled the TGA sample under the same drying conditions used for the CCE electrodes.
Additionally this allowed for the TGA sample to be subjected to the same spraying conditions
that could potentially contaminate the CCE sample. Finally, after production, the samples were
analyzed through SEM to examine bulk surface properties and to provide an insight into
potential coating defects.
4.1: Results
4.1.1: Results for 1N Materials
As with the half-cell electrode samples, initial tests were centered on varying the total
concentration of the 1N silane within the CCE. This was done to both verify the findings in the
half-cell measurements as well as to assess differences in how the full-cell electrodes handled
the presence of the electrically insulating sol gel network. Silane composition was targeted at
between 20 and 60 wt% silane. This allowed for the examination of lower loading silane
samples which were not produced for half-cell testing. The target silane loadings were also
chosen to correlate with work published previously in our lab24.
Table 4-1: 1N CCE materials for full-cell electrolysis compositional information.
Sample Code wt% Silane Mass Loading (mg cm-2) Carbon Loading
(mg cm-2) mMol Si gCarbon-1
B1P73S2 27.18 1.78 1.30 3.39
B1P69S1 32.42 2.66 1.80 4.36
B1P69S2 50.72 2.79 1.37 9.36
B1P69S3 53.45 3.65 1.70 10.44
B1P60S2 62.49 4.24 1.59 15.14
Many 1N CCE samples were produced and tested; from them the above five were selected to
examine the effects of the varied silane content on full-cell electrode properties and
performance. The samples were selected because they represented an approximately even
spacing of silane content from the lowest to highest amounts. Across the five samples the total

67
mass loading of the CCE increases with increased silane composition. This is to be expected as
the sol-gel binder is denser than the carbon support which it is binding to. The loading of
carbon on the electrode has a relative standard deviation of 13.68%. The relatively narrow
range of carbon loading ensures that changes in electrode performance can be attributed to the
change in silane composition and not to morphological CCE changes from increased carbon
loading. The effects of changing carbon loadings are examined in chapter 4.1.2: Results for
Varied CCE Loadings (1N). To compare the 1N CCEs to those prepared with other silanes a molar
loading of silicon normalized to the mass of carbon was also calculated.
4.1.1.1: Materials Characterization Results
All of the CCEs produced had very similar physical properties. As with the half-cell CCEs
the full-cell CCEs were characterized using both TGA analysis and SEM imaging. The samples all
showed consistent behavior analyzed through TGA. As with the half-cell CCE materials, the total
mass was normalized at 200 °C to account for water loss. After the initial drying the samples
were air stable up to approximately 600 °C at which point the carbon structures combusted
leaving only SiO2 at the final temperature of 1000 °C, an example of this degradation can be
seen in Figure 3-1. The uniform and simple degradation of the materials indicated that, like the
half-cell CCEs, the CCE materials have a standard morphology that is unaltered on a macro scale.
This is to be expected as the materials used for the production of the CCEs are largely uniform.
Accounting for volume, very little silane is actually present within the CCE with the bulk being
comprised of the very high surface area and low density carbon (Vulcan XC-72).
In addition to the TGA analysis performed on the samples SEM images were taken to
observe the bulk structural properties (Figure 4-3). All of the CCEs photographed showed a
homogeneous morphology. At lower magnifications, near the micrometer range, the samples
showed similar structural features; a rough surface featuring mud cracks and small defects. At
higher magnifications the differences between the samples become more apparent, where the
homogeneous distribution of the CCE appeared to decrease with increased silane content.

68
Sample and Silane wt% 100 x Magnification 2500 x Magnification
B1P73S2
27.2 wt%
B1P69S1
32.4 wt%
B1P69S2
50.7 wt%
B1P69S3
53.4 wt%
Figure 4-3: SEM images taken of CCE samples B1P73S2, B1P69S1, B1P69S2, and B1P69S3 at 100 and 2500 x
magnification.

69
4.1.1.2: Electrochemical Results for 1N materials
Similar electrochemical test conditions to those performed in the half-cell were applied
in the full-cell testing. Expanding upon the testing done in the half-cell, flow rate was also varied
to examine the effects of it on cell performance. During the operation, the evolution of H2 on Pt
at the cathode was used as a reference electrode for the full-cell. From this, all of the
electrochemical data was taken as V vs. RHE and was not adjusted for a reference potential.
Capacitive CVs and EIS were collected in the absence of CuCl to analyze the surface area
and ionic conductivity of the different anode materials. As stated in chapter 2.3 the anode was
supplied with 2 M HCl solution at 60 mL min-1 and the cathode was supplied with H2 gas at a rate
of 25 mL min-1.
The impedance plots of the five CCE materials showed an interesting trend in
conductivity. As the silane monomer is functionalized with amines, increased silane content
should show a higher ionic conductivity from the increased number of charged amine groups.
However, we see a reduction in the overall conductivity with increased silane loading. The two
CCEs with the lowest silane content showed effectively nonexistent Warburg regions indicating
a high conductivity. The two highest silane containing samples showed the largest Warburg
regions (both approximately 0.01 Ω) and, therefore, the lowest conductivity.
In addition to the ionic conductivity, the impedance measurements were also used to
examine the capacitance of the CCE samples. There was no apparent trend in the capacitance
plots. The two samples with the highest plateau were the 32.42 and 53.45 wt% samples. There
was very little difference in the plateaus of these two electrodes. This is consistent with the
very similar areas of their capacitive CVs for the same CCE materials (Figure 4-4 (A)). Differing
from the capacitive CV measurements, the 27.18 wt% sample shows a higher plateau compared
to the 50.72 wt% sample. The 62.5 wt% sample showed a low overall capacitance because of
the high mass of silane within the sample.

70
Figure 4-4: Capacitive CV of CCE materials with varied 1N silane loading. 10 mV s-1
scan rate from 0.2 to 1.0 V vs.
RHE. Current normalized for geometric SA and for mass of carbon. In 2 M HCl under N2 atmosphere at 60 mL min-1
anolyte flow rate. (A) Area specific (B) Carbon mass normalized.
There did not appear to be any dependence of the capacitive surface area on the silane loading.
When normalized for the mass of carbon present on the CCE the materials showed very similar
capacitances (Figure 4-4).
-8
-6
-4
-2
0
2
4
6
8
10
0 0.2 0.4 0.6 0.8 1 1.2
Cu
rre
nt
(mA
cm
-2)
Potential (V vs. RHE)
27.2 wt% Silane32.4 wt% Silane50.7 wt% Silane53.5 wt% Silane
-5-4-3-2-10123456
0 0.2 0.4 0.6 0.8 1 1.2
Cu
rre
nt
(mA
gC
arb
on
-1)
Potential (V vs. RHE)
27.2 wt% 1N Silane
32.4 wt% 1N Silane50.7 wt% 1N Silane
53.5 wt% 1N Silane
A
B
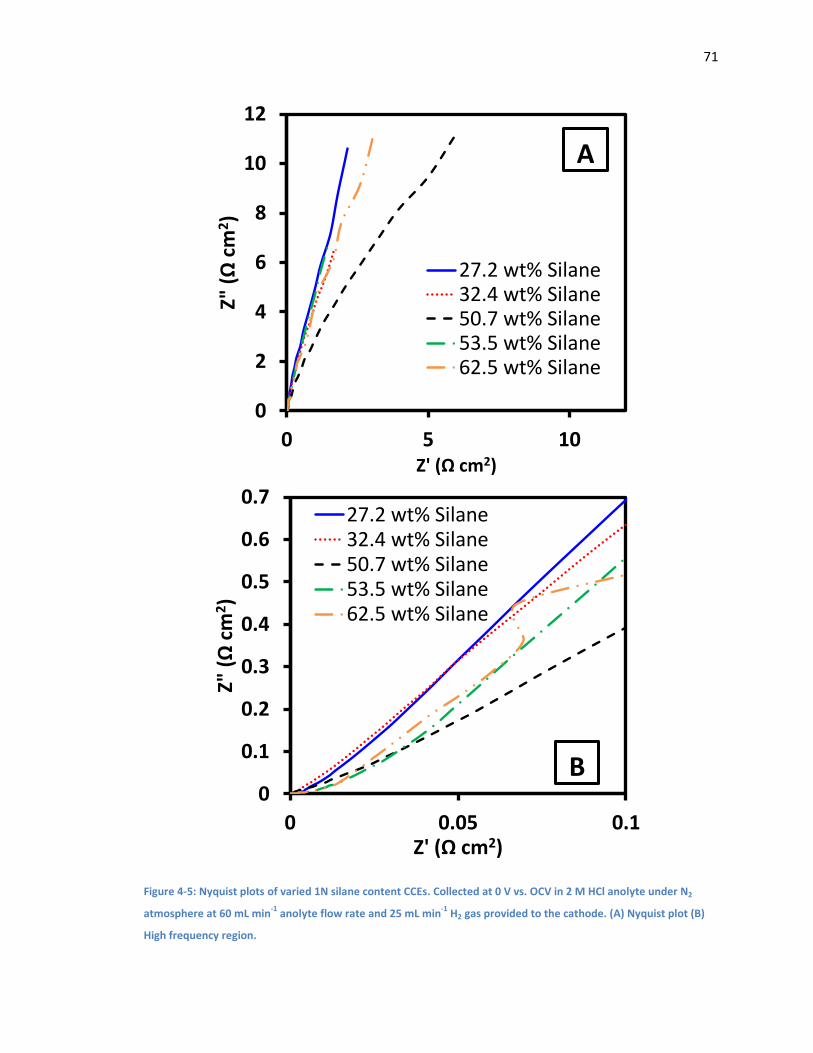
71
Figure 4-5: Nyquist plots of varied 1N silane content CCEs. Collected at 0 V vs. OCV in 2 M HCl anolyte under N2
atmosphere at 60 mL min-1
anolyte flow rate and 25 mL min-1
H2 gas provided to the cathode. (A) Nyquist plot (B)
High frequency region.
0
2
4
6
8
10
12
0 5 10
Z" (
Ωcm
2)
Z' (Ω cm2)
27.2 wt% Silane32.4 wt% Silane50.7 wt% Silane53.5 wt% Silane62.5 wt% Silane
0
0.1
0.2
0.3
0.4
0.5
0.6
0.7
0 0.05 0.1
Z" (
Ωcm
2)
Z' (Ω cm2)
27.2 wt% Silane32.4 wt% Silane50.7 wt% Silane53.5 wt% Silane62.5 wt% Silane
A
B

72
Figure 4-6: Capacitance plots of varied 1N silane content CCEs. Tests were performed at 0 V vs. OCV in 2 M HCl
anolyte under N2 atmosphere at 60 mL min-1
anolyte flow rate and 25 mL min-1
H2 gas provided to the cathode. (A)
Area specific capacitance (B) Mass of carbon normalized (C) Capacitance normalized to 1.
0
50
100
150
200
250
300
0 2 4 6 8
Cap
acit
ance
(m
F cm
-2)
Z' (Ω cm2)
27.2 wt% Silane32.4 wt% Silane50.7 wt% Silane53.5 wt% Silane62.5 wt% Silane
0
5
10
15
20
25
30
0 2 4 6 8
Cap
acit
ance
(m
F g C
arb
on
-2)
Z' (Ω cm2)
27.2 wt% Silane32.4 wt% Silane50.7 wt% Silane53.5 wt% Silane62.5 wt% Silane
0
0.2
0.4
0.6
0.8
1
1.2
0 2 4 6 8
No
rmal
ize
d C
apac
itan
ce
Z' (Ω cm2)
27.2 wt% Silane32.4 wt% Silane50.7 wt% Silane53.5 wt% Silane62.5 wt% Silane
A
B
C
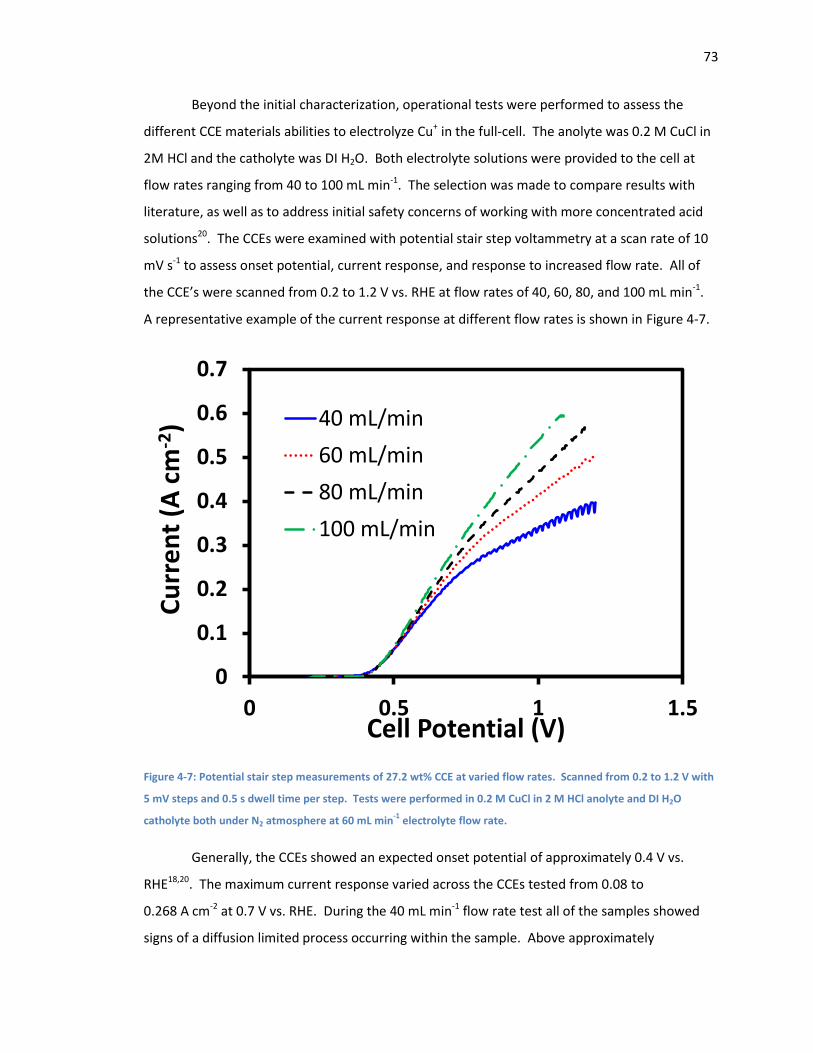
73
Beyond the initial characterization, operational tests were performed to assess the
different CCE materials abilities to electrolyze Cu+ in the full-cell. The anolyte was 0.2 M CuCl in
2M HCl and the catholyte was DI H2O. Both electrolyte solutions were provided to the cell at
flow rates ranging from 40 to 100 mL min-1. The selection was made to compare results with
literature, as well as to address initial safety concerns of working with more concentrated acid
solutions20. The CCEs were examined with potential stair step voltammetry at a scan rate of 10
mV s-1 to assess onset potential, current response, and response to increased flow rate. All of
the CCE’s were scanned from 0.2 to 1.2 V vs. RHE at flow rates of 40, 60, 80, and 100 mL min-1.
A representative example of the current response at different flow rates is shown in Figure 4-7.
Figure 4-7: Potential stair step measurements of 27.2 wt% CCE at varied flow rates. Scanned from 0.2 to 1.2 V with
5 mV steps and 0.5 s dwell time per step. Tests were performed in 0.2 M CuCl in 2 M HCl anolyte and DI H2O
catholyte both under N2 atmosphere at 60 mL min-1
electrolyte flow rate.
Generally, the CCEs showed an expected onset potential of approximately 0.4 V vs.
RHE18,20. The maximum current response varied across the CCEs tested from 0.08 to
0.268 A cm-2 at 0.7 V vs. RHE. During the 40 mL min-1 flow rate test all of the samples showed
signs of a diffusion limited process occurring within the sample. Above approximately
0
0.1
0.2
0.3
0.4
0.5
0.6
0.7
0 0.5 1 1.5
Cu
rre
nt
(A c
m-2
)
Cell Potential (V)
40 mL/min
60 mL/min
80 mL/min
100 mL/min

74
0.9 V vs. RHE the rate at which current increased with potential was reduced. This was
particularly noticeable in the highest wt% silane sample (62.5 wt% Silane) which showed the
lowest capacitive surface area. For the 62.5 wt% sample the reduction in current response was
also noticeable in the 60 mL min-1 run.
Figure 4-8: Potential stair step measurements of CCE’s with varied 1N silane composition. Scanned from 0.2-1.2 V
with 5 mV steps and 0.5 s dwell time per step. Experiment performed in in 0.2 M CuCl in 2M HCl anolyte and DI
H2O catholyte both under N2 atmosphere at 60 mL min-1
electrolyte flow rate. (A) Enlarged onset potential region
from 0.3 to 0.5 V vs. RHE.
When compared, the current responses of the different CCE’s at the same flow rate
show a slight trend towards better performance from the CCE’s with lower silane content. The
top performing CCE’s were the 32.42 and 27.18 wt% samples respectively. The low silane
loading CCE’s showed a slightly better onset potential than the higher silane content samples.
The lower onset potential can be partly attributed to the higher conductivity of the electrodes
leading to lower resistive losses within the cell. There was also a clear increase in performance
from the lower silane loading CCEs compared to the higher loading samples. Figure 4-8 shows
that the higher silane loading CCEs had a varied dependence of the current response on silane
content. Regarding the three highest silane content CCEs, at 1.2 V vs. RHE there was a trend of
A
A

75
lower current response with increased silane content. At 0.7 V the 62.48 wt% silane CCE out
performed both the 50.72 and 53.45 wt% silane samples, this can be attributed to the CCE’s
earlier onset potential. All three samples were still dramatically out performed by the 27.18 and
32.42 wt% silane samples. This trend is in agreement with work done previously showing the
lower loading CCE’s to be more active24.
The LSV data was further analyzed by plotting the current at 0.7 and 1.1 V vs. RHE with
respect to the flow rate of the electrolyte solutions (Figure 4-9). Using this, the cell’s response
to increased flow at the anode surface was evaluated. At 1.1 V vs. RHE all of the samples show a
linear response to increased flow rate. While the 32.4 wt% silane showed the best current of
the samples, the 27.2 wt% sample showed a steeper response to the increased flow rate.
Therefore, at even higher flow rates the 27.2 wt% sample may outperform the 32.4 wt% sample.
Similar behavior was observed for the 0.7 V vs. RHE comparison. This is particularly important
as the DOE target for operation is set at 0.7 V vs. RHE22. The 32.4 wt% sample also showed the
highest current response at 0.7 V vs. RHE; however, the 27.3 wt % sample showed comparable
currents with a steeper response to the increased flow rates. This shows more conclusively that,
while the 27.3 wt% sample showed a slightly lower current response, at higher flow rates or
concentrations the 27.3 wt% sample should perform the best of all the tested CCEs.
Additionally, the 62.5 wt% sample showed a plateau in the current response to higher flow rates
at 0.7 V vs. RHE. This plateau can indicate that its maximum accessible electrochemical surface
area has been reached.

76
Figure 4-9: Current Trends of CCEs with varied 1N silane content at 0.7 and 1.1 V and varied flow rates. The
experiments were performed in 0.2 M CuCl in 2 M HCl anolyte and DI H2O catholyte both under N2 atmosphere at
40, 60, 80, and 100 mL min-1
electrolyte flow rate. Scanned from 0.2 to 1.2 V vs. RHE with 5 mV steps and 0.5 s
dwell time per step. (A) Current density at 0.7 V vs. RHE (B) Current density at 1.1 V vs. RHE.
Finally, potentiostatic measurements were used to compare the CCE materials. In these
measurements the cell was polarized to a constant 0.7 V vs. RHE for extended periods of time.
The tests were performed to simulate the operation of the electrolysis cell integrated into the
0
0.1
0.2
0.3
0.4
0.5
0.6
0.7
20 40 60 80 100 120
Cu
rre
nt
De
nsi
ty (
A c
m-2
)
Flow Rate (mL min-1)
27.3 wt% Silane32.4 wt% Silane50.7 wt% Silane53.5 wt% Silane62.5 wt% Silane
0
0.1
0.2
0.3
0.4
0.5
0.6
0.7
20 40 60 80 100 120
Cu
rre
nt
De
nsi
ty (
A c
m-2
)
Flow Rate (mL min-1)
27.2 wt% Silane 32.4 wt% Silane
50.7 wt% Silane 53.5 wt% Silane
63.48 wt% Silane
A
B

77
full thermochemical cycle at the standard DOE target potential of 0.7 V vs. RHE4. Generally,
there was a constant current response to the potentiostatic holds for extended periods of time.
The measurements were also taken at varied flow rates to test the effects of increased flow on
the anode’s ability to oxidize CuCl. In the absence of external factors such as analyte spoilage or
copper crossover, the increased flow rates showed a linear increase in current response.
Figure 4-10: Potentiostatic Holds of the 27.18 wt% CCE at 0.7 V. The experiments were performed in 0.2 M CuCl in
2 M HCl anolyte and DI H2O catholyte both under N2 atmosphere at 40, 60, 80, and 100 mL min-1
electrolyte flow
rate.
Figure 4-10 shows us a normal operation of the full-cell under standard potentiostatic
conditions. The four samples with the lowest wt% silane showed relatively stable behavior
under the potentiostatic tests. The 62.5 wt% sample showed an inconsistent and low current
response when tested. This behavior was consistent with the CuCl analyte spoiling; converting
to CuCl2, reducing the effective concentration of CuCl, and as such was removed from the
analysis. At 150 s into the run, the current was recorded as a representative value for the
potentiostatic test. These representative points were then plotted with respect to the anolyte
flow rate. As seen in Figure 4-2 the trend in current with respect to flow rate also closely
resembles that which was observed at 0.7 V vs. RHE during the potential stair step
measurements (Figure 4-11). Comparing the current at 0.7 V vs. RHE with respect to analyte
0.00
0.05
0.10
0.15
0.20
0.25
0.30
0 200 400 600
Cu
rre
nt
De
nsi
ty (
A c
m-2
)
Time (s)
40 mL/min
60 mL/min
80 mL/min
100 mL/min
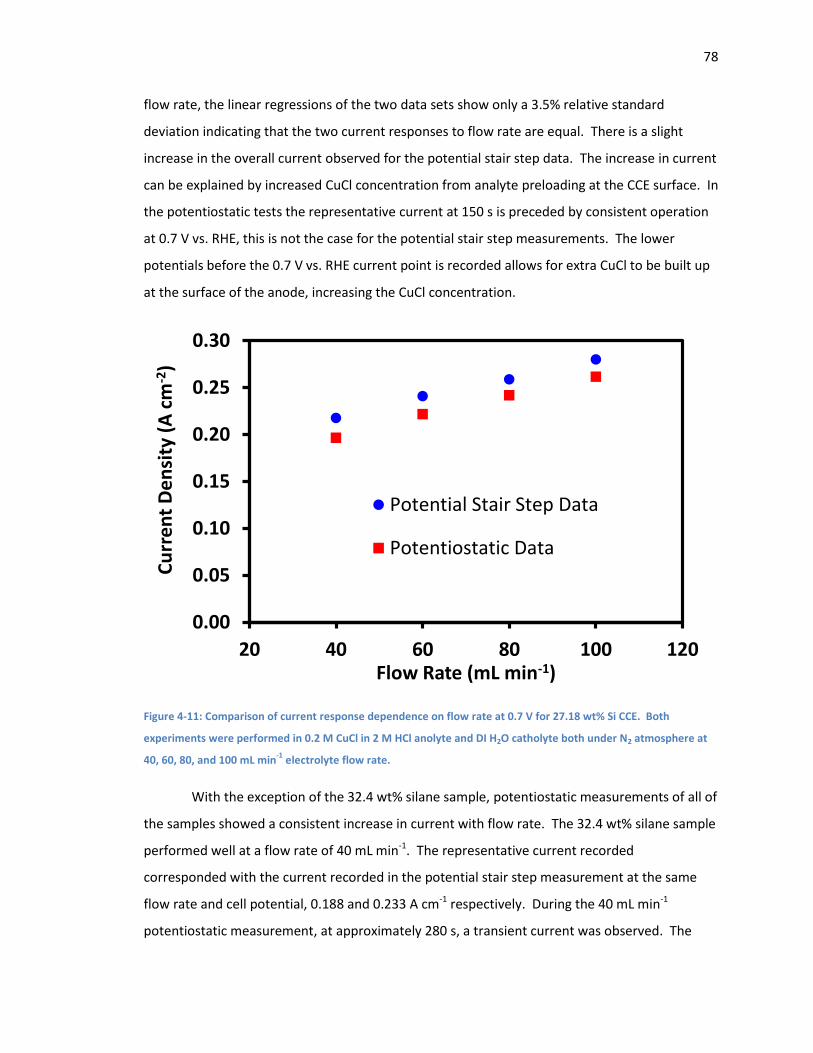
78
flow rate, the linear regressions of the two data sets show only a 3.5% relative standard
deviation indicating that the two current responses to flow rate are equal. There is a slight
increase in the overall current observed for the potential stair step data. The increase in current
can be explained by increased CuCl concentration from analyte preloading at the CCE surface. In
the potentiostatic tests the representative current at 150 s is preceded by consistent operation
at 0.7 V vs. RHE, this is not the case for the potential stair step measurements. The lower
potentials before the 0.7 V vs. RHE current point is recorded allows for extra CuCl to be built up
at the surface of the anode, increasing the CuCl concentration.
Figure 4-11: Comparison of current response dependence on flow rate at 0.7 V for 27.18 wt% Si CCE. Both
experiments were performed in 0.2 M CuCl in 2 M HCl anolyte and DI H2O catholyte both under N2 atmosphere at
40, 60, 80, and 100 mL min-1
electrolyte flow rate.
With the exception of the 32.4 wt% silane sample, potentiostatic measurements of all of
the samples showed a consistent increase in current with flow rate. The 32.4 wt% silane sample
performed well at a flow rate of 40 mL min-1. The representative current recorded
corresponded with the current recorded in the potential stair step measurement at the same
flow rate and cell potential, 0.188 and 0.233 A cm-1 respectively. During the 40 mL min-1
potentiostatic measurement, at approximately 280 s, a transient current was observed. The
0.00
0.05
0.10
0.15
0.20
0.25
0.30
20 40 60 80 100 120
Cu
rre
nt
De
nsi
ty (
A c
m-2
)
Flow Rate (mL min-1)
Potential Stair Step Data
Potentiostatic Data

79
transient current was also observed for the entirety of the subsequent 60 mL min-1
measurement (Figure 4-12).
Figure 4-12: Potentiostatic holds at 0.7 V for the 32.4 wt% Si CCE. Experiments performed in 0.2 M CuCl in 2 M HCl
anolyte and DI H2O catholyte both under N2 atmosphere at 40 and 60 mL min-1
electrolyte flow rate. Copper
crossover visible after approximately 400 s.
This current was ascribed to cationic copper crossing the cell membrane and plating as Cu0 on
the cathode surface (detailed in 5.1). To remove this, an electrode cleaning was performed
(detailed in 5.4). This regeneration lowered the cell’s current response giving the 32.4 wt%
silane an apparent non-linear response to flow rate. The remaining samples did not exhibit
transient current and showed reasonable current responses to changes in flow rate. Normalized
for total mass of carbon the 27.3 and 32.4 wt% samples still showed the best current response
of the four samples tested (32.4 wt% at 40 mL mL-1 only) (Figure 4-13). The 50.7 wt% sample
showed a notable increase in its current response with respect to changing flow rate.
0.00
0.10
0.20
0.30
0.40
0.50
0.60
0.70
0 500 1000
Cu
rre
nt
De
nsi
ty (
A c
m-2
)
Time (s)
40 mL/min Hold
60 mL/min Hold
Transient Current Area

80
Figure 4-13: Potentiostatic hold current trends of CCEs with varied 1N silane content at 0.7 V and varied flow rates.
The experiments were performed in 0.2 M CuCl in 2 M HCl anolyte and DI H2O catholyte both under N2 atmosphere
at 40, 60, 80, and 100 mL min-1
electrolyte flow rate. Potential held at 0.7 V vs. RHE, current value taken at 150 s.
(A) Area specific (B) Carbon mass normalized.
Using the 40 mL min-1 flow rate data the representative current at 0.7 V vs. RHE was
related to the amount of silane present in the CCE sample (Figure 4-14). The normalized current
showed a slight linear relationship (r2 = 0.8178) between increased silane content and decreased
current response. This relationship was expected, carrying forward from our previous half-cell
work as well as the work done previously in our group24.
0.00
0.05
0.10
0.15
0.20
0.25
0.30
20 40 60 80 100 120
Cu
rre
nt
De
nsi
ty (
A c
m-2
)
Flow Rate (mL min-1)
27.3 wt% Silane 32.4 wt% Silane
50.7 wt% Silane 53.5 wt% Silane
0
0.05
0.1
0.15
0.2
0.25
0.3
20 40 60 80 100 120
No
rmal
ize
d C
urr
en
t (
A g
Car
bo
n-1
)
Flow Rate (mL min-1)
27.3 wt% Silane 32.4 wt% Silane
50.7 wt% Silane 53.5 wt% Silane
A
B

81
Figure 4-14: Relationship of 1N silane composition to current response in potentiostatic holds taken at 0.7 V.
Experiment was performed in 0.2 M CuCl in 2 M HCl anolyte and DI H2O catholyte both under N2 atmosphere at 40
mL min-1
electrolyte flow rate.
4.1.2: Results for Varied CCE Loadings (1N)
Beyond varied silane content the effects of total CCE loading were also examined. When
normalized for carbon mass the CCEs showed a relationship between silane content and
operational current (Figure 4-14). Within this relationship there was significant variance. This
variance can potentially be attributed to the different CCE materials varied total mass loading.
While the current responses for each of the materials were normalized for mass of carbon
present, this does not account for varied utilization of the carbon surface. With increased CCE
loading it is possible that areas of the active carbon were not well utilized, lowering the effective
electrode surface area per gram of carbon. This is an important factor in the CCE development
as high utilization of the materials used is both economical and electrochemically desirable. To
examine the effects of increased mass loading, five samples were produced and tested with
similar silane compositions and varied total mass loadings. The samples were prepared at
30±3 wt% silane. This target silane content of 30 wt% silane was chosen because
y = -0.0029x + 0.2171R² = 0.8178
0.00
0.02
0.04
0.06
0.08
0.10
0.12
0.14
0.16
20 40 60
No
rmal
ize
d C
urr
en
t (
A g
Car
bo
n-1
)
Silane Composition (wt%)
Current at 0.7 V vs.SHE and 40 mL/min

82
experimentation (Figure 4-13 and Figure 4-14) showed that samples with approximately 30 wt%
silane had the best electrochemical performance.
Table 4-2: 1N CCE materials with varied total mass loadings for full-cell electrolysis: compositional information.
Name wt% Sample Mass Loading gCarbon mass loading mMol Si gCarbon-1
B1P73S1 28.83 1.11 0.8103 3.288
B1P73S2 27.18 1.78 1.2962 3.393
B1P69S1 32.42 2.66 1.7976 4.362
B1P77S3 31.11 5.24 3.6098 4.106
The samples were produced using the standard method detailed in 2.1.3. Data collected
for the 27.18 wt% silane sample was reused from the varied silane content testing. The total
mass loading was varied between 1.11 and 5.24 g cm-1 with the bulk of the samples mainly
produced between 1.11 and 2.61 g cm-1. The range of CCE, loadings is dramatically increased
from what was tested in 4.1: Results. To account for the silanes altering the CCE’s density the
mass of carbon was calculated, providing a more standardized idea of the change in CCE loading.
The samples compared were not all produced with the intent of varying the mass loading on the
CCE but rather the various samples were selected from a stock of samples produced throughout
the investigation of the full-cell electrochemical behavior. Two of the samples listed above
(B1P73S2 and B1P69S1) were tested previously comparing various silane loadings in chapter
4.1: Results. The two samples were shown to be the best performing of the four materials
tested.
4.1.2.1: Physical Electrode Characterization Results
While the electrodes were created with higher ceramic loadings they all behaved
similarly under TGA analysis. The samples all underwent the same degradation pattern seen in
the samples produced for chapters “3.1: Materials Characterization Result” and “4.1: Results”.
The samples were all produced with the same ratio of carbon to APTMS with the intent of
producing samples of identical composition. The differences in silane loadings (Table 4-2) can
be attributed to variance during the gelation and spray coating. To produce samples with a
higher total mass loading, larger amounts of carbon and APTMS were gelled and then sprayed
onto standard 100 cm2 sized targets. To produce the samples with lower mass loadings, a
standard 400 mg of carbon was gelled and sprayed onto targets of larger sizes.

83
4.1.2.2: Electrochemical Results for Varied CCE Loadings
Following the procedure developed by the previous half and full-cell testing, the
samples were analyzed with; capacitive CV, EIS, LSV, and potentiostatic measurements. In all
cases the samples were assessed on the bulk scale and after mass normalization to observe the
effects of higher CCE content on the overall electrode performance as well as utilization of the
specific carbon surface area.
During capacitive CV measurements, the samples showed an expected increase in
surface area with the increased CCE loading (Figure 4-15). The three samples with the lowest
CCE loading all showed a normal behavior in their charging and discharging. The fourth sample
with the highest CCE loading showed a much more gradual discharging during the cathodic
sweep of the CV. Additionally we observed a large peak at approximately 0.4 V vs. RHE on the
cathodic sweep. This was attributed surface oxide reduction from an incomplete degassing of
the catholyte prior to operation.
Once the samples were normalized for the mass of CCE used the capacitive surface area
became much more consistent. There was an apparent decrease in the mass normalized
surface area with increased CCE loading.
EIS was performed on the four samples (Figure 4-16). In the high frequency region of
the spectra, the three samples with the lowest loadings show a distinct similarity with nearly
parallel lines and effectively no Warburg region. This is expected as they have nearly the same
silane content and their total loadings fall within a 1 mg cm-2 range (0.8-1.8 mg cm-2). The
3.6 mg cm-2 sample showed a Warburg region of 0.02 Ω and a flatter slope overall. This
indicated decreased ionic and electronic conductivity.
The capacitance measurements showed a similar trend to what was seen in the
capacitive CV measurements (Figure 4-17). As the mass of carbon on the electrode was
increased, the maximum capacitance also increased. After normalizing for the mass of carbon
present we again see a similar trend in capacitance values when compared with the mass
normalized capacitive CV measurements. The three lower loading silanes (0.8 – 1.8 mg cm-2)
showed similar maximum capacitance values while the higher loading CCE showed a lower
maximum capacitance value. The 0.8 mg cm-2 sample showed the highest mass normalized
capacitance indicating the best utilization of the carbon surface. The better utilization of the

84
carbon surface is expected as the sample has the least silane present to block the carbon’s
micro-porous structure. The 1.8 mg cm-2 sample showed the steepest initial slope indicating
that it had a higher ionic conductivity, charging its surface the fastest. This significantly higher
ionic conductivity was made with a small loss in the overall utilization of the carbon surface
indicating that the 1.8 mg cm-2 CCE should perform better than the 0.8 mg cm-2 sample.
Figure 4-15: Capacitive CV of CCE materials with 30±3% 1N silane loading and varied total CCE mass loadings.
10 mV s-1
scan rate from 0.2 to 1.0 V vs. RHE. Current normalized for geometric SA and for mass of carbon. In 2 M
HCl under N2 atmosphere at 60 mL min-1
anolyte flow rate. (A) Area specific (B) Carbon mass normalized.
-15.00
-10.00
-5.00
0.00
5.00
10.00
15.00
0 0.2 0.4 0.6 0.8 1 1.2
Cu
rre
nt
(mA
cm
-2)
Potential (V vs. RHE)
0.8 mgC cm⁻²1.3 mgC cm⁻²1.8 mgC cm⁻²3.6 mgC cm⁻²
-6.00
-4.00
-2.00
0.00
2.00
4.00
6.00
0 0.2 0.4 0.6 0.8 1 1.2
No
rmal
ize
d C
urr
en
t (m
A g
Car
bo
n-1
)
Potential (V vs. RHE)
0.8 mgC cm⁻²1.3 mgC cm⁻²1.8 mgC cm⁻²3.6 mgC cm⁻²
A
B

85
Figure 4-16: Nyquist plots of CCE’s with 30±3% 1N silane content and varied total mass loadings. Experiments were
performed in 2 M HCl anolyte under N2 atmosphere at 60 mL min-1
anolyte flow rate and 25 mL min-1
H2 gas
provided to the cathode. (A) Nyquist plot (B) High frequency region.
0.00
0.02
0.04
0.06
0.08
0.10
0.00 0.02 0.04 0.06 0.08 0.10
Z" (
Ωcm
2)
Z' (Ω cm2)
0.8 mgC cm⁻²
1.3 mgC cm⁻²
1.8 mgC cm⁻²
3.6 mgC cm⁻²
0
2
4
6
8
10
12
14
0 2 4 6 8 10 12 14
Z" (
Ωcm
2)
Z' (Ω cm2)
0.8 mgC cm⁻²
1.3 mgC cm⁻²
1.8 mgC cm⁻²
3.6 mgC cm⁻²
A
B

86
Figure 4-17: Capacitance plots of 30±3% 1N silane content CCEs with varied total mass loadings. Experiment was
performed in 2 M HCl anolyte under N2 atmosphere at 60 mL min-1
anolyte flow rate and 25 mL min-1
H2 gas
provided to the cathode. (A) Area specific capacitance (B) Mass of carbon normalized.
0
10
20
30
40
50
60
70
0 1 2 3 4
Cap
acit
ance
(m
F cm
-2)
Z' (Ω cm2)
0.8 mgC cm⁻²1.3 mgC cm⁻²1.8 mgC cm⁻²3.6 mgC cm⁻²
0
5
10
15
20
25
30
35
0 1 2 3 4
Mas
s N
orm
aliz
ed
Cap
acit
ance
(m
F g-1
)
Z' (Ω cm2)
0.8 mgC cm⁻²1.3 mgC cm⁻²1.8 mgC cm⁻²3.6 mgC cm⁻²
A
B
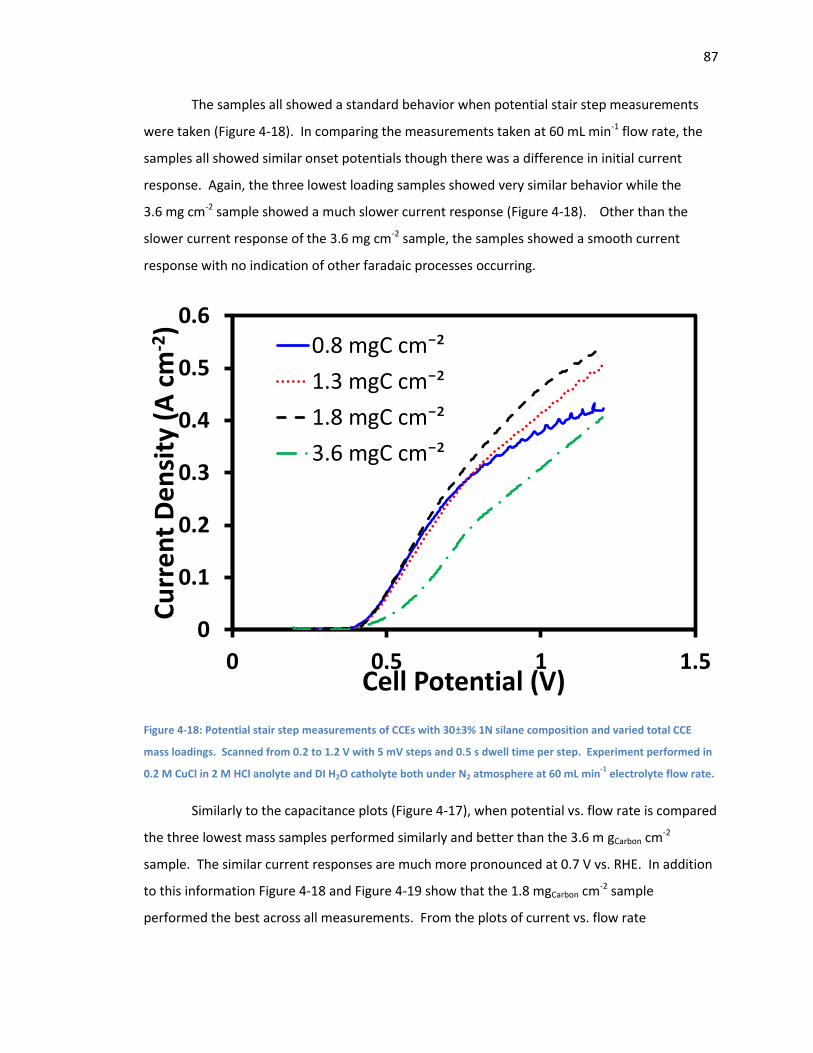
87
The samples all showed a standard behavior when potential stair step measurements
were taken (Figure 4-18). In comparing the measurements taken at 60 mL min-1 flow rate, the
samples all showed similar onset potentials though there was a difference in initial current
response. Again, the three lowest loading samples showed very similar behavior while the
3.6 mg cm-2 sample showed a much slower current response (Figure 4-18). Other than the
slower current response of the 3.6 mg cm-2 sample, the samples showed a smooth current
response with no indication of other faradaic processes occurring.
Figure 4-18: Potential stair step measurements of CCEs with 30±3% 1N silane composition and varied total CCE
mass loadings. Scanned from 0.2 to 1.2 V with 5 mV steps and 0.5 s dwell time per step. Experiment performed in
0.2 M CuCl in 2 M HCl anolyte and DI H2O catholyte both under N2 atmosphere at 60 mL min-1
electrolyte flow rate.
Similarly to the capacitance plots (Figure 4-17), when potential vs. flow rate is compared
the three lowest mass samples performed similarly and better than the 3.6 m gCarbon cm-2
sample. The similar current responses are much more pronounced at 0.7 V vs. RHE. In addition
to this information Figure 4-18 and Figure 4-19 show that the 1.8 mgCarbon cm-2 sample
performed the best across all measurements. From the plots of current vs. flow rate
0
0.1
0.2
0.3
0.4
0.5
0.6
0 0.5 1 1.5
Cu
rre
nt
De
nsi
ty (
A c
m-2
)
Cell Potential (V)
0.8 mgC cm⁻²
1.3 mgC cm⁻²
1.8 mgC cm⁻²
3.6 mgC cm⁻²

88
(Figure 4-19) it is apparent that all of the samples show a linear increase in current response
with flow rate.
During the potentiostatic measurements both the 0.8 and 1.8 mgCarbon cm-2 samples
showed evidence of copper crossover. The samples were treated in situ to remove the plated
copper and the runs were continued. After the plated copper was removed there was a
characteristic decrease in performance. Additionally, for the 0.8 mgCarbon cm-2 sample there was
a hardware error that prevented the acquisition of data for flow rates above 60 mL min-1 so the
points were not included in the analysis. The current recorded at 150 s into the potentiostatic
hold measurements was taken to be representative of the entire measurement. At this time in
the potentiostatic holds there was no indication of copper crossover occurring so the values can
be considered representative of only the oxidation of CuCl and the production of H2 gas. Both
the 1.3 and 3.6 mgCarbon cm-2 samples showed a linear increase in current with the increased flow
rate (Figure 4-20). This increase is consistent with the data taken from the potential stair step
measurements. As with the potential stair step measurements the three lower loading samples
(0.8-1.8 mgCarbon cm-2) outperformed the higher 3.6 mg cm-2 sample by a considerable margin
during the 40 mL min-1 flow rate measurement. Beyond the 40 mL min-1 measurement, the 0.8
and 1.8 mg cm-2 samples showed a decrease in current due to copper crossover. The 1.3 mg cm-
2 sample also showed a steeper increase with increased flow rate when compared with the
3.6 mgCarbon cm-2 sample. While there is a larger surface area associated with the
3.6 mgCarbon cm-2 sample it has been shown through the EIS measurements that there is a much
lower conductivity in the sample and a lower utilization of the carbon surface area. These two
short comings are likely what contributed to the lower overall current response from the
sample.

89
Figure 4-19: Current Trends of CCEs with 30±3% 1N silane composition and varied total CCE mass loading at 0.7 and
1.1 V and varied flow rates. Tests performed in 0.2 M CuCl in 2 M HCl anolyte and DI H2O catholyte both under N2
atmosphere at 40, 60, 80, and 100 mL min-1
electrolyte flow rate. Scanned from 0.2-1.2 V vs. RHE with 5 mV steps
and 0.5s dwell time per step. (A) Current density at 0.7 V vs. RHE (B) Current density at 1.1 V vs. RHE.
0
0.05
0.1
0.15
0.2
0.25
0.3
0.35
0.4
20 40 60 80 100 120
Cu
rre
nt
De
nsi
ty (
A c
m-2
)
Flow Rate (mL min-1)
0.8 mgC cm⁻²1.3 mgC cm⁻²1.8 mgC cm⁻²3.6 mgC cm⁻²
0
0.1
0.2
0.3
0.4
0.5
0.6
20 40 60 80 100 120
Cu
rre
nt
De
nsi
ty (
A c
m-2
)
Flow Rate (mL min-1)
0.8 mgC cm⁻²1.3 mgC cm⁻²1.8 mgC cm⁻²3.6 mgC cm⁻²
A
B

90
Figure 4-20: Potentiostatic hold current trends of CCEs with 30±3% 1N silane composition and varied total CCE mass
loadings at 0.7 V vs. RHE and varied flow rates. Tests performed in 0.2 M CuCl in 2 M HCl anolyte and DI H2O
catholyte both under N2 atmosphere at 40, 60, 80, and 100 mL min-1
electrolyte flow rate. Potential held at 0.7 V,
current value taken at 150 s.
The current response at an electrolyte flow of 40 mL min-1 was used to compare the
various samples. This measurement was chosen as there was no indication of copper crossover
occurring while or before the measurement was taken. Figure 4-21 compares the current
during the 40 mL min-1 potentiostatic holds to the total mg cm-2 loading of ceramic carbon. The
three samples with the lowest loading (0.8-1.8 mgCarbon cm-2) show little deviation in current
response from one another with them all out performing the 3.6 mgCarbon cm-2 sample (Figure
4-21).
0
0.05
0.1
0.15
0.2
0.25
0.3
20 40 60 80 100 120
Cu
rre
nt
De
nsi
ty (
A c
m-2
)
Flow Rate (mL min-1)
0.8 mgC cm⁻² 1.3 mgC cm⁻²
1.8 mgC cm⁻² 3.6 mgC cm⁻²
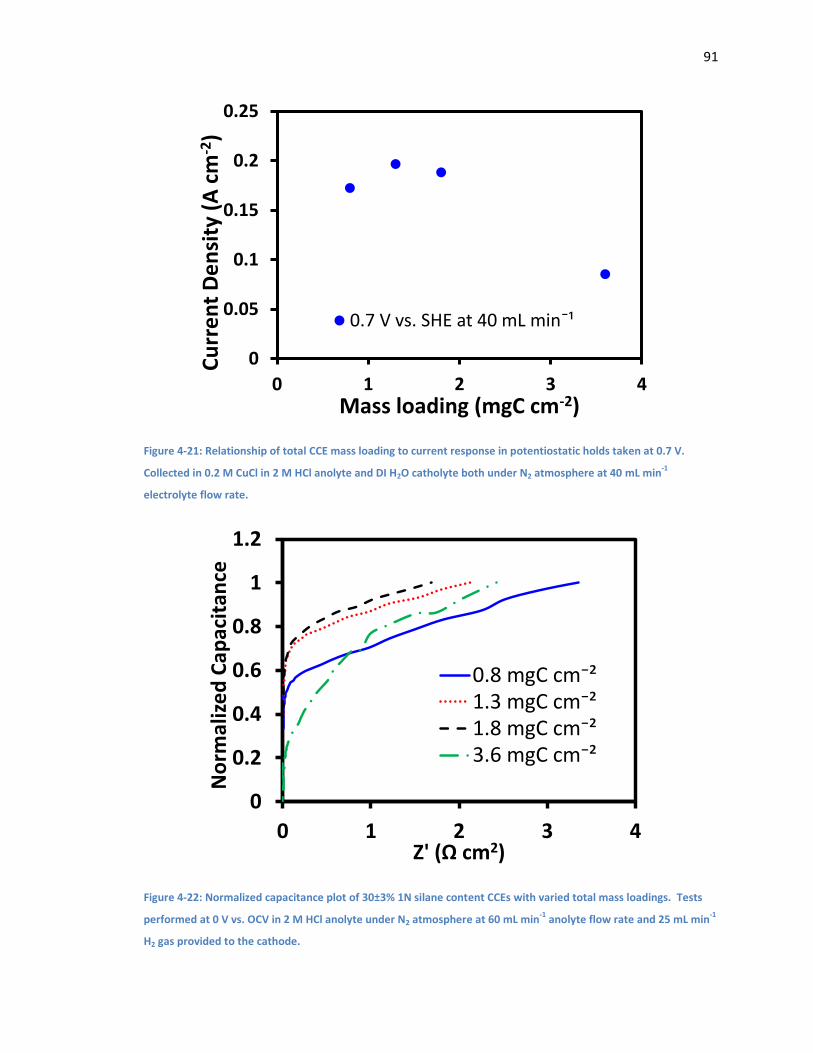
91
Figure 4-21: Relationship of total CCE mass loading to current response in potentiostatic holds taken at 0.7 V.
Collected in 0.2 M CuCl in 2 M HCl anolyte and DI H2O catholyte both under N2 atmosphere at 40 mL min-1
electrolyte flow rate.
Figure 4-22: Normalized capacitance plot of 30±3% 1N silane content CCEs with varied total mass loadings. Tests
performed at 0 V vs. OCV in 2 M HCl anolyte under N2 atmosphere at 60 mL min-1
anolyte flow rate and 25 mL min-1
H2 gas provided to the cathode.
0
0.05
0.1
0.15
0.2
0.25
0 1 2 3 4
Cu
rre
nt
De
nsi
ty (
A c
m-2
)
Mass loading (mgC cm-2)
0.7 V vs. SHE at 40 mL minˉ¹
0
0.2
0.4
0.6
0.8
1
1.2
0 1 2 3 4
No
rmal
ize
d C
apac
itan
ce
Z' (Ω cm2)
0.8 mgC cm⁻²1.3 mgC cm⁻²1.8 mgC cm⁻²3.6 mgC cm⁻²

92
4.1.3: Results for Varied Silanes
Concluding the analysis of the effects of amine functionalized ceramic carbon electrodes
the effects of varying the silane type at similar molar silane loadings were examined. By using
silane monomers containing additional amine functionalities the resistivity associated with the
increased silane content can be standardized while still varying the amine functional group
amounts. This was intended to show the increased conductivity only from the increased amine
functional groups. The same 1N, 2N, and 3N silanes (Figure 1-10) as used in the initial half-cell
measurements in chapter 3 were used here. This allows us to also compare our trends in half
cell testing with those in the full-cell environment. The 1N silane information discussed in
section 4.1 will be compared with 2N and 3N data discussed in this section to provide a
comparison of the effects of varied silanes on CuCl electrolysis.
4.1.3.1: Physical Electrode Characterization Results
Both the 2N and 3N materials were prepared with the intent to create CCE materials
with similar molar loadings of silane and mass loadings of carbon as were recorded for 1N CCEs
in 4.1: Results three samples were produced for both the 2N and 3N CCE materials. The sol-gels
were prepared in the standard method outlined in section 2.1.1 and spray coated as outlined in
2.1.3. The gels were later characterized by TGA to determine their bulk silane content.
Table 4-3: 2N and 3N CCE materials for full-cell electrolysis: compositional Information.
Name Silane wt% Sample Mass Loading gCarbon mass loading mmol Si gCarbon-1
B1P81S1 2N 42.49 2.59 1.49 4.81
B1P81S2 2N 46.63 2.09 1.11 5.70
B1P83S1 2N 67.84 4.21 1.35 13.76
B1P85S2 3N 57.40 2.26 0.96 6.86
B1P85S1 3N 66.27 1.85 0.62 10.01
B1P85S3 3N 69.86 1.84 0.56 11.80
Under flowing air in the TGA the 2N and 3N CCE samples showed a similar decomposition
pattern to the 1N CCE materials tested previously. The samples were determined to have silane
loadings between 4.81 and 13.76 mmol gCarbon-1. This molar loading is in good agreement with
the 1N samples produced which had a silane loading range of 3.28 to 15.14 mmol gCarbon-1. In
keeping a similar range of silane loadings the electrical resistance from the Si-O-Si backbone can
be kept approximately constant. The constant electrical resistance and silane loading allows for
the analysis of the silane functionalities independent of other variables. The mass of carbon in

93
the CCE material was also kept in a standard range to avoid changes in the electrochemical
activity as detailed in 4.2.
The 2N materials showed a similar change in morphology as the 1N materials as the
molar loading of the silane was increased. With the increased silane content there appears to
be a decrease in the overall homogeneity of the 2N samples at the 2500x magnification (Figure
4-24). The overall coating was quite similar at the 100x magnifications, both within the 2N
samples and when compared to the 1N samples. The 3N materials began to deviate from the
previously seen patterns with increased silane content (Figure 4-25). At 2500x magnification
there is less of an apparent decrease in surface homogeneity with increased silane content. In
regards to this, the 3N silanes all have molar loadings above the median values for the 1N and
2N samples, and are spread over a narrower range of silane loadings. This increased silane
content and decreased range would make it difficult to discern changes in the surface
morphology. At the 100x magnification, small amounts of the CFP backing are visible and the
CCE material can be seen coating individual fibers. Similar to the 1N and 2N materials, the 3N
materials still show the similar coating patterns at 100x magnification. This indicates that
although there is a lighter coating on the CFP backing there is still the same relatively even
distribution of the ceramic carbon material for all of the 1N ,2N, and 3N CCE samples. In
addition to the SEM images taken of all 1N, 2N, and 3N electrodes TEM images were taken of
the 1N and 2N materials to confirm their homogeneity of their structures on a nanometer scale
(Figure 4-23). The materials imaged were largely indistinguishable from each other showing
that the different silane precursors did not alter the CCEs structures on a nanometer scale.
Figure 4-23: TEM Images of B1P69S1 1N material (A) and B1P83S1 2N material (B) at 92000 and 180000x
magnification respectively.
A B

94
Sample 100x Magnification 2500x Magnification
B1P81S1
B1P81S2
B1P83S1
Figure 4-24: SEM images taken of CCE samples B1P81S1, B1P81S2, and B1P83S1 at 100 and 2500 x magnification

95
Sample 100x Magnification 2500x Magnification
B1P85S2
B1P85S1
B1P85S3
Figure 4-25: SEM images taken of CCE samples B1P85S2, B1P85S1, and B1P85S3 at 100 and 2500 x magnification.
4.1.3.2: Electrochemical Results for 2N Materials
The 2N materials were examined separately from the 3N materials to investigate the
effects of the different silanes. In the 2N silane we see a longer amine functionalization on the
silane backbone. This longer pendant arm can potentially affect the electrochemically active

96
surface area of the carbon electrode. The CCE materials were produced to have a range of
silane concentrations similar to those produced with the 1N silane. The 1N materials had a
range of 3.4 to 15.1 mmol Silane gCarbon-1. The 2N CCE materials were produced with a silane
concentration range of 4.8 to 13.8 mmol Silane gCarbon-1.
Cyclic voltammetry was performed in the absence of CuCl to assess the capacitive
surface area of the three CCE materials (Figure 4-26). There was little difference in the surface
area of the 42 and 47 wt% silane CCEs. This was expected as there was little difference between
their carbon and silane loadings. The 68 wt% silane sample had a much larger absolute
capacitive surface area (Figure 4-26 (A)). This was also expected as the carbon loading was
much larger than what was present in the 42 and 47 wt% silane samples. Normalizing for the
carbon loading on each of the CCEs the utilization of the carbon was examined (Figure 4-26 (B)).
A trend in the surface areas of the CCEs appeared, with increased silane content the utilization
of the carbon surface area appears to increase dramatically. This indicates that the available
carbon surface is being better utilized at higher silane contents. This dramatic of correlation
was not seen in the 1N samples tested in chapter 4.1 (Figure 4-4).
EIS was also used to examine the conductivity of the CCE materials. In this case we can
expect to see generally higher conductivities from the samples given the presence of additional
charged amine functionalities (Figure 4-27). The Nyquist plot of the 47 and 68 wt% silane
samples shows that the 68 wt% sample has a shorter Warburg region. The shorter Warburg
region of the Nyquist plot indicated that the sample has a higher overall conductivity.
Capacitance plots were also generated to re-examine the capacitive surface area as well
as the conductivity of the samples (Figure 4-28). We see similar indications of the carbon
surface area when compared to the capacitive CV measurements taken (Figure 4-26). In the raw
capacitance plot the 68 wt% silane has a much higher plateau level indicating a higher overall
surface area (Figure 4-28 (A)). When normalized for the mass of carbon present in the sample
we see a smaller overall increase, but the 68 wt% 2N sample still shows a higher normalized
capacitive surface area (Figure 4-28 (B)). The steepness of the initial charging area of the
capacitance plot also shows that the 68 wt% 2N sample has a higher overall conductivity than
the 47 wt% 2N sample. Conductivity can be shown as a steeper slope in initial charging area of
capacitance plots. Normalizing the maximum capacitance values to 1 allows for a clearer picture
of the initial slope of the capacitance plots and thus the conductivity (Figure 4-28 (C)). While the
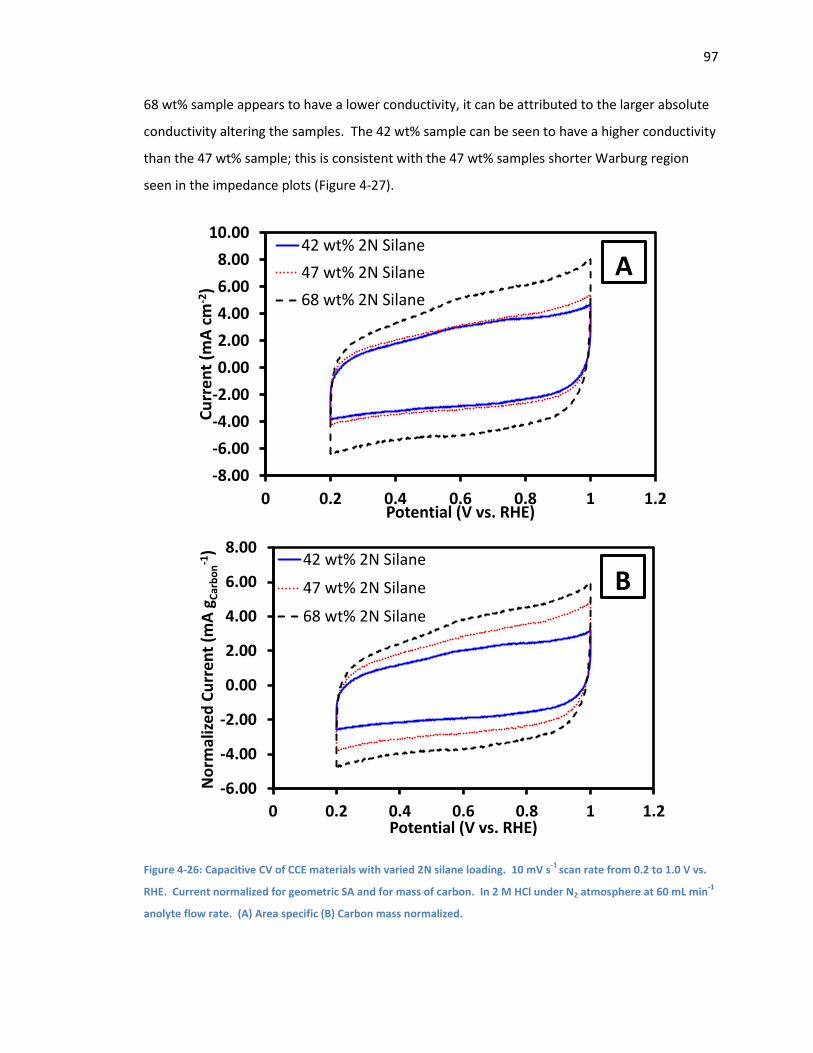
97
68 wt% sample appears to have a lower conductivity, it can be attributed to the larger absolute
conductivity altering the samples. The 42 wt% sample can be seen to have a higher conductivity
than the 47 wt% sample; this is consistent with the 47 wt% samples shorter Warburg region
seen in the impedance plots (Figure 4-27).
Figure 4-26: Capacitive CV of CCE materials with varied 2N silane loading. 10 mV s-1
scan rate from 0.2 to 1.0 V vs.
RHE. Current normalized for geometric SA and for mass of carbon. In 2 M HCl under N2 atmosphere at 60 mL min-1
anolyte flow rate. (A) Area specific (B) Carbon mass normalized.
-8.00
-6.00
-4.00
-2.00
0.00
2.00
4.00
6.00
8.00
10.00
0 0.2 0.4 0.6 0.8 1 1.2
Cu
rre
nt
(mA
cm
-2)
Potential (V vs. RHE)
42 wt% 2N Silane
47 wt% 2N Silane
68 wt% 2N Silane
-6.00
-4.00
-2.00
0.00
2.00
4.00
6.00
8.00
0 0.2 0.4 0.6 0.8 1 1.2
No
rmal
ize
d C
urr
en
t (m
A g
Car
bo
n-1
)
Potential (V vs. RHE)
42 wt% 2N Silane
47 wt% 2N Silane
68 wt% 2N Silane
A
B

98
Figure 4-27: Nyquist plots of varied 2N silane content CCEs. Tests performed at 0 V vs. OCV in 2 M HCl anolyte
under N2 atmosphere at 60 mL min-1
anolyte flow rate and 25 mL min-1
H2 gas provided to the cathode. (A) Nyquist
plot (B) High frequency region.
0.00
0.02
0.04
0.06
0.08
0.10
0.00 0.02 0.04 0.06 0.08 0.10
Z" (
Ωcm
2)
Z' (Ω cm2)
42 wt% 2N Silane
47 wt% 2N Silane
68 wt% 2N Silane
0.00
0.10
0.20
0.30
0.40
0.50
0.60
0.70
0.80
0.00 0.20 0.40 0.60 0.80
Z" (
Ωcm
2)
Z' (Ω cm2)
42 wt% 2N Silane
47 wt% 2N Silane
68 wt% 2N Silane
A
B

99
Figure 4-28: Capacitance plots of CCEs with varied 2N silane content. Experiments performed at 0 V vs. OCV in 2 M
HCl anolyte under N2 atmosphere at 60 mL min-1
anolyte flow rate and 25 mL min-1
H2 gas provided to the cathode.
(A) Area specific capacitance (B) Mass of carbon normalized (C) Capacitance normalized to 1.
0
50
100
150
200
250
0 0.05 0.1 0.15 0.2
Cap
acit
ance
(m
F cm
-2)
Z' (Ω cm2)
42 wt% 2N Silane
47 wt% 2N Silane
68 wt% 2N Silane
0
20
40
60
80
100
120
140
160
0 0.05 0.1 0.15 0.2
Mas
s N
orm
aliz
ed
Cap
acit
ance
(m
F g C
arb
on
-1)
Z' (Ω cm2)
42 wt% 2N Silane
47 wt% 2N Silane
68 wt% 2N Silane
0.0
0.2
0.4
0.6
0.8
1.0
1.2
0 0.05 0.1 0.15 0.2
Frac
tio
n o
f To
tal C
apac
itan
ce
Z' (Ω cm2)
42 wt% 2N Silane
47 wt% 2N Silane
68 wt% 2N Silane
A
B
C

100
The standard CuCl oxidation testing protocol was also used to examine the 2N CCE
materials. Standard potential stair step measurements were made to observe the current
response to increased potential as the cell was polarized (Figure 4-29).
Figure 4-29: Potential stair step measurements of CCE’s with varied 2N silane composition. Scanned from 0.2 to 1.2
V with 5 mV steps and 0.5 s dwell time per step. Tests performed in 0.2 M CuCl in 2 M HCl anolyte and DI H2O
catholyte both under N2 atmosphere at 60 mL min-1
electrolyte flow rate.
The three CCE materials showed similar onset potentials to one another as well as to the
assumed standard value of 0.4 V vs. RHE. With this information we can see that the increased
resistance from silane content is not affecting the onset of the CuCl oxidation. The three
materials showed similar smooth current responses as the cell potential was increased
indicating there was no separate processes occurring aside from CuCl oxidation. For better
diagnostic abilities, the cell current was compared at 0.7 and 1.0 V vs. RHE and at different flow
rates (Figure 4-30).
0.00
0.10
0.20
0.30
0.40
0.50
0 0.5 1 1.5
Cu
rre
nt
(A c
m-2
)
Cell Potential (V)
42 wt% 2N Silane
47 wt% 2N Silane
68 wt% 2N Silane
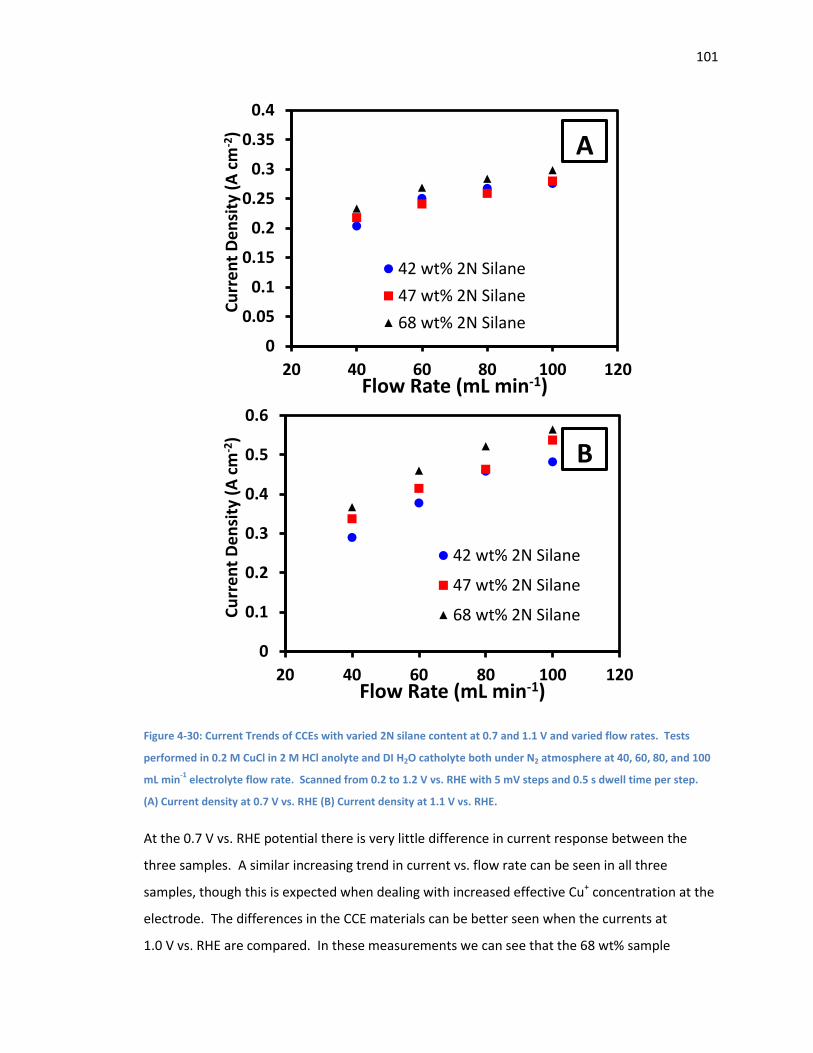
101
Figure 4-30: Current Trends of CCEs with varied 2N silane content at 0.7 and 1.1 V and varied flow rates. Tests
performed in 0.2 M CuCl in 2 M HCl anolyte and DI H2O catholyte both under N2 atmosphere at 40, 60, 80, and 100
mL min-1
electrolyte flow rate. Scanned from 0.2 to 1.2 V vs. RHE with 5 mV steps and 0.5 s dwell time per step.
(A) Current density at 0.7 V vs. RHE (B) Current density at 1.1 V vs. RHE.
At the 0.7 V vs. RHE potential there is very little difference in current response between the
three samples. A similar increasing trend in current vs. flow rate can be seen in all three
samples, though this is expected when dealing with increased effective Cu+ concentration at the
electrode. The differences in the CCE materials can be better seen when the currents at
1.0 V vs. RHE are compared. In these measurements we can see that the 68 wt% sample
0
0.05
0.1
0.15
0.2
0.25
0.3
0.35
0.4
20 40 60 80 100 120
Cu
rre
nt
De
nsi
ty (
A c
m-2
)
Flow Rate (mL min-1)
42 wt% 2N Silane
47 wt% 2N Silane
68 wt% 2N Silane
0
0.1
0.2
0.3
0.4
0.5
0.6
20 40 60 80 100 120
Cu
rre
nt
De
nsi
ty (
A c
m-2
)
Flow Rate (mL min-1)
42 wt% 2N Silane
47 wt% 2N Silane
68 wt% 2N Silane
A
B

102
responded the best to the applied potential, followed very closely by the 42 and 47 wt%
samples. Ultimately there is little difference in the current responses of the three samples when
compared by LSV measurement. It is still apparent that the three materials and behaving well,
and as expected.
Figure 4-31: Potentiostatic hold current trends of CCEs with varied 2N silane content at 0.7 V and varied flow rates.
Tests performed in 0.2 M CuCl in 2 M HCl anolyte and DI H2O catholyte both under N2 atmosphere at 40, 60, 80, and
100 mL min-1
electrolyte flow rate. Potential held at 0.7 V vs. RHE, current value taken at 150 s. (A) Area specific
(B) Carbon mass normalized.
0
0.05
0.1
0.15
0.2
0.25
0.3
20 40 60 80 100 120 140 160
Cu
rre
nt
De
nsi
ty (
A c
m-2
)
Flow Rate (mL min-1)
42 wt% 2N Silane
47 wt% 2N Silane
68 wt% 2N Silane
0
0.05
0.1
0.15
0.2
0.25
20 40 60 80 100 120 140 160
Mas
s N
orm
aliz
ed
Cu
rre
nt
(A g
Car
bo
n-1
)
Flow Rate (mL min-1)
42 wt% 2N Silane
47 wt% 2N Silane
68 wt% 2N Silane
A
B

103
As a final comparison, potentiostatic holds at 0.7 V vs. RHE were taken for each of the
samples at flow rates up to 140 mL min-1. When compared through this method we can see that
there is much better separation between the three samples. In the potentiostatic hold
measurements the 2N materials performed quite well, with some current densities above
200 mA cm-1. In the 2N samples the CCE materials were tested up to 140 mL min-1 as opposed
to the previous standard of 100 mL min-1 to examine any plateaus in the current response at
higher flow rates (Figure 4-31). The three samples did not show any signs of plateauing at the
higher flow rates. Each sample was able to be fit with a linear regression with an R2 value of
0.995 or higher. This indicates that there is a positive linear correlation between the increase in
flow rate of the analyte and the current response recorded for CuCl oxidation.
The 47 wt% sample was by far the best performing of the three samples with a
consistently higher current response across all flow rates. When normalized for the mass of
carbon present in the CCE material the 47 wt% sample increased its relative performance
compared to the other CCE materials. This indicates that the 47 wt% CCE material is giving the
best overall utilization of the electrode material. The 47 wt% sample also had the fastest
charging rate when examined through capacitance plots. This faster charging of the electrode
surface could be assisting the CCE in oxidizing the Cu+ leading to a higher overall current
response.
The overall current response in the potentiostatic tests showed a similar relationship
between the wt% loading of silane and current response as was seen previously in our group24.
There was a much more pronounced difference in the current response for the 2N materials as
opposed to the 1N materials (Figure 4-14). The overall relationship between the 1N silane
content and the current response was not seen in the 2N materials. However, silanes with a
composition below 42 wt% silane were not tested. Overall, for the 2N materials, it appears that
there is an increase in current response as the overall wt% of silane in the CCE is increased.

104
Figure 4-32: Relationship of 2N silane composition to current response in potentiostatic holds taken at 0.7 V.
Experiments performed in 0.2 M CuCl in 2 M HCl anolyte and DI H2O catholyte both under N2 atmosphere at 40 mL
min-1
electrolyte flow rate.
All three materials displayed an acceptable current response across all flow rates. There
was no sign of crossover or poisoning in the electrolysis cell and the current response was
maintained throughout the full testing protocol. Of the three materials the 47 wt% sample had
the best overall current response and the best utilization of the carbon surface for the Cu+
oxidation reaction. With this in mind the electrochemical surface area was found to be best
utilized by the 68 wt% sample and the sample was also found to have the best conductivity and
capacitance. This indicates that the decreased silane content substantially increases the overall
reactivity of the CCE materials for the oxidation reaction. The improved oxidation from the
lower silane content sample also supports the theory that the amino functionalities can block
pores of the carbon surface, limiting the possible oxidation sites.
4.1.3.3: Electrochemical Results for 3N Materials
The 3N silane material with two secondary and one primary amine functionalities was
examined. The 3N material is the silane with the largest amine pendant arm functionality
0
0.02
0.04
0.06
0.08
0.1
0.12
0.14
0.16
0.18
0.2
30 40 50 60 70 80
Cu
rre
nt
De
nsi
ty (
A c
m-2
)
Silane Composition (wt%)
Current at 0.7V vs. SHE and 60mL/min

105
allowing for extended investigation of the effect of the longer pendant arm on the
electrochemically active surface area of the carbon electrode. The 3N materials were produced
with silane content ranging from 6.86 to 11.80 mmol Silane gCarbon -1 (Table 4-3).
Figure 4-33: Capacitive CV of CCE materials with varied 3N silane loading. 50 mV s-1
scan rate from 0.2 to
1.0 V vs. RHE. Current normalized for geometric SA and for mass of carbon. In 2 M HCl under N2 atmosphere at 60
mL min-1
anolyte flow rate. (A) Area specific (B) Carbon mass normalized.
Again, capacitive CVs were taken in the absence of CuCl to assess the surface area of the
CCE materials. The three materials all showed a stable box like shape in the CV indicating there
were almost no non faradaic processes occurring during the measurements. The only apparent
faradaic process occurred in the 66 wt% silane sample at approximately 0.55 mV. This was
-6.00
-4.00
-2.00
0.00
2.00
4.00
6.00
8.00
0 0.2 0.4 0.6 0.8 1 1.2
Cu
rre
nt
(mA
cm
-2)
Potential (V vs. RHE)
57 wt% 3N Silane
66 wt% 3N Silane
70 wt% 3N Silane
-10.00
-8.00
-6.00
-4.00
-2.00
0.00
2.00
4.00
6.00
8.00
10.00
0 0.2 0.4 0.6 0.8 1 1.2
No
rmal
ize
d C
urr
en
t (m
A g
Car
bo
n-1
)
Potential (V vs. RHE)
57 wt% 3N Silane
66 wt% 3N Silane
70 wt% 3N Silane
A
B

106
assumed to be the result of Cu+ deposition from copper contamination. The three samples had
capacitive areas of decreasing size in the same order as the decreasing mass loading of carbon.
After normalizing for the mass of carbon on the surface it was seen that the 66 wt% sample had
the highest capacitive area indicating the best utilization of the carbon surface area. The 57 and
70 wt% samples had similar capacitive areas once normalized for the mass of carbon present.
The EIS measurements were also taken to assess the conductivity of the 3N materials
(Figure 4-34). Again the increased amine content in the silane functionality leads us to expect
greater increases in ionic conductivity with increased silane content. While the 57 wt% sample
did not show a discernable Warburg region, the 66 and 70 wt% samples did show a well-defined
Warburg region (0.01 and 0.02 Ω respectively) with the 66 wt% sample appearing to have a
higher conductivity.
The capacitance plots (Figure 4-35) showed a similar ordering of the CCE samples based
on their capacitance when compared to the capacitive CV’s that were collected (Figure 4-33).
The non-normalized samples showed close to the same limiting capacitance for the 57 and
66 wt% samples with a lower limiting capacitance observed for the 70 wt% sample. After
normalizing for the mass of carbon present in the CCE the 66 wt% sample again shows a much
higher limiting capacitance indicating the sample had the best overall utilization of the carbon
surface. In addition to this, the 57 and 70 wt% samples had nearly equal limiting capacitances,
although the 70 wt% sample charged to its capacitance at a lower real resistance (Z’). The
information that is obtained from the mass normalized capacitance plots also closely mimics the
information generated from the mass normalized capacitive CV graphs. The initial steepness of
the capacitance plots is very similar even when the maximum capacitance is normalized to a
maximum value of 1. From this we can conclude that the materials are charging at similar rates
meaning the difference in the conductivity of the samples is quite small.

107
Figure 4-34: Nyquist plots of varied 3N silane content CCEs. Experiment performed at 0 V vs. OCV in 2 M HCl
anolyte under N2 atmosphere at 60 mL min-1
anolyte flow rate and 25 mL min-1
H2 gas provided to the cathode.
(A) High frequency region (B) Full nyquist plot.
0.00
0.02
0.04
0.06
0.08
0.10
0.00 0.02 0.04 0.06 0.08 0.10
Z" (
Ωcm
2)
Z' (Ω cm2)
57 wt% 3N Silane
66 wt% 3N Silane
70 wt% 3N Silane
0.00
0.50
1.00
1.50
2.00
2.50
3.00
3.50
4.00
0.00 2.00 4.00
Z" (
Ωcm
2)
Z' (Ω cm2)
57 wt% 3N Silane
57 wt% 3N Silane
70 wt% 3N Silane
A
B

108
Figure 4-35: Capacitance plots of CCEs with varied 3N silane content. Experiment performed at 0 V vs. OCV in 2 M
HCl anolyte under N2 atmosphere at 60 mL min-1
anolyte flow rate and 25 mL min-1
H2 gas provided to the cathode.
(A) Area specific capacitance (B) Mass of carbon normalized (C) Capacitance normalized to 1.
0
20
40
60
80
100
120
140
0 0.5 1
Cap
acit
ance
(m
F cm
-2)
Z' (Ω cm2)
57 wt% 3N Silane
66 wt% 3N Silane
70 wt% 3N Silane
0
20
40
60
80
100
120
140
160
180
200
0 0.5 1
Mas
s N
orm
aliz
ed
Cap
acit
ance
(m
F g C
arb
on
-1)
Z' (Ω cm2)
57 wt% 3N Silane
66 wt% 3N Silane
70 wt% 3N Silane
0.0
0.2
0.4
0.6
0.8
1.0
1.2
0 0.5 1
Frac
tio
n o
f To
tal C
apac
itan
ce
Z' (Ω cm2)
57 wt% 3N Silane
66 wt% 3N Silane
70 wt% 3N Silane
A
B
C

109
There was very little variation found between the 3N materials when linear sweep
measurements were taken in the presense of CuCl. The 3N CCE’s all showed a similar onset
potential that was in keeping with previous measurements made of both the 2N and 1N CCE’s.
The increase in current was smooth for all three samples with a similar reduction in the rate of
current increase at approximatly 0.6 V vs. RHE. All three samples performed similarly to one
another with no clear best material over the whole current range.
Figure 4-36: Potential stair step measurements of CCEs with varied 3N silane composition. Scanned from 0.2-1.2 V
with 5 mV steps and 0.5 s dwell time per step. Collected in 0.2 M CuCl in 2 M HCl anolyte and DI H2O catholyte
both under N2 atmosphere at 60 mL min-1
electrolyte flow rate.
To better analyse the current responses, comparisons of the current of the potential
stair step measurements at 0.7 and 1.0 V vs. RHE and at varied flow rates between 40 and 100
mL min-1 were made (Figure 4-37). A linear increase in current response with flow rate was
observed for the CCE’s as expected. The only case of plateauing current was seen in the 66 wt%
sample at 1.0 V vs. RHE and 100 mL min-1 anolyte flow. The 57 wt% sample also appeared to
have a steeper slope of current response vs. flow rate at 0.7 V vs. RHE.
0.00
0.05
0.10
0.15
0.20
0.25
0.30
0.35
0.40
0.45
0 0.5 1 1.5
Cu
rre
nt
De
nsi
ty (
A c
m-2
)
Cell Potential (V)
57 wt% 3N Silane
66 wt% 3N Silane
70 wt% 3N Silane

110
Figure 4-37: Current Trends of CCEs with varied 3N silane content at 0.7 and 1.1 V and varied flow rates.
Experiments performed in 0.2 M CuCl in 2 M HCl anolyte and DI H2O catholyte both under N2 atmosphere at 40, 60,
80, and 100 mL min-1
electrolyte flow rate. Scanned from 0.2 to 1.2 V vs. RHE with 5 mV steps and 0.5 s dwell time
per step. (A) Current density at 0.7 V vs. RHE (B) Current density at 1.1 V vs. RHE.
The potentiostatic holds taken at 0.7 V vs. RHE show the best current response from the
57 wt% sample followed by the 70 wt% sample and finally the 66 wt% sample. Upon normalizing
for the total mass of carbon in the CCE material the 70 wt% sample showed the best mass
normalized current response. The current responses were compared with respect to the total
0
0.05
0.1
0.15
0.2
0.25
0.3
0.35
0.4
20 40 60 80 100 120
Cu
rre
nt
De
nsi
ty (
A c
m-2
)
Flow Rate (mL min-1)
57 wt% 3N Silane
66 wt% 3N Silane
70 wt% 3N Silane
0
0.1
0.2
0.3
0.4
0.5
0.6
20 40 60 80 100 120
Cu
rre
nt
De
nsi
ty (
A c
m-2
)
Flow Rate (mL min-1)
57 wt% 3N Silane
66 wt% 3N Silane
70 wt% 3N Silane
A
B

111
silane composition (Figure 4-39). There was no discernable trend in current with the silane
composition.
Figure 4-38: Potentiostatic hold current trends of CCEs with varied 3N silane content at 0.7 V and varied flow rates.
Experiments performed in 0.2 M CuCl in 2 M HCl anolyte and DI H2O catholyte both under N2 atmosphere at 40, 60,
80, and 100 mL min-1
electrolyte flow rate. Potential held at 0.7 V vs. RHE, current value taken at 150 s. (A) Area
specific (B) Carbon mass normalized.
0.00
0.05
0.10
0.15
0.20
0.25
0.30
20 40 60 80 100 120 140 160
Cu
rre
nt
De
nsi
ty (
A c
m-2
)
Flow Rate (mL min-1)
57 wt% 3N Silane
66 wt% 3N Silane
70 wt% 3N Silane
0.00
0.05
0.10
0.15
0.20
0.25
0.30
0.35
0.40
0.45
0.50
20 40 60 80 100 120 140 160Mas
s N
orm
aliz
ed
Cu
rre
nt
(A g
Car
bo
n-1
)
Flow Rate (mL min-1)
57 wt% 3N Silane
66 wt% 3N Silane
70 wt% 3N Silane
A
B

112
Figure 4-39: Relationship of 3N silane composition to current response in potentiostatic holds taken at 0.7 V.
Collected in 0.2 M CuCl in 2 M HCl anolyte and DI H2O catholyte both under N2 atmosphere at 40 mL min-1
electrolyte flow rate.
4.2: Discussion
To examine the effects of the silane materials in the full-cell environment two variables
were investigated. First the 1N, 2N, and 3N materials were examined, expanding on the
investigation of these materials in a half-cell. The second variable investigated was the total
loading of the electrode material on the CCE. This investigation was specific to the full-cell
environment.
4.2.1: 1N Materials
One of the reasons for producing the 1N CCE materials with silane loadings between
20 to 60 wt% was to allow for comparison to CCEs produced previously in our lab. These CCEs
were tested extensively in a half-cell environment24. Three CCE materials containing the 1N
silane were tested with silane loadings of 22, 36, and 56 wt%. It was determined through anodic
polarization that the 36 wt% silane sample was the best performing demonstrating the highest
limiting current. Initially the new half-cell materials discussed in Chapter 3 were intended to be
0.00
0.05
0.10
0.15
0.20
0.25
0.30
50 60 70 80
Cu
rre
nt
De
nsi
ty (
A c
m-2
)
Silane Composition (wt%)
Current at 0.7 V vs. SHE and 60 mL/min
113
compared to those produced previously. However, because the samples we produced all had
silane loadings above the original best 36 wt% silane we were not able to compare our silane
materials to those produced previously. To that end, the full-cell CCE’s tested showed silane
compositions between 27 and 62 wt% of silane allowing for a more direct comparison of the
initial half-cell work to our materials. While there was a compositional similarity between the
original half-cell and the full-cell CCE materials it is still a comparison between full and half-cell
operation which possess drastically different operating conditions. With this in mind, only basic
connections between the original half-cell data and the full-tests can be made.
The decrease in surface homogeneity with increasing silane content that was observed
when the 1N materials were examined under SEM (Figure 4-3) was attributed to the additional
sol-gel binder present in the CCEs creating macrostructures. Within the CCE structure, the sol-
gel material exists as a binder holding the carbon surface together. By increasing the silane
content, the binder will be more able to form cross linking creating surface defects. Ultimately
the surface of the CCE structures can be assumed to be largely homogeneous. This is because
the capacitive CV measurements when normalized for the mass of carbon showed little
variation (Figure 4-4).
As with the half-cell experiments, EIS measurements were performed on the 1N CCEs
(Figure 4-5). The very low Warburg regions were attributed to the electronic conductivity of the
carbon support as well as the high ionic conductivity of the analyte liquid. As with the half-cell
measurements the high silane content materials showed the highest resistance. While the
samples with the higher silane content were expected to have a higher ionic conductivity this
can be explained. The increased electronic resistance from the silane backbone will decrease
the overall conductivity of the materials. Excess silane content could also block micro-pores
within the CCE material in doing this the additional ionic conductivity of the added silane can be
mitigated. Beyond the inverse dependence of conductivity on silane content there was no clear
trend in the conductivity. The Warburg regions of the two CCEs containing the least silane were
very similar, the same behavior was seen for the two highest silane content CCEs. The
capacitance plot shows behavior similar to what was seen in the capacitive CV measurements
(Figure 4-6). The lower plateau level for the capacitance plot of the 62.5 wt% sample (not
included in capacitive CV measurements) showed that the porous structure was quite reduced.
This is likely due to the blocking of micro-pores in the carbon by the larger amount of the silane
114
and the associated amine functionalities attached to the silane monomers. After normalizing for
the mass of carbon, the only notable difference was that the relative capacitance values of the
four CCEs with the lowest silane content increased relative to the CCE with the highest silane
content. This further supports the idea that the increased silane content eventually blocks
micro-pores of the carbon surfaces and not that there was simply less carbon present to be
capacitive24.
The initial examination of the potential stair step measurements in the full-cell
environment showed the expected onset potential; however the samples showed a plateauing
of current response at higher potentials. Since this phenomenon was not seen in the faster flow
rate runs or in the CCEs that showed a higher capacitive surface area and greater current
response (Figure 4-7 and Figure 4-8), it is likely that this is due to a mass transport plateau
current being reached. At higher flow rates it can be assumed that the Cu+ at the electrode
surface is being replenished fast enough to avoid the slower mass limited current response. A
noticeable feature of the CCEs is that up to 100 mL min-1 they do not appear to be showing signs
of diminishing returns in current response for the increased flow rate of the electrolytes. As
determined by Stolberg et al., there will be an increased flow rate or potential at which all of the
CCEs will reach a point of diminishing returns, though it may be higher than it is feasible to
operate the electrolysis cell21. In addition to the comparison of materials, the potential stair
step measurements can also be used to predict the cell’s response to higher concentrations of
anolyte. When the flow rate is doubled the amount of CuCl per unit time at the electrode
surface should be identical to an anolyte with twice the CuCl concentration flowing at the
original flow rate.
Again, as with the half-cell experiments, the potentiostatic hold tests were used to
examine the materials’ activity during sustained CuCl oxidation (Figure 4-13). While these tests
were shown to give the same data as potential stair step measurements (Figure 4-11), the ability
to assess the sustained operation of the CCE was important along with Cu oxidation was quite
valuable.
Across the 4 samples measured there was a negative correlation between current
response and silane content (Figure 4-14). The differences in the relationship between the
silane content and the current measured are likely because of varied microstructures within the
carbon. The similar mass normalized capacitive CVs which indicated that the carbon support

115
was being utilized by the same amount for each sample. However, during the capacitive CV
measurements the surface of the electrode is simply being charged and discharged. This is
different from what is expected under normal operation. When making a potentiostatic hold,
bulky copper compounds must reach the surface of the electrode as opposed to electrons which
can be transferred through the carbon material. With this in mind we can draw the conclusion
that the increased silane presence in the CCE structure will obstruct the migration of CuCl to the
electrode surface. While it is expected that there will be better ionic conductivity from higher
wt% silane samples given their amine functionalities, the amino-propyl side chain could also
physically obstruct micropore sites, limiting access to the electrode’s surface area. This would
not affect the capacitive surface area measured as the electrolyte solution could more easily
penetrate into pores obstructed by the silane side chains. The increased silane content will also
increase the resistance in the electrode increasing the potential required for CuCl oxidation.
This also supports the previous half-cell measurements made showing a low 36 wt% silane
loading to be optimal24.
4.2.2: Varied CCE Loadings (1N)
Initially there were two reasons for testing the increased loading on the CCE materials.
It was shown that the mass normalized capacitance of the different samples tested (shown in
Figure 4-4) were very similar. This implies that with increased carbon surface area we should
see an increased activity of the samples or at least see an increase in the point at which a
maximum current is reached. The second reason is that the higher mass loadings should also
correlate to a thicker electrode structure. This increased thickness is potentially valuable to the
cells ability to resist copper crossover. This phenomenon is discussed at length in
Chapter 5: Materials Durability and Copper Crossover Resistance. In brief, the increased
thickness of the CCE layer increases the distance that Cu+ must migrate to cross through the
membrane and poison the cathode catalyst.
By using samples that all contain the same silane to carbon ratio (Table 4-2), the effects
of only the total CCE loading were isolated. During the capacitive CV measurements we
observed the highest CCE loading sample discharging at a much slower rate (Figure 4-15), this
was attributed to the thick electrode layer which created a larger resistive environment slowing
the discharging from the electrode surface. In spite of this, the highest CCE loading sample
showed a large capacitive surface area as expected from the large amount of carbon within the

116
CCE. However, after normalizing for the mass of carbon the 3.6 mg C cm-2 was shown to have
the worst carbon utilization. The decrease was expected as the increased mass of CCE will
necessarily obstruct some of the carbons surface area. This trend was also shown in the mass
normalized capacitance measurements (Figure 4-17 (B)). The capacitance measurements also
showed a better definition between the samples with respect to the overall capacitance,
however there was no trend amongst the low CCE loading samples. The lack of a trend in the
mass normalized capacitance and CV measurements further speaks to the very similar CCE
structure in the three CCE’s with a lower mass loading.
From the EIS measurements it was observed that only the 3.6 mg C cm-2 sample showed
a significant Warburg region (Figure 4-16). While there could be some decreased conductivity
from electronic resistance the decreased conductivity is assumed to be primarily ionic. This is
because the silane content is nearly the same for all four of the samples. The similar silane
loading indicates that the any resistance within the samples from the silane presence should be
roughly equivalent leaving only the varied CCE structure to affect the ionic conductivity.
For both the potential stair step and potentiostatic hold measurements there does not
appear to be any dependence of the current response on the silane content in these samples
(Figure 4-19 and Figure 4-20). With this in mind, the current responses were compared with the
ionic conductivity measured in the samples. This was accomplished by normalizing the
maximum capacitance values for each of the CCEs to 1, allowing for the rate at which the
materials charge to their maximum value to be examined. The normalized capacitance plot
showed that the 1.8 mgCarbon cm-2 sample had the highest conductivity from the steepness of the
initial slope on the capacitance plot (Figure 4-22). The order from highest to lowest conductivity
for the remaining three samples is; 1.3 mgCarbon cm-2, 0.8 mgCarbon cm-2, and finally the
3.6 mgCarbon cm-2. While the 3.6 mgCarbon cm-2 sample capacitance plot crosses the line made by
the 0.8 mgCarbon cm-2 sample and reaches its maximum capacitance sooner, the steeper initial
slope of the 0.8 mgCarbon cm-2 sample indicated it had a higher ionic conductivity. With the
exception of the 1.3 mg C cm-2 sample, which showed the highest response, the order of
increasing ionic conductivity from the normalized capacitance graph correlated with the
maximum current response recorded in the potentiostatic measurements taken at 40 mL min-1
(Figure 4-20). From this it was inferred that the increased ionic conductivity of the electrodes
led to an increased current response. This is not surprising as the diffusion of the CuCl

117
molecules to the electrode surface is by far the slowest step in the electrolysis reaction,
increases made to this portion of the electrolysis will strongly affect the overall current
response21.
Beyond ionic conductivity, there appears to be little dependence of the current on other
factors in the composition of the four samples (Figure 4-21). In these samples, increased ionic
conductivity cannot be attributed to varied silane content as all four fall within a very narrow
range. As described above, the lower ionic conductivity of the 3.6 mgCarbon cm-2 sample can be
attributed to the slower mass transport through the much thicker CCE layer. For the three
lower loading samples the 0.8 mgCarbon cm-2 sample had the worst performance because of its
overall lower mass loading and the 1.8 mgCarbon cm-2 sample began suffering from the decreased
reaction kinetics associated with the higher mass loadings. The 1.3 mgCarbon cm-2 sample
represents an optimal mass loading, gaining the increased reaction kinetics of the lower loading
samples without losses from a smaller overall surface area.
4.2.3: 2N Materials
For the examination of the 2N materials the produced CCE materials had a range of
silane concentrations completely within the 1N materials silane concentration range it allows for
easy comparison between the 1N and 2N materials (Table 4-3). As with the 1N materials, the 2N
CCEs showed a decrease in surface homogeneity with increased silane content. Again, this was
attributed to the increased binder content increasing crosslinking and, thus, the surface defects
observed. Differing from the 1N materials, the 2N materials showed increasing capacitive area
with increasing silane content. In this case it is possible that the higher silane content is allowing
for better utilization of the high surface area carbon. The increased amine functionalizations
from higher silane content would allow for easier electron transport to the surface of the
electrode increasing the capacitive charging. This phenomenon can also explain why there was
a more dramatic increase in CCE surface area with silane content for the 2N CCEs when
compared to the 1N CCEs.
The EIS measurements made showed that the Warburg regions of the three CCEs were
almost identical (Figure 4-27). While the 68 wt% sample showed the shortest Warburg region
overall, all three materials showed very low resistance. This can also be attributed to the
118
increased protonated amine content within the CCE. The increased conductivity is also likely not
from an increase in electronic conductivity. The increase of the silane content will necessarily
increase the resistance of the CCE material. For these two reasons it is assumed that the
increase in conductivity is from the increased ionic conductivity of the CCE. The capacitance
plots of the 2N materials also showed that the capacitance was increasing with surface area
(Figure 4-28), confirming the capacitive CV measurements.
When examining the potential stair step measurements it was determined that the 68
wt% sample performed the best (Figure 4-29), while this was not the case for the measurements
made in the potentiostatic holds an interesting trend can be observed. While none of the
materials showed any signs of plateauing the 68 wt% sample does show an better response to
the increased flow rate. The slope of the 68 wt% sample in Figure 4-31 (A) was 0.00094
compared to 0.00086 for the 47 wt% sample. These two slopes were found to be statistically
different at a 95% confidence interval. This implies that the 68 wt% sample will eventually
overtake the 47 wt% sample’s current response at a much higher flow rate. However, this does
rely on the premise that neither sample will plateau before that point is reached as predicted by
Stolberg et al.21. The 42 wt% sample showed a much lower current response with a lower
overall response to the increased flow rate. While the sample did appear to have a higher ionic
conductivity, from the EIS measurements (Figure 4-27), the lower overall surface area limited
the CCEs ability to oxidize Cu+. Beyond this, the potentiostatic measurements did not show any
trend in current response to silane content (Figure 4-32). While the surface area of the
materials would affect the reaction the similar ionic conductivity the three CCEs likely
contributed to the overall lack of trend in the potentiostatic data.
4.2.4: 3N Materials
To complete the examination of varied silanes 3N materials were produced for the full-
cell environment. Again, the CCE materials were produced with silane contents that fell within
the range of silane content produced for the 1N and 2N materials allowing for the comparison
between the different silanes (Table 4-3). When the SEM images of the 3N materials are
compared to the 1N and 2N materials, the 3N CCEs did not show the expected decrease in
surface homogeneity (Figure 4-25). This can be explained by the narrow range over which the
materials were produced. This made it more difficult to discern changes in the CCE structure.

119
The surface was still taken to be homogeneous as the capacitive CV measurements showed very
similar capacitive areas when normalized for the mass of carbon.
Once again, an increase in the Warburg region and, thus, resistance with increasing
silane content was observed (Figure 4-34). The 2N materials showed decreasing resistance with
increased silane content implying that the increase in ionic conductivity was greater than the
increase in electronic conductivity. While an increase in ionic conductivity from the 70 wt%
sample is expected, it is also possible that the very high wt% content of the silane in the CCE led
to dramatic increases in resistance, lowering the electrical conductivity, and increasing the
overall resistance. As with the 1N and 2N materials, the mass normalized capacitance plot
showed the same trend in increasing capacitance as was seen in the capacitive CVs (Figure
4-35).
The potential stair step measurements showed very similar current responses making
analysis of the CCE materials based on this technique difficult (Figure 4-37). Contrary to this, the
potentiostatic hold measurements showed very clear differences in current response at all flow
rates tested (Figure 4-38). There was a large change in the relative current responses between
the area and mass normalized current responses. The change can be ascribed totally to the
variety in carbon loadings between samples. Normally the 57 wt% sample had a higher total
mass of carbon giving it the best overall performance. The low loading on both the 66 and 70
wt% samples gave them much better utilization of the carbon surface area. Ultimately all three
materials performed quite well allowing excellent mass normalized current responses. This
excellent utilization of the carbon surface can be partially attributed to the increase in ionic
conductivity afforded by the protonated amine functionalities. In addition to the increased ionic
conductivity it is also important to note that the oxidation can also occur outside of the CCE
material. The smaller total mass of carbon meant that a larger percentage of the total oxidation
was occurring outside of the CCE, this gave the CCE material an artificially increased utilization
of the CFP surface. This increase would also have not been seen in the surface area
measurements where the non-ceramic surface area can always be seen as negligible.
Overall, the 3N materials showed a good current response in the potentiostatic hold
measurements, comparable to both the 1N and 2N materials discussed previously. The 3N
material did not appear to follow the trend seen in the 2N and previously published data from
our research (Figure 4-39)24. Instead the lowest wt% sample appeared to have the best overall

120
current response. This decreasing current with increased silane content is likely due to the
much higher silane contents tested for the 3N samples. The ratio of silane to mass of carbon is
much higher for the 3N samples tested when compared to the 1N and 2N samples. Due to this,
the range of 3N samples tested represents the upper portion of the 1N and 2N samples tested.
This means that while the best performing 3N sample had the lowest silane content, it still
corresponds with the best 1N and 2N sample compositions.
4.2.5: Comparison of Varied Silane Types
From the analysis of the CCE materials produced with the three silane materials it is
possible to compare the samples based on silane type, and amount, as well as amine content.
The CCEs showed similar conductivities across all of the samples. The 1N materials, on average,
possessed shorter Warburg regions than the 2N and 3N CCE materials, but the overall
conductivity from the CCE materials was largely the same (Figure 4-40 (A)). Additionally, the
conductivity associated with the CCEs was quite low. This is in large part due to the liquid
electrolyte providing excellent electronic and ionic conductivity. With the initially low ionic
conductivity of the MEA it was difficult to discern differences solely based on changes in total
silane content. The capacitance of the materials also gives an approximate insight into the total
surface area of the materials. While the conductivity of the CCEs was quite similar, a difference
in the limiting capacitance was observed when comparing the different materials (Figure 4-40
(B)). Overall there was not a dramatic change in the limiting capacitance values associated with
the 1N, 2N, or 3N materials. This indicates that the overall surface morphology of the CCEs is
more important to the capacitance of the CCEs than the silane binders.

121
Figure 4-40: Nyquist and Capacitance plots of CCEs with representative compositions from 1N, 2N, and 3N silane
precursors. Representative compositions of the silanes were used. Collected in 2 M HCl anolyte under N2
atmosphere at 60 mL min-1
anolyte flow rate and 25 mL min-1
H2 gas provided to the cathode. (A) High frequency
region Nyquist plot (B) Mass of carbon normalized capacitance plot.
0
0.01
0.02
0.03
0.04
0.05
0.06
0.07
0.08
0.09
0.1
0 0.02 0.04
Z" (
Ωcm
2)
Z' (Ω cm2)
53 wt% 1N Silane
42 wt% 2N Silane
66 wt% 3N Silane
0
5
10
15
20
25
30
35
40
0 0.1 0.2 0.3 0.4 0.5
Mas
s N
orm
aliz
ed
Cap
acit
ance
(m
F g C
arb
on
-1)
Z' (Ω cm2)
27 wt% 1N Silane
42 wt% 2N Silane
66 wt% 3N Silane
A
B

122
In addition to the EIS information, the capacitive CV measurements taken in the absence
of CuCl provide an interesting insight into the surface area of the materials. There should be a
correlation between the overall charge on the surface of the CCEs during capacitive CV
measurements and the electrochemically active surface area (ECSA) of the material. The
forward scans of the capacitive CV measurements were integrated with respect to time to
provide a columbic charge values for each material (Figure 4-41).
Figure 4-41: Example of the integrated area for the forward scan integration of capacitive CVs.
When comparing all of the CCE materials a slight association between the molar loading of the
silane and the capacitive surface area. At higher molar loadings of silane the capacitive surface
area is increased (Figure 4-42). During the charging and discharging of the CCE surface, low
conductivity can potential required for the materials ability to be fully charged. From this, while
the increase in charge with increased silane loading is not necessarily tied to an increased
surface area it can be correlated with the electrodes overall ability to facilitate non faradaic
charging.
Potential (V vs. RHE)

123
Figure 4-42: Total charge from capacitive CV measurements taken at 50 mV s-1
in relation to the molar loading of
silane in the CCE material.
As has been mentioned, the increase in charge is likely not due to an increase in overall
surface area, but more likely because of increased conductivity in the materials allowing for
easier electron transport. The sol-gel network supporting the CCE will insulate the CCE structure
so the positive correlation between charge and silane content must be related to the total
amine content of the material. In comparing the sum of the amine functionalities (both primary
and secondary) to the total charge a good linear correlation can be seen (r2 = 0.8165) (Figure
4-43). From this we conclude that the increased ionic conductivity afforded by the amine
content increased the electrodes ability to be charged. In all cases this increased ionic
conductivity appears to outweigh the electrically resistive effects of the sol-gel binder. The
increase in charge with amine content also appears to be more pronounced in the 2N and 3N
materials.
0
5
10
15
20
25
30
35
40
45
0 5 10 15
No
rmal
ize
d C
har
ge (
C g
-1)
Silane Loading (mMol gCarbon-1)
1N Materials
2N Materials
3N Materials

124
Figure 4-43: Total charge from capacitive CV measurements taken at 50 mV s-1 in relation to the molar content of
amines in the CCE material.
The CCE materials all showed similar behavior when compared by potential stair step
measurements. The materials all had similar onset potentials and behavior as the potential was
scanned to higher values. When compared to standard Pt catalyst materials and a bare CFP
control it can be observed that the onset potential does not change significantly (Figure 4-44).
The current response does appear to be better for the bare CFP material. This is due to a faster
reaction occurring at the surface of the CFP. The increased activity of the CCE materials over the
Pt catalyst material is in agreement with work previously performed by our lab and others27.
y = 0.574x + 14.581R² = 0.8165
0
5
10
15
20
25
30
35
40
45
0 10 20 30 40
No
rmal
ize
d C
har
ge (
C g
-1)
Amine Loading (mMol gC-1)
1N Materials
2N Materials
3N Materials

125
Figure 4-44: Comparison of best potential stair step mearuements for 1N, 2N, and 3N CCEs as well as bare CFP and
standard Pt/C catalyst materials. Scanned from 0.2 to 1.2 V with 5 mV steps and 0.5 s dwell time per step.
Collected in 0.2 M CuCl in 2 M HCl anolyte and DI H2O catholyte both under N2 atmosphere at 60 mL min-1
electrolyte flow rate.
While these measurements give insight into the operational behavior of the different
electrodes, full potentiostatic measurements allow for a more realistic comparison between
electrode properties and their operating current. As with the previous potentiostatic
measurements, after 150 s of the cell’s operation at 0.7 V vs. RHE with 60 mL min-1 electrolyte
flow the recorded current was taken to be representative of the material. To account for the
materials varied total loadings, all measurements comparing the different CCE materials were
normalized for mass of carbon present. When the mass normalized current is compared to the
molar loading of the silane precursor used there is a varied current response to increased silane
content (Figure 4-45). As the molar loading of the silane is increased the ionic conductivity
should increase and the electronic conductivity should decrease. These two properties can be
attributed to the protonated amine groups and the non-conductive sol-gel network respectively.
The competition between these two phenomena should produce an optimal loading of silane.
In the case of the 1N silane it is likely that the optimal loading is lower than the range of silane
that was tested. This is evident from the constant decrease in activity with increasing silane
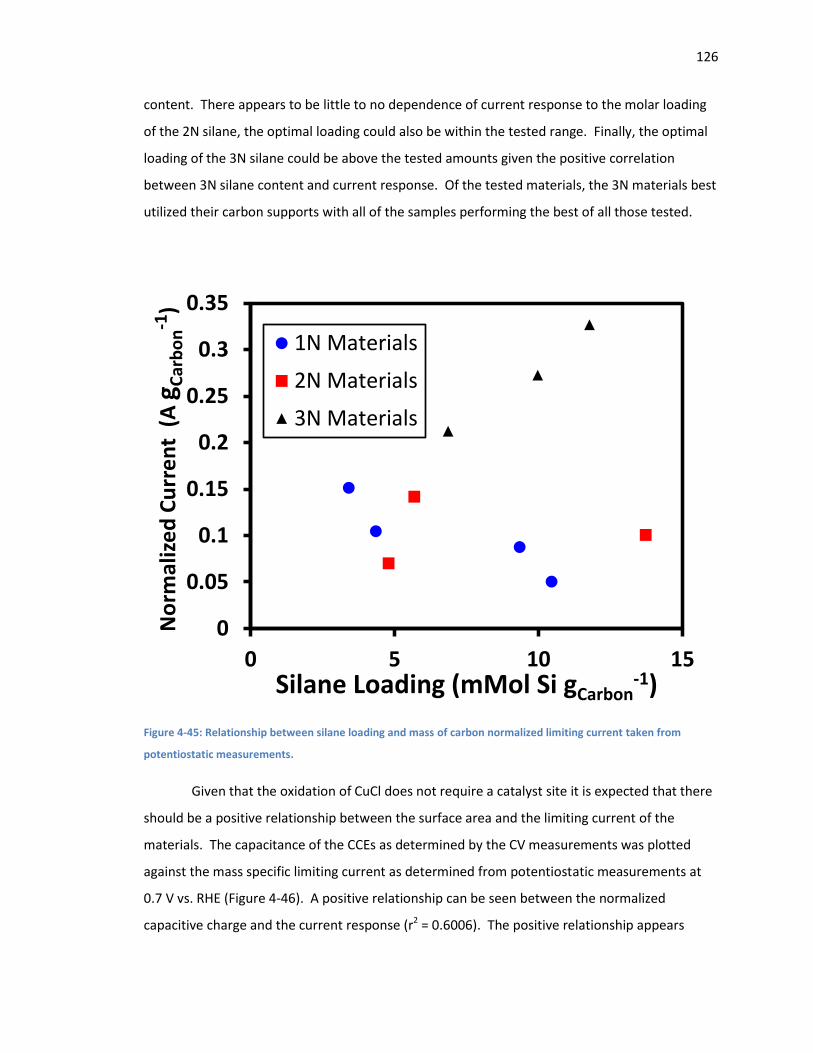
126
content. There appears to be little to no dependence of current response to the molar loading
of the 2N silane, the optimal loading could also be within the tested range. Finally, the optimal
loading of the 3N silane could be above the tested amounts given the positive correlation
between 3N silane content and current response. Of the tested materials, the 3N materials best
utilized their carbon supports with all of the samples performing the best of all those tested.
Figure 4-45: Relationship between silane loading and mass of carbon normalized limiting current taken from
potentiostatic measurements.
Given that the oxidation of CuCl does not require a catalyst site it is expected that there
should be a positive relationship between the surface area and the limiting current of the
materials. The capacitance of the CCEs as determined by the CV measurements was plotted
against the mass specific limiting current as determined from potentiostatic measurements at
0.7 V vs. RHE (Figure 4-46). A positive relationship can be seen between the normalized
capacitive charge and the current response (r2 = 0.6006). The positive relationship appears
0
0.05
0.1
0.15
0.2
0.25
0.3
0.35
0 5 10 15
No
rmal
ize
d C
urr
en
t (
A g
Car
bo
n-1
)
Silane Loading (mMol Si gCarbon-1)
1N Materials
2N Materials
3N Materials

127
independent of the type of silane used to produce the CCE. This indicates that the oxidation of
CuCl does indeed depend on the capacitance of the CCE material.
Figure 4-46: Comparison of CCE capacitance and mass of carbon specific limiting current taken from potentiostatic
holds.
Ultimately, the comparison of mass specific currents does not allow for an adequate
comparison of the electrodes that were specifically tested. Through only normalizing for the
specific area of the electrode the absolute current response of the different CCE materials can
be compared to determine the best overall performing material (Figure 4-47). There appears to
be a marked decrease in the maximum current obtained for the 2N materials. This could be
attributed to low overall CCE loadings as the 2N materials performed comparably to the 1N
materials when normalized for the mass of carbon (Figure 4-45). The most notable change is
the difference in current response of the 3N materials. While they showed good mass specific
currents the 3N materials showed relatively lower absolute currents more similar to those
recorded for the 1N and 2N electrodes. The low loadings of carbon at the surface of the
electrode limited the overall current responses while giving much better mass normalized
y = 0.0099x - 0.0835R² = 0.6006
0
0.05
0.1
0.15
0.2
0.25
0.3
0.35
0 10 20 30 40 50
No
rmal
ize
d C
urr
en
t (
A g
Ca
rbo
n-1
)
Normalized Charge (C gCarbon-1)
1N Materials
2N Materials
3N Materials

128
performance. Of the materials tested the best performing CCE from each of the three
precursors was selected for comparison to control materials (Figure 4-48). Of the materials, the
best 1N and 3N materials outperformed the bare CFP control electrode and performed
comparably well to the Pt/C catalyst electrode.
Figure 4-47: Comparison of area normalized current response to potentiostatic holds for all 1N, 2N, and 3N
materials.
Figure 4-48: Comparison of best area normalized current responses to potentiostatic holds from 1N, 2N, and 3N
CCE materials as well as control electrodes.
0
0.05
0.1
0.15
0.2
0.25
27
wt%
1N
32
wt%
1N
50
wt%
1N
53
wt%
1N
42
wt%
2N
47
wt%
2N
68
wt%
2N
57
wt%
3N
66
wt%
3N
70
wt%
3N
Cu
rre
nt
De
nsi
ty (
A c
m-2
)
0
0.05
0.1
0.15
0.2
0.25
Pt/C Cat Bare CFP 27 wt%1N
47 wt%2N
57 wt%3N
Cu
rre
nt
De
nsi
ty (
A c
m-2
)

129
The CCE materials showed different responses to varying the silane compositions. The
CuCl oxidation process was shown to be related to the total capacitance of the electrode surface
independent of the silane precursor used (Figure 4-46). In addition to this the total capacitance
was shown to be related to the silane content and much more accurately to the total amine
content in the CCE (Figure 4-43). This relationship between the amine content and capacitance
can be attributed to increased ionic conductivity from the charged amine groups within the CCE
as well as increased wettability of the carbon surface by the surface bound hydrophilic groups.
The increased ionic conductivity from the amine content should also help balance the resistive
nature the sol-gel back bone imparts on the CCE structure. While there is not a clear best
material of those tested, the increase in capacitance with amine content and the increase in
current with capacitance leads to the 3N materials being good candidates for future
investigations.

130
Chapter 5 : Materials Durability and Copper Crossover Resistance

131
Cell durability was a problem of particular importance during our experiments. Copper
crossover represents either the total failure of the Nafion membrane or the plating of Cu+ as Cu0
at the cathode electrode4. This copper plating causes a shift in the potential for the hydrogen
evolution reaction (HER) at the cathode43. The cathode reaction is also used as the cell’s internal
reference electrode, so altering the reaction’s chemical potential will alter at what potential the
reaction is held. Beyond the change in potential for the reaction, the Cu plating has also been
shown to remove or obscure existing Pt catalyst sites. This was shown through high resolution
transmission electron microscopy (TEM) (Figure 5-1). The initial structure of the cathode
catalyst shows a high surface area carbon structure with Pt nanoparticles evenly dispersed
across the surface. The structure is visibly different after Cu crossover was identified and the
MEA was considered spent. There was a significant, and sometimes complete, decrease in the
prevalence of the Pt nano particles. This supports the assumption that Cu plating is either
destroying or obscuring the Pt catalyst sites.
Figure 5-1: 18000x magnification TEM image of Pt/C cathode catalyst before operation (A) and after Cu plating had
occurred (B).
Further proof of the Cu crossover and plating can be seen in SEM images. Images of the spent
cathode and membrane were taken to examine the Cu deposition (Figure 5-2). There is clear
evidence of dendritic structures forming on the surface of the electrode caused by copper
crossover and plating. The membranes and electrodes were also visibly plated with copper after
copper crossover was identified (Figure 5-3).
A B

132
Figure 5-2: SEM Images of Cu Dendrites grown on 0.3 mg Pt cm-2
catalyst cathode (A) and Cu metal impregnated
into the Nafion 115 PEM (B) after electrolysis cell failure.
Figure 5-3: Picture of 0.3 mg Pt cm-2
catalyst cathode (A) and cathode side of the Nafion 115 PEM (B) for the CuCl-
HCl electrolysis process after significant Cu crossover and plating has occurred (Red/brown colour is Cu metal).
5.1: Copper Crossover Identification Copper plating at the cathode creates a transient current response that can be observed
during cell operation. The crossover current is more easily identified during potentiostatic
holds. In an ideal case, the cell will operate at a standard current associated with both the
potential applied as well as the materials used. The apparent maximum current that was
observed for the cell testing was approximately 0.2 – 0.25 A cm-2 at 0.7 V vs. RHE cell potential
with standard electrolyte solutions supplied to the electrode at a rate of 60 mL min-1. Sustained
operation of the cell above this current was taken to be a sign of copper crossover. Additionally,
A B
A B
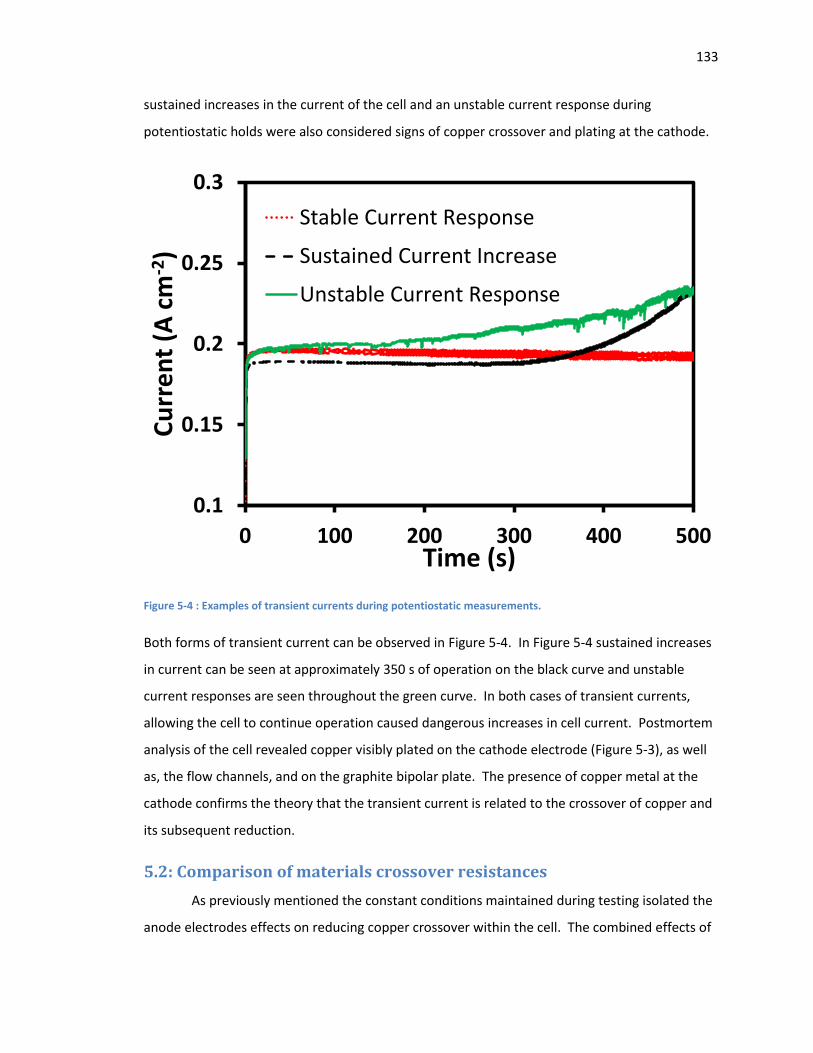
133
sustained increases in the current of the cell and an unstable current response during
potentiostatic holds were also considered signs of copper crossover and plating at the cathode.
Figure 5-4 : Examples of transient currents during potentiostatic measurements.
Both forms of transient current can be observed in Figure 5-4. In Figure 5-4 sustained increases
in current can be seen at approximately 350 s of operation on the black curve and unstable
current responses are seen throughout the green curve. In both cases of transient currents,
allowing the cell to continue operation caused dangerous increases in cell current. Postmortem
analysis of the cell revealed copper visibly plated on the cathode electrode (Figure 5-3), as well
as, the flow channels, and on the graphite bipolar plate. The presence of copper metal at the
cathode confirms the theory that the transient current is related to the crossover of copper and
its subsequent reduction.
5.2: Comparison of materials crossover resistances
As previously mentioned the constant conditions maintained during testing isolated the
anode electrodes effects on reducing copper crossover within the cell. The combined effects of
0.1
0.15
0.2
0.25
0.3
0 100 200 300 400 500
Cu
rre
nt
(A c
m-2
)
Time (s)
Stable Current Response
Sustained Current Increase
Unstable Current Response

134
the thickness of the CCE layer as well as the silane content are expected to contribute to the
overall copper crossover resistance that the anode provided. When the main family of materials
was compared, the constant carbon loading allowed for comparison of the materials based on
their silane content while the varied CCE loading materials allowed for comparison based on
their carbon loading. Observations of each material’s ability to resist the crossover of copper
was made during normal cell operation (Table 5-1). The time of each MEA’s failure was
compared to assess their relative abilities’ to resist copper crossover. During the extent of the
full-cell testing, there were significant changes to the overall testing protocol and additionally
variations in the current response. These changes affected the environment in which the cell
was operating. To normalize for this variation the total charge over the operation of the cell was
integrated for comparison. Both the total operation time and total operation charge are
compiled in Table 5-1.
Table 5-1: Bare CFP and CCE materials for full-cell electrolysis: Cu crossover resistance and sample compositional
information.
Sample Code Silane Type mMol Silane gCarbon -1- Time Total (s) Charge ( C)
B1P73S2 1N 3.39 5970 6632
B1P69S1 1N 4.36 3087 4004
B1P69S2 1N 9.36 1143 1876
B1P69S3 1N 10.44 3724 7772
B1P81S1 2N 4.81 2575 2961
B1P81S2 2N 5.70 2107 2138
B1P83S1 2N 13.76 2171 2489
B1P85S2 3N 6.86 3311 2948
B1P85S1 3N 10.01 8162 8509
B1P85S3 3N 11.80 2873 2665
Bare CFP Bare CFP N/A 2024 1850
The total time of the cell operation was taken as the time the cell spent operating under
load with the standard CuCl/HCl anolyte supplied to the anode. Time spent while the cell
operated in the absence of Cu was discarded as there was no source of cationic copper to
permeate the membrane. Additionally, time spent while no current passed through the cell,
specifically open circuit potential holds, were also discarded as it was assumed that there would
be no significant concentration of cationic copper to drive crossover. The charge values were
determined by numerical integration of the current signal with respect to time using the
135
trapezoidal rule. A time step of 0.5 s integrated over scale thousands of seconds ensured an
accurate determination of the total charge value. As with the total cell operation time, the
portions of cell operation where no current was flowing or no copper was present at the anode
were discarded for the total charge integration.
When comparing the total cell operation time it can be seen in Table 5-1 that the bare
carbon fiber paper control is out lasted by all of the materials tested with the exception of
B1P69S2, the CCE with the second highest molar loading of 1N silane (Figure 5-5). A greater
performance difference can be observed when the total charge of the materials is compared.
The bare carbon fiber paper is outperformed by all of the CCE materials with respect to the total
charge before failure. It is visible that the 1N materials showed the largest spread in material
performances, with a much more varied performance when compared to the 2N and 3N
materials. This difference is likely due to the previously mentioned changes in testing protocol.
For the 1N materials a series of galvanostatic tests at 0.1 A cm-2 and varied flow rates were also
performed. This low current density test potentially allowed for increased cell duration while
more rigorous cell testing would have decreased its operational lifetime. Conversely, a more
consistent testing and protocol was employed for the 2N and 3N materials as well as the bare
CFP control. Between the 2N and 3N materials, there was a much closer distribution observed.
With the exception of 66 wt% 3N sample (B1P85S1) operating to a total charge above
8000 C, the 2N and 3N materials show a relatively narrow distribution. In fact, with a Q test
value of 0.870 the charge at crossover value for the 66 wt% 3N sample (B1P85S1) can be
discarded as an outlier with 99% confidence. With this in mind the average total charge at
crossover for the 2N and 3N materials is 2640 C and the Bare CFP sample falls more than two
standard deviations below this value (at 1850 C total). It is important to note that no duplicate
runs of the CCE or CFP control materials were made. While it is possible to say that the 2N and
3N materials performed better than the CFP control material, variation of individual materials
over multiple runs was not taken into account. Additionally, while the overall effect of CCE
materials on inhibiting copper crossover can be observed, the specific effects of each material
cannot be identified accurately.

136
Figure 5-5: Total charge at time of cell failure for CCE materials and Bare CFP control.
5.3: Cell Regeneration
During cell operation, to prolong the testing of the cell, two “cell regeneration”
techniques were developed and employed. The primary cause of cell failure as discussed in 5.1
and 5.2 is copper crossover and plating at the cathode. In future work, high concentration HCl
can be used to inhibit the plating of copper at the cathode electrode. In our electrolysis cell
because the aim is not to produce extended tests, but rather to compare materials, only DI H2O
was supplied to the cathode. By replacing the cathode liquid with 2 M HCl and circulating for
periods of time up to 2 hrs, the plated copper was dissolved into solution regenerating the
cathode electrode for further testing. In this testing the flow of the HCl solution was kept
constant and the cell was purged of liquid at the cathode prior to restarting circulating deionized
H2O. These precautions allowed us to reliably dissolve and then finally remove plated Cu from
the cathode of the electrode. In addition to this, to regenerate the electrode, a potential of 0 V
0 2000 4000 6000 8000 10000
27 wt% 1N
32 wt% 1N
50 wt% 1N
53 wt% 1N
42 wt% 2N
47 wt% 2N
68 wt% 2N
57 wt% 3N
66 wt% 3N
70 wt% 3N
Bare CFP
Charge (C)

137
vs. RHE was held while current was allowed to flow from the “Cathode” to the “Anode”,
allowing reduction at the CuCl containing “Anode” electrode. When this occurs the plated
copper becomes oxidized and dissolves into the catholyte. This also allows for a successful
regeneration of the full-cell, however, the Cu metal is simply dissolved into the catholyte
allowing for potential redeposition during cell operation. The 0 V hold technique allows for
much shorter regeneration times with successful runs as short as 5 minutes.
A long term experiment was performed to assess the 0 V hold technique’s ability to
repeatedly regenerate the cathode electrode and with it cell function (Figure 5-6). During the
cell potentiostatic conditions were employed with 60 mL min-1 electrolyte flow and a cell
potential of 0.7 V vs. RHE. For regeneration the cell potential was adjusted to 0 V vs. RHE while
the flow was kept the same conditions as during the potentiostatic holds. Initial testing was
performed after the cell had experienced crossover and regeneration by chemical means. The
baseline current for the cell was initially recorded at approximately 0.13 A cm-2. This current
already represents a decrease from the best performing current response recorded for the
tested material. This decrease is assumed to be because of degradation at the cathode
electrode from previous cell testing. Cell operation was held constant with switches to 0 V holds
when there was evidence of copper crossover occurring within the MEA. The cell regeneration
technique worked in three repeated instances, returning the cell’s current response to
approximately the standard value. As the cycles were increased the operation time until
crossover was detected shortened. This is likely due to an increase in total copper
concentration in the catholyte liquid. After the regenerations were discontinued, sustained
copper crossover was observed over the final approximately 200 min showing the sustained
increases in current from copper crossover.

138
Figure 5-6: Example crossover and cell regeneration of the 50 wt% 1N CCE (B1P69S2) during 0.7 V potentiostatic
holds (Red) with 0 V regeneration holds (Blue). Experiments performed in 0.2 M CuCl in 2 M HCl anolyte and DI
H2O catholyte both under N2 atmosphere at 60 mL min-1
electrolyte flow rate.
5.4: Ultra-Micro Electrode Measurements
In pursuit of a simple method to measure copper crossover the use of ultra-micro
electrodes for copper concentration measurements was investigated. Initially the ultra-micro
electrodes were investigated for their abilities to discern between Cu(I) and Cu(II) allowing the
percent conversion of Cu(I) to Cu(II) in the anolyte solutions to be determined. The complexity
of the electrochemical signal prevented this from being accurately determined, however,
further work was done to examine the ability to detect total copper concentration. The
hemispherical diffusion and low operating currents of the ultra-micro electrode allow for it to
maintain a steady state current that is linearly related to the concentration of the analyte in
solution39.
-0.3
-0.2
-0.1
0.0
0.1
0.2
0.3
0 5000 10000 15000 20000 25000
Cu
rre
nt
(A c
m-2
)
Time (s)
0.7 V Hold
0.0 V Hold

139
Figure 5-7: Linear sweep voltammetry from 0.1 to 1.0 V at 20 mV s-1
scan rate of CuCl at varied concentrations in 2
M HCl under N2 atmosphere.
In Figure 5-7 the scan from 0.1 to 1.0 V vs. RHE was taken to include the Cu(I) oxidation at
approximately 0.4 V vs. RHE. This was performed on a series of solutions with known CuCl
concentrations allowing for the external calibration of the technique. Above 0.7 V vs. RHE the
current response from the Cu(I) oxidation obeyed a steady state behavior. The plateau current
showed a proportion to the copper concentration decreasing with the decreasing copper
content. The anodic current response was determined for each solution tested and plotted
relative to the concentration of copper in Figure 5-8. Overall the maximum anodic current in
the LSV measurement shows a very linear relationship to the concentration of the copper in the
anolyte. This method allows for the overall determination of the concentration of copper with a
current lower detection limit of 1 mMol Cu or 60 ppm. Notably, the current tested detection
limit is orders of magnitude higher than that of a conventional absorption based analytical
technique, but has the potential to be operated in situ for constant online monitoring of
catholyte copper content.
-0.20
0.00
0.20
0.40
0.60
0.80
1.00
0 0.2 0.4 0.6 0.8 1
Cu
rre
nt
(µA
)
Potential (V vs. RHE)
0.2 M CuCl0.1 M CuCl0.05 M CuCl0.02 M CuCl0.01 M CuCl0.005 M CuCl0.001 M CuCl

140
Figure 5-8: Relationship between Cu concentration in 2 M HCl and current amplitude. Low concentration values
expanded and inset. Data taken from Figure 5-7.
To determine the concentration of CuCl without an external set of standards the current
can be related to the total copper concentration via Equation 5-139.
Equation 5-1
In Equation 5-1 the current iD is related to the concentration (C), the radius of the electrode (r0),
the diffusion coefficient for the species in question in the electrolyte, Faradays constant, and
finally the number of electrons involved in the redox process (n). With this information the
concentration can be determined without the need to prepare external standards. From this,
ultra-micro electrodes show promise for the in-situ determination of Cu concentration within
the full-cell system.
y = 4.88x + 0.0061R² = 0.9987
0.00
0.20
0.40
0.60
0.80
1.00
1.20
0.00 0.05 0.10 0.15 0.20 0.25 0.30
Cu
rre
nt
(µA
)
Cu Concentration (mol L-1)
0.00
0.05
0.10
0 0.01 0.02

141
Chapter 6 : Conclusions and Future Directions

142
6.1: Conclusions In this thesis we produced and characterized a number of CCE materials for the CuCl-HCl
electrolysis step of the hybrid three step CuCl-HCl thermochemical cycle. The materials were
produced using a standard amount of high surface area carbon (Vulcan XC-72) and varied
amounts of three silane precursors. The silane precursors were (3-Aminopropyl) triethoxysilane,
N-[3-(Trimethoxysilyl)propyl]ethylenediamine, and N1-(3-Trimethoxysilylpropyl)
diethylenetriamine listed as 1N, 2N and 3N respectively. These materials were chosen for their
amine functionalities which were intended to provide increased ionic conductivity. A definite
increase in ionic conductivity with increased silane content was not observed in the EIS
measurements. This can be partially attributed to the finite transmission line model not
allowing us to distinguish between the electronic and ionic resistance in our CCE materials.
These two forms of resistance should have opposite correlations with silane content. The
increase in the amine functionalities of the silane backbone did show a good linear correlation
with increased overall capacitance and to a lesser degree the operational current during
potentiostatic holds.
The CCE materials were physically characterized through both TGA measurements and
SEM imaging. All of the materials showed general stability up to 300 °C before a mass loss
attributed to the degradation of the functionalities was seen. Beyond this the materials were
shown to be stable up to 600 °C in air before combusting. The full-cell materials were imaged
using an SEM. The imaging showed that there was a decrease in surface homogeneity with
increased silane content (Figure 4-3, Figure 4-24, and Figure 4-25). This was expected as the
increased silane content provides increased binding capabilities.
The half-cell electrolysis experiments showed similar activity for CuCl electrolysis when
materials produced with 1N, 2N, or 3N silane precursors were tested. Within the tests it was
shown that the best performing material contained the 1N silane. While this would normally
indicate that the 2N and 3N materials should be ignored for full-cell electrolysis, the loadings of
the materials were all quite high so further full-cell analysis was performed with 2N and 3N
materials using lower loadings of silane.
In the full-cell electrolysis cell the CCE materials all showed similar behaviors. The
overall best material was shown to be produced from 3N silane precursors. When normalized
for the mass of carbon present the 3N materials showed the best overall performance with the

143
1N and 2N materials showing similar and lower activities for CuCl electrolysis. A mixture of
trends for mass normalized current and silane content were observed for the CCE materials.
This is explained by the variation in the ionic conductivity provided by the amine functionalities
countering a constant electronic resistance from the silicate backbone. In addition to the
electrolysis measurements the CCE materials were characterized with respect to the total silane
and amine content. A linear relationship between the amine content and the total capacitance
was seen. There was also a linear relationship between the total capacitance and the current
response recorded for CuCl-HCl electrolysis.
All but one of the CCE materials was shown to outperform the bare CFP control for the
resistance of copper crossover. Beyond the increase in the resistance there was no clear trend
in the materials’ ability to resist copper crossover. For the resistance of copper crossover we
developed a method to electrochemically regenerate the cathode surface. After an initial
current drop, the regeneration was shown to return transient current signals to a consistent
stable level. Finally, we also examined the use of an ultra-micro electrode for the detection of
copper crossover at the anode. Signals for Cu concentrations as low as 60 ppm were recorded.
This technique is still outstripped by analytical spectroscopic techniques such as flame atomic
adsorption but it has the unique advantage of being an in situ method that requires no
advanced sample preparation.
When compared to work done by Balashov et al. in 2011 we see that our materials show
comparable and better current responses compared to the best materials produced20. The best
materials show comparable current densities to those listed as an interim DOE goal, though the
operational time for our materials is far below the target or 168 hrs25,26. Of most importance,
the data we collected was in the absence of a Pt catalyst at the anode. The cited works have all
used Pt catalyst anode materials.
In conclusion we produced a series of CCE materials with varied silane types and
contents. The materials were tested in a full-cell liquid electrolysis test station. All of the
materials showed increased activity towards CuCl oxidation when compared to the bare CFP
control. In addition to this a selection of the materials also showed comparable activities to a
standard Pt/C catalyst material without the use of any precious metals.

144
6.2: Future Directions The further characterization of the CCE materials is an important future direction for the
development of new and better electrode for CuCl oxidation in the CuCl-HCl electrolysis step.
When compared to other members of the CuCl-HCl project the cell used for the discussed
measurements was operated in comparatively benign conditions with regards to flow rate,
temperature, and electrolyte composition. Further testing at elevated temperatures would
allow for better reaction kinetics and from that a better overall current response from our
materials. It was shown in the potentiostatic measurements that the current response has a
positive linear relation to increased flow rate. With this modification, while it is promising, it has
also been shown that the overall increases in current with electrolyte flow rate will eventually
plateau. With this in mind, we the full-cell is still being operated at flow rates well below other
members of the research project and the increases in flow rate should still afford increased
current response. Both of these modifications to the process simply represents better reaction
kinetics and a higher effective concentration of CuCl at the anode. There are still simple
methods to improve the overall performance of the materials that have been have produced.
The most notable difference in the cell operation when compared to the collaborators
who focus on the electrochemical step is the electrolyte composition, the catholyte was kept as
pure water as opposed to acid and the anolyte was a comparatively dilute CuCl and HCl
solution20,21. By increasing the CuCl concentration in the anolyte there should be an increase in
current response. Again, this is simply by an improvement in the effective concentration of CuCl
at the anode electrode. Increasing the HCl concentration is partly required to help solvate an
increased CuCl concentration. In addition to this, the HCl should provide assistance to the
oxidation of the CuCl by increasing the available Cl- concentration. Finally, adding HCl to the
catholyte has two potential benefits. The first is that it will improve the overall current response
by improving the cathode reduction reaction. The increased H+ concentration will allow for
faster reaction kinetics. In addition to this, the HCl concentration helps maintain cell
performance in the presence of contaminate Cu+ by keeping it in solution as CuCl. This is shown
qualitatively by the operation of other CuCl electrolyzer operating with HCl at the cathode. This
is also shown through a pourbaix diagram investigation of CuCl speciation by
Beverskog et al 44-46.

145
An easy direction to take in this research would be to test the effects of a cloth CCE
backing. The increased wettability of the carbon cloth would potentially provide increased
diffusion of the CuCl species to the electrode surface. Currently, every CCE material tested has a
companion material produced on carbon cloth. With these materials it would be simple to test
and compare the effects of the carbon cloth backing.
There are a number of other improvements that could be made to the CCE materials
that were produced. First there is an indication that at lower silane content of the 1N material
there should be an improvement in current response (Figure 4-14). This is mirrored by the trend
that shows increased current response at higher 3N silane contents (Figure 4-45). These trends
could be examined by producing new materials with either lower 1N content or higher 3N
content. It has also been established that there appears to be an increase in capacitance with
higher amine content (Figure 4-43). From this it would be interesting to further expand these
tests to include novel silanes with increased amine functionalities.
Novel CCE materials have been produced containing sulfonate groups in our research
group47,48. It was shown that the optimal composition of those CCE materials was produced
from a mix of functionalized silane precursor and unfunctionalized TEOS. From this knowledge it
would be useful to synthesize a series of CCEs with a mixture of the amine functionalized silanes
and TEOS as precursors to investigate the effects of the silicate backbone in combination with
the protonated amine functionalities.
Ultimately the future directions of this project can be summarized in the following way.
The improvement of the electrolysis testing conditions to provide a more aggressive
environment for the oxidation of CuCl, and to limit Cu+ plating. Additionally, it would be useful
to further investigate the effects of carbon cloth, silane type, and silane content on the CCE
materials. Both of these suggestions could be performed simply, with little additional research
required.

146
Chapter 7 : References

147
1. Holladay JD, Hu J, King DL, Wang Y. An overview of hydrogen production technologies. Catal
Today. 2009;139(4):244-260. doi: 10.1016/j.cattod.2008.08.039.
2. Turner J, Sverdrup G, Mann MK, et al. Renewable hydrogen production. Int J Energy Res.
2008;32(5):379-407. doi: 10.1002/er.1372.
3. Barbir F, Gomez T. Efficiency and economics of proton exchange membrane (PEM) fuel cells.
Int J Hydrogen Energy. 1996;21(10):891-901. doi: 10.1016/0360-3199(96)00030-4.
4. Naterer GF, Suppiah S, Stolberg L, et al. Canada's program on nuclear hydrogen production
and the thermochemical cu-cl cycle. Int J Hydrogen Energy. 2010;35(20):10905-10926. doi:
10.1016/j.ijhydene.2010.07.087.
5. Hino R. Nuclear hydrogen production handbook<br />. New York: CRC Press; 2011.
6. Carrette L, Friedrich K, Stimming U. Fuel cells: Principles, types, fuels, and applications.
Chemphyschem. 2000;1(4):162-193. doi: 10.1002/1439-7641(20001215)1:4<162::AID-
CPHC162>3.0.CO;2-Z.
7. Utgikar V, Thiesen T. Life cycle assessment of high temperature electrolysis for hydrogen
production via nuclear energy. Int J Hydrogen Energy. 2006;31(7):939-944. doi:
10.1016/j.ijhydene.2005.07.001.
8. Hydrogenics, shift power energize your world. http://www.hydrogenics.com/. Accessed
July/1, 2013.
9. Proton onsite: The leader in onsite gas generation. http://www.protononsite.com/. Accessed
July/1, 2013.

148
10. McQuillan B, Brown L, Besenbruch G, et al. High efficiency generation of hydrogen fuels
using solar thermochemical splitting of water. annual report. . 2002.
11. Lewis M, Taylor A. High temperature thermochemical processes. DOE hydrogen program.
annual progress report. . 2006:182.
12. Onuki K, Kubo S, Terada A, Sakaba N, Hino R. Thermochemical water-splitting cycle using
iodine and sulfur. Energy Environ Sci. 2009;2(5):491-497. doi: 10.1039/b821113m.
13. Staser JA, Weidner JW. Effect of water transport on the production of hydrogen and sulfuric
acid in a PEM electrolyzer. J Electrochem Soc. 2009;156(1):B16-B21. doi: 10.1149/1.3001923.
14. Fatih K, Wilkinson DP, Moraw F, Ilicic A, Girard F. Advancements in the direct hydrogen
redox fuel cell. Electrochemical and Solid State Letters. 2008;11(2):B11-B15. doi:
10.1149/1.2812788.
15. Ranganathan S, Easton EB. High performance ceramic carbon electrode-based anodes for
use in the cu-cl thermochemical cycle for hydrogen production. Int J Hydrogen Energy.
2010;35(3):1001-1007. doi: 10.1016/j.ijhydene.2009.11.077.
16. Naterer GF, Suppiah S, Stolberg L, et al. Clean hydrogen production with the cu-cl cycle -
progress of international consortium, II: Simulations, thermochemical data and materials. Int J
Hydrogen Energy. 2011;36(24):15486-15501. doi: 10.1016/j.ijhydene.2011.08.013.
17. Naterer GF, Suppiah S, Stolberg L, et al. Progress of international hydrogen production
network for the thermochemical cu-cl cycle. Int J Hydrogen Energy. 2013;38(2):740-759. doi:
10.1016/j.ijhydene.2012.10.023.

149
18. Ranganathan S, Edge PSR, Easton EB. Evaluation of anode electrode materials for cu-cl/HCl
electrolyzers for hydrogen production. Electrochemical Energy Summit - an International Summit
in Support of Societal Energy Needs. 2012;41(31):111-120. doi: 10.1149/1.3702861.
19. Gilbert T, Kirss R, Davies G. Appendix 6 standard reduction potentials. In: Chemistry the
science in context. New York: Norton; 2004:A-28.
20. Balashov VN, Schatz RS, Chalkova E, Akinfiev NN, Fedkin MV, Lvov SN. CuCl electrolysis for
hydrogen production in the cu-cl thermochemical cycle. J Electrochem Soc. 2011;158(3):B266-
B275. doi: 10.1149/1.3521253.
21. Stolberg L, Boniface H, McMahon S, Suppiah S, York S. Development of the electrolysis
reactions involved in the cu-cl thermochemical cycles. . 2009:167.
22. Lewis M, Masin J, Vilim R. Development of the low temperature cu-cl thermochemical cycle.
. 2005.
23. Stolberg L, Boniface H, McMahon S, Suppiah S, York S. Electrolysis of the CuCl/AHCl aqueous
systerm for the production of nuclear hydrogen. . 2008:1.
24. Ranganathan S, Easton EB. Ceramic carbon electrode-based anodes for use in the cu-cl
thermochemical cycle. Int J Hydrogen Energy. 2010;35(10):4871-4876. doi:
10.1016/j.ijhydene.2009.08.085.
25. Lewis M. Electrolyzer development for the cu-cl thermochemical cycle. . 2013.
26. Lvov S. Electrolyzer development for the cu-cl thermochemical cycle. . 2012.

150
27. Naterer G, Suppiah S, Lewis M, et al. Recent canadian advances in nuclear-based hydrogen
production and the thermochemical cu-cl cycle. Int J Hydrogen Energy. 2009;34(7):2901-2917.
doi: 10.1016/j.ijhydene.2009.01.090.
28. Ranganathan S, Easton EB. Novel ceramic carbon electrode (CCE) materials for CuCl
electrolysis. . 2008.
29. Brinker C, Scherer G. Sol-gel science: The physics and chemistry of sol-gel processing.
Sandiego, CA: Academic Press; 1989.
30. Scherer G, Brinker C. Sol-gel technology. In: Bergna H, Roberts W, eds. Colloidal silica
fundamentals and applications. Vol 131. CRC Press; 2005:613.
31. Lev O, Wu Z, Bharathi S, et al. Sol-gel materials in electrochemistry. Chemistry of Materials.
1997;9(11):2354-2375. doi: 10.1021/cm970367b.
32. Ranganathan S, Easton EB. High performance ceramic carbon electrode-based anodes for
use in the cu-cl thermochemical cycle for hydrogen production. Int J Hydrogen Energy.
2010;35(3):1001-1007. doi: 10.1016/j.ijhydene.2009.11.077.
33. Eastcott JI, Easton EB. Electrochemical studies of ceramic carbon electrodes for fuel cell
systems: A catalyst layer without sulfonic acid groups. Electrochim Acta. 2009;54(12):3460-3466.
doi: 10.1016/j.electacta.2009.01.007.
34. Qi ZG, Pickup PG. High performance conducting polymer supported oxygen reduction
catalysts. Chemical Communications. 1998(21):2299-2300. doi: 10.1039/a805322g.

151
35. Maleki N, Safavi A, Tajabadi F. High-performance carbon composite electrode based on an
ionic liquid as a binder. Anal Chem. 2006;78(11):3820-3826. doi: 10.1021/ac060070+.
36. Pedersen AW, Pauric AD, Eastcott JI, Easton EB. Proton conductivity within fuel cell
electrodes containing a sulfonated carbon support. Fuel Cell Membranes, Electrode Binders, and
Mea Performance. 2010;28(27):39-49. doi: 10.1149/1.3496611.
37. Collinson M. Sol-gel strategies for the preparation of selective materials for chemical
analysis. Crit Rev Anal Chem. 1999;29(4):289-311. doi: 10.1080/10408349891199310.
38. Rabinovich L, Lev O. Sol-gel derived composite ceramic carbon electrodes. Electroanalysis.
2001;13(4):265-275. doi: 10.1002/1521-4109(200103)13:4<265::AID-ELAN265>3.3.CO;2-U.
39. Bard A, Faulkner L. Electrochemical methods fundamentals and applications. Hoboken, NJ:
John Wiley and Sons Inc; 2001:833.
40. Loveday D, Peterson P, Rodgers B. Evaluation of organic coatings with electrochemical
impedance spectroscopy part 1: Fundamentals of EIS. ; 2004:46.
41. Li G, Pickup P. Ionic conductivity of PEMFC electrodes - effect of nafion loading. J
Electrochem Soc. 2003;150(11):C745-C752. doi: 10.1149/1.1611493.
42. Lefebvre M, Qi ZG, Rana D, Pickup PG. Chemical synthesis, characterization, and
electrochemical studies of poly(3,4-ethylenedioxythiophene)/poly(styrene-4-sulfonate)
composites. Chemistry of Materials. 1999;11(2):262-268. doi: 10.1021/cm9804618.

152
43. Nishihara C, Nozoye H. Underpotential deposition of copper on pt(s)-[N(111)x(100)]
electrodes in sulfuric-acid-solution. J Electroanal Chem. 1995;386(1-2):75-82. doi: 10.1016/0022-
0728(94)03803-B.
44. Beverskog B, Puigdomenech I. Pourbaix diagrams for the system copper-chlorine at 5–100
°C. . 1998;98:19.
45. Beverskog B, Pettersson S. Pourbaix diagrams for copper in 5 m chloride solution. . 2002;23.
46. Beverskog B, Puigdomenech I. Revised pourbaix diagrams for copper at 25 to 300 degrees C.
J Electrochem Soc. 1997;144(10):3476-3483. doi: 10.1149/1.1838036.
47. Eastcott JI, Yarrow KM, Pedersen AW, Easton EB. Fuel cell electrode structures containing
sulfonated organosilane-based proton conductors. J Power Sources. 2012;197:102-106. doi:
10.1016/j.jpowsour.2011.09.023.
48. Eastcott JI, Powell JA, Vreugdenhil AJ, Easton EB. Electrochemical and morphological studies
of ceramic carbon electrodes for fuel cell systems. Polymer Electrolyte Fuel Cells 11.
2011;41(1):853-864. doi: 10.1149/1.3635619.

153
Chapter 8 : Appendices

154
Colloidal silica : fundamentals and applications
Billing Status:
N/A
Order detail ID:64432158
ISBN:978-0-8247-0967-9
Publication Type:Book
Publisher:TAYLOR & FRANCIS GROUP LLC
Author/Editor:BERGNA, HORACIO E.
Permission Status: Granted
Permission type:Republish or display content
Type of use:Republish in a thesis/dissertation
Order License Id: 3325621403378
Hide details
o
Requestor type Academic institution
Format Print, Electronic
Portion chart/graph/table/figure
Number of charts/graphs/tables/figures
1
Title or numeric reference of the portion(s)
FIGURE 47.1 Illustration of the various stages of the sol–gel process.
Title of the article or chapter the portion is from
Sol–Gel Processing of Silica
Editor of portion(s) N/A
Author of portion(s) George W. Scherer, C. Jeffrey Brinker
Volume of serial or monograph
N/A
Page range of portion 616
Publication date of portion 2006
Rights for Main product
Duration of use Life of current edition
Creation of copies for the disabled
no
With minor editing privileges no
For distribution to Worldwide
In the following language(s) Original language of publication
With incidental promotional use
no
Lifetime unit quantity of new product
0 to 499
Made available in the following markets
Academic
The requesting person/organization
Patrick Edge, University of Ontario Institute of Technology
Order reference number

155
Author/Editor Patrick Edge
The standard identifier None Available
Title The Production and
Characterization of Ceramic Carbon Electrode Materials for CuCl-HCl Electrolysis
Publisher University of Ontario Institute of Technology
Expected publication date Feb 2014
Estimated size (pages) 165