the problems and prospects faced by pay-as-you-go ... · eco/wkp(99)7 4 the problems and prospects...
TRANSCRIPT

Unclassified ECO/WKP(99)7
Organisation de Coopération et de Développement Economiques OLIS : 10-May-1999Organisation for Economic Co-operation and Development Dist. : 20-May-1999__________________________________________________________________________________________
English text onlyECONOMICS DEPARTMENT
THE PROBLEMS AND PROSPECTS FACED BY PAY-AS-YOU-GOPENSION SYSTEMS : A CASE STUDY OF GREECEECONOMICS DEPARTMENT WORKING PAPERS N0. 215
byPaul Mylonas and Christine de la Maisonneuve
Unclassified
EC
O/W
KP
(99)7E
nglish text only
Most Economics Department Working Papers beginning with No. 144 are now available throughOECD’s Internet Web site at http://www.oecd.org/eco/eco.
77882
Document complet disponible sur OLIS dans son format d’origine
Complete document available on OLIS in its original format
ECO/WKP(99)7
2
ABSTRACT/RÉSUMÉ
Without further reforms, pay-as-you-go pension systems throughout most of continental Europeface unsustainable financial imbalances as their population ages. Though this paper describes the Greekpension system, which will face especially severe financial strains, it sheds light on the pension problemsof other continental European countries, as these countries’ systems share many common features. Themain focus of the paper is on the factors of the Greek pay-as-you-go system which result in its futureunsustainability. Exacerbating the deteriorating demographics, the system is characterised by verygenerous pensions relative to contributions for the pre-1993 generation of workers, as well as otherincentives/provisions to retire early. To highlight these facets, the study provides simulations of thegenerosity of different categories of individual pensions under different scenarios as well as projections ofaggregate pension expenditures and revenues. It concludes with options for reform.
**********
S’ils ne font pas l’objet de réformes supplémentaires, les systèmes de retraite par répartition de laplupart des pays d’Europe continentale vont être confrontés à des déséquilibres financiers non viables dusau vieillissement de la population. Ce document décrit le système grec de retraite qui va devoir faire face àdes difficultés financières particulièrement importantes. Cependant il expose aussi les problèmes dessystèmes de pension des autres pays d’Europe continentale puisque ces régimes ont de nombreusescaractéristiques communes. Le document analyse principalement les éléments du système grec de retraitepar répartition qui conduiront à sa non-viabilité future. Outre l’évolution démographique défavorable, lesystème se caractérise par la générosité des pensions au regard des cotisations pour les travailleurs entrésdans la population active avant 1993, ainsi que par d’autres incitations/dispositifs qui favorisent les départsen retraite anticipée. Pour mettre en évidence ces caractéristiques, l’étude présente des simulations qui fontétat de la générosité des différentes catégories de pensions individuelles, suivant différents scénarios, ainsique des projections des dépenses et des recettes du système de pension. Elle se termine par despropositions de réformes.
Copyright: OECD 1999Applications for permission to reproduce or translate all, or part of, this material should be made to:Head of Publications Service, OECD, 2 rue André-Pascal, 75775 PARIS CEDEX 16, France.

ECO/WKP(99)7
3
TABLE OF CONTENTS
I. Introduction............................................................................................................................. 4
II. Structure of the pension system .............................................................................................. 5
III. Microeconomic incentives result in high pensions relative to contributions .......................... 6
Private sector wage earners ................................................................................................... 6The self-employed ................................................................................................................... 7Public sector ........................................................................................................................... 8
IV. A comparison of the relative generosity of the main pension funds ....................................... 8
V. A brief theoretical discussion of a pay-as-you-go system..................................................... 11
VI. Modelling the pension system and projecting its evolution into the future .......................... 13
VII. Options for reform ................................................................................................................ 16
Annex I. Problems of accountability and inequity arise from excessive segmentation ....................... 20
Annex II. Historical overview of the Greek pension system................................................................. 22
Annex III. Pension projections: a description of the model................................................................... 30
Box 1 The main pension funds .......................................................................................................... 5
Box 2 Policies that raised pension expenditure during 1978-82...................................................... 23
Box 3 The 1990-92 reforms............................................................................................................. 26
Tables and Figures...................................................................................................................................... 33

ECO/WKP(99)7
4
THE PROBLEMS AND PROSPECTS FACED BY PAY-AS-YOU-GO PENSION SYSTEMS:A CASE STUDY OF GREECE
Paul Mylonas and Christine de la Maisonneuve 1
I. Introduction
1. Critical reforms to the pension system were undertaken in 1990-92 to stem its rapidlydeteriorating financial position. It was recognised at the time that these reforms would provide only sometemporary breathing space until more fundamental changes to the pay-as-you-go system could beimplemented. Indeed, unfavourable demographics -- worse than in most industrial countries -- combinedwith a still generous, but inequitable system, will soon expose the unsustainability of the situation again.The OECD Economic Survey of Greece (1997) included an extensive analysis of the problems plaguing theGreek pension system and presented long-term projections. It pointed to loose eligibility conditions,introduced mostly during the period 1978-85, combined with individual pension benefits which in generalfar exceed the corresponding contributions -- and foster early retirement and contribution evasion -- as themain shortcomings of the public pension system. Furthermore, the complexity and excessive segmentationof the system, combined with poor administration, were considered to permit abuses of the system. Thelong-term projections indicated that Greece’s pay-as-you-go system’s unfunded liabilities are among thehighest in OECD countries. The present value of future pension liabilities, net only of employer andemployee contributions, was estimated to be of the order of 200 per cent of GDP. The complexity and dataproblems of the Greek pension system introduce a greater than usual degree of uncertainty around thecentral projections. Nevertheless, the order of magnitude of the imbalance clearly indicates the need for anoverhaul of the pension system so as to better align individual pension benefits with contributions and atthe same time provide adequate income security in retirement, especially for the elderly poor.
2. Following the introduction of a small reform in December 1998, comprising mostlyorganisational changes, a more fundamental reform is envisaged after 2000. It is generally realised thatchanges cannot be postponed much longer, because many of them could take several decades to becomefully effective and if delayed they will be more onerous to implement. With policy debate approaching acritical juncture, this paper aims to further the analysis presented in the OECD Survey. It delves deeperinto the underpinnings of many of the results of the long-term projections, as well as presenting a detailedanalysis of the individual generosity of the major pension regimes. It also adds an alternative, moreintuitive, explanation of the magnitude and sources of the system’s imbalances based on simple relationsfor equilibrium in a pay-as-you-go system. The second section describes the pension system. The thirdsection analyses the microeconomic incentives imbedded in the system. The fourth section attempts toquantify the relative generosity of the different types of pension regimes, including those for earlyretirement. The fifth presents a brief theoretical explanation of the disequilibrium in the pay-as-you-gosystem. The final two sections contain, respectively, the projections and review reform options.
1. Paul Mylonas was the principal administrator on the Greek and Spanish Desk when this paper was written.
Christine de la Maisonneuve was the research assistant, and contributed significantly to the modelling ofthe pension system. This paper furthers the analysis of the Greek pension system that was presented in theOECD Economic Survey of Greece (1997). Special gratitude goes to Platon Tinios for his many valuableinsights into the Greek pension system. The assistance of the Greek authorities is gratefully acknowledged,and especially that of Kyriakos Anagnostopoulos of the Ministry of Labour and Social Services. Thanksfor comments go to Doug Fore, Peter Hoeller, Isabelle Joumard, Val Koromzay, Stephen Potter, andDeborah Roseveare and to Celia Rutkoski, Hervé Bource and Paula Simonin for help with the text.

ECO/WKP(99)7
5
II. The structure of the pension system
3. Pensions are provided almost exclusively by the public sector, and there is very limited recourseto private pensions.2 Public pensions are provided through a plethora of funds, which have the status ofpublic entities and form part of the general government sector (Box 1). The funds offer defined-benefitsbased on employer and employee contributions. Though the funds are permitted to retain any existing cashsurpluses -- reflecting the system’s original conception as a funded system -- in total, these are not verysignificant and they generally operate as pay-as-you-go schemes.3 The large number of funds arises fromthe historical development of the pension system, whereby funds were created by individual sectors. Partlyas a result the benefit schemes offered by the funds, or even within the funds, differ. Workers are insuredby at least one primary fund but usually have supplementary coverage (which may be provided by aseparate fund). In addition, some workers contribute towards a lump-sum separation payment at the timeof retirement. Thus segmentation of the pension system is both horizontal across economic sectors andvertical among three levels of pension payments: primary, supplementary and separation payments.Annex I provides a description of the problems of accountability and inequity arising from excessivesegmentation of the pension system.
Box 1. The main pension funds
The public pension system is highly segmented and complex, containing over 300 funds, with many differentregulations for pension rights. The 28 primary pension funds and the system of public pensions can be classified byemployment category into five groups whose funds have broadly similar regulations concerning pension rights,though the differences among the five groups are substantial. These groups cover respectively: i) private sector wageearners (principally IKA), of which seamen (NAT) are an important subset; ii) farmers (OGA); iii) non-agriculturalself-employed (principally TEBE),4 of which another important subset covers professionals, such as doctors, lawyers,and engineers; iv) civil servants; and v) employees in public enterprises and state-owned banks. The large number ofsupplementary funds (over 200) were mostly created after the second world war to supplement the low level ofprimary pensions. Individually, these funds cover much smaller groups of workers than primary funds and are oftenbased on enterprise agreements. Two large supplementary funds were created in the 1980s: one to coverapproximately 50 per cent of private sector employees who did not have supplementary coverage, and a second foragricultural workers, who account for about 50 per cent of the self-employed. Consequently, only self-employedsmall entrepreneurs and traders do not have supplementary coverage.5 Separation pensions cover a smaller group ofworkers comprising mostly public employees, lawyers, doctors and since quite recently, a few groups of privatesector wage earners. Table 1 presents the major characteristics of the primary, supplementary and separation fundsthat correspond to each of the five categories of workers.
2. There are an estimated 35 000 group policies, providing insurance for employees in large, often
multinational, firms. Insurance companies attribute the low demand for private pensions to the generosityof the public pension system.
3. The social security funds as a whole hold financial and real estate assets equivalent to approximately 9 percent of GDP. The low level of savings reflects the deficit position of many funds and the placement of pastaccumulated surpluses in bank deposits which yielded negative real rates of return due to the existence ofinterest rate controls until 1989.
4. Under the 1998 reform, a new fund will replace the three large primary funds for the non-agricultural self-employed, with regulations resulting in a gradual convergence of pension benefits to the more generouslevels of the dominant fund in the grouping (TEBE).
5. The 1998 pension reform also unified the 12 supplementary funds for civil servants and the 48 funds forrural lawyers. Moreover, the 7 supplementary funds experiencing financial difficulties were merged withthe large supplementary fund for private sector employees (IKA-TEAM).

ECO/WKP(99)7
6
III. Microeconomic incentives result in high pensions relative to contributions
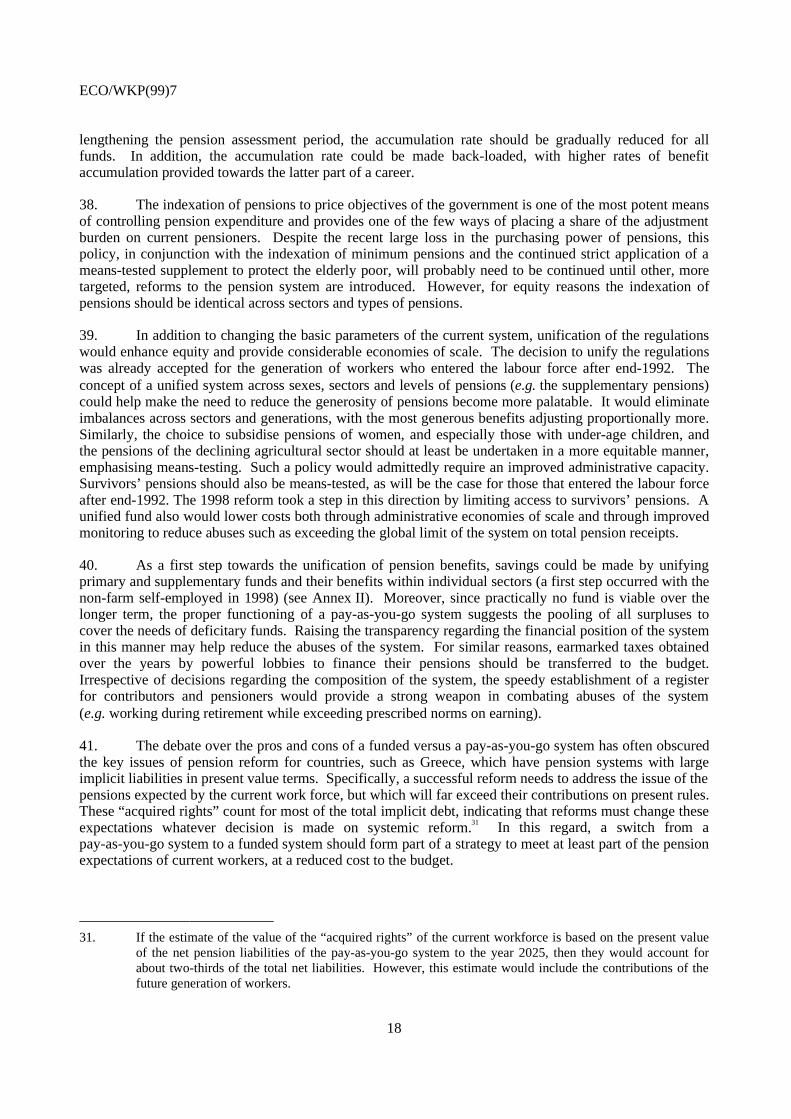
4. The complexity and segmentation of the pension system obscures the factors which are strainingits finances. Not surprisingly the common theme to all groups of funds is the generosity of individualpension payments relative to contributions. Nevertheless, pensioners (especially from the private sector)complain about low primary pensions, which equal slightly less than one-half the average wage. Thisparadox is resolved by the fact that contributions have been quite low in the past and often for shortperiods. In addition, pensions start at an early age—for employees, usually before the age of 55 in thepublic sector and near the age of 60 in the private sector (Table 2). Moreover, the existence ofsupplementary and multiple pensions, as well as dependency allowances, often raise a pensioner’s incomesubstantially. Annex II presents a brief description of the historical developments of the pension systemwhich have led to its unsustainability and an outline of the main accomplishments of the 1990-1992 and1998 reforms.
Private sector wage earners
5. The relative generosity of old-age pensions in the case of private sector wage earners (mainlyinsured by IKA) arises from two sources. First, the existence of a relatively high minimum pension inconjunction with a low eligibility requirement creates the incentive to retire after contributing for theminimum 15 years (recently raised from 13.5 years). The minimum pension offers a replacement ratewhich is equivalent to the one derived from the pension formula corresponding to 25 years of contributionsat the median income level (currently about 45 per cent) (Figure 1). 6 This relatively high replacement ratehas led to the startling number of new pensioners that retire with less than 20 years’ contributions andreceive the minimum pension.7 For new pensioners, the number of retirees receiving the minimum pensionrose to near 60 per cent from 1985 onwards, so that 70 per cent of the total stock of pensions is currently atthe minimum pension.8 The perverse incentive to retire at the minimum pension, with far less than thenormal 35 years of contributions, lowers the effective contribution rate by far more than the effectivereplacement rate (see section IV).
6. The second source of the relative generosity for private sector wage earners arises from theformula for determining an IKA pension. Generosity arises first from the short earning period used as abasis for determining a pension. In fact, the pension base is the shortest among OECD countries forprivate sector employees. Private employee pensions are based only on earnings over the last five years ofemployment (increased from the last two years in 1992), which also introduces a bias towards
6. The replacement rate formula for IKA is complicated. The replacement rates for the first 10 years of
contributions range from 30-70 per cent and are inversely related to the 28 income brackets. For everyyear of service from the eleventh through twenty-fifth year, the replacement rate is raised by asupplementary 1 per cent. For every year of service above 25 years, the supplement is raised, and rangesfrom 1.5-2.5 per cent, with the premium applied to the higher brackets. The replacement rate is raisedfurther by the double counting of two months’ bonus salary (Christmas, Easter, and holiday). The bonusesare included in the pension base, but also continue to be distributed to pensioners. This double counting isbeing gradually phased out.
7. See OECD Economic Survey for Greece (1997) for a more detailed description of this phenomenon.
8. The few years for which private sector employees have actually contributed, especially for individualsretiring in the 1970s, likely reflects the impact of urbanisation and the belated increase in coverage thatoccurred in Greece, but also contribution evasion abetted by the relatively high minimum pension. Perhapsreflecting the latter, the age distribution for male old-age pensioners has shifted noticeably towardsyounger age groups during the past two decades, weakening the argument that non-qualification is a rootcause for the low contribution period.

ECO/WKP(99)7
7
under-reporting income in years falling outside this period.9 Second, replacement rates are high for old-ageprimary pensions and are inversely related to the pension base, which provides further incentives tounder-report income. Specifically, for lower incomes the gross statutory replacement rate for old-ageprimary pensions is near 90 per cent for 35 years’ contributions while for higher incomes it is about 75 percent (see section IV). In combination with generous supplementary pensions, replacement rates are about100 per cent, and even higher on an after-tax basis, placing them among the highest, relative to respectiveearnings, in the OECD.10 This generosity of the pension formula provides additional incentives forcontributing few years to the pension system.
7. The perverse incentives, arising from the generosity of pensions, combined with abuses of thesystem, likely comprise a large part of the explanation for the large shortfall in contributions relative totheir potential (i.e. that implied by earned income). If national accounts data are used to estimate privatesector wages, an admittedly rough estimation suggests a 20 to 30 per cent shortfall, which can only partlybe explained by earnings such as overtime pay for which no contributions are required. The stylised factsalso support this notion. Reportedly, workers and their employers -- especially in smaller firms and in thelarge construction sector -- under-report working days to reduce the cost associated with social securitycontributions.11 In the event, it would be surprising not to find evidence of contribution evasion in a systemwhere income tax evasion is also considered to be high.
The self-employed
Non-agricultural sector
8. Small entrepreneurs and traders also receive generous pensions relative to their contributions.They often choose to place themselves in low income contribution classes -- significantly below theaverage income of the sector – as they can still receive primary pensions which are broadly equal topensions corresponding to dependent employment. In comparison with IKA pensioners, they make smallercontributions for more years, retiring closer to age 65.12 Even subsequent to the raising of the minimumcontribution class in 1992 toward the average income, the effective contribution rate relative to the averageblue collar wage is only 8 per cent, compared with double that amount by private sector wage earners fortheir primary pensions (Table 3).13 Though the effective replacement rate stands at around 55 per cent andthe base includes all contributing years—in contrast to the last five years for IKA pensioners—the pensionis still far too generous in actuarial terms relative to the low contributions (see section IV). The situationfor self-employed professionals is similar, though both pensions (including supplementary and separation
9. For the supplementary pension, the assessment base is even shorter, as the minimum blue collar wage at
the time of retirement is used to determine the level for this pension.
10. Moreover, since the pension formula adjustments exceeded wage growth until 1990, replacement rates rosefor unchanged real wages (i.e. effectively a negative bracket creep).
11. The desire to maintain health coverage is not a disincentive to contribution evasion, since eligibility for fullhealth benefits is achieved after only 50 days’ contributions during the past year.
12. Their eligibility period is slightly longer than for IKA (20 years, which will gradually be increased to25 years by 2007). Though no data exist on the average contribution period on which TEBE pensions arebased, the fact that the average pension exceeds the minimum by 20 per cent compared with 40 per cent forIKA suggests a lower number of pensioners retiring at the minimum eligibility period. Funds havedifferent minimum pensions, with the one for IKA about 25 per cent more generous than that for TEBE.
13. For the few self-employed who entered the work force after end-1992, the effective contribution rates arehigher.

ECO/WKP(99)7
8
pensions) and contributions are higher and their funds are supported by earmarked taxes, which in certaincases exceed the revenues from contributions.14
Farmers
9. Farmers receive the lowest pensions, and receive them from age 65, though about one-quarterqualify earlier for a disability pension. They receive a flat pension, currently equivalent to about 29 percent of the minimum IKA pension. This fixed amount has lost approximately 70 per cent of its purchasingpower since 1986. However, farmers do not make contributions towards their primary pensions, and theirpensions are funded by the budget (1.2 per cent of GDP) and earmarked taxes (0.5 per cent of GDP). Theirlow supplementary pensions were replaced by a new primary pension plan which began to collectcontributions in 1998, with the Government providing two-thirds of the contributions. The new fund willprovide the opportunity for raising farmers’ pensions. However, it provides a high statutory replacementrate (50-70 per cent for a full pension) and easy eligibility conditions during the transition period (initially5 years and rising to 15, with years of contributions under the old supplementary scheme counting towardseligibility).
Public sector
10. Civil servants and employees of public enterprises and state-owned banks receive the mostgenerous pensions (Figure 2) and can retire at an earlier age, usually after serving 25 years (andsignificantly less for women hired before 1983, see Annex II). For civil servants, employee contributionrates for a primary pension have been similar to those in the private sector since 1995 (civil servants didnot make contributions towards their primary pension prior to 1993).15 Contribution rates in publicenterprises and state-owned banks are higher than those in the private sector (33 per cent for a primarypension compared with 20 per cent in the private sector). For neither category of employees iscontribution evasion a real possibility. Public sector pensions for both civil servants and employees ofpublic enterprises and state-owned banks are generous, in part because they are based on the last monthlysalary before retirement. In addition, the replacement rates are high, especially in the case ofsupplementary funds. The effective replacement rate for the primary plus supplementary pension isestimated to be about 100 per cent for both public enterprise employees and civil servants, with civilservants and employees in some public enterprises receiving two supplementary pensions. Employees inpublic enterprises and state-owned banks receive the highest pensions due to their high wages, with onlydoctors’ pensions coming close. In addition, civil servants and employees in most public enterprisesreceive a (tax-free) lump-sum separation payment upon retirement equivalent to one and two years ofsalary (for 25 years’ work), respectively, raising their pensions further.
IV. A comparison of the relative generosity of the main pension funds
11. This section attempts to quantify the above-described relative generosity of the pensions receivedby workers in the different sectors, as well as the incentives to retire early, by comparing the present valueof an individual’s contributions and receipts under various work and retirement scenarios. The objective isto attribute the source of the system’s overall disequilibrium (presented in section VI) to the regulations
14. For example, the lawyers’ fund receives a percentage from all contracts, the doctors’ fund 6.5 per cent of
the wholesale price of pharmaceuticals (hence taxing other social security funds), which was reduced to4.6 per cent in 1998, and engineers a percentage of public works.
15. The employers’ share of contributions is hard to define since the Government does not dedicate budgetaryresources for civil servant pensions and it has a legal responsibility for the total primary pension outlay.

ECO/WKP(99)7
9
applying to the different regimes. To facilitate the presentation, the following assumptions were made forthe baseline scenario regarding workers in the 5 sectors:16
− All have equivalent salary paths -- indexed to equal 100 at the start of their career salary andgrowing annually by two per cent in real terms.
− All start to work at age 25 and retire after 35 years at age 60.
− Contributions towards a pension (primary, supplementary, and separation) are madeaccording to the current contribution rates in force in each sector (with the rate of thegovernment for the employer’s share of civil servant primary pensions contributions assumedto be equivalent to that in the private sector and the non-agricultural self-employed assumedto contribute according to their full income).
− Primary, supplementary, and lump-sum separation pension payments are determinedaccording to the formulas currently in place for the respective pension funds.
− Pensions are indexed to inflation (not to wages) and remain constant in real terms.
− Annual pension payments are received until the age of 75.
The present value of contributions and pension payments are discounted to the date of retirement (atage 60) at a rate of 2 per cent in the baseline scenario.17 The choice of the real discount rate, the growth ofreal wages, and their relative magnitudes are key assumptions which will be discussed further when themodelling of the pension system as a whole is described. For the present, the assumption can be supportedon historical developments:
Real wage growth Real interest rate(In per cent; period average)
Last 35 years (1961 - 1996) 3.1 2.6Last 25 years (1971 - 1996) 1.3 1.0Last 15 years (1981 - 1996) 0.1 2.8
Two quantitative measures of generosity are presented in Table 4: the ratio of the present value of pensionreceipts to contributions (in total as well as for primary, supplementary and separation pensionsindividually) and the annual rate of return of the contributions (over the working life). Moreover, thereplacement rates can be compared with the contribution rates in each sector in view of the similarlyconstructed income and age structures. Based on this analysis the following observations can be made:
− The contribution rates and replacement rates differ significantly between sectors, but both arevery high in all sectors (except in the case of farmers), with the replacement rate near orabove 100 per cent of the final wage.
16. The five sectors are (i) private sector employees proxied by workers covered by IKA, (ii) private sector
non-agricultural self-employed proxied by workers covered by TEBE, (iii) farmers covered by OGA, (iv)civil servants, and (v) employees of public enterprises proxied by employees covered by the pension fundof the public electricity company (DEH).
17. The analysis is undertaken in real terms to avoid the complications arising from the need to adjust the basefor the calculation of a pension, as well as the ensuing pension payments, for inflation.

ECO/WKP(99)7
10
− In each sector, the present value of the pension payments exceeds the present value ofcontributions by wide margins often exceeding 2:1, resulting in significant positive rates ofreturn on their respective pension schemes. Based on these measures, public servants(especially civil servants) have by far the most generous pension system. They are followedby the non-agricultural self-employed (TEBE) and the private sector employees (with the rateof return on OGA high due to the fact that farmers do not make any contributions for theirprimary pensions). In reality the regimes are even more generous since the contribution rateswere raised to their current high levels only by the 1990-1992 reforms.
− Supplementary pensions are more generous than primary pensions, especially those for civilservants.18
− Separation payments are the most generous of all pensions, with the present value ofcontributions deviating the most from the corresponding contributions. Public sectoremployees are the main recipients of such lump-sum pensions.
12. A similar analysis can be applied to the new regime applying to all employees entering theworkforce after end-1992 (excluding farmers) as well as the new regime which will gradually be phased infor farmers (columns New System and New OGA respectively in Table 4). Though the new regime for thenon-farm population is less generous than any of the existing regimes, the present value of the pensionpayments continues to exceed the present value of contributions.19 The new regime for farmers is morethan fair in actuarial terms only after the inclusion of the government’s two-thirds share of thecontributions.
13. The sensitivity of the analysis to changes in certain key assumptions provides some valuableinsights into their relative importance for the design of a pension regime. Table 5 illustrates the increase ineach regime’s disequilibrium due to the addition of survivors’ pensions. These are assumed to extendpension payments -- at the lower rate applying in each regime -- for 10 additional years, which isappropriate to capture the longer life expectancy of women and the fact that women on average areyounger than their spouses.20 Table 6 shows the results of delaying the receipt of a pension for anadditional 5 years until the age of 65 (though the working life ends at 60) and maintains the assumption ofthe existence of survivors’ pensions. In this scenario, all existing regimes continue to be very generous,with the present value of pension payments far exceeding the present value of contributions. Theexception is the new regime for non-agricultural workers, whose equilibrium falls to near balance. Thus, ajudgement on the actuarial fairness of the new regime will depend critically on the extent to which:(a) survivors’ pensions are successfully means tested under the new regime, and (b) mothers with under-age children continue to retire at age 55, which would reduce the average retirement age to below 65.
14. By increasing the discount rate, one can simulate the case where interest rates exceed the growthof real wages (a situation of perpetual capital accumulation). Under this (optimistic) assumption (andwhile maintaining the assumption of the existence of survivors’ pensions) the disequilibrium in the existingregimes remain large -- with the important exception of IKA -- while the new regime for the non-
18. It has not been assumed that the Government contributes as employer to the supplementary funds.
However, even if the Government’s share were assumed to be equal to the employee’s share (as occurs inthe private sector), these supplementary funds would continue to be the most generous supplementaryfunds.
19. This calculation does not include the Government’s tripartite 10 percentage point contribution towardsthese pensions’ financing.
20. No survivors’ pensions are introduced in the case of the existing OGA regime since both farmers and theirspouses automatically qualify for an old-age pension.

ECO/WKP(99)7
11
agricultural sector (including the Government’s participation) yields a slightly negative rate of return(Table 7). By raising both the discount rate and the real wage equiproportionally (to say 4 per cent inTable 8), one observes the reduction in the generosity of pension formulas which use a longer period ofworking years to establish the pension base. For example, TEBE uses earnings over the whole workinglife -- adjusted for inflation -- while the last wage is used in the public service.21
15. The final set of simulations indicates the increase in the relative generosity of the differentpension regimes when individuals are able to retire early (e.g. after working only 25 years). The firstscenario permits a receipt of a pension immediately (i.e. at age 50) while the second scenario delays thereceipt of a pension until the age of 60 (Tables 9 and 10, respectively). For all pension regimes, an earlierretirement whereby a lower pension is received immediately following retirement results in a huge jump inthe generosity of the regime relative to the baseline scenario. Moreover, even if the pension is delayed andreceived at age 60, the rate of return on contributions remains high and perversely increases for publicservants and remains broadly unchanged for the self-employed compared with the baseline case where theworking life is 35 years and the retirement age 60. The exceptions are IKA and TEBE, where this rate fallsslightly. These results imply that in most regimes, pension regulations provide the incentive to retire early.The more appropriate incentives provided by TEBE may explain why few of its members retire early. ForIKA, however, other opportunities exist to retire with a generous pension. First, at age 65 with a minimumpension after 15 years of contributions (or at age 60 with 70 per cent of the minimum pension) or under theregulations pertaining to the classification of “arduous and unhealthy activity” whereby retirement occurs5 years earlier for somewhat higher contributions.22 In both cases -- but especially the former one -- thegenerosity of these categories of pensions are higher than for an ordinary pensioner retiring at age 65(Table 11). It should be noted that an IKA pension is broadly fair in actuarial terms if an individual retiresat the age of 65, having worked (and contributed) 35 years and has no surviving spouse.
V. A brief theoretical discussion of a pay-as-you-go system
16. The above discussion treated the existing pension regimes as if they were funded systems (i.e. thecontributions earned interest until they were distributed as a pension payment). However, the regimes infact are pay-as-you-go systems with little accumulated savings. This section draws out the implications forthe pay-as-you-go system as a whole arising from the above-demonstrated lack of actuarial fairness of theexisting individual pension regimes.
17. The condition necessary for a pay-as-you-go system to be in equilibrium (receipts equal topayments) at any moment in time, is:
C/B = d where C is the effective contribution rate, [1]B is the effective replacement rate, andd is the ratio of primary old-age pensioners to contributors.23
Based on this simple equation, several important inferences can be made for the Greek pension system:
21. In the next section is reviewed the well-known concept that if the real interest rate equals the growth rate of
real wages, and pension payments are indexed to wages rather than prices, then their level does not affectthe present value of the pension payments net of liabilities.
22. The contribution rates applying to “arduous and unhealthy activity” are 5.6 percentage points higher forboth primary and supplementary pensions compared with the normal ones.
23. This ratio exceeds by far the dependency ratio derived from the population over the age of 65, divided bythat aged 15-65, due to the large number of individuals that retire early.

ECO/WKP(99)7
12
− If the full adjustment in the pay-as-you-go system is placed on the replacement rate,equilibrium requires its immediate reduction by about one third. The ratio of old-age primarypensions to contributors currently stands at about 40 per cent, and the effective contributionrate and effective replacement rate are estimated to be 14 per cent and 53 per centrespectively (for primary and supplementary old-age pensions).
− Moreover, the replacement rates would have to fall further over time to maintain equilibriumsince this dependency ratio is projected to rise to 60 per cent by 2035, as the demographicsdeteriorate. By that time the replacement rate would have to fall by an additional one third.The adjustment would have to be greater to the extent that the system matures, and thus raisesthe effective replacement rate (see section VI below).
18. What are the implications of these results for the system’s actuarial fairness? Under thesimplifying assumptions that the interest rate is equal to the rate of growth of wages, a funded system isactuarially fair (present value of pension payments equals the present value of contributions) when:
C/B = m/n where: m is the number of years the pension is received, and [2]n is the number of years contributions are made. 24
Based on equations [1] and [2], one can draw the following conclusion:
− Equilibrium in the pay-as-you-go system – under the current demographics -- requires a ratioof (average) effective contribution rates to (average) effective replacement rates which areless generous than those that would provide actuarially fair benefits for any individual in thesystem. This conclusion arises from the fact that the passivity ratio (m/n) is smaller than thedependency ratio (d); the former could realistically be equal to about one third (10/35) whilethe latter currently stands at 40 per cent and will subsequently rise.25
− The above-described adjustment to the replacement rate necessary to achieve equilibrium inthe pay-as-you-go system can be decomposed into two components. First, an adjustment toeliminate the relative generosity of the existing regimes, which are too generous in actuarialterms. Second, an adjustment for the poor state of the demographics. Thus, even if thesystem was fair in actuarial terms, the demographics would result in a large shortfall incontributions relative to payments.
19. The intuition behind the first result is as follows: unlike a funded system, a pure pay-as-you-gosystem accumulates no savings. When the demographics deteriorate, the situation is similar to a fundedsystem where individuals retire early (and the passivity ratio increases); there are insufficient funds to fullyprovide for the pensions under existing regulations. The second observation raises the question of whetherit was a mistake to introduce a pay-as-you-go system in the first place.
20. What are the relative advantages of the two regimes, supposing that a pension system were beingset up from scratch? A funded system can provide more generous pensions than a pay-as-you-go systemwith identical contributions, if the real interest rate consistently exceeds the rate of growth of thecontributions base (i.e. the sum of the rate of growth of real wages and the growth of the population):
24. This condition assumes that pension payments are indexed to wages. If they were indexed to prices, the
contribution rate could be raised or the replacement rate lowered relative to the parameters implicit in thisrelationship.
25. Both the passivity and dependency ratio would rise if the ratios included survivors’ pensions.

ECO/WKP(99)7
13
r > g + population growth, where: r is the real interest rate, and [3]g is the growth rate of real wages.
− In the post-war baby boom, favourable demographics, a still immature system with fewpensioners, and the existence of controls on interest rates, made a pay-as-you-go systemappear attractive. Now however, the current ageing of the Greek population, the maturing ofa generous pension system with many individuals qualifying for pension rights, and high realinterest rates favour a funded system. Population projections indicate that the population willdecline by an average of 1 per cent per year over the next quarter century.
21. Thus we observe that a fundamental drawback of a pure pay-as-you-go system is the potential forlarge inter-generational transfers when the population growth declines or turns negative. In many othercountries in similar circumstances, the pay-as-you-go systems have accumulated a significant (thoughusually insufficient) amount of savings in anticipation of the population’s ageing – in essence acting as apartially funded system. However in the case of Greece, accumulated savings are very small (9 per cent ofGDP). What are the options available under the current circumstances?
− Switching at this time to a pure funded system, whereby contributions are saved and are theonly source of making future pension payments (i.e. no cost is borne by the Budget) entailsfinding the resources to finance the present value of the net liabilities of all existing andfuture pensions. If the regime for the post-1993 entrants is broadly fair in actuarial terms, thepresent value of the future pension liabilities reflects the generosity of the pre-1993 pensionregimes.
− To the extent that the regulations pertaining to the pre-1993 regimes are not adjusted and thefull future liabilities are not covered by the Budget, then the entrants into the labour forceafter end-1992 would have to cover the costs arising from the generosity of the pre-1993regimes. The regulations pertaining to their pension regime would have to be much lessgenerous and, thus, be much less than actuarially fair. They would in essence be paying fortwo pensions, their own as well as that of the previous generation. Thus, the longer reformsto the current pension regimes are delayed, the larger will be the cost to future generations,either through higher taxes or lower pensions.
VI. Modelling the pension system and projecting its evolution into the future
22. The above analysis suggests that despite any further positive impact expected from the1990-92 reforms, pension expenditures are set to increase substantially relative to contributions if nofurther reform measures are taken. Similar to developments anticipated in the other continental Europeancountries and Japan, expenditure will be propelled mainly by the ageing of the population. In the case ofGreece, demographic developments are even less favourable than those elsewhere due to the relativelongevity of the population. The elderly dependency ratio (population over 65 divided by the populationaged 15-64) is expected to increase from about 25 per cent currently, to 40 per cent in 2030 and to a peakof 55 per cent in 2050 (Figure 3). This development is largely pre-determined by past birth rates and couldonly be altered by further large immigration flows similar to the ones that occurred at the turn of thisdecade.26 However, several factors specific to Greece will add additional strain on the system. The systemis still in the process of maturing, with replacement rates expected to increase as future pensioners become
26. The registration of nearly 400,000 illegal immigrants in 1998 is not envisaged to make a short-term impact
on the social security system’s financing since most contributions are expected to be made for theminimum period sufficient to qualify for health benefits, and thus to lead to substantial expenditures for thepublic health system.

ECO/WKP(99)7
14
eligible for the full benefits of the system, especially those provided by supplementary funds andagricultural workers from their new primary pension fund. Further urbanisation will also put upwardpressure, with a larger share of the labour force receiving more generous pensions than their farmerparents.
23. To the extent possible, the OECD’s pension simulation model attempts to capture and quantifythese effects as well as the lagged effects of the 1990-92 reforms through to the year 2070. It projects arise of the expenditure to GDP ratio of 1.2 per cent of GDP every five years with expenditure practicallydoubling when it would reach 23 per cent of GDP by 2050 (Figure 4). (Annex III provides a detaileddescription of the projections.) Contributions are projected to increase from 7 per cent of GDP to 9 percent of GDP. This increase mainly reflects two factors. First, the assumption of employment moving outof the lower income agricultural sector. Second, the longer contribution periods for private sectoremployees, as incentives to retire early diminish when the minimum pension which is currently linked toprices becomes relatively less generous compared with wages. Thus, the gap between total pension outlaysand the current rate of contributions (excluding all government sources of funding) is projected to widenprogressively from 4½ per cent of GDP in 1997 to about 14 per cent of GDP in 2050.27
24. While Belgium, France and Portugal face similar dynamics, the projected situation in Greece isclearly worse. An important source of the increasing disequilibrium is the rising number of pensionersreceiving supplementary pensions, and an increasing transfer ratio reflecting the diminishing distortionsarising from a high minimum pension and higher pensions for the self-employed and farmers (Figure 5,panels A and B). Nevertheless, the dominating factor in the increasing financial imbalance is the ageing ofthe population. The assumed tightening of easy access to pensions and the large number of unemployedwithout pension rights reduces pressure on the system significantly and acts to partly offset the effect of anageing population (Figure 5, panel C).
25. Another indicator of the magnitude of the future gap on current contribution rates is the presentvalue of net pension outlays during this 75 year period as a percentage of GDP. The model projects theseunfunded liabilities to be equivalent to about 195 per cent of 1994 GDP (Table 12). This ratio exceeds bya wide margin similar estimates for all other OECD countries. OECD simulations for other countriesfound present values of net pension liabilities of 102 per cent of GDP for France, 153 per cent of GDP forBelgium and 109 per cent of GDP for Portugal.28
26. With a view to estimating the burden on the budget, the OECD methodology excludes allrevenues except employer and employee contributions. Thus, the attainment of estimates for Greececonsistent with other OECD countries requires excluding from the pension system’s revenues: earmarkedtaxes, transfers from the budget, and government contributions. Inclusion of government contributionswould raise revenues substantially, albeit by adding general taxation receipts to contribution revenue.Specifically, the participation of the Government as employer would add revenues equivalent to 14 percent of 1994 GDP, if it is assumed that the employer’s share for primary pensions is the same as for theprivate sector. The Government’s one-third share of the contributions for post-1992 entrants into the workforce would raise revenue by the equivalent of 53 per cent of 1994 GDP, while the Government’stwo-thirds share of farmers’ contributions would add the equivalent of 18 per cent of 1994 GDP. In total,the present value of net pension outlays would thus be reduced to 110 per cent of 1994 GDP.
27. The demographic projections do not include the immigrants which entered Greece in the early 1990s. In
the short run, their contributions could reduce the pension system’s gross financing needs slightly but inview of the generosity of the pensions system, in the long run, their incorporation would be broadly offsetby the corresponding pension payments.
28. D. Roseveare, D. Fore, W. Leibritz and E. Wurzel (1996), “Ageing populations, pensions systems andgovernment budgets: simulations for 20 OECD countries”, OECD Economics Department WorkingPapers, No. 168, Paris.

ECO/WKP(99)7
15
27. The long-term projections disaggregated on a sectoral basis permit the following observationsregarding some of the key factors influencing the projections (Figure 6):
− The introduction of the new regime for the post 1992 entrants into the labour force slowsslightly the acceleration in expenditures on pensions of private sector employees.
− The reforms capping supplementary pensions would bring down pension expenditures as apercentage of GDP for the civil servants during 2000-2010 and would decelerate the growthof expenditures in the public enterprises and banks (where contribution rates decline for thepost-1992 entrants into the labour market).29
− Farm pensions under the new regime result in a rapid increase in pension expenditures and,subsequently, the projected decline in the sector gradually leads to lower contributions andeventually pensions.
− The gradual elimination of the double counting of two months wages in the pensioncalculation for IKA reduces pension expenditures in this sector through the year 2005.
− The floor on contributions of the self employed results in higher contributions and, with a lag,higher pensions.
− The surplus currently observed for professionals disappears between 2005 and 2010. 30
28. Primary pensions account for 85 per cent of the net future liabilities and supplementary pensionsfor 14 per cent (Figure 7). Nevertheless, the gap between payments and contributions deteriorates the mostrapidly for supplementary pensions, with the initial surplus turning to a comparatively large deficit soonafter 2005. Similarly, the surplus observed for separation payments also disappears, but about a decadelater.
29. The projection is particularly sensitive to the assumptions for the real GDP growth rate and thediscount rate. The baseline simulation -- to be consistent with the projections made by the OECD in othercountries -- assumes productivity growth of 1.5 per cent of GDP and a (perhaps optimistic) discount rate of5 per cent. A lower productivity growth rate will improve the pension system’s situation in present valueterms since the concomitant reduction in real wages will affect the more generous pensions proportionallymore than contributions. A lower discount rate will obviously increase the present value of the liabilities.For example, if productivity growth is lowered to 1 per cent or the discount rate lowered to 4 per cent, thepresent value of net pension outlays changes, respectively, to 182 and 261 per cent of GDP. The presentvalue of unfunded liabilities would be even higher if the real interest rate were lowered towards the neo-classical growth model assumption of equivalence with the growth of real output (productivity multipliedby (negative) employment growth) – Solow’s golden rule. The baseline scenario also assumes anunchanged participation rate. Raising the participation rate by about 10 percentage points to equal the EUaverage and distributing the ensuing employment equiproportionally among the various sectors results in asmall reduction in the present value of net liabilities to 185 per cent of 1994 GDP (Figure 8).
29. These reforms were delayed indefinitely in 1998 (see Annex II).
30. The generosity of the pension funds of self-employed professionals is underestimated due to the difficultyin separating out receipts from earmarked taxes from earnings-based contributions. For example, in thecase of the engineers’ fund (TSMEDE), all receipts, including a large amount from earmarked taxes, areconsidered to be contribution-based.

ECO/WKP(99)7
16
30. The baseline results obviously carry a wide range of uncertainty around the central results due tothe complicated characteristics of the system, its segmentation, and severe data deficiencies, to mentiononly the main obstacles. In addition, the 1990-1992 reforms were very extensive and some facets difficultto take into account (see Annex III). Despite these simplifications, the model suggests that the results arerelatively robust and the overall baseline result will not change by much if more detailed projections aremade. In part, this conclusion is based on the fact that many of the more complicated changes take place inthe distant future and are thus heavily discounted. For example, under the extreme example that the systemdoes not suffer from any further maturity, the system’s financing needs are only reduced by about 20 percent of 1994 GDP. On the other hand, an assumption of no progress in constraining pension eligibilitywould raise the unfunded liabilities by about 20-30 per cent of 1994 GDP (see Annex IV for a list of themain sources of uncertainty).
VII. Options for reform
31. The projections indicate that the introduction of additional pension reforms cannot be delayed.The gap between expenditures and contributions will have reached 5½ per cent of GDP by the year 2010from about 4½ per cent in 1997, primarily due to the transformation of the surplus currently achieved bythe supplementary funds into a deficit exceeding 1 per cent of GDP. The financing requirement will beabout ½ per cent of GDP greater as reserves are run down, and the concomitant revenue lost. Thus, thefiscal burden will increase by about 1½ per cent of GDP. The relatively constrained deterioration in thedeficit until 2010 reflects the low birth rate during the second world war and during the years immediatelyfollowing, which are now resulting in a slowing in the rate of increase of new pensioners (Figure 9).Nevertheless, in view of the present financial position of the pension system, reforms should be startedquickly as their implementation requires long lead times, and early implementation would provide largebenefits by avoiding the snowball effect of a ballooning public debt.
32. With many OECD countries facing similar, though perhaps less pressing, situations twostrategies for reform have emerged. Most countries have pursued reforms of their pay-as-you-go system,including France (1993), Spain (1996) and Italy (1992 and 1995), or have introduced multi-tieredpay-as-you-go systems, with a flat public pension and an earnings-based component, such as in the UnitedKingdom and Sweden. A few others have introduced more radical reforms, whereby all or part of thesystem was transformed into some form of defined contribution system, which is either fully-funded(Australia, Chile and Singapore) or multi-tiered (pursued in Central European countries).
33. Concerning reforms to pay-as-you-go systems, most countries have hesitated to raise contributionrates further, because of the adverse affect of higher payroll taxes on employment creation. A similar viewis held in Greece as the 1990-92 pension reform raised contribution rates to the point where statutorypayroll taxes are among the highest in the OECD for private sector employees. To ensure equilibrium, theeffective contribution rate for the system as a whole would have to increase gradually from about 15 percent in 2000 to the obviously untenable 50 per cent in 2050. If the adjustment was made up front it wouldnot require such a large alignment, but it would nevertheless still be too large to represent a viable option.For example, a one-time and sustained increase in the average effective contribution rate to 1½ times thecurrent rate in 2010 would reduce the present value of net pension liabilities by about one-third, to theequivalent of about 130 per cent of 1994 GDP (Figure 10).
34. On the other hand, the effective contribution rate for most funds is low as compared with thestatutory one, reflecting the incentives for contribution evasion, including through the incentives providedby the high minimum pension in conjunction with the low eligibility requirement. For the system as awhole, the effective contribution rate for a primary pension is about half the average statutory one of about20 per cent. The effective rate could be brought towards the statutory rate without raising contributionrates by stemming contribution evasion. Most importantly, the gradual replacement of the minimum

ECO/WKP(99)7
17
pension by a means-tested minimum income for pensioners would eliminate a principal incentive forcontribution evasion.
35. The elimination of this disincentive to contribute should help alleviate a fundamental problem ofthe system, namely the easy eligibility for a pension. Raising the years worked (and contributed) towards apension is an extremely effective measure since it provides the double benefit of reducing the number ofpensioners, while at the same time increasing the number of contributors. Other measures to raise theeffective retirement age from its current level between 55 and 60 years would be to further tighten controlsto arrest abuses of the early retirement opportunities, especially work in “arduous and unhealthy activity”,and access to invalidity pensions (though admittedly much progress has been made in controlling easyaccess to invalidity pensions). Extending the contribution period for five additional years prior to thereceipt of a pension for all funds, except those of farmers and self-employed professionals who alreadycontribute until age 65, (effective from the year 2000) would reduce contingent liability by about 30 percent. Such a delay in the retirement age could be achieved by raising the effective retirement age to thecurrent statutory retirement age of 65 years. With life expectancy high and increasing, many countries areconsidering raising this limit to over 65 years. If the limit is raised to 70, the value of the contingentliabilities declines by about two-thirds to about 70 per cent of 1994 GDP.
36. Nevertheless, a portion of the gains from raising the effective retirement age would be offset byhigher pensions once they are paid, arising from the generosity of the existing pension formulae. Thus, itis inevitable that reforms should strengthen the link between the value of individual pension payments andthe supporting contributions by setting the pension base closer to earnings over a whole career. In Greece,the pension base for the private sector of the last 5 years of earnings is the lowest in the OECD area, whilethe base used in the public sector of the last month’s salary (or the minimum wage at the time of retirementfor the largest supplementary pension fund) is even more generous. Greece should follow the example ofother countries and use wages over a longer, if not the entire, working life to calculate pensions (as isalready the case for the self-employed small entrepreneurs and traders who make up a large section of thepopulation). The simulations in section IV indicate that a pension base comprising the full career wouldreduce the replacement rate in IKA and the public sector by 24 and 27 per cent, respectively, if annual realwage growth averages 2 per cent. Widening the pension base in this manner also reduces inequitiesbetween blue and white collar workers arising from the latter’s more dynamic salaries, who as a result,benefit more from a back-loaded earnings base. Raising the contribution base to comprise a large share oflifetime income should also discourage contribution evasion. In order to achieve a gradual lengthening ofthe pension base, Greece should follow the example of other countries and soon start lengthening thepension base annually by increments.
37. In view of the longer life expectancy, as well as budgetary concerns, many countries have alsoreduced the rate at which pension benefits accrue in order to provide incentives for workers to delayretirements. They have also extended the period required to accumulate benefit rights for a full pensionbeyond 35 years (e.g. for France the limit is 38 years and for Germany 40 years). The accumulation ratesin most OECD countries range from 0.5 per cent to 1.5 per cent per year while in Greece, the accrual rateremains very generous in almost all funds. Including supplementary funds, it ranges from a low of 2.3 percent per year for workers entering the work force after end-1992 to over 3 per cent per year for publicservants, while a full pension is usually obtained after 35 years’ contributions. These benefit accumulationrates imply very high rates of return on contributions and the accumulation rate would need to be reducedto about two-thirds, be based over a longer assessment period, and be introduced early on, to bring thepension system towards viability. For example, a one-time reduction in the effective replacement rate inthe year 2010 by 50 per cent would reduce the present value of the net pension liabilities by about one-half.Alternatively, to maintain the balance for the system would require a gradual reduction in the aggregateeffective replacement rate from 53 per cent in 2000 to below 20 per cent in 2050. If, as was mentionedabove, reform was delayed so as to effect only the post-1992 generation of workers, the burden ofadjustment that would have to be borne by them would have to be even greater. Similar to the strategy for
ECO/WKP(99)7
18
lengthening the pension assessment period, the accumulation rate should be gradually reduced for allfunds. In addition, the accumulation rate could be made back-loaded, with higher rates of benefitaccumulation provided towards the latter part of a career.
38. The indexation of pensions to price objectives of the government is one of the most potent meansof controlling pension expenditure and provides one of the few ways of placing a share of the adjustmentburden on current pensioners. Despite the recent large loss in the purchasing power of pensions, thispolicy, in conjunction with the indexation of minimum pensions and the continued strict application of ameans-tested supplement to protect the elderly poor, will probably need to be continued until other, moretargeted, reforms to the pension system are introduced. However, for equity reasons the indexation ofpensions should be identical across sectors and types of pensions.
39. In addition to changing the basic parameters of the current system, unification of the regulationswould enhance equity and provide considerable economies of scale. The decision to unify the regulationswas already accepted for the generation of workers who entered the labour force after end-1992. Theconcept of a unified system across sexes, sectors and levels of pensions (e.g. the supplementary pensions)could help make the need to reduce the generosity of pensions become more palatable. It would eliminateimbalances across sectors and generations, with the most generous benefits adjusting proportionally more.Similarly, the choice to subsidise pensions of women, and especially those with under-age children, andthe pensions of the declining agricultural sector should at least be undertaken in a more equitable manner,emphasising means-testing. Such a policy would admittedly require an improved administrative capacity.Survivors’ pensions should also be means-tested, as will be the case for those that entered the labour forceafter end-1992. The 1998 reform took a step in this direction by limiting access to survivors’ pensions. Aunified fund also would lower costs both through administrative economies of scale and through improvedmonitoring to reduce abuses such as exceeding the global limit of the system on total pension receipts.
40. As a first step towards the unification of pension benefits, savings could be made by unifyingprimary and supplementary funds and their benefits within individual sectors (a first step occurred with thenon-farm self-employed in 1998) (see Annex II). Moreover, since practically no fund is viable over thelonger term, the proper functioning of a pay-as-you-go system suggests the pooling of all surpluses tocover the needs of deficitary funds. Raising the transparency regarding the financial position of the systemin this manner may help reduce the abuses of the system. For similar reasons, earmarked taxes obtainedover the years by powerful lobbies to finance their pensions should be transferred to the budget.Irrespective of decisions regarding the composition of the system, the speedy establishment of a registerfor contributors and pensioners would provide a strong weapon in combating abuses of the system(e.g. working during retirement while exceeding prescribed norms on earning).
41. The debate over the pros and cons of a funded versus a pay-as-you-go system has often obscuredthe key issues of pension reform for countries, such as Greece, which have pension systems with largeimplicit liabilities in present value terms. Specifically, a successful reform needs to address the issue of thepensions expected by the current work force, but which will far exceed their contributions on present rules.These “acquired rights” count for most of the total implicit debt, indicating that reforms must change theseexpectations whatever decision is made on systemic reform.31 In this regard, a switch from apay-as-you-go system to a funded system should form part of a strategy to meet at least part of the pensionexpectations of current workers, at a reduced cost to the budget.
31. If the estimate of the value of the “acquired rights” of the current workforce is based on the present value
of the net pension liabilities of the pay-as-you-go system to the year 2025, then they would account forabout two-thirds of the total net liabilities. However, this estimate would include the contributions of thefuture generation of workers.

ECO/WKP(99)7
19
42. In the case of Hungary, the generosity of the system was reduced for existing and future workers.At the same time, workers were allowed a choice between a reformed (i.e. less generous) pay-as-you-gosystem and a new multi-tiered system with the first tier proportionally identical to the reformedpay-as-you-go system and a funded second tier. It is expected that younger workers would be willing tovoluntarily switch to the multi-tier system since they will earn a higher rate of return on their investedcontributions. This would make up to them for the difference between an even less generous accumulationrate for past contributions (in the second tier) relative to the reformed pay-as-you-go system. Thedifference in the accumulation rates for past contributions between the multi-tier and reformedpay-as-you-go system (for the second tier) are the savings to the budget from this systemic change.However, the transfer of even a share of existing workers’ contributions towards a contribution-basedsystem will lead to a loss of revenue for the pay-as-you-go component of the system and thus result in ahigher budget deficit over the medium term. For Greece, taking this route would imply a strongcommitment to significant additional fiscal consolidation as the debt burden is already very high. It wouldalso imply reducing the generosity of pensions through one very significant reform. Subsequent changesto the rules of the system, especially of the funded component, would lead to a large loss of credibility tothe system.

ECO/WKP(99)7
20
ANNEX I
Problems of accountability and inequity arise from excessive segmentation
43. The segmentation and complexity of the public pension system, in conjunction with pooradministration, has led to a lack of transparency and inadequate monitoring.32 As a result, pension fraud isdifficult to detect and contribution evasion is sizeable. The lack of transparency is highlighted by the factthat most funds compile their accounts with delays amounting to several years, while accounting quality ispoor. Few funds other than the large fund for private sector employees (IKA) collect anything more thanthe most basic data on their pensioners or contributors. This precludes a full compilation of pensionsystem data, and raises the potential for abuses, including contribution evasion.33 It is characteristic of thepoor quality of the data that the total number of contributors across primary funds exceeds totalemployment—as measured by the labour force survey—by about 20 per cent. Moreover, for the largestfund (IKA), declared earnings for contributions fall far short of the respective total earnings data from thenational accounts. As funds monitor pensions rather than pensioners, the total number of pensioners is notknown, though the number of primary pensioners exceeds the population aged over 65 years by a widemargin. Without proper accounting and administration (e.g. a unique social security number), pensionersmay receive more than one primary pension and exceed with impunity the existing overall cap on totalpension receipts per individual, or continue to receive a pension while working and earning in excess ofstatutory limits.34 In addition, little collaboration exists with the income tax authorities to verify ifcontributions are consistent with declared income.35 Frequent recourse to contribution amnesties—foursince 1985 -- have further weakened incentives to contribute. In an effort to improve monitoring, the1990-92 reforms set up a national registry. However, its completion has been delayed until well after theyear 2000.
44. The segmentation generates additional problems. First, it is inevitable that any system wherefunds are based on economic sectors will eventually include funds covering sectors with a declining
32. No one ministry is responsible for overseeing all funds, though the majority are under the supervision of
the Ministry of Labour and Social Affairs.
33. The term “contribution evasion” is used to describe the phenomenon whereby individuals do not declaretheir working status, as well as the situation where contributions are in arrears.
34. Legislation does not forbid either the receipt of multiple pensions or working while receiving a pension.The most common cases of multiple pensions are reportedly: i) female spouses who receive their own andtheir husband’s survivors’ pensions (male workers can only receive a survivor’s pension if they are invalidsor have young children); ii) private sector salaried workers who had a second career as self-employed;and iii) public sector employees who had a second career in the private sector. In the second case, aslightly longer contribution period is required to qualify for a second pension. The total value of allpensions per individual was capped at four times the 1991 per capita GDP in 1992. Regarding the right towork while simultaneously receiving a pension, a pension is suspended only if the earnings fromemployment are more than twice the level of the minimum wage. For recipients of the minimum pension,the pension is fully suspended in the event the recipient works. However, these restrictions only apply toprivate sector employees (IKA). These conditions will change from 2001 (see Annex II).
35. The 1992 reform required the tax authorities to receive confirmation from a firm’s social security fund thatthe requisite contributions have been paid prior to making any refunds. However, this measure’seffectiveness is circumscribed without the fund’s ability to verify wages and employment time. Moreeffective was the introduction in the construction sector -- where contribution evasion is reportedly mostacute -- of presumptive days of contributions.

ECO/WKP(99)7
21
number of contributors especially when the system as a whole faces deteriorating demographics.36 Even ifthe overall system is sustainable this will lead to financial difficulties unless there exists access to acommon pool of resources which is funded by the surpluses of the more dynamic sectors.37 Though thereis no overall effect on the general government deficit as the consolidated system balance remainsunchanged, the prospect that liabilities will be absorbed by budget transfers could lead to a moral hazardproblem with, for instance, too generous pension benefits being granted to the current generation ofpensioners.38 In Greece, bankrupt funds (and their liabilities) have been absorbed by the largest socialsecurity fund (IKA), which has necessitated budgetary transfers. Other sizeable concessions, which certainsectors have been able to extract, are earmarked taxes to support (or in certain cases practically replace)contributions.39 Finally, the existence of many funds leads to high expenditure on personnel. Pensionfunds employ some thirty-five thousand individuals (approximately 1 per cent of total employment) at acost of Dr 70 billion (0.3 per cent of GDP). Personnel outlays relative to overall social security spendingare twice the OECD average.
36. Currently, two funds are suffering large losses due to the decline of their respective sectors; the seaman’s
fund and the fund for drivers of public vehicles, which have ratios of contributors to pensioners of 1:2 and1.1:1, respectively. The consolidation of both these funds into other larger funds is an option underconsideration.
37. The 1992 reform introduced a small pooling fund (LAFKA). It is funded by freezing the revenues fromearmarked taxes received by certain funds at their nominal 1992 level and shifting the excess receipts tothis pool. In 1996, LAFKA receipts were budgeted at Dr 25 billion compared to annual budget transfers toloss-making funds of Dr 750 billion.
38. The system also provides incentives for adverse selection. The large variation in pension benefits andeligibility requirements in conjunction with generous conversion provisions provide incentives forindividuals to switch pension funds towards those with higher benefit levels relative to contributions. Suchtransfers of pension rights reportedly occur most often from the less generous funds for the smallentrepreneurs and traders to IKA, which has a higher minimum pension and earlier eligibility. The transferof pension rights to funds which have less onerous eligibility requirements is partly to blame for the severefinancial difficulties of the seaman’s fund, when lax transfer requirements during the period 1983-87resulted in the granting of many full pensions after 15 years of contribution.
39. The most flagrant examples are the self-employed professionals such as doctors, lawyers and engineers(see footnote 14) and journalists who receive a percentage of television and radio advertising costs. Part ofthe problem stems from the lack of a clear legal distinction between a contribution and an earmarked tax,especially for the cases of the self-employed.

ECO/WKP(99)7
22
ANNEX II
Historical overview of the Greek pension system:
The unsustainability of the pension system
Expenditure: A large increase in pensions and pensioners in the 1970s and 1980s
45. The microeconomic incentives imbedded in the system, in combination with the introduction ofother measures that increased the system’s generosity, resulted in a surge in aggregate pension expenditure.It increased from below 6 per cent of GDP in the mid-1970s to over 12 per cent of GDP in 1990(Figure A1, panel A). These expenditure developments can be separated into two parts. First, an upwardshift in the transfer ratio (the average pension divided by earnings per capita) at the start of the decade.Second, a sharp and consistent increase in the eligibility ratio (the number of primary pensions divided bythe population over the age of 65).
46. The main policy change that raised the transfer ratio was the establishment of a link betweenminimum pensions and minimum wages during a period of rapid real wage growth at the lower end of thewage spectrum. A second factor raising the transfer ratio was maturing supplementary funds, which raisedindividual pension benefits in the latter part of the 1980s.40 As a result, the transfer ratio rose by nearly30 percentage points between 1978 and 1990 (Figure A1, panel B).
47. Nevertheless, a lowering of eligibility requirements was the main factor raising pensionexpenditure during the late 1970s and all of the 1980s. As a result, the eligibility ratio rose by over 50 percent; to reach 1 1/3 primary pensions for every member of the population above the age 65 in 1990(Figure A1, panel C).41 The current level of 2.2 million primary pensions (comprising old-age, invalidityand survivor benefits) is equivalent to 60 per cent of employment, which is probably one of the highestpercentages in the OECD. Policies that raised the eligibility ratio comprised i) the sharp increase in theminimum pension described above, ii) better opportunities to obtain early retirement for the rising numberof unemployed, iii) easier access to invalidity pensions, and iv) the provision of pensions for those whowere falling short of qualifying for a pension (Box 2).
48. The effect of these policies can be highlighted by developments in IKA. During 1975-90, anincreasing share of retirements was made before age 60, with the earlier retirement of men accounting forthe rise (Figure A2, panel A).42 Women (especially those with under-age children) traditionally have hadmore generous eligibility requirements.43 At the same time, about one-quarter of new pensioners received 40. The transfer ratio was also propelled upwards by low labour productivity growth, which averaged below
1 per cent during the 1980s compared with 3 per cent during the previous decade.
41. The ratio exceeds 1:1 due to the institutional factors that permit and/or induce individuals to retire beforethe age of 65, including generous retirement provisions, women’s earlier statutory retirement age, lowerretirement limits for many public servants, access to invalidity and survivor pensions, and theindeterminate number of multiple pensions.
42. Individuals can retire up to five years earlier than the limit of 65 years, with a reduction in pension benefitsof 6 per cent per year. This regulation also applies to retirement with a minimum pension.
43. The more generous eligibility regulations for women permit a woman in the private sector to retire at age55 with 18.3 years’ contributions if she has under-age children, and at age 60 with 15 years’ contributionsif married. The retirement conditions are far more generous in the public sector. In the civil service,married women hired after end-1982 and retiring before end-1997, can retire at age 58 with 17.5 years’

ECO/WKP(99)7
23
an invalidity pension, though the share has declined since the mid-1980s as pressures to provide pensionsto unemployed workers eased (Figure A2, panel B).44 Finally, about 40 per cent of private sector wageearners were classified as working under “arduous and unhealthy employment conditions”, wherebyretirement can be moved forward by five years. Spending developments during this period were relativelyunaffected by deteriorating demographics. After having increased rapidly during the 1960s and 1970s, thedependency ratio remained fairly stable during the 1980s, which may reflect a low birth rate during thetumultuous period of the late 1910s and early 1920s.
Box 2. Policies that raised pension expenditure during 1978-82
Transfer ratio
The transfer ratio rose sharply in the period 1978-85 when the minimum pension was linked to an increasingly largershare of the minimum blue-collar wage (initially 60 per cent and subsequently 80 per cent), while the minimum bluecollar wage was raised by 50 per cent in 1982. Other policies which raised the transfer ratio were: i) on an ad hocbasis, pensioners were placed in higher pension classes; and ii) Christmas, Easter and holiday salary bonuses,amounting to two months’ salary, were added to the calculation of the monthly pension base in 1978, thus raisingpensions by 16.6 per cent.
Eligibility ratio
Policy facilitated the provision of pensions for non-qualifiers and older age unemployed. The existence of manyindividuals who did not qualify for a pension reflected the extension of pension coverage to the entire population in1982. Moreover, workers who migrated from rural to urban areas had difficulty in qualifying for a pension sincefarmers do not contribute toward a pension and thus had no pension rights to transfer to their new pension fund uponcommencing work in urban areas. A broken employment history, primarily affecting women, is an additional factorwhich hampers qualification for a pension.
The main measures that eased pension eligibility for workers whose contribution period fell short of the minimumqualifying period were: i) permitting individuals over the age of 65 to purchase sufficient pension rights to obtain theminimum pension; and ii) introducing a special old-age pension for non-contributors (equivalent to a farm pension)for some 35 000 individuals. Similarly, pension rights were granted to many non-contributors, such as immigrants ofGreek origin -- arriving in Greece prior to 1984, especially from Eastern Europe -- and members of the nationalresistance. In neither case were the beneficiaries required to make a payment towards these pension rights. Finally,agricultural pensions were automatically granted to farmers’ spouses in 1981, increasing the number of pensions-- albeit of a low individual level -- by about 120 000.
Measures aimed at the unemployed comprised: i) the introduction in 1978 of the “35 years” rule, whereby anyone ofage 58 with 35 years’ contributions could receive a full pension; ii) the ad hoc expansion of the “arduous andunhealthy employment” category of contributors who are eligible for retirement five years earlier than the normalretirement age, albeit in exchange for somewhat higher contributions; and iii) a lax application of eligibilityconditions for invalidity pensions.
contributions or without age limit after 24.5 years’ contributions. For women with under-age children, and17.5 years of contributions, the retirement age falls to 50. Women hired prior to end-1982 have even moregenerous age limits.
44. Eligibility for an invalidity pension requires only five years’ contributions in IKA, while it is ten years forother funds. Perhaps reflecting the lower eligibility standard, IKA has the highest share of invaliditypensions (equalled only by OGA where invalidity pensions are nevertheless low).

ECO/WKP(99)7
24
Revenues: rising salaries and contribution rates
49. Though not keeping pace with expenditures, revenues from employers’ and employees’contributions rose steadily as a per cent of GDP during the late 1970s and 1980s (Figure A3). During theperiod 1975-85, the underlying force was the sharp rise in real wages. Contributions as a per cent of GDPshowed some further increase subsequently even though the labour share fell between 1985 and 1990, asthe share of workers contributing to supplementary pension funds increased, and more than doubledbetween 1980 and 1990.45 The increased coverage of supplementary funds initially provides extrarevenues, but will soon lead to additional expenditures because eligibility requirements are low. A similarshort-term source of contributions will arise from the introduction of the new primary fund for farmworkers in 1997.46
The 1990-92 reforms: a stop-gap measure
50. The 1990-92 reforms were required to stem an explosive situation. Total pension expendituresexceeded contributions by 7½ per cent of GDP in 1990 -- compared with a shortfall of about 3 per cent ofGDP in 1975 -- despite a 3½ per cent of GDP increase in contributions during the corresponding period(Figure A4). To cover expenditures, transfers from the budget increased from about ½ per cent of GDP in1975 to nearly 4 per cent of GDP in 1990. In addition, some of the larger funds became heavily indebted.47
Following the introduction of the reforms, contributions increased and expenditures fell, each by 1½ percent of GDP. The former was achieved by a sharp increase in contribution rates which placed Greeceamong the countries with the highest non-wage labour costs in the OECD.48 Regarding expenditure, themost important measure to break their fast upward trend was the de-linking of pensions from wages.Primary pensions in the private sector were indexed to the increase in civil servant pensions, which havebeen used along with civil servant wages and the exchange rate policy to influence inflation expectationsand thus increased in line with stringent government inflation objectives. As a result, during the1990-95 period, average primary pensions (excluding farmers) on aggregate declined by over 20 per centin real terms.49
45. The increase in the effective contribution rate also reflects the increase in coverage following the extension
of the pension system to the whole population and the inflow of immigrants.
46. Upon its creation in 1982, the eligibility criteria for the largest supplementary fund (IKA-TEAM), coveringover 50 per cent of private sector wage earners, was set at 1 000 days’ contributions (equivalent to3 1/3 years) and increased by 175 days every year until it reaches 4 500 days in 2001. Thus, the fundalready has close to 200 000 pensioners. On 1 January 1997, the eligibility criteria stood at 2 575 days(equivalent to 8.6 years). Similarly, the eligibility condition for the new farmers’ primary pension has beenset at five years, and will gradually rise to 15 years over 20 years. Moreover, contributions forsupplementary pensions, which it replaces, will count towards eligibility. It appears likely that recourse tothe reduced eligibility criteria will be large since the majority of agricultural workers are near retirement.This situation reflects the declining importance of this sector since the second world war fromapproximately 50 per cent of the labour force to 20 per cent currently.
47. The Government eventually had to assume most of this debt which was issued with a governmentguarantee. In the early 1990s, the Government assumed debts equivalent to about 7½ per cent of GDP.
48. See OECD Economic Survey of Greece (1996), Paris.
49. Primary pensions for the self-employed are adjusted on an ad hoc basis for inflation and have exceeded theincreases permitted by IKA by about 25 per cent since 1990, leaving their pensions broadly unchanged inreal terms.

ECO/WKP(99)7
25
51. The large loss in purchasing power arising from the de-indexation was not sustainable and1996 legislation indexed minimum pensions to CPI inflation and provided for a means tested supplementto low income (non-agricultural) pensioners above the age of 65 (EKAS). This supplement is the firstoccurrence of the application of means testing in the Greek pension system. The supplement is a fixedamount equivalent to 12 per cent of the minimum IKA pension and will be henceforth indexed toinflation.50 In 1998, access to the mean-tested pension supplement was broadened (see below). In 1999,the supplement was raised by 50 per cent. These later reforms weakened the initial reform’s aim to providenecessary benefits without introducing incentives to retire early.
52. The other measures to reduce pension expenditure varied across funds, but the main onesgradually reduced pension replacement rates and raised eligibility standards, especially in the public sector,and tightened procedures for granting invalidity pensions. (See Box 3 for a detailed description of thereforms.) The tightening of invalidity eligibility has proven relatively successful, and reduced theincidence of invalidity pensions to below 15 per cent of private sector retirees, from more than 20 per centin the late 1980s. The reforms reduced many of the inequities in the system, especially those betweenprivate and public sector employees, but they created an important new differentiation, as all workersentering the work force from 1993 onwards are subject to less generous, though unified, rules.Entitlements have been moved in the right direction yet, according to OECD estimates, pensions remaintoo generous even for new workers to bring the system towards viability. The projections presented aboveindicate that the changes came too late and have been insufficient to restore the viability of the system.
50. Eligibility is based on uniform criteria, the most important of which is total pension receipts. Some
380 000 pensioners (about 17 per cent of the total) have already received the supplement and its cost isestimated to be 0.2 per cent of GDP on an annual basis. Nevertheless, the potential for fraud will need tobe faced through co-ordination with tax authorities. If eligibility is broadened, the effectiveness of themeasure as a targeted social policy will be reduced. Eligibility for the monthly pension supplementrequires a pensioner to fulfil all of the following cascading conditions: i) a gross pension income (from allpensions) which does not exceed Dr 110 000 per month; ii) total annual income from work and pensionswhich do not exceed Dr 1.4 million; iii) total annual taxable income which does not exceed Dr 1.8 million;and iv) total family taxable income which does not exceed Dr 2.8 million. The supplement is reducedprogressively for pensioners receiving pensions between Dr 100 000 - 110 000.

ECO/WKP(99)7
26
Box 3. The 1990-92 reforms
Revenue measures
For private-sector wage earners, contribution rates were raised by 5.8 percentage points to 20 per cent. For civilservants, contributions were introduced and gradually raised to the level of the private sector by 1995. In the broaderpublic sector, contributions were raised from a range of 14 to 25 per cent to 33 per cent by 1995 (for pre-1993employees). For the self-employed, where contributions are based on a set of voluntarily chosen income classes(which had not been fully adjusted for inflation), the lower classes were eliminated and the earnings base forcontributions was gradually raised towards the 1991 per capita GDP (adjusted subsequently by the increase in civilservant pensions). Finally, a progressive tax was placed on all pensions (except for farmers and seamen); amountingto 1 per cent for pensions exceeding Dr 100 000 per month, up to 5 per cent for pensions exceeding Dr 500 000.
Expenditure measures
− Replacement rates: For IKA pensioners, the replacement rate will be gradually reduced by 14.2 per centduring the period 1992-2001 through the elimination of the double counting of the two months’ bonus salary.Moreover, their pension base was increased from the last two to the last five years’ salary (adjusted by thecorresponding increase in civil servants pensions). For all pensioners, an overall limit was placed on the totalvalue of all pensions per individual pensioner equivalent to four times the 1991 per capita GDP (adjusted bythe corresponding increase in civil servant pensions). For all funds, but applying mostly to the broader publicsector and professionals, the replacement rate of new retirees will be capped for primary pensions at 80 percent and for supplementary pensions at 20 per cent (from 1998) of the applicable salary base. On the samedate, separation payments will be capped at Dr 13.5 million.
− Indexation: Pensions in the private sector were no longer indexed to changes in the blue-collar minimumwage, but adjusted in line with civil servant pensions, which are in turn adjusted according to thegovernment’s inflation objective.
− Eligibility: For the private sector, pension eligibility conditions were raised from 13.5 years to 15 years’contributions for a minimum pension at age 65, and the minimum pension is increased by 1 per cent for eachadditional year of contributions above 15 years. In addition, the minimum retirement age (the “35 year” rule)will be gradually raised from 58 to 60 by 2002 (for men only).
− For the public sector, a minimum pensionable age was introduced for those hired after end-1982 (60 for menand 58 for women), which will be gradually raised to those ages applying in the private sector (65 for men and60 for women) during the period 1998-2007. Moreover, a minimum contribution period of 25 years was alsointroduced (which mainly affected women who previously could retire after 15 years’ service and at age 42).In addition, the employment period in the public sector required to retire without an age limit will be graduallyraised from 32 years to 35 years (by 1997 for women and between 1998 and 2004 for men), a back-loadedpension formula was introduced to provide a greater incentive to retire later, and transitional arrangementswere set for public employees hired prior to 1982.
− Eligibility for invalidity pensions was also tightened. The basic measures raised the minimum degree ofinvalidity required to receive a pension from 33 to 50 per cent and required verifications of past decisions.
New system
The reforms unified the pension rights and obligations for all public and private-sector employees entering the workforce after end-1992, and made them less generous than those applying to the current generation of employees.
− Retirement age: At age 65 for men and women, and at age 55 for women with under-age children.

ECO/WKP(99)7
27
− Replacement rate: 80 per cent for a combined primary and supplementary pension (about 10 percentage pointsless than the current replacement rate for wage earners) and with a linear accumulation rule at a rate of2.285 per year (compared with the progressive one applied by IKA currently). The assessment base is theaverage of the last five years’ earnings (adjusted for inflation).
− Contributions: The new system introduces a tripartite system for contributions, with employer and employees’contributions remaining unchanged, but with government providing an additional contribution (10 percentagepoints or one-third of the total). Also, the cap on contributions for the post-1992 generation was eliminated.
− Dependency allowances: For those entering the workforce after 1993, the 1990-92 reforms eliminated thespouse dependency allowance and changed the child dependency allowance to 8 per cent, 10 per cent and12 per cent, respectively for the first, second and third child, from 3 per cent for the spouse and 20 per cent,15 per cent and 10 per cent, respectively for the first, second and third child.
− Multiple pensions: Contributions for a second pension are made on a voluntary basis by the employee for thefull (employee and employer) amount, and eligibility for a survivor pension is subject to means testing unlessthe survivor is disabled.
− Right to work and simultaneously receive a pension: Pensions will be reduced by one-third if recipientscontinue to work. Recipients of minimum pensions will have their pension fully suspended.
53. The 1990-92 reforms have succeeded in temporarily stabilising the finances of the pensionsystem. Though a detailed decomposition of pension expenditure and revenues for 1998 is not yetavailable, the shortfall between total (public and private) outlays and contributions is estimated to bebetween 5-6 per cent of GDP. It is, nevertheless, often believed that the pension system is in surplusfollowing the implementation of the reforms, as the pension funds’ cash balances are in surplus equivalentto about 2 per cent of GDP. This perception overlooks the transfers from the budget to deficit funds(2½ per cent of GDP), that civil service and other government pension outlays—net of employeecontributions—amounted to 2 per cent of GDP, and that funds received earmarked taxes of over 1 per centof GDP. Moreover, a large part of the cash surplus arose from the increased return on fund assetsfollowing the liberalisation of interest rates in 1989.
The 1998 reform: a small reform of the social security system
54. In March 1998, the Government promised to introduce a two-stage pension reform. The firststage would introduce minor organisational changes during 1998 and reflects agreement between socialpartners in the social dialogue on pension reform. The second stage will aim at a major overhaul of thepublic pay-as-you-go pension system. The timing of the implementation of the second stage has not yetbeen announced but is expected to coincide with the next legislature which will convene no later thanOctober 2000. Delaying the introduction of significant changes to the pension system was partly due to theGovernment's desire to focus on labour market reform. The Government also did not implement costsaving measures that had been planned by the 1990-92 pension reforms to start in 1998. These delays inthe implementation of pension reform will make the eventual overhaul of the system more difficult.
55. The first stage of pension reform aims to improve the organisation of the pension system byreducing the large number of funds, which results in a complex and non-transparent structure. By reducingtheir number, the reform also aims to eliminate certain deficitary funds through mergers with larger,financially healthier ones. A new fund has replaced the three large primary funds for the self-employed,unified 12 supplementary funds for civil servants and the 48 funds for rural lawyers, and merged7 supplementary funds experiencing financial difficulties with the large supplementary fund forprivate-sector employees. The creation in the near future of a unified pension fund for employees ofstate-owned banks is also envisaged. These operations will increase overall pension expenditure since no

ECO/WKP(99)7
28
individual’s pension will be reduced while in several cases the regulations will allow a gradual convergenceof pension benefits to the more generous level of the dominant fund in the new groupings. The mostnotably examples are the cases of the new fund for the self-employed and the supplementary funds.51
56. The reform also aims at generating some financial savings for the social security system. First,efforts will be made to reduce contribution evasion, including through the introduction of labourinspectors. Second, starting in 2001 pensioners who work and are below the age of 55 will not receivetheir pension. Those who are above the age of 55 will receive only 30 per cent of their pension for theamount of pension exceeding Dr 200 000 per month (which effectively excludes over 80 per cent of allprivate sector pensioners). Third, in response to a constitutional court ruling on the equality between thesexes, survivors’ pensions will henceforth also be provided to both sexes — males had previously not beeneligible. However, the survivors pension will be provided for only three years. Exceptions exist if asurvivor is without work or pension (in which case after the third year the survivor would receive 50 percent of the survivor’s pension if above the age of 65 and nothing if below the age of 65). This measurewill not be applied retroactively to women but men can apply for a survivor’s pension if they qualify.
57. The Government did not implement certain planned aspects of pension reform, and also tookdecisions that are not commensurate with the final reform objectives. Most importantly, the Governmenthas decided to postpone indefinitely several measures foreseen by the 1990-92 reforms of the pensionsystem to commence in January 1998. Specifically, legislation envisaged the following measures. First,the restriction of all supplementary pensions to at most 20 per cent of the pension base. Second, the raisingof the minimum retirement age for receiving a pension early on account of work in arduous and unhealthyenvironments. Third, the raising of the number of years of work required for eligibility for a full pensionin public enterprises and state-owned banks. A less costly measure, but one that constituted an importantchange in philosophy, concerned the broadened access of low income pensioners to the means-testedpension supplement. This supplement was introduced in 1997 for pensioners above the age of 65 and wasa first step at providing benefits in the social security system that did not include incentives for earlyretirement. The supplement will henceforth be made available to pensioners over the age of 60, and alsoapply to certain categories without age limit (e.g. survivors with under-age children). The supplement wasincreased by about 50 per cent in 1999 raising the budget cost to Dr 60 billion. In a similar move, theGovernment did not implement an envisaged reform of the expensive “lifetime” pension for mothers infamilies with more than two children, which would have made it means-tested and provided only towomen above the age of 65.52 Finally, the Government raised significantly the base used for calculatinginvalidity pensions for individuals who entered the work force after 1993 (the date of the last majorreform). This had previously been based on a share of 1992 per capita income (adjusted by the cost ofliving adjustments applied to private sector pensions). Though several of these measures providednecessary support to low-income pensioners, they may be providing poor incentives regarding earlyretirement as they are introduced outside a comprehensive reform package.
51. The package of measures also includes raising the limit on the share of liquid assets that pension funds can
invest in the stock market from 20 per cent to 23 per cent beginning in 2001; the remainder will remaininvested in government bonds.
52. There are 210,000 women eligible for this benefit with a budgetary cost of Dr 130 billion.

ECO/WKP(99)7
29
58. The overall deficit of the social security system will be contained by the additional contributionsfrom the new primary pension for farmers and the registration of illegal immigrants. The effect on overallgovernment finances will be much smaller, however, since the Government pays two-thirds of the farmers’contributions. Moreover, eligibility requirements for such pensions are lax, and many immigrants arelikely to contribute for the minimum period necessary to attain eligibility for health coverage and willreceive health care throughout the year. Transfers from the budget to social security funds are expected toincrease from Dr 840 billion in 1997 to an estimated Dr 900 billion in 1999 (equivalent to 2½ per cent ofGDP).

ECO/WKP(99)7
30
ANNEX III
Pension projections: a description of the model
This annex describes the construction of the pension model, whose basic design is based on Van DenNoord and Herd (1993).53
Coverage
The model covers old-age, survivor and invalidity pensions, provided by primary and supplementaryfunds, as well as separation payments. Health care and other social benefits (and their correspondingcontributions) are not included in the calculations. The model divides contributors and pensioners into thefollowing seven groups:
− private sector dependent workers (IKA, IKA-TEAM, etc.);
− seamen (NAT);
− self-employed small entrepreneurs and traders (TEBE, TAE, etc.);
− self-employed professionals (doctors, lawyers, and engineers);
− farmers (OGA);
− general government employees (excluding war pensions and pensions for members of thenational resistance); and
− public sector employees in public enterprises and state-owned banks.
Separate estimates are made for each of the above mentioned pension categories for each of the sevengroups.
The revenues of the pension model exclude all receipts that are not contribution based such as earmarkedtaxes (where it was possible to separate out earmarked taxes from contributions), budget transfers topension funds and earnings from funds’ assets. In addition, in order to make the projections comparable tothose undertaken by the OECD for other countries, the model excludes contributions that are madeimplicitly or explicitly by the State. The rationale for their exclusion is that the source of such revenues isgeneral taxation. These receipts include the State’s one-third share of the tripartite financing for thecontributions of workers that entered the workforce after 1992, the State’s two-thirds share of thecontributions for farmers’ pensions, and the State’s implicit contributions as employer.
53. P. Van Den Noord and R. Herd, (1993), “Pension liabilities in the seven major economies,” OECD
Economics Department Working Papers, No. 142, Paris.

ECO/WKP(99)7
31
Assumptions
Demographics and employment growth: The population projections for the period 2000 to 2070 are takenfrom the World Bank.54 The main assumption underlying the projections are that fertility rates will returnto replacement rates by 2030 and that life expectancy will increase by about 4 years during the same timehorizon. The labour force participation rate is assumed to be constant. The NAWRU is also assumed to beconstant from 2000 onwards, implying that the unemployment rate thereafter remains at about 9 per cent.55
The initial distribution of employment between the different sectors is based on the labour force survey ofthe Greek National Statistical Agency and national accounts data. The employment shares do not remainconstant over the projection period for all sectors. The projections assume that the share of employment inthe agricultural sector falls to 14 per cent by 2035 from 21 per cent in 1995. The employment share of theself-employed traders and small entrepreneurs and private dependent workers is each assumed to increaseby one-half of this decline. For the other sectors, the employment share is assumed to remain constantthroughout the projection period.
Earnings and output growth: The analysis is conducted in constant 1994 prices. Earnings are assumed toincrease in line with labour productivity (1½ per cent per year for each sector). Output increases in linewith productivity and employment.
The model
Pensioners and contributors: The base year of the model is 1994 -- the most recent year for whichaccounts could be collected for the main pension funds. Old-age primary pensions (the number ofpensioners is not known) are assumed to grow in line with the population over the age of 60 or 65,depending on the sector, as well as movements in the sectoral employment rates (lagged by the averagenumber of working years in the sector). The unemployed are assumed to be ineligible for any pension.Moreover, pension eligibility is assumed to tighten under the 1990-92 reform. For the sectors where thereis a discrepancy between the number of primary and supplementary pensions (primarily IKA),supplementary pensions are assumed to mature and equal the number of primary pensions. Survivorspensions are assumed to grow in line with the population aged 50 and above, and invalidity pensions inline with the population between the ages of 45 and 60 years old. Separation payments are assumed togrow in line with the population aged 60-65 years. Contributors are assumed equal to the number ofemployed workers.
Contributions: For each fund (primary, supplementary or separation), contributions are the product of thesector specific contribution rate, the wage and the number of contributors. For each fund, the contributionrate is derived from 1994 data, using the above-described hypotheses for the number of contributors andthe sectoral wage. Adjustments are made to the contribution rate to account for the 1990-92 reforms.These include the following. First, the increase in the contribution rates of government employees to thoseof the private sector, the unification of contribution rates for the post-1992 entrants into the labour force.Second, the increase in the presumed income categories of the self-employed traders and smallentrepreneurs. Third, some increase in the contribution rates of IKA reflecting the reduction incontribution evasion as the minimum wage is kept constant in real terms (and thus provides a decliningreplacement rate relative to the pension arising from the pension formula). Fourth, the contribution rate forfarmers rises, reflecting the introduction of their new primary pension fund. 54. E. Bos et al. (1994), World Population Projections, 1994-95, The International Bank for Reconstruction
and Development, The World Bank, Washington DC.
55. In view of the generosity of the individual pension, a higher labour force participation ratio and a lowerunemployment rate would lead to a deterioration of the pension system’s financial position, though theincreased contributions would improve the system’s finances in the short term.

ECO/WKP(99)7
32
Pension expenditure: The pension outlay per individual is the product of the replacement ratio and thewage at the time of retirement. Since pensions are assumed to be indexed to inflation and not to wages, thepensions of older pensioners are lower than those of younger ones. Thus, total pension expenditure foreach fund is the sum of outlays on three or four age groups of pensioners (depending if the retirement agefor the sector is 60 or 65); those that have retired during the past five years, those that have retiredbetween 5 and 10 years earlier, those that have retired between 10 and 15 years earlier, and those that haveretired more than 15 years ago. The replacement ratio is derived from 1994 data by adjusting the averagepension by wage and pension adjustments for the period 1975-94. The replacement rate is adjusted toaccount for the effects of the 1990-92 reforms. These include the following. First, the lower replacementrates for the post-1992 entrants into the work force. Second, the gradual elimination of the doublecounting of the bonus months’ salary for IKA pensioners. Third, the reduction in supplementary pensionreplacement rates to 20 per cent starting from 1998. In addition, the replacement rate for IKA pensionersrises slightly reflecting the above mentioned reduction in contribution evasion following the reduction ofthe minimum wage relative to the average wage. Finally, the replacement rate for farmers also increasesgradually reflecting the introduction of their new primary pension fund.
The main sources of uncertainty: These reflect the following (plus sign implies a reduction in the presentvalue of the net pension liabilities and a negative sign an increase):
(+) An over-estimation of the system’s maturity.
(+) No adjustment for the increase in the retirement age of women without under-age childrenfrom 60 to 65 under the post-1992 regime (i.e. starting from 2025).
(+) No adjustment for the existence of the progressive tax on pensions which exceed certainlimits, the implementation of the overall cap on pension receipts, or the changes independency allowances and restrictions on multiple pensions under the 1990-1992 reforms.
(+) No adjustment for the elimination of the “35 year” rule.
(?) No increase in the retirement age of male civil servants hired post 1982 to the level of theprivate sector by 2007. However, the model assumes that all civil servants retire at age 60from the beginning of the projections, which should broadly offset this factor.
(-) An overestimation of the tightening in eligibility arising from the 1990-1992 reforms. Theeligibility ratio falls by about 40 per cent during the projection period.
(-) The assumption that the unemployed do not qualify for any pension.
(-) No specific account is taken for arduous and unhealthy condition for early retirement.
(-) Reduction of contributions for certain self-employed professionals by the amountcorresponding to their regimes’ receipt of earmarked taxes.
(-) All farmers are assumed to retire at 65 while many receive invalidity pensions earlier.

ECO/WKP(99)7
33
Table 1. The structure of pension funds1
Contributors(per cent of
total)
Primary pensions(per cent of total)
Dependencyratio2
Main primary funds Additional coverage by:Supplementary fund Separation fund
1. Private sector employees 39.5 37.6 1 : 1.9 IKA Yes Some
Of which: seamen 0.8 2.7 1 : 0.5 NAT Yes Yes
2. Public sector employees 13.8 14.9 1 : 1.6
General government3 9.0 11.7 1 : 1.4 - - Yes4 Yes
Public enterprises andstate-owned banks
4.8 3.2 1 : 2.6 Eight funds Yes Yes
3. Self-employed
Agriculture 20.1 36.8 1 : 1.0 OGA No5 No
Non-agriculture 26.7 10.7 1 : 4.4
Small entrepreneurs and traders 22.0 9.0 1 : 4.3 TEBE No Some
Professionals 4.7 1.7 1 : 5.0 Lawyers, doctors,engineers funds Yes Yes
Total 100.0 100.0 1 : 1.8
1. Funds under Ministry of Welfare and Social Security and other ministries.2. Primary pensions per contributor.3. Excluding war pensions and pensions for participants in the national resistance.4. The typical civil servant has two supplementary pensions.5. The farmer’s supplementary fund was turned into a primary fund in 1997.
Source: Ministry of Welfare and Social Security.
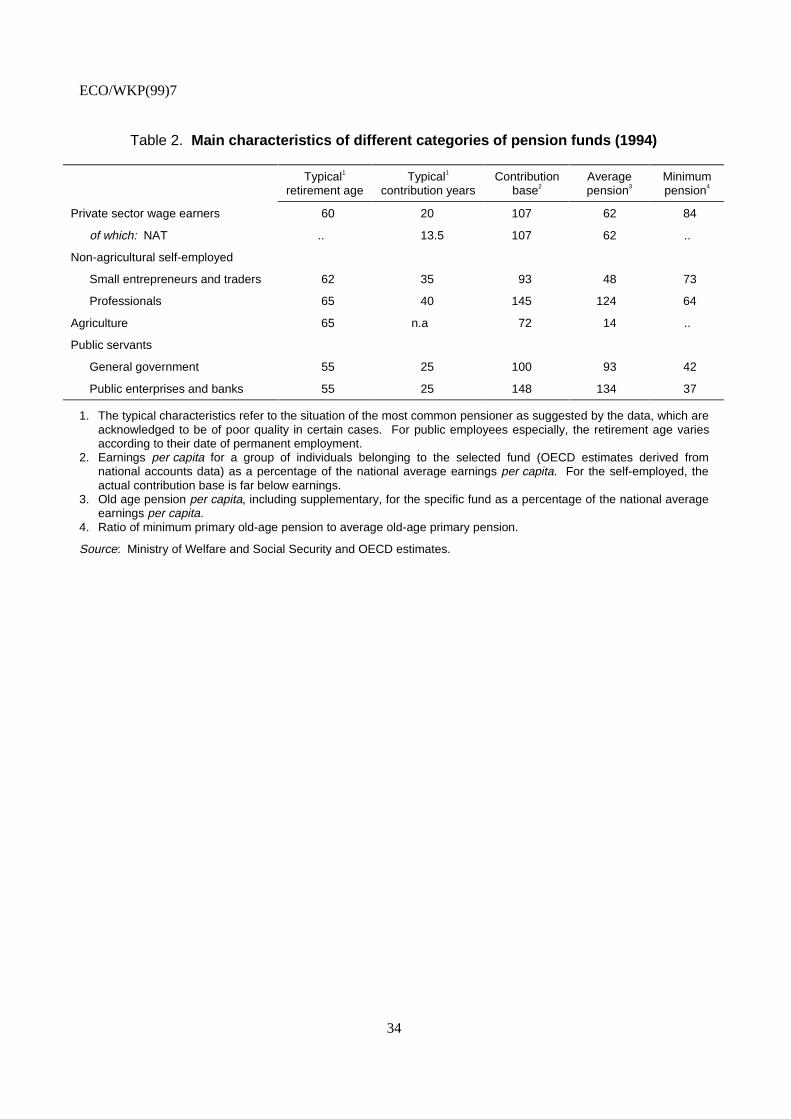
ECO/WKP(99)7
34
Table 2. Main characteristics of different categories of pension funds (1994)
Typical1
retirement ageTypical1
contribution yearsContribution
base2Averagepension3
Minimumpension4
Private sector wage earners 60 20 107 62 84
of which: NAT .. 13.5 107 62 ..
Non-agricultural self-employed
Small entrepreneurs and traders 62 35 93 48 73
Professionals 65 40 145 124 64
Agriculture 65 n.a 72 14 ..
Public servants
General government 55 25 100 93 42
Public enterprises and banks 55 25 148 134 37
1. The typical characteristics refer to the situation of the most common pensioner as suggested by the data, which areacknowledged to be of poor quality in certain cases. For public employees especially, the retirement age variesaccording to their date of permanent employment.
2. Earnings per capita for a group of individuals belonging to the selected fund (OECD estimates derived fromnational accounts data) as a percentage of the national average earnings per capita. For the self-employed, theactual contribution base is far below earnings.
3. Old age pension per capita, including supplementary, for the specific fund as a percentage of the national averageearnings per capita.
4. Ratio of minimum primary old-age pension to average old-age primary pension.
Source: Ministry of Welfare and Social Security and OECD estimates.

ECO/WKP(99)7
35
Table 3. Contribution and replacement rates in 1995
(Percentage points unless otherwise indicated)
Contribution rate1 Old-age replacement rates
Statutory Effective2 Statutory3 Effective2
Total4 Primary Total4 Primary Total4 Primary Total4 Primary
Private sector wage earners (IKA) 26 20 19 15 90-110 70-90 62 49
Seamen (NAT) n.a 15-23 28 21 100 80 65 53
Small entrepreneurs and traders (TEBE)5 20 20 8 8 90 90 54 54
Professionals5 n.a n.a 13 5 n.a 80 90 55
Farmers (OGA)5
Old 4 .. 1 0 n.a n.a 20 16 New 7 7 .. .. 70 70 .. ..
Civil servants6 15.75 6.75 12 6 1527 80 1097 80
Public enterprises and state-owned banks8 42 33 26 21 100 80 98 80
Total .. .. 14 10 .. .. 53 41
Memorandum: Post-1992 new entrants into work force 269 209 .. .. 80 60 .. ..
1. Employer and employee contributions.2. The effective contribution and replacement rates are derived from the actual pension expenditure and contribution using national accounts data for the derivation of
sectoral earnings.3. For 35 years’ contributions.4. Primary and supplementary pensions.5. Contributions and pensions based on either fixed or voluntary income classes, which are often unrelated to actual earnings. Statutory contribution and replacement
rates are based on these nominal values, and the median income class where applicable. Effective contribution rates are often biased upwards by the inclusion ofreceipts from earmarked taxes.
6. Excluding the participation of Government as employer. Employee contributions for primary pensions were introduced in 1993 and the rate raised to that in theprivate sector by 1995.
7. Includes two supplementary pensions.8. Statutory rates are proxied by those of the Public Electricity Company (DEH).9. Excludes government contribution amounting to 10 percentage points.
Source: Social Security Budget and OECD estimates.

ECO/WKP(99)7
36
Table 4. Baseline scenario
IKA Civilservants
Bank/Pub. Ent.(proxiedby DEH)
TEBE OGA Newsystem
NewOGA
Age at which first employed 25 25 25 25 25 25 25Number of years employed 35 35 35 35 35 35 35Age at retirement 60 60 60 60 60 60 60Age at start of pension collection 60 60 60 60 60 60 60Age at end of pension collection 75 75 75 75 75 75 75Age until which survivor’s pension
collected n.a n.a n.a n.a n.a n.a n.a.
Starting monthly wage 100 100 100 100 100 100 100Rate of growth of average wage (%) 2 2 2 2 2 2 2Final wage 196 196 196 196 196 196 196Average lifetime monthly wage 143 143 143 143 143 143 143Pension base 188 196 196 143 196 188 143
Contribution rate: 26 33 48 20 5 26 21Employee 10 20 20 20 5 10 7Employer 16 13 29 0 0 16 14
Contributions at start of career 26 33 48 20 5 26 21
Value of monthly pension 199 294 196 186 56 151 100Basic 143 157 157 186 29 113 100Supplementary 56 137 39 0 27 38 0Separation (lump sum) 0 8345 5882 0 0 0 0
Replacement rate 101 150 100 95 29 77 51Basic 73 80 80 95 15 58 51Supplementary 28 70 20 0 14 19 0Separation (lump sum) % ofyearly wage 0 304 214 0 0 0 0
Ratio of entitlement to contributions1 146 538 257 178 222 111 91Basic 136 475 299 178 n.a 108 91Supplementary 177 919 274 n.a 108 120 n.aSeparation n.a 3040 1429 n.a n.a n.a n.a
Rate of return on contributions 1.1 4.9 2.7 1.7 2.3 0.3 -0.3Basic 0.9 4.6 3.2 1.7 n.a 0.2 -0.3Supplementary 1.6 6.5 2.9 n.a 0.2 0.5 n.aSeparation n.a 10.2 7.9 n.a n.a n.a n.a
Memorandum item:Rate of discount 2.0 2.0 2.0 2.0 2.0 2.0 2.0
n.a not applicable.
1. Both entitlements and contributions are discounted to present value terms.
Source: OECD calculations based on formulae provided by the Greek authorities.

ECO/WKP(99)7
37
Table 5. Scenario – Baseline including survivors’ pensions
IKA Civilservants
Bank/Pub. Ent.(proxiedby DEH)
TEBE OGA Newsystem
NewOGA
Age at which first employed 25 25 25 25 25 25 25Number of years employed 35 35 35 35 35 35 35Age at retirement 60 60 60 60 60 60 60Age at start of pension collection 60 60 60 60 60 60 60Age at end of pension collection 75 75 75 75 75 75 75Age until which survivor’s pension
collected 85 85 85 85 n.a 85 85
Starting monthly wage 100 100 100 100 100 100 100Rate of growth of average wage (%) 2 2 2 2 2 2 2Final wage 196 196 196 196 196 196 196Average lifetime monthly wage 143 143 143 143 143 143 143Pension base 188 196 196 143 196 188 143
Contribution rate: 26 33 48 20 5 26 21Employee 10 20 20 20 5 10 7Employer 16 13 29 0 0 16 14
Contributions at start of career 26 33 48 20 5 26 21
Value of monthly pension 199 294 196 186 56 151 100Basic 143 157 157 186 29 113 100Supplementary 56 137 39 0 27 38 0Separation (lump sum) 0 8345 5882 0 0 0 0
Replacement rate 101 150 100 95 29 77 51Basic 73 80 80 95 15 58 51Supplementary 28 70 20 0 14 19 0Separation (lump sum) % ofyearly wage 0 304 214 0 0 0 0
Ratio of entitlement to contributions1 206 609 289 243 222 157 129Basic 193 537 336 243 n.a 153 129Supplementary 251 1040 308 n.a 108 170 n.aSeparation n.a 3040 1429 n.a n.a n.a n.a
Rate of return on contributions 2.1 5.3 3.1 2.6 2.3 1.3 0.7Basic 1.9 4.9 3.5 2.6 n.a 1.2 0.7Supplementary 2.7 6.9 3.3 n.a 0.2 1.5 n.aSeparation n.a 10.2 7.9 n.a n.a n.a n.a
Memorandum item:Rate of discount 2.0 2.0 2.0 2.0 2.0 2.0 2.0
n.a not applicable.
1. Both entitlements and contributions are discounted to present value terms.
Source: OECD calculations based on formulae provided by the Greek authorities.

ECO/WKP(99)7
38
Table 6. Scenario – Receive pension at age 65 and maintain survivor’s pension
IKA Civilservants
Bank/Pub. Ent.(proxiedby DEH)
TEBE OGA Newsystem
NewOGA
Age at which first employed 25 25 25 25 25 25 25Number of years employed 35 35 35 35 35 35 35Age at retirement 60 60 60 60 60 60 60Age at start of pension collection 65 65 65 65 65 65 65Age at end of pension collection 75 75 75 75 75 75 75Age until which survivor’s pension
collected 85 85 85 85 85 85 85
Starting monthly wage 100 100 100 100 100 100 100Rate of growth of average wage (%) 2 2 2 2 2 2 2Final wage 196 196 196 196 196 196 196Average lifetime monthly wage 143 143 143 143 143 143 143Pension base 188 196 196 143 196 188 143
Contribution rate: 26 33 48 20 5 26 21Employee 10 20 20 20 5 10 7Employer 16 13 29 0 0 16 14
Contributions at start of career 26 33 48 20 5 26 21
Value of monthly pension 199 294 196 186 56 151 100Basic 143 157 157 186 29 113 100Supplementary 56 137 39 0 27 38 0Separation (lump sum) 0 8457 5882 0 0 0 0
Replacement rate 101 150 100 95 29 77 51Basic 73 80 80 95 15 58 51Supplementary 28 70 20 0 14 19 0Separation (lump sum) % ofyearly wage 0 308 214 0 0 0 0
Ratio of entitlement to contributions1 153 552 260 177 140 116 95Basic 143 486 303 177 n.a 113 95Supplementary 186 942 278 n.a 68 126 n.aSeparation n.a 3081 1429 n.a n.a n.a n.a
Rate of return on contributions 1.2 5.0 2.8 1.7 1.0 0.4 -0.1Basic 1.0 4.6 3.2 1.7 n.a 0.4 -0.1Supplementary 1.8 6.6 3.0 n.a -1.1 0.7 n.aSeparation n.a 10.3 7.9 n.a n.a n.a n.a
Memorandum item:Rate of discount 2.0 2.0 2.0 2.0 2.0 2.0 2.0
n.a not applicable.
1. Both entitlements and contributions are discounted to present value terms.
Source: OECD calculations based on formulae provided by the Greek authorities.

ECO/WKP(99)7
39
Table 7. Scenario – Discount rate raised to 4 per cent
IKA Civilservants
Bank/Pub. Ent.(proxiedby DEH)
TEBE OGA Newsystem
NewOGA
Age at which first employed 25 25 25 25 25 25 25Number of years employed 35 35 35 35 35 35 35Age at retirement 60 60 60 60 60 60 60Age at start of pension collection 60 60 60 60 60 60 60Age at end of pension collection 75 75 75 75 75 75 75Age until which survivor’s pension
collected n.a n.a n.a n.a n.a n.a n.a
Starting monthly wage 100 100 100 100 100 100 100Rate of growth of average wage (%) 2 2 2 2 2 2 2Final wage 196 196 196 196 196 196 196Average lifetime monthly wage 143 143 143 143 143 143 143Pension base 188 196 196 143 196 188 143
Contribution rate: 26 33 48 20 5 26 21Employee 10 20 20 20 5 10 7Employer 16 13 29 0 0 16 14
Contributions at start of career 26 33 48 20 5 26 21
Value of monthly pension 199 294 196 186 56 151 100Basic 143 157 157 186 29 113 100Supplementary 56 137 39 0 27 38 0Separation (lump sum) 0 8345 5882 0 0 0 0
Replacement rate 101 150 100 95 29 77 51Basic 73 80 80 95 15 58 51Supplementary 28 70 20 0 14 19 0Separation (lump sum) % ofyearly wage 0 304 214 0 0 0 0
Ratio of entitlement to contributions1 91 366 174 111 138 69 57Basic 85 322 203 111 n.a 67 57Supplementary 110 624 186 n.a 67 75 n.aSeparation n.a 2144 1007 n.a n.a n.a n.a
Rate of return on contributions -0.3 `3.8 1.6 0.3 0.9 -1.1 -1.6Basic -0.5 3.4 2.0 0.3 n.a -1.1 -1.6Supplementary 0.3 5.4 1.8 n.a -1.1 -0.8 n.aSeparation n.a 9.2 6.8 n.a n.a n.a n.a
Memorandum item:Rate of discount 4.0 4.0 4.0 4.0 4.0 4.0 4.0
n.a not applicable.
1. Both entitlements and contributions are discounted to present value terms.
Source: OECD calculations based on formulae provided by the Greek authorities.

ECO/WKP(99)7
40
Table 8. Scenario – Discount rate and real wage growth raised to 4 per cent
IKA Civilservants
Bank/Pub. Ent.(proxiedby DEH)
TEBE OGA Newsystem
NewOGA
Age at which first employed 25 25 25 25 25 25 25Number of years employed 35 35 35 35 35 35 35Age at retirement 60 60 60 60 60 60 60Age at start of pension collection 60 60 60 60 60 60 60Age at end of pension collection 75 75 75 75 75 75 75Age until which survivor’s pension
collected n.a n.a n.a n.a n.a n.a n.a
Starting monthly wage 100 100 100 100 100 100 100Rate of growth of average wage (%) 4 4 4 4 4 4 4Final wage 379 379 379 379 379 379 379Average lifetime monthly wage 210 210 210 210 210 210 210Pension base 350 379 379 210 379 350 210
Contribution rate: 26 33 48 20 5 26 21Employee 10 20 20 20 5 10 7Employer 16 13 29 0 0 16 14
Contributions at start of career 26 33 48 20 5 26 21
Value of monthly pension 375 568 379 286 82 280 147Basic 266 304 304 286 29 210 147Supplementary 110 265 76 0 53 70 0Separation (lump sum) 0 16190 11383 0 0 0 0
Replacement rate 99 150 100 75 22 74 39Basic 70 80 80 75 8 55 39Supplementary 29 70 20 0 14 18 0Separation (lump sum) % ofyearly wage 0 305 214 0 0 0 0
Ratio of entitlement to contributions1 126 519 247 124 147 94 61Basic 116 458 288 124 n.a 91 61Supplementary 159 887 264 n.a 95 102 n.aSeparation n.a 3048 1429 n.a n.a n.a n.a
Rate of return on contributions 0.7 4.8 2.6 0.6 1.1 -0.2 -1.4Basic 0.4 4.4 3.1 0.6 n.a -0.3 -1.4Supplementary 1.3 6.4 2.8 n.a -0.1 0 n.aSeparation n.a 10.3 7.9 n.a n.a n.a n.a
Memorandum item:Rate of discount 4.0 4.0 4.0 4.0 4.0 4.0 4.0
n.a not applicable.
1. Both entitlements and contributions are discounted to present value terms.
Source: OECD calculations based on formulae provided by the Greek authorities.

ECO/WKP(99)7
41
Table 9. Scenario – Work for 25 years and retire at age 50
IKA Civilservants
Bank/Pub. Ent.(proxiedby DEH)
TEBE OGA Newsystem
NewOGA
Age at which first employed 25 25 25 25 25 25 25Number of years employed 25 25 25 25 25 25 25Age at retirement 50 50 50 50 50 50 50Age at start of pension collection 50 50 50 50 50 50 50Age at end of pension collection 75 75 75 75 75 75 75Age until which survivor’s pension
collected n.a n.a n.a n.a n.a n.a n.a
Starting monthly wage 100 100 100 100 100 100 100Rate of growth of average wage (%) 2 2 2 2 2 2 2Final wage 161 161 161 161 161 161 161Average lifetime monthly wage 128 128 128 128 128 128 128Pension base 155 161 161 128 161 155 128
Contribution rate: 26 33 48 20 5 26 21Employee 10 20 20 20 5 10 7Employer 16 13 29 0 0 16 14
Contributions at start of career 26 33 48 20 5 26 21
Value of monthly pension 114 144 80 114 45 88 64Basic 75 64 64 114 29 66 64Supplementary 39 80 16 0 16 22 0Separation (lump sum) 0 4890 4021 0 0 0 0
Replacement rate 71 90 50 71 28 55 40Basic 47 40 40 71 18 41 40Supplementary 24 50 10 0 10 14 0Separation (lump sum) % ofyearly wage 0 217 179 0 0 0 0
Ratio of entitlement to contributions1 218 585 291 283 459 168 151Basic 187 430 339 283 n.a 164 151Supplementary 323 1190 3211 n.a 164 182 n.aSeparation n.a 3040 1667 n.a n.a n.a n.a
Rate of return on contributions 3.2 7.3 4.4 4.2 6.3 2.1 1.7Basic 2.5 6.0 5.0 4.2 n.a 2.0 1.7Supplementary 4.8 10.4 4.6 n.a 2.0 2.4 n.aSeparation n.a 14.6 11.9 n.a n.a n.a n.a
Memorandum item:Rate of discount 2.0 2.0 2.0 2.0 2.0 2.0 2.0
n.a not applicable.
1. Both entitlements and contributions are discounted to present value terms.
Source: OECD calculations based on formulae provided by the Greek authorities.

ECO/WKP(99)7
42
Table 10. Scenario – Work for 25 years and retire at age 60
IKA Civilservants
Bank/Pub. Ent.(proxiedby DEH)
TEBE OGA Newsystem
NewOGA
Age at which first employed 25 25 25 25 25 25 25Number of years employed 25 25 25 25 25 25 25Age at retirement 50 50 50 50 50 50 50Age at start of pension collection 60 60 60 60 60 60 60Age at end of pension collection 75 75 75 75 75 75 75Age until which survivor’s pension
collected n.a n.a n.a n.a n.a n.a n.a
Starting monthly wage 100 100 100 100 100 100 100Rate of growth of average wage (%) 2 2 2 2 2 2 2Final wage 161 161 161 161 161 161 161Average lifetime monthly wage 128 128 128 128 128 128 128Pension base 155 161 161 128 161 155 128
Contribution rate: 26 33 48 20 5 26 21Employee 10 20 20 20 5 10 7Employer 16 13 29 0 0 16 14
Contributions at start of career 26 33 48 20 5 26 21
Value of monthly pension 114 144 80 114 45 88 64Basic 75 64 64 114 29 66 64Supplementary 39 80 16 0 16 22 0Separation (lump sum) 0 5028 4021 0 0 0 0
Replacement rate 71 90 50 71 28 55 40Basic 47 40 40 71 18 41 40Supplementary 24 50 10 0 10 14 0Separation (lump sum) % ofyearly wage 0 223 179 0 0 0 0
Ratio of entitlement to contributions1 118 496 253 153 248 91 82Basic 101 364 295 153 n.a 89 82Supplementary 174 1008 270 n.a 88 98 n.aSeparation n.a 3126 1667 n.a n.a n.a n.a
Rate of return on contributions 0.7 6.6 3.8 1.7 3.7 -0.4 -0.8Basic 0.0 5.3 4.4 1.7 n.a -0.5 -0.8Supplementary 2.2 9.7 4.1 n.a -0.5 -0.1 n.aSeparation n.a 14.8 11.9 n.a n.a n.a n.a
Memorandum item:Rate of discount 2.0 2.0 2.0 2.0 2.0 2.0 2.0
n.a not applicable.
1. Both entitlements and contributions are discounted to present value terms.
Source: OECD calculations based on formulae provided by the Greek authorities.

ECO/WKP(99)7
43
Table 11. Scenario – Pension options under IKA
BaselineArduous and unhealthy
conditions Minimum pension
Age at which first employed 25 25 25 25 50 50Number of years employed 35 35 35 35 15 15Age at retirement 60 60 60 60 65 65Age at start of pension collection 65 65 60 60 65 65Age at end of pension collection 75 75 75 75 75 75Age until which survivor’s pension
collected n.a 85 n.a 85 n.a 85
Starting monthly wage 100 100 100 100 100 100Rate of growth of average wage (%) 2 2 2 2 2 2Final wage 196 196 196 196 132 132Average lifetime monthly wage 143 143 143 143 115 115Pension base 188 188 188 188 127 127
Contribution rate: 26 26 32 32 26 26Employee 10 10 13 13 10 10Employer 16 16 19 19 16 16
Contributions at start of career 26 26 32 32 26 26
Value of monthly pension 199 199 199 199 121 121Basic 143 143 143 143 94 94Supplementary 56 56 56 56 27 27Separation (lump sum) 0 0 0 0 0 0
Replacement rate 101 101 101 101 92 92Basic 73 73 73 73 71 71Supplementary 28 28 28 28 20 20Separation (lump sum) % ofyearly wage 0 0 0 0 0 0
Ratio of entitlement to contributions1 92 153 120 170 215 356Basic 86 143 116 164 217 360Supplementary 112 186 133 188 208 345Separation n.a n.a n.a n.a n.a n.a
Rate of return on contributions -0.2 1.2 0.5 1.5 5.2 8.8Basic -0.4 1.0 0.4 1.4 5.3 8.9Supplementary 0.3 1.8 0.8 1.8 5.0 8.6Separation n.a n.a n.a n.a n.a n.a
Memorandum item:Rate of discount 2.0 2.0 2.0 2.0 2.0 2.0
n.a not applicable.
1. Both entitlements and contributions are discounted to present value terms.
Source: OECD calculations based on formulae provided by the Greek authorities.

ECO/WKP(99)7
44
Table 12. Implicit gross liabilities of the public pension system1
(Present value of expenditure minus contributions)
Baseline scenarioAlternative scenarios
(as a percentage of 1994 GDP)
As a percentageof 1994 GDP
As a percentage oftotal revenue
Increase ineffective
contribution rate by50 per centfrom 2010
Decrease ineffective
replacement rate by50 per centfrom 2010
Increase ineffective
retirement age by5 years
from 20002
Increase ineffective
retirement age by10 years
from 20003
IKA and Other 61 52 27 11 30 -3
NAT 12 424 11 9 10 7
Self-employed
Small entrepreneurs and traders 13 42 4 0 6 -1
Professionals4 3 38 1 0 3 1
OGA 45 469 42 36 45 37
Civil servants5 49 230 43 34 39 29
Public enterprises and banks 10 50 4 3 4 -2
Total 193 92 132 93 137 68
1. The OECD estimates exclude earmarked taxes, government transfers, tripartite financing and all other non-contribution based revenue. The model’s assumptions aredescribed in Annex III.
2. Except for the case of self-employed professionals and farmers, where the baseline scenario assumes retirement age of 65.3. Except for the case of self-employed professionals and farmers, where the retirement age is increased by 5 years.4. The results for self-employed professionals are biased by the inability in many cases to separate out earmarked taxes from earnings based contributions.5. Excluding the participation of Government as an employer. Including a government participation equivalent to twice the employees’ contribution would reduce the
present value of net liabilities to 42 per cent of 1994 GDP.
Source: Social Security Budget.

ECO/WKP(99)7
45
Figure 1. INTERACTION OF REPLACEMENT RATES AND THE MINIMUM PRIMARY PENSION FOR IKA IN 1995 (1)13th bracket, per cent of pension base
1. The pension formula for IKA provides higher replacement rates for lower incomes. Contributors are placed into 28 income brackets, with identical replacement rate formulas for the highest 15 income brackets. Most insured fall in the 13th income bracket. From 1992, the minimum pension was increased by 1 per cent for each year of contributions after the 15th year. For lower income brackets, the minimum pension exceeds the pension derived from the pension formula for 35 years contributions.Source: IKA.
40
50
60
70
80
90
100Replacement rates
40
50
60
70
80
90
100
15 16 17 18 19 20 21 22 23 24 25 26 27 28 29 30 31 32 33 34 35 36 37 38 39 40
Years of contribution

ECO/WKP(99)7
46
Figure 2. CUMULATIVE DISTRIBUTION OF PRIMARY PENSION LEVELS FOR MAJOR EMPLOYMENT CATEGORIES(1995)
Source: Social Security budgets.
0
20
40
60
80
100
120%
0
20
40
60
80
100
120%
Minimum pension for IKA
20 40 60 70 80 90 100 110 120 140 160 180 200 220 240 260 280 300 320
Thousands drachmas
IKASelf-employedCentral governmentBanksSeamen

ECO/WKP(99)7
47
Figure 3. ELDERLY DEPENDENCY RATIOS (1)Per cent
1. Population aged 65 and over as a per cent of working age population.Source: World Bank.
10
15
20
25
30
35
40
45
50
55
60
65%
10
15
20
25
30
35
40
45
50
55
60
65%
1960 1965 1970 1975 1980 1985 1990 1995 2000 2005 2010 2015 2020 2025 2030 2035 2040 2045 2050 2055 2060 2065 2070
GREECESpainOECD-EuropeTotal OECD

ECO/WKP(99)7
48
Figure 4. PENSION PAYMENTS AND CONTRIBUTIONS SIMULATIONAs a percentage of GDP
Source: OECD.
0
5
10
15
20
25%
0
5
10
15
20
25%
A. Greece
1995 2005 2015 2025 2035 2045 2055 2065
ContributionsPension payments
0
5
10
15
20
25%
0
5
10
15
20
25%
B. France
1995 2005 2015 2025 2035 2045 2055 2065
ContributionsPension payments
0
5
10
15
20
25%
0
5
10
15
20
25%
C. Belgium
1995 2005 2015 2025 2035 2045 2055 2065
ContributionsPension payments
0
5
10
15
20
25%
0
5
10
15
20
25%
D. Portugal
1995 2005 2015 2025 2035 2045 2055 2065
ContributionsPension payments

ECO/WKP(99)7
49
Figure 5. EXPENDITURE ON PENSIONS
Source: OECD.
0
5
10
15
20
25%
0
5
10
15
20
25%
Separation
Primary
Supplementary
A. Components of total pension expenditure As a percentage of GDP
1995 2000 2005 2010 2015 2020 2025 2030 2035 2040 2045 2050 2055 2060 2065 2070
80
90
100
110
120
130
140
150
160
170
180
80
90
100
110
120
130
140
150
160
170
180B. Transfer ratio and supplementary pensions 1995 = 100
1995 2000 2005 2010 2015 2020 2025 2030 2035 2040 2045 2050 2055 2060 2065 2070
Ratio of the number of supplementary pensions to basic pensions (excluding OGA)Transfer ratio (Average pension / average earning)
50
100
150
200
250
300
50
100
150
200
250
300C. Decomposition of beneficiary ratio 1995 = 100
1995 2000 2005 2010 2015 2020 2025 2030 2035 2040 2045 2050 2055 2060 2065 2070
Dependency ratio (population over 65 to population 15-64)Eligibility ratio (pensions to population over 65)Inactivity ratio (population 15-64 to total employment)

ECO/WKP(99)7
50
Figure 6. INDIVIDUAL SECTOR PENSION SIMULATIONS (1)As a per cent of GDP
1. Includes primary and supplementary pensions.Source: OECD.
3
4
5
6
7
8
9
10
11
12%
3
4
5
6
7
8
9
10
11
12%
IKA + other private sector employees
1995 2000 2005 2010 2015 2020 2025 2030 2035 2040 2045 2050 2055 2060 2065 2070
ContributionsPension payments
0.5
1.0
1.5
2.0
2.5
3.0
3.5%
0.5
1.0
1.5
2.0
2.5
3.0
3.5%
General government
1995 2000 2005 2010 2015 2020 2025 2030 2035 2040 2045 2050 2055 2060 2065 2070
ContributionsPension payments
0.0
0.5
1.0
1.5
2.0
2.5
3.0
3.5
4.0%
0.0
0.5
1.0
1.5
2.0
2.5
3.0
3.5
4.0%
Farmers (OGA)
1995 2000 2005 2010 2015 2020 2025 2030 2035 2040 2045 2050 2055 2060 2065 2070
ContributionsPension payments

ECO/WKP(99)7
51
Figure 6. INDIVIDUAL SECTOR PENSION SIMULATIONS (Cont.) (1)As a per cent of GDP
1. Includes primary and supplementary pensions.Source: OECD.
0.5
1.0
1.5
2.0
2.5
3.0%
0.5
1.0
1.5
2.0
2.5
3.0%
Small entrepreneurs and traders
1995 2000 2005 2010 2015 2020 2025 2030 2035 2040 2045 2050 2055 2060 2065 2070
ContributionsPension payments
0.7
0.8
0.9
1.0
1.1
1.2
1.3
1.4
1.5%
0.7
0.8
0.9
1.0
1.1
1.2
1.3
1.4
1.5%
Public enterprises and state-owned banks
1995 2000 2005 2010 2015 2020 2025 2030 2035 2040 2045 2050 2055 2060 2065 2070
ContributionsPension payments
0.2
0.3
0.4
0.5
0.6
0.7
0.8%
0.2
0.3
0.4
0.5
0.6
0.7
0.8%
Self-employed professionals
1995 2000 2005 2010 2015 2020 2025 2030 2035 2040 2045 2050 2055 2060 2065 2070
ContributionsPension payments

ECO/WKP(99)7
52
Figure 7. PENSION SIMULATIONS ACCORDING TO TYPE OF PENSIONAs a per cent of GDP
Source: OECD.
4
6
8
10
12
14
16
18%
4
6
8
10
12
14
16
18%
Primary
1995 2000 2005 2010 2015 2020 2025 2030 2035 2040 2045 2050 2055 2060 2065 2070
ContributionsPension payments
1
2
3
4
5
6
7
8%
1
2
3
4
5
6
7
8%
Supplementary
1995 2000 2005 2010 2015 2020 2025 2030 2035 2040 2045 2050 2055 2060 2065 2070
ContributionsPension payments
0.25
0.30
0.35
0.40
0.45
0.50%
0.25
0.30
0.35
0.40
0.45
0.50%
Separation
1995 2000 2005 2010 2015 2020 2025 2030 2035 2040 2045 2050 2055 2060 2065 2070
ContributionsPension payments
ECO/WKP(99)7
53
Figure 7. PENSION SIMULATIONS ACCORDING TO TYPE OF PENSION (Cont.) As a per cent of GDP
Source: OECD.
6
8
10
12
14
16
18
20
22
24%
6
8
10
12
14
16
18
20
22
24%
Old age
Invalidity
Survivors
1995 2000 2005 2010 2015 2020 2025 2030 2035 2040 2045 2050 2055 2060 2065 2070

ECO/WKP(99)7
54
Figure 8. ALTERNATIVE ASSUMPTIONSAs a per cent of GDP
1. Increase in participation rate to EU average.2. Decrease in productivity to 1 per cent from 1.5 per cent.Source: OECD.
6
8
10
12
14
16
18
20
22
24
%
6
8
10
12
14
16
18
20
22
24
%
Baseline
1995 2000 2005 2010 2015 2020 2025 2030 2035 2040 2045 2050 2055 2060 2065 2070
ContributionsPension payments
6
8
10
12
14
16
18
20
22
24
%
6
8
10
12
14
16
18
20
22
24
%
Participation rate (1)
1995 2000 2005 2010 2015 2020 2025 2030 2035 2040 2045 2050 2055 2060 2065 2070
ContributionsPension payments
6
8
10
12
14
16
18
20
22
24
%
6
8
10
12
14
16
18
20
22
24
%
Productivity (2)
1995 2000 2005 2010 2015 2020 2025 2030 2035 2040 2045 2050 2055 2060 2065 2070
ContributionsPension payments

ECO/WKP(99)7
55
Figure 9. POPULATION COMPOSITION1995
12 10 8 6 4 2
Greece
Men
Source: World Bank.
0 2 4 6 8 10 12
75+
70-74
65-69
60-64
55-59
50-54
45-49
40-44
35-39
30-34
25-29
20-24
15-19
10-14
5-9
0-4
WomenAge Year reach
age of 60
12 10 8 6 4 2
1980
1985
1990
1995
2000
2005
2010
2015
2020
2025
2030
2035
2040
2045
2050
2055
EU
Men
0 2 4 6 8 10 12
Women

ECO/WKP(99)7
56
Figure 10. ADJUSTMENT SCENARIOS (1)As a per cent of GDP
1. Includes primary and supplementary pensions.2. Increase in effective contribution rate by 50% from 2010.3. Decrease in effective replacement rate by 50% from 2010.Source: OECD.
6
8
10
12
14
16
18
20
22
24
%
6
8
10
12
14
16
18
20
22
24
%
Baseline
1995 2000 2005 2010 2015 2020 2025 2030 2035 2040 2045 2050 2055 2060 2065 2070
ContributionsPension payments
6
8
10
12
14
16
18
20
22
24
%
6
8
10
12
14
16
18
20
22
24
%
Contribution rate (2)
1995 2000 2005 2010 2015 2020 2025 2030 2035 2040 2045 2050 2055 2060 2065 2070
ContributionsPension payments
6
8
10
12
14
16
18
20
22
24
%
6
8
10
12
14
16
18
20
22
24
%
Replacement rate (3)
1995 2000 2005 2010 2015 2020 2025 2030 2035 2040 2045 2050 2055 2060 2065 2070
ContributionsPension payments

ECO/WKP(99)7
57
Figure 10. ADJUSTMENT SCENARIOS (Cont.) (1)As a per cent of GDP
1. Includes primary and supplementary pensions.2. Increase in effective retirement age by 5 years from 2000.3. Increase in effective retirement age by 10 years from 2000.Source: OECD.
6
8
10
12
14
16
18
20
22
24
%
6
8
10
12
14
16
18
20
22
24
%
Baseline
1995 2000 2005 2010 2015 2020 2025 2030 2035 2040 2045 2050 2055 2060 2065 2070
ContributionsPension payments
6
8
10
12
14
16
18
20
22
24
%
6
8
10
12
14
16
18
20
22
24
%
Retirement age (2)
1995 2000 2005 2010 2015 2020 2025 2030 2035 2040 2045 2050 2055 2060 2065 2070
ContributionsPension payments
6
8
10
12
14
16
18
20
22
24
%
6
8
10
12
14
16
18
20
22
24
%
Retirement age (3)
1995 2000 2005 2010 2015 2020 2025 2030 2035 2040 2045 2050 2055 2060 2065 2070
ContributionsPension payments

ECO/WKP(99)7
58
Figure A1. EXPENDITURE ON PENSIONS
Source: Social Security Budgets.
1962 1964 1966 1968 1970 1972 1974 1976 1978 1980 1982 1984 1986 1988 1990 1992 19940
2
4
6
8
10
12
14%
0
2
4
6
8
10
12
14%
Supplementary
Separation and other
Primary
A. Components of total pension expenditure As a percentage of GDP
1962 1964 1966 1968 1970 1972 1974 1976 1978 1980 1982 1984 1986 1988 1990 1992 199480
100
120
140
160
180
200
80
100
120
140
160
180
200B. Transfer ratio and supplementary pensions 1962 = 100
Transfer ratio (Average pension / average earnings)Ratio of the number of supplementary pensions to basic pensions (including OGA)
1962 1964 1966 1968 1970 1972 1974 1976 1978 1980 1982 1984 1986 1988 1990 1992 199480
100
120
140
160
180
80
100
120
140
160
180C. Decomposition of beneficiary ratio 1962 = 100
Dependency ratio (population over 65 to population 15-64)Eligibility ratio (pensions to population over 65)Inactivity ratio (population 15-64 to total employment)

ECO/WKP(99)7
59
Figure A2. NEW IKA PENSIONERS BELOW AGE 60
Source: IKA.
1976 1978 1980 1982 1984 1986 1988 1990 1992 19940
5
10
15
20
25
30
35
40
45
50%
0
5
10
15
20
25
30
35
40
45
50%
A. Old age
New pensioners under 60 as a percentage of total new old age pensioners
MenWomen
1976 1978 1980 1982 1984 1986 1988 1990 1992 19945
10
15
20
25
30
35
40
45%
5
10
15
20
25
30
35
40
45%
B. Invalidity
New invalidity pensioners under 60 as a percentage of total new pensioners
MenWomen

ECO/WKP(99)7
60
Figure A3. CONTRIBUTIONS FOR PENSIONS
1. Including contributions for health care which amount to 2 per cent of GDP in 1994, excludes government contributions and transfers.2. Includes total of self-employed contributions.3. Contributions divided by total compensation.Source: Social Security budgets.
1962 1964 1966 1968 1970 1972 1974 1976 1978 1980 1982 1984 1986 1988 1990 1992 19941
2
3
4
5
6
7
8
9%
1
2
3
4
5
6
7
8
9%
Employer contributions
Employee contributions (2)
A. Decomposition of total contributions (1) As a percentage of GDP
1962 1964 1966 1968 1970 1972 1974 1976 1978 1980 1982 1984 1986 1988 1990 1992 199460
80
100
120
140
160
180
200
220
60
80
100
120
140
160
180
200
220B. Effective contribution rate 1962 = 100
contributors (excluding OGA)
Effective contribution rate (3)Ratio of the number of supplementary contributors to primary
1962 1964 1966 1968 1970 1972 1974 1976 1978 1980 1982 1984 1986 1988 1990 1992 199458
60
62
64
66
68
70
72
74
76%
58
60
62
64
66
68
70
72
74
76%
C. Labour share in business sector value added

ECO/WKP(99)7
61
Figure A4. PENSION EXPENDITURE AND RECEIPTSAs a percentage of GDP
1. Including total contributions for health care which amount to 2 per cent of GDP in 1994.Source: Social Security budget.
1966 1968 1970 1972 1974 1976 1978 1980 1982 1984 1986 1988 1990 1992 19943
4
5
6
7
8
9
10
11
12
13%
3
4
5
6
7
8
9
10
11
12
13%
A. Expenditure and contribution receipts
Total expenditureEmployers and employees contributions (1)
1966 1968 1970 1972 1974 1976 1978 1980 1982 1984 1986 1988 1990 1992 1994-1
0
1
2
3
4
5
6
7
8%
-1
0
1
2
3
4
5
6
7
8%
Earmarked taxes + return on assets
Transfers
Government pension payments
B. Financing of the gap between expenditure and contributions

ECO/WKP(99)7
62
ECONOMICS DEPARTMENTWORKING PAPERS
214. Greek Public Enterprises : Challenges for Reform( May 1999) Paul Mylonas and Isabelle Joumard
213. The Levels and Cyclical Behaviour of Mark-Ups Across Countries and Market Structures(May 1999) Joaquim Oliveira Martins and Stefano Scarpetta
212. Poverty Dynamics in Four OECD Countries(April 1999) Pablo Antolín, Thai-Thanh Dang and Howard OxleyAssisted by Ross Finnie and Roger Sceviour
211. The Recent Experience with Capital Flows to Emerging Market Economies(February 1999) Sveinbjörn Blöndal and Hans Christiansen
210. Foreign Portfolio Investors Before and During a Crisis(February 1999) Woochan Kim and Shang-Jin Wei
209. Towards More Efficient Government : Reforming Federal Fiscal Relations in Germany(February 1999) Eckhard Wurzel
208. Stock Market Fluctuations and Consumption Behaviour : Some Recent Evidence(December 1998) Laurence Boone, Claude Giorno and Pete Richardson
207. Microeconometric analysis of the retirement decision: The Netherlands(June 1998) Maarten Lindeboom
206. Microeconometric analysis of the retirement decision: United Kingdom(June 1998) Raffaele Miniaci and Elena Stancanelli
205. Microeconometric analysis of the retirement decision: Italy(June 1998) Raffaele Miniaci
204. Microeconometric analysis of the retirement decision: Germany(June 1998) Pablo Antolin and Stefano Scarpetta
203. Microeconometric analysis of the retirement decision: United States(June 1998) Joseph Quinn, Richard Burkhauser, Kevin Cahill and Robert Weathers
202. The retirement decision in OECD countries(June 1998) Sveinbjörn Blöndal and Stefano Scarpetta
201. The macroeconomic effects of pension reforms in the context of ageing populations:overlapping generations model simulations for seven OECD countries(June 1998) Ketil Hviding and Marcel Mérette
200. The macroeconomics of ageing, pensions and savings: a survey(June 1998) Richard Kohl and Paul O’Brien
199. Marginal Effective Tax Rates on Physical, Human and R&D Capital(May 1998) Kathryn Gordon and Harry Tchilinguirian
198. The Norwegian Health Care System(May 1998) Paul van den Noord, Terje Hagen and Tor Iversen

ECO/WKP(99)7
63
197. APEC Trade Liberalisation : Its Implications(May 1998) Seunghee Han and Inkyo Cheong
196. The OECD Jobs Strategy : Progress Report on Implementation of Country Specific Recommendations(May 1998)
196 La Strategie de l’OCDE pour l’emploi : rapport sur l’état d’avancement de la mise en oeuvre des recommandations par pays(May 1998)
195. Trends in OECD Countries’ International Competitiveness(April 1998) Martine Durand, Christophe Madashi and Flavia Terribile
194. The European Union’s Trade Policies and their Economic Effects(April 1998) Peter Hoeller, Nathalie Girouard and Alessandra Colecchia
193. The Macroeconomic Implications of Ageing in a Global Context(March 1998) Dave Turner, Claude Giorno, Alain De Serres, Ann Vourc’h and Pete Richardson
192. Efficiency and Distribution in Computable Models of Carbon Emission Abatement(March 1998) Joaquim Oliveira Martins and Peter Sturm
191. Monetary Policy when Inflation is Low(March 1998) Charles Pigott and Hans Christiansen
190. Submission by the OECD to the G8 Growth, Employability and Inclusion Conference(March 1998)
189. Income Distribution and Poverty in Selected OECD Countries(March 1998) Jean-Marc Burniaux, Thai-Thanh Dang, Douglas Fore, Michael Förster,Marco Mira d’Ercole and Howard Oxley
188. Asset Prices and Monetary Policy(February 1998) Mike Kennedy, Angel Palerm, Charles Pigott and Flavia Terribile
187. NAIRU: Incomes Policy and Inflation(January 1998) Silvia Fabiani, Alberto Locarno, Gian Paolo Oneto and Paolo Sestito
186. OECD Submission to the Irish National Minimum Wage Commission(December 1997)
185. OECD Submission to the UK Low Pay Commission(December 1997)
184. Concept, Measurement and Policy Implications of the NAIRU - Perspective from Belgium(October 1997) Joost Verlinden
183. Structural unemployment in Denmark(September 1997) Agnete Gersing