the problem: daubert was supposed to relax standards - jurisense
TRANSCRIPT

Principal Components Analysis in Demonstrating Causation
by a Preponderance of the Evidence
by Tammy Metzger
I. Introduction
When the Supreme Court held that the Federal Rules of Evidence superceded the Frye1
common law “general acceptance” test for the admissibility of scientific testimony, they intended
to liberalize Rules 702 and 703 regarding expert testimony. Daubert v. Merrell Dow
Pharmaceuticals, Inc.2 The Majority specifically stated that they did not intend to open the
doors to pseudoscience, but that trial court judges should screen scientific evidence by its
methodology, thereby acting as a gatekeeper.3 However, just the opposite has occurred. In the
years following Daubert, more scientific evidence has been excluded from courtrooms since the
Supreme Court tried to open the doors to cutting edge, unpublished and otherwise not generally
accepted research.4
Establishing causation in a toxic tort case is difficult because the cause of the injury is not
so directly obvious.5 Instead of a precise, known moment of contact and immediate injury, toxic
exposures occur over an extended and unknown period of time and result in an increased
probability of disease. The injury may take months or years to surface, there may be multiple
causal agents as well as interacting effects, therefore, scientific testimony is required to establish
1 Frye v. United States, 293 F. 1013, 1014 (D.C. Cir. 1923). 2 509 U.S. 579, 589 (1993). 3 Id. at 597. 4 See, e.g., David E Bernstein, The Breast Implant Fiasco, 87 Calif. L. Rev. 457 (1999). 5 Edward Greer & Warren Freedman, Toxic Tort Litigation 5-2 (1989).
1

factual causation. Because of these difficulties, expert witnesses are essential to a toxic tort case,
and in many cases, they provide the only evidence of causation.
Critics have asserted that in deciding the admissibility of scientific evidence, judges have
collapsed legal standards of proof into the more rigorous scientific standard, thereby unfairly
barring plaintiff’s claims.6 While some courts have specifically noted the difference between the
two standards,7 many have chosen to exclude expert testimony that does not show causation to a
95% certainty.8 In Allen v. Pennsylvania Eng’g Corp.,9 The 5th Circuit excluded plaintiff’s
causation evidence showing a correlation between ethylene oxide and brain cancer, saying
numerous studies found no correlation and the agencies’ threshold of proof is lower than that
required in tort law.
One possible answer is to apply a statistical method which is useful with epidemiological
and other “unsupervised” data sets, which are not under strict laboratory controls. It also can
explain things in terms of “more likely than not” with beloved 95% certainty. Principal
components analysis (PCA) is a decorrelation technique often used for exploratory data analysis
and is especially useful when there are multiple factors. This analysis can sometimes be useful
when there are hidden dependencies between different object measures. PCA is commonly
utilized in fields such as astronomy, neural networks, psychology, forestry, geochemistry and
systems engineering to decrease the number of axes, thereby removing variables not of interest,
in the data field in order to facilitate interpretation.10 For example, in ecology field studies,
6 Steve Gold, Causation in Toxic Torts: Burdens of Proof, Standards of Persuasion, and Statistical Evidence, 96 Yale L. J. 376 (1986). 7In re Paoli R.R. Yard PCB Litig., 916 F.2d 829, 853-54 (3d Cir. 1990), Ambrosini v. Labarraque, 101 F.3d 129 (D.C. Cir. 1996). 8Hodges v. Dept. of Health and Human Ser., 9 F.3d 958 (Fed. Cir. 1993). 9 102 F.3d 194, (5th Cir. 1996) 10 PCA, also known as Karhunen-Loève expansion, is used in image processing fields to compress data for remote sensing and lipreading images, which is used in conjunction with some speech recognition programs.
2

species and environmental data are analyzed via PCA to reveal various aspects of community
structure, such as ecological gradients and relationships between species and their environment.
This paper explains how principal components analysis can be used to introduce
causation evidence when the standard scientific tests are not 95% certain of the causation
mechanism but do show with 95% confidence that a given factor is most likely the cause of a
given result. For example, if toxicologists are 75% certain that chemical XYZ causes fish
mortality at a given exposure, this evidence may be excluded as invalid knowledge to prove that
XYZ actually killed any fish. But a statistical test that demonstrates with a 95% certainty that
XYZ more likely than not (say 60% probability) caused the fish to die should be admissible
according to the Daubert standard.
II. How to prove causation in a toxic tort
To prove causation, evidence must be both admissible and it must support the burden of
proof. Following the Supreme Court’s Daubert decision, federal trial judges have restricted11 the
admissibility of scientific evidence according to their new “gatekeeping” role, which requires
that they assess the reasoning and methodology underlying the expert’s opinion and determine
whether it is scientifically valid and applicable to a particular set of facts. Courts have held
conflicting views of what constitutes causation,12 whether probabilistic evidence alone is
sufficient to support a finding of cause in fact, without an explanatory mechanism,13 and whether
certain types of epidemiologic, toxicologic and statistical studies are ever admissible. This
11 Molly Treadway Johnson et al., Expert Testimony in Federal Civil Trials: A Preliminary Analysis, Federal Judicial Center (2000). 12 Some courts follow the “but for” corpuscularian causal chain approach, where probabilistic evidence is misunderstodd and reluctantly used, while others apply a substantial factor type analysis. See, e.g., Troyen A. Brennan, Causal Chains and Statistical Links: The Role of Scientific Uncertainty in Hazardous-Substnace Litigation, 73 Cornell L. Rev. 469 (1988). 13 In re “Agent Orange” Prod. Liab. Litig., 597 F. Supp. 740, 835-36 (E.D.N.Y. 1984).
3

section describes legal and scientific methods of causation, the current difficulty in linking these
two approaches and a method to scientifically demonstrate causation at the civil burden of proof
standard.
A. The Daubert Trilogy
For most of this century American courts relied on the Frye test to determine the
admissibility of expert testimony, that it “be sufficiently established to have gained general
acceptance in the particular field in which it belongs.”14 Frye had excluded testimony of a
“crude” precursor to the polygraph technique. This test served to exclude unreliable testimony
but it also barred new discoveries.
1. Daubert v. Merrell Dow Pharmaceuticals, Inc.
In 1993, the Supreme Court changed this federal standard and ruled that the 1975 Federal
Rules of Evidence superceded the Frye test.15 Rule 702 provided for expert testimony to be
admissible if “scientific, technical, or other specialized knowledge will assist the trier of fact”
and the witness is “qualified as an expert by knowledge, skill, experience, training, or
education.”16 The Supreme Court characterizes the Federal Rules of Evidence as having a
“liberal thrust” and “relaxing the traditional barriers to ‘opinion’ testimony.”17 In comparison,
they describe the Frye test as “rigid” and “austere.”18 Furthermore, they espouse the American
adversarial system of “vigorous cross-examination, presentation of contrary evidence, and
14 Frye, 293 F. at 1014. 15 Daubert, 509 U.S. at 588. 16 Fed. R. Evid. 702. 17 509 U.S. at 588. 18 Id, at 588-9.
4

careful instruction on the burden of proof are the traditional and appropriate means of attacking
shaky but admissible evidence.”19
In Daubert, the guardians of two children sued over birth defects allegedly caused by
Bendectin, an antinausea drug manufactured by Merrell Dow Pharmaceuticals. The 9th Circuit
district court followed the Frye test in excluding expert testimony that Bendectin had caused the
birth defects because it was not “generally accepted” within the epidemiological field. The
defendant’s expert witness testified that numerous studies indicated no birth defects with
Bendectin. The petitioner’s experts provided in vitro (test tube), in vivo (animal studies),
pharmacological studies that indicated similar chemical structure to other drugs known to cause
birth defects and a reanalysis of epidemiological research. The 9th Circuit Court of Appeals
affirmed the district court’s summary judgement for the defendants,20 stating that expert opinion
based on scientific evidence must be based on techniques that are “generally accepted” as
reliable in the relevant scientific community.21
The Supreme Court interpreted Rule 702, testimony of experts, to supercede the Frye
general acceptance test and replace it with a requirement of reliability and relevancy. In dicta,
they suggested a guideline for courts to determine the scientific methodology’s reliability, which
include whether it has been generally accepted within the particular scientific community, peer
review and publication, the level of error and whether it has been tested.22 Furthermore,
relevancy includes “fit,” for example the phases of the moon can be introduced to suggest the
19 Id, at 596 citing Rock. Arkansas, 483 U.S. 44, 61, 107 S.Ct. 2704, 2714, 97 L.Ed.2d 37 (1987). 20 509 U.S. at 583. 21 951 F.2d 1128, 1129-1130, (1991). 22 509 U.S. at 593-5.
5

brightness on a given night but not a person’s state of mind.23 The Supreme Court also stressed
that it is the methodology, not the conclusion that is to be judged.24
While expanding the types of scientific evidence that should be admitted, the Supreme
Court clarified that this does not mean that “the Rules themselves place no limits on the
admissibility of purportedly scientific evidence. Nor is the trial judge disabled from screening
such evidence. To the contrary, under the Rules the trial judge must ensure that any and all
scientific testimony or evidence admitted is not only relevant, rut reliable.”25
Following Daubert, courts had differing opinions as to whether the new test applied to
technical, non-scientific, testimony and to what standard appellate courts were to apply in
review. The Supreme Court cleared up these matters in two more important rulings, General
Electric v. Joiner26 and Kumho Tire Co., Ltd. V. Carmichael.27
23 Id, at 591. 24 Id, at 595. 25 Id, at 589. 26 522 U.S. 136 (1997). 27 526 U.S. 137 (1999).
6
2. General Electric Co. v. Joiner
Joiner involved a smoker who was exposed to polychlorinated biphenyls (PCBs) and
subsequently contracted lung cancer. Robert Joiner’s case relied heavily on expert testimony
that PCBs alone can cause lung cancer. This testimony was based on animal studies, which the
District Court ruled were an insufficient basis for the expert opinions because the differing
exposure levels and pathways between the mice and workers.28 Furthermore, the experts would
not definitively say that the PCBs had caused the cancer in the exposed workers. The
epidemiologic studies were also excluded since one was inconclusive and the other made no
mention of PCBs.
The Eleventh Circuit Court of Appeals reversed, holding “because the Federal Rules of
Evidence governing expert testimony display a preference for admissibility, we apply a
particularly stringent standard of review to the trial judge’s exclusion of expert testimony.”29
The Court of Appeals further opined that a district court should limit its role to determining the
“legal reliability of proffered expert testimony, leaving the jury to decide the correctness of
competing expert opinions.”30
On Certiorari, the Supreme Court reversed, holding that the standard for review for
evidentiary matters is abuse of discretion.31 Furthermore, in response to plaintiffs argument that
Daubert specified that the methodology, not the conclusion, is to be the basis of the admissibility
of the expert’s testimony, the justices held that “conclusions and methodology are not entirely
distinct from one another. . . A court may conclude that there is simply too great a gap between
28 Joiner, 522 U.S. at 144. 29 Id. At 529. 30 78 F.3d 524, 533 (1996). 31 Joiner, 522 U.S. at 146.
7

the data and the opinion proffered.”32 The Court examined the evidence and determined that the
trial court had not abused its discretion in excluding the expert testimony.33
3. Kuhmo Tire Co. v. Carmichael
The third case in the Daubert trilogy, Kuhmo,34 dealt with nonscientific expert testimony.
This case is about the influence of an allegedly defective tire in a fatal minivan accident. The
plaintiff’s expert attributed the crash to a defective tire based on his experience as an engineer
with extensive experience examining failed tires.35 The District Court excluded the expert
testimony by holding that technical testimony was subject to the Daubert test. The visual-
inspection test failed the Daubert test of peer review or publication, known or potential rate of
error, and its general acceptance within the relevant scientific community.36
As a matter of law, upon a de novo standard of review, the 11th Circuit held that Daubert
only applied in the scientific context37 and remanded the case back to the district court for
consideration as to whether the testimony was sufficiently reliable and relevant to assist the
jury.38 The court was concerned that the expert’s methodology was unsound because he had
made his conclusions before ever examining the tire.39
The Supreme Court unanimously rejected the 11th Circuit’s opinion and held that the trial
court’s gatekeeping obligation extends to all expert testimony, for example, including that of a
32 Id. 33 Id. at 147. 34 Kuhmo Tire Co. v. Carmichael, 119 S Ct 1167 (1999). 35 Carmichael v. Samyang Tires, Inc., 923 F.Supp. 1514, 1521 (S.D. Ala. 1996), rev’d, 131 F.3d 1433 (11th Cir. 1997). 36 Id. at 1520-21. 37 Carmichael v. Samyang Tires, Inc., 131 F.3d 1433, 1435 (11th Cir. 1997), cert. Granted sub nom Kumho Tire Co v. Carmicael, 118 S Ct 2339 (1998), and rev’d, 119 S Ct 1167 (1999).. 38 Id. at 1436-37. 39 Id.
8

perfume tester.40 Furthermore, the court unanimously held that the appellate court erred in
applying a de novo standard of review and held that the proper standard is an abuse of
discretion.41
The Supreme Court, as in Joiner, looked at the evidence and ruled that the trial court did
not abuse its discretion since the expert did not follow his own methodology in coming to his
conclusion that the tire caused the accident.42 The court was bothered by several weaknesses in
Carlson’s testimony, including the fact that he had no idea “whether the tire had traveled more
than 10, or 20, or 30, or 40, or 50 thousand miles.” 43 Yet he was certain that the tire caused the
accident despite evidence to the contrary.
Interestingly, the Court seems to have backed away from establishing guidelines, instead,
clarifying that the Daubert test depends on the circumstances of the case, is flexible and “may”
bear on the judge’s gatekeeping determination.44 The Court clarified the judge’s gatekeeper role
as ensuring that “an expert, whether basing testimony upon professional studies or personal
experience, employs in the courtroom the same level of intellectual rigor that characterizes the
practice of an expert in the relevant field.45
40 Kumho Tire Co. v. Carmichael, 119 S. Ct 1167, 1171 (1999). 41 Id. at 1171. 42 Id. 43 Id. at 1177. 44 Id. at 1175 (quoting Brief for United States as Amicus Curiae Supporting Peititioners at 19, Kumho Tire Co v. Carmichael, 119 S. Ct. 1167 (1999) (No 97-1709). 45 Id. at 1176.
9

B. Scientific Evidence of Causation in Fact
Science is both a method for discovery and the resulting body of knowledge. Although
day-to-day science is conducted in a more intuitive and less structured process,46 it is often
described as following the Scientific Method, which consists of systematically observing
phenomena, recording facts, formulating physical laws from the generalization of the
phenomena, and developing a theory that is used to predict new phenomena. This Method is
useful for creating new paradigms,47 when necessary; however, typical scientific studies fill in
small gaps within the current paradigm through observation, classification, experimentation and
hypothesis testing.48
Statistical methods use hypothesis testing to determine if a relationship between variables
is simply the result of chance. If a relationship is established, the next step is to determine the
strength of that relationship, which is discussed in the epidemiological measures of risk section
of this paper. Plaintiff’s experts usually testify about studies that meet both of these elements as
distinct steps. This is not the only way to apply scientific methodologies, but it is the way it is
currently done in toxic torts.
1. Statistical Techniques and Significance Testing in Assessing Scientific Integrity
While traditional, physical sciences have used calculus and other particular mathematics,
modern science increasingly relies on statistics of data to explain phenomena. Statistics describe
46 See, e.g., David Goodstein, How Science Works, Reference Manual on Scientific Evidence, 2nd Edition, Federal Judicial Center (2000). 47 See, e.g., Thomas S. Kuhn, The Structure of Scientific Revolutions (1970). (When new observations do not fit into scientists’ world-view, eventually, a new working model is required. This change does not occur according to typical, deliberative scientific processes, but switches with sudden insight. Within the new paradigm, the world has not actually changed, just the perception of it.) 48 Science errs on the side of caution by testing a relationship to see if there is a strong (usually greater than 95%) certainty that the correlation is not random chance. This means that most studies falsely report no relationship when one actually exists, thereby accepting the null hypothesis (Type II error).
10

data, often summarizing numerous observations, and are commonly used in psychology,
astronomy, toxicology, climatology, economics and physics, just to name a few. Through
regression models, analyzing correlations between variables and other multivariate techniques,
statistics can be used to infer causation by describing the likelihood that observed relationships
are random.
In order to say whether a distribution of variables is random or not, one must first select
the degree of accuracy required of this conclusion. For example, if a craps shooter throws four
straight 7s, what is the appropriate reaction of the pit boss? How sure is he that the shooter is
cheating? Is he willing to immediately throw her out of the casino? Should he stop the game to
examine the dice? Perhaps he prefers to watch the next few throws before he’s certain enough to
risk making the superstitious players unhappy by interrupting their lucky streak.
People intuitively make statistical decisions every day that are weighted by the risks of
each circumstance. Statisticians use p-values to choose these desired certainties in relationships,
typically at the 95% level of confidence that the observation is not random, which is equal to a p-
value of 0.05. A lower p-value indicates a higher chance that something is going on besides
random error, so the scientists would reject the null hypothesis49 and find that there is significant
evidence that there is a relationship.
Simple linear regression models are used to infer causation from association. A line is
drawn through a set of data so that the sum of the differences from each data point to the line
squared is minimized. The line is mathematically described as a slope, which relates the
49 The null hypothesis is typically the hypothesis that there is no difference between a sample and another sample or the entire population. This is what is being tested and if the statistical test shows that the difference between these means is less than what would be expected to occur by chance at whatever level of confidence is predetermined, then the null hypothesis is assumed to be true.
11

variables. For example, a regression model that roughly predicts a person’s salary can be
estimated based on their experience.
Salary = $15,000 + $2,000(years of experience)
In this model, a person with no experience is predicted to make $15,000 while a person
with 10 years of experience is predicted to make $35,000. This simple linear model would have
relatively low statistical significance since it will have a high error associated with each
prediction. If the model were improved by adding multiple regressions for the salary differences
of men and women, it would much more accurately predict salaries and would have a higher
level of confidence. This is because the salary of men with the same number of years of
experience is more than that of women. This difference causes more variability in the model,
thus reducing its predictive value and producing results that appear more random.
Regression model predictions are typically described by the confidence interval of the
resulting estimate. Higher confidence in an estimate is obtained when the data more closely fit
the model, there are more data to use in the model,50 there are few outliers,51 and there are no
other influencing factors. Sometimes confounding52 variables that are missing from the analysis
are the actual cause of observed relationships, so a significant relationship is not necessarily
causal.
50 If the additional data has the same characteristics as the original, the effect of this additional data is to reduce the uncertainty of randomness where signals are “noisy,” meaning surrounded by great variability, which is common in climate research. 51 Because outliers are often assumed to be a measurement, recording or other data error, many scientists remove them from their regression models.
12

2. Epidemiological Measures of Risk
Epidemiologists study the incidence, distribution and etiology of disease in populations
and the influence of the environment and lifestyle on disease patterns; for example, how tobacco
has affected the health of a particular population. Epidemiologists focus on general causation,
things that can cause disease, rather than specific causation, such as the cause of disease in a
specific individual. These studies are uncontrolled, meaning not under laboratory conditions,
since that would obviously be unethical treatment of humans.53 The most common measures
used to estimate the association between exposure and risk are relative risk, odds ratio and
attributable proportion of risk (APR).
Since relative risk is most frequently used in litigation, only this measure will be
described. Relative risk is the ratio of the incidence of disease in exposed individuals compared
to the incidence in unexposed individuals.54 Most courts have held that a relative risk of 2.0 or
greater is sufficient to prove causation by a preponderance of the evidence, since this amounts to
a doubling of risk.55 Example 10% of people with a given exposure contract a specific disease
compared with 5% of normal population, therefore RR = .10/.5=2.
52 A confounder is a missing “third variable” from the analysis but is related to the modeled variables and may explain the association. For example, there is probably a high correlation between lung cancer and littering non-biodegradable, yellow, toxic cotton filters but neither causes the other. Smoking is the confounding variable. 53 Toxicologists study the effects of chemicals on laboratory animals and extrapolate these results to estimate toxic human exposures. 54 Michael D. Green, et al., Reference Guide on Epidemiology, Reference Manual on Scientific Evidence 2nd Edition, Federal Judicial Center (2000) p 348. 55 See DeLuca v. Merrell Dow Pharms., Inc., 911 F.2d 941, 958-59 (3rd Cir. 1990); In re Joint E. & S. Dist. Asbestos Litig., 964 F.2d 92 (2d Cir. 1992) (relative risk less than 2.0 may still be sufficient to show causation); Daubert v. Merrell Dow Pharms., Inc., 43 F.3d 1311, 1320 (9th Cir.) cert. denied, 516 U.S. 869 (1995); Pick v. American Med. Sys., Inc., 958 F.Supp. 1151, 1160 (recognizing that a relative risk of less than 2.0 is still admissible but by itself may be insufficient to establish causation); Landrigan v. Celotex Corp., 605 A.2d 1079, 1087 (N.J. 1992) (relative risk greater than 2.0 enough to support an inference of probable causation for specific individual within the exposed population).
13

C. Collapsed Legal and Scientific Standards in Practice
There has been much debate within the legal community whether plaintiffs are unfairly
held to a higher burden of proof when their main evidence of causation is scientific.56 Some
courts have held that scientific evidence should be admitted at a relaxed standard so that it does
not raise the plaintiff’s burden of proof beyond a preponderance of the evidence requirement.57
This is problematic because scientists are reluctant to make assertions based on lower levels of
certainty than what is required in their professional journals.
Although much scientific work with results below the 95% certainty now required in
most courtrooms is considered valid and is published in scientific journals, most lower certainty
techniques are used primarily for exploratory research, where these results are further
investigated via more robust methods, such as regression models. After Daubert, some courts
have continued to distinguish between scientific certainty and legal sufficiency,58 however, most
courts have insisted on evidence that meets the relevant scientific methodology of the given
field59 following Daubert.
While it is true that science is not amenable to reduced significance standards,60 that has
not deterred suggestions for modified approaches, such as reduced certainty for scientific
56Bert Black, The Supreme Court’s View of Science: Has Daubert Exorcised the Certainty Demon?, 15 Cardozo L. Rev. 2129. (arguing that the two standards should be collapsed). 57 Ferebee v. Chevron Chemical Co., 736 F.2d 1529, 1536 (D.C. Cir.), cert. denied, 469 U.S. 1062 (1984); Wells v. Ortho Pharmaceutical Corp., 788 F.2d 741, 745 (11th Cir.), reh’g denied (en banc), 795 F.2d 89 (11th Cir.), and cert. denied, 479 U.S. 950 (1986); Bunting v. Secr. Of the Dep’t. of Health and Human Ser., 956 F.2d 1144, 1148 (Fed. Cir. 1992). 58 Knudsen v. Dept. of Health and Human Ser., 35 F.3d 543 (Fed. Cir. 1994). 59 Hodges v. Dept. of Health and Human Ser., 9 F.3d 958 (Fed. Cir. 1993). 60 Brief Amicus Curiae of Professor Alvan R. Feinstein in Support of Respondent, Daubert v. merrell Dow Pharmaceuticals, Inc., 113 S. Ct. 2786 (1993) (No. 92-102).
14

evidence.61 This idea, however, does not fully use the capabilities of science to contribute to
legal proceedings because p-values of 0.5 mean virtually nothing to scientists.
There are limitless ways to work with science and its strict methodologies without
transferring an undue burden of proof onto a plaintiff. The trick is to keep in mind the purpose
of the investigation. Instead of aiming to unveil universal truths, science should be applied to
determine probabilities in legal, “more likely than not”, terms.
D. Using Principal Components Analysis (PCA) to Demonstrate Causation
Principal components analysis, an exploratory data analysis technique, is useful for civil
litigation because it interprets complex environmental data more clearly than multiple
regressions and it specifies the association between each variable and the outcome. The goal in
PCA is not always to perfectly model a phenomena, but to quickly understand relationships
between the independent variables and the outcome at whatever completeness the researcher
wishes to discern, including 51%.
Most commonly used in discerning environmental relationships,62 PCA is also used in
various scientific fields such as astronomy, neural networks, psychology, forestry, geochemistry,
climatology and systems engineering.63
1. Introduction to Principal Components Analysis
Principal components analysis64 is a multivariate statistical technique that works by
considering only a smaller number of these variables, which the researcher can designate. Each
61 Jon Todd Powell, How to Tell the Truth with Statistics: A New Statistical Approach to Analyzing the Bendectin Epidemiological Data in the Aftermath of Daubert v. Merrell Dow Pharmaceuticals, 31 Hous. L. Rev. 1241 (1994). (proposes using p-value of 0.5 for legal sufficiency standard.)
15

variable’s influence on the entire dataset’s variability is calculated, along with the cumulative
impact of a given group of principal components. Mr. Kendall65 originally proposed PCA to
analyze data that does not work well in regression models. The technique obtains the principal
components66 of a set of explanatory variables, calculating their regression upon a dependent
variable, and projecting the resulting parameters back into the terms of the original variates. The
principal components are orthogonalized, which eliminates collinearities67 in the dataset.
If you imagine the dataset as a cloud, graphed in as many dimensions are there are
descriptive variables, the first principle component is the line that would extend furthest through
this cloud, thereby catching the most variability. If you imagine that this line represents the line
from each corner of your mouth, as is done in lipreading programs, the form of the lips can be
described most efficiently from the first principal component, the basic line across the mouth.
This is how PCA is used to compress data. This is also useful to remove factors that are
confusing the analysis. The main component should not be removed, but lets say that the person
speaking is nervously tapping and this motion is causing their face and lips to tremble, thereby
interfering in the speech recognition program. PCA can remove this “noise,” which is how it is
used in climate studies, where numerous subtle effects distort the more easily understandable
major climate influences, like latitude, elevation and El Niño events.
While scientists usually group these to explain as much of the outcome as possible, they
could also be grouped or singled out to explain 51% of an outcome, such as the variables that
62 See Glenn De Ath, Principal curves: A New Technique for indirect and direct gradient analysis, Ecology, Oct. 1999. 63 PCA is known as Karhunen-Loeve expansion in the computer vision and pattern recognition fields. 64 See William F. Massy, Principal Components Regression in Exploratory Statistical Research, American Statistical Association Journal, March 1965. 65 Kendall, M.G., A Course in Multivariate Analysis. London, England: Charles Griffin and Company, Ltd., 1957. 66 See Stone, J. R. N., “The analysis of market demand,” Journal of the Royal Statistical Society, New Series: 108 (1945), 286-382.
16

explain cancer. Although there are many factors which contribute to lung cancer, a PCA would
be able to separate out the factor or factors that more likely than not caused a specific cancer.
Furthermore, other contributing variables that may be missing from an individual’s case, such as
the possibility that they never smoked, could be included in the calculation to add confidence to
a prediction of the present cancer causing variables, such as work exposure, via Bayes Theorem.
Intuitively, the chance that the work exposure caused the cancer increases when other causes are
eliminated.68 Standard statistical programs describe significance parameters, such as the
confidence interval, covariance and standard deviation of these principal components.
Factor analysis is a commonly used statistical technique that measures an unobservable
element by combining the measured ones by using linear combinations of variables to explain
sets of observations of many variables, just like principle components. For example, factor
analysis is useful for intelligence tests, where observed variables are various test score results.
Psychologists do not care about the various tests, but the intelligence they were designed to
describe. The difference between the two is that in PCA, the observed variables themselves are
the focus of interest, whereas in factor analysis, it is the unobservable element that is of interest.
The principle components approach simplifies the interpretation of confounding variables,
whereas factor analysis disregards those observed variables and looks at the underlying factor.
2. Hypothetical Application of Principal Components Analysis to Lung Cancer
Since this paper merely aims to lay out the general concept of how to use PCA for legal
evidence, the numerous steps required to produce a resulting table like the example below have
67 Also termed multicollinearity, this describes the existence of correlations among the independent variables in the regression model, which would falsely enhance the results. 68 This is a akin to differential diagnosis, where a physician uses the process of elimination to determine which of several diseases with similar symptoms caused a patient’s condition.
17
been omitted. Perhaps the weakest aspect of this approach is the actual assignment of the
principal components to the nearest independent variable. Although it involves some
subjectivity, scientific studies utilizing PCA are generally accepted in numerous fields and
authoritative publications.69
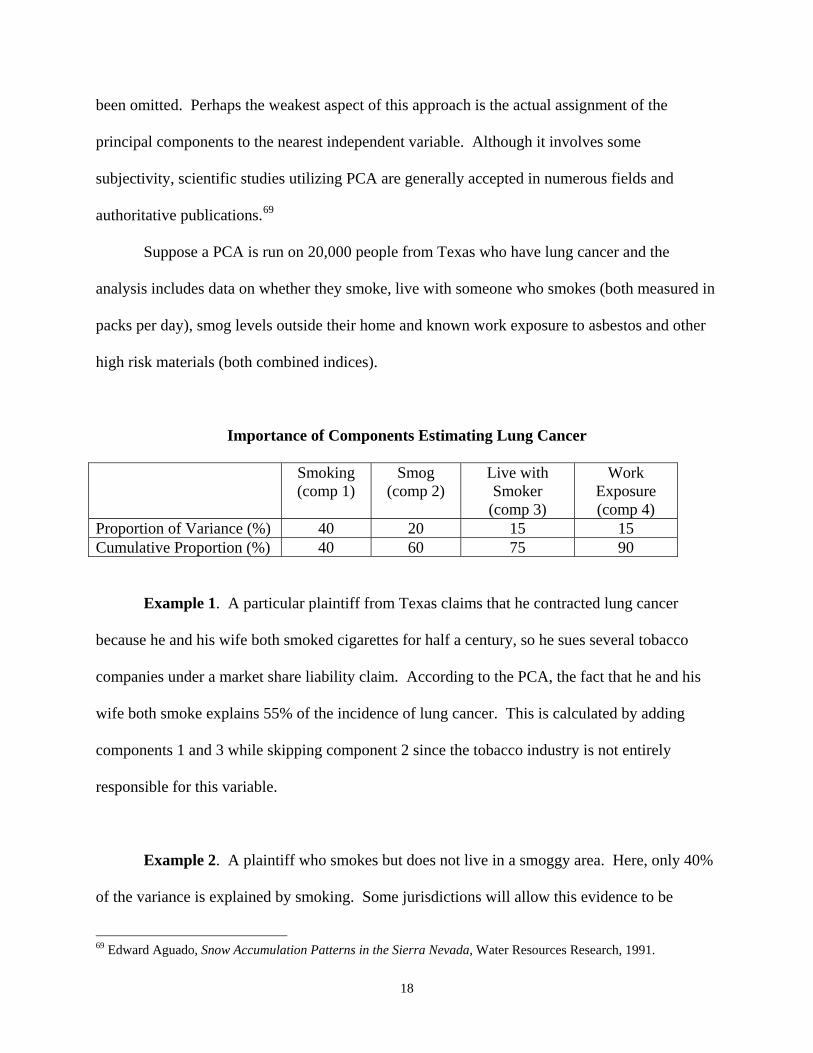
Suppose a PCA is run on 20,000 people from Texas who have lung cancer and the
analysis includes data on whether they smoke, live with someone who smokes (both measured in
packs per day), smog levels outside their home and known work exposure to asbestos and other
high risk materials (both combined indices).
Importance of Components Estimating Lung Cancer
Smoking (comp 1)
Smog (comp 2)
Live with Smoker
(comp 3)
Work Exposure (comp 4)
Proportion of Variance (%) 40 20 15 15 Cumulative Proportion (%) 40 60 75 90
Example 1. A particular plaintiff from Texas claims that he contracted lung cancer
because he and his wife both smoked cigarettes for half a century, so he sues several tobacco
companies under a market share liability claim. According to the PCA, the fact that he and his
wife both smoke explains 55% of the incidence of lung cancer. This is calculated by adding
components 1 and 3 while skipping component 2 since the tobacco industry is not entirely
responsible for this variable.
Example 2. A plaintiff who smokes but does not live in a smoggy area. Here, only 40%
of the variance is explained by smoking. Some jurisdictions will allow this evidence to be
69 Edward Aguado, Snow Accumulation Patterns in the Sierra Nevada, Water Resources Research, 1991.
18

introduced to demonstrate a substantial factor of causation, but it would be prudent to more
rigorously combine the additional information to establish a preponderance of the evidence that
“but for” the smoking, the plaintiff would not have contracted lung cancer.
Bayes’ Theorem describes how to link distinct probabilities of specific conditions into the
total combined probability given those conditions.
Bayes’ Theorem P(C/E) = P(C ) * P(E/C ) .
[P(C ) * P(E/C)] + [P(not C) P(E/not C)]
where,
P(C ) the current probability plaintiff did not contract cancer from cigarettes
(= 0.6) E new piece of probabilistic evidence P(C/E) new probability of something, P(C ), given E (P(E/C) the probability of E given C (probability that smog causes cancer = 0.2) P(not C) the probability that C is not true (1-C = 0.4) P(E/not C). the probability of E if C were not true (since we have evidence that the plaintiff
lives in a smog-free area, =1)
P(C/E) = 0.6 * 0.2 = 0.75 0.6 * 0.2 + [1 * 0.4]
The combined information gives a new estimate that smoking is 75% likely the cause of
the cancer for a person who smokes and lives outside a smoggy area. This could be further
improved by accounting for the missing smoking housemate and possibly the effects of work
exposure.
3. Possible Challenges to using PCA to show Causation
One problem with this analysis is that the 9th Circuit Court of Appeals added to the
Supreme Court’s Daubert opinion that research done for litigation is a factor in excluding
19

evidence. In Response, this is unfair since much research is done specifically for litigation, as in
environmental assessments to determine who is a potentially responsible party for the clean-up.
Under Daubert and Kuhmo, most of these environmental studies should be admitted as long as
the methodology is sound and follows generally accepted principles that were not developed
solely for litigation.
Many jurisdictions require particular evidence to show causation for the individual
plaintiff, therefore, statistics alone may be admissible yet insufficient. Here, a mechanism is
needed, such as the etiology of the injury. However, courts need to know that not every
mechanism is understood. The expert should discuss possible mechanisms, based on scientific
knowledge, and leave that factual question for the jury. Also, additional statistical tests, such as
time-series analysis, relating to the timing might sufficiently support association evidence in
proving causation.
Opposing counsel may challenge the methodology of exploratory PCA evidence as
unscientific and only suggestive of how the scientist should proceed to conduct a meaningful
investigation. Although PCA is used in many fields and the results are published in reputable
journals, it has not yet made an appearance in toxic tort litigation. Hopefully this will soon
change.
E. Conclusion
Principal components analysis works well in the context of civil litigation, where a
preponderance of the evidence standard of proof is sought, since PCA can separate out the
individual influence of each independent variable. Furthermore, it is especially well-suited for
environmental datasets, where there are many confounding influences. Since this technique is
20

21
generally accepted in the scientific community and used in numerous scientific fields, it should
be admissible under Rule 702 when used appropriately.
Specific PCA studies, if reasonably conducted, should follow both the law and spirit of
Daubert to admit reliable, relevant and sound scientific evidence. This approach is both
scientifically and legally more credible than other suggestions to avoid the collapsing standards
problem, where plaintiffs’ are sometimes held to an unfair, higher standard of proof when their
primary proof of causation is scientific evidence.
This combined approach of PCA and Bayes’ Theorem is useful for environmental and
toxic torts, where there is not conclusive laboratory experimental research to support the real-
world evidence of causation, such as epidemiological associations. PCA is commonly used to
discover ecological and climate influences and it should be applied in toxic tort litigation to bring
polluters to justice and thereby reduce disease and resource degradation.
The Supreme Court intended to liberalize the Federal Rules of Evidence so that cutting
edge technology would be available in the courtrooms. PCA is precisely the type of technique
that is needed in the courtrooms to facilitate the fair resolution of conflicts. PCA combines a
scientifically rigorous method with the flexibility to find causation at the civil burden of proof,
which is an ideal balance to ensure justice and fairness in toxic tort litigation.