the pricing of credit default swaps during distress - imf · 5 ii. cds valuation and the basis this...
TRANSCRIPT

WP/06/254
The Pricing of Credit Default Swaps During Distress
Jochen Andritzky and Manmohan Singh


© 2006 International Monetary Fund WP/06/254 IMF Working Paper Monetary and Capital Markets Department
The Pricing of Credit Default Swaps During Distress
Prepared by Jochen Andritzky and Manmohan Singh1
Authorized for distribution by Ms. Ceyla Pazarbasioglu
November 2006
Abstract
This Working Paper should not be reported as representing the views of the IMF. The views expressed in this Working Paper are those of the author(s) and do not necessarily represent those of the IMF or IMF policy. Working Papers describe research in progress by the author(s) and are published to elicit comments and to further debate.
Credit default swaps (CDS) provide the buyer with insurance against certain types of credit events by entitling him to exchange any of the bonds permitted as deliverable against their par value. Unlike bonds, whose risk spreads are assumed to be the product of default risk and loss rate, CDS are par instruments, and their spreads reflect the partial recovery of the delivered bond's face value. This paper addresses the implications of the difference between bond and CDS spreads and shows the extent to which the recovery assumption matters for determining CDS spreads. A no-arbitrage argument is applied to extract recovery rates from CDS and bond markets, using data from Brazil’sdistress in 2002–03. Results are related to the observation that preemptive restructurings are now more common than straight defaults in sovereign bond markets and that this leads to a decoupling of CDS and bond spreads.
JEL Classification Numbers: F34, G12, G15 Keywords: Credit default swaps, Brazil, recovery value, default risk
1 We like to thank for helpful comments from Bojan Bistrovic, Jane Brauer, Michael Dooley, Frank Packer, Paul Söderlind, Haibin Zhu, and seminar participants at the Quant Congress 2005, New York; the EFMA Annual Meetings 2006, Madrid; theAnnual Pacific Basin Finance, Economics, and Accounting Conference 2006, Taipei; the NFA Annual Meetings 2006, Montreal; the University of California, Santa Cruz; and the International Monetary Fund. Jochen Andritzky acknowledges financial support from the Swiss National Science Foundation (SNF).

2
Contents Page
I. Introduction....................................................................................................................3
II. CDS Valuation and the Basis.........................................................................................5
III. The Role of Recovery ....................................................................................................9
IV. Data Analysis ...............................................................................................................13
V. Implied Recovery Values under No Arbitrage ............................................................15
VI. Implied Recovery Values under No Arbitrage with CTD ...........................................18
VII. Conclusions..................................................................................................................20
References................................................................................................................................22 Tables 1. Basis Effects...................................................................................................................7 Figures 1. Cash Flow Scheme for a Credit Default Swap ..............................................................5 2. Recovery Smile from Brazilian CDS Contracts ..........................................................10 3. Fair CDS Spreads as Function of the Recovery of Face Value ...................................12 4. CDS Spreads with One-, Three-, and Five-Year Tenor and the Brazil EMBIG Subindex during the Brazil Crisis of 2002-03 ..........................................................14 5. Basis from Three- and Five-Year CDS and Similar Tenor Cash Bonds .....................15 6. Implied Recovery Rate from Three-Year CDS ...........................................................16 7. Implied Recovery Rate from Five-Year CDS..............................................................16 8. Implied RFV and RMV Recovery Fractions from Three-Year CDS ..........................19 9. Implied RFV and RMV Recovery Fractions from Five-Year CDS ............................19 Boxes 1. Recovery Swaps, or Where the CTD Bonds End Up after Delivery......................................... 7 2. Basis Effects from Nontechnical Factors—Some Recent Examples............................... 8

3
I. INTRODUCTION
In a CDS contract, the protection buyer pays a periodic insurance premium until maturity or a predefined credit event, whichever comes first. Upon the credit event, the protection buyer receives the difference between the par and the market value of any eligible bond as compensation. Unlike high-yield CDS contracts on corporate bonds in the United States, market convention and standards of the International Swaps and Derivatives Association (ISDA) for a typical emerging market CDS contract allow for restructuring as a credit event. Usually, criteria that trigger a credit event include (i) a change in coupon rates, (ii) a change in principal amount, (iii) a postponement of interest or principal payment date, (iv) a change in ranking of priority, and (v) a change in payment of interest or principal to a nonpermitted currency.2 In the case of a credit event, the contract is usually settled by physical delivery of the cheapest-to-deliver (CTD) bond within 30 business days against the payment of par value.3 Since protection buyers do not always have the currently CTD bond in their portfolio, a distress situation often sets off heavy trading activity where a squeeze in the CTD market may cause such bonds to appreciate. This is the actual recovery value which becomes relevant to the protection buyers in the CDS markets. The recent prevalence of soft restructurings in sovereign markets suggests that the actual recovery value can become as high as 60 percent, a level at odds with the analysts' rule-of-thumb of using 25 percent to value CDS contracts under risk neutrality. This paper pursues two research questions. First, the analysis explores whether the choice of the recovery value has an impact on pricing CDS when using a delta-hedge with cash bonds. Duffie (1999) shows that this is not the case when bond instruments trade close to par, as is common in nondistressed markets. An overly low assumption of the recovery value is offset by an underestimation of the implied default probability, leaving the CDS spreads unaffected. But if prices trade far below par, the offsetting mechanism does not work any longer for two reasons. First, the bond implied default intensity increases exponentially with the recovery fraction of par value, as do the CDS spreads. Second, since CDS contracts offer insurance for the par value, it is obvious that the insurance premium must be higher than the risk premium implied from bonds which trade below par. 2 Permitted currencies are generally the G-7 currencies and also those OECD currencies that carry a rating of AAA on their local currency debt (e.g., the Mexican peso and South Korean won, both issued by OECD countries, are not permitted currencies as the local currency debt is rated below AAA).
3 According to market participants, physical delivery is the preferred clause to avoid price disputes in the typically illiquid cash markets following a credit event. This is problematic when there is a short supply of CTDs, as it recently occurred when the U.S. auto parts maker Delphi filed for bankruptcy in 2005. In this case, an auction to determine the CTD price can be called with protection sellers offering the choice between physical delivery or cash settlement at the auction price.

4
Regarding the second question, the empirical part extracts information on the recovery value from CDS data which provide a guideline for pricing CDS in future distress situations. In contrast to corporates, the sovereign bond market—with only a limited number of historical defaults and restructuring events—does not provide enough experience from realized defaults for choosing the appropriate recovery value in distress. As an alternative, risk-neutral recovery values can be approximated from bond prices as in Merrick (2001) and Andritzky (2005, 2006), which requires rather restrictive assumptions. These models find some evidence for the well established notion that the likelihood of default and the recovery value are negatively correlated.4 However, this is not the case in soft restructurings which are becoming the most frequent credit event in sovereign bond markets. Since soft restructurings do not automatically imply losses in terms of the net present value, we observe a close relationship between implied recovery values and the current price level in the distressed cash bond market. As a result, the recovery rate for CDS contracts is much higher than traditionally assumed. Given that the expected recovery value is influencing CDS spreads, the information content of historical CDS spreads can, in combination with the underlying bond prices, be used to reveal the investors' expected recovery value. This paper shows the result of such an analysis for the Brazil crisis of 2002–03. This study extends the thriving academic literature on credit default swaps which, among the empirical studies, has largely focused on corporate CDS for which the role of recovery is less prominent. Duffie (1999), Hull and White (2000, 2001), and Schönbucher (2004) present essays on CDS pricing. Empirical studies on the pricing of CDS can be found mainly for the corporate bond market (see Cossin, Hricko, Aunon-Nerin, and Huang (2002), among others), but some recent working papers also research the sovereign bond market (Pan and Singleton, 2005; and Zhang, 2003). A good overview of the sovereign CDS market and its rapid growth is provided by Packer and Suthiphongchai (2003). A few other studies have explored the extent of nondefault influences on CDS prices. In their analysis of corporate CDS, Longstaff, Mithal, and Neis (2005) observe that besides credit risk, the most important nondefault component of CDS spreads is related to liquidity. Packer and Zhu (2005) study the pricing impact of the contractual differences with regard to admitted credit events and deliverable bonds. For the different ISDA definitions of credit events, the authors find significant spread differences, both by rating class and by regional and sectoral categories. The rest of the paper is organized as follows. First, the underlying CDS pricing rationale is introduced, discussing the influence of basis effects and showing the impact of the recovery assumption on spreads. Second, we compare bond and CDS implied parameters in a no-arbitrage framework to gain implied parameters to proxy the expected recovery value.
4 This is the underlying idea of the widespread recovery of market value (RMV) concept which assumes the expected recovery value ψ to be a portion of the market value. See Duffie and Singleton, 1999.

5
II. CDS VALUATION AND THE BASIS
This section introduces the mathematical foundation of CDS pricing and explains the reasons why risk spreads might diverge from the cash bond market. Figure 1 illustrates the relevant cash flows in a CDS contract. The buyer of protection pays an annual premium of c per one unit of ensured notional value until maturity of the contract or a predefined credit event, whichever is first. Normally, the premium payments are made quarterly, so that we denote the premium payment times with Ntt ,...,1 . The value of these payments, commonly referred to as premium leg, is
( ) ( ) ( )∑ ∫=
⎟⎟⎠
⎞⎜⎜⎝
⎛+−=
N
i
ti
duuurcctg1 0
exp4
, λ , (1)
where tr is the continuous risk-free rate, and tλ is the risk-neutral intensity of the credit event. For CDS on assets that are assumed to bear very high risk, the protection seller may require some up-front compensation. In this case, a lump sum lc in basis points of the underlying face value is paid to the protection seller at origination of the contract.5 The lump sum is added to the protection leg.
Figure 1. Cash Flow Scheme for a Credit Default Swap In case of a credit event, the buyer of protection receives the full notional amount of the underlying in exchange for delivery of the underlying bond. Since in most cases, sovereigns have a considerable number of deliverable bonds outstanding, the protection buyer has an option to choose, picking the cheapest-to-deliver bond (on which accrued interest has to be considered). The post-default price of the bond, expressed as fraction of the nominal value, is the relevant recovery value for pricing CDS. Let τ be the default time and dτ the time of the settlement which occurs within a time that is normally 30 business days after occurrence of 5 When marking CDS contracts to market, this up-front payment reduces the exposure of protection sellers since less of the protection leg is at risk. Therefore, when spreads tighten (widen), the mark-to-market gain (loss) will be smaller.
Protectionbuyer
Protectionseller
Quarterly CDS premium
Delivery of acceptable bond
Reimbursement of par value
In event of default:
6
the credit event, so that dd +=ττ with 30,...,0=d business days. Resorting to the recovery of face value (RFV) concept, )( dτω is the expected fractional recovery of face value, and
)( dA τ the value of accrued interest of the delivered bond at time dτ . Assuming that the protection seller cannot default (i.e., no counterparty risk), define
⎟⎟⎠
⎞⎜⎜⎝
⎛−= ∫
d
durudd
τ
τ
τωτω exp)()(ˆ ,
and
⎟⎟⎠
⎞⎜⎜⎝
⎛−= ∫
d
durAA udd
τ
τ
ττ exp)()(ˆ
to signify the corresponding values at time of default, τ . The present value of the contract for the protection buyer at time of the credit event τ then becomes
4)(ˆ)(ˆ1
*cA dd −−− ττω , (2)
where 4
*c is the fractional amount of the CDS premium accrued until the time of the credit
event. To calculate the market value of the protection leg at 00 =t , where the conditional
risk-neutral density of default is given by ( ) ( ) ⎟⎟⎠
⎞⎜⎜⎝
⎛− ∫
t
duut0
exp λλ , the value of the protection
leg is
( ) ( ) ( ) ( ) dsduuurscdsAdsdcthNt s
∫ ∫ ⎟⎟⎠
⎞⎜⎜⎝
⎛+−⎟⎟
⎠
⎞⎜⎜⎝
⎛−−−=
0 0
*
exp4
),(ˆ),(ˆ1,, λλω . (3)
The current fair premium or spread of a CDS contract, tc , is chosen so that the value of the premium leg equals the value of the protection leg at the time of origination, ( ) ( )dcthctg tt ,,, = . (4)
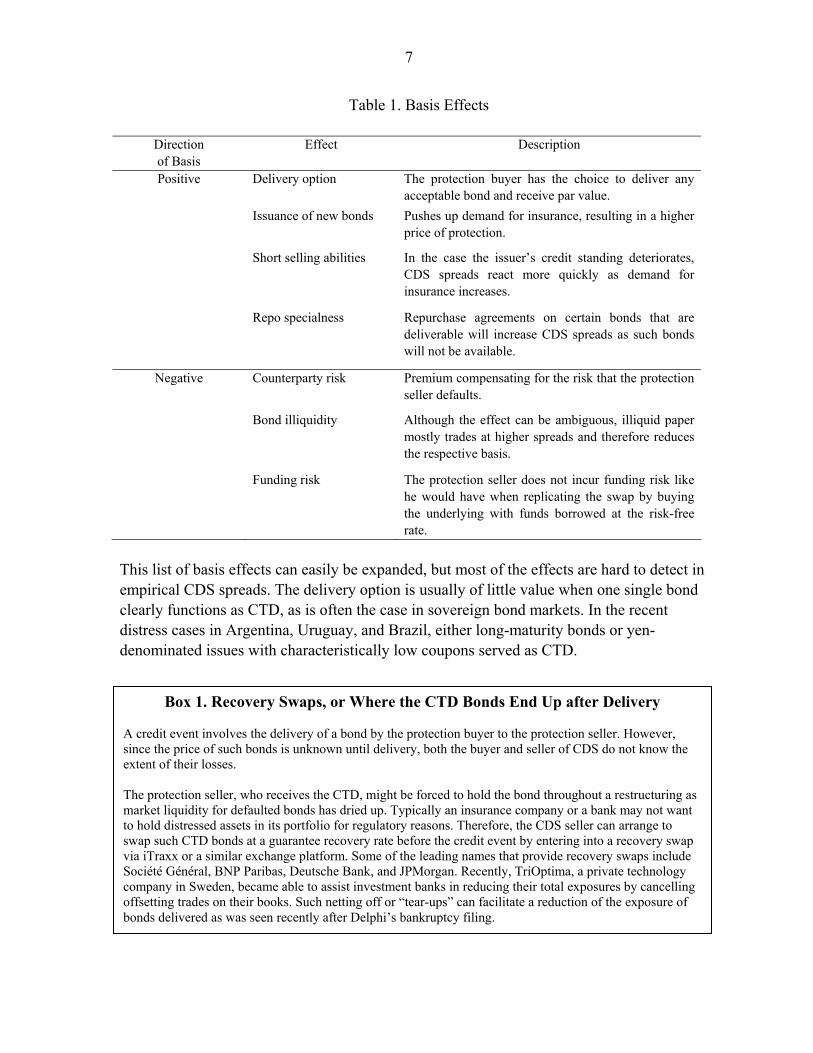
The premium, tc , is the spread that is quoted. There are, however, reasons why there may be a discrepancy between CDS and cash bond spreads. On the one hand, these are conceptual reasons: bond and CDS spreads are calculated differently. The effect of recovery, the main subject of this paper, is an example. On the other hand, CDS are priced by protection sellers based on their costs to hedge this exposure, resorting to expensive risk capital to cover any residual mismatch. This creates many reasons why in practice CDS might decouple from bond spreads. Such a deviation of the CDS from bond spreads is called “basis.” The basis is the difference between CDS spreads and the corresponding point on the term structure curve of bond spreads, implying a positive (or negative) basis when CDS premiums are above (below) the bond spread curve. Table 1 gives an overview of factors which contribute to the basis.
7
Table 1. Basis Effects
Direction of Basis
Effect Description
Positive Delivery option The protection buyer has the choice to deliver any acceptable bond and receive par value.
Issuance of new bonds
Pushes up demand for insurance, resulting in a higher price of protection.
Short selling abilities
In the case the issuer’s credit standing deteriorates, CDS spreads react more quickly as demand for insurance increases.
Repo specialness
Repurchase agreements on certain bonds that are deliverable will increase CDS spreads as such bonds will not be available.
Negative Counterparty risk
Premium compensating for the risk that the protection seller defaults.
Bond illiquidity
Although the effect can be ambiguous, illiquid paper mostly trades at higher spreads and therefore reduces the respective basis.
Funding risk
The protection seller does not incur funding risk like he would have when replicating the swap by buying the underlying with funds borrowed at the risk-free rate.
This list of basis effects can easily be expanded, but most of the effects are hard to detect in empirical CDS spreads. The delivery option is usually of little value when one single bond clearly functions as CTD, as is often the case in sovereign bond markets. In the recent distress cases in Argentina, Uruguay, and Brazil, either long-maturity bonds or yen-denominated issues with characteristically low coupons served as CTD.
Box 1. Recovery Swaps, or Where the CTD Bonds End Up after Delivery A credit event involves the delivery of a bond by the protection buyer to the protection seller. However, since the price of such bonds is unknown until delivery, both the buyer and seller of CDS do not know the extent of their losses. The protection seller, who receives the CTD, might be forced to hold the bond throughout a restructuring as market liquidity for defaulted bonds has dried up. Typically an insurance company or a bank may not want to hold distressed assets in its portfolio for regulatory reasons. Therefore, the CDS seller can arrange to swap such CTD bonds at a guarantee recovery rate before the credit event by entering into a recovery swap via iTraxx or a similar exchange platform. Some of the leading names that provide recovery swaps include Société Général, BNP Paribas, Deutsche Bank, and JPMorgan. Recently, TriOptima, a private technology company in Sweden, became able to assist investment banks in reducing their total exposures by cancelling offsetting trades on their books. Such netting off or “tear-ups” can facilitate a reduction of the exposure of bonds delivered as was seen recently after Delphi’s bankruptcy filing.

8
Relative liquidity in the cash and protection market has been identified by some authors as a significant driver of the basis. In a model exploring the default and nondefault components in bond spreads versus default spreads from CDS, Longstaff, Mithal, and Neis (2005) explore the basis for 68 investment-grade-rated corporations. Their results suggest that proxies for the liquidity of bonds, such as the bid-ask spread and the principal amount, are the most significant explanatory factors. Packer and Zhu (2005) compare the price impact of different contractual terms with regard to restructurings. Until recently, this has not been relevant for sovereign CDS since the typical contractual terms include all kinds of restructurings as specified in the introduction. With regard to corporate CDS, the exclusion of restructuring (the “no restructuring (NR)” term) becomes more popular today, especially in North America.6 As expected, Packer and Zhu (2005) find the highest impact in the range of a 7 percent higher CDS spread for contracts that allow for restructurings as credit event in comparison to NR contracts. A similar result is gained for their sovereign CDS subsample. No information, however, is given about the absolute impact. To avoid any bias in the empirical part, this paper exclusively considers contracts with full restructuring. 6 Other standard terms are (i) “modified restructuring (MR),” first applied in 2001 and for nonsovereigns today by far the most popular contract in the United States, which limits the delivery option to bonds with a maturity of 30 months or less after the maturity of the respective CDS contract, and (ii) “modified-modified restructuring (MMR),” first used in 2003 and often applied in European markets for nonsovereigns, which allows slightly more flexibility in the delivery option than the modified restructuring terms.
Box 2. Basis Effects from Nontechnical Factors—Some Recent Examples A large basis during distress can arise from nontechnical factors such as a squeeze on certain bonds stemming from debt management, or repo specialness. During August to September 2002, the large basis in Brazil was attributed to a squeeze on certain bonds with very short maturity (and high yields) such as the ‘04s and the eligible interest (“EI”) bonds. Market sources indicate that the Brazilian central bank also bought most of the Brazilian yen bonds, which further squeezed the market for CTD bonds and led to higher CDS spreads. Such actions by central banks may have intended consequences (e.g., inexpensive buy-backs) but may be misinterpreted by market participants since an increase in the basis may motivate sell-offs in the cash bond market. Repo specialness could also magnify the CDS basis. Anecdotal evidence from CDS and repo markets indicates that, around December 2001, local Argentine banks held short positions on Argentine sovereign bonds that served as collateral and allowed them to borrow cash. However, many local Argentine banks had to close such short positions by repo-ing certain bonds at 15 percent, a rate lower than the regulator’s 24 percent penalty. The repo transactions removed these bonds from the market, leaving fewer deliverable bonds after the credit event.

9
Other basis effects might attract future research in high-grade debt markets, but their impact is presumably small and difficult to gauge. The following focuses on exceptional situations of major financial distress, under which these effects were to take a back seat. This will become apparent in the following section, which explores the basis that arises when bond prices fall below par while recovery values remain high.
III. THE ROLE OF RECOVERY
Duffie (1999) shows that the effect of varying default intensity and recovery fraction is offsetting when pricing CDS in accordance with the underlying bond market. In this case, an underestimation of the recovery fraction will be compensated by an overestimation of the default intensity. When these parameters are used in the CDS spread formula, the bias will cancel out. This mechanism works especially well for short maturities and low par spreads. Nevertheless, it does not work in specific cases which might be more prevalent among sovereign CDS than in the corporate CDS market. Sovereign bonds often show features like low coupons, step-up language, or long maturities which cause bond issues to trade at a wide range of prices. The CTD is mostly trading far below par, especially when spreads are high. For sovereign CDS, there is also a large market for long-maturity contracts like 10 years, and the contractual terms allow for a wider range of credit events than for corporate CDS.7 All of these situations mark circumstances in which the offsetting mechanism admittedly fails. This motivates a closer look at the relationship between bond and CDS markets. The following explores the effect of bonds trading apart from par and the related impact of the recovery value. This explains most of the large, positive basis typically observed during distress. The main driver of the basis is the fact that bond and CDS spreads assume different concepts of recovery, which become incompatible at high spreads. For CDS, the recovery value represents a fraction of the insured nominal of the contract. This risk-neutral recovery measure, denoted here by ω , corresponds to the recovery fraction of face value insured by the CDS contract. When calculating the basis, the usual proceeding is to assume the same notional value for the CDS and the bonds. But bond spreads or bond risk premiums (such as gained from a bootstrapping analysis) implicitly apply a different measure of recovery. As Duffie and Singleton (1999) exemplify, bond spreads reflect the mean risk-neutral loss rate. In this context, the recovery value is based on the recovery of market value (RMV) scheme, where a fraction ψ of the pre-default bond value is received upon default. This inconsistency presents an analogy to volatility smiles observed in option markets: If the underlying’s price assumes no lognormal distribution, option values depart from the price
7 See Packer and Suthiphongchai (2003).

10
suggested by the Black-Scholes formula. When comparing the implied volatility for different exercise prices, the characteristic shape of volatility smiles or skews becomes apparent. The same logic can be extended to implied recoveries. Figure 2 illustrates the resulting “recovery smile” of Brazil CDS contracts. By use of the above CDS formula, observed CDS spreads are calibrated to the respective bond spread curve obtained from Bloomberg, adjusted by the common 25 percent RMV recovery assumption which apparently is biased: the implied recovery measure deviates significantly from this assumption.
Figure 2. Recovery Smile from Brazilian CDS Contracts (December 2004)
This discrepancy is best explained when simplifying the CDS and bond spread formulas under the risk-neutral measure. Let us assume a constant default intensity λ as well as a flat risk-free rate, and neglect for a moment the role of accruals et cetera (i.e., ττ =d , 0)( =dA τ ,
0* =c , 0=lc ). Imagining continuous premium payments, the formula for the fair CDS premium collapses to ( )λω−1 on the one hand. On the other hand, the bond risk premium in accordance with Duffie and Singleton (1999) is ( )λψ−1 . Given that both markets are subject to the same default intensity λ , it is obvious that the two premiums will only equal (implying a basis of zero) in two cases: (1) the recovery value is zero, so that 0==ψω , or (2) the bond trades close to par. In the latter case, the recovery received as a fraction of face value approximates the recovery received as a fraction of market value, so that ψω ≈ .8 The difference between ω and ψ becomes more pronounced when the underlying bond trades farther below par. The corresponding RFV recovery rate ω is in this case significantly lower than its RMV counterpart ψ . 8 This is exactly true only if the bond price always stays at par.
11
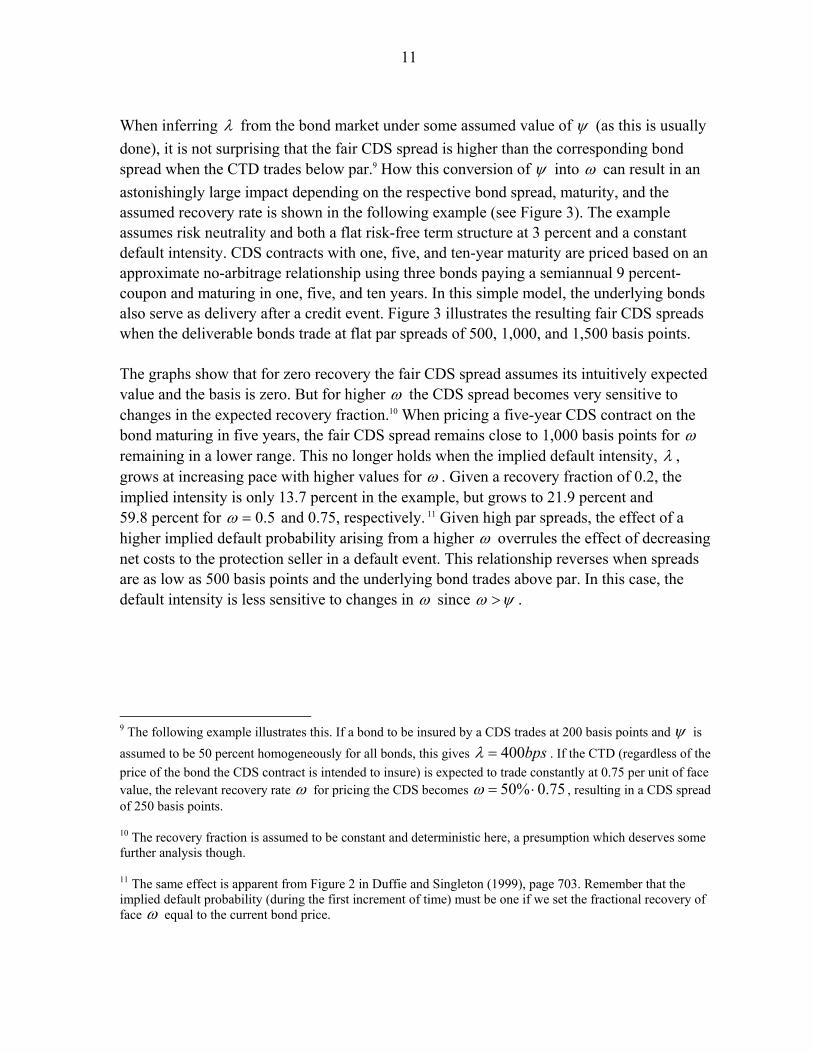
When inferring λ from the bond market under some assumed value of ψ (as this is usually done), it is not surprising that the fair CDS spread is higher than the corresponding bond spread when the CTD trades below par.9 How this conversion of ψ into ω can result in an astonishingly large impact depending on the respective bond spread, maturity, and the assumed recovery rate is shown in the following example (see Figure 3). The example assumes risk neutrality and both a flat risk-free term structure at 3 percent and a constant default intensity. CDS contracts with one, five, and ten-year maturity are priced based on an approximate no-arbitrage relationship using three bonds paying a semiannual 9 percent-coupon and maturing in one, five, and ten years. In this simple model, the underlying bonds also serve as delivery after a credit event. Figure 3 illustrates the resulting fair CDS spreads when the deliverable bonds trade at flat par spreads of 500, 1,000, and 1,500 basis points. The graphs show that for zero recovery the fair CDS spread assumes its intuitively expected value and the basis is zero. But for higher ω the CDS spread becomes very sensitive to changes in the expected recovery fraction.10 When pricing a five-year CDS contract on the bond maturing in five years, the fair CDS spread remains close to 1,000 basis points for ω remaining in a lower range. This no longer holds when the implied default intensity, λ , grows at increasing pace with higher values for ω . Given a recovery fraction of 0.2, the implied intensity is only 13.7 percent in the example, but grows to 21.9 percent and 59.8 percent for 5.0=ω and 0.75, respectively. 11 Given high par spreads, the effect of a higher implied default probability arising from a higher ω overrules the effect of decreasing net costs to the protection seller in a default event. This relationship reverses when spreads are as low as 500 basis points and the underlying bond trades above par. In this case, the default intensity is less sensitive to changes in ω since ψω > .
9 The following example illustrates this. If a bond to be insured by a CDS trades at 200 basis points and ψ is assumed to be 50 percent homogeneously for all bonds, this gives bps400=λ . If the CTD (regardless of the price of the bond the CDS contract is intended to insure) is expected to trade constantly at 0.75 per unit of face value, the relevant recovery rate ω for pricing the CDS becomes 75.0%50 ⋅=ω , resulting in a CDS spread of 250 basis points.
10 The recovery fraction is assumed to be constant and deterministic here, a presumption which deserves some further analysis though.
11 The same effect is apparent from Figure 2 in Duffie and Singleton (1999), page 703. Remember that the implied default probability (during the first increment of time) must be one if we set the fractional recovery of face ω equal to the current bond price.

12
Figure 3. Fair CDS Spreads as Function of the Recovery of Face Value
Fair CDS spreads of one- (solid line), five- (dashed line), and ten- (dotted line) year maturity on a corresponding cash bond with the same maturity and semiannual coupon of 9 percent. The three sets of lines correspond to the fair CDS spread in dependence of the expected RFV recovery fraction if the bond trades at spreads of 500 basis points (lower set of lines), 1,000 basis points (middle set of lines), and 1,500 basis points (upper set of lines). The risk-free term structure is flat at 3 percent annually. The no-arbitrage relationship used for Figure 3 is flawed by the aspect that the respective protection buyer might be overinsured (underinsured) if the underlying bond trades below (above) par. If the protection buyer wants to establish a static hedge of respective bonds at a certain point in time, he might be inclined to buy CDS contracts amounting to a notional which equals his bonds’ current market price.12 The above graph, however, assumes that he buys insurance for the full face amount of his bonds regardless of the trading price. To overcome this objection, one simply has to multiply the fair CDS spread by the respective market price of the bond. This results in a parallel shift of the lines in Figure 3 but does not change their curvature. The overall picture remains the same, even after considering accruals.
12 This is called partial protection. The corresponding argument for the protection seller would indicate that for achieving a neutral position when providing protection for a par value of 100 units of currency the protection seller would need to short more than 100 units of par value in the underlying bond.

13
Even allowing multiple bonds for acceptable delivery does not reverse the effect when the underlying trades below par, since the existence of a bond which trades cheaper than the underlying further increases the basis. As evident from this example, the irrelevance of the chosen recovery fraction is a good working assumption when the deliverable bonds trade near par. In this case, the CDS spread is insensitive to the exogenously chosen recovery value, and the difference between the RMV-based ψ and the RFV-based ω becomes irrelevant. Under such circumstances, other basis effects probably outweigh the recovery effect. This is the reason why, in practice, negative bases are observed for most nondistressed entities, even if the CTD trades slightly below par. In distress, however, the recovery effect cannot be neglected. The pricing of the CTD deserves special attention in such situations. As shown above, this can cause the basis to widen significantly.
IV. DATA ANALYSIS
The dependence of CDS bases on recovery values offers an opportunity to extract the implied risk-neutral recovery value from market data. This section will exploit empirical CDS and bond data for the purpose of extracting implied expected default recovery values, leaving aside potential other basis effects. The empirical analysis relies on different sets of data, based on common data sources (such as Bloomberg and Datastream) as well as quotes directly provided by traders. The analysis of approximate no-arbitrage relationships focuses on episodes of distress, where the recovery effect is most pronounced and dominates other basis effects. Among sovereign issuers, only a few cases are available matching the following selection criteria: (i) a prolonged period of spreads above 1,000 basis points;13 (ii) a rich data set of CDS quotes; (iii) the existence of cash bonds with roughly comparable tenor to serve as the derivative's underlying bond; and (iv) a set of CTD bonds trading below par. The Brazil crisis of 2002–03 complies best with these criteria, given the limited availability of liquid CDS quotes from other countries. Some of Brazil's cash bonds resemble CDS tenors of three and five years, which is useful for the further analysis. The time period of 2002–03 encompasses the entire cycle of a distress period. Figure 4 illustrates CDS spreads and the EMBI country subindex. Credit Trade data indicates that the usual trade size is between $5 and $35 million, with a mean size of $7.5 million. As is typical for distress periods, the term structure of spreads is inverted, with the one-year CDS quoting higher than the three- and five-year contracts. This relation is not reversed until the beginning of 2003, when spreads finally declined. First differences show a significant co-movement of CDS spreads, with correlation coefficients amounting to
13 This threshold is typically seen as a good proxy for distress. See Pescatori and Sy (2004).

14
96 percent and 98 percent, and the first principal component explaining 98.6 percent of the variation (and 95.6 percent of the AR(1) residuals).
Figure 4. CDS Spreads with One-, Three-, and Five-Year Tenor and the Brazil EMBIG Subindex during the Brazil Crisis of 2002–03
Figure 4 already gives a clear indication of the development of the basis during this period. Figure 5 plots the basis using spreads from cash bonds of similar tenor. The basis is higher for the three-year tenor, which is the result of a less strong inversion of the bond spread curve, both in absolute and in relative terms. Although a number of basis effects listed in Table 1 are possibly at work, only a few can be identified to offer a conclusive explanation for the basis. There is no evidence of extraordinary issuing activity in the cash bond market and proxies for short selling restrictions prove insignificant. With regard to relative liquidity, Longstaff, Mithal, and Neis (2005) show that this effect may widen the basis by around five basis points for liquid bonds, and up to 50 or 75 basis points during distress, according to information retrieved from market traders. However, for Brazil, indicators of liquidity on the CDS market contribute only marginally to explaining the basis. Generally, Brazil quotes show a mean bid-ask spread of 29.8 basis points, or 15 percent of the respective mid-quote. This is considerably higher than spreads on Brazil bonds, amounting to around 20 basis points.14 During distress, bid-ask spreads are relatively lower and make up only around 3 percent of the CDS mid-quote. The co-movement of the basis to common proxies of risk aversion is less obvious than in the sample countries used by Pan and Singleton (2005). In a regression of spread levels, the VIX volatility index explains between 10 percent and 20 percent of the variance. Other measures,
14 As measured by the British Bankers Association according to the EMBI+ subindex.

15
such as the EMBI Global, or the term spread of U.S. Treasuries, do not provide meaningful determinants of the CDS basis. The most significant influence can be traced back to the fact that the underlying bonds traded below par. A regression of the basis on the price difference to par explains more than 40 percent of the variance. If it is assumed that protection buyers ask only for partial protection (and therefore buy CDS to insure only the current market price of the underlying bonds), the basis is positive solely in autumn 2002, reaching to above 500 basis points. This preliminary analysis indicates that the price effect of these underlying bonds, trading far below par, is the main cause for the discrepancy of spreads between the CDS and the cash bond market.
Figure 5. Basis from Three- and Five-Year CDS and Similar Tenor Cash Bonds
V. IMPLIED RECOVERY VALUES UNDER NO ARBITRAGE
The analysis of basis effects in the previous section has offered many possible explanations and suggests that the spread difference between CDS and bonds might not be a good measure to assess the relative value of a position. Applying CDS and bond data from Brazil, the following section strives to yield the implied default intensity and recovery rate from a simple no-arbitrage framework. For this reason we choose bonds of about the same tenor as an available CDS contract. Assuming that the CDS is priced under no arbitrage, the observed market values can be used to calibrate Equation (4) and a common bond valuation formula. Leaving other basis effects aside, the CDS spread becomes some function of the default intensity and the recovery fraction,
( )ttt fc ωλ ,= , (5)

16
with the default intensity and recovery rate assumed to be constant throughout the life of the contract. The dirty bond price, in turn, is, under this no-arbitrage argument, a function of the very same parameters,
( )ttRFVt wP ωλ ,= . (6) When using a combination of one CDS spread for c in (5) and one corresponding bond price for P in (6), both variables, λ and ω , can be determined. Figures 6 and 7 illustrate this implied recovery fraction of face, ω , the main variable of interest, for different combinations of bonds and CDS.
Figure 6. Implied Recovery Rate from Three-Year CDS
Implied recovery rate ω from an approximate no-arbitrage relationship calibrated to three-year CDS and bond market data in Brazil. The implied parameters—the default intensity λ and the recovery rate ω —are assumed to be constant for the remaining life of the instruments. The grey line indicates the dirty price of one of the underlyings.
Figure 7. Implied Recovery Rate from Five-Year CDS
Implied recovery rate ω from an approximate no-arbitrage relationship calibrated to five-year CDS and bond market data in Brazil. The implied parameters—the default intensity λ and the recovery rate ω —are assumed to be constant for the remaining life of the instruments. The grey line indicates the dirty price of one of the underlyings.
17
It has to be borne in mind, though, that in this analysis the two implied parameters subsume all statistical noise, residual basis effects, as well as potential distortions emanating from a less than perfect match of maturities. Furthermore, the implied parameters represent risk-neutral measures, so that the implied recovery rate does not necessarily compare with realized recovery values. However, it is striking that the implied recovery rate during distress is much higher than the 25 percent standard assumption. The course of the implied recovery rates shows a strong correlation with the overall bond price level. This is a reasonable result as the underlying cash bond price provides an upper bound for the recovery value. When translating the implied recovery fraction of par into the respective recovery fraction of the underlying bond's market value, the resulting ψ is found to be between 0.74 and 0.80 for the five-year CDS, and close to 0.9 for the three-year CDS. At a first glance, the result might point towards a discrepancy between market CDS spreads and the theoretical spreads warranted by the model, possibly caused by other basis effects at work. When recalling that the recovery effect is less pronounced at shorter maturities, this conclusion appears even more plausible for Brazil where the recovery rate implied from three-year contracts is higher than for five-year contracts. It is reasonable to imagine that CDS spreads during very severe distress are higher than the model suggests since certain basis effects (such as a shortfall in the supply of protection and costs of short selling) become more significant. However, if this implied measure represents the true risk-neutral RFV fraction for all bonds, we would expect the recovery fraction to be about the same for all maturities. Such an interpretation neglects the fact that the implied recovery rates become higher than the CTD's price which, of course, has not yet entered the arbitrage relationship. This gives rise to the more flexible model of mixed recovery where a bond's total recovery value is comprised of two parts, an RFV fraction and an RMV fraction which is multiplied with the pre-default bond price. This is the most sensible way to draft a recovery scheme that fits all bonds, both the underlyings and the cheapest-to-deliver bond.15 Under this type of model, the recovery fraction of face value would be lower than the implied recovery value in the above estimations. The total recovery value of the CTD would cause the implied default intensity for the CDS and the underlying bond to assume lower values. This corrects a potential bias emanating from the above assumption of the underlying bond serving as delivery, and sheds more light on the crucial role of the CTD.
15 As evidence from Uruguay shows, even very plain maturity extension deals do not result in a constant ψ for all bonds. In practice, even soft restructurings resemble a mixed recovery framework where the recovery value is comprised by two recovery fractions ω and ψ . See Andritzky, 2006, p. 105.

18
VI. IMPLIED RECOVERY VALUES UNDER NO ARBITRAGE WITH CTD
This no-arbitrage relationship is made up by three instruments, the underlying bond, the cheapest-to-deliver bond, and the CDS contract. Assuming that our data present fair prices for each instrument, and that other basis effects are negligible, the formulas for CDS and bond prices suggest the distinction of the following unobservable variables: the RMV fraction, ψ , the RFV fraction, ω , and the intensity of a credit event, λ . While term structure models can be used to accommodate different shapes of forward intensities, the following uses a constant hazard rate function, which, together with the flexible model of mixed recovery, presents a sensible simplification suitable to this static estimation. The use of a constant hazard rate is necessary to infer, along with the default intensity, both implied recovery parameters, ω and ψ , from the daily prices of the three instruments under consideration. The resulting recovery value of the CDS, comprised of the RFV fraction, ω , and the RMV fraction of the CTD price, ψ , are shown for the three- and five-year contracts in Figures 8 and 9.16 Although it is well known that risk term structures are significantly inverted during distress, using constant default intensities is a reasonable working assumption for two reasons. First, the introduction of face value recovery (in contrast to market value recovery implicitly assumed when looking at spread term structures) causes the implied default intensity to level out as can be seen in a bootstrapping analysis. Second, distressed bond prices show little sensitivity to the long-term (survival contingent) default intensity as the likelihood of survival in the distant future is very low. The price of the Brazil CTD, which has a much longer duration than the three- and five-year tenor contracts regarded here, is therefore only marginally affected by an incorrect specification of the long-term default intensity. Figures 8 and 9 show two main results. First, the implied recovery value is found significantly higher than the 25 percent fraction of face most of the time. Second, the graph unveils a very high correlation between the implied recovery value and the dirty price of the relevant CTD during the heights of the crisis. During the period from July 2002 to January 2003, the correlation amounts to 85 percent for the three-year, and 83 percent for the five-year contract.
16 These figures are created for illustrative reasons (instead of plotting solely ω and ψ ), and incorporate additional assumptions. The graphed recovery value is discounted with the risk-free rate from the 75 percent quantile default time, i.e., the point in the future at which the cumulative default probability hits 75 percent. The recovery fraction of market value, ψ , is multiplied with the current clean price of the CTD which does not take into account fluctuations in the expected pre-default price. Results are illustrated only for one underlying. For the three-year tenor, Brazil 2006 US$10.25 percent was the most liquid bond and has the best maturity match. Results for the Brazil 2005 US$9.625 percent bond look comparable. For the five-year tenor, results for the other bonds look similar.

19
Figure 8. Implied RFV and RMV Recovery Fractions from Three-Year CDS
Dirty CTD price and implied recovery value of a three-year CDS contract, split by RFV and RMV fractions, where the Brazil 2006 10.25 percent US$ bond serves as underlying.
Figure 9. Implied RFV and RMV Recovery Fractions from Five-Year CDS
Dirty CTD price and implied recovery value of a five-year CDS contract, split by RFV and RMV fractions, where the Brazil 2008 11.5 percent US$ bond serves as underlying. The level and course of the implied recovery rates are fairly similar for both CDS maturities. For the five-year contract, the recovery of face value portion, ω , remains stable around 20 percent of face value while almost all variation originates from fluctuations in the ψ -recovery fraction. During the period of autumn 2002, when spreads hit their peak, the implied total recovery value almost equals the CTD price. This implied recovery value can be interpreted as the investors' expectations with regard to the value recovered from a possible restructuring. The constellation suggests that CDS markets expected an imminent, but soft restructuring.
20
VII. CONCLUSIONS
The conjecture that recovery is not a relevant determinant of CDS spreads is a reasonable approximation during nondistress periods. The theoretical section of this paper, however, indicates that when bonds trade considerably below par, for instance during distress, the role of recovery cannot be put aside. Awareness of this phenomenon is important for understanding CDS spreads and a well functioning market for protection. The empirical observation that CDS spreads are much higher than bond spreads during distress exceeds the scope of traditional basis effects (such as the delivery option), and is based on two mechanisms. The first is the fact that, at bond prices below par, a CDS contract insuring the par value offers overinsurance, resulting in a positive basis. Additionally, the relevant recovery rate for CDS contracts is the post-default value of the bond chosen for delivery by the protection buyer. The protection buyer would, preferably, choose the cheapest-to-deliver bond. Independent of the underlying to be protected, the cheaper the expected post-default price of the CTD in relation to the underlying bond, the higher the wedge between the CDS and the bond spread. The second mechanism refers more directly to the impact of the chosen recovery fraction to price CDS. This is best illustrated in a model calculation in which a CDS contract price is based on an underlying bond with the same tenor, being the only accepted delivery. Using simplified formulas, the bond spread equals the product of the hazard rate, λ , and the loss rate using the RMV definition, ( )ψ−1 . In contrast, CDS are par instruments so that the CDS spread is the product of λ and the loss rate using the RFV definition, ( )ω−1 . At high spreads during distress, the underlying bond usually trades below par. Thus, any exogenously assumed recovery fraction of face value translates into a higher recovery fraction of market value, and ωψ > . Assuming consistent pricing of CDS and bonds under risk neutrality, this causes the fair CDS spread to increase exponentially with higher values for ω , given that the bond price is below par. This nonlinear relationship becomes more pronounced for higher spreads and longer CDS maturities. During crises, the above effect can be used to infer the implied recovery rate from market data of CDS and bond spreads, assuming that both are driven by the same parameters. Using data from the Brazil crisis in 2002–03, this helps to explain why the CDS basis reached levels as high as 2,500 basis points. Calibrating bond and CDS formulas for different combinations of three- and five-year tenor instruments suggests that the implied recovery rate is closely related to the underlying bond price and remained above 40 percent of par during most of the crisis. Using a combination of three instruments (the CDS, the underlying bond, and the CTD), it is possible to distinguish between the RMV and RFV fractions, following the idea of mixed recovery concept using both ω and ψ . Results for the Brazil crisis show that CDS and bond data implied an almost constant recovery fraction of par (about 20 percent), while the RMV fraction adds another portion of up to 25 percent to the total

21
implied recovery value. The implied recovery value is strongly correlated with the CTD during the heights of the crisis, supporting the idea that the CTD is a useful proxy for pricing CDS (Singh, 2004). Furthermore, the very high recovery value (in comparison to the CTD) suggests that markets expected a restructuring at soft terms, in fall 2002.

22
REFERENCES
Andritzky, Jochen, 2005, “Default and Recovery Rates of Sovereign Bonds: A Case Study of
the Argentine Crisis,” Journal of Fixed Income, Vol. 7, pp. 97–107. –––––, 2006, Sovereign Default Risk Valuation (New York: Springer). Cossin, Didier, Tomas Hricko, Daniel Aunon-Nerin, and Zhijiang Huang, 2002, “Exploring
for the Determinants of Credit Risk in Credit Default Swap Transaction Data: Is Fixed-Income Markets’ Information Sufficient to Evaluate Credit Risk?” Research Paper Series No. rp65 (Brussels: HEC–University of Lausanne).
Duffie, Darrell, 1999, “Credit Swap Valuation,” Financial Analyst’s Journal, Vol. 55
(January-February), pp. 73–87. ————, and Kenneth J. Singleton, 1999, “Modeling Term Structures of Defaultable
Bonds,” Review of Financial Studies, Vol. 12, No. 4 (Special), pp. 687–720. Hull, John, and Alan White, 2000, “Valuing Credit Default Swaps II: No Counterparty
Default Risk,” Journal of Derivatives, Vol. 8, No. 1 (Fall), pp. 29–40. ————, 2001, “Valuing Credit Default Swaps II: Modeling Default Correlations,” Journal
of Derivatives, Vol. 8, No. 3 (Spring), pp. 12–22. Longstaff, Francis A., Sanjay Mithal, and Eric Neis, 2005, “Corporate Yield Spreads: Default
Risk or Liquidity? New Evidence from the Credit Default Swap Market,” Journal of Finance, Vol. 60, No. 5 (October), pp. 2213–53.
Merrick, John J., 2001, “Crisis Dynamics of Implied Default Recovery Ratios: Evidence
from Russia and Argentina,” Journal of Banking & Finance, Vol. 25, No. 10 (October), pp. 1921–39.
Packer, Frank, and Chamaree Suthiphongchai, 2003, “Sovereign Credit Default Swaps,” BIS
Quarterly Review, pp. 79–88. Packer, F., and H. Zhu, 2005, “Contractual Terms and CDS Pricing,” BIS Working Paper
(Basel: Bank for International Settlements). Pan, Jun, and Kenneth J. Singleton, 2005, “Default and Recovery Implicit in the Term
Structure of Sovereign CDS Spreads” (mimeo, Stanford: Stanford University). Pescatori, A. and A. Sy, 2004, “Debt Crises and the Development of International Capital
Markets” IMF Working Paper WP/04/44 (Washington: International Monetary Fund).
23
Schönbucher, Philipp J., 2004, “A Measure of Survival,” RISK 17, Risk Technical Papers (August), pp. 79–85.
Singh, Manmohan, 2004, “A New Road to Recovery,” RISK Magazine (September). ————, and Jochen Andritzky, 2005, “The Realities of Emerging Market CDS,”
Euromoney (September), pp. 214-7. Zhang, Frank X., 2003, “What Did the Credit Market Expect of Argentina Default? Evidence
from Default Swap Data,” FEDS Paper No. 25 (Washington: Federal Reserve Board).