the preparatory survey on transmission system network...
TRANSCRIPT

4RJR(先)17-058
The Preparatory SurveyOn
Transmission System NetworkReinforcement Project
inIslamabad and Burhan Area
inThe Islamic Republic of Pakistan
September 2017
Japan International Cooperation AgencyAsia Engineering Consultant Co., Ltd.
CTI Engineering International Co., Ltd.
Ministry of Water and PowerNational Transmission and Despatch Company LimitedThe Islamic Republic of Pakistan

Summary-1
Summary General Information on the Project
Background and Purpose of the Project The background and the purpose of the project
In the Islamic Republic of Pakistan (hereinafter referred to as “Pakistan”), an average of 5.5 % per year of electricity demand growth was estimated by 2020, however the electric power supply and demand gap is serious in recent years. Considering this situation, according to increase of power station capacity, it is necessary to reinforce the existing transmission lines which relate to the incremental power station capacity, raise up the reliability of electric power supply and respond the future power demand growth. Eventually, electric power sector issues are resolved by contribution of the countermeasure.
Actually to respond to reinforcement of the forth expansion of Tarbela power station, 1900 MW, electric power supply to metropolitan areas which have many important facilities are to be strongly intensified. The plan is shown as below; To reinforce the capacity of the 220 kV existing transmission line, improve reliability and increase the power transmission line efficiency from Tarbela power station to Burhan grid station (35km) and from Tarbela power station to ISPR (Islamabad Peshawar Road) grid station.
Scope of the Survey Implementation of the following works relevant to the Project 1) and 2)
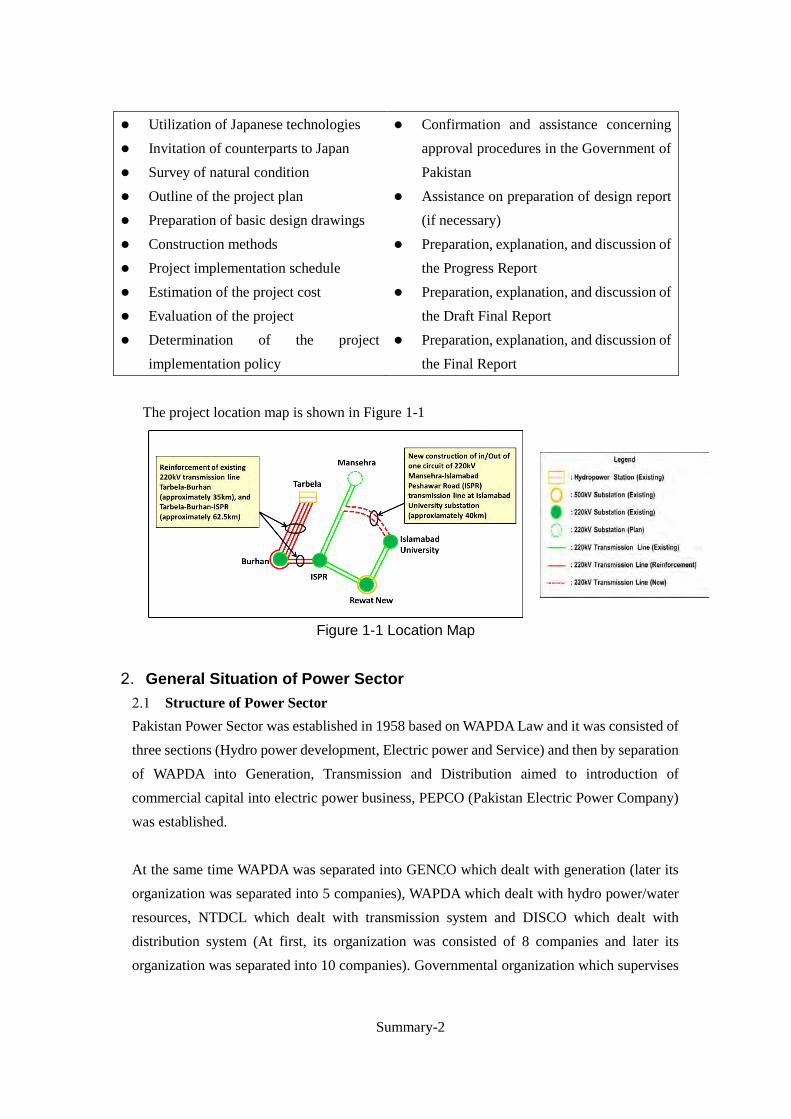
1) New construction of in/out of one circuit of 220kV Mansehra-Islamabad Peshawar Road (ISPR) transmission line at Islamabad University substation (approximately 40km)
2) Reinforcement of existing 220kV transmission line Tarbela-Burhan (approximately 35km), and Tarbela-Burhan-ISPR (approximately 62.5km)
.
Advance preparation Confirmation of the background and
course of the project Survey on current situation of the target
system and existing facilities Outline design and selection of the
optimum plan
Project implementation and maintenance structure
Formulation of consulting service implementation plan
Environmental and social considerations Assistance on preparation of Abbreviated
Resettlement Plan (ARP)
Summary-2
Utilization of Japanese technologies Invitation of counterparts to Japan Survey of natural condition Outline of the project plan Preparation of basic design drawings Construction methods Project implementation schedule Estimation of the project cost Evaluation of the project Determination of the project
implementation policy
Confirmation and assistance concerning approval procedures in the Government of Pakistan
Assistance on preparation of design report (if necessary)
Preparation, explanation, and discussion of the Progress Report
Preparation, explanation, and discussion of the Draft Final Report
Preparation, explanation, and discussion of the Final Report
The project location map is shown in Figure 1-1
Figure 1-1 Location Map
General Situation of Power Sector Structure of Power Sector
Pakistan Power Sector was established in 1958 based on WAPDA Law and it was consisted of three sections (Hydro power development, Electric power and Service) and then by separation of WAPDA into Generation, Transmission and Distribution aimed to introduction of commercial capital into electric power business, PEPCO (Pakistan Electric Power Company) was established. At the same time WAPDA was separated into GENCO which dealt with generation (later its organization was separated into 5 companies), WAPDA which dealt with hydro power/water resources, NTDCL which dealt with transmission system and DISCO which dealt with distribution system (At first, its organization was consisted of 8 companies and later its organization was separated into 10 companies). Governmental organization which supervises

Summary-3
those companies mentioned above is MOP(Ministry of Water and Power)
Government Policy of Power Sector Long Term Plan of Power Sector In Pakistan Long Term National Power Policy (National Power System Expansion Plan 2011-2030) for Electric Power Sector was settled in the year of 2010. The contents of this plan showed expansion plan policy which explained electricity supply from power stations to main urban districts. Short Term Plan of Power Sector In Pakistan Short Term National Power Policy for Electric Power Sector was settled in 2013 according to the long term plan, Electric Power System Expansion Plan, mentioned above.
Policy and Assignment of NTDCL Obligation of NTDCL NTDCL is responsible to supply stable electric power to the customers following Grid Code as the Pakistan electric transmission company. Substations and Transmission lines as of November 2015 are shown in Table 1-1.
Table 1-1 Scope of Substation and Transmission line
(Source:Five Year Expansion Plan of NTDCL, December, 2015)
Assignment of NTDCL ・Interconnection transmission lines for evacuation of power from the power plants to
respective load centers. ・New 500 kV & 220 kV Substations along with associated transmission lines to meet the
increasing power demand of DISCOs ・Extension & Augmentation to remove the overloading of existing substations.
The Five Year Expansion Plan is shown as below;

Summary-4
Table 1-2 NTDCL Five Year Plan
(Source:Five Year Expansion Plan of NTDCL, December, 2015)
Power System Development Plan formulated by NTDCL in the Project Area and its Surroundings
As of November 2015, according to the “Five Year Expansion & Investment Plan of NTDCL (2015-16 to 2019-20)”, the following system expansion is proposed over the 2019-20 year:
Table 1-3 NTDCL’s Power System Development Plan
Type Voltage Transmission Lines Substations
500kV 3,460km 8 places(12,500MVA) 220kV 1,591km 21 places(14,970MVA)
Among this, the details of development plan in this project area and its surroundings are described in original version. Both 1) Reinforcement of existing 220kV transmission line Tarbela-Burhan and Tarbela – Burhan - ISPR and 2) New construction of in/Out of one circuit of 220kV Mansehra-Islamabad Peshawar Road (ISPR) transmission line at Islamabad University substation, the targets of this survey, are included in the Medium Term Plan.
Current Situation of the Project Target System Power System Map of the Project Target System
Islamabad and Burhan area is fed by the following 500kV and 220kV transmission lines shown in Table 1-4.

Summary-5
Table 1-4 500kV and 220kV Transmission Lines supplying Power to Islamabad and Burhan Area
No. Voltage (kV) From To Circuit
No. Number
of Circuit Length (km) Year
1 500 Tarbela Rawat New 1 1 110.89 1997 2 220 Tarbela Burhan 1, 2 2 35.1 1977 3 220 Tarbela Burhan 3 1 35.4 1977 4 220 Burhan Sangjani (ISPR) 1 1 27.1 1998 5 220 Tarbela Sangjani (ISPR) 1 1 62.5 1998 6 220 Sangjani (ISPR) Rawat New 1, 2 2 43.04 1998 7 220 Sangjani (ISPR) Mansehra I & II 1, 2 2 100.48 2011 8 220 Rawat New Islamabad University 1, 2 2 49.9 2004
(Source: Power System Statistics 2014-2015 40th Edition, Planning Power NTDC)
Current Situation of the Project Target System The transition of annual number of outages, annual total duration of outages, and maximum duration of single outage, which are based on the tripping reports/electrical fault data for the project target 220kV transmission lines for the period between 2011 and 2015, were examined based on the tripping reports provided by NTDCL. Annual number of outages is relatively large in the section between Mansehra and ISPR. The main cause of the transmission line trip is a flashover caused by a lightning strike. For the annual total duration of outages, Tarbela - Burhan section has recorded 551 minutes/year over the years from 2011 to 2012. In other sections, the annual total duration of outages has remained at less than 150 minutes/year after 2013. The maximum duration of single outage ranges from dozen minutes to a maximum 290 minutes. This outage was caused by a ground wire breaking incident occurred to the section between Tarbela and Burhan substations. For other cases, it took from about a dozen of minutes to several tens of minutes for line reclosing in the case of power failure. No significant improvement effect in decreasing of the annual number of outages, annual total duration of outages, and maximum duration of single outage on the existing transmission sections to be reinforced is expected by implementation of the project. On the other hand, improvement in power supply reliability is expected by implementation of new construction of the transmission line to Islamabad University substation in that it enables securing additional source of power supply from Mansehra substation and ISPR substation (after commissioning of Islamabad West substation in 2019, the source substation will be change from ISPR to Islamabad West substation).
Summary-6
Power Demand Forecast NTDCL sets out the power demand of each substation level from 66kV up to 220kV based on the medium-term power demand forecast for the year from 2014 to 2024, which was prepared in May 2015 for the transmission system planning, based on the power market survey. Future demand for each substation in the analysis model which NTDCL Planning Power used for the power system analysis for the project in PC-1 was based on the medium-term demand forecast. Therefore, the power flow analysis models (provided by NTDCL Planning Power) which reflect the substation load data based on the same premise as the PC-1, were utilized.
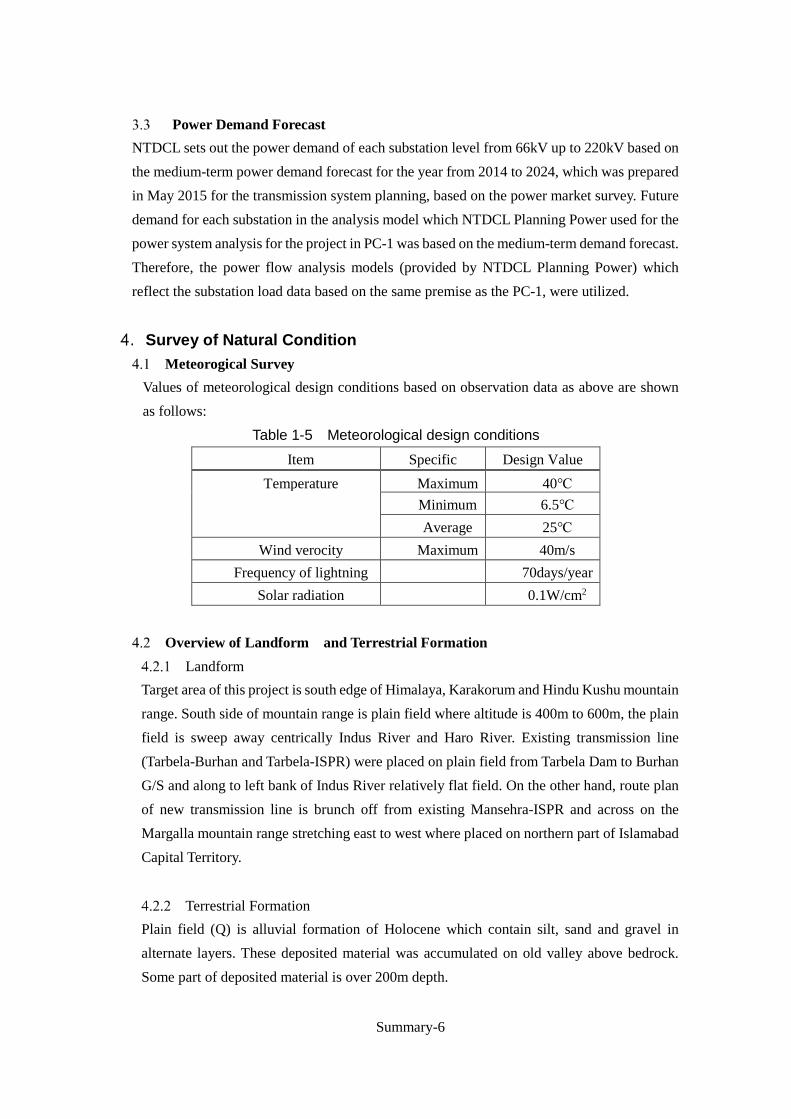
Survey of Natural Condition Meteorogical Survey
Values of meteorological design conditions based on observation data as above are shown as follows:
Table 1-5 Meteorological design conditions Item Specific Design Value
Temperature Maximum 40℃ Minimum 6.5℃ Average 25℃
Wind verocity Maximum 40m/s Frequency of lightning
70days/year
Solar radiation 0.1W/cm2
Overview of Landform and Terrestrial Formation Landform
Target area of this project is south edge of Himalaya, Karakorum and Hindu Kushu mountain range. South side of mountain range is plain field where altitude is 400m to 600m, the plain field is sweep away centrically Indus River and Haro River. Existing transmission line (Tarbela-Burhan and Tarbela-ISPR) were placed on plain field from Tarbela Dam to Burhan G/S and along to left bank of Indus River relatively flat field. On the other hand, route plan of new transmission line is brunch off from existing Mansehra-ISPR and across on the Margalla mountain range stretching east to west where placed on northern part of Islamabad Capital Territory.
Terrestrial Formation Plain field (Q) is alluvial formation of Holocene which contain silt, sand and gravel in alternate layers. These deposited material was accumulated on old valley above bedrock. Some part of deposited material is over 200m depth.

Summary-7
Margalla mountain range (Tep) which target to new transmission line is mainly mesozoic jurassic and palepgene eocene limestone with marl and shales. There are fault which are south side of Margalla mountain range. These sequence is intricate due to fault motion and fold effect.
Earthquake Seismic zone is defined in Building Code of Pakistan. Seismic zone of target area is shown in Table 1-6. Seismic zone were defined as for ground acceleration depending on ground condition. Design load due to Earthquake is smaller than wind load. Therefore design of Tower take no thought for seismic load.
Table 1-6 View Format of Seismic Zone in Target Area Table 1-7 Seismic Zone
Environmental and Social Consideration Social Environment in and around Project Site
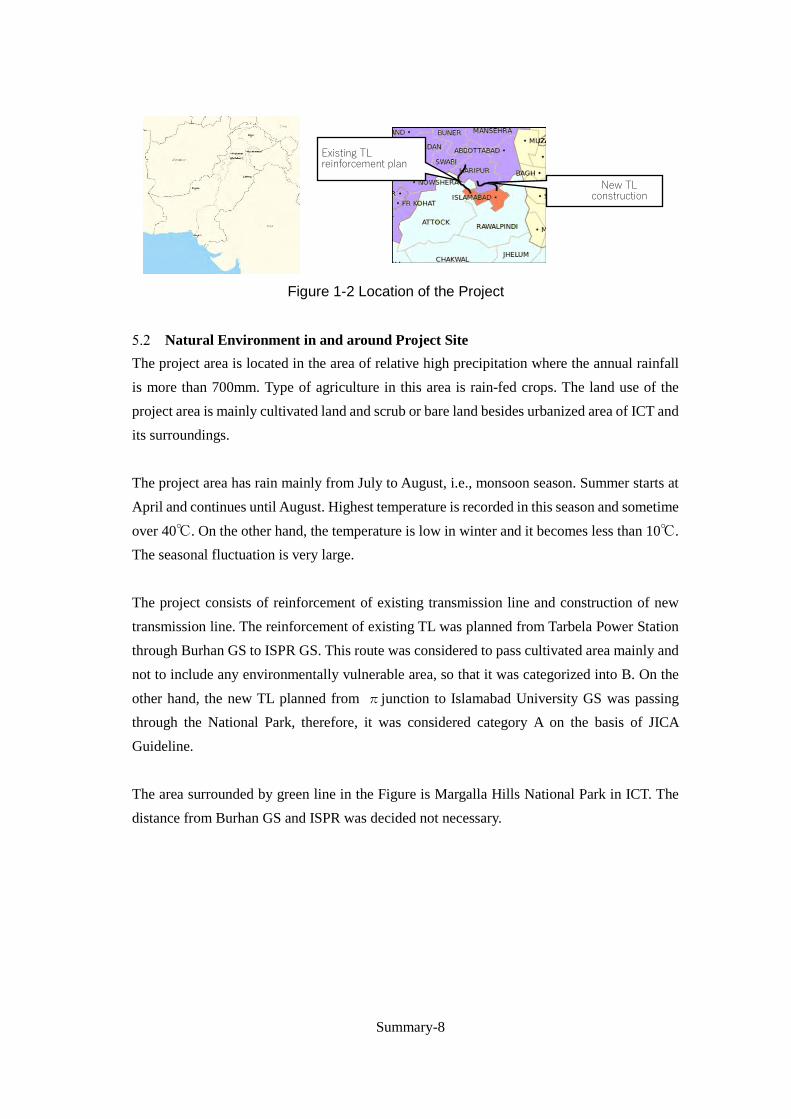
Pakistan is Islamic country located in south Asia, which have 796,096km2 in area, and contacting with Afghanistan, China, India and Iran. Total population in 2014 is about 180 million and its growth rate is about 1.8〜1.6%. Islamabad is a capital city which has relative dense population. Due to rapid growth of population and urbanization, the infrastructure development has been big issue to the city. Figure 1-2 shows the administrative boundaries of Pakistan and the enlarged view of project area surroundings. The project area is located in Islamabad Capital Territory (ICT), Attok district in Punjab province, Abbottabad and Haripur district in Khyber Pakhtunkhwa province.
Section/Grid Station Province Seismic
Zone
Tarbela G/S ~ Burhan G/S KP Zone 2B
Tarbela G/S ~ Burhan G/S ~
ISPR(Sangjani) G/S
KP Zone 2B
Punjab Zone 2B
Mansehra G/S ~ ISPR(Sangjani) G/S ~
Islamabad University G/S
KP Zone 3
Punjab Zone 2B
Tarbela Power House KP Zone 2B
Burhan G/S Punjab Zone 2B
ISPR(Sangjani) G/S Punjab Zone 2B
Seismic Zone Peak Horizontal Ground
Acceleration
1 0.05~0.08g
2A 0.08~0.16g
2B 0.16~0.24g
3 0.24~0.32g
4 >0.32g
Summary-8
Figure 1-2 Location of the Project
Natural Environment in and around Project Site
The project area is located in the area of relative high precipitation where the annual rainfall is more than 700mm. Type of agriculture in this area is rain-fed crops. The land use of the project area is mainly cultivated land and scrub or bare land besides urbanized area of ICT and its surroundings. The project area has rain mainly from July to August, i.e., monsoon season. Summer starts at April and continues until August. Highest temperature is recorded in this season and sometime over 40℃. On the other hand, the temperature is low in winter and it becomes less than 10℃. The seasonal fluctuation is very large. The project consists of reinforcement of existing transmission line and construction of new transmission line. The reinforcement of existing TL was planned from Tarbela Power Station through Burhan GS to ISPR GS. This route was considered to pass cultivated area mainly and not to include any environmentally vulnerable area, so that it was categorized into B. On the other hand, the new TL planned from πjunction to Islamabad University GS was passing through the National Park, therefore, it was considered category A on the basis of JICA Guideline. The area surrounded by green line in the Figure is Margalla Hills National Park in ICT. The distance from Burhan GS and ISPR was decided not necessary.
New TL construction
Existing TL reinforcement plan

Summary-9
Figure 1-3 Original Plan of TL and National Park Location
Environmental and Social Consideration in Pakistan Ministry of Climate Change (MOCC) is responsible for environmental policy in Pakistan. Pakistan Environment Protection Agency (Pak EPA) is one of attached departments of MOCC which is working for environmental management practically. Pak EPA is working for federal and national issues. On the other hand, each province has own EPA and the provincial EPA is responsible for environmental issues in the province. This project is located in Khyber Pakhtunkhwa (KP), Punjab and ICT, thus the project proponent should obtain No Objection Certificate (NOC) from all concerning provinces. Pakistan has a regulation which determines which project requires EIA. This project falls in the extra high voltage project (more than 11kV) which needs the EIA. In the beginning of the survey, EIA was considered unnecessary for the part of existing TL, but it was finally judged a target of EIA.
Legal Framework of Land Acquisition and Resettlement for TL Project Power Supply Authority is not allowed to acquire a land for TL and post on the basis of Telegraph Act 1910. Therefore NTDCL pays compensation for the use of TL project to a land owner. However, NTDCL does not allow any person lives within the ROW and resettlement will be required in such case. NTDCL has no power to remove encroachment in the ROW, accordingly, the many unacceptable illegal residents are living under TL, especially in the urbanized area.
Implementation Structure of the Project NTDCL established Environmental and Social Impacts Cell (ESIC) in 1997 for the environmental management. ESIC is an organization under chief engineer EHV, and it is in charge of the environmental and social issues management for the construction, operation and
Tarbela PS
Islamabad
π
Burhan
SPR
Summary-10
maintenance of the NTDCL project. Because ESIC is operated by a few members, it seems to be difficult to look out deeply for all NTDCL projects. The practical part of environmental management is taken care by Project Management Unit (PMU) and Project Implementing Unit (PIU)
The project implementation and the maintenance organization Project implementation Structure
The organization of NTDCL NTDCL is composed of 11,700 personnel, as the top of managing director. However, as a matter of fact, 3,200 people are vacant and 8,500 person are enrolled. The organization chart of NTDCL is as below.
Related departments of project implementation The relevant departments, mainly design and construction, are as below. 1) Planning 2) Design 3) MP&M 4) CCC 5) GSC 6) Environmental & Social Impact Cell
Relevant Governmental Agency Relevant governmental agencies are 1) Water and Power Development Authority (WAPDA), 2) Environmental Protection Agency (EPA), 3) Planning Commission, 4) Ministry of Finance and so on.
Order Procedure of Construction Project (1) Procedure of the construction
1)Creating of the bid documents 2)Official announcement (e.g. Newspaper, the NTDC website and PPRA website) 3)Bidding 4)Approval of the order supplier 5) Publication of the order supplier
(2) Procedure of consulting service 1) Creating of the ordering book 2) Official announcement (e.g. Newspaper, the NTDC website and PPRA website) 3) Bidding 4) Approval of the order supplier 5) Publication of the order supplier
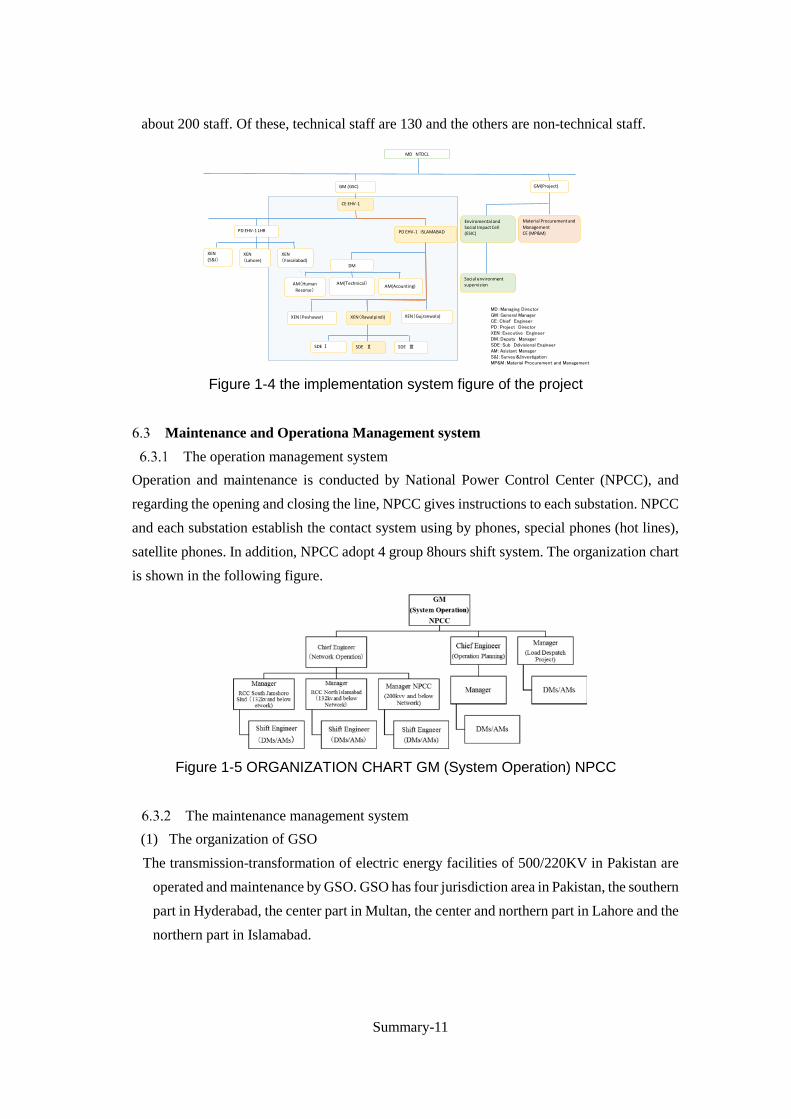
The project implementation system In this project, Chief Engineer EHV-1 in Lahore takes full responsibility. EHV-1 is consisted of 590 people, and 350 are technical staff and the others are non-technical staff. PD EHV-1 in Islamabad office takes responsibility for construction of this project, and it is consisted of
Summary-11
about 200 staff. Of these, technical staff are 130 and the others are non-technical staff.
Figure 1-4 the implementation system figure of the project
Maintenance and Operationa Management system The operation management system
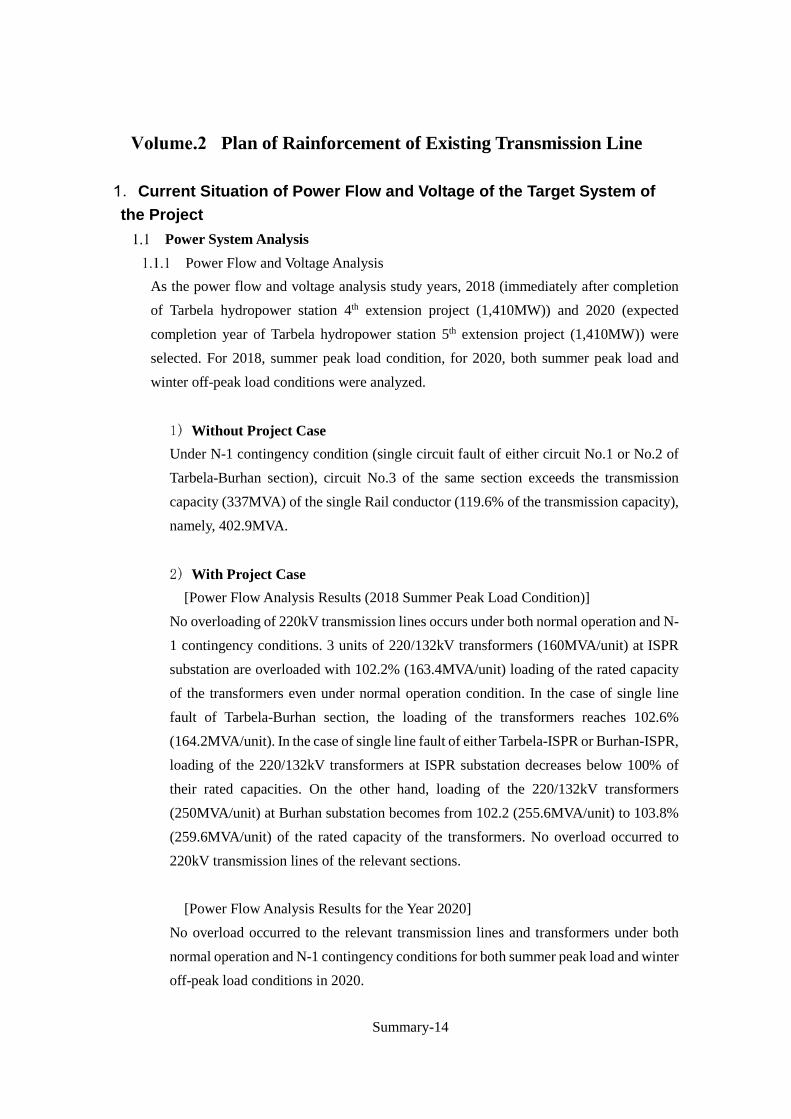
Operation and maintenance is conducted by National Power Control Center (NPCC), and regarding the opening and closing the line, NPCC gives instructions to each substation. NPCC and each substation establish the contact system using by phones, special phones (hot lines), satellite phones. In addition, NPCC adopt 4 group 8hours shift system. The organization chart is shown in the following figure.
Figure 1-5 ORGANIZATION CHART GM (System Operation) NPCC
The maintenance management system (1) The organization of GSO The transmission-transformation of electric energy facilities of 500/220KV in Pakistan are
operated and maintenance by GSO. GSO has four jurisdiction area in Pakistan, the southern part in Hyderabad, the center part in Multan, the center and northern part in Lahore and the northern part in Islamabad.
MD:Managing DirectorGM:General ManagerCE:Chief Engineer PD:Project DirectorXEN:Executive EngineerDM:Deputy ManagerSDE:Sub Ddivisional EngineerAM:Asistant ManagerS&I:Survey&InvestigationMP&M:Material Procurement and Management
PD EHV-1 ISLAMABAD
DM
AM(HumanResorse)
AM(Technical) AM(Acounting)
XEN (S&I)
GM (GSC) GM(Project)
Enviromental and Social Impact Cell(ESIC)
Material Procurement and ManagementCE (MP&M)
Social environment supervision
XEN(Peshawar) XEN(Gujranwala)
SDEⅠ SDE Ⅲ
CE EHV-1
PD EHV-1 LHR
XEN(Lahore)
XEN(Faisalabad)
XEN(Rawalpindi)
SDE Ⅱ
MD NTDCL

Summary-12
(2) The system of the maintenance The maintenance system at each substation is as the following. 1) Operation & Maintenance of Grid Stations ・Operational Crew ・Maintenance Crew ・P&I Crew 2) Operation & Maintenance of T/Lines 500kv T/Line・・・・・・・・・(939.34 ㎞) 220kv T/Line・・・・・・・・・(2507.01 ㎞) Maintenance of T/Lines is carried out by the following staff ・Deadline Crew ・Live line Crew (3) A distribution of personnel example at the substation is shown below.
Figure 1-6 the distribution-of-personnel example at the substation
Invitation to Japan Purpose
The purpose of the visit is to inspect the power transmission lines of Japanese electric power company and other advanced technologies to be applied to the Japanese electric power company. Therefore NTDCL mission members visited Japanese electric power company and electric power facilities which utilized with the latest advanced technologies of Japanese commercial companies (electric power company, makers) developed and then the explanatory meeting was held to examine how to apply these Japanese advanced technologies to NTDCL.
Mission Members of Japan Visit National Transmission and Distribution Company Limited (NTDCL) selected. Approximately 9 persons under General Manager Class and they were invited to Japan. Members are shown as below Table 1-8.
DEPUTY MANAGER(1)
ASSISTANT MANAGER
OPERATION(1)
ASISTANT MANAGER
SHIFT(2)
SHIFT OPERRATOR(16)
DRIVER(1)
ASSISTANT MANAGER
MENTENANCE(1)
FOREMAN(1)
ASSISTANT FORMAN(2)
OTHERS(8)
DRIVER(1)
SUB ENGINEER(1)
MASON(1)
MALI(6)
OTHERS(5)
ASSISTANT MANAGER(1)
TEST INSPECTOR(1)
LAB ASSISTANT(1)
OTHERS(3)
DIVISIONAL ACOUNTS OFICER(1)
ACOUNT ASSISTANT(1)
OTHERS(3)
SECURITY OFFICER(1)
SECURITY INSPECTOR(1)
SECURITY SERGENT(4)
SECURITY GUARD(26)

Summary-13
Table 1-8 NTDCL Invitees to Japan Post, Position Office place
1 General Manager (Planning), Lahore PIA building, Lahore
2 Chief Engineer (Planning), Lahore PIA building, Lahore
3 Dy, Manager T/L (EHV-2), Multan Multan
4 PD (EHV-1), Islamabad Islamabad
5 Additional Manager 220kV G/S, Mardan Mardan
6 Deputy Manager 220kV G/S, Sangjani Islamabad
7 Deputy Manager (Design), Lahore WAPDA house, Lahore
8 Deputy Manager T/L (M) Div. 500kV G/S, Peshawar Peshawar
9 Assistant Manager Planning (Power) Lahore PIA Building, Lahore
Schedule Main facilities of electric power company to be inspected were Central Control Center which controls main electric power system of the Kansai Electric Power, AC-DC converter station and Control Center which controls several 500 kV substations in Kansai Electric Power. Further in Kanto area of Japan, NTDCL inspected advanced high technology conductors. They also inspected electric power equipment maker factory.
Outcome of Invitations for Training in Japan
(1) NTDCL members inspected Central Control Center of Kansai Electric Power Company and they learned control conditions of Japanese electric power company. It is very useful for NTDCL to improve their control conditions of transmission grid in Pakistan.
(2) They visited Kihoku DC convertor center and DC transmission line of Kansai Electric Power. They deepened their knowledge of construction of future DC transmission lines in Pakistan.
(3) They visited 500 kV substation of Kansai Electric Power and they deepened their knowledge of GIS which will be constructed in the near future in Pakistan.
(4) They inspected low loss transmission line conductor (LL-ACSR) which was manufactured by Sumitomo Electric factory and the manufacturing process of LL-ACSR. They were explained performance of LL-ACSR and they deepened their knowledge of LL-ACSR which will be applied to future project in Pakistan.
(5) They visited electric power equipment manufacturer, Toshiba which manufactured GIS and Arrestor. Then they deepened their knowledge of Japanese electric power equipment which had little supply record in Pakistan.
Summary-14
Plan of Rainforcement of Existing Transmission Line
Current Situation of Power Flow and Voltage of the Target System of the Project
Power System Analysis Power Flow and Voltage Analysis
As the power flow and voltage analysis study years, 2018 (immediately after completion of Tarbela hydropower station 4th extension project (1,410MW)) and 2020 (expected completion year of Tarbela hydropower station 5th extension project (1,410MW)) were selected. For 2018, summer peak load condition, for 2020, both summer peak load and winter off-peak load conditions were analyzed.
Without Project Case Under N-1 contingency condition (single circuit fault of either circuit No.1 or No.2 of Tarbela-Burhan section), circuit No.3 of the same section exceeds the transmission capacity (337MVA) of the single Rail conductor (119.6% of the transmission capacity), namely, 402.9MVA.
With Project Case [Power Flow Analysis Results (2018 Summer Peak Load Condition)]
No overloading of 220kV transmission lines occurs under both normal operation and N-1 contingency conditions. 3 units of 220/132kV transformers (160MVA/unit) at ISPR substation are overloaded with 102.2% (163.4MVA/unit) loading of the rated capacity of the transformers even under normal operation condition. In the case of single line fault of Tarbela-Burhan section, the loading of the transformers reaches 102.6% (164.2MVA/unit). In the case of single line fault of either Tarbela-ISPR or Burhan-ISPR, loading of the 220/132kV transformers at ISPR substation decreases below 100% of their rated capacities. On the other hand, loading of the 220/132kV transformers (250MVA/unit) at Burhan substation becomes from 102.2 (255.6MVA/unit) to 103.8% (259.6MVA/unit) of the rated capacity of the transformers. No overload occurred to 220kV transmission lines of the relevant sections.
[Power Flow Analysis Results for the Year 2020] No overload occurred to the relevant transmission lines and transformers under both normal operation and N-1 contingency conditions for both summer peak load and winter off-peak load conditions in 2020.

Summary-15
[Power Flow Analysis for the construction period] In the summer of 2019, namely, during the construction period of the project, power supply to Burhan substation depends only on the two lines; Tarbela-Burhan circuit No.1 and 2, reinforcement of which is planned by the self-financing of NTDCL since the two circuits 1) Tarbela-Burhan circuit No.3 and 2) Tarbela-Burhan section of Tarbela-Burhan-ISPR line will become out-of-service. The power flow analysis under N-1 contingency condition (fault section: Tarbela-Burhan circuit No.1) was carried out in order to confirm if power supply to Burhan by the remaining sound circuit is possible from the viewpoint of the transmission capacity. The power flow of the Tarbela-Burhan circuit No.2, the remaining sound circuit, was 699MW (732.2MVA), which was 108.6% of the transmission capacity of twin-bundled Rail conductor (674MVA). The value is within the allowable limit of overload (120%) under N-1 contingency condition.
Short-circuit Fault Current Analysis The three-phase short-circuit fault current was calculated for the substation buses of Islamabad-Burhan region and its peripheral system for the year 2018 and 2020. In 2018, the maximum value of the three-phase short-circuit fault current was below 40kA. In 2020, the three-phase short-circuit fault current value at 220kV Tarbela substation bus and 220kV Islamabad West substation exceeded 40kA, the breaking capacity of the commonly used circuit breakers in the NTDCL system. From the result, it is recommended that the circuit breakers with the breaking capacity of 50kA be adopted for the planned Islamabad West substation.
Transient Stability Analysis Transient stability analysis was carried out for the year 2018 and 2020. In 2018, the results show that the NTDCL power system in Islamabad and Burhan area and surrounding northern system remains stable in the case of single line fault of the project target transmission lines for both normal clearing and stuck breaker conditions. For the 2020 summer peak and winter off-peak load condition, transient stability analysis cannot be performed at this time since the dynamic data NTDCL provided is incomplete (missing generator model at several dozen units); however, considering that the power flow of the relevant sections of the transmission lines in 2020 is greatly reduced than that under 2018 summer peak condition after Islamabad West substation start operation, stability is expected to be maintained in the case of N-1 contingency of the sections in question.
Summary-16
Outline of Existing Transmission Line Reinforcement Plan Transmission Line
Existing Condition Survey for Existing Transmission Line Transmission Line Route
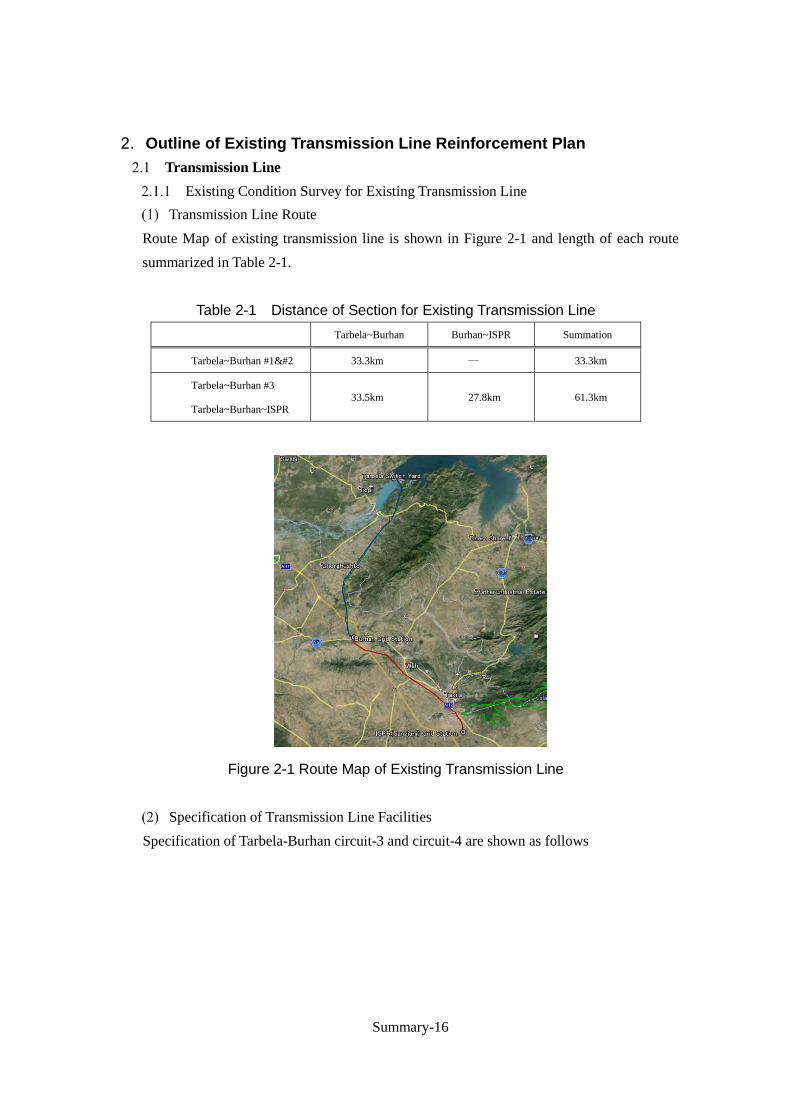
Route Map of existing transmission line is shown in Figure 2-1 and length of each route summarized in Table 2-1.
Table 2-1 Distance of Section for Existing Transmission Line
Tarbela~Burhan Burhan~ISPR Summation
Tarbela~Burhan #1 33.3km ― 33.3km
Tarbela~Burhan #3
Tarbela~Burhan~ISPR 33.5km 27.8km 61.3km
Figure 2-1 Route Map of Existing Transmission Line
Specification of Transmission Line Facilities Specification of Tarbela-Burhan circuit-3 and circuit-4 are shown as follows

Summary-17
Table 2-2 Specification of Existing Tarbela-Burhan-ISPR Transmission Line
Consideration of Present State of Existing Transmission Facilities Existing towers had constructed 40 years ago, however corrosion of steel member are slightly and there are no steel section loss. Therefore tower has sustained enough strength of construction at that time. However, there are no remaining design documents and drawings. So that, design condition of existing transmission line has assumed as single conductor. Therefore, twin-bundle LL-ACSR using for existing tower, it shall be construct new tower between existing towers to reduce loading span, correspondent to increment of self-weight and tensile force. Moreover, it shall be compensation for additional towers. For reuse existing towers, new tower shall be constructed same number of towers and increase inspection work for maintenance. So that, existing towers shall be dismantle and reconstruction towers correspondent for twin-bundle conductor.
Selection of Relevant Proposal One of the 2 circuit between Tarbela power houses to ISPR Grid Station, the circuit in/out Burhan Grid Station. Existing transmission line using conventional Rail conductor as single for both circuit. On the PC-1, transmission line is planned as twin-bundle conductor as for
Section Tarbela - Burhan - ISPR(Sangjani)Name of Line 220kV Tabela - Burhan - ISPR Circuit-III & IV
(Express Circuit, Route-II)Completion Tarbela - Burhan T/Line Circuit-III
Burhan - ISPR(Sangjani) T/LineTarbela - ISPR(Sangjani) Express T/Line
Length of T/L Tarbela - Burhan T/Line Circuit-III kmBurhan - ISPR(Sangjani) T/Line kmTarbela - ISPR(Sangjani) Express T/Line km
Nos of Tower Tabela - Burhan T/Line Circuit-III( Nos/km)
Burhan - ISPR(Sangjani) T/Line( Nos/km)
Tarbela - ISPR(Sangjani) Express T/Line( Nos/km)
Number of CircuitConductor
BundleASTM CodeOverall Diameter mm Strand Steel x ( mm2 )
Alminium x ( mm2 )Total ( mm2 )
Stringing condition kNKind of Ground Wire Gulbanaized Steel Wire(Optical fiber installed/OPGW)Kind of Insulator Porcelain, made by EMKO, 80kN
Arcing Horn Gap length Arcing horn are not installed on this transmission line.
2.60
3.06
2.80
19.58
singleRail
33.5445 3.70
2
17.12.199817.12.1998
175
35.40
2.457
83
92
27.1062.50
09.06.1977
TypeNos 14
483.8517.3
29.1

Summary-18
extension project of Tarbela power house. In this project, relevant proposal shall be select from alternative proposal. 1) Replace single Rail to twin-bundle Rail 2) Replace singe Rail to single HTLS (High Temperature Low Sag) conductor 3) Replace single Rail to twin bundle LL-ACSR (Low Loss Conductor) Relevant proposal shall be taken into account for load flow analysis and evaluation of transmission loss. Therefore replacement of existing transmission line with low loss conductor has selected from alternative proposal. In the case of using twin-bundle Rail conductor or twin-bundle LL-ACSR, loadings acting on the existing tower is greater than loadings of current condition. So that, the plan of PC-1 which planned to construct in each middle of existing tower span. Therefore, existing towers has available to reuse. However, existing towers should be reconstruct as the case may be construction of new tower is not available between existing towers. Therefore all towers should be replace in the view of the circumstances in maintenance work. On this project, Low Loss conductor would be installed to Tarbela-Burhan Circuit3(③ in Figure 2-2) and Tarbela-Burhan section of Tarbela-Burhan-ISPR (62.5km). Furthermore Transmission line of Tarbela-Burhan section of Tarbela-Burhan-ISPR (35.1km, ④ in Figure 2-2) should be installed as Low Loss Conductor to reduce power transmission loss. Burhan-ISPR section of Tarbela-Burhan-ISPR is used for existing single Rail conductor. Outline figure of the scope of this project shown as following.
Rail (twin-bundle)
LL-ACSR(twin-bundle)
Existing Rail (Single)
LL-ACSR(twin-bundle)

Summary-19
Figure 2-2 Outline of Project Scope for Reinforcement of Existing Transmission Line
Schematic Design Conductor and Ground Wire Design
LL-ACSR designed equivalent to current capacity of twin-bundle Rail conductor planned in PC-1 and same diameter of Rail conductor (Wind pressure equivalent to Rail). Comparison of characteristics of Rail and LL-ACSR are shown in following table.
Table 2-3 Characteristics of Conductor
Route Circuit/Section Existing Reinforcement Remarks
Tarbela P/H
-Burhan G/S
① Circuit-Ⅰ Single Rail Twin-bundle Rail NTDC own resource
② Circuit-Ⅱ Single Rail Twin-bundle Rail NTDC own resource
③ Circuit-Ⅲ Single Rail Twin-bundle LL-ACSR JICA Fund
Tarbela P/H
-ISPR G/S
④ Tarbela P/H-Burhan G/S Single Rail Twin-bundle LL-ACSR JICA Fund
⑤ Burhan G/S-ISPR G/S Single Rail ---
Burhan G/S
-ISPR G/S
⑥ Burhan G/S -ISPR G/S Single Rail ---
Items Unit ACSR LL-ACSR
ASTM:Rail LL-ACSR/AS610
Figure
construction 45/3.7-Al
7/2.47-St
16/TW-AL
11/TW-AL
8/TWAl
7/2.1-14EAS
Nominal Diameter mm 29.61 29.59
Min. Breaking Load kN 116.1 126.5
Cross section area:Al mm2 483.8 610.7
Core 33.54 24.25
Total 517.3 635.0
Nominal weight kg/km 1600 1867

Summary-20
OPGW had introduced to recent transmission line. The scope of work of this project, ground wire is planned to adopt as OPGW. Therefore, OPGW has adopted to all section of this project. Size of ground wire shall be adopted as OP-AC97sq corresponding to Rail 480sq.
Insulator Design Arcing hone shall be adopted to avoid corruption of insulator due to lightning strike. Target area placed inland. So that, it has not expected salt pollution. Therefore fouling design of insulator shall be corresponding to dust fouling design. Salt deposit density has specified as 0.12mg/cm2 in Grid Code.
Table 2-4 Specifications of Insulator
Type/Shape Strength Nos
(nos)
Length
(mm)
Remarks
Single Strings for
Suspension
Porcelein, Normal 120kN 14 2,922
Twin-bundle
Conductor
Double Strings for
Suspension/Tension
Porcelein, Anti-fog 120kN
120kN,double
14 2,922 Twin-bundle
conductor
Shape of Tower and Tower Design
Towers shall be adopted standard EA-Type suspension tower, EG-Type angle tower and JKD-Type tension tower for using existing Mansehra-ISPR transmission line. Existing Mansehra-ISPR transmission line had designed as twin-bundle Rail. These standard towers are applicable to reinforcement of existing transmission line for this project. In the case of apply the LL-ACSR610 which is equivalent outer diameter of Rail conductor, horizontal load (wind load) is equal. Because of a vertical load will be increased by the different of unit weight (1.867-1.600=0.267kg/m), foundation compression load also will be increased and uplift load will be decreased. These loads is estimated about 320kg/foot for
DC Resistance at 20deg-C Ohm/km 0.0597 0.0471
Co-efficient of linear
expansion
/deg-C 20.9x10⁻⁶ 21.9x10⁻⁶
Current capacity A 956
at 90 deg-C
1207
at 90 deg-c
Sag (at 350m) m 14.4
at 90 deg-C
15.2
at 90 deg-C

Summary-21
400m loading span. The reason of about 1 % different of foundation load, LL-ACSR610 shall be able to apply to the new construction line. On the other hand, the sag of LL-ACSR610 will be increased under the same tension stringing condition as Rail conductor because of increased unit weight. So, it is necessary to addition the tower height for keep the distance from a ground. The additional height of tower will be about 2m average in the case of 400m span.
Foundation Design Basically, normal foundation (inverted T shape foundation) shall be applied towers placed in plain field as existing transmission line and pile foundation shall be applied to sandy ground affected erosion due to stream flow and nearby sand pit. Type of foundation shall be studied at detailed design stage.
Transmission Line Route RoW should not be changed from existing transmission line. Existing towers must be dismantle and reconstruct to new towers on same place corresponding to twin-bundle conductor. Clearance of conductor shall be secure 8m specified in design condition. Moreover transmission line route shall be same as existing transmission line.
Application of New Technology Use of Low Loss Conductor (LL-ACSR)
In the case of introduction of low loss conductor, wind load and tensile force of conductor shall be not exceed design load corresponding to tower design for twin-bundle Rail. Therefore, low loss conductor shall be equivalent outer diameter and current capacity to conventional ACSR Rail conductor. Standard design of towers corresponding to twin-bundle ACSR Rail conductor is applicable to twin-bundle low loss conductor. Furthermore, transmission loss will be reduced after the start of operation when design condition has secured as mentioned above. So that the benefit can be surely obtained.
Substation Current Status of Existing Substations
The Substations addressed to modification of this Transmission System Network Reinforcement Project are as following three (3) Substations; 〇 Burhan Substation 〇 ISPR Substation
Summary-22
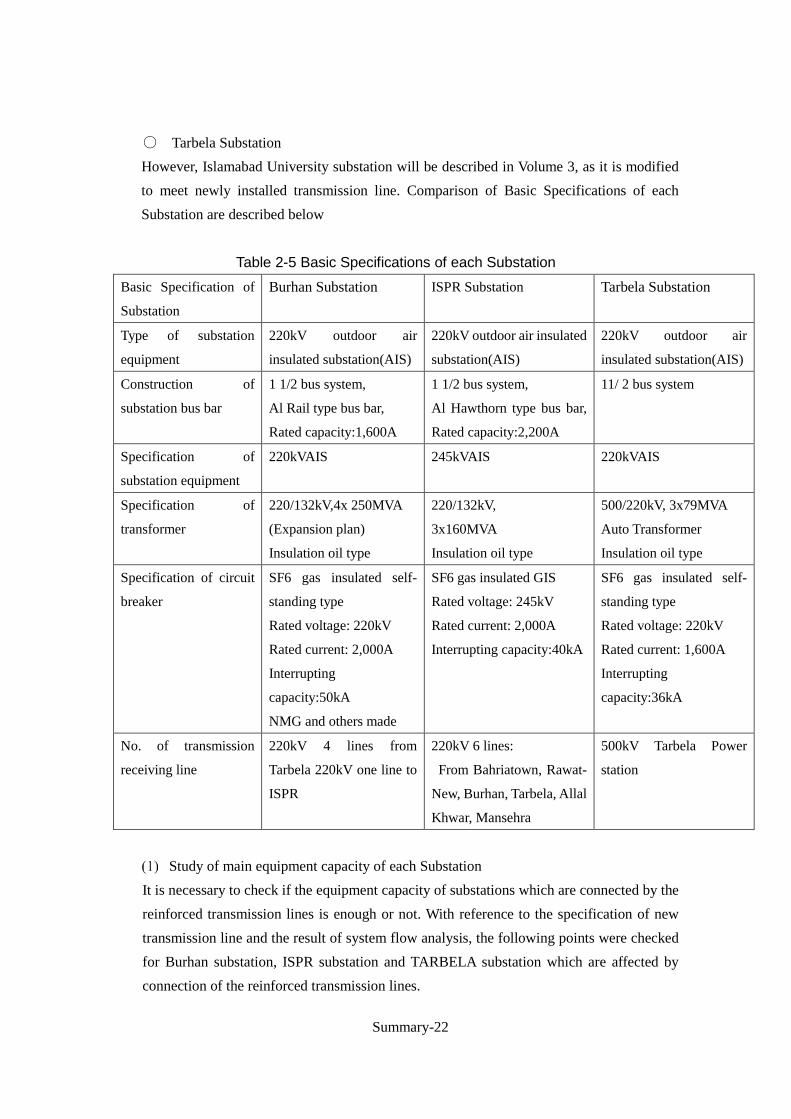
〇 Tarbela Substation However, Islamabad University substation will be described in Volume 3, as it is modified to meet newly installed transmission line. Comparison of Basic Specifications of each Substation are described below
Table 2-5 Basic Specifications of each Substation Basic Specification of
Substation
Burhan Substation ISPR Substation Tarbela Substation
Type of substation
equipment
220kV outdoor air
insulated substation(AIS)
220kV outdoor air insulated
substation(AIS)
220kV outdoor air
insulated substation(AIS)
Construction of
substation bus bar
1 1/2 bus system,
Al Rail type bus bar,
Rated capacity:1,600A
1 1/2 bus system,
Al Hawthorn type bus bar,
Rated capacity:2,200A
11/ 2 bus system
Specification of
substation equipment
220kVAIS 245kVAIS 220kVAIS
Specification of
transformer
220/132kV,4x 250MVA
(Expansion plan)
Insulation oil type
220/132kV,
3x160MVA
Insulation oil type
500/220kV, 3x79MVA
Auto Transformer
Insulation oil type
Specification of circuit
breaker
SF6 gas insulated self-
standing type
Rated voltage: 220kV
Rated current: 2,000A
Interrupting
capacity:50kA
NMG and others made
SF6 gas insulated GIS
Rated voltage: 245kV
Rated current: 2,000A
Interrupting capacity:40kA
SF6 gas insulated self-
standing type
Rated voltage: 220kV
Rated current: 1,600A
Interrupting
capacity:36kA
No. of transmission
receiving line
220kV 4 lines from
Tarbela 220kV one line to
ISPR
220kV 6 lines:
From Bahriatown, Rawat-
New, Burhan, Tarbela, Allal
Khwar, Mansehra
500kV Tarbela Power
station
Study of main equipment capacity of each Substation
It is necessary to check if the equipment capacity of substations which are connected by the reinforced transmission lines is enough or not. With reference to the specification of new transmission line and the result of system flow analysis, the following points were checked for Burhan substation, ISPR substation and TARBELA substation which are affected by connection of the reinforced transmission lines.
Summary-23
・ Check point 1: Rated current and the short time overload current of transformer and circuit breaker which is affected by the short circuit fault in other lines.
・ Check point 2: Interrupting capacity of circuit breaker at time of short circuit fault, ・ Check point 3: Mechanical strength of bus bar and support insulator against flowing short
circuit current.
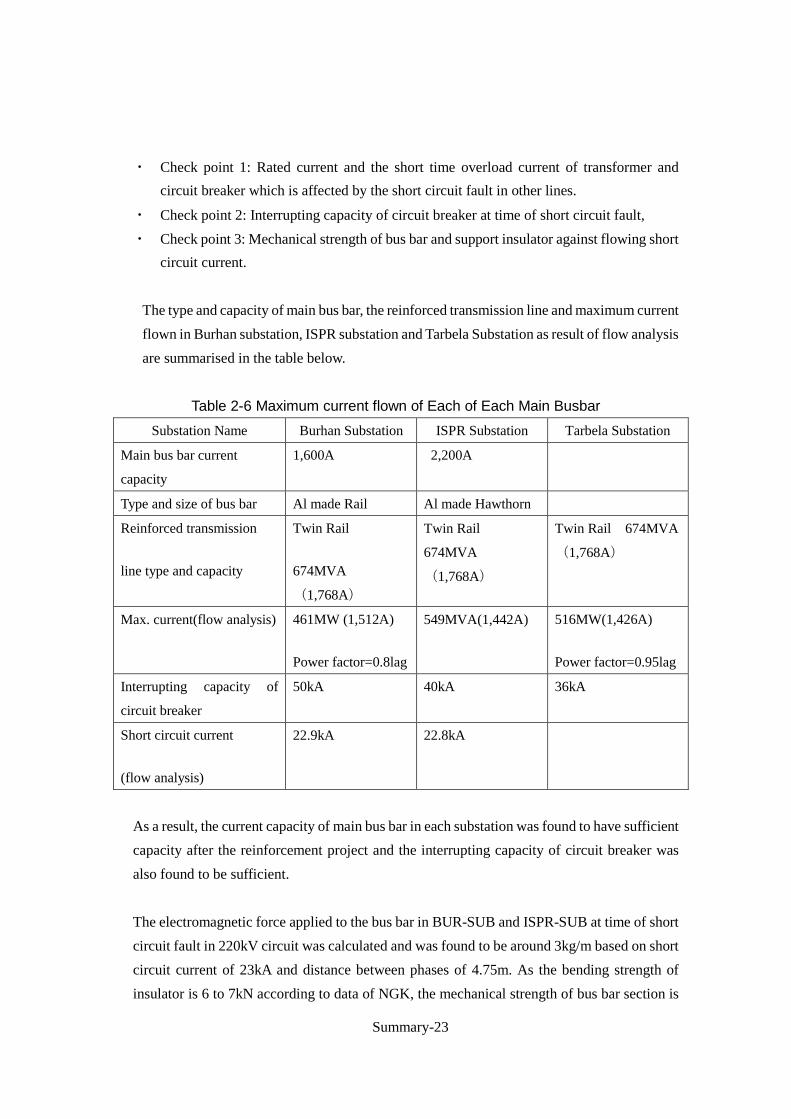
The type and capacity of main bus bar, the reinforced transmission line and maximum current flown in Burhan substation, ISPR substation and Tarbela Substation as result of flow analysis are summarised in the table below.
Table 2-6 Maximum current flown of Each of Each Main Busbar
Substation Name Burhan Substation ISPR Substation Tarbela Substation
Main bus bar current
capacity
1,600A 2,200A
Type and size of bus bar Al made Rail Al made Hawthorn
Reinforced transmission
line type and capacity
Twin Rail
674MVA
(1,768A)
Twin Rail
674MVA
(1,768A)
Twin Rail 674MVA
(1,768A)
Max. current(flow analysis) 461MW (1,512A)
Power factor=0.8lag
549MVA(1,442A) 516MW(1,426A)
Power factor=0.95lag
Interrupting capacity of
circuit breaker
50kA 40kA 36kA
Short circuit current
(flow analysis)
22.9kA 22.8kA
As a result, the current capacity of main bus bar in each substation was found to have sufficient capacity after the reinforcement project and the interrupting capacity of circuit breaker was also found to be sufficient. The electromagnetic force applied to the bus bar in BUR-SUB and ISPR-SUB at time of short circuit fault in 220kV circuit was calculated and was found to be around 3kg/m based on short circuit current of 23kA and distance between phases of 4.75m. As the bending strength of insulator is 6 to 7kN according to data of NGK, the mechanical strength of bus bar section is

Summary-24
regarded as sufficient. Burhan substation
220kV power is supplied through three circuits TARBELA-Burhan transmission line. Another circuit from TARBELA is also received and transmitted to ISPR grid substation. 220kV switchgear is 1 1/2 bus bar system installed on outdoor steel structure. 220kV circuit breaker is SF6 gas insulated type for newly installed ones and minimum oil insulated type made mainly in Europe (manufacturer NMG, S&S, BBC, AREVA etc.)For older ones and some transducers are made by Japanese company (Nissin). Four 220/132kV transformers are installed (one 250MVA, three 160MVA). After expansion 160MVA transformers are planned to be replaced with 250MVA transformers). This substation was constructed in 1975. The control and monitoring equipment of substation is conventional type and data logger is not used.
ISPR Substation This Substation is located at around 20km in the west of Islamabad and distributes power to the areas west side of Islamabad. This substation receives 220kV power through five transmission lines from Tarbela, Rawat-New, Bahia Town, Allal Khwar and Mansehra (in future). There are three 220/132kV transformers (each 160MVA) and there is 132kV outdoor switchyard for power distribution. There are also three 132/11kV transformers for distribution to neighboring area and station service. All 220kV circuit breakers are SF6 gas insulated and supplied by European manufacturers (NMG, Alstom, MG, AEG, and ABB etc.). The conductors of 220kV bus bar are Aluminum Hawthorn twin conductor type and the rated current is 2,200A. As the result of flow analysis, and capacity of bus bar including feeder circuits was found enough.
Tarbela Substation Tarbela hydro power station has generating capacity of 3,478MW (10x175MW, 4x432MW). The maximum load recorded in July 2013 was 3,606MW. This power station has the forth expansion plan of 1,410MW (May, 2017COD) and the fifth expansion plan of 1,300MW. The substation is outdoor steel structured type for 500kV and 220kV with 1 1/2busbar system. Four 220kV transmission lines for supply to Burhan Substation and ISPR Substation are fed from 220kV circuit breaker. This reinforcement project will change the conductors of transmission lines, therefore changing work shall be executed solving technical problems at point of connecting new transmission conductors. As a result of flow analysis by JICA survey team, maximum power 516MW(1,469A at

Summary-25
cosφ=0.922(lag),1,426A at cosφ=0.95(lag)) which is within the capacity of bus bar flows in one line of tree lines from Tarbela to Burhan in summer peak of 2018. But, the short circuit current in 2020 is 43.2kA, therefore the existing interrupting capacity 36kA is not enough, which is required to be replaced with 50kA level circuit breaker in 2020.
Construction Method Problems of Current Construction Method
Existing towers should be dismantle and reconstruct new towers corresponding to twin-bundle conductor. In the case of termination of construction work during summer peak (June to September), duration of construction must be needed several years. Therefore, availability of power transmission under N-1 contingency during construction of Tarbela-Burhan Circuit 3 and Tarbela-Burhan section of Tarbela-Burhan-ISPR express line confirmed as after completion of double circuit which funded NTDC own resource by Load Flow Analysis.
Study of Construction Method Existing transmission line of target area of this project replace single Rail to twin-bundle LL-ACSR. Therefore, existing towers should be dismantle and reconstruct corresponding to twin-bundle conductor.
Duration of System Shutdown Tarbela-Burhan corcuit3 and Tarbela-Burhan-ISPR shall be shutdown throughout dismantlement of existing conductor to completion of installation of LL-ACSR.
Foundation Works Existing foundation shall be demolished. Then new foundation shall be constructed corresponding to twin-bundle conductor.
Tower Erection Tower shall be construct by standard method.
Installation of Conductor Installation work shall be execute after finish temporary protection work to avoid third party damage for the area where buildings exist under transmission line.
Implementation Schedule (Confidential)
Cost Estimation of Existing Transmission Line Reinforcement (Confidential)
Summary-26
Financial and Economic Analysis and Business Evaluation Financial and Economic Analysis
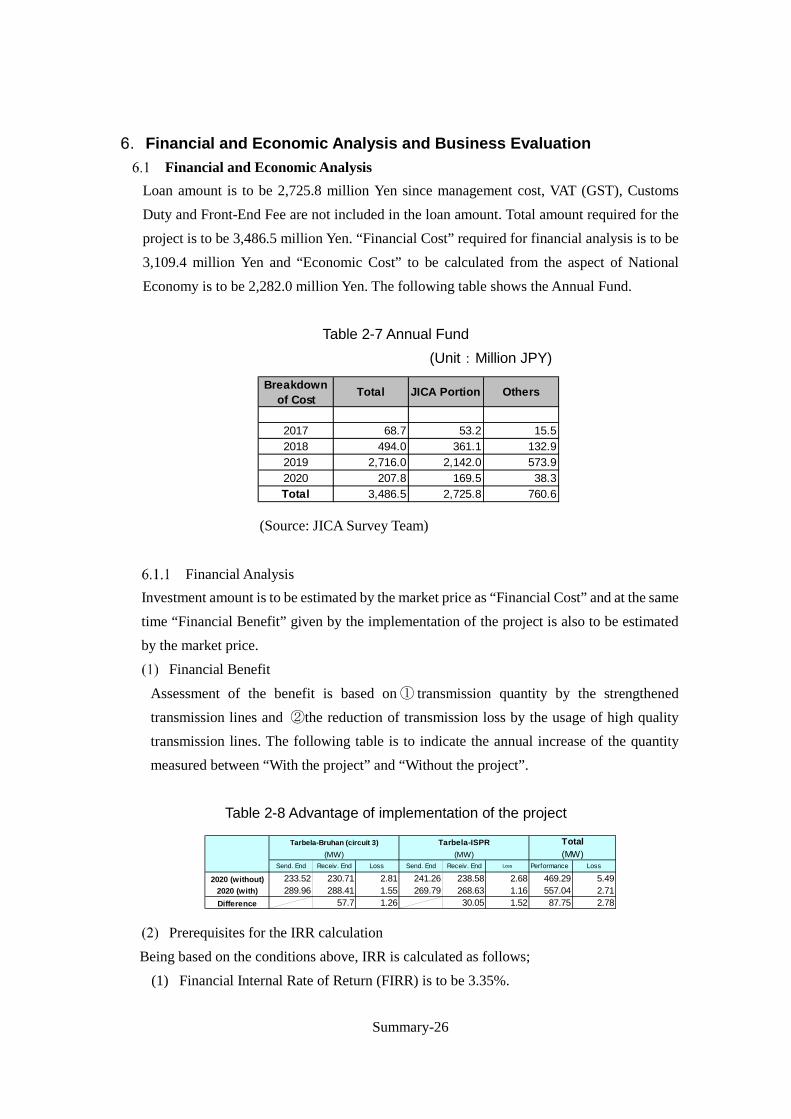
Loan amount is to be 2,725.8 million Yen since management cost, VAT (GST), Customs Duty and Front-End Fee are not included in the loan amount. Total amount required for the project is to be 3,486.5 million Yen. “Financial Cost” required for financial analysis is to be 3,109.4 million Yen and “Economic Cost” to be calculated from the aspect of National Economy is to be 2,282.0 million Yen. The following table shows the Annual Fund.
Table 2-7 Annual Fund
(Unit:Million JPY)
(Source: JICA Survey Team)
Financial Analysis Investment amount is to be estimated by the market price as “Financial Cost” and at the same time “Financial Benefit” given by the implementation of the project is also to be estimated by the market price.
Financial Benefit Assessment of the benefit is based on ① transmission quantity by the strengthened transmission lines and ②the reduction of transmission loss by the usage of high quality transmission lines. The following table is to indicate the annual increase of the quantity measured between “With the project” and “Without the project”.
Table 2-8 Advantage of implementation of the project
Prerequisites for the IRR calculation Being based on the conditions above, IRR is calculated as follows;
(1) Financial Internal Rate of Return (FIRR) is to be 3.35%.
Breakdownof Cost Total JICA Portion Others
2017 68.7 53.2 15.52018 494.0 361.1 132.92019 2,716.0 2,142.0 573.92020 207.8 169.5 38.3Total 3,486.5 2,725.8 760.6
Send. End Receiv. End Loss Send. End Receiv. End Loss Performance Loss
2020 (without) 233.52 230.71 2.81 241.26 238.58 2.68 469.29 5.492020 (with) 289.96 288.41 1.55 269.79 268.63 1.16 557.04 2.71Difference 57.7 1.26 30.05 1.52 87.75 2.78
(MW) (MW)Tarbela-Bruhan (circuit 3) Tarbela-ISPR Total
(MW)
Summary-27
(2) B/C ratio is to be 0.72 (discounted rate of 10%) and 0.65 (discounted rate of 12%). (3) Annual benefit of 72.8 million Yen gives the breakeven period of 42.7 years for the
investment cost of 3,109.4 million.
Economic Analysis "Economic cost" is 2,282.1 million Yen as described earlier.
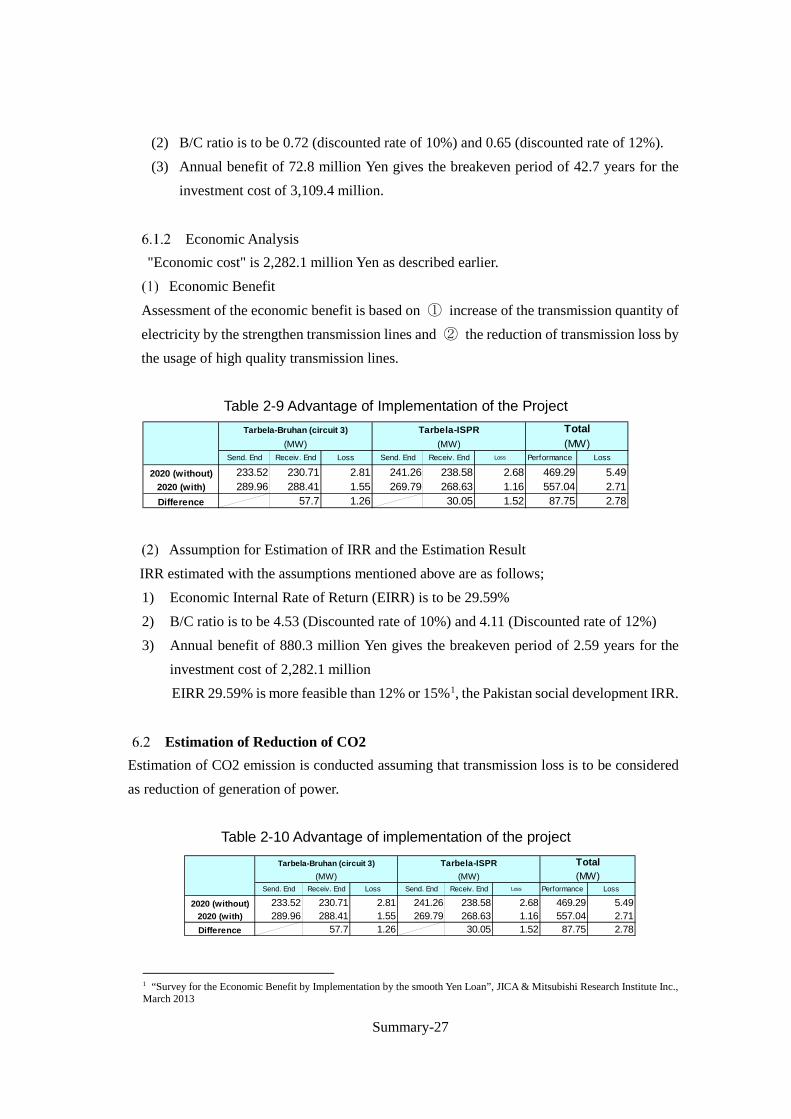
Economic Benefit Assessment of the economic benefit is based on ① increase of the transmission quantity of electricity by the strengthen transmission lines and ② the reduction of transmission loss by the usage of high quality transmission lines.
Table 2-9 Advantage of Implementation of the Project
Assumption for Estimation of IRR and the Estimation Result
IRR estimated with the assumptions mentioned above are as follows; 1) Economic Internal Rate of Return (EIRR) is to be 29.59% 2) B/C ratio is to be 4.53 (Discounted rate of 10%) and 4.11 (Discounted rate of 12%) 3) Annual benefit of 880.3 million Yen gives the breakeven period of 2.59 years for the
investment cost of 2,282.1 million EIRR 29.59% is more feasible than 12% or 15%1, the Pakistan social development IRR.
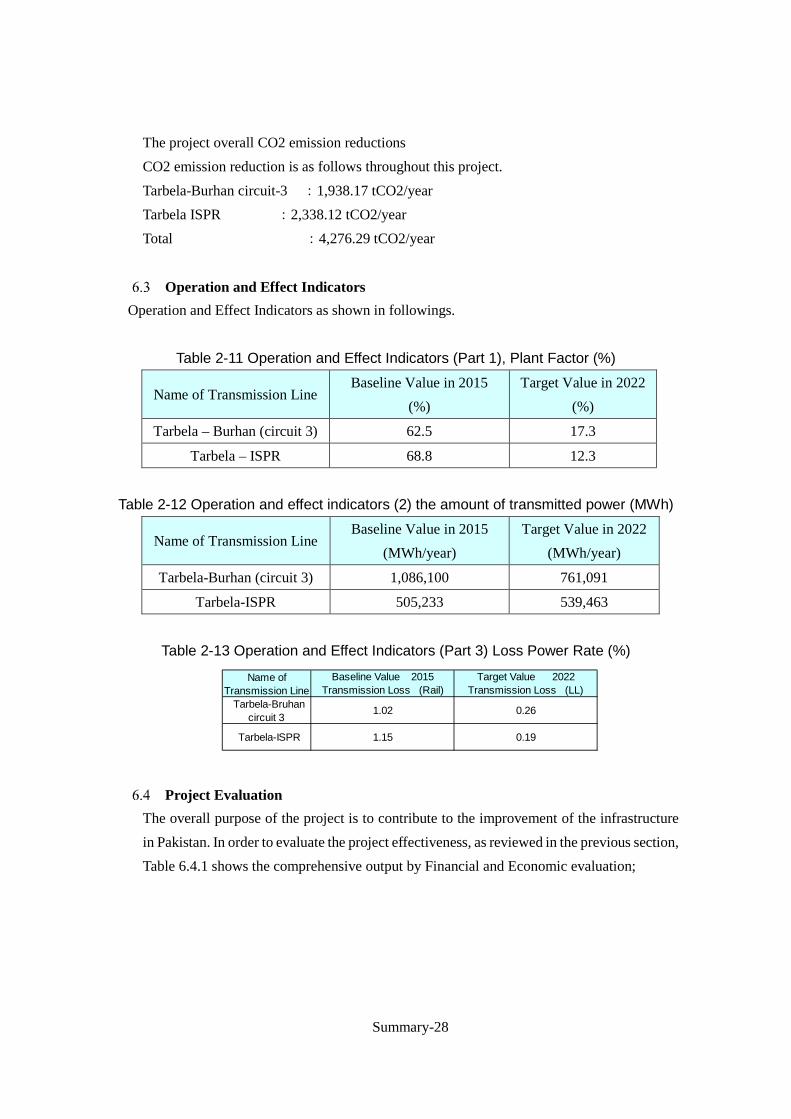
Estimation of Reduction of CO2 Estimation of CO2 emission is conducted assuming that transmission loss is to be considered as reduction of generation of power.
Table 2-10 Advantage of implementation of the project
1 “Survey for the Economic Benefit by Implementation by the smooth Yen Loan”, JICA & Mitsubishi Research Institute Inc., March 2013
Send. End Receiv. End Loss Send. End Receiv. End Loss Performance Loss
2020 (without) 233.52 230.71 2.81 241.26 238.58 2.68 469.29 5.492020 (with) 289.96 288.41 1.55 269.79 268.63 1.16 557.04 2.71Difference 57.7 1.26 30.05 1.52 87.75 2.78
(MW) (MW)Tarbela-Bruhan (circuit 3) Tarbela-ISPR Total
(MW)
Send. End Receiv. End Loss Send. End Receiv. End Loss Performance Loss
2020 (without) 233.52 230.71 2.81 241.26 238.58 2.68 469.29 5.492020 (with) 289.96 288.41 1.55 269.79 268.63 1.16 557.04 2.71Difference 57.7 1.26 30.05 1.52 87.75 2.78
(MW) (MW)Tarbela-Bruhan (circuit 3) Tarbela-ISPR Total
(MW)
Summary-28
The project overall CO2 emission reductions CO2 emission reduction is as follows throughout this project. Tarbela-Burhan circuit-3 :1,938.17 tCO2/year Tarbela ISPR :2,338.12 tCO2/year Total :4,276.29 tCO2/year
Operation and Effect Indicators Operation and Effect Indicators as shown in followings.
Table 2-11 Operation and Effect Indicators (Part 1), Plant Factor (%)
Name of Transmission Line Baseline Value in 2015
(%) Target Value in 2022
(%)
Tarbela – Burhan (circuit 3) 62.5 17.3
Tarbela – ISPR 68.8 12.3
Table 2-12 Operation and effect indicators (2) the amount of transmitted power (MWh)
Name of Transmission Line Baseline Value in 2015
(MWh/year) Target Value in 2022
(MWh/year)
Tarbela-Burhan (circuit 3) 1,086,100 761,091
Tarbela-ISPR 505,233 539,463
Table 2-13 Operation and Effect Indicators (Part 3) Loss Power Rate (%)
Project Evaluation The overall purpose of the project is to contribute to the improvement of the infrastructure in Pakistan. In order to evaluate the project effectiveness, as reviewed in the previous section, Table 6.4.1 shows the comprehensive output by Financial and Economic evaluation;
Tarbela-Bruhancircuit 3 1.02 0.26
Tarbela-ISPR 1.15 0.19
Name ofTransmission Line
Baseline Value 2015 Target Value 2022Transmission Loss (Rail) Transmission Loss (LL)
Summary-29
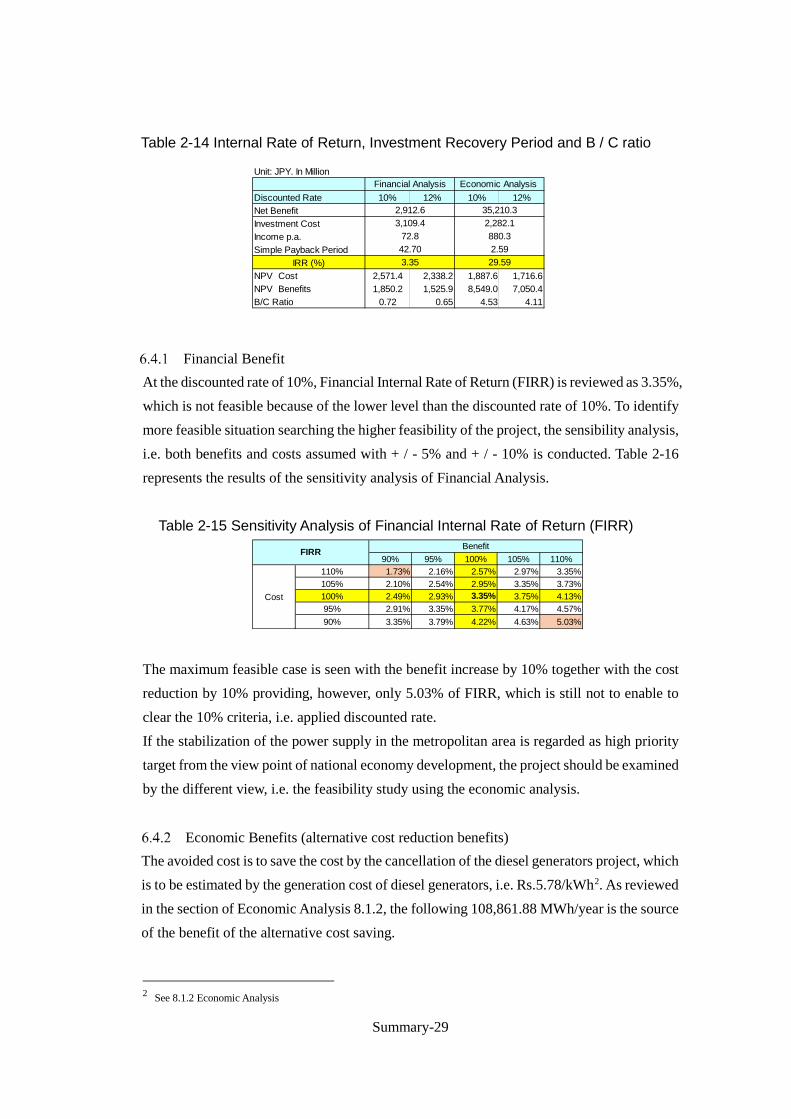
Table 2-14 Internal Rate of Return, Investment Recovery Period and B / C ratio
Financial Benefit At the discounted rate of 10%, Financial Internal Rate of Return (FIRR) is reviewed as 3.35%, which is not feasible because of the lower level than the discounted rate of 10%. To identify more feasible situation searching the higher feasibility of the project, the sensibility analysis, i.e. both benefits and costs assumed with + / - 5% and + / - 10% is conducted. Table 2-16 represents the results of the sensitivity analysis of Financial Analysis.
Table 2-15 Sensitivity Analysis of Financial Internal Rate of Return (FIRR)
The maximum feasible case is seen with the benefit increase by 10% together with the cost reduction by 10% providing, however, only 5.03% of FIRR, which is still not to enable to clear the 10% criteria, i.e. applied discounted rate. If the stabilization of the power supply in the metropolitan area is regarded as high priority target from the view point of national economy development, the project should be examined by the different view, i.e. the feasibility study using the economic analysis.
Economic Benefits (alternative cost reduction benefits) The avoided cost is to save the cost by the cancellation of the diesel generators project, which is to be estimated by the generation cost of diesel generators, i.e. Rs.5.78/kWh2. As reviewed in the section of Economic Analysis 8.1.2, the following 108,861.88 MWh/year is the source of the benefit of the alternative cost saving.
2 See 8.1.2 Economic Analysis
Unit: JPY. In Million
Discounted Rate 10% 12% 10% 12%Net BenefitInvestment CostIncome p.a.Simple Payback Period
IRR (%)NPV Cost 2,571.4 2,338.2 1,887.6 1,716.6NPV Benefits 1,850.2 1,525.9 8,549.0 7,050.4B/C Ratio 0.72 0.65 4.53 4.11
Financial Analysis Economic Analysis
2,912.6 35,210.33,109.4 2,282.1
72.8 880.342.70 2.593.35 29.59
90% 95% 100% 105% 110%110% 1.73% 2.16% 2.57% 2.97% 3.35%105% 2.10% 2.54% 2.95% 3.35% 3.73%100% 2.49% 2.93% 3.35% 3.75% 4.13%95% 2.91% 3.35% 3.77% 4.17% 4.57%90% 3.35% 3.79% 4.22% 4.63% 5.03%
FIRR Benefit
Cost

Summary-30
Benefit by the alternative cost saving = 108,861.88 MWh/year × Rs5.78 / kWh = Rs.629.2 million = 635.5 million Yen
As seen in the previous section in Economic Analysis, Internal Rate of Return (EIRR) of 29.59% is much better than the social discount rate of Pakistan, the 12% or 15%. Table 2-17 shows the results of the sensitivity analysis by the Economic Analysis.
Table 2-16 Sensitivity Analysis of Economic Internal Rate of Return (EIRR)
Environmental and Social Consideration Scope of the Project
The scope of the project has been changed from PC-1 through the study of conditions. The reinforcement between Burhan and Islamabad was considered unnecessary, and the reinforcement of circuit 1 and circuit 2 between Tarbela Burhan was excluded from the JICA assistance.
Evaluation of alternatives The following alternatives have been considered.
1) Zero option:No any change 2) Replacing to increased capacity conductor 3) Change from single conductor to double conductors 4) Replacing to low loss conductors 5) Reinforcement of towers in case of double conductors use (reconstruction or increase of
number of towers)
The use of low loss conductor was selected as the best among alternatives with the consideration of cost, environment and social impact. It results in the increase of weight of conductor and reinforcement of the towers to bear the weight. The procedure of reinforcement of tower was compared for two methods, i.e., reconstruction of all towers and construction of new towers between existing towers. The reconstruction method was evaluated better because of easier maintenance and less environmental and social impact.
90% 95% 100% 105% 110%110% 24.72% 25.95% 27.17% 28.39% 29.59%105% 25.77% 27.06% 28.33% 29.59% 30.84%100% 26.93% 28.27% 29.59% 30.91% 32.21%95% 28.20% 29.59% 30.97% 32.35% 33.71%90% 25.59% 31.05% 32.57% 33.93% 35.36%
EIRR
Cost
Benefit

Summary-31
Result of Environmental and Social Survey The result of the survey and evaluation is shown in following table.
Items
Evaluation at
Scoping
Evaluation after
Survey
Reason Before and Under
Construction
Operation Before and Under
Construction
Operation
Operation
Pollution
1 Air
pollution
B- D D D Construction: Air pollution such as exhaust fumes from
earthmoving equipment as well as construction vehicles are
considered for construction phase, but additional pollution on
current condition is not significant.
2 Water
pollution
B- B- B- D Construction:Construction work is possible to create turbid
water but it occurs near the construction site of towers and the
impact is not significant. Turbid water from earth and rock
should be controlled.
3 Waste B- D B- D Construction:Construction waste, soil, litter of workers will
be generated. There is no special rule applicable for
construction waste. The project should create own rule with
the guidance from local authorities.
4 Soil
pollution
B- D B- D Construction:During the construction phase, soil pollution
by oil spill from construction vehicles or machinery may
occur.
5 Noise and
vibration
B- D B- D Construction:During the construction phase, noises and
vibration associated with construction anticipated.
Natural
6 Ecosystem B- D B- D Construction: There is no habitat of important species in most
of project area and its vicinity. The main land use is cultivated
area or shrubs, and it is the rehabilitation of existing T/L so
that the additional impact is not significant. But area of
Tarbela Dam vicinity is in forest area, this 3 km distance
should be taken care of deforestation and construction work.

Summary-32
Social
7 Resettleme
nt
B- B- D D This project is to reconstruct the towers and replace
conductors. It is not expected the construction of new towers.
NTDCL has no power to remove the resident under the
existing line, and the construction will be done with them as
it is. Therefore, any resettlement does not occur.
8 Poverty
group
C B+ B- D The compensation will be done fairly.
9 Land use
and
resources
B- D B- D Construction:Land for construction work and access road is
necessary. NTDCL should compensate the loss of crops for
temporal use.
10 Water use B- D B- D Construction: Impact on drinking water is not expected. It will be
compensated and measures will be taken in case.
11 Disturbance
to social
infrastructu
res and
B- B+ D B+ Construction: Traffic congestion is possible to occur during
construction stage but most project area is located in rural
area and the impact is limited.
12 Heritage C C D D There is no heritage near the project site.
13 Increase the
risk of
infectious
diseases
B- D B- D Construction:Construction period is short and the impact is
not significant.
14 working
conditions
B- D B- D Construction: Safety management will be undertaken as
usual practice.
Others
15 Accident B- B- B- B- Construction:Access road will be constructed and the chance
of traffic accident will increase for human, livestock and
wildlife. Some buildings exist under T/L and the safety
measures should be prepared and implemented.

Summary-33
Mitigation Measures The mitigation measures are considered with the result of survey and evaluation.
Items Environmental Management Plan
Implementation
party Responsible party Cost
Construction
1 Water Pollution Earth generated by the construction work is applied
cover to prevent the flow out. Temporally storage yard is
placed at location of least impact on water. When
construction site is close to the water source, a drainage
pit is installed, to prevent the discharge flow into the
stream directly. The turbid water is introduced to the
drainage pit and let the turbid material settle. The
supernatant water can discharge.
PIU NTDCL/ESIC 0
2 Waste Construction waste, soil, litter of workers will be
generated should be managed to follow the instruction
of local government, CDA and EPA. Temporal dumping
yard is prepared and the waste is transferred to official
dumping site. The recyclable material should be
separated and reused.
PIU NTDCL/ESIC 0
3 Soil Pollution There is a possibility of oil leakage by the vehicles so
that the storage is managed for leakage prevention.
PIU NTDCL/ESIC 0
4 Noise and
Vibration
Construction vehicles are registered and maintained.
Construction time is limited at the residential area and
noise will be monitored.
PIU NTDCL/ESIC 0
5 Ecosystem Tree cutting at the site will be least in the forest area
near Tarbela dam. Unnecessary uprooting is prohibited
and minimizes the deforestation area. The space
required for storage or other purpose will be placed
outside of the forest area. The use of cable way should
be considered for forest area. Reforestation will be done
near the site for compensation.
PIU NTDCL/ESIC 0.1 million
Rs
6 Poverty Resettlement does not occur. Every POPs should receive
a fair compensation on the basis of project policy.
PIU NTDCL/ESIC Included
in8

Summary-34
7 Land use and
resources
Land under T/L has owner. Any damage by the crops or
property should be compensated with replacement price
on the rule of entitle matrix.
PIU NTDCL/ESIC 1.2
million
Rs
8 Water use Impact on drinking water is not expected. It will be
compensated and measures will be taken in case.
PIU NTDCL/ESIC 0
9 Disturbance to
social
infrastructures
and services
Possibility of traffic conjunction is very little but detour
is installed at the village area and the advance notice is
necessary. Road, canal or any infrastructure should be
protected during construction.
PIU NTDCL/ESIC 0
10 Increase the
risk of
infectious
diseases
Contractor will provides educational program of
infectious disease prevention for construction workers
PIU NTDCL/ESIC 0
11 working
conditions
Occupational safety plan is prepared. Training for safety
is implemented for management of safety. Safety
equipment is supplied to construction worker. Restricted
area will be created for the safety.
PIU NTDCL 0
12 Accident Awareness-raising program for preventing accident is
given to workers. The safety management plan is
prepared and implemented with the consideration of the
livelihood and commercial activities under T/L.
PIU NTDCL 0
Operation
Accident Safety of working environment in the high-voltage
power lines and aerial work will be secured.
NTDCL NTDCL 0
Summary-35
The Plan for Installation of New Transmission Line
Objective of the Project and the Current Power Flow on the Target Grid System
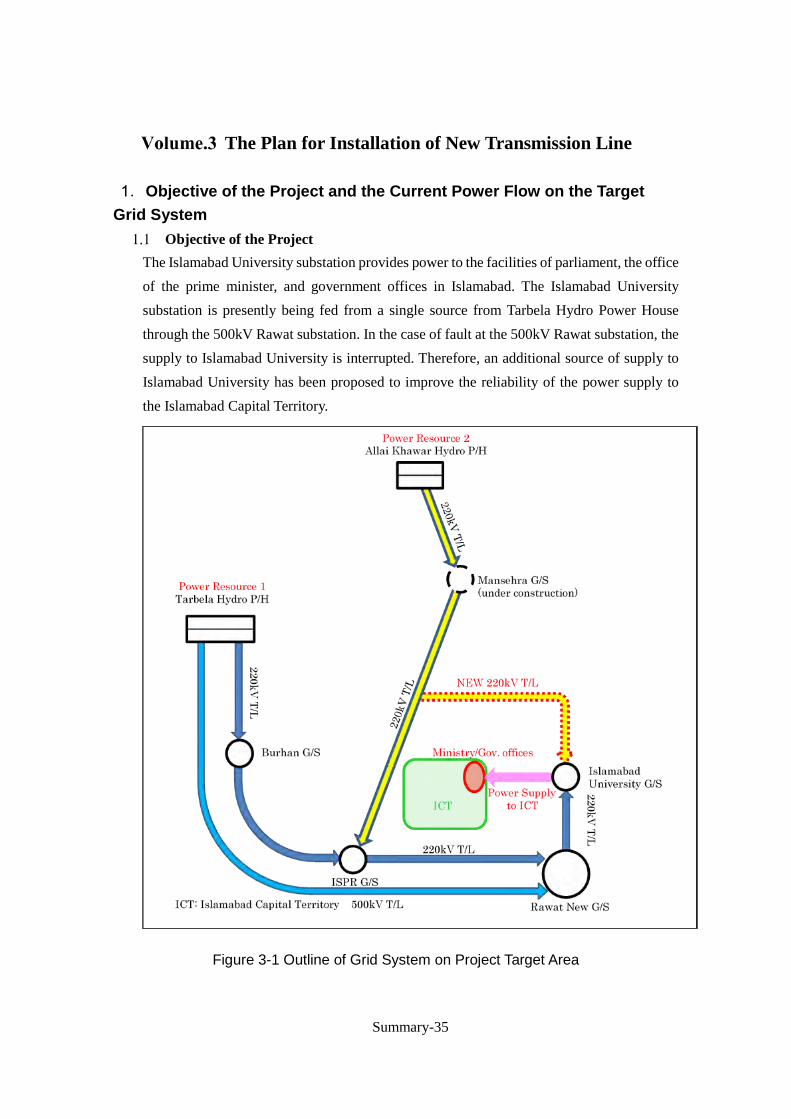
Objective of the Project The Islamabad University substation provides power to the facilities of parliament, the office of the prime minister, and government offices in Islamabad. The Islamabad University substation is presently being fed from a single source from Tarbela Hydro Power House through the 500kV Rawat substation. In the case of fault at the 500kV Rawat substation, the supply to Islamabad University is interrupted. Therefore, an additional source of supply to Islamabad University has been proposed to improve the reliability of the power supply to the Islamabad Capital Territory.
Figure 3-1 Outline of Grid System on Project Target Area

Summary-36
Islamabad University
ISPR
220kV
twin-bundled Rail (Existing), L=110km
(New Construction)twin-bundled LL-ACSR/AC 610, L=40km
Manshera twin-bundled Rail (Existing), L=82km
twin-bundled Rail (Existing), L=27km
132kV
132kV
132kV
220kV Transmission Line (Existing)
220kV Transmission Line (Plan)
220/132kV Transformer
Legend
Current Situation of Power Flow and Voltage of the Target System of the Project
Power System Analysis Study Phase
As the power flow and voltage analysis study years, 2018 (immediately after completion of the Tarbela hydropower station 4th extension project 3 (1,410MW)) and 2020 (expected completion year of the Tarbela hydropower station 5th extension project (1,410MW)) were selected. For 2018, the summer peak load condition was analyzed, and for 2020, both summer peak load and winter off-peak load conditions were analyzed.
Target System for the Analysis Power flow analysis for the new construction section (from the branch point to the Islamabad University substation at 220kV Mansehra-ISPR line to the Islamabad University substation) was carried out. The system configuration of the target system is shown in Figure 3-2.4 (Source: JICA Survey Team)
Figure 3-2 System configuration of the New Construction Section and Target of Power Flow Analysis
3 According to the information in the PC-1 prepared by NTDCL Planning Power in July 2014, the expected Tarbela 4th extension project completion year was 2017; however, based on the information obtained by the interview with the World Bank in December 2015, the expected commissioning year was 2018. Therefore, the updated information was taken into consideration. 4 LL-ACSR/AC (Low Electrical Power Loss Aluminum Conductor, Aluminum-Clad Steel) is a type of low loss conductor

Summary-37
Power Flow Analysis Power flow analysis for both “With Project” and “Without Project” cases for the year 2018 (summer peak load condition) was carried out. As the N-1 contingency condition, single circuit fault of the following sections was assumed.
Table 3-1 Fault Sections Assumed for N-1 Contingency Condition No. Fault Section
1 Mansehra – ISPR (“Without Project” case only)
2 Mansehra - Islamabad University
3 Islamabad University - ISPR
(Source: JICA Survey Team)
a) With Project Case [Power Flow Analysis Results (2018 Summer Peak Load Condition)] The analysis result and power flow diagram is shown in and Figure 3-3, respectively. As shown in the Table, no overload occurred to the relevant 220kV transmission lines and transformers of the 220kV system around the Islamabad University substation.
Table 3-2 Power Flow Analysis Results (2018 Summer Peak)
(Source: JICA Survey Team)
Mansehra - ISPR Mansehra - Islamabad University Islamabad University - ISPRNo overloading of transmissionlines or transformers
Same as on the left Same as on the left Same as on the left
Normal OperationN-1 Contingency

Summary-38
Figure 3-3 Power Flow Diagram (With Project: 2018 Summer Peak, Normal Operation) b) Without Project Case The loading of three (3) units of 220/132kV transformers at ISPR substation is 101.6% (487.6MVA) of the rated capacity of the transformers (160MVA x 3) even under normal operation conditions. No overload occurred to the 220kV transmission lines in the surrounding 220kV system under both normal operation conditions and the N-1 contingency condition (Mansehra-ISPR single circuit fault). The transformer colored orange indicates that the transformer is loaded over 100% of its rated capacity. NTDCL planned to secure a new 220 kV supply route to Islamabad University substation from the viewpoints of securing the flexibility of the power supply system composition to the Islamabad region with many important customers such as government organizations and the possibility of major change

Summary-39
of the power system planning due to review of future power development plan etc.
Figure 3-4 Power Flow Diagram (Without Project: Normal Operation Conditions) [Power Flow Analysis Results in 2020] Power flow analysis was carried out for both summer peak and winter off-peak conditions in 2020. The power flow analysis result for the system in 2020 for both summer peak and winter off-peak load conditions are summarized in Figure 3-4. As shown in Table 3-3, no overload occurred to the relevant transmission lines and transformers under normal operation and N-1 contingency conditions for both summer peak load and winter off-peak load conditions in 2020.
Table 3-3 Power Flow Analysis Results (2020 Summer Peak and Winter Off-peak Load Conditions)
Mansehra-Islamabad West Mansehra-Islamabad UniversityIslamabad University-
Islamabad West
Summer PeakNo overloading of
transmission lines ortransformers
Same as on the left Same as on the left Same as on the left
Winter Off-peakNo overloading of
transmission lines ortransformers
Same as on the left Same as on the left Same as on the left
Load Condition Normal Operation
N-1 Contingency
Summary-40
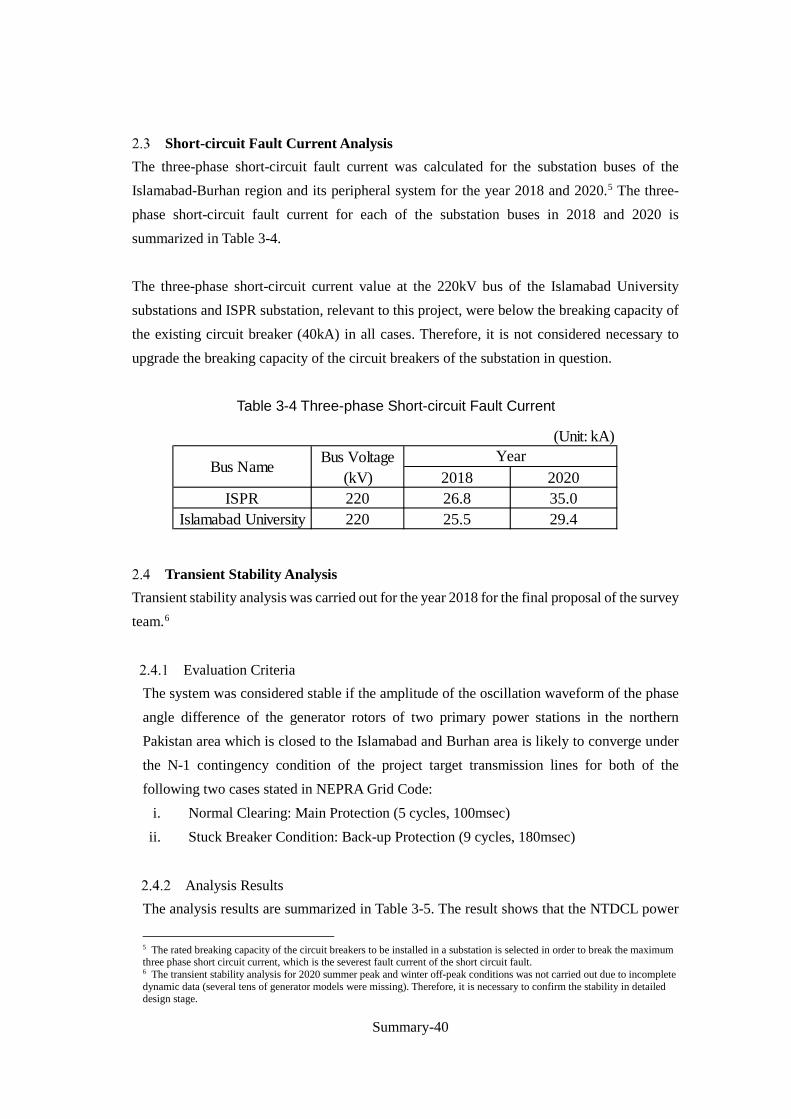
Short-circuit Fault Current Analysis The three-phase short-circuit fault current was calculated for the substation buses of the Islamabad-Burhan region and its peripheral system for the year 2018 and 2020.5 The three-phase short-circuit fault current for each of the substation buses in 2018 and 2020 is summarized in Table 3-4. The three-phase short-circuit current value at the 220kV bus of the Islamabad University substations and ISPR substation, relevant to this project, were below the breaking capacity of the existing circuit breaker (40kA) in all cases. Therefore, it is not considered necessary to upgrade the breaking capacity of the circuit breakers of the substation in question.
Table 3-4 Three-phase Short-circuit Fault Current
Transient Stability Analysis Transient stability analysis was carried out for the year 2018 for the final proposal of the survey team.6
Evaluation Criteria The system was considered stable if the amplitude of the oscillation waveform of the phase angle difference of the generator rotors of two primary power stations in the northern Pakistan area which is closed to the Islamabad and Burhan area is likely to converge under the N-1 contingency condition of the project target transmission lines for both of the following two cases stated in NEPRA Grid Code:
i. Normal Clearing: Main Protection (5 cycles, 100msec) ii. Stuck Breaker Condition: Back-up Protection (9 cycles, 180msec)
Analysis Results The analysis results are summarized in Table 3-5. The result shows that the NTDCL power
5 The rated breaking capacity of the circuit breakers to be installed in a substation is selected in order to break the maximum three phase short circuit current, which is the severest fault current of the short circuit fault. 6 The transient stability analysis for 2020 summer peak and winter off-peak conditions was not carried out due to incomplete dynamic data (several tens of generator models were missing). Therefore, it is necessary to confirm the stability in detailed design stage.
(Unit: kA)
2018 2020ISPR 220 26.8 35.0
Islamabad University 220 25.5 29.4
Bus Name Bus Voltage(kV)
Year

Summary-41
system in the Islamabad and Burhan area and the surrounding northern system remains stable in the case of single line fault of the project target transmission lines for both normal clearing and stuck breaker conditions for the year 2018.
Table 3-5 Transient Stability Analysis Results
Study Phase
Fault Section Case Mansehra
- Islamabad University ISPR
- Islamabad University
2018 Summer Peak
Normal Clearing Condition Stable Stable
Stuck Breaker Condition Stable Stable
The Outline of Installation of New Transmission Line Facilities Transmission Line Facilities
Specification of New Transmission Line Facilities Specification of new transmission line facilities corresponds to the existing Mansehra-ISPR transmission line mentioned in PC-I. Specification of existing Mansehra-ISPR transmission line facilities is shown as follows.
Table 3-6 Existing T/L facilities on Mansehra – ISPR
Section Mansehra - ISPR(Sangjani)Name of LineCompletionLength of T/L kmNos of Tower ( Nos/km )Number of CircuitConductor
BundleASTM CodeOverall Diameter mm Strand Steel x ( mm2 )
Alminium x ( mm2 )Total ( mm2 )
Stringing condition kNKind of Ground Wire Gulbanaized Steel Wire(Optical fiber installed/OPGW)Kind of Insulator Porcelain, made by EMKO, 120kN
Arcing Horn Gap length 6 feet
3.54100.48
356
19.58
29.1
517.3
twin bundleRail
7 2.45 33.54
220kV Mansehra - ISPR(Sangjani) T/Line Circuit-I & II
45 3.70
TypeNos 14
483.8
09.08.2011
2
Summary-42
Selection of Conductor (Confidential)
Outline Study of Transmission Line Facilities Design Condition
Applicable standards for design of transmission line facilities are shown as follows: 1) Applicable Standard ・IEC60826 Design criteria of overhead transmission lines Third edition (2003-10) ・Building code of Pakistan (2007) ・WAPDA/NTDCL Specifications
2) Allowable Continuous Current Calculation Condition ・Based on IEEE738 ・Wind velocity 3feet/s (Line Temperature 90℃) ・Ambient Temperature (40℃) Note: Line temperature under emergency shall be taken as 100℃. Ambient temperature shall be taken corresponding to the target area. ・Amount of Solar Radiation (0.5 W/m)
3) Insulating Distance ・Conductor-Tower (Normal condition 2.1m, High wind condition 40m/secs 1.6m) ・Conductor-Ground (8m, Line temperature 100℃)
4) Sag Calculation Condition ・Sag equivalent to Normal Tensile Force of ACSR Rail (17%UTS, Calm/No accretion of snow and ice, Ambient Temperature 25℃) ・Maximum Sag equivalent to Rail (Calm/No accretion of snow and ice, Line temperature 65℃) ・Space of conductor (457mm) ・Wind pressure (970Pa, No accretion of snow and ice, Temperature 25℃) ・Insulator String :Single Rail (Porcelain 120kNx14nos, Length 2922mm, Gap length of arcing hone 6feet) : Twin Bundle Rail (porcelain 120kNx14nos x2, Length 2922mm, Anti-fog, Gap length of arcing hone 6feet)
5) Earthquake Seismic zone and seismic zone of target area are as described in Volume 1. Chapter 4. 4.3.

Summary-43
Tower Shape Towers shall be adopted as standard EA-Type suspension towers, EG-Type angle towers and JKD-Type tension towers for using the existing Mansehra-ISPR transmission line. The existing Mansehra-ISPR transmission line had been designed as a twin-bundle Rail. These standard towers are applicable to reinforcement of the existing transmission line for this project.
In the case of applying the LL-ACSR610, which is equivalent to the outer diameter of the Rail conductor, the horizontal load (wind load) is equal. Because the vertical load will be increased by the difference of unit weight (1.867-1.600=0.267kg/m), the foundation compression load also will be increased and uplift load will be decreased. These loads are estimated to be about 320kg/foot for a 400m loading span. Due to the approximately 1 % difference of foundation load, LL-ACSR610 shall be able to be applied to the new construction line.
On the other hand, the sag of LL-ACSR610 will be increased under the same tension stringing condition as the Rail conductor because of the increased unit weight. So, it is necessary to add to the tower height to keep the distance from the ground. The additional height of the tower will be about 2m average in the case of a 400m span. The different sag of each conductor is shown in Figure 3-6.
Figure 3-5 Comparison of each conductor sag (No wind and snow, 90 deg.C,
T=1,970kg/wire)

Summary-44
Table 3-7 Suspension Tower Design Condition
Summary-45
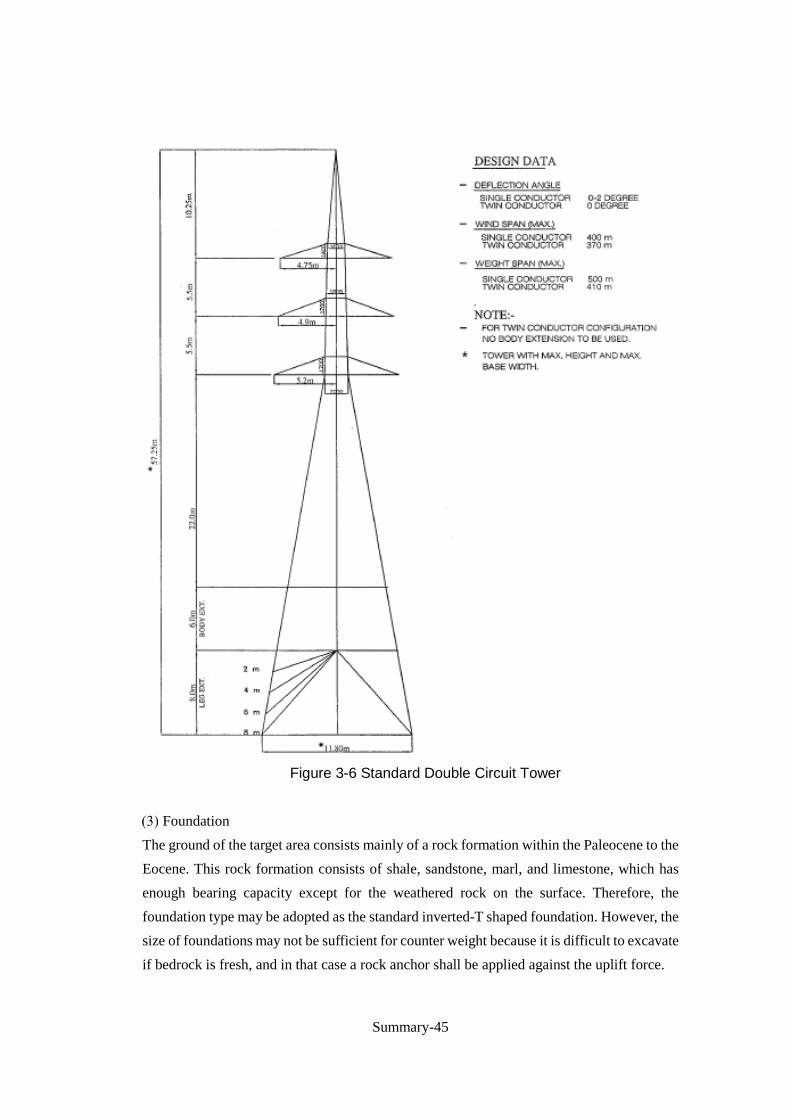
Figure 3-6 Standard Double Circuit Tower
Foundation The ground of the target area consists mainly of a rock formation within the Paleocene to the Eocene. This rock formation consists of shale, sandstone, marl, and limestone, which has enough bearing capacity except for the weathered rock on the surface. Therefore, the foundation type may be adopted as the standard inverted-T shaped foundation. However, the size of foundations may not be sufficient for counter weight because it is difficult to excavate if bedrock is fresh, and in that case a rock anchor shall be applied against the uplift force.
Summary-46
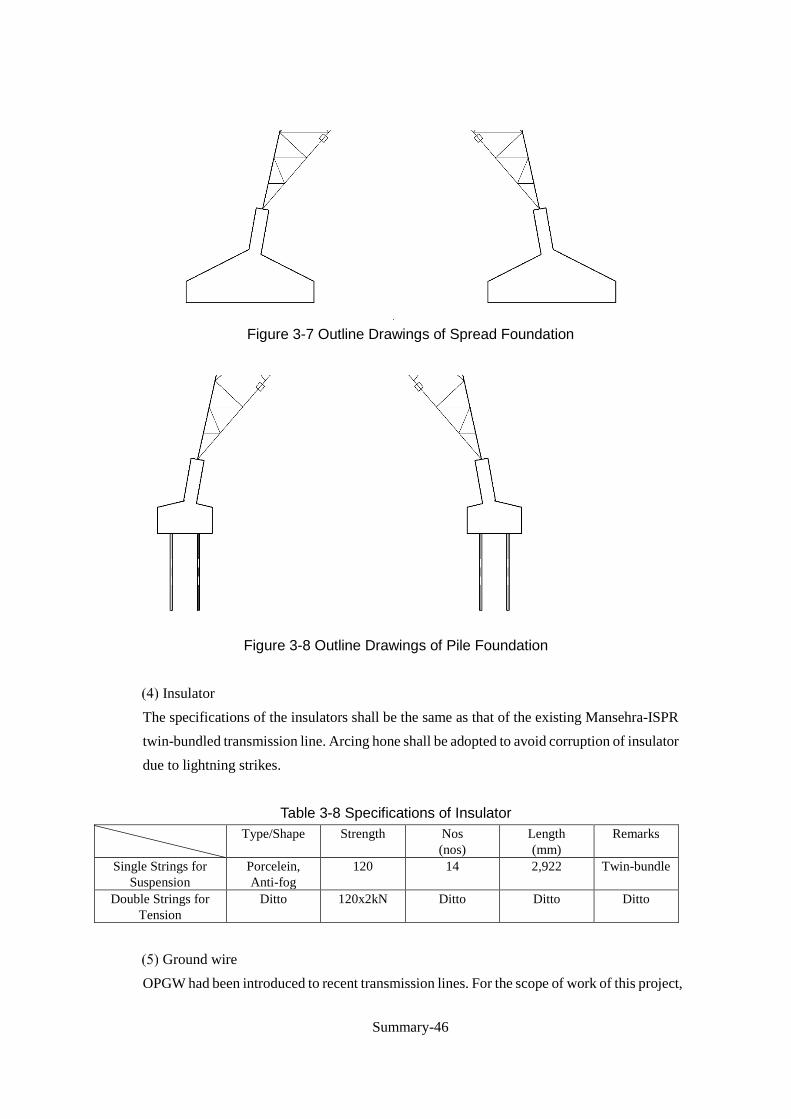
Figure 3-7 Outline Drawings of Spread Foundation
Figure 3-8 Outline Drawings of Pile Foundation
Insulator
The specifications of the insulators shall be the same as that of the existing Mansehra-ISPR twin-bundled transmission line. Arcing hone shall be adopted to avoid corruption of insulator due to lightning strikes.
Table 3-8 Specifications of Insulator Type/Shape Strength Nos
(nos) Length (mm)
Remarks
Single Strings for Suspension
Porcelein, Anti-fog
120 14 2,922 Twin-bundle
Double Strings for Tension
Ditto 120x2kN Ditto Ditto Ditto
Ground wire
OPGW had been introduced to recent transmission lines. For the scope of work of this project,

Summary-47
ground wire is planned to be adopted as OPGW. Therefore, OPGW has been adopted in all sections of this project. The size of the ground wire shall be adopted as OP-AC97sq corresponding to Rail 480sq. The cross-section of OP-AC97sq is shown in Figure 3-10.
The number of optical fibers is assumed to be the same number of 24nos as planned in PC-1. However, the number of optical fibers shall be decided by the detailed design.
Figure 3-9 Outline diagram of OP-AC97sq
Substation Basic Concept of the Design
The Substation which requires modifications and/or additions along with the installation of a new transmission line under this Reinforcement Project is the ISD. Univ substation only. The existing 220kV GIS and connecting bus duct from the transmission line bay will need to be modified due to the addition of the power receiving transmission line from In/out Mansehra-ISPR line. Although the modification/addition of metering and protection relaying circuits and operation/control panels are required, the cost was estimated as the ancillary facility cost after the main equipment cost was calculated. Table 3-9 shows the

Summary-48
scope of the substation equipment and the associated works in this reinforcement project.
Table 3-9 Scope of the substation equipment and the associated works in this reinforcement project
Item of device, equipment, installation, and wiring work
1 Equipment for 220kV transmission line receiving bay: measuring/protection
devices, line arrestors, and connecting bus bar with 220kV switchgear
2 220kV switchgear equipment (circuit breaker, isolator, bus bar, measurement,
indicating circuits, insulation gas, and related devices) (those which are required for
expansion of transmission lines and modified equipment)
3 Measurement, protection, indicating, and control circuits for 220kV switchgear
(including for modified existing circuits )
4 Supply of drawings of foundation works for the above mentioned equipment
5 Execution of the above foundation works
6 Check of strength of steel structure for modification of AIS type substation
7 Reinforcement work of the steel structure as result of the above check
The Selection of Optimum Plan and Outline Design (Results of study of specifications) 1) As the 220kV In/out Mansehra-ISPR transmission line accesses from the eastside of the ISD. Univ substation, the transmission line from 220kV Rawat-NEW will be shifted westward and connected to a new line bay to avoid crossing with the transmission line from Mansehra-ISPR. The power receiving line bay from the 220kV In/Out Mansehra-ISPR transmission line shall be placed at the position of the existing line bay from Rawat-New. (Refer to Figure 3-11)

Summary-49
Figure 3-10 Transmission Line and Line Bay for ISD.Univ Substation
Layout of ISD. Univ substation
Figure 3-11 Layout of Expansion Area of ISD. Univ Substation

Summary-50
Figure 3-12 Single Line Diagram of Expansion Area of ISD. Univ Substation
Table 3-10 ISD. Univ Substation:Expansion Specification No. Item name and specification Q’ty Application
Part-1 Circuit breaker, 3 phase,
Rated voltage 245kV
Rated current 4,000A,
Rated short circuit current 50kA
3 2 for Expansion line
1 for Expansion Transformer feeder
Part-2 Disconnecting switch(LS), 3 phase:
Rated voltage 245kV, Rated current 4,000A,
Rated short time withstand current 50kA
6 4 for Expansion line
2 for Expansion Transformer feeder
Part-3 Outdoor type disconnecting switch(LS), 3 phase:
Rated voltage 245kV, Rated current 4,000A,
Rated short time withstand current(3s) 50kA
2
Part-4 Lightning arrester(LA), single phase type
Impulse test voltage 750kV
6 For Transformer
Part-5 Protection relay panel 1 Distance protection relays, over current
relays
Part-6 Control and operation panel 1

Summary-51
Construction Method Construction Method of Transmission Line Facilities
Problems for the Grid System In the summer peak period, it is necessary to make all of the existing lines usable in order to secure both freedom and transmission capacity of the power system as a whole. Therefore, connection works at the junction point of in/out of Mansehra-ISPR shall be avoided during this period, in which the impact of the power supply interruption accompanied by an electrical accident caused by construction work is enormous. However, foundation, tower erection, and line installation work can be done in a timely fashion except for the junction point
Construction of Substation Issues/advice cautioned in construction of the Substation
1) The modification of the above 220kV GIS is difficult for anyone other than Siemens, which is the manufacturer of existing GIS, because the extension of GIS is difficult to interface with the existing part due to its structure, and high-accuracy mechanical matching is necessary to compose the integrated gas insulated space. (In this case, modification of GIS may be exclusively ordered to the Siemens Company.)
2) The modification work of the 220kV GIS will be supervised through the expertise of the manufacturer of GIS, the Siemens Company. However, it is usual for NTDCL to prepare workmen to execute the modification work to save costs paid to the manufacturer. NTDCL is supposed to be capable of dispatching workmen/technicians to execute the work. NTDCL shall recognize that this modification work is an opportunity for NTDCL to study the technology for the maintenance of the facility from the manufacturer.
Implementation Schedule of this Project (Confidential)
Estimated Construction Cost Finance of Implementation Cost of the New Transmission Line Construction
The estimated construction cost is shown in following table.
Alternative studies Project Plan in the PC-1
The in/out of existing Mansehra-ISPR to the Islamabad University Substation has been planned in the PC-1. However, there is not an objectified route plan in the PC-1, and the
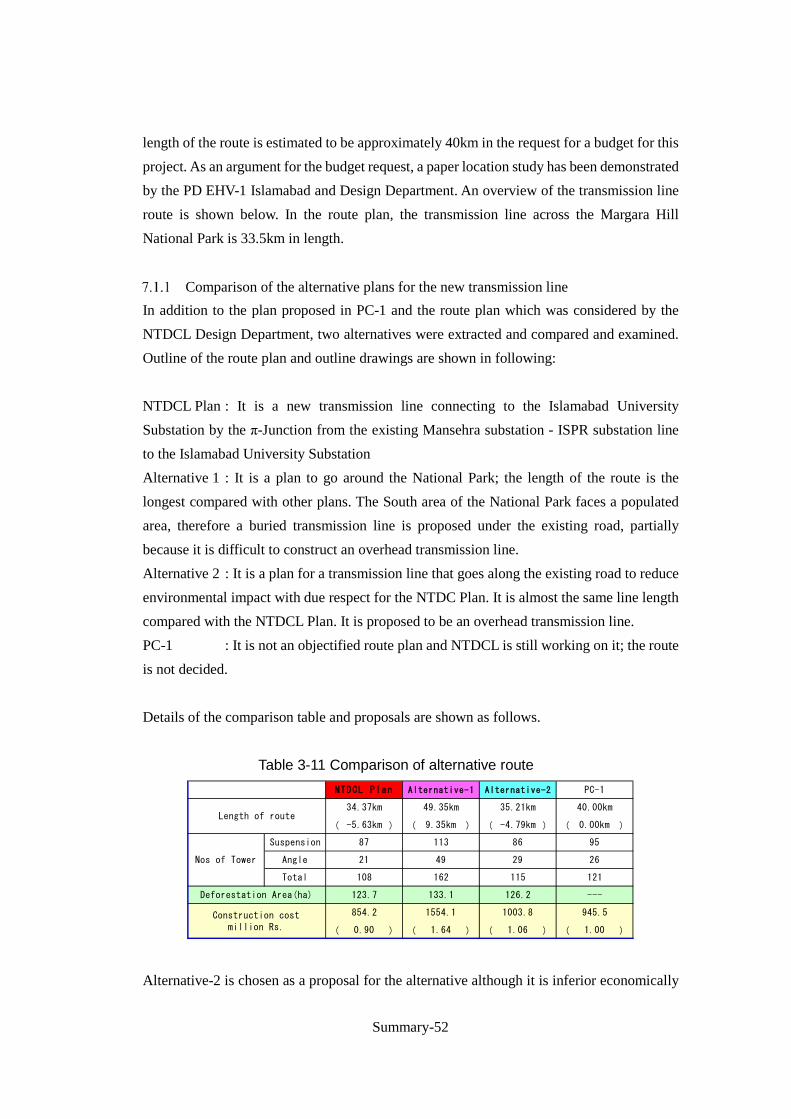
Summary-52
length of the route is estimated to be approximately 40km in the request for a budget for this project. As an argument for the budget request, a paper location study has been demonstrated by the PD EHV-1 Islamabad and Design Department. An overview of the transmission line route is shown below. In the route plan, the transmission line across the Margara Hill National Park is 33.5km in length.
Comparison of the alternative plans for the new transmission line In addition to the plan proposed in PC-1 and the route plan which was considered by the NTDCL Design Department, two alternatives were extracted and compared and examined. Outline of the route plan and outline drawings are shown in following: NTDCL Plan : It is a new transmission line connecting to the Islamabad University Substation by the π-Junction from the existing Mansehra substation - ISPR substation line to the Islamabad University Substation Alternative 1 : It is a plan to go around the National Park; the length of the route is the longest compared with other plans. The South area of the National Park faces a populated area, therefore a buried transmission line is proposed under the existing road, partially because it is difficult to construct an overhead transmission line. Alternative 2 : It is a plan for a transmission line that goes along the existing road to reduce environmental impact with due respect for the NTDC Plan. It is almost the same line length compared with the NTDCL Plan. It is proposed to be an overhead transmission line. PC-1 : It is not an objectified route plan and NTDCL is still working on it; the route is not decided. Details of the comparison table and proposals are shown as follows.
Table 3-11 Comparison of alternative route
Alternative-2 is chosen as a proposal for the alternative although it is inferior economically
( ) ( ) ( ) ( )
( ) ( ) ( ) ( )
945.5
0.90 1.64 1.06 1.00
Construction costmillion Rs.
854.2 1554.1 1003.8
121
Deforestation Area(ha) 123.7 133.1 126.2 ---
Total 108 162 115
95
Angle 21 49 29 26
-4.79km 0.00km
Nos of Tower
Suspension 87 113 86
PC-1
Length of route34.37km 49.35km 35.21km 40.00km
-5.63km 9.35km
NTDCL Plan Alternative-1 Alternative-2

Summary-53
to the NTDCL Plan. The transmission line passes through the vicinity of the existing road to secure accessibility during construction and to avoid disjunction of the natural forest.
Stakeholders meetings Two stakeholder meetings were held to institute the route for the new transmission line. Alternative proposals are discussed in each round as follows.
First stakeholder meeting Result of the 1st alternative study
The study team prepared two alternatives, the east bypass route and the south bypass route, other than NTDCL’s original plan, and conducted a simple desk study based on literature and satellite images and prepared the study report (ANNEX8.3.1-1). The first SHM was held on 4th August 2016 at Islamabad based on the study report. Most of the participants supported Alternative 3 (the south bypass route), but NTDCL did not agree with Alternative 3. The record of the meeting was attached in ANNEX8.3.1-2 and ANNEX8.3.1-3
Table 3-12 Results of the first alternative study
Item Alternative 1 Alternative 2 Alternative 3 Length 41 km 51 km 35 km Forest area in ROW 84.71 ha 103.03 ha 10.59 ha Length in the National Park
7.2 km - -
Houses/Buildings 133 32 (Underground 349) 24 (Underground 0) Farm land 20.04 ha 17.21 ha 19.20 ha Cost 1,637 mill. Rs 4,575 mill. Rs 11,413 mill. Rs NTDCL’s experience Yes No No
Pros Cheapest
Technically easy No impact on MHNP
No impact on MHNP No impact on the
forest of KPK
Cons Passing through
MHNP
Expensive Technically
unacceptable
Expensive Technically
unacceptable
Second stakeholder meeting Result of the second alternative study
After the first SHM, the study team and NTDCL prepared six new alternatives and studied the original design. Based on the study results of the seven alternatives, the second SHM was held on 17th October 2016. All the participants supported Alternative 3e and agreed to select it. Alternative 3e is based on Alternative 3, which was selected as the proposal in

Summary-54
the first SHM. In this proposal, the transmission line is changed from a buried line to an overhead line which joins with the existing 132kV transmission line.
Table 3-13 Results of the second alternative study
Item Alt. 1
Alt. 1a
Alt.3b Alt. 3c
Alt.3d New Alt.3e
Length 41 km
46 km 37 km 42 km
41 km 31 km 24 km
High tower 38 km
43.6 km
6.6 km 7.4 km
6.6 km 0 km 0 km
Joint Spanning 0 km 0 km 22 km 0 km 6.6 km 0 km 11 km Affected forest and bush* 3.5
ha 5.0 ha 0.0 ha 1.3
ha 0.0 ha 0.5 ha 0.0 ha
Length in the National Park 7.2 km
4.3 km
6.6 km 7.4 km
6.6 km 0.0km 0.0km
Potential impact on flora and fauna*
∆ x ○ ○ ○ ○ ○
Houses/Buildings 133 38 58 80 96 0 58 Agriculture fields* ∆ ○ ∆ ∆ ∆ ∆ ∆ Construction cost (mil Rs.)
Monopole 10%
2,351 2,642 5,165 3,498 4,205 1,270 1,926◊
Monopole 20%
2,351 2,642 7,611 5,155 6,196 1,270 3,615◊
Monopole 30%
2,351 2,642 10,057 6,812 8,188 1,270 4,459◊
Main issues NP Forest IESCO NP Cost IESCO
Mosque, Army
IESCO
* 576 m2 for one tower **Preferences: ○ (Better) ∆ (Good) x (Fair) ◊Not included G/S cost
Outline, Agenda, and Recommendation for the New Selected Plan Outline of the Favorite Proposal
Project Objective and Anticipated Efficacy In the stakeholder meeting, Alternative-3e was selected as the best compared with other alternative plans. NTDCL has studied Alternative-3e to commercialize and prepare the Proforma PC-I (New PC-I7). The outline of the selected plan mentioned in the new PC-I, agenda, and recommendation for execution are summarized in this chapter.
Project Scope The project scope is mentioned in the new PC-1 as follows. The outline diagram of the project is shown in Figure 3-15.
7 Proforma PC-I 220kV Zero Point Grid Station at Islamabad, January 2017, Planning Power NTDC (ANNEX4.1.2-1)
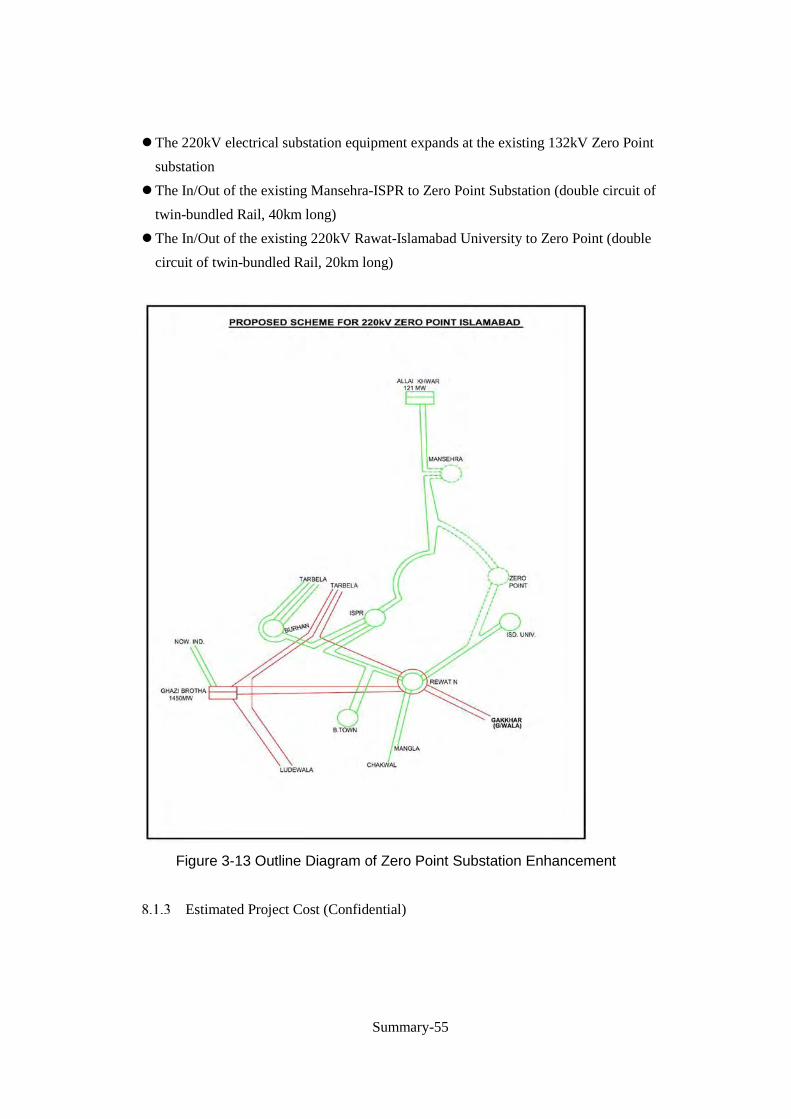
Summary-55
The 220kV electrical substation equipment expands at the existing 132kV Zero Point substation
The In/Out of the existing Mansehra-ISPR to Zero Point Substation (double circuit of twin-bundled Rail, 40km long)
The In/Out of the existing 220kV Rawat-Islamabad University to Zero Point (double circuit of twin-bundled Rail, 20km long)
Figure 3-13 Outline Diagram of Zero Point Substation Enhancement
Estimated Project Cost (Confidential)

Summary-56
Conclusion Issues and Recommendations
The initial objective is to target improved reliability of the power supply to the Islamabad Capital Territory through an additional power supply link to the 220kV Islamabad University Substation, which is currently being fed from a single source from the 500kV Rawat Substation. The new scope suggested at the stakeholder meetings is not suitable for the initial objective. Moreover, the thinking of ways for a grid system expansion plan is different between the current plan and the existing plan of NTDCL and IESCO. The applicability of the new scope shall be validated as the view point of the grid system plan. NTDCL shall review the grid system plan prior to implementation of the project depending on the new scope. The availability of project implementation shall be evaluated after completing a review of the grid system plan. Moreover, the review of the grid system plan will take a long time depending on load flow analysis and consideration. Therefore in this project, this report points out problems of the new scope.
Issues and Recommendations on Power System Analysis The future load flow situation of the transmission lines in the project target area will change according to changes in the proposed project scope, namely, upgrading of the existing 132kV Zero Point substation to a 220kV one and development of new 220 kV transmission lines to be connected to the substation. Therefore, it is necessary to review the existing 5-year expansion plan and the grid development plan of the system for supplying power to the Islamabad area considering the changes.
Issues and of Transmission Line (1) Since the route of Mansehra-ISPR to Zero Point Substation was proposed just before the day of the SHM, this route has not been examined in any detail. The conditions of new proposal are not mentioned in the PC-1, i.e. the constraint on construction in respect to level crossing with railways and roads, places where it is expected be difficult for land acquisition, etc. Therefore, it is required to study the feasibility thorough the survey along the proposed route in detail. (2) The existing 132kV transmission line crosses the interchange of Islamabad Highway and Kashmir Highway. It will be required that construction work happens during the night when there is less traffic. It is also required to study the detour and traffic regulations during construction work. In addition to the existing tower which is placed on the ROW of the road,
Summary-57
traffic regulations during dismantling and reconstruction work are required, and countermeasures for workers’ safety and third-party damage are also required. It is recommended that the towers which are placed on the road be reconstructed outside of the road. (3) On the proposed route, there are some important government agency facilities, so it is necessary to reach a consensus with concerned agencies. In case of accident incidents, i.e. a breakdown due to breakage of a conductor and insulator damage, etc., it will be difficult to respond to an emergency from the viewpoint of maintenance. Therefore, it is recommended to study detour routes for such areas. (4) Part of the section of the transmission line from Islamabad University Substation to the Rawat Substation goes through the National Park. It will be required to conduct mutual consultations with CDA, EPA, and other concerned agencies.
Issues of the Substation The scope of the substation construction was changed from extension of transmission line bay at Islamabad university substation to modification of the Zero point substation including voltage grade up. Therefore, securing of land for the substation and the design of the substation are to be considered sufficiently, as concretely shown below. (1) The layout of equipment and the connection diagram (single line diagram) of the main Circuit of the substation are not provided in new PC-1. Therefore, it is necessary to study them at time of the detail design of this substation. (2) Based on the system analysis, the specification of the equipment (rated capacity, short-circuit capacity etc.,) and the connection of the main circuit of the substation, etc., are to be reviewed. (3) The space at the Zero point substation for 4 transmission line bays and 3 transformers is secured. However, for the new PC-1 220 kV Zero point substation, the construction cost is estimated not only for 220 kV GIS but also for 132 kV GIS, although existing 132 kV facilities are AIS (Air Insulated Switch Gear) and existing 132 kV facilities are not necessary to be changed to GIS. The space of the expansion of 132 kV facilities for AIS is secured at the Zero point substation.
Issues of Environmental and Social Considerations Power transmission route
Alternative 3e was selected after the two SHMs. But the detail design and route was not decided in 2016. NTDCL has to conduct detail design after topographical survey, geological survey, land use survey and housing survey under the discussion with CDA and IESCO.

Summary-58
Project Category Regarding the impact of the environment, this plan is based on the policy that does not go through Margalla Hills National Park. On the other hand, resettlement is considered to be inevitable. There is the possibility of that it is evaluated as category A in JICA guideline. (Over 200 resettlements)
Environmental Impact Though “Environmental Effect of the Project” is written in the section of 11.3 in the new PC-1, the contents are mentioned only typical topics. The contents is almost same as the former PC-1 written in the section of “220kV Transmission System Network Reinforcement in Islamabad and Burhan Area”. There is no described contents regarding the impactor this project. It cannot be read from the new PC-1.

Volume1.
General Information on the Project
1-i
Table of Contents –Vol.1– Volume.1 General Information on the Project ....................................................................... 1
Background and Purpose of the Project ................................................................. 1 Background and purpose of the project .................................................................. 1 Scope of the Survey ................................................................................................ 2
General Situation of Power Sector ......................................................................... 6 Structure of Power Sector ....................................................................................... 6 Government Policy in the Power Sector ................................................................ 8
Long Term Plan of the Power Sector .............................................................. 8 Short Term Plan of Power Sector .................................................................... 8
Policy and Assignment of NTDCL ...................................................................... 10 Obligation of NTDCL ................................................................................... 10 Assignment of NTDCL ................................................................................. 11
Power System Development Plan formulated by NTDCL in the Project Area and its Surroundings ............................................................................................................... 12
Trend of other donors in the power transmission field ......................................... 19 The legal system of NTDCL ................................................................................ 21
The main law about the power transmission company ................................. 21 The main law about power-transmission line construction ........................ 22 Labour laws in Pakistan ................................................................................ 23
Current Situation of the Project Target System .................................................... 25 Power System Map of the Project Target System ................................................ 25 Current Situation of the Project Target System .................................................... 27
Power Demand and Supply........................................................................... 27 Daily Load Curve ......................................................................................... 28 Transmission Loss ........................................................................................ 29 Power Supply Reliability .............................................................................. 30
Power Demand Forecast ....................................................................................... 36 Survey of Natural Conditions .............................................................................. 37
Meteorological Survey ......................................................................................... 37 Design Data and Grid Code of NTDCL ....................................................... 37 Data of Weather Observation Satellite .......................................................... 39 Design Specifications Based on Meteorological Observation ...................... 43
Overview of Landform and Terrestrial Formation ............................................... 44 Landform ...................................................................................................... 44
1-ii
Terrestrial Formation .................................................................................... 45 Earthquakes .......................................................................................................... 47
Social and natural environment ............................................................................ 49 Social Environment in and aroung Project site .................................................... 49
Key Indicators of Pakistan and its Provinces ................................................ 49 Administrative Region .................................................................................. 51 Ethnic Group ................................................................................................. 52 Population ..................................................................................................... 52 Education, Health and Hygiene .................................................................... 53
Natural Environment in and around Project site .................................................. 54 Natural Reserves ........................................................................................... 54 Climate .......................................................................................................... 54 Land use ........................................................................................................ 54
Environmental and Social Considerations in Pakistan ......................................... 56 Institutional and organizational condition of environmental and social
considerations in Pakistan ................................................................................................ 56 Organization and Policy ................................................................................ 56 Legal system for Environmental Impact Assessment ................................... 57 Gap Analysis between the Law of Pakistan and JICA Guidelines ................ 66
Legal framework of resettlement and land acquisition ........................................ 68 Project Policy of Land Acquisition and Resettlement .......................................... 72 Implementing structure and grievance redress mechanism .................................. 76
Organisation of Project Implementation and Maintenance .................................. 78 The organisation of NTDCL ................................................................................ 78
Organisational structure of NTDCL ............................................................. 78 The role of each department in NTDCL ....................................................... 79
Organisation of the project implementation ......................................................... 81 Departments related to project implementation ............................................ 81 Relevant Governmental Agencies ................................................................. 82 Implementation Procedure ............................................................................ 83 The Project Staff plan ................................................................................... 85 The project implementation system .............................................................. 86 Evaluation of the project implementation system ......................................... 88
System of maintenance and operation management............................................. 88 Operation Management System .................................................................... 88 Maintenance System ..................................................................................... 89

1-iii
Invitation to Japan ................................................................................................ 93 Purpose ................................................................................................................. 93 Mission Members of Japan Visit .......................................................................... 93 Schedule ............................................................................................................... 94 Outcome of Invitations for Training in Japan ....................................................... 95
1-iv
List of Tables–Vol.1– Table 2.3.1 Scope of Substation and Transmission line ........................................................... 11 Table 2.3.2 NTDCL Five Year Plan ......................................................................................... 12 Table 2.4.1 Short Term Plan (Ongoing Development Projects) ............................................... 13 Table 2.4.2 Medium Term Plan (Projects Ready for Implementation)..................................... 15 Table 2.4.3 Long Term Plan (for which Financing is required) ............................................... 17 Table 2.5.1 Trends of other donors for the power transmission field ....................................... 20 Table 2.6.1 Labour Standards Act ............................................................................................ 23 Table 3.1.1 500kV and 220kV Transmission Lines supplying Power to Islamabad and Burhan
Area ..................................................................................................................................... 25 Table 4.1.1 Meteorological Parameters Mentioned in Grid Code(2005) ................................. 38 Table 4.1.2 Past Record of Cyclones in Pakistan - Total Number of Cyclones ....................... 39 Table 4.1.3 ESDD of classified 3 area in Pakistan ................................................................... 44 Table 4.3.1 View Format of Seismic Zones in Target Area ...................................................... 47 Table 4.3.2 Seismic Zones ........................................................................................................ 47 Table 5.1.1 Key indicators of Pakistan ..................................................................................... 50 Table 5.1.2 Key indicators of Pakistan ..................................................................................... 51 Table 5.2.1 Number and area of Natural Reserves ................................................................... 54 Table 6.1.1 Projects requiring IEE/EIA in Energy Sector ........................................................ 57 Table 6.1.2 Acts and Ordinances regarding Environmental and Social Issues ........................ 59 Table 6.1.3 National Environmental Quality Standards ........................................................... 60 Table 6.1.4 National environmental quality standards for municipal and liquid industrial
effluents (mg/l unless otherwise defined) ............................................................................ 61 Table 6.1.5 National environmental quality standards for industrial gaseous emissions ......... 62 Table 6.1.6 National environmental quality standards for motor vehicle exhaust and noise ... 63 Table 6.1.7 National environmental quality standards for noise .............................................. 63 Table 6.1.8 National environmental quality standards for noise .............................................. 64 Table 6.1.9 The Gap between the Law of Pakistan and JICA guideline .................................. 67 Table 6.2.1 Comparison of JICA guideline and LAA .............................................................. 70 Table 6.4.1 Structure of implementation of land acquisition and resettlement ........................ 77 Table 7.2.1 Classification names of the project plan documents.............................................. 83 Table 8.2.1 NTDCL Invitees to Japan ...................................................................................... 93 Table 8.3.1 Overall schedule of knowledge co-creation program for NTDCL officers from
February 10th to 20th, 2016 ................................................................................................ 95

1-v
List of Figures –Vol.1–
Figure 1.2.1 Location Map ......................................................................................................... 4 Figure 1.2.2 Project Location Map (Magnification) .................................................................. 5 Figure 2.1.1 Structure of Pakistan Power Sector........................................................................ 7 Figure 2.4.1 Project Location Map of Short Term Plan ........................................................... 14 Figure 2.4.2 Project Location Map of Medium Term Plan ...................................................... 16 Figure 2.4.3 Project Location Map of Long Term Plan ........................................................... 18 Figure 3.1.1 Power System Map including the Project Target Transmission Lines ................. 26 Figure 3.2.1 Changes in Peak Power Demand and Supply Capacity ....................................... 27 Figure 3.2.2 Changes in the Installed Capacity and Supply Capacity...................................... 28 Figure 3.2.3 Daily Load Curve on the Days when the Maximum Load was recorded in the
summer and winter in 2013 ................................................................................................. 28 Figure 3.2.4 Daily Load Curves on both Working and Non-working Days when the Maximum
Load was recorded in Summer/Winter ................................................................................ 29 Figure 3.2.5 Changes in Transmission Loss in PEPCO System ........................................... 30 Figure 3.2.6 Annual Number of Outages of PEPCO System ................................................... 31 Figure 3.2.7 Annual Total Duration of Outage of PEPCO System .......................................... 31 Figure 3.2.8 Maximum Duration of Single Outage of PEPCO System ................................... 32 Figure 3.2.9 Changes in Length of 500kV and 220kV Transmission Lines............................. 32 Figure 3.2.10 Changes in Annual Number of Outages of the Target 220kV Transmission Lines
............................................................................................................................................. 34 Figure 3.2.11 Changes in Annual Total Duration of Outages of the Target 220kV Transmission
Lines .................................................................................................................................... 34 Figure 3.2.12 Changes in Maximum Duration of Single Outage of the Target 220kV
Transmission Lines .............................................................................................................. 35 Figure 4.1.1 Total Number of Cyclones ................................................................................. 39 Figure 4.1.2 Temperature in Tarbela Switch Yard-Islamabad University Grid Station Area ... 40 Figure 4.1.3 Solar Radiation in Tarbela Power House - Burhan Grid Station Area ................. 41 Figure 4.1.4 Lightning Strike Frequency Map (~1985, CIGRE) ........................................... 42 Figure 4.1.5 Lightning strike frequency (~2013, NASA) ........................................................ 43 Figure 4.2.1 Landform of Target Area of Project ..................................................................... 45 Figure 4.2.2 Terrestrial Formation around Target Area ............................................................ 46 Figure 4.3.1 Seismic Zones of Punjub Province and Islamabad Capital Territory................... 48 Figure 5.1.1 Administrative Regions ....................................................................................... 51
1-vi
Figure 5.1.2 Ethnic composition of Pakistan ........................................................................... 52 Figure 5.1.4 Age Composition of Pakistan (in millions) ......................................................... 53 Figure 5.2.1 Landuse map of project area ................................................................................ 55 Figure 6.1.1 Attached department of MOCC ........................................................................... 56 Figure 6.1.2 Flow of IEE/EIA procedure ................................................................................. 58 Figure 7.1.1 Organisation Chart of NTDCL ............................................................................ 78 Figure 7.2.1 Manpower planning of the project ....................................................................... 85 Figure 7.2.2 Diagram of implementation system for the project ............................................. 87 Figure 7.3.1 NPCC photograph ................................................................................................ 88 Figure 7.3.2 Organization Chart of NPCC ............................................................................... 89 Figure 7.3.3 Organisation of GSO............................................................................................ 90 Figure 7.3.4 Example of distribution of personnel at a substation ........................................... 92

1-vii
Abbreviations Abbreviation Formal Name
ADB Asian Development Bank AEDB Alternative Energy Development Board AFR Annual Fund Requirement ALM Assistant Line Man ASSA Assistant Sub Station Attendant B Susceptance CCC Central Contract Cell CPP Capital Power Producer CE Chief Engineer CDA Capital Development Authority C&DF Capacitance & Dissipation Factor C/P Counterpart CIGRE Conseil International des Grands Reseaux Electriques DES Dielectric Strength DISCO/DISCOs Distribution Company DLC Dead Line Course EAD Economic Affairs Division EIA Environmental Impact Assessment EPA Environmental Protection Agency ESIC Environmental and Social Impact Cell FESCO Faisalabad Electric Supply Company Limited GENCO Generation Company GEPCO Gujranwala Electric Power Company Limited GI General Information GRC Grievance Redress Committee GSO Grid System Operation Organization G/S Grid Station GTACSR Gap-Type Aluminium Conductor Steel-Reinforced HESCO Hyderabad Electric Supply Company Limited ICT Islamabad Capital Territory IEE Initial Environmental Examination IESCO Islamabad Electric Supply Company Limited IPP Independent Power Producer ISD.Univ Islamabad University ISPR Islamabad Peshawar Road JET JICA Expert JICA Japan International Cooperation Agency JS Joint Secretary kA kilo Ampere
1-viii
KE K-Electric Limited LARF Land Acquisition Resettlement Framework LARP Land Acquisition Resettlement Plan KPK Khyber Pakhtunkhwa Province kV kilo Volt LCM Leakage Current Measurement LA Lab Assistant LAA Land Acquisition Act LESCO Lahore Electric Supply Company Limited
LL-ACSR/AC Low loss Aluminium Conductors Aluminium Clad Steel-Reinforced
LM Line Man LS Line Superintendent MA Machine Attendant MD Managing Director MEPCO Multan Electric Power Company Limited MTCE Maintenance MoWP Ministry of Water and Power M/M Minutes of Meeting MTDF Midterm Development Framework MOCC Ministry of Climate Change MVA Megavolt-ampere MW Megawatt NEQS National Environmental Quality Standards NOC No Objection Certificate NEPRA National Electric Power Regulatory Authority NPCC National Power Control Center NPV Net Present Value NTDC/NTDCL National Transmission and Dispatch Company/Limited OLTC On Load Tap Changer O&M Operation and Maintenance OPGW Optical Ground Wire PAEC Pakistan Atomic Energy Commission PEPCO Pakistan Electric Power Company Limited PESCO Peshawar Electric Supply Company Limited PC-1 Planning Commission form 1 PCM Project Cycle Management PIU Project Implementing Unit PPIB Private Power and Infrastructure Board PPRA Public Procurement Regulatory Provincial/AJK Provincial/AJK PSS/E Power System Simulator for Engineering (Software name)

1-ix
p.u. per unit QESCO Quetta Electric Supply Company Limited R Resistance SAIDI System Average Interruption Duration Index SAIFI System Average Interruption Frequency Index SESCO Sukkur Electric Supply Company Limited SPP Small Power Producer TESCO Tribal Areas Electricity Supply Company Limited TOR Terms of Reference T/L Transmission line
PMU Project Management Unit
RAP Resettlement Action Plan USAID United States Agency for International Development USAIDS Joint United Nations Programme on HIV and AIDS X Reactance WAPDA Water and Power Development Authority WB World Bank
ZTACIR Aluminium Alloy Conductor Invar Rein- forced

1-1
Volume.1 General Information on the Project
Background and Purpose of the Project
Background and purpose of the project
In the Islamic Republic of Pakistan (hereinafter referred to as “Pakistan”), an average of 5.5 % per year of electricity demand growth was estimated by 2020, however the electric power supply and demand gap is serious in recent years and a yawning supply-demand gap where the demand for electricity far outstrips the current generation capacity which remains at 16,170 MW to 20,576 MW of peak demand, about 21.4 % short of demand in 2013/2014. From this supply-demand gap, depending on the area, on average a scheduled power supply outage of 10.5 hours/a day occurs. To meet demand growth and reduce the outage rate of electricity supply, reinforcement of grid stations and transmission system are key tasks. In Pakistan, transmission facilities are in bad condition of maintenance and have aged. Transmission lines are divided into single sections and do not comprise an efficient transmission system. Therefore in case of the transmission system, transmission line failure causes huge electricity supply outages. In these situations Government of Pakistan released the “National Power Policy 2013” in June 2013 having a higher target which would have a zero gap between the supply of and demand for electricity. In the Government Policy Report it is described that the electric power sector targets not only an increase of generation capacity, but also efficiency improvements in old transmission facilities and reinforcement of power transmission ability. This project is planned by NTDCL (National Transmission and Despatch Company Limited) based on PC-1 (Planning Commission Form 1). In this project there are two sub-projects. One is the construction of new transmission lines which supply electricity to those grid stations which have only one electricity supply route and for which the reliability of electric supply is low. The other is the reinforcement of 40-year-old existing transmission lines. For the increase of power station capacity, it is necessary to reinforce the existing transmission lines which relate to the incremental power station capacity, improve the reliability of electric power supply and respond to future power demand growth. Eventually, electric power sector issues are to be resolved by the contributions of those countermeasures.

1-2
At present, to respond to reinforcement of the fourth expansion of Tarbela power station, 1900 MW, the following sub-projects 1 and 2 are planned, and electric power supply to metropolitan areas which have many important facilities are to be strongly intensified. The sub-projects 1 and 2 are as shown below:
① To reinforce the capacity of the 220 kV existing transmission line, improve reliability and increase the power transmission line efficiency from Tarbela power station to Burhan grid station (35km) and from Tarbela power station to ISPR (Islamabad Peshawar Road) grid station.
② To double electric power supply to the capital city by an additional new transmission line, in/out of Mansehra grid station to Islamabad University grid station (40 km).
The purpose of this investigation is to conduct research on the overview, the project cost, the business operation system and the environment and the social considerations for examining whether this project is appropriate to be financed by a Japanese Yen loan to the Government of Pakistan.
Scope of the Survey
Implementation of the following tasks relevant to sub-projects 1 and 2: Advance preparation Confirmation of the background and course of the project Survey on current situation of the target system and existing facilities Outline design and selection of the optimum plan Utilization of Japanese technologies Invitation of counterparts to Japan Survey of natural conditions Outline of the project plan Preparation of basic design drawings Construction methods Project implementation schedule Estimation of the project cost Evaluation of the project Determination of the project implementation policy Project implementation and maintenance structure Formulation of consulting service implementation plan Environmental and social considerations
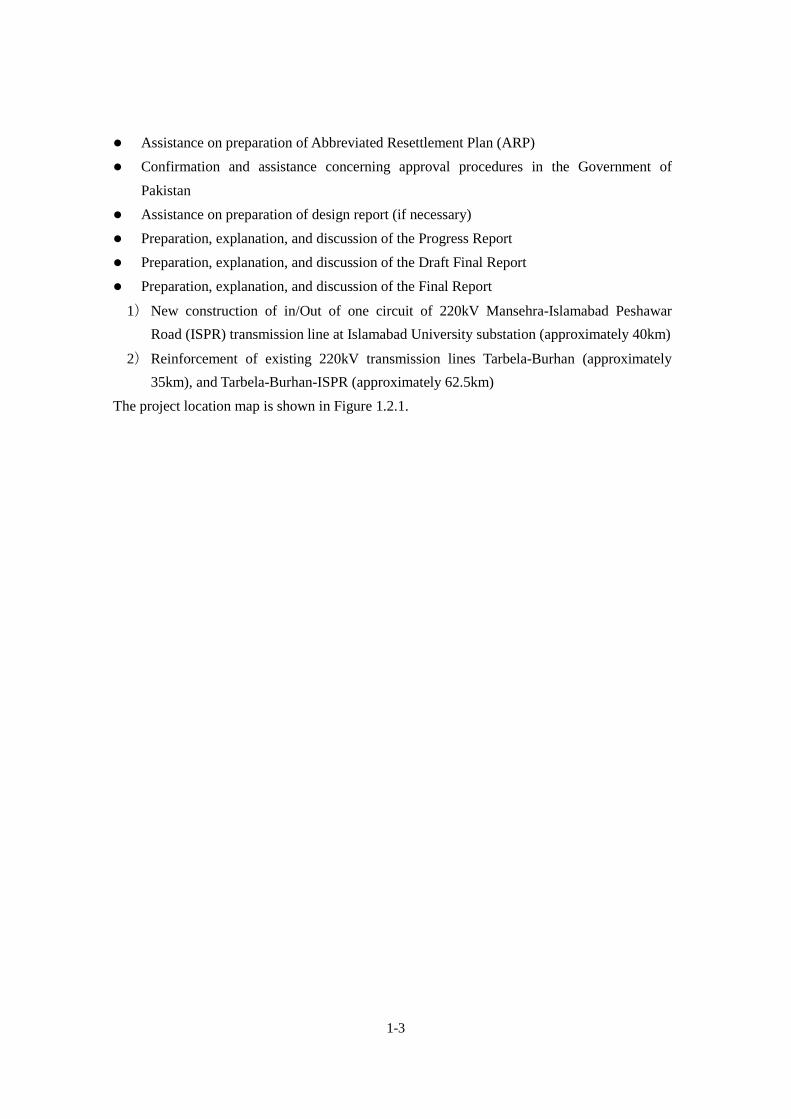
1-3
Assistance on preparation of Abbreviated Resettlement Plan (ARP) Confirmation and assistance concerning approval procedures in the Government of
Pakistan Assistance on preparation of design report (if necessary) Preparation, explanation, and discussion of the Progress Report Preparation, explanation, and discussion of the Draft Final Report Preparation, explanation, and discussion of the Final Report
1) New construction of in/Out of one circuit of 220kV Mansehra-Islamabad Peshawar Road (ISPR) transmission line at Islamabad University substation (approximately 40km)
2) Reinforcement of existing 220kV transmission lines Tarbela-Burhan (approximately 35km), and Tarbela-Burhan-ISPR (approximately 62.5km)
The project location map is shown in Figure 1.2.1.

1-4
(Source: NTDCL Planning Power) Figure 1.2.1 Location Map
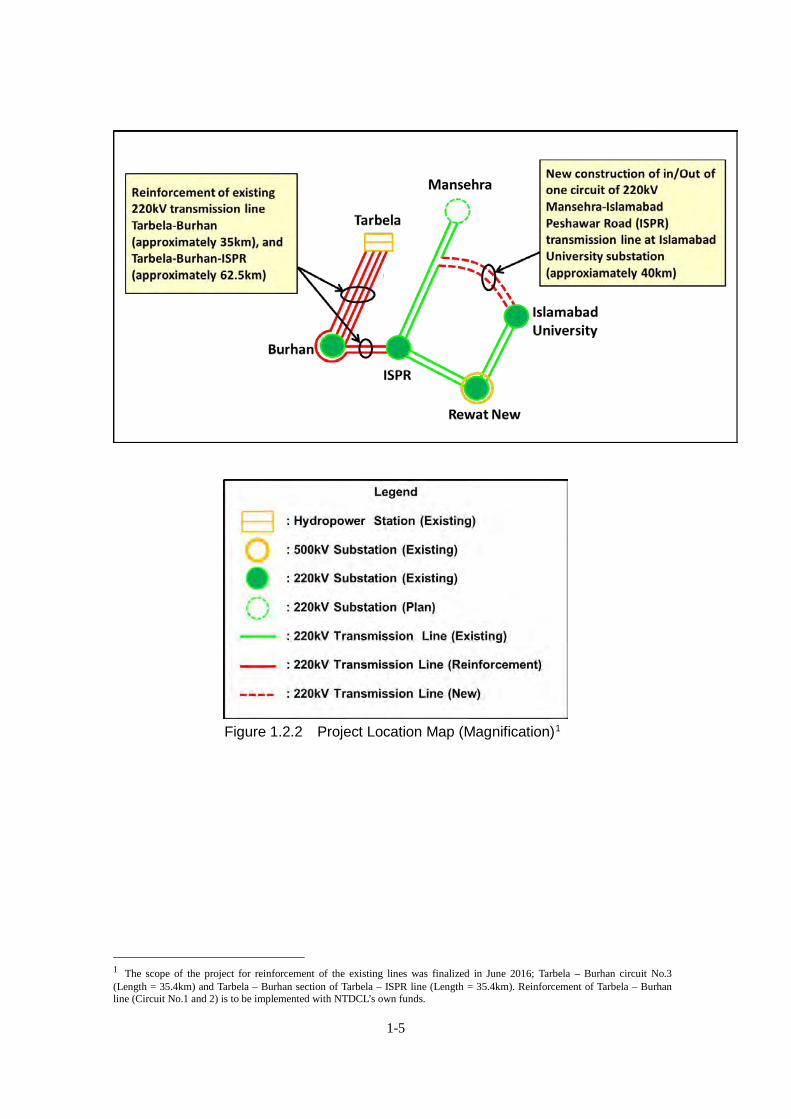
1-5
Figure 1.2.2 Project Location Map (Magnification)1
1 The scope of the project for reinforcement of the existing lines was finalized in June 2016; Tarbela – Burhan circuit No.3 (Length = 35.4km) and Tarbela – Burhan section of Tarbela – ISPR line (Length = 35.4km). Reinforcement of Tarbela – Burhan line (Circuit No.1 and 2) is to be implemented with NTDCL’s own funds.
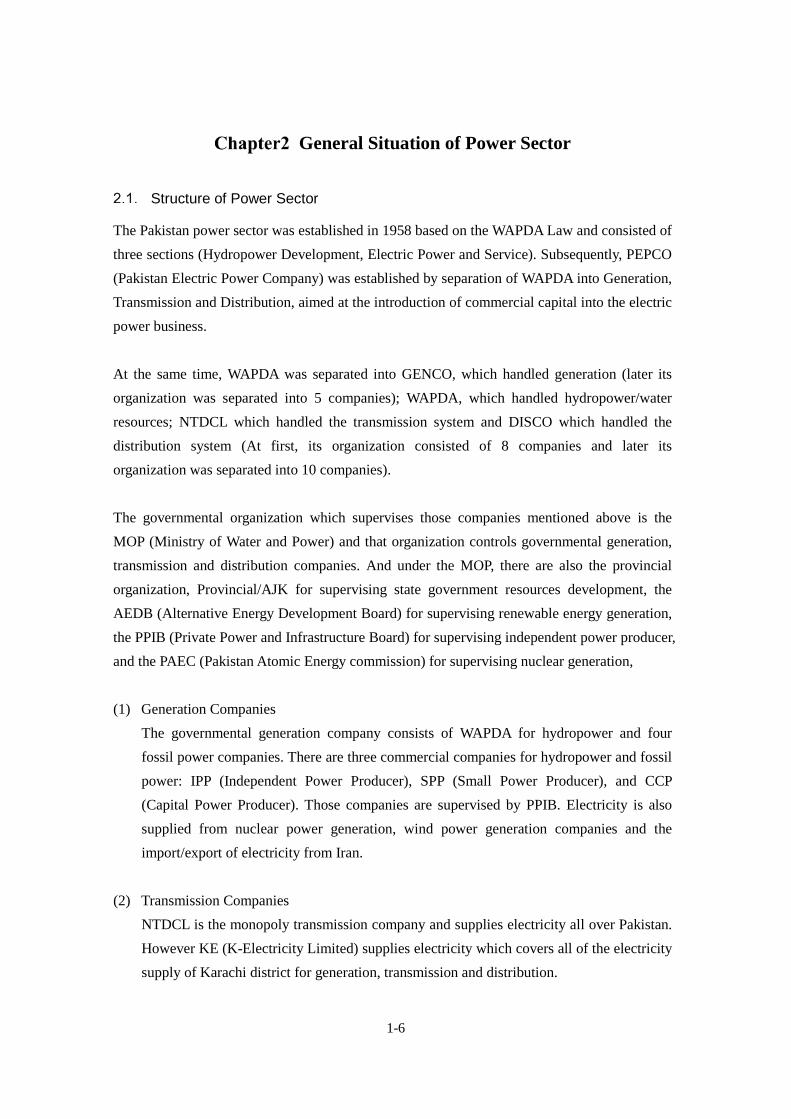
1-6
General Situation of Power Sector
Structure of Power Sector
The Pakistan power sector was established in 1958 based on the WAPDA Law and consisted of three sections (Hydropower Development, Electric Power and Service). Subsequently, PEPCO (Pakistan Electric Power Company) was established by separation of WAPDA into Generation, Transmission and Distribution, aimed at the introduction of commercial capital into the electric power business. At the same time, WAPDA was separated into GENCO, which handled generation (later its organization was separated into 5 companies); WAPDA, which handled hydropower/water resources; NTDCL which handled the transmission system and DISCO which handled the distribution system (At first, its organization consisted of 8 companies and later its organization was separated into 10 companies). The governmental organization which supervises those companies mentioned above is the MOP (Ministry of Water and Power) and that organization controls governmental generation, transmission and distribution companies. And under the MOP, there are also the provincial organization, Provincial/AJK for supervising state government resources development, the AEDB (Alternative Energy Development Board) for supervising renewable energy generation, the PPIB (Private Power and Infrastructure Board) for supervising independent power producer, and the PAEC (Pakistan Atomic Energy commission) for supervising nuclear generation,
(1) Generation Companies The governmental generation company consists of WAPDA for hydropower and four fossil power companies. There are three commercial companies for hydropower and fossil power: IPP (Independent Power Producer), SPP (Small Power Producer), and CCP (Capital Power Producer). Those companies are supervised by PPIB. Electricity is also supplied from nuclear power generation, wind power generation companies and the import/export of electricity from Iran.
(2) Transmission Companies NTDCL is the monopoly transmission company and supplies electricity all over Pakistan. However KE (K-Electricity Limited) supplies electricity which covers all of the electricity supply of Karachi district for generation, transmission and distribution.
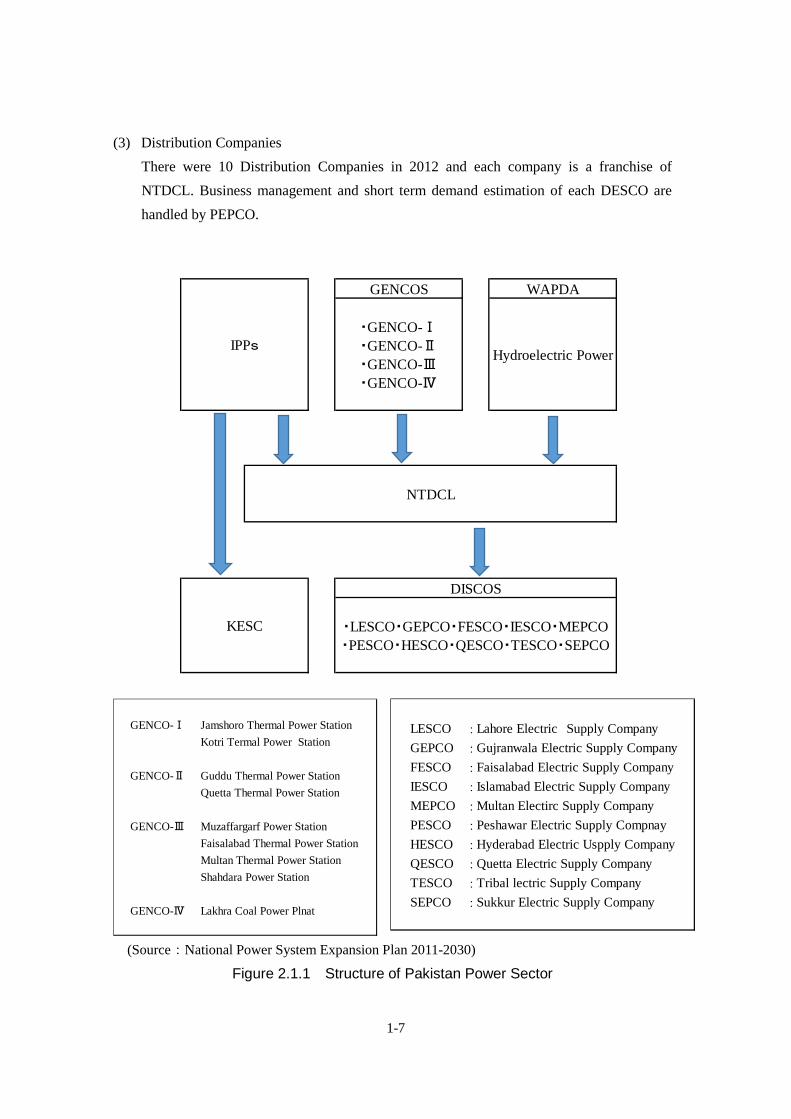
1-7
(3) Distribution Companies There were 10 Distribution Companies in 2012 and each company is a franchise of NTDCL. Business management and short term demand estimation of each DESCO are handled by PEPCO.
(Source:National Power System Expansion Plan 2011-2030)
Figure 2.1.1 Structure of Pakistan Power Sector
GENCO-Ⅰ Jamshoro Thermal Power StationKotri Termal Power Station
GENCO-Ⅱ Guddu Thermal Power StationQuetta Thermal Power Station
GENCO-Ⅲ Muzaffargarf Power StationFaisalabad Thermal Power StationMultan Thermal Power StationShahdara Power Station
GENCO-Ⅳ Lakhra Coal Power Plnat
KESC
DISCOS
・LESCO・GEPCO・FESCO・IESCO・MEPCO・PESCO・HESCO・QESCO・TESCO・SEPCO
IPPs
GENCOS
・GENCO-Ⅰ・GENCO-Ⅱ・GENCO-Ⅲ・GENCO-Ⅳ
WAPDA
Hydroelectric Power
NTDCL
LESCO :Lahore Electric Supply CompanyGEPCO :Gujranwala Electric Supply CompanyFESCO :Faisalabad Electric Supply CompanyIESCO : Islamabad Electric Supply CompanyMEPCO :Multan Electirc Supply CompanyPESCO :Peshawar Electric Supply CompnayHESCO :Hyderabad Electric Uspply CompanyQESCO :Quetta Electric Supply CompanyTESCO :Tribal lectric Supply CompanySEPCO :Sukkur Electric Supply Company

1-8
Government Policy in the Power Sector
Long Term Plan of the Power Sector
In Pakistan, the Long Term National Power Policy (National Power System Expansion Plan 2011-2030) for the Electric Power Sector was settled in 2010. The contents of this plan showed an expansion plan policy to expand electricity supply from power stations to main urban districts. Its contents are shown as below:
・ Identification of technical and economic requirements ・ Determination of the reinforcement in transmission network ・ Fulfilment of the reliability criteria of NTDC Grid Code ・ Determination of the long-term impact on fault levels throughout the transmission
network and to examine mitigation measures
・ Evaluating the transient and dynamic stability of 500 kV high voltage AC system and high voltage DC system
・ Estimation of the economic cost of these reinforcements in a strategic manner
Short Term Plan of Power Sector
In Pakistan, the Short Term National Power Policy for Electric Power Sector was settled in 2013 according to the long term plan, the Electric Power System Expansion Plan, mentioned above. The background is shown in the following: In Pakistan there is a supply-demand gap where the demand for electricity far outstrips supply. There is a 4500 MW-5000 MW gap between electric power supply and electric demand. Therefore load shedding is happening continuously. 44% of generation depends on fossil fuel generation and it causes high tariff of electricity, 23 PKR/kWh. Furthermore, transmission loss is high, 23-24 % and it should be improved to 16 % of target.
The strategic targets by 2017 are shown in the following.
(1) Short Term Target
The Strategic Targets which NTDCL is to meet in 2017 are as shown below.
・ Solving the supply-demand gap of 4500 MW - 5000 MW. ・ Lowering generation cost from 12c / unit to 10c / unit. ・ Lowering total distribution loss from 23-25 % to 16 %.
Raising collection rates from 85 % to 95 %.

1-9
(2) Strategies to meet Short Term Target NTDCL is following the strategies shown below to accomplish the Short Term Targets shown above.
1) Supply Side Strategy
- Building a power generation capacity that can meet Pakistan’s energy needs in sustainable manner.
- Phasing out subsidy for poor residential users over a three-year period. - Bringing existing plants’ capacity on line. - Completing pipeline projects which deliver the fossil fuel supply to power
stations.
2) Demand Side Strategy - Setting energy conservation and product labelling standards - Introducing smart meters that improve collection of electric tariffs - Phasing out subsidies over a period of three years and provide more
expensive electricity to heavy users.
3) Affordable Power Strategy - Shifting tariff incentive towards low cost energy sources. (Hydro, gas, coal,
nuclear, biomass, etc.) - Gas conservation for power sector
4) Supply-chain Strategy
- Redirecting supply of fuel from inefficient GENCOs to the most efficient IPPs.
- Constructing 22 km gas pipeline to stabilise the gas fuel supply chain.
5) Generation Strategy - Providing fuel to efficient plants - Privatizing GENCOs
6) Transmission Strategy
- Reducing current 3.0 % losses to 2.5 % and installing efficient transmission analysis software to optimize transmission lines.
- Expanding high voltage transmission lines.

1-10
- Strengthening 220 kV transmission line rings around large cities to minimize losses.
- Incentivizing the private sectors to make investments in transmission business.
7) Distribution Strategy
- Signing performance contracts with the key stakeholders of distribution companies (DISCOs) to ensure their accountability with respects to effective distribution.
- Using smart meters to develop an online system of monitoring electricity distribution.
- Privatising distribution companies.
8) Financial Efficiency Strategy - Agreeing upon transparent procedure for future billing and collections - Eliminating transmission and distribution theft. - Focusing load-shedding in areas where collections are low and improve
tariff collection.
9) Governmental Strategy - Controlling energy sector with official coordination council between
Ministry of Power, Ministry of Petroleum, Ministry of Finance and the Planning Commission.
- Reforming the structure and regulatory aspects of NEPRA (National Electric Power Regulatory Authority) and so on.
- Restructuring Ministry of Water and Power to strengthen functional expertise.
Policy and Assignment of NTDCL
Obligation of NTDCL
(1) As the Pakistan electric transmission company, NTDCL is responsible for the stable supply of electric power to the customers following the Grid Code.
(2) NTDCL is the main body of Pakistan electric power supply and is responsible for
supplying electricity to the increasing demand of the north and south area of

1-11
Pakistan by 500 kV and 220 kV transmission lines. NTDCL has the hydropower
stations of WAPDA, four fossil power stations (GENCOs: Generation companies),
and has business relations with the commercial fossil power stations (IPP:
Independent Power Producer, SPP: Small Power Producer, CPP: Capital Power
Producer).Then they supply electric power to 10 distribution companies
(DESCOs: Distribution Companies).
Substations and Transmission lines as of November 2015 are shown in Table 2.3.1.
Table 2.3.1 Scope of Substation and Transmission line
(Source: Five Year Expansion Plan of NTDCL, December, 2015)
Assignment of NTDCL
At present, the country is facing the problem of a severe power shortage due to insufficient generation capacity leading to massive load shedding. Further, the power demand of the country is increasing at an average rate of about 5.5 % per annum. Therefore, there is a dire need to add significant bulk power generation in the existing system to overcome the power shortage of the country. For this purpose a generation plan has been prepared on the basis of information provided by the respective bodies for installation of power generation plants. In order to meet the growing electricity demand of the country and to reliably transfer power to the load centres of the country from the power plants soon to come on line, NTDCL has prepared an expansion plan for the next five years. The projects included in this plan have been categorised into the following:

1-12
・ Interconnection transmission lines for evacuation of power from the power plants to respective load centres.
・ New 500 kV & 220 kV Substations along with associated transmission lines to meet the increasing power demand of DISCOs
・ Extension & Augmentation to remove the overloading of existing substations.
The Five Year Expansion Plan is shown as below;
Table 2.3.2 NTDCL Five Year Plan
(Source: Five Year Expansion Plan of NTDCL, December, 2015)
Power System Development Plan formulated by NTDCL in the Project Area and its Surroundings
As of November 2015, according to the “Five Year Expansion & Investment Plan of NTDCL (2015-16 to 2019-20)”, the following system expansion is proposed over the 2019-20 year: 500kV substation: 8 locations, 2,500MVA (11,250MW) 220kV substations: 21 locations, 14,970MVA (13,473MW) 500kV transmission lines: 3,460km 220kV transmission lines: 1,591km Of these, the development plan in the project area and its surroundings are as follows:

1-13
Table 2.4.1 Short Term Plan (Ongoing Development Projects)
No. Name of the
Project
Transformer Augmentation
Capacity (MVA)
PC-I Approval
Date Financing Expected Completion
Augmentation of Existing Grid Stations
1 220kV Burhan 4 x 160 to 4 x 250 21.01.2010 Iranian Loan
1x250 MVA Transformer
Commissioned
2 500kV Rawat 1 x 450 to 1 x 750 21.01.2010 ADB Tr-IV December 2015
(Source: Five Year Expansion & Investment Plan of NTDC (2015-16 to 2019-20), November 2015)
The 500kV Rawat substation reinforcement project was scheduled to be completed in December 2015 in the plan; however, according to the information by ADB as of March 2016, the project has now entered re-bidding status. The modified tender documents have not been submitted to ADB yet. Completion of the project may be delayed until the second quarter in 2019, or the first quarter of 2020. With this delay, there is the concern that an existing 500/220kV transformer (450MVA x 1 unit) may be overloaded even under normal operation conditions. The location of each project is shown at the upper left of the magnification in Figure 2.4.1 .

1-14
(Source: NTDCL Planning Power)
Figure 2.4.1 Project Location Map of Short Term Plan

1-15
Table 2.4.2 Medium Term Plan (Projects Ready for Implementation)
No. Name of the Project Transformer Installation Capacity (MVA)
Construction of Additional
Transmission Line (km)
PC-I Approval
Date Financing Expected
Completion
New Construction of Grid Station and allied Transmission Lines
1 220kV Mansehra Grid Station along with allied Transmission Lines
2 x 250 1 07.04.2011 ADB- Tr-III
December, 2016
220 kV Transmission System Network Reinforcement in Islamabad and Burhan
2
Replacement of existing 220 kV Tarbela-Burhan Double Circuit Transmission Line (35km)
- 138
PC-I approved
principally on
30.09.2015
(Expected donor) 2016-17
3
Replacement of existing 220 kV Tarbela-Burhan-ISPR Double Circuit Transmission Line (62.5km)
4
In/Out of one circuit of 220kV Mansehra-ISPR Double Circuit Transmission Line at Islamabad University Grid Station (40km)
Extension and Augmentation of Grid Station
5
Extension/Augmentation of 220/132kV Rawat substation (2x160 to 2x250 + 1x250)
430 - Approved by
CDWP on 23.09.2014
ADB 2016-17
(Source: Five Year Expansion & Investment Plan of NTDC (2015-16 to 2019-20), November 2015) Both 1) Reinforcement of existing 220kV transmission lines Tarbela-Burhan and Tarbela – Burhan - ISPR and 2) New construction of in/Out of one circuit of 220kV Mansehra-Islamabad Peshawar Road (ISPR) transmission line at Islamabad University substation, the targets of this survey, are included in the Medium Term Plan. The location of each project in Table 2.4.2 is shown at the upper left of the magnification in Figure 2.4.2.

1-16
(Source: NTDCL Planning Power) Figure 2.4.2 Project Location Map of Medium Term Plan
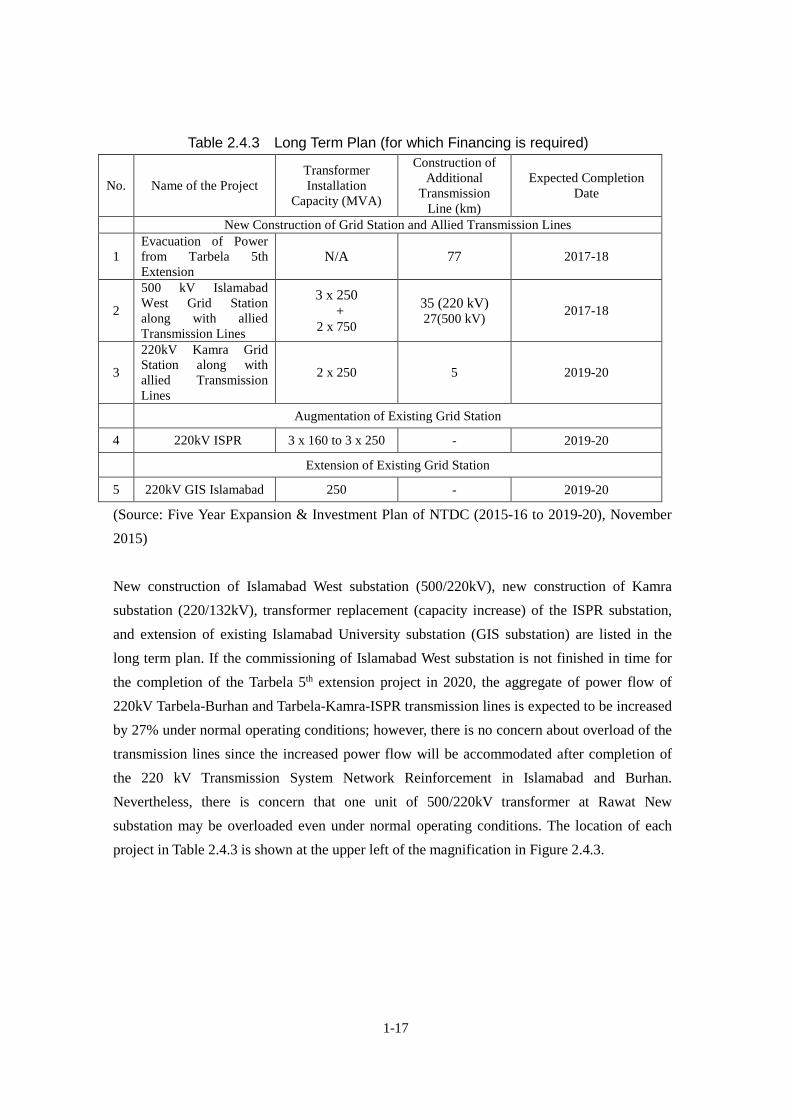
1-17
Table 2.4.3 Long Term Plan (for which Financing is required)
No. Name of the Project Transformer Installation
Capacity (MVA)
Construction of Additional
Transmission Line (km)
Expected Completion Date
New Construction of Grid Station and Allied Transmission Lines
1 Evacuation of Power from Tarbela 5th
Extension N/A 77 2017-18
2 500 kV Islamabad West Grid Station along with allied Transmission Lines
3 x 250 +
2 x 750
35 (220 kV) 27(500 kV) 2017-18
3 220kV Kamra Grid Station along with allied Transmission Lines
2 x 250 5 2019-20
Augmentation of Existing Grid Station
4 220kV ISPR 3 x 160 to 3 x 250 - 2019-20
Extension of Existing Grid Station
5 220kV GIS Islamabad 250 - 2019-20
(Source: Five Year Expansion & Investment Plan of NTDC (2015-16 to 2019-20), November 2015) New construction of Islamabad West substation (500/220kV), new construction of Kamra substation (220/132kV), transformer replacement (capacity increase) of the ISPR substation, and extension of existing Islamabad University substation (GIS substation) are listed in the long term plan. If the commissioning of Islamabad West substation is not finished in time for the completion of the Tarbela 5th extension project in 2020, the aggregate of power flow of 220kV Tarbela-Burhan and Tarbela-Kamra-ISPR transmission lines is expected to be increased by 27% under normal operating conditions; however, there is no concern about overload of the transmission lines since the increased power flow will be accommodated after completion of the 220 kV Transmission System Network Reinforcement in Islamabad and Burhan. Nevertheless, there is concern that one unit of 500/220kV transformer at Rawat New substation may be overloaded even under normal operating conditions. The location of each project in Table 2.4.3 is shown at the upper left of the magnification in Figure 2.4.3.

1-18
(Source: NTDCL Planning Power) Figure 2.4.3 Project Location Map of Long Term Plan
1-19
Trend of other donors in the power transmission field
At present, the main donors working in the electricity sector in Pakistan are the World Bank (WB), the Asian Development Bank (ADB) and the United States Agency for International Development (USAID). They are proceeding with planning and implementation of various projects. It has been confirmed that the Asian Infrastructure Investment Bank (AIIB), which was established mainly by China, has also been active recently, but the details of their activity are unclear. As for transmission and distribution, the projects of the main donors other than are shown the table below. The reinforcement construction of the Rawat substation is a sub-project of Tranche 4 of the Power Distribution Enhancement Investment Program of the ADB in the following table. Incidentally, although they are not as prominent as the large donors listed above, there is also a trend of projects in which the German KfW, the European Investment Bank and the Islamic Development Bank also participate in via co-financing and so on. For example, the World Bank invests 31.5 % in the co-financing of < GHAZI BAROTHA HYDROPOWER PROJECT > of the total of 1.11 billion USD; the ADB invests 27.0 %; JICA invests 25.8 %; the German KfW invests 9.4 %; and European Investment Bank invests 3.2 %, and the Islamic Development Bank invests 3.2 %. These values are from data provided by WAPDA.
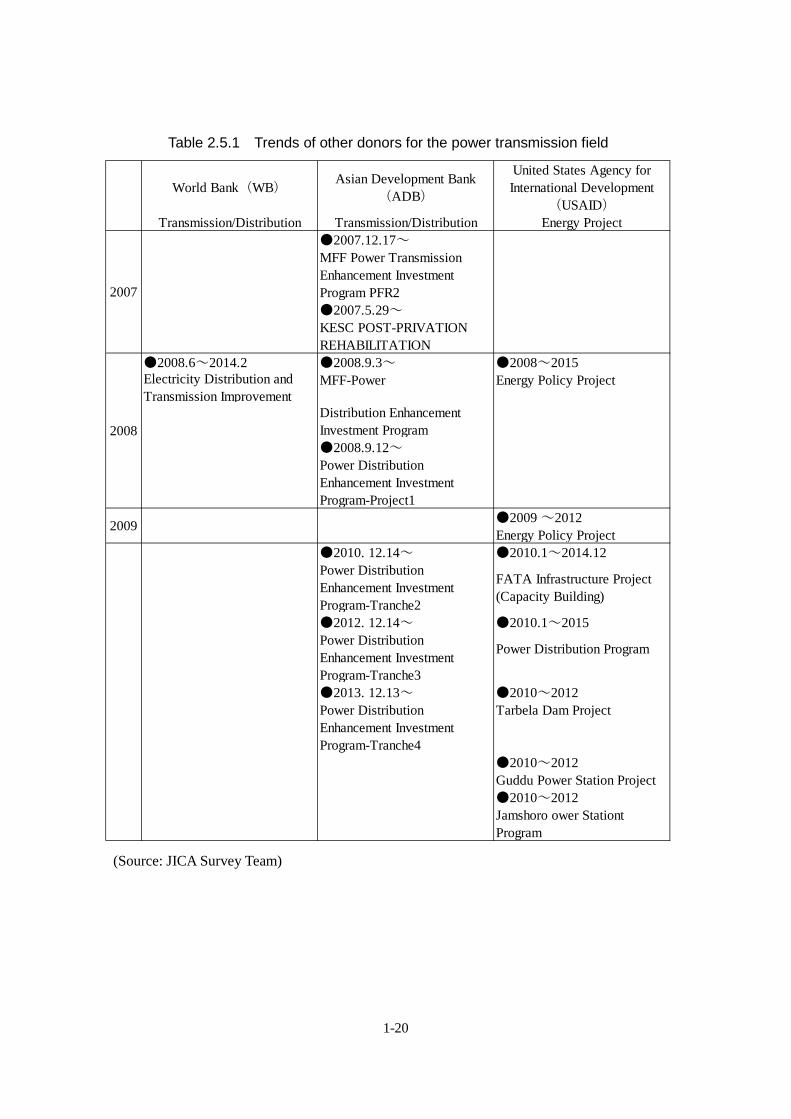
1-20
Table 2.5.1 Trends of other donors for the power transmission field
(Source: JICA Survey Team)
World Bank(WB) Asian Development Bank(ADB)
United States Agency forInternational Development
(USAID)
Transmission/Distribution Transmission/Distribution Energy Project●2007.12.17~MFF Power TransmissionEnhancement InvestmentProgram PFR2●2007.5.29~KESC POST-PRIVATIONREHABILITATION
●2008.6~2014.2 ●2008.9.3~ ●2008~2015Electricity Distribution andTransmission Improvement
MFF-Power Energy Policy Project
Distribution EnhancementInvestment Program●2008.9.12~Power DistributionEnhancement InvestmentProgram-Project1
●2009 ~2012Energy Policy Project
●2010. 12.14~ ●2010.1~2014.12Power DistributionEnhancement InvestmentProgram-Tranche2
FATA Infrastructure Project(Capacity Building)
●2012. 12.14~ ●2010.1~2015Power DistributionEnhancement InvestmentProgram-Tranche3
Power Distribution Program
●2013. 12.13~ ●2010~2012Power DistributionEnhancement InvestmentProgram-Tranche4
Tarbela Dam Project
●2010~2012Guddu Power Station Project●2010~2012Jamshoro ower StationtProgram
2007
2008
2009

1-21
The legal system of NTDCL
The main law about the power transmission company
(1) Environmental Protection Act, 1997 The law which provides for environmental protection in Pakistan by environmental assessments and so on. It is related to this project because the power-transmission wires pass over areas such as a national park.
(2) National Electric Power Regulation Authority Act, 1997 This law governs authorization in case of the establishment and operation of electric power equipment.
(3) National Electric Power Regulation Authority (Tariff Standards and Procedure) Rules, 1998) This is a rule about the electricity tariff standards and procedures.
(4) National Electric Power Regulation Authority Act, 1997 (Fees Pertaining to Tariff Standards and Procedure) Regulations, 2002 This is the law to specify the commission which sets the electricity tariff standards and the authorization procedures.
(5) National Electric Power Regulation Authority Licensing (Distribution) Rules, 1999 These are the rules about the authorization of connections in the electric power sector.
(6) Policy for Power Generation Projects
(7) Regulation of Generation, Transmission and Distribution of Electric Power (Amendment) Ordinance 2009 This regulates licenses in the electric industry. Also, it applies to the connection and terms and conditions such as levies and customs duties on the power supply.
(8) Regulation of Generation, Transmission and Distribution of Electric Power Act, 1997 This is law governing company responsibility, transmission licenses, sales of electric power, the price system of the national grid and so on.
.
1-22
The main law about power-transmission line construction 2
(1) Cantonments Act, 1924 This is the law which is applied to activities in the army bases. The law concerns in part construction activity on the property of the army It is necessary to take this law into consideration because although it is not directly related to the project, in some cases there is in some construction in areas surrounding army property. (2) Pakistan Building Code, 1986 This law is same as the Building Standards Law in Japan and it specifies about the strength design and so on. It prescribes the various standards about the construction of the building to be earthquake-proof and so on. Because there is a direct relation with this project, an assessment of details such as its provisions is necessary. (3) Pakistan Environmental Protection Act, 1997 This is the law which provides for environmental protection in Pakistan by environmental assessments and so on. Then, this law specifies a framework offer for the environmental research (IEE) in the early stages and the implementation of the environmental assessment (EIA) establishment and so on. It requires an environmental assessment when constructing social infrastructure, buildings, and other structures such as skyscrapers, and the approval of Environmental Protection Agency must be acquired. It is related to this project because the power-transmission wire passes over areas such as a national park. (4) National Highway Authority Act, 1991 This is the law which manages national highways (national roads). It provides for the maintenance and the construction on national roads and so on.There is no direct relationship but this project needs to be checked for when power-transmission wire construction crosses an expressway. (5) Pakistan Engineering Council Act, 1976 This law that primarily specifies a Pakistani engineering society (PEC). Also, depending on the scale of the construction of facilities, the builder must be a member under this law. The engineer, the contractor and the management of the construction contract must be members at the time that the project starts operations. (6) Public Procurement Ordinance, 2002
2 JETRO materials from May 2015

1-23
This is the law which specifies the necessary procedures for procurement by official bodies such as government ministries, agencies and local governments. The law governs the procurement by official bodies such as government ministrie, agencies and local governments. This law applies to this project in procurement activities.
Labour laws in Pakistan
(1) The labour standard in Pakistan There is no Labour Standards Law in Pakistan, these are included in the Small-scale Stores Law and the Factory Acts. A comparison with the Labour Standards Law in Japan is shown in the next table.
Table 2.6.1 Labour Standards Act
The item Pakistan JapanShops and Establishment
OrdinanceFactories Act 1934 Labor Standards Act
Working Hours
The upper limit in the working houris 9 hours per day (48 hours perweek) ※ The laborer below 17years old is 7 hours per day (42hours per week)
The upper limit in theworking hour is9 hours perday . however Seasonallaborer ( 10 hours per day ) ※ The laborer below 16years old is 7.5 hours per day
The upper limit in the working houris 8 hours per day (40 hours perweek) ※※It is possible to make it increaseby the discussion with the union.
Rest Periods
The laborer take rest in 30minutes every 5 hours or take 1hour rest every 6 hours.
1 hour for every 6 hours
The laborer below 17 years old is in1 hour for every 3.5 hours. 1 hour for every 8 hours
45 minutes for every 6 hours
The extra wage of theovertime work
The labor wage of the overtime istwice paid compared with beinggeneral.
The labor wage of the overtimeis twice paid compared withbeing general.
It does overtime work below 25 %of - 50 % increase of usual supply.( But, when exceeding 60 hoursper month, it is 50 percent of abovethe increase ).
leave system
The maternity leave ( 6 weeks foreach are given before and behindback and forth of having a baby ).The paid holiday ( 14 days after thecontinuation working of 12 months). The sick leave ( it supplies 8days / a supply at the full amount).The special vacation ( it supplies10 days / a supply at the fullamount ), the festival vacation ( itsupplies the 10th / a supply at thefull amount ) and so on.
The paid holiday ( 14 days afterthe continuation working of 12months ).The sick leave ( itsupplies 16 days / The half ofthe supply ). the specialvacation ( the the 10th / supplyfull amount service ) .thefestival lack vacation ( the day/ the supply full amountservice when the stategovernment specified ) and soon
The maternity leave ( A paidholiday is given for 6 weeks beforebirth and a 8 weeks paid holiday isgiven after having a baby.The paid holiday ( 10 days after thecontinuation working of 6 months).
minimum age for work 15 years old 15 years old 15 years old

1-24
(2) The main law and occupational safety and health standards in Pakistan Pakistan covers this in the following related laws. In Japan, the law about occupational
safety is the Industrial Safety and Health Law and covers most of these.3
1) Mines Act, 1923 2) Workmen's Compensation Act, 1923 3) Dock Laborers Act, 1934 4) Factories Act, 1934 5) Hazardous Occupations Rules, 1963
6) Provincial Employees Social Security Ordinance, 1965 7) West Pakistan Shops and Establishments Ordinance, 1969 8) Provincial Factories Rules
3 International Safety and Health Centre
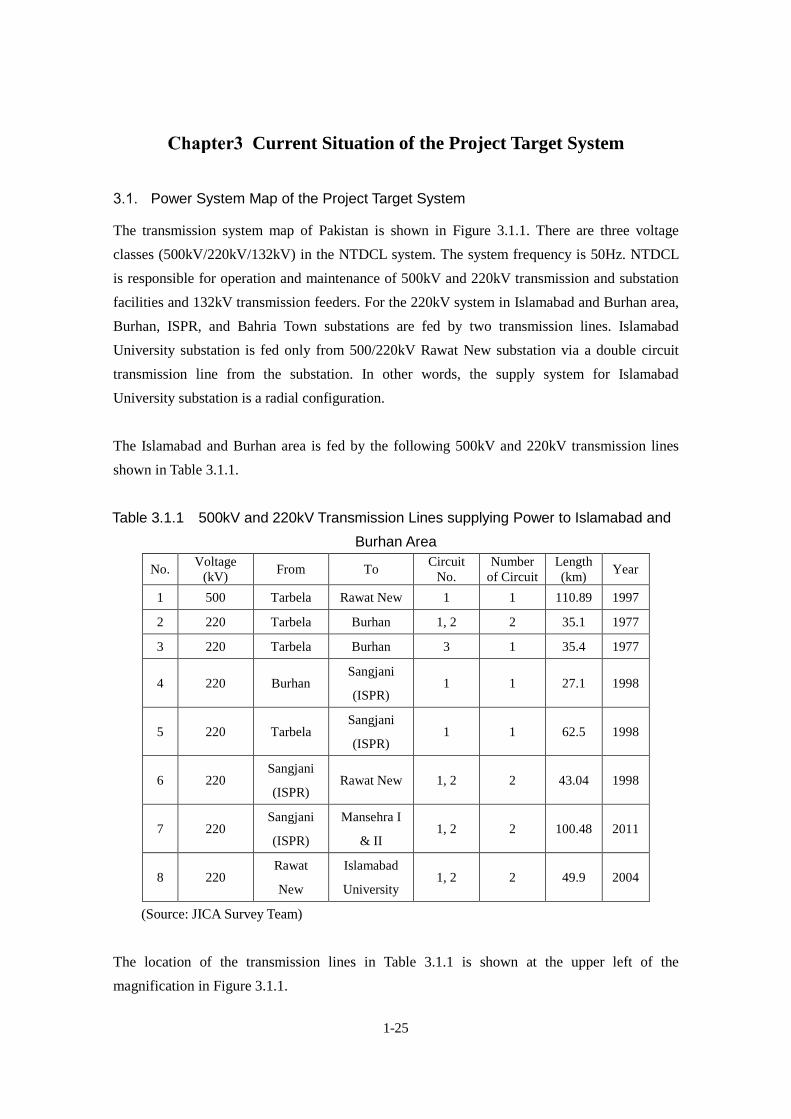
1-25
Current Situation of the Project Target System
Power System Map of the Project Target System
The transmission system map of Pakistan is shown in Figure 3.1.1. There are three voltage classes (500kV/220kV/132kV) in the NTDCL system. The system frequency is 50Hz. NTDCL is responsible for operation and maintenance of 500kV and 220kV transmission and substation facilities and 132kV transmission feeders. For the 220kV system in Islamabad and Burhan area, Burhan, ISPR, and Bahria Town substations are fed by two transmission lines. Islamabad University substation is fed only from 500/220kV Rawat New substation via a double circuit transmission line from the substation. In other words, the supply system for Islamabad University substation is a radial configuration. The Islamabad and Burhan area is fed by the following 500kV and 220kV transmission lines shown in Table 3.1.1.
Table 3.1.1 500kV and 220kV Transmission Lines supplying Power to Islamabad and Burhan Area
No. Voltage (kV) From To Circuit
No. Number
of Circuit Length (km) Year
1 500 Tarbela Rawat New 1 1 110.89 1997
2 220 Tarbela Burhan 1, 2 2 35.1 1977
3 220 Tarbela Burhan 3 1 35.4 1977
4 220 Burhan Sangjani
(ISPR) 1 1 27.1 1998
5 220 Tarbela Sangjani
(ISPR) 1 1 62.5 1998
6 220 Sangjani
(ISPR) Rawat New 1, 2 2 43.04 1998
7 220 Sangjani
(ISPR)
Mansehra I
& II 1, 2 2 100.48 2011
8 220 Rawat
New
Islamabad
University 1, 2 2 49.9 2004
(Source: JICA Survey Team)
The location of the transmission lines in Table 3.1.1 is shown at the upper left of the magnification in Figure 3.1.1.
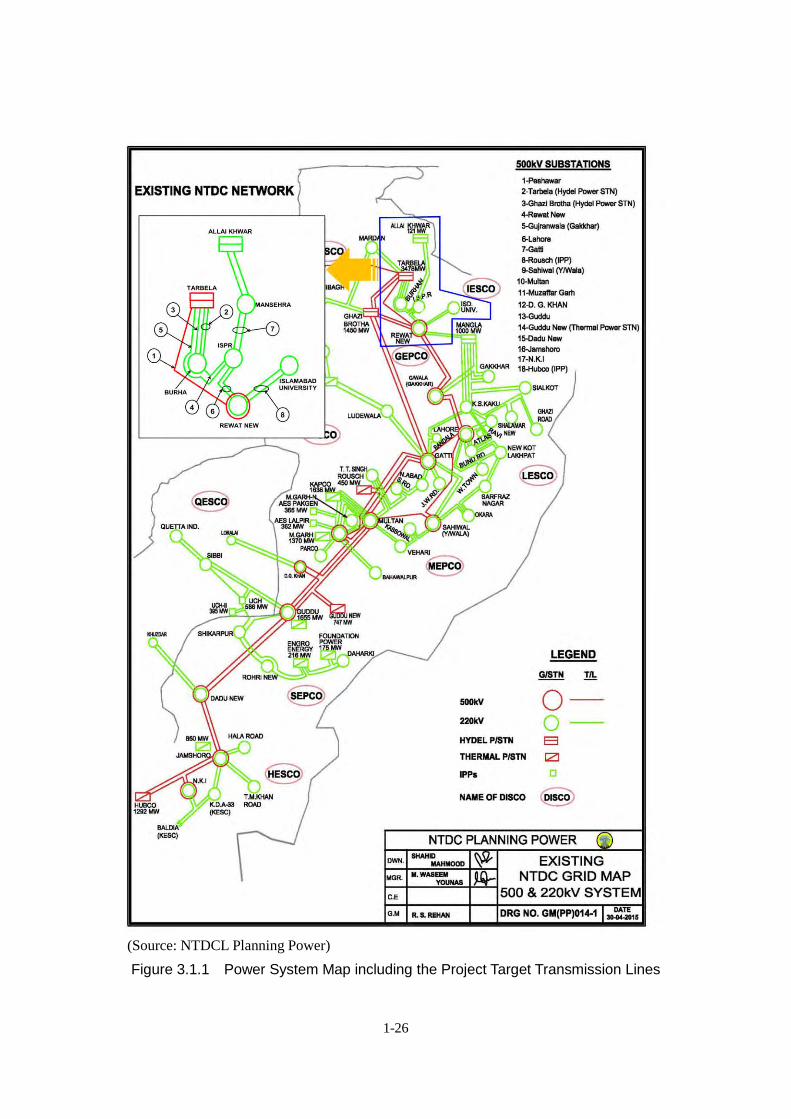
1-26
(Source: NTDCL Planning Power) Figure 3.1.1 Power System Map including the Project Target Transmission Lines
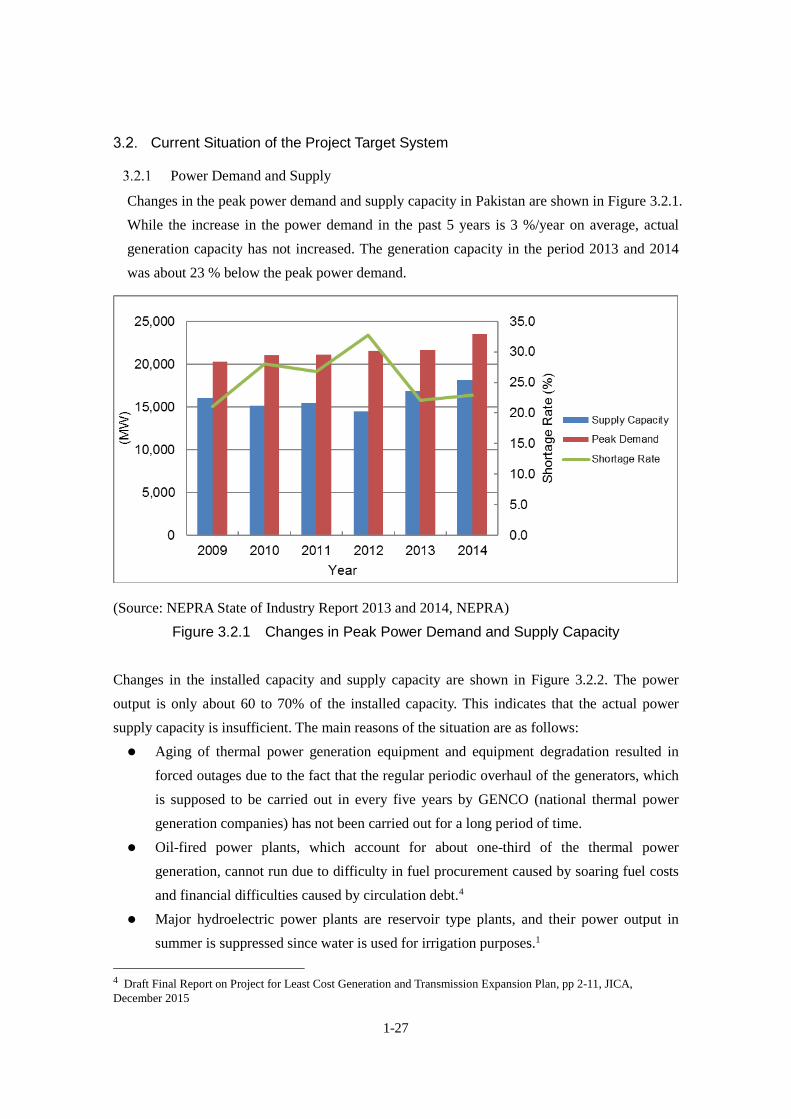
1-27
Current Situation of the Project Target System
Power Demand and Supply
Changes in the peak power demand and supply capacity in Pakistan are shown in Figure 3.2.1. While the increase in the power demand in the past 5 years is 3 %/year on average, actual generation capacity has not increased. The generation capacity in the period 2013 and 2014 was about 23 % below the peak power demand.
(Source: NEPRA State of Industry Report 2013 and 2014, NEPRA) Figure 3.2.1 Changes in Peak Power Demand and Supply Capacity
Changes in the installed capacity and supply capacity are shown in Figure 3.2.2. The power output is only about 60 to 70% of the installed capacity. This indicates that the actual power supply capacity is insufficient. The main reasons of the situation are as follows: Aging of thermal power generation equipment and equipment degradation resulted in
forced outages due to the fact that the regular periodic overhaul of the generators, which is supposed to be carried out in every five years by GENCO (national thermal power generation companies) has not been carried out for a long period of time.
Oil-fired power plants, which account for about one-third of the thermal power generation, cannot run due to difficulty in fuel procurement caused by soaring fuel costs and financial difficulties caused by circulation debt.4
Major hydroelectric power plants are reservoir type plants, and their power output in summer is suppressed since water is used for irrigation purposes.1
4 Draft Final Report on Project for Least Cost Generation and Transmission Expansion Plan, pp 2-11, JICA, December 2015

1-28
(Source: NEPRA State of Industry Report 2013 and 2014, NEPRA)
Figure 3.2.2 Changes in the Installed Capacity and Supply Capacity
Daily Load Curve
The daily load curve on the days when the maximum load was recorded in the summer and winter in 2013 is shown in Figure 3.2.3. During summer, the power demand does not decrease in the middle of the night, and the peak hour is between 20:00 and 22:00. On the other hand, the power demand decreases in the middle of the night during winter, and the peak hour is between 18:00 and 20:00.
(Source: NEPRA State of Industry Report 2014, NEPRA)
Figure 3.2.3 Daily Load Curve on the Days when the Maximum Load was recorded in the summer and winter in 2013

1-29
The daily load curves on both working and non-working days when the maximum load was recorded in summer and winter in 2013 are shown in Figure 3.2.4.
(Source: NEPRA State of Industry Report 2014, NEPRA)
Figure 3.2.4 Daily Load Curves on both Working and Non-working Days when the Maximum Load was recorded in Summer/Winter
Transmission Loss
According to NTDCL Power System Statistics 2014-2015 40th Edition, the transmission loss of the PEPCO system has remained around 3 % in the past 5 years. Changes in the transmission loss are shown in Figure 3.2.5. Pakistan government has set a target to build the state-of-the-art transmission system in the National Power Policy 2013 and National Electric Power Regulatory Authority (NEPRA) set a goal to reduce the transmission loss to 2.5 % as a strategy for optimum power transmission. Since the transmission loss is the Joule heat generated by conductor resistance, the longer becomes the transmission length, the larger becomes the transmission loss. Therefore, it is effective to reduce the current flow of the transmission line by upgrading the operating voltage and to shorten the transmission line length. In the National Power Policy 2013, as transmission loss reduction measures, construction of small and medium-sized power plants located close to the demand centre, expansion of extra-high-voltage transmission network, and development of 220kV loop system in large cities have been listed.

1-30
(Source: Power System Statistics 2014-2015, 40th Edition, Planning Power NTDC)
Figure 3.2.5 Changes in Transmission Loss in PEPCO System
Power Supply Reliability
As the indices of the power supply reliability of the PEPCO system, the transition of the annual number of outages, annual total duration of outages, and maximum duration of any single outage of PEPCO’s 500kV and 220kV system are shown in Figure 3.2.6 to Figure 3.2.8, respectively. A Planned Outage is the outage of the power plant which has been pre-planned well in advance for regular maintenance and inspection, and that suspends the supply of power when the power demand is expected to exceed the supply capacity in order to avoid a large-scale power outage. The latter is exercised by pre-determining the type of customer, date, time, and zone. On the other hand, a Forced Outage is the outage of any power plants and transmission lines without notice resulted from sources such as force majeure, insufficient manpower, shortage of fuel etc., although the power plants and/or transmission lines are due to supply power.

1-31
(Source: NEPRA State of Industry Report 2014, NEPRA) Figure 3.2.6 Annual Number of Outages of PEPCO System
(Source: NEPRA State of Industry Report 2014, NEPRA) Figure 3.2.7 Annual Total Duration of Outage of PEPCO System

1-32
(Source: NEPRA State of Industry Report 2014, NEPRA) Figure 3.2.8 Maximum Duration of Single Outage of PEPCO System
(Source: Power System Statistics 2014-2015, 40th Edition, Planning Power NTDC) Figure 3.2.9 Changes in Length of 500kV and 220kV Transmission Lines

1-33
The annual number of planned outages is the largest for 220kV system. From 2009 to 2011, the number had remained at nearly 500 times/year or so, but has been increasing since 2011 by about 170 times/ year. A similar situation occurred in the 500kV system from the period 2011-12 to 2012-13. As shown in Figure 3.2.9, the circuit length of the 500kV and 220kV transmission lines increased in the same period. From these figures, it is presumed that increase in the number of planned outages resulted from increase in the number of planned power interruptions for construction of 500kV and 220kV transmission lines and substations. As for the forced outages, the number has remained at about 50 to 100 times/year for 500kV system, and 250 to 270 times/year for 220kV system, respectively. The annual total duration of outages of both 500kV and 220kV system due to planned outages has steadily increased since 2009. In terms of forced outages, although there is no regularity for the years in which the annual total duration of outages is long or short, it can be seen that the power outage time for the 220kV system is likely to be longer than that for the 500kV system. For the maximum duration of single outage, 111,815 minutes (2010-11: about 78 days) due to a forced outage of the 220kV system has been recorded up to 2010. In 2011 and beyond, 56,334 min (2012-13: about 40 days) due to a forced outage of the 500kV system has been recorded. Changes in the annual number of outages, annual total duration of outages, and maximum duration of single outage, which are based on the tripping reports/electrical fault data for the project target 220kV transmission lines for the period between 2011 and 2015, are shown in Figure 3.2.10 to Figure 3.2.12, respectively. The annual number of outages, as shown in the figure below, is relatively large in the section between Mansehra and ISPR. Outages occurred especially frequently in the section in question in 2012-2013, reaching 10 times. The main cause of the transmission line trip is a flashover caused by a lightning strike.
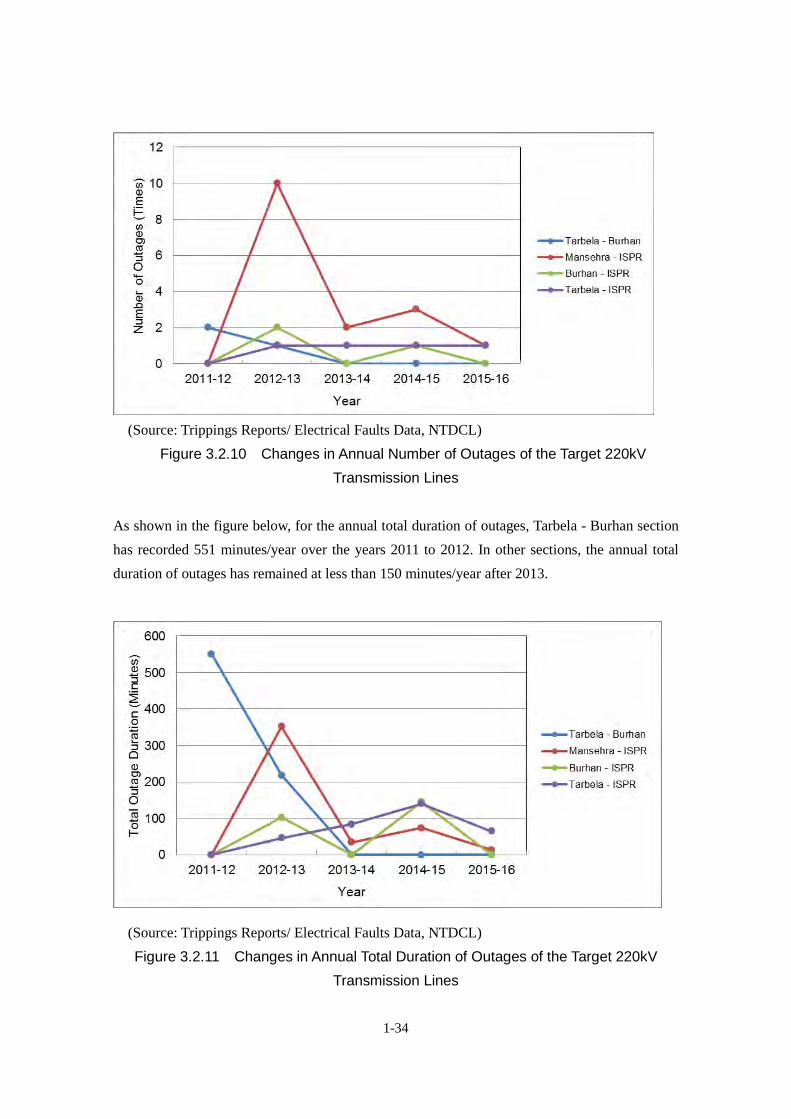
1-34
(Source: Trippings Reports/ Electrical Faults Data, NTDCL)
Figure 3.2.10 Changes in Annual Number of Outages of the Target 220kV Transmission Lines
As shown in the figure below, for the annual total duration of outages, Tarbela - Burhan section has recorded 551 minutes/year over the years 2011 to 2012. In other sections, the annual total duration of outages has remained at less than 150 minutes/year after 2013.
(Source: Trippings Reports/ Electrical Faults Data, NTDCL) Figure 3.2.11 Changes in Annual Total Duration of Outages of the Target 220kV
Transmission Lines

1-35
The maximum duration of a single outage, as shown in the figure below, ranges from a minimum of dozen minutes to a maximum of 290 minutes. This outage occurred to the line No. 2 of the section between Tarbela and Burhan in the year 2011-2012. Breakage of an overhead ground wire between the tower No.4 and No.4 caused the broken wire to drop on the upper phase conductor. It took 290 minutes to recover the transmission line. Besides, it takes from about a dozen of minutes to several tens of minutes for line reclosing in the case of power failure. In NTDCL, when a single line-to-ground fault occurs to the 220kV transmission line, the following reclosing procedure is practiced. a) National Power Control Centre in Islamabad (NPCC) and substations of sending/receiving
ends implement the consultation by telephone. (Time required: 5 to 10 minutes) b) Confirmation of the protection relay display in the substations of the transmission line at
both ends (Time required: 10 to 20 minutes) c) Transmission line reclosing operation (Time required: 10 to 15 minutes) Even if a trip occurred to a certain transmission line, on the tripping record, it is regarded as no power supply failure happened by the trip on the transmission line if the power to the receiving substation is supplied from remaining healthy transmission line sections.
(Source: Trippings Reports/ Electrical Faults Data, NTDCL) Figure 3.2.12 Changes in Maximum Duration of Single Outage of the Target 220kV
Transmission Lines
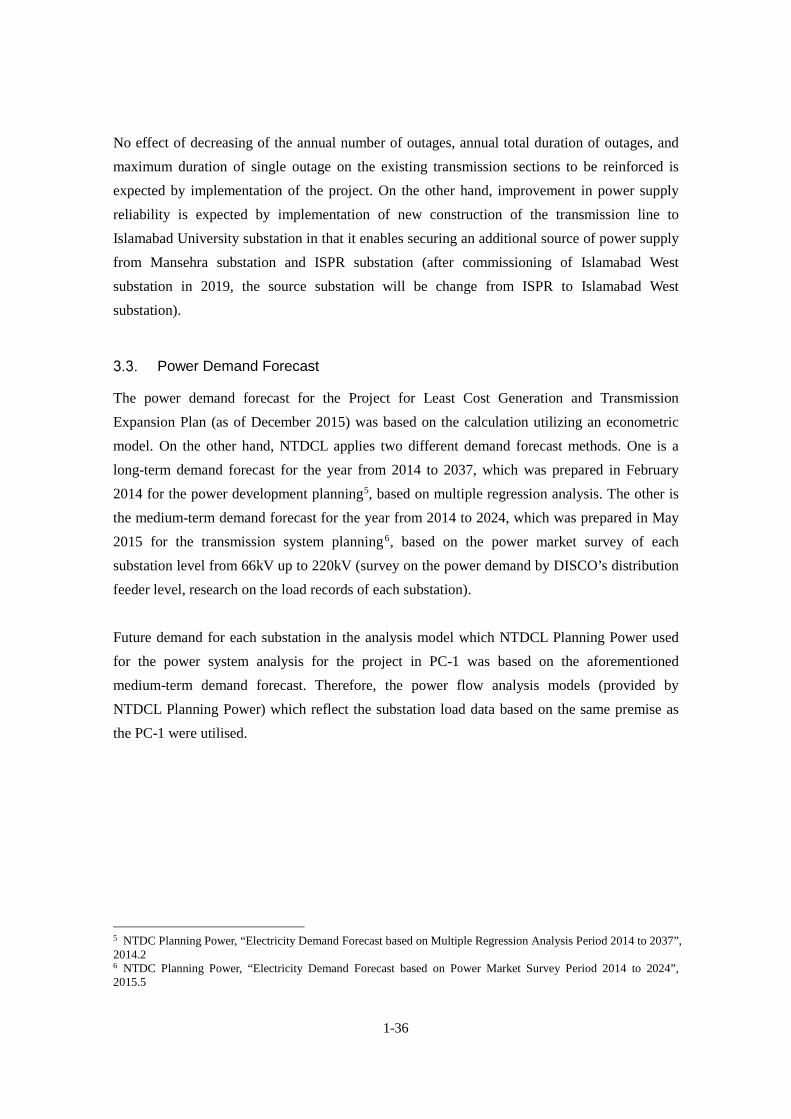
1-36
No effect of decreasing of the annual number of outages, annual total duration of outages, and maximum duration of single outage on the existing transmission sections to be reinforced is expected by implementation of the project. On the other hand, improvement in power supply reliability is expected by implementation of new construction of the transmission line to Islamabad University substation in that it enables securing an additional source of power supply from Mansehra substation and ISPR substation (after commissioning of Islamabad West substation in 2019, the source substation will be change from ISPR to Islamabad West substation).
Power Demand Forecast
The power demand forecast for the Project for Least Cost Generation and Transmission Expansion Plan (as of December 2015) was based on the calculation utilizing an econometric model. On the other hand, NTDCL applies two different demand forecast methods. One is a long-term demand forecast for the year from 2014 to 2037, which was prepared in February 2014 for the power development planning5, based on multiple regression analysis. The other is the medium-term demand forecast for the year from 2014 to 2024, which was prepared in May 2015 for the transmission system planning6, based on the power market survey of each substation level from 66kV up to 220kV (survey on the power demand by DISCO’s distribution feeder level, research on the load records of each substation). Future demand for each substation in the analysis model which NTDCL Planning Power used for the power system analysis for the project in PC-1 was based on the aforementioned medium-term demand forecast. Therefore, the power flow analysis models (provided by NTDCL Planning Power) which reflect the substation load data based on the same premise as the PC-1 were utilised.
5 NTDC Planning Power, “Electricity Demand Forecast based on Multiple Regression Analysis Period 2014 to 2037”, 2014.2 6 NTDC Planning Power, “Electricity Demand Forecast based on Power Market Survey Period 2014 to 2024”, 2015.5
1-37
Survey of Natural Conditions
Meteorological Survey
This is meteorological data for overhead transmission line design in accordance with design data of NTDCL and the Grid Code. Meteorological observation records were collected for the past 10 years from weather observation satellite data observed by NASA and so forth. Items of meteorological observation records are shown as follows; -Temperature (Maximum, Minimum, Average) -Maximum wind velocity -Frequency of lightning strike -Solar radiation
Design Data and Grid Code of NTDCL
The Grid Code (2005) establishes the criteria for appropriate design/operation of Transmission System in NTDCL. Therefore, the design criteria of overhead transmission line shall be according to the Grid Code. Meteorological parameters for design/operation are shown in Table 4.1.1.

1-38
Table 4.1.1 Meteorological Parameters Mentioned in Grid Code(2005)
(Source: The Grid Code 2005, NEPRA)

1-39
Data of Weather Observation Satellite
Weather observation satellite records are shown in Figure 4.1.1 to Figure 4.1.5. In the past record, the Islamabad area was affected by cyclone once. The wind velocity of the cyclone is shown in Table 4.1.2.
(1)Strong Wind Area
Figure 4.1.1 Total Number of Cyclones
Table 4.1.2 Past Record of Cyclones in Pakistan - Total Number of Cyclones Date
Area
Name
Maximum Wind
Velocity
(category)
Damage Situation
2015/04/26 Peshawar Minicyclone 110km/H
(30.6m/s)
Death 44people 、 Injured
200people 、 Property
Damage 、 Damage of
agricultural corp
(Source: AFPBB.com, AFP/A MAJEED 2015/04/27)

1-40
(2)Temperature In accordance with the NASA surface meteorology and solar energy table available at 2016/06/21, the temperature in the area from Tarbela hydropower station to Burhan Grid station has changed as shown in Figure 4.1.2. Regarding the Figure 4.1.2, 35 deg. C of maximum temperature, 7 deg. C of minimum temperature and 24 deg. C of average temperature are obtained.
(Source: NASA surface meteorology and solar energy – available table 2016/06/21)
Figure 4.1.2 Temperature in Tarbela Switch Yard-Islamabad University Grid Station Area
(3) Solar Radiation Solar radiation in Tarbela Power House to Burhan Grid Station is shown in Figure 4.1.3 based on NASA observation database. In accordance with Figure 4.1.3, solar radiation is 0.44~0.84kW/m2.
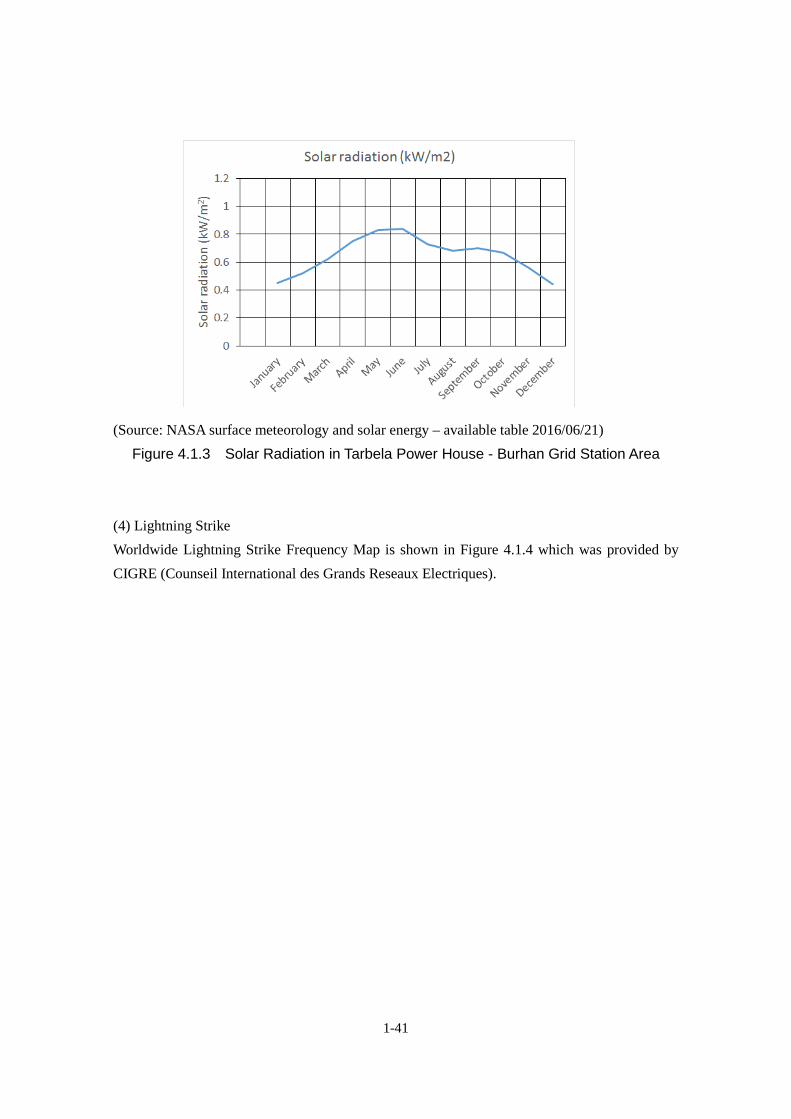
1-41
(Source: NASA surface meteorology and solar energy – available table 2016/06/21) Figure 4.1.3 Solar Radiation in Tarbela Power House - Burhan Grid Station Area
(4) Lightning Strike Worldwide Lightning Strike Frequency Map is shown in Figure 4.1.4 which was provided by CIGRE (Counseil International des Grands Reseaux Electriques).
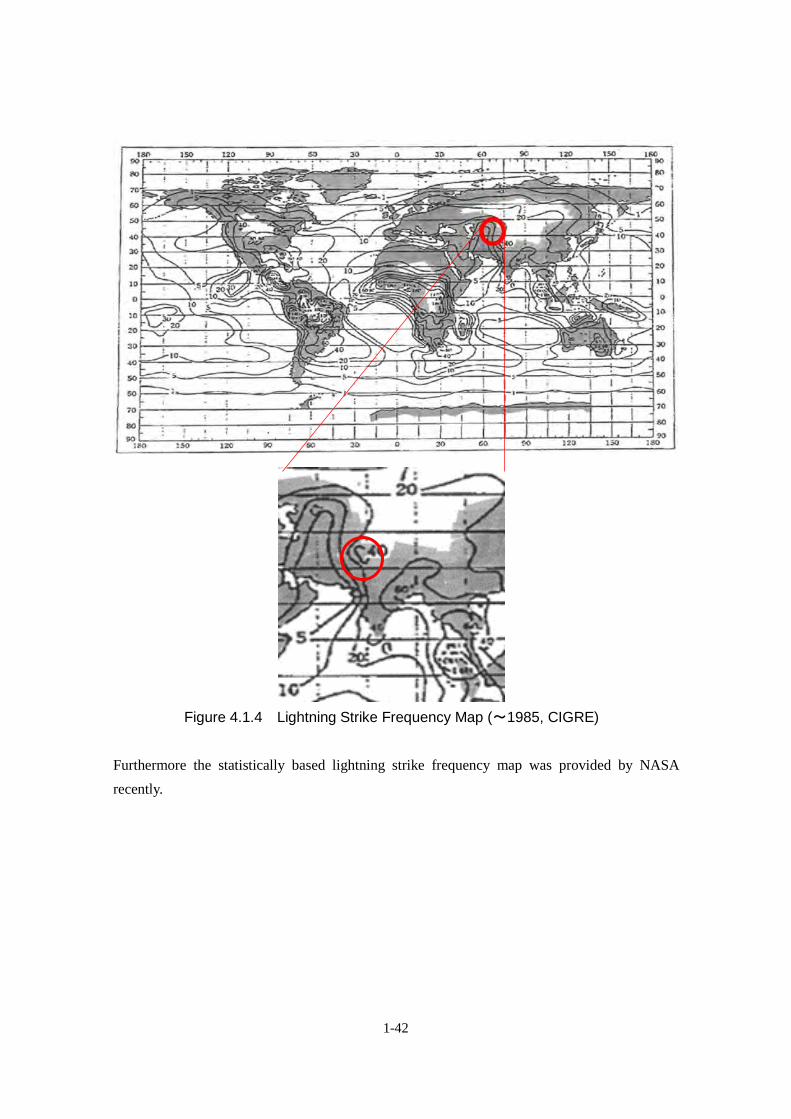
1-42
Figure 4.1.4 Lightning Strike Frequency Map (~1985, CIGRE)
Furthermore the statistically based lightning strike frequency map was provided by NASA recently.
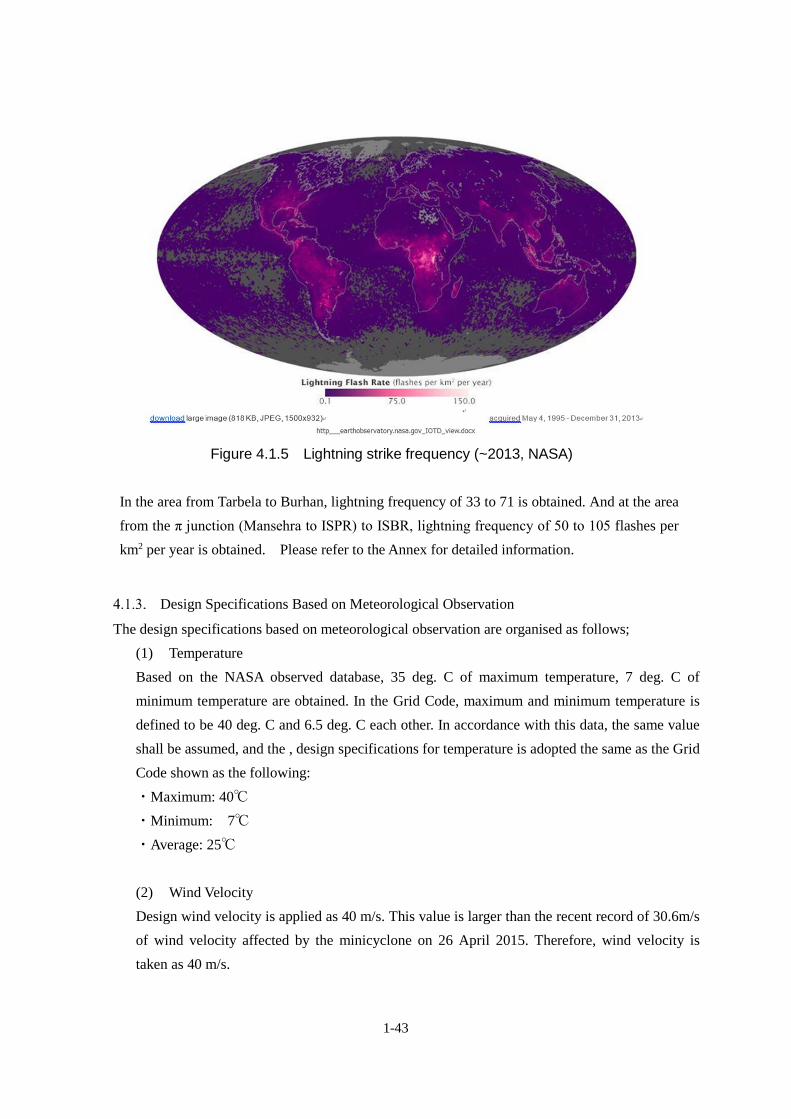
1-43
Figure 4.1.5 Lightning strike frequency (~2013, NASA)
In the area from Tarbela to Burhan, lightning frequency of 33 to 71 is obtained. And at the area from the π junction (Mansehra to ISPR) to ISBR, lightning frequency of 50 to 105 flashes per km2 per year is obtained. Please refer to the Annex for detailed information.
Design Specifications Based on Meteorological Observation
The design specifications based on meteorological observation are organised as follows; (1) Temperature Based on the NASA observed database, 35 deg. C of maximum temperature, 7 deg. C of minimum temperature are obtained. In the Grid Code, maximum and minimum temperature is defined to be 40 deg. C and 6.5 deg. C each other. In accordance with this data, the same value shall be assumed, and the , design specifications for temperature is adopted the same as the Grid Code shown as the following: ・Maximum: 40℃ ・Minimum: 7℃ ・Average: 25℃
(2) Wind Velocity Design wind velocity is applied as 40 m/s. This value is larger than the recent record of 30.6m/s of wind velocity affected by the minicyclone on 26 April 2015. Therefore, wind velocity is taken as 40 m/s.

1-44
(3) Frequency of Lightning Strike The frequency of lightning strike is defined as the average of 32 to 65 (Max. 120) days/year in accordance with the Grid Code. Against the Grid code, at the area from Tarbela to Burhan, lightning frequency of 33 to 71 is obtained and at the area from the π junction (Mansehra to ISPR) to ISBR, lightning frequency of 50 to 105 is obtained in accordance with the NASA observation database. So, these data are lower than or equivalent to the maximum value of 120 defined by Grid Code, observed pointed out maximum value of 70 shall be adopted to the area from Tarbela to Burhan and 120 shall be adopted to the area from π junction (Mansehra to ISPR) to ISBR for the reason of optimising the design of lightning protection countermeasures. (4) Solar Radiation The value of solar radiation was observed as 0.44~0.84kW/m2 by NASA in the solar radiation database. So, for continuous allowable current of electricity, we calculate the value to be 0.04~0.08W/cm2. This value is less than 0.1W/ cm2 that CIGRE recommends. Therefore, solar radiation is taken as 0.1W/cm2. (5) Equivalent Salt Deposit Density (ESDD) In the Grid Code, the ESDD of the three classification areas s determined as shown in Table 4.1.3. The target area of this project is in the north of Guddu.
Table 4.1.3 ESDD of classified 3 area in Pakistan Area ESDD (mg/cm2) Equivarent Clasified area by
IEC60815
South of Jamshoro 1.0 Ⅳ
South of Guddu 0.67 Ⅲ
North of Guddu 0.12 Ⅱ
(Sourve: JICA Survey Team)
Overview of Landform and Terrestrial Formation
Landform
The target area of this project is located on the south edge of the Himalaya, Karakorum and Hindu Kush mountain range. The south side of mountain range is a plain field with altitude of 400m to 600m and this plain field sweeps away radially from the is Indus River and the Haro River. Existing transmission lines (Tarbela-Burhan and Tarbela-ISPR) were placed on the plain field from Tarbela Dam to Burhan G/S and along the relatively flat plain field on the left bank of

1-45
Indus River. On the other hand, the route plan of new transmission line branches off from the existing Mansehra-ISPR line and runs across the Margalla mountain range stretching east to west in the northern part of Islamabad Capital Territory.
(Source: JICA Survey Team)
Figure 4.2.1 Landform of Target Area of Project
Terrestrial Formation
The plain (Q) is a Holocene alluvial formation which contains silt, sand and gravel in alternate layers. These deposited materials were accumulated on an old valley above bedrock. Some parts of deposited material are over 200m deep. The Margalla mountain range (Tep) which is the target area of the new transmission line is mainly Mesozoic, Jurassic and Palaeocene and Eocene limestone with marl and shales. There are faults on the south side of the Margalla mountain range. Their sequence is intricate due to
Tarbela
Burhan G/S
ISPR G/S
Islamabad Univ. G/S

1-46
fault motion and fold effects.
Q
HOLOCENE Unconsolidated surficial deposits of silt, sand, and gravel.
Tep
EOCENE AND PALEOCENE ROCK Shallow marine foraminiferal limestone and grey fossiliferous shales, divided into several formations. Unconformable lower contact with various Mesozoic and Palaeozoic formations, which is marked by laterite, coal, and/or ferruginous / sandstone of Hangu Formation (post-Danian); contains economic coal seams in the Surghar Range and in parts of northern Kohat. Palaeocene rocks above the Hangu Formation include Lockhart Formation (grey shales with subordinate marls and shales) and Patala Formation (grey shales with minor limestone interbeds), contains economic coal seams in the eastern Salt Range and also low-grade coal in parts of the Kala Chitta and Kohat areas. Eocene rocks exhibit many facie changes in different parts, an comprise Nammal Formation (grey marls and shales with subordinate limestone). Sakesar Limestone (cream to grey limestone) and Chorgali Formation (fossiliferous shales and limestone) in the Surghar Range (except Chorgali Formation), Salt Range and subsurface Potwar, it comprises the Margala Hill Limestone (dark grey, ridge-forming limestone), Chorgali Formation (shales and dolomites, mostly unfossiferous) and Kaldana Formation (red shales, with some grey sandstone and limestone: partly estuarine and fluvial). In the Kohat area, in addition to the Bahadur Khel Salt overlain by Jatta Gypsum, other marine sequence includes Panoba Shale, Shekhan Formation (grey
limestone and gypsiferous shales), Kuldana Formation and Kohat Formation (interbedded limestone and shales with abundant foraminifera).
Mz
MESOZOIC ROCKS Include Cretaceous, Jurassic and Triassic rocks: dominantly marine limestone, shales, and sandstone: fossiliferous, mainly ammonoides, foraminifera and bivalves. Cretaceous rocks include Kawagarh Formation (limestone with subordinate marl and shale; late Cretaceous) restricted to the Hazara, Kala Chitta and Kohat areas, Lumshiwal Formation (quartzose and glauconitic sandstone, limestone and shales, Early Cretaceous), and Chichali Formation (glauconitic shale and sandstone, fossiliferous; Early Cretaceous to Late Jurassic). Jurassic sequence include Samana Suk Formation (oolitic, massive limestone with minor shale; Middle Jurassic). Triassic sequence includes Kingraili Formation (dolomites with subordinate limestone; Late Triassic), Tredian Formation (sandstone and shales, Middle Triassic) and Mianwali Formation (limestone, shale and some sandstone; fossiliferous; Early Triassic).
J
JURASSIC ROCKS Jurassic rocks, undifferentiated; includes Samana Suk Limestone (Middle Jurassic), Shinawari Formation (Early Jurassic, Toarcian) and Datta Formation (Early Jurassic). Datta Formation mainly developed in the Trans-Indus Ranges and thins northwards in the Kohat, Kala Chitta and Hazara areas.
(Source: Geological Map of Pakistan、Geological Survey of Pakista) Figure 4.2.2 Terrestrial Formation around Target Area
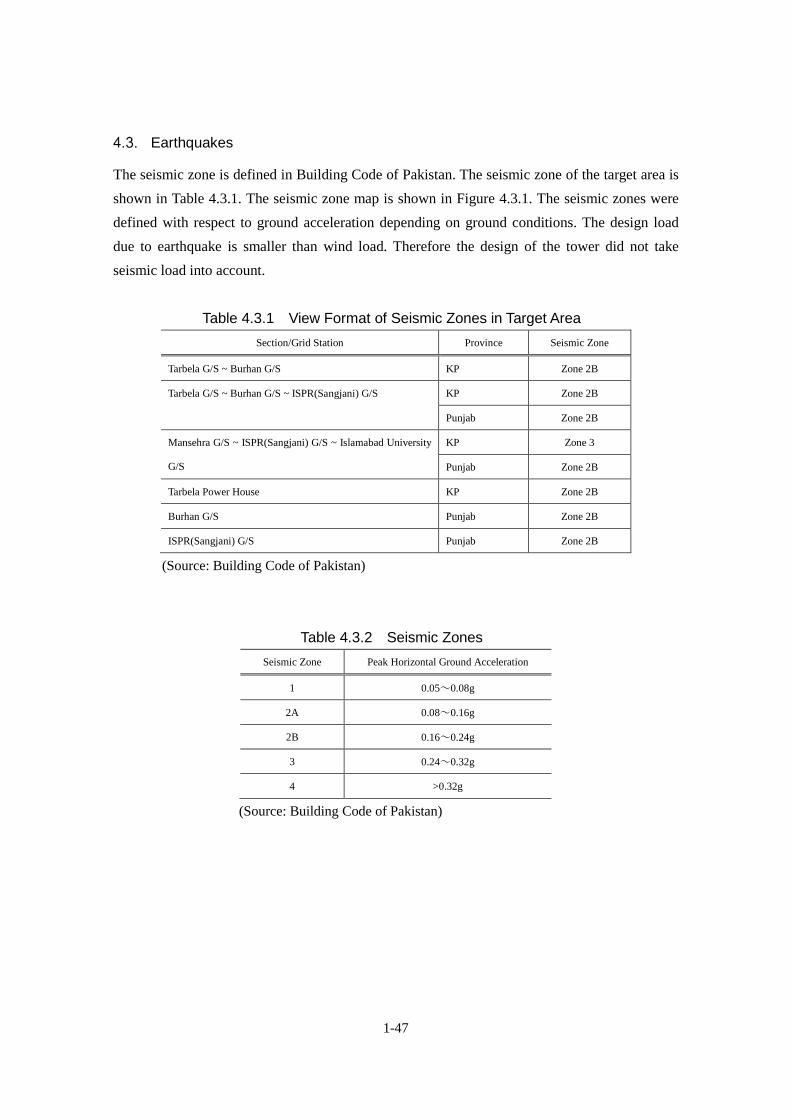
1-47
Earthquakes
The seismic zone is defined in Building Code of Pakistan. The seismic zone of the target area is shown in Table 4.3.1. The seismic zone map is shown in Figure 4.3.1. The seismic zones were defined with respect to ground acceleration depending on ground conditions. The design load due to earthquake is smaller than wind load. Therefore the design of the tower did not take seismic load into account.
Table 4.3.1 View Format of Seismic Zones in Target Area Section/Grid Station Province Seismic Zone
Tarbela G/S ~ Burhan G/S KP Zone 2B
Tarbela G/S ~ Burhan G/S ~ ISPR(Sangjani) G/S KP Zone 2B
Punjab Zone 2B
Mansehra G/S ~ ISPR(Sangjani) G/S ~ Islamabad University
G/S
KP Zone 3
Punjab Zone 2B
Tarbela Power House KP Zone 2B
Burhan G/S Punjab Zone 2B
ISPR(Sangjani) G/S Punjab Zone 2B
(Source: Building Code of Pakistan)
Table 4.3.2 Seismic Zones Seismic Zone Peak Horizontal Ground Acceleration
1 0.05~0.08g
2A 0.08~0.16g
2B 0.16~0.24g
3 0.24~0.32g
4 >0.32g
(Source: Building Code of Pakistan)
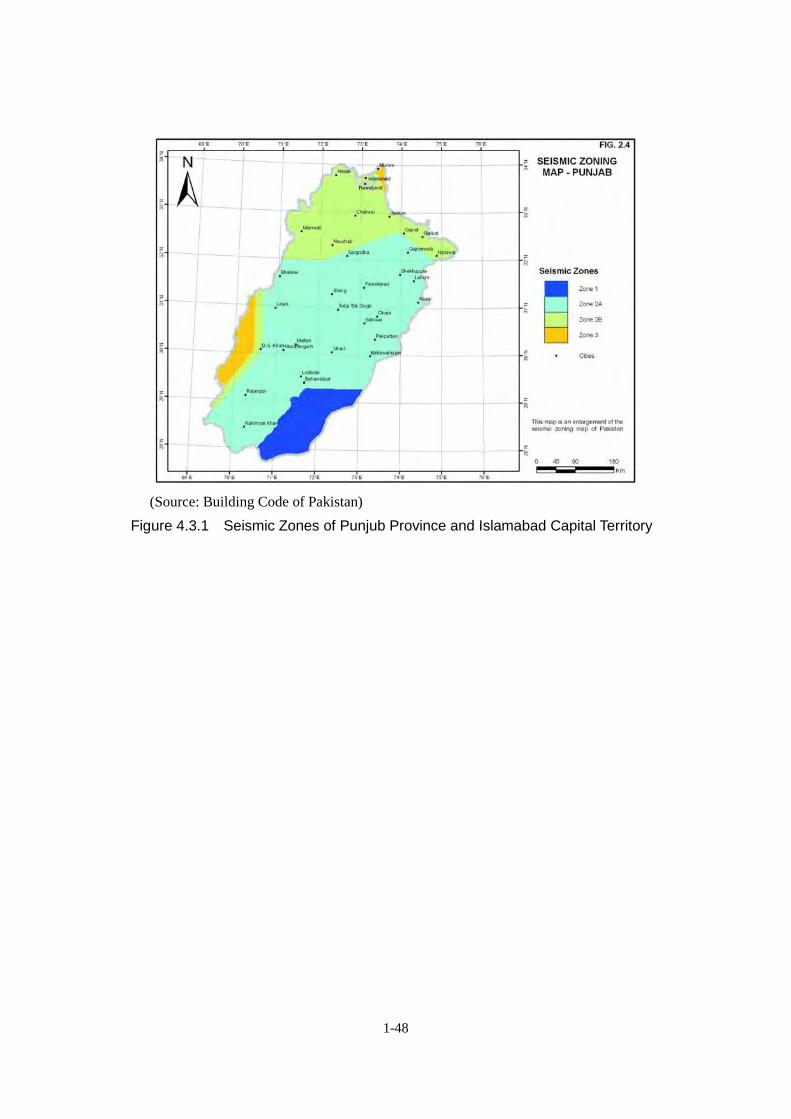
1-48
(Source: Building Code of Pakistan)
Figure 4.3.1 Seismic Zones of Punjub Province and Islamabad Capital Territory

1-49
Social and natural environment
Social Environment in and aroung Project site
Key Indicators of Pakistan and its Provinces
The Islamic Republic of Pakistan is an Islamic country located in south Asia with an area of 796,000 km2 and borders with Afghanistan, China, India and Iran. The total population in 2014 is about 180 million and its population growth rate is about 1.6- 1.8 %. Pakistan is a federal parliamentary republic, consisting of four provinces, the Islamabad Capital Territory and federal territories. Table 5.1.1 shows the key indicators of Pakistan.
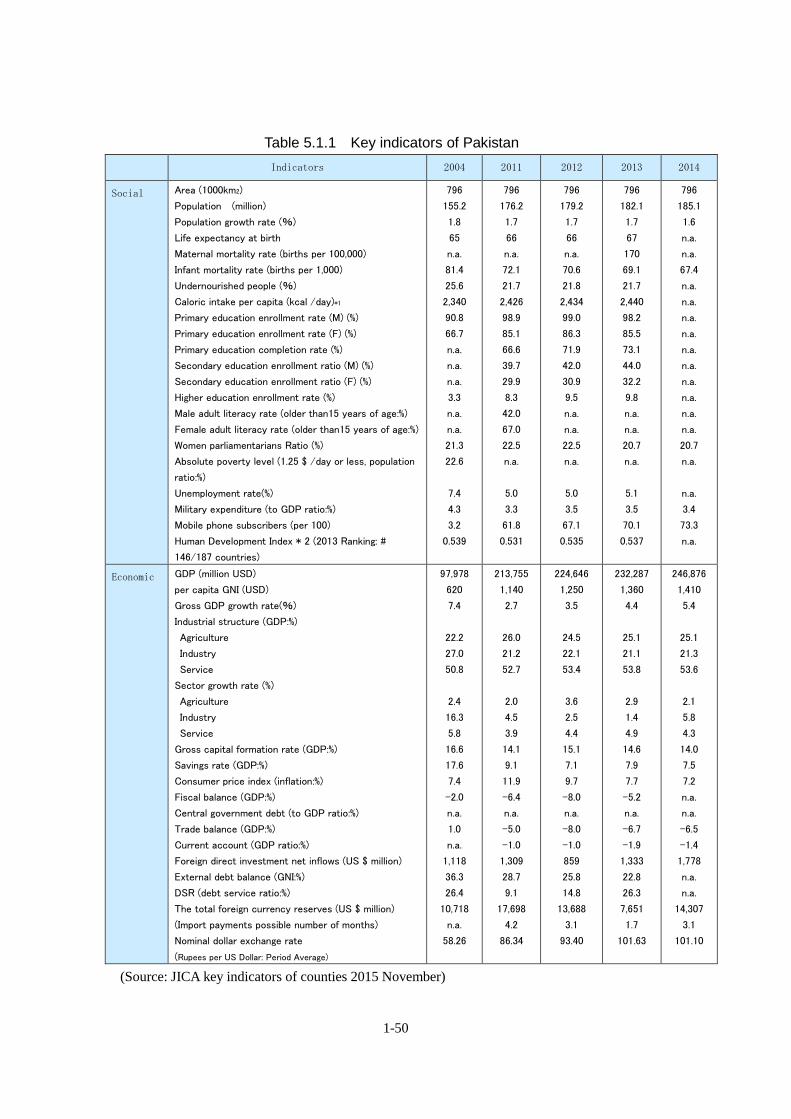
1-50
Table 5.1.1 Key indicators of Pakistan Indicators 2004 2011 2012 2013 2014
Social Area (1000km2)
Population (million)
Population growth rate (%)
Life expectancy at birth
Maternal mortality rate (births per 100,000)
Infant mortality rate (births per 1,000)
Undernourished people (%)
Caloric intake per capita (kcal /day)*1
Primary education enrollment rate (M) (%)
Primary education enrollment rate (F) (%)
Primary education completion rate (%)
Secondary education enrollment ratio (M) (%)
Secondary education enrollment ratio (F) (%)
Higher education enrollment rate (%)
Male adult literacy rate (older than15 years of age:%)
Female adult literacy rate (older than15 years of age:%)
Women parliamentarians Ratio (%)
Absolute poverty level (1.25 $ /day or less, population
ratio:%)
Unemployment rate(%)
Military expenditure (to GDP ratio:%)
Mobile phone subscribers (per 100)
Human Development Index * 2 (2013 Ranking: #
146/187 countries)
796
155.2
1.8
65
n.a.
81.4
25.6
2,340
90.8
66.7
n.a.
n.a.
n.a.
3.3
n.a.
n.a.
21.3
22.6
7.4
4.3
3.2
0.539
796
176.2
1.7
66
n.a.
72.1
21.7
2,426
98.9
85.1
66.6
39.7
29.9
8.3
42.0
67.0
22.5
n.a.
5.0
3.3
61.8
0.531
796
179.2
1.7
66
n.a.
70.6
21.8
2,434
99.0
86.3
71.9
42.0
30.9
9.5
n.a.
n.a.
22.5
n.a.
5.0
3.5
67.1
0.535
796
182.1
1.7
67
170
69.1
21.7
2,440
98.2
85.5
73.1
44.0
32.2
9.8
n.a.
n.a.
20.7
n.a.
5.1
3.5
70.1
0.537
796
185.1
1.6
n.a.
n.a.
67.4
n.a.
n.a.
n.a.
n.a.
n.a.
n.a.
n.a.
n.a.
n.a.
n.a.
20.7
n.a.
n.a.
3.4
73.3
n.a.
Economic GDP (million USD)
per capita GNI (USD)
Gross GDP growth rate(%)
Industrial structure (GDP:%)
Agriculture
Industry
Service
Sector growth rate (%)
Agriculture
Industry
Service
Gross capital formation rate (GDP:%)
Savings rate (GDP:%)
Consumer price index (inflation:%)
Fiscal balance (GDP:%)
Central government debt (to GDP ratio:%)
Trade balance (GDP:%)
Current account (GDP ratio:%)
Foreign direct investment net inflows (US $ million)
External debt balance (GNI:%)
DSR (debt service ratio:%)
The total foreign currency reserves (US $ million)
(Import payments possible number of months)
Nominal dollar exchange rate
(Rupees per US Dollar: Period Average)
97,978
620
7.4
22.2
27.0
50.8
2.4
16.3
5.8
16.6
17.6
7.4
-2.0
n.a.
1.0
n.a.
1,118
36.3
26.4
10,718
n.a.
58.26
213,755
1,140
2.7
26.0
21.2
52.7
2.0
4.5
3.9
14.1
9.1
11.9
-6.4
n.a.
-5.0
-1.0
1,309
28.7
9.1
17,698
4.2
86.34
224,646
1,250
3.5
24.5
22.1
53.4
3.6
2.5
4.4
15.1
7.1
9.7
-8.0
n.a.
-8.0
-1.0
859
25.8
14.8
13,688
3.1
93.40
232,287
1,360
4.4
25.1
21.1
53.8
2.9
1.4
4.9
14.6
7.9
7.7
-5.2
n.a.
-6.7
-1.9
1,333
22.8
26.3
7,651
1.7
101.63
246,876
1,410
5.4
25.1
21.3
53.6
2.1
5.8
4.3
14.0
7.5
7.2
n.a.
n.a.
-6.5
-1.4
1,778
n.a.
n.a.
14,307
3.1
101.10
(Source: JICA key indicators of counties 2015 November)

1-51
Table 5.1.2 shows the basic condition of provinces (Self-governed areas are not in the table). The Project is located in Punjab, KP and Islamabad Capital Territory (ICT). It is a populated area and the basic condition of education and hygiene is relative good within Pakistan.
Table 5.1.2 Key indicators of Pakistan
National Punjab KP Sindh Balochistan
Area km2 205,344 74,521 140,915 347,190
population (million in 2012) 184.35 100.1 28 42.4 7.9 Net primary enrolment ratio ( percent) 57 57 54 52 45
Literacy rate ( percent) 60 60 52 60 44 Under 5 Mortality Rate (Deaths per 1000 Live Births) 89 89 75 112 158
Maternal Mortality Ratio 276 276 275 345 758 Proportion of Population with Access to Improved Water Sources
87 87 82 90 69
Remarks
Largest economy in Pakistan contributing most to the national GDP
Third largest provincial economy in Pakistan
Second Largest economy in Pakistan after Punjab
economy is based on the production of natural gas, coal and other minerals
(Source: MDG status 2012-2013)
Administrative Region
Figure 5.1.1 shows the administrative boundaries of Pakistan and the enlarged view of project area surroundings. The project area is located in Islamabad Capital Territory (ICT), Attok district in Punjab province, Abbottabad and Haripur district in Khyber Pakhtunkhwa province.
Figure 5.1.1 Administrative Regions
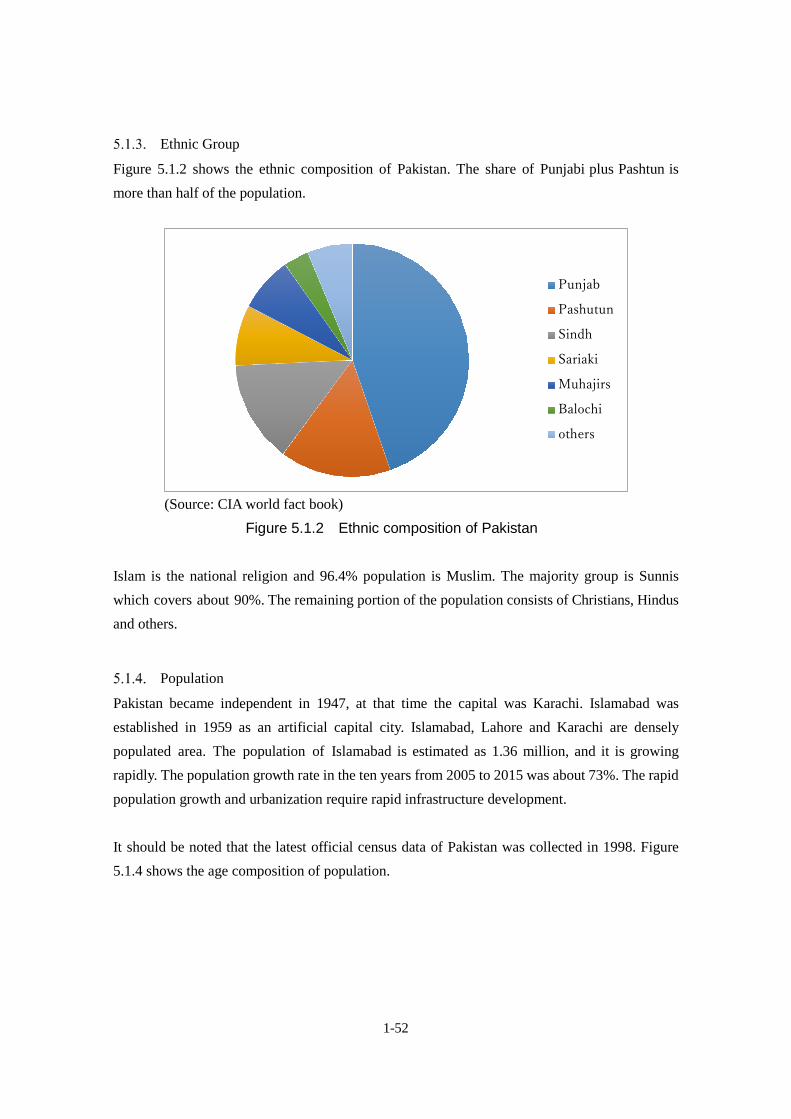
1-52
Ethnic Group
Figure 5.1.2 shows the ethnic composition of Pakistan. The share of Punjabi plus Pashtun is more than half of the population.
(Source: CIA world fact book)
Figure 5.1.2 Ethnic composition of Pakistan
Islam is the national religion and 96.4% population is Muslim. The majority group is Sunnis which covers about 90%. The remaining portion of the population consists of Christians, Hindus and others.
Population
Pakistan became independent in 1947, at that time the capital was Karachi. Islamabad was established in 1959 as an artificial capital city. Islamabad, Lahore and Karachi are densely populated area. The population of Islamabad is estimated as 1.36 million, and it is growing rapidly. The population growth rate in the ten years from 2005 to 2015 was about 73%. The rapid population growth and urbanization require rapid infrastructure development. It should be noted that the latest official census data of Pakistan was collected in 1998. Figure 5.1.4 shows the age composition of population.
Punjab
Pashutun
Sindh
Sariaki
Muhajirs
Balochi
others
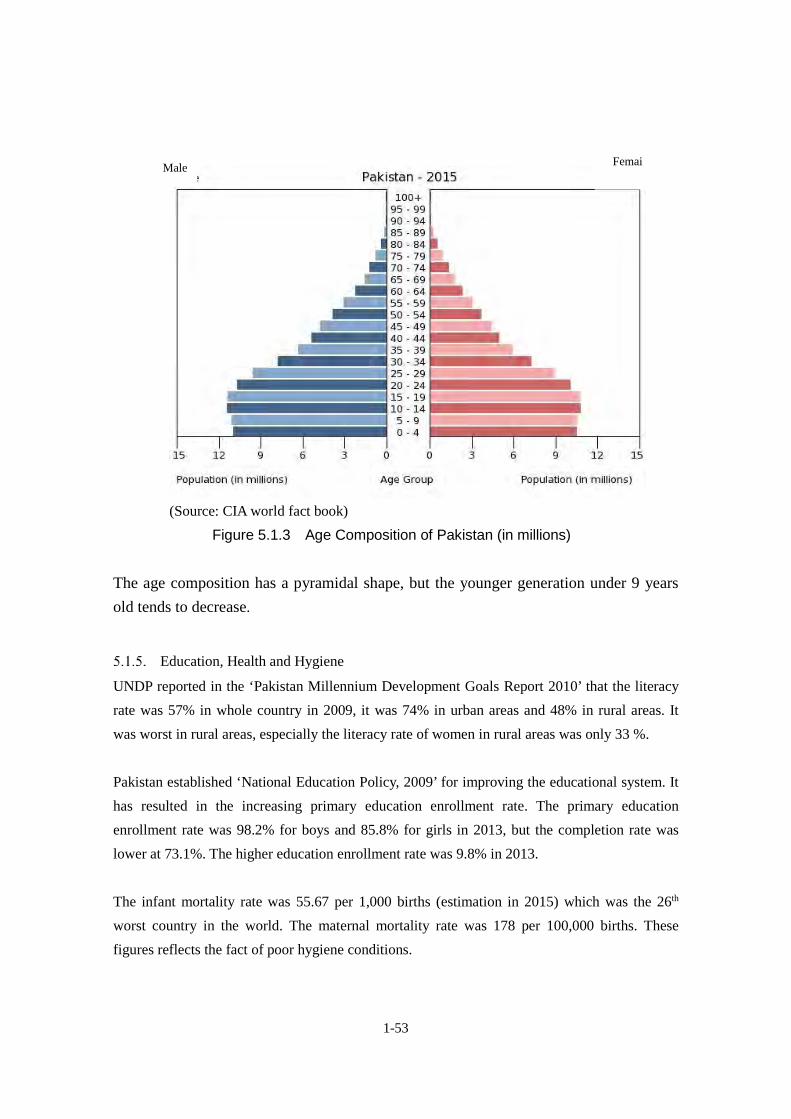
1-53
(Source: CIA world fact book) Figure 5.1.3 Age Composition of Pakistan (in millions)
The age composition has a pyramidal shape, but the younger generation under 9 years old tends to decrease.
Education, Health and Hygiene
UNDP reported in the ‘Pakistan Millennium Development Goals Report 2010’ that the literacy rate was 57% in whole country in 2009, it was 74% in urban areas and 48% in rural areas. It was worst in rural areas, especially the literacy rate of women in rural areas was only 33 %. Pakistan established ‘National Education Policy, 2009’ for improving the educational system. It has resulted in the increasing primary education enrollment rate. The primary education enrollment rate was 98.2% for boys and 85.8% for girls in 2013, but the completion rate was lower at 73.1%. The higher education enrollment rate was 9.8% in 2013. The infant mortality rate was 55.67 per 1,000 births (estimation in 2015) which was the 26th worst country in the world. The maternal mortality rate was 178 per 100,000 births. These figures reflects the fact of poor hygiene conditions.
女性 Male
Femai
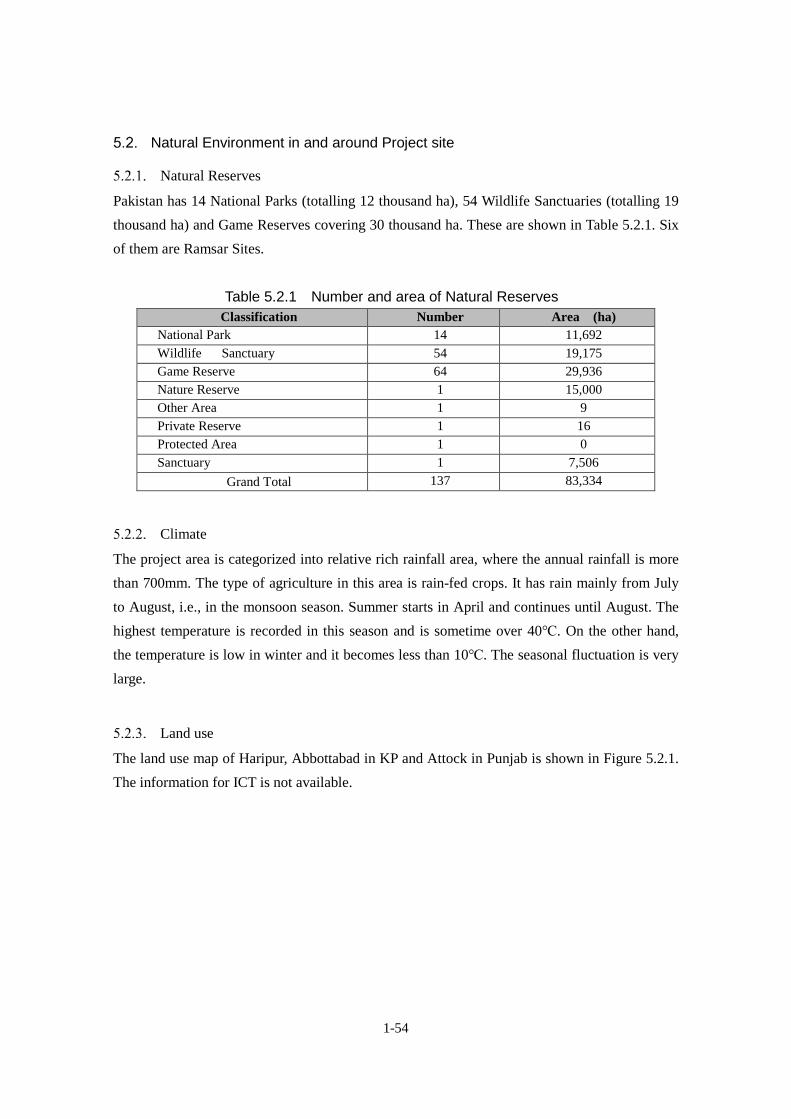
1-54
Natural Environment in and around Project site
Natural Reserves
Pakistan has 14 National Parks (totalling 12 thousand ha), 54 Wildlife Sanctuaries (totalling 19 thousand ha) and Game Reserves covering 30 thousand ha. These are shown in Table 5.2.1. Six of them are Ramsar Sites.
Table 5.2.1 Number and area of Natural Reserves Classification Number Area (ha)
National Park 14 11,692 Wildlife Sanctuary 54 19,175 Game Reserve 64 29,936 Nature Reserve 1 15,000 Other Area 1 9 Private Reserve 1 16 Protected Area 1 0 Sanctuary 1 7,506
Grand Total 137 83,334
Climate
The project area is categorized into relative rich rainfall area, where the annual rainfall is more than 700mm. The type of agriculture in this area is rain-fed crops. It has rain mainly from July to August, i.e., in the monsoon season. Summer starts in April and continues until August. The highest temperature is recorded in this season and is sometime over 40℃. On the other hand, the temperature is low in winter and it becomes less than 10℃. The seasonal fluctuation is very large.
Land use
The land use map of Haripur, Abbottabad in KP and Attock in Punjab is shown in Figure 5.2.1. The information for ICT is not available.
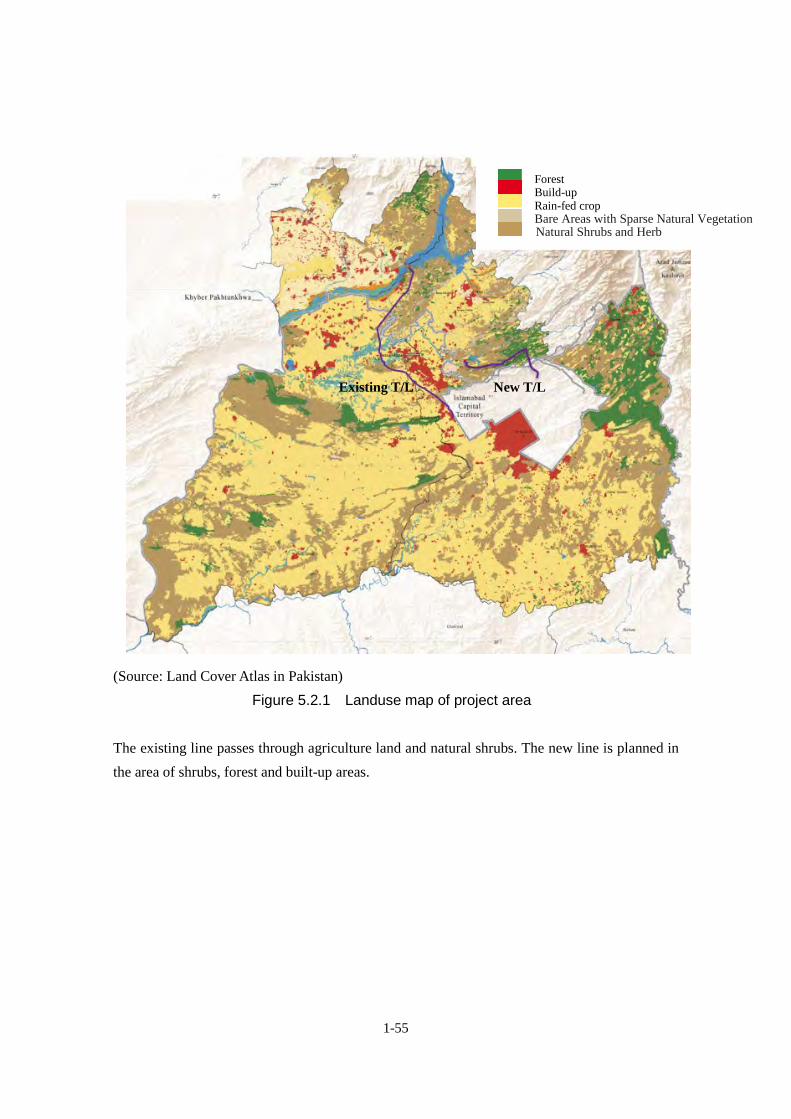
1-55
(Source: Land Cover Atlas in Pakistan)
Figure 5.2.1 Landuse map of project area
The existing line passes through agriculture land and natural shrubs. The new line is planned in the area of shrubs, forest and built-up areas.
Existing T/L New T/L
Forest Build-up Rain-fed crop Bare Areas with Sparse Natural Vegetation Natural Shrubs and Herb

1-56
Environmental and Social Considerations in Pakistan
Institutional and organizational condition of environmental and social considerations in Pakistan
Organization and Policy
The Ministry of Climate Change (MOCC) was established in 2010 to succeed the Ministry of Environment, Local Government and Rural Development and currently is responsible for environmental issues. MOCC has five attached departments shown in Figure 6.1.1. The Pakistan Environment Protection Agency (Pak EPA) is one of the practical departments and responsible for environmental management.
(Source: Website of MOCC) Figure 6.1.1 Attached department of MOCC
Pak EPA manages federal issues and it covers the whole country. On the other hand, each province also has own EPA and the provincial EPA is responsible for environmental issues in the province. The latest national level environmental policy in Pakistan is National Environmental Policy in 2005. There is a National Climate Change Policy (NCCP), which was approved by the cabinet in 2010, but it concerns mainly to climate change countermeasures. The Pakistan Environmental Protection Act (PEPA) is the most powerful legislation of environmental protection. Each province has its own Provincial Environmental Protection Act, and the description of these Acts are almost same as in the federal one. This project is located in Khyber Pakhtunkhwa (KP), Punjab and Islamabad Capital Territory
MOCC
National Disaster Management Authority
Pakistan Environmental Protection Agency
Zoological Survey Department
Pakistan Environmental Protection Council
Pakistan Environmental Planning & Architectural Consultants Ltd.

1-57
(ICT), therefore the confirmation of the regulations and standards of each government is necessary. KP and Punjab are provinces and ICT is a federally governed area.
Legal system for Environmental Impact Assessment
EIA was firstly stated as a necessary procedure for a project which might have environmental impact in the Environmental Protection Ordinance, 1983. In 1994, the government made it obligatory to obtain an approval of an EIA before starting project. This Ordinance was taken over by the PEPA in 1997. In 2000, the government issued the ‘Pakistan Environmental Protection Agency Review of Initial Environmental Examination and Environmental Impact Assessment Regulations, 2000’. ‘Policy and procedures for the filing, review and approval of Environmental assessment, 2000’, and the procedures of EIA and IEE were clearly defined. The guidelines for implementing IEE/EIA are as follows.
1) Guideline for Preparation and Review of Environmental Reports, 1997 2) Guideline for Public Consultation, 1997 3) Guideline for Sensitive and Critical Areas 4) NEQS: National Environmental Quality Standards 5) Sectorial Guidelines for Environmental Reports
The projects requiring IEE/EIA are defined in ‘Pakistan Environmental Protection Agency Review of Initial Environmental Examination and Environmental Impact Assessment Regulations, 2000’. The projects regarding energy sector are summarized in Table 6.1.1.
Table 6.1.1 Projects requiring IEE/EIA in Energy Sector IEE EIA
1. Hydroelectric power generation less than 50 MW
2. Thermal power generation less than 200 KW 3. Transmission lines less than 11 KV, and large
distribution projects 4. Oil and gas transmission systems 5. Oil and gas extraction projects including
exploration, production, gathering systems, separation and storage
6. Waste-to-energy generation projects
1. Hydroelectric power generation over 50 MW 2. Thermal power generation over 200 MW 3. Transmission lines (11 KV and above) and
grid stations 4. Nuclear power plans 5. Petroleum refineries
(Source: Review of Initial Environmental Examination and Environmental Impact Assessment Regulations, 2000)

1-58
This regulation also defines the EIA required project as follows.
• Environmentally Sensitive Areas: All projects situated in environmentally sensitive areas • Other projects
1) Any other project for which filing of an EIA is required by the Federal Agency under sub-regulation (2) of Regulation 5.
2) Any other project likely to cause an adverse environmental effect The flow of IEE/EIA is shown in Figure 6.1.2
(Source: Review of Initial Environmental Examination and Environmental Impact Assessment Regulations, 2000)
Figure 6.1.2 Flow of IEE/EIA procedure A project proponent submits the EIA report to the provincial EPA in the project area. In cases when the project location is in multiple provinces, the proponent should submit the report to each of the respective provinces separately. The location of this project covers three regions including ICT, therefore, NTDCL needed to submit EIA report to Pak-EPA being responsible for federal issues, and Pak-EPA will obtain a NOC (No Objection Certificate) from KP and Punjab for the final decision. Public hearings will be held in both provinces. The days necessary
Public participation
Public hearing Review
Decision
Preliminary scrutiny
Preparation of IEE/EIA report
Submission to EIA
not being earlier than 30 days later
IEE: within 45 days EIA: within 90 days
within 10 working days

1-59
for each step of the approvals are shown in Figure 6.1.2. The period of communication of decision-making is four months from the date of filing report, and approval is given after that period. However, the federal government is able to extend this period in certain cases. Other related regulations are listed in Table 6.1.2.
Table 6.1.2 Acts and Ordinances regarding Environmental and Social Issues Title Contents Responsible authority The Forest Act, 1927 Conservation of vegetation and
habitat of flora and fauna Forest department
Provincial Wildlife (Protection, Preservation, Conservation and Management) Act, Ordinances and Rules
Rules for protection of wildlife Definition of national park, sanctuary etc.
Provincial Wildlife department
Antiquities Act, 1975 Rules for protection of archaeological and historical important place
Department of Archaeology and Museums
Provincial Local Government Ordinances, 2001
Regulations of local government for the protection of land use, natural visitation, ambient air, water, soil from pollution and waste and wastewater, etc.
Provincial local government
Factories Act, 1934 Rules of occupational safety and hygiene
Department of Labor
Land Acquisition Act 1894 Rules for land acquisition Provincial local government (Source: Environmental Impact Assessment Handbook for Pakistan, National Impact Assessment Programme)
Table 6.1.3 shows the National Environmental Quality Standards (NEQS) for several environmental targets. The project should follow these standards in the operation stage as well as during the construction stage.
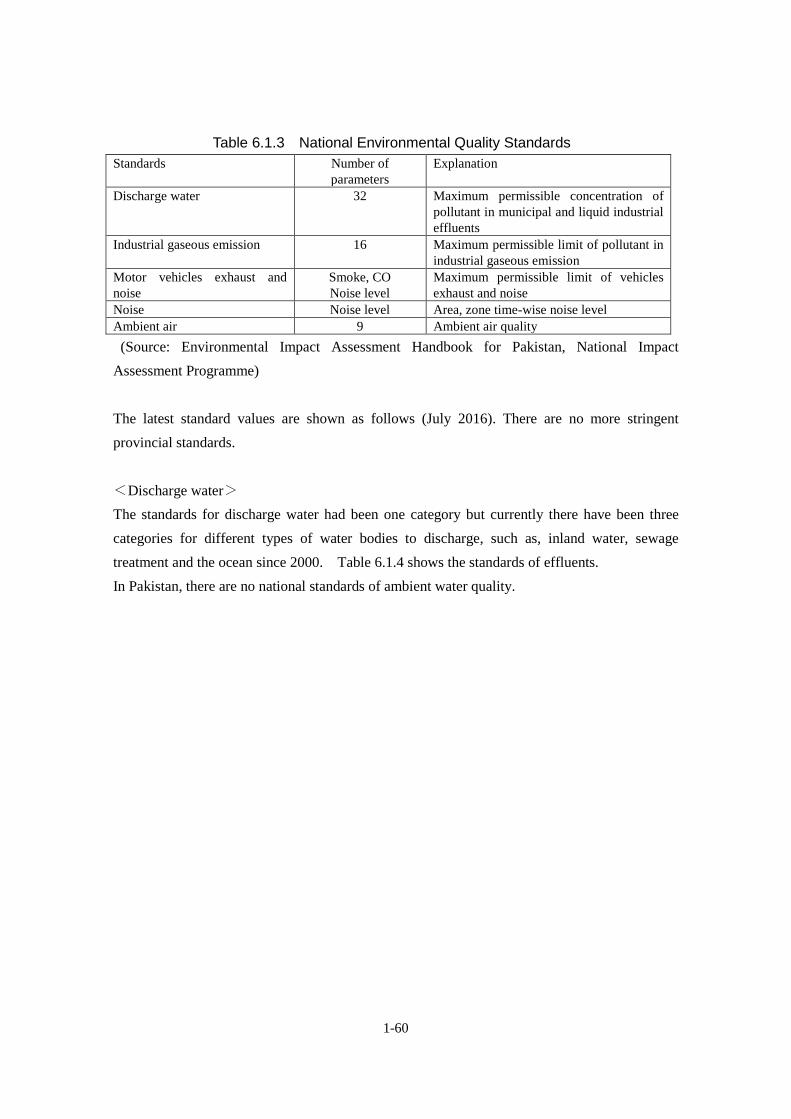
1-60
Table 6.1.3 National Environmental Quality Standards Standards Number of
parameters Explanation
Discharge water 32 Maximum permissible concentration of pollutant in municipal and liquid industrial effluents
Industrial gaseous emission 16 Maximum permissible limit of pollutant in industrial gaseous emission
Motor vehicles exhaust and noise
Smoke, CO Noise level
Maximum permissible limit of vehicles exhaust and noise
Noise Noise level Area, zone time-wise noise level Ambient air 9 Ambient air quality (Source: Environmental Impact Assessment Handbook for Pakistan, National Impact Assessment Programme)
The latest standard values are shown as follows (July 2016). There are no more stringent provincial standards.
<Discharge water> The standards for discharge water had been one category but currently there have been three categories for different types of water bodies to discharge, such as, inland water, sewage treatment and the ocean since 2000. Table 6.1.4 shows the standards of effluents. In Pakistan, there are no national standards of ambient water quality.

1-61
Table 6.1.4 National environmental quality standards for municipal and liquid industrial effluents (mg/l unless otherwise defined)
Parameter
Discharge into
Inland water Sewage treatment Sea
Temperature increase ≤ 3 ℃ ≤ 3 ℃ ≤ 3 ℃ pH 6 - 9 6 - 9 6 - 9 Biological Oxygen Demand BOD 80 250 80 Chemical Oxygen Demand COD 150 400 400 Suspended Solid SS 200 400 200 Total Dissolved Solid TDS 3500 3500 3500 Oil and Grease 10 10 10 Phenolic compounds 0.1 0.3 0.1 Chloride Cl- 1000 1000 SC Fluoride F- 10 10 10 Cyanide CN- 1.0 1.0 1.0 An-ionnic detergents MBAS 20 20 20 Sulphate SO42- 600 1000 SC* Sulphide S2- 1.0 1.0 1.0 Ammonia NH3 40 40 40 Pesticides 0.15 0.15 0.15 Cadmium Ca 0.1 0.1 0.1 Chromium Cr 1.0 1.0 1.0 Copper Cu 1.0 1.0 1.0 Lead Pb 0.5 0.5 0.5 Mercury Hg 0.01 0.01 0.01 Selenium Se 0.5 0.5 0.5 Nickel Ni 1.0 1.0 1.0 Silver Ag 1.0 1.0 1.0 Total toxic material 2.0 2.0 2.0 Zinc Zn 5.0 5.0 5.0 Arsenic As 1.0 1.0 1.0 Barium Ba 1.5 1.5 1.5 Iron Fe 8.0 8.0 8.0 Manganese Mn 1.5 1.5 1.5 Boron B 6.0 6.0 6.0 Chlorine 1.0 1.0 1.0 *SC: Discharge concentration at or below concentration in the ocean (Source: Gazette of Pakistan Extraordinary S.R.O. 549 (I)/2000 Annex-I)

1-62
<Standards for Industrial Gaseous Emission> Industrial Gaseous Emission was revised in 2000.
Table 6.1.5 National environmental quality standards for industrial gaseous emissions Parameter Source Standard (mg/Nm3)
1 Smoke Smoke capacity not to exceed 40% or 2 Ringlemann Scale or equivalent smoke number
2 Particulate matter
Boilers and Furnaces 1 Oil fired 300 2 Coal fired 500 3 Cement Kilns 300 Gliding, crushing, Clinker coolers and related processes, matallurgical processes, converter, blast furnaces and cupolas
500
3 Hydrogen Chloride Any 400 4 Chlorine Any 150 5 Hydrogen Fluoride Any 150 6 Hydrogen Sulphide Any 10
7 Sulphur Oxides
Sulphric acid/sulphonic acid plant,
Other plants except power plants operating on oil and coal
1700
8 Carbon Monoxide Any 800 9 Lead Any 50 10 Mercury Any 10 11 Cadmium Any 20 12 Arsenic Any 20 13 Copper Any 50 14 Antimony Any 20 15 Zinc Any 200
16 Oxide of Nitrogen
Nitric acid manufacturing unit. 3000
Other plants except power plants operating on oil and coal
1 Gas fired 400 2 Oil fired 600 3 Coal fired 1200
(Source: Gazette of Pakistan Extraordinary S.R.O. 549 (I)/2000 Annex-II)

1-63
<Motor vehicle exhaust > Table 6.1.6 shows the standards for motor vehicle exhaust and noise revised in 2009.
Table 6.1.6 National environmental quality standards for motor vehicle exhaust and noise
For vehicles in use
Parameter Standard (Maximum permissible limit) Measuring method
Smoke 40% or 2 on the Ringlemann Scale
during engine acceleration mode
To be compared with Ringlemann Chart at a
distance of 6m or more
Carbon
monoxide 6%
Under idling conditions: Non-dispersive
infrared detection through gas analyzer
Noise 85dB (A) Sound-meter at 7.5 m from the source
For new vehicle Type of vehicle Category/class Tier CO HC+NOx PM
Passenger cars M 1 Pak-II IDI 1 0.7 0.08
Pak-II DI 1 0.9 0.1
Light Commercial vehicles NI-I Pak-II IDI 1 0.7 0.08
Pak-II DI 1 0.9 0.1
NI-II Pak-II IDI 1.25 1 0.12
Pak-II DI 1.25 1.3 0.14
NI-III Pak-II IDI 1.5 1.2 0.17
Pak-II DI 1.5 1.6 0.2
(Source: Gazette of Pakistan Extraordinary S.R.O. 72(KE)/2009)
<Noise> The standards for noise are enacted in 2010 (Table 6.1.7).
Table 6.1.7 National environmental quality standards for noise
Category of Area/ Zone Limit in dB(A) Leq daytime (6:00~22:00) nighttime (22:00~6:00)
Residential area A 55 45 Commercial area B 65 55 Industrial area C 75 65 Silence Zone D 50 45 (Source: Gazette of Pakistan Extraordinary S.R.O. 1064 (I)/2010)

1-64
<Ambient air quality> The standards for the ambient air quality were published in the official gazette in 2010. Table 6.1.8 shows the standards which have been effective after 2013.
Table 6.1.8 National environmental quality standards for noise
Parameter Time- weighted average
Standard Unit Method of measurement
Sulphur Dioxide SO2 Annual 80 μg/m3 Ultraviolet fluorescence method 24 hours 120 μg/m3
Oxides of Nitrogen NO Annual 40 μg/m3 gas phase chemiluminescence 24 hours 40 μg/m3
Oxides of Nitrogen NO2 Annual 40 μg/m3 gas phase chemiluminescence 24 hours 80 μg/m3
Ozone O3 1 hour 130 μg/m3 Non dispersive UV absorption
Particulate matter SPM Annual 360 μg/m3 High volume 24 hours 500 μg/m3 Sampling
Respirable particulate matter PM10 Annual 120 μg/m3 β-ray absorption 24 hours 150 μg/m3
Respirable particulate matter PM2.5
Annual 15 μg/m3 β-ray absorption 24 hours 35 μg/m3
1 hour 15 μg/m3
lead Pb Annual 1 μg/m3 ASS 24 hours 1.5 μg/m3
Carbon monoxide CO 8 hours 5 mg/m3 Non Dispersive Infra Red 1 hour 10 mg/m3
(Source: Gazette of Pakistan Extraordinary S.R.O. 1062 (I)/2010)
Pakistan is party to following international agreements.
Convention on Biological Diversity United Nations Framework Convention on Climate Change Kyoto Protocol to the United Nations Framework Convention on Climate Change Convention on International Trade in Endangered Species of Wild Fauna and Flora United Nations Convention to Combat Desertification Convention on the Prohibition of Military or Any Other Hostile Use of
Environmental Modification Techniques Basel Convention on the Control of Transboundary Movements of Hazardous Wastes
and their Disposal United Nations Convention on the Law of the Sea Convention on the Prevention of Marine Pollution by Dumping of Wastes and other
Matter

1-65
Vienna Convention for the Protection of the Ozone Layer International Convention for the Prevention of Pollution from Ships, 1973, as
modified by the Protocol of 1978 relating thereto Convention on Wetlands of International Importance Especially as Waterfowl
Habitat Marine Life Conservation
Environmental protection in Pakistan is conducted in each province by means of provincial regulations and laws. There are provincial wildlife acts and ordinances which stipulate how to manage and protect national parks, sanctuaries and game reserves. The acts and ordinances which the project needs to consider are as follows (Note: North-West Frontier Province is old name of KPK before 2010).
ICT: Islamabad Wildlife (Protection, Preservation, Conservation and Management) Ordinance, 1979
Punjab: Punjab Wildlife (Protection, Preservation, Conservation and Management) Act, 1974
KP: North-West Frontier Province Wildlife (Protection, Preservation, Conservation and Management) Act, 1975
The description of protected areas in these acts and ordinance are shown below. There is no significant difference among these acts and ordinances.
Wildlife Sanctuary 1) With a view to securing undisturbed breeding of wildlife, the (Federal) Government may,
by notification in the official Gazette, declare any area to be a wildlife sanctuary. 2) Subject to rules, the wildlife sanctuary shall be closed to public, and no exploitation of
forest therein shall be allowed except for reducing fire hazards epidemic or insect attacks or other natural calamities.
3) No person shall enter or reside, cultivate any land, damage or destroy any vegetation, introduce any endemic or exotic species of any animal or plant, introduce any domestic animal or allow it to stray, cause any fire, or pollute water, in a wildlife sanctuary, or hunt, kill or capture any wild animal or fire any gun or other fire-arm within one and half kilometre of the boundaries thereof; Provided that the authorised officer may, for specific purposes authorise the doing of any of the aforementioned acts.

1-66
National Park 1) With a view to protecting and preserving scenery, flora and fauna in natural state, the
(Federal) Government may, by notification in the official Gazette, declare any area to be a national park.
2) The national park shall be accessible to public for recreation, education and research, subject to such restrictions as the Federal Government may impose.
3) Provision for access roads to, and construction of rest houses, hotels and other buildings in the national park alongwith amenities for public may be so made, the forest therein shall be so managed and forest produce so obtained as not impair the object for which it is declared a national park.
4) Except as otherwise provided by this Ordinance and the rules, the following acts shall be prohibited in a national park, namely:––
(i). hunting, shooting, trapping, killing, or capturing of any wild animal within a radius of two kilometers of its boundaries ;
(ii). firing any fire-arm or doing of any other act which may disturb any wild animal or interfere with its breeding place ;
(iii). felling, tapping, burning, damaging or destroying of, or taking, collecting or removing therefrom, any plant or tree;
(iv). clearing or breaking up of any land for cultivation, mining or for any other purposes ; and
(v). polluting water flowing in or through it :
Game Reserves 1) With a view to providing facilities for hunting, the (Federal) Government may, by a
notification in the official Gazette, declare any area to be a game reserve, but no person shall hunt, shoot or capture any wild animal in a game reserve, except in the case of game animals specified in the First Schedule, under a hunting permit.
2) A hunting permit may be issued by an authorised officer in such manner, on such terms and conditions and upon payment of such fees as may be prescribed.
3) The holder of a hunting permit may hunt such number of game animals specified in the First Schedule and during such period as may be specified by the authorised officer.
Gap Analysis between the Law of Pakistan and JICA Guidelines
Table 6.1.9 shows the gap analysis between the Law of Pakistan and JICA guidelines.

1-67
Table 6.1.9 The Gap between the Law of Pakistan and JICA guideline Item JICA Law of Pakistan Gap
1.Category JICA classifies projects into four categories according to the extent of environmental and social impacts, taking into account an outline of project, scale, site condition, etc.
The projects requires IEE/EIA are listed in Pakistan Environmental Protection Agency (Review of IEE and EIA) regulations, 2000 (hereinafter referred as to Review)
JICA guideline defines that the project with large-scale involuntary resettlement, large-scale deforestation, and submarine transmission line are environmental effective projects. Pakistan low mentions EHV T/L project (more than 11kV) requires EIA.
2.Information Disclosure
JICA discusses frameworks with project proponents etc. in order to ensure information disclosure, and comes to an agreement in an early stage of cooperation projects. JICA encourages project proponents etc. to disclose and present information about environmental and social considerations to local stakeholders.
In the case of an EIA, the Federal Agency shall, simultaneously with issue of confirmation of completeness to be published in any English or Urdu national newspaper and in a local newspaper of general circulation in the area affected by the project, a public notice mentioning the type of project, its exact location, the name and address of the proponent and the places at which the EIA of the project can. (Review)
Pakistani law requests information disclosure after completion of EIA report
3.Consultation with Local Stakeholders
In the case of Category A projects, JICA encourages project proponents etc. to consult with local stakeholders about their understanding of development needs, the likely adverse impacts on the environment and society, and the analysis of alternatives at an early stage of the project, and assists project proponents as needed.
After preparation EIA, public hearing and public consultation are done. (Review)
Pakistani law doesn’t ensure the participation of stakeholders before EIA report preparation. Guideline for Preparation and Review of Environmental Reports, 1997 requests the participation at scoping stage.
4.EIA Reports for Category A Projects
EIA reports cover the items enumerated in the following. ・ Executive summary ・ Policy, legal, and
administrative framework ・ Project description ・ Baseline data ・ Environmental impacts ・ Analysis of alternatives ・ EMP ・ Consultation
Guideline for Preparation and Review of Environmental Reports, 1997 defines necessary items of EIA report. It covers JICA requirement.
The description in Pakistani guideline is almost equivalent.
5.Consideration of human right
JICA respects the principles of internationally established
Guideline for Public Consultation, 1997 indicates
The description in Pakistani guideline is
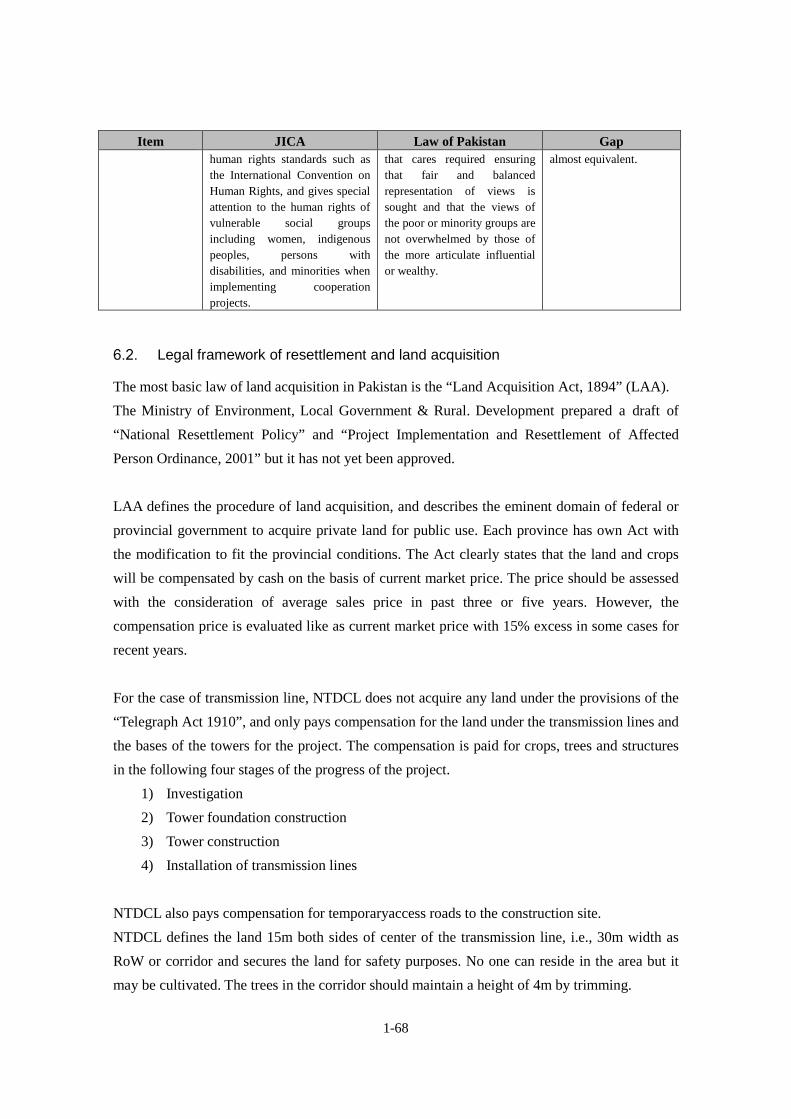
1-68
Item JICA Law of Pakistan Gap human rights standards such as the International Convention on Human Rights, and gives special attention to the human rights of vulnerable social groups including women, indigenous peoples, persons with disabilities, and minorities when implementing cooperation projects.
that cares required ensuring that fair and balanced representation of views is sought and that the views of the poor or minority groups are not overwhelmed by those of the more articulate influential or wealthy.
almost equivalent.
Legal framework of resettlement and land acquisition
The most basic law of land acquisition in Pakistan is the “Land Acquisition Act, 1894” (LAA). The Ministry of Environment, Local Government & Rural. Development prepared a draft of “National Resettlement Policy” and “Project Implementation and Resettlement of Affected Person Ordinance, 2001” but it has not yet been approved. LAA defines the procedure of land acquisition, and describes the eminent domain of federal or provincial government to acquire private land for public use. Each province has own Act with the modification to fit the provincial conditions. The Act clearly states that the land and crops will be compensated by cash on the basis of current market price. The price should be assessed with the consideration of average sales price in past three or five years. However, the compensation price is evaluated like as current market price with 15% excess in some cases for recent years. For the case of transmission line, NTDCL does not acquire any land under the provisions of the “Telegraph Act 1910”, and only pays compensation for the land under the transmission lines and the bases of the towers for the project. The compensation is paid for crops, trees and structures in the following four stages of the progress of the project.
1) Investigation 2) Tower foundation construction 3) Tower construction 4) Installation of transmission lines
NTDCL also pays compensation for temporaryaccess roads to the construction site. NTDCL defines the land 15m both sides of center of the transmission line, i.e., 30m width as RoW or corridor and secures the land for safety purposes. No one can reside in the area but it may be cultivated. The trees in the corridor should maintain a height of 4m by trimming.

1-69
NTDCL acquires land if unavoidable, and should follow the LAA. However, there are a many gaps between international requirement and Pakistani law. Table 6.2.1 indicates the gap between JICA guidelines and LAA. In order to bridge the gap between LAA and international requirements, NTDCL prepared the “Land Acquisition and Resettlement Framework (LARF)”as an internal reference and has used it as a guideline for projects financed by international financial institutions (IFI). But still the gaps remain in some points. This project will refer to both LARF and JICA guidelines, and create an appropriate Land Acquisition Resettlement Plan (LARP).
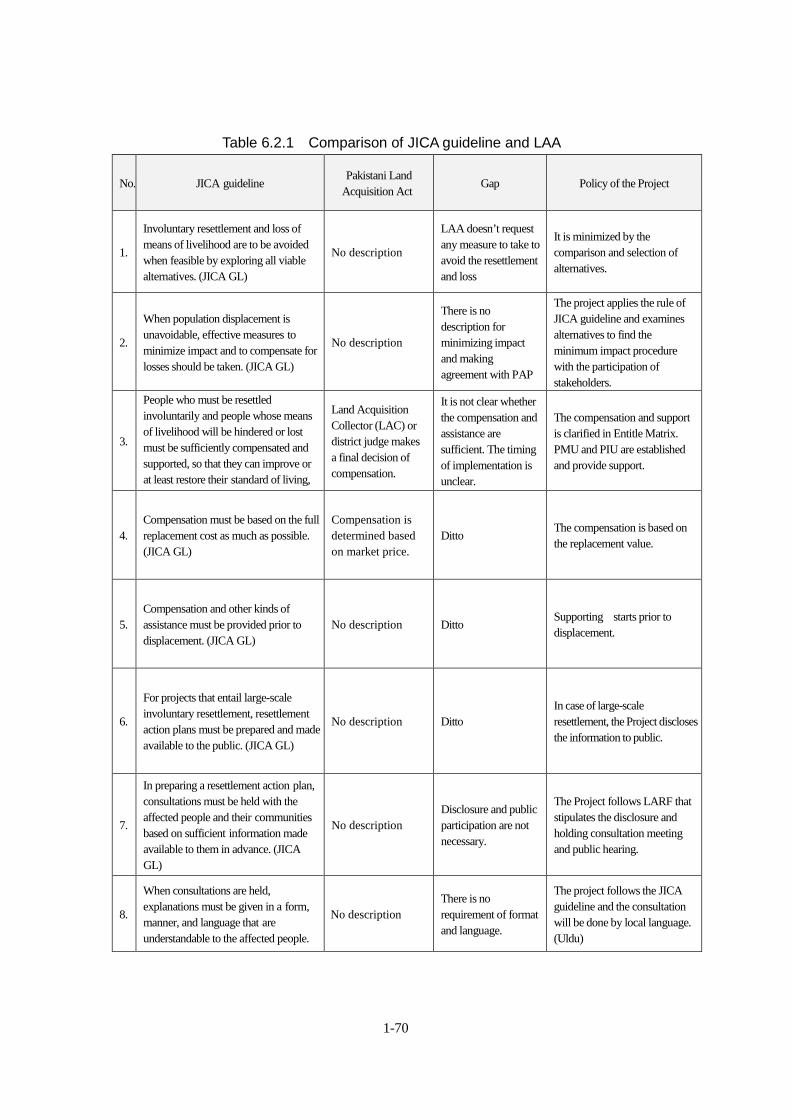
1-70
Table 6.2.1 Comparison of JICA guideline and LAA
No. JICA guideline Pakistani Land
Acquisition Act Gap Policy of the Project
1.
Involuntary resettlement and loss of means of livelihood are to be avoided when feasible by exploring all viable alternatives. (JICA GL)
No description
LAA doesn’t request any measure to take to avoid the resettlement and loss
It is minimized by the comparison and selection of alternatives.
2.
When population displacement is unavoidable, effective measures to minimize impact and to compensate for losses should be taken. (JICA GL)
No description
There is no description for minimizing impact and making agreement with PAP
The project applies the rule of JICA guideline and examines alternatives to find the minimum impact procedure with the participation of stakeholders.
3.
People who must be resettled involuntarily and people whose means of livelihood will be hindered or lost must be sufficiently compensated and supported, so that they can improve or at least restore their standard of living,
Land Acquisition Collector (LAC) or district judge makes a final decision of compensation.
It is not clear whether the compensation and assistance are sufficient. The timing of implementation is unclear.
The compensation and support is clarified in Entitle Matrix. PMU and PIU are established and provide support.
4. Compensation must be based on the full replacement cost as much as possible. (JICA GL)
Compensation is determined based on market price.
Ditto The compensation is based on the replacement value.
5. Compensation and other kinds of assistance must be provided prior to displacement. (JICA GL)
No description Ditto Supporting starts prior to displacement.
6.
For projects that entail large-scale involuntary resettlement, resettlement action plans must be prepared and made available to the public. (JICA GL)
No description Ditto In case of large-scale resettlement, the Project discloses the information to public.
7.
In preparing a resettlement action plan, consultations must be held with the affected people and their communities based on sufficient information made available to them in advance. (JICA GL)
No description Disclosure and public participation are not necessary.
The Project follows LARF that stipulates the disclosure and holding consultation meeting and public hearing.
8.
When consultations are held, explanations must be given in a form, manner, and language that are understandable to the affected people.
No description There is no requirement of format and language.
The project follows the JICA guideline and the consultation will be done by local language. (Uldu)

1-71
No. JICA guideline Pakistani Land
Acquisition Act Gap Policy of the Project
9
Appropriate participation of affected people must be promoted in planning, implementation, and monitoring of resettlement action plans. (JICA GL)
No description Participation of PAP is not secured.
The Project follows LARF that stipulates the participation of PAP and chairman of local community.
10.
Appropriate and accessible grievance mechanisms must be established for the affected people and their communities. (JICA GL)
No description Grievance redness system is not secured.
The Project follows LARF that stipulates the establishment of grievance committee, clarifying the procedure of grievance, and support for people want to state.
11.
Affected people are to be identified and recorded as early as possible in order to establish their eligibility through an initial baseline survey (including population census that serves as an eligibility cut-off date, asset inventory, and socioeconomic survey), preferably at the project identification stage, to prevent a subsequent influx of encroachers of others who wish to take advance of such benefits. (WB OP4.12 Para.6)
No description
The necessity of baseline survey is not mentioned and there is subsequent influx of encroachment.
The baseline survey will be done after determination of scope of the project and cut-off date will be officially declared.
12.
Eligibility of benefits includes, the PAPs who have formal legal rights to land (including customary and traditional land rights recognized under law), the PAPs who don't have formal legal rights to land at the time of census but have a claim to such land or assets and the PAPs who have no recognizable legal right to the land they are occupying. (WB OP4.12 Para.15)
Only legal entitled person can receive compensation.
Right of no entitled PAP is not secured.
The PAP who has no right can also receive the compensation and assistance. However, after cut-off date, the new encroachment is not estimated as PAP.
13.
Preference should be given to land-based resettlement strategies for displaced persons whose livelihoods are land-based. (WB OP4.12 Para.11)
No description
There is no consideration for the person whose livelihoods are land-based.
The livelihood of target persons of resettlement is surveyed. If there is land-based PAP, the resettlement plan should include the consideration for such persons.
14.
Provide support for the transition period (between displacement and livelihood restoration). (WB OP4.12 Para.6)
No description The support of transition period is unclear.
POPs will receive appropriate support for the transition period.
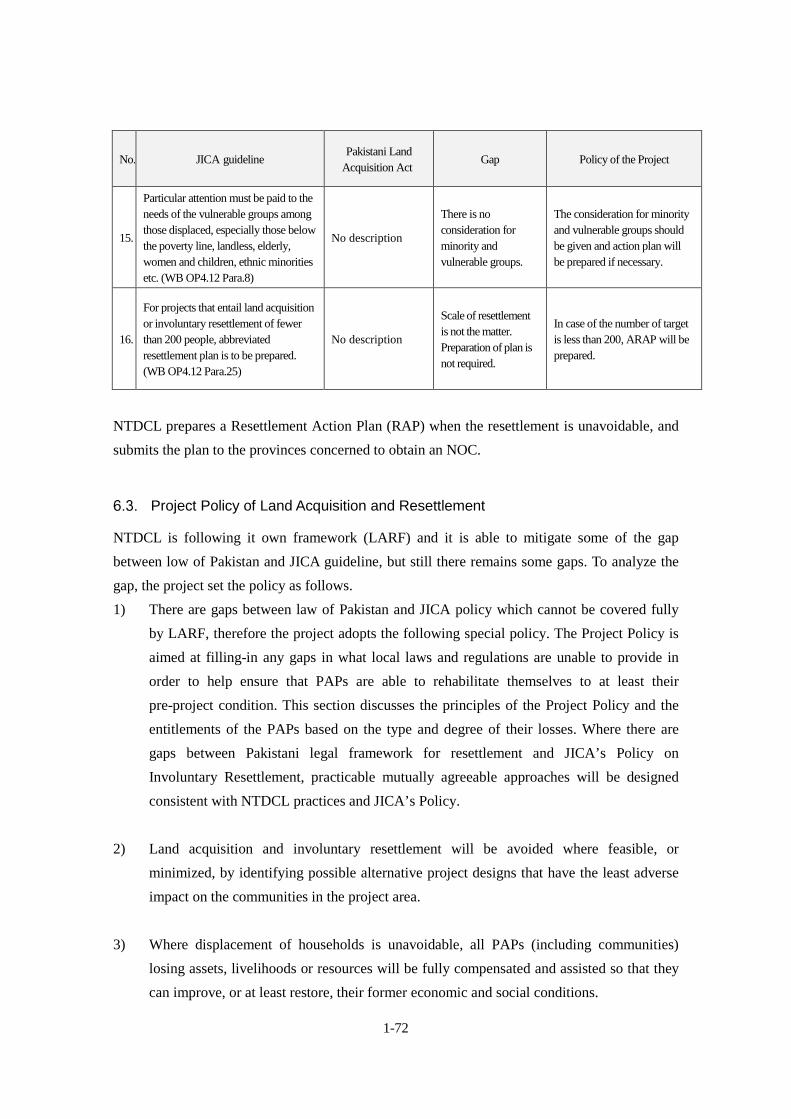
1-72
No. JICA guideline Pakistani Land
Acquisition Act Gap Policy of the Project
15.
Particular attention must be paid to the needs of the vulnerable groups among those displaced, especially those below the poverty line, landless, elderly, women and children, ethnic minorities etc. (WB OP4.12 Para.8)
No description
There is no consideration for minority and vulnerable groups.
The consideration for minority and vulnerable groups should be given and action plan will be prepared if necessary.
16.
For projects that entail land acquisition or involuntary resettlement of fewer than 200 people, abbreviated resettlement plan is to be prepared. (WB OP4.12 Para.25)
No description
Scale of resettlement is not the matter. Preparation of plan is not required.
In case of the number of target is less than 200, ARAP will be prepared.
NTDCL prepares a Resettlement Action Plan (RAP) when the resettlement is unavoidable, and submits the plan to the provinces concerned to obtain an NOC.
Project Policy of Land Acquisition and Resettlement
NTDCL is following it own framework (LARF) and it is able to mitigate some of the gap between low of Pakistan and JICA guideline, but still there remains some gaps. To analyze the gap, the project set the policy as follows. 1) There are gaps between law of Pakistan and JICA policy which cannot be covered fully
by LARF, therefore the project adopts the following special policy. The Project Policy is aimed at filling-in any gaps in what local laws and regulations are unable to provide in order to help ensure that PAPs are able to rehabilitate themselves to at least their pre-project condition. This section discusses the principles of the Project Policy and the entitlements of the PAPs based on the type and degree of their losses. Where there are gaps between Pakistani legal framework for resettlement and JICA’s Policy on Involuntary Resettlement, practicable mutually agreeable approaches will be designed consistent with NTDCL practices and JICA’s Policy.
2) Land acquisition and involuntary resettlement will be avoided where feasible, or minimized, by identifying possible alternative project designs that have the least adverse impact on the communities in the project area.
3) Where displacement of households is unavoidable, all PAPs (including communities)
losing assets, livelihoods or resources will be fully compensated and assisted so that they can improve, or at least restore, their former economic and social conditions.
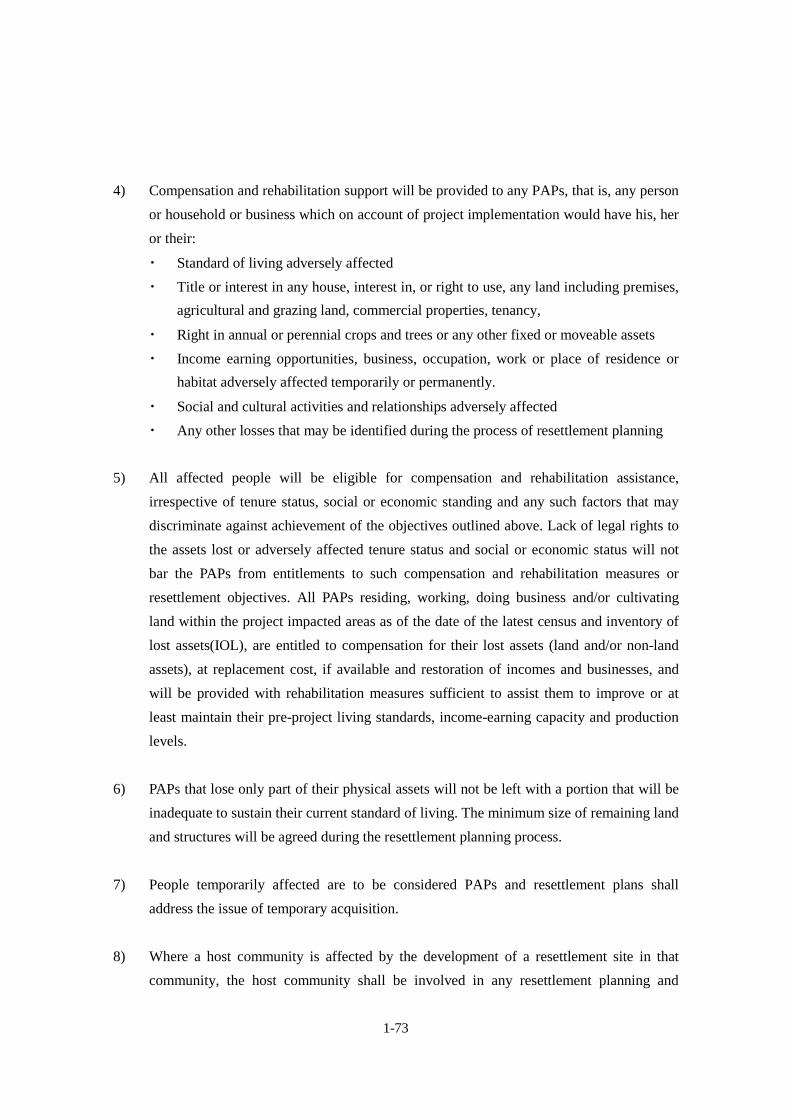
1-73
4) Compensation and rehabilitation support will be provided to any PAPs, that is, any person or household or business which on account of project implementation would have his, her or their:
・ Standard of living adversely affected ・ Title or interest in any house, interest in, or right to use, any land including premises,
agricultural and grazing land, commercial properties, tenancy,
・ Right in annual or perennial crops and trees or any other fixed or moveable assets ・ Income earning opportunities, business, occupation, work or place of residence or
habitat adversely affected temporarily or permanently.
・ Social and cultural activities and relationships adversely affected ・ Any other losses that may be identified during the process of resettlement planning
5) All affected people will be eligible for compensation and rehabilitation assistance,
irrespective of tenure status, social or economic standing and any such factors that may discriminate against achievement of the objectives outlined above. Lack of legal rights to the assets lost or adversely affected tenure status and social or economic status will not bar the PAPs from entitlements to such compensation and rehabilitation measures or resettlement objectives. All PAPs residing, working, doing business and/or cultivating land within the project impacted areas as of the date of the latest census and inventory of lost assets(IOL), are entitled to compensation for their lost assets (land and/or non-land assets), at replacement cost, if available and restoration of incomes and businesses, and will be provided with rehabilitation measures sufficient to assist them to improve or at least maintain their pre-project living standards, income-earning capacity and production levels.
6) PAPs that lose only part of their physical assets will not be left with a portion that will be inadequate to sustain their current standard of living. The minimum size of remaining land and structures will be agreed during the resettlement planning process.
7) People temporarily affected are to be considered PAPs and resettlement plans shall
address the issue of temporary acquisition. 8) Where a host community is affected by the development of a resettlement site in that
community, the host community shall be involved in any resettlement planning and
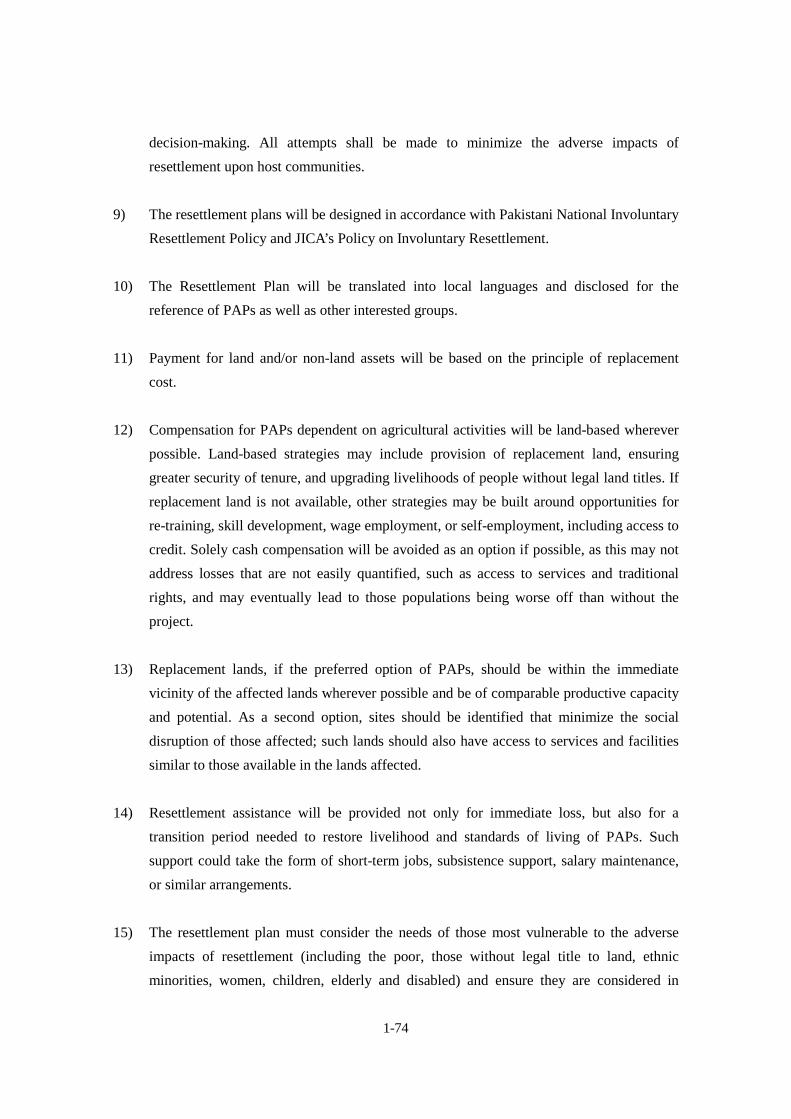
1-74
decision-making. All attempts shall be made to minimize the adverse impacts of resettlement upon host communities.
9) The resettlement plans will be designed in accordance with Pakistani National Involuntary
Resettlement Policy and JICA’s Policy on Involuntary Resettlement. 10) The Resettlement Plan will be translated into local languages and disclosed for the
reference of PAPs as well as other interested groups. 11) Payment for land and/or non-land assets will be based on the principle of replacement
cost. 12) Compensation for PAPs dependent on agricultural activities will be land-based wherever
possible. Land-based strategies may include provision of replacement land, ensuring greater security of tenure, and upgrading livelihoods of people without legal land titles. If replacement land is not available, other strategies may be built around opportunities for re-training, skill development, wage employment, or self-employment, including access to credit. Solely cash compensation will be avoided as an option if possible, as this may not address losses that are not easily quantified, such as access to services and traditional rights, and may eventually lead to those populations being worse off than without the project.
13) Replacement lands, if the preferred option of PAPs, should be within the immediate
vicinity of the affected lands wherever possible and be of comparable productive capacity and potential. As a second option, sites should be identified that minimize the social disruption of those affected; such lands should also have access to services and facilities similar to those available in the lands affected.
14) Resettlement assistance will be provided not only for immediate loss, but also for a
transition period needed to restore livelihood and standards of living of PAPs. Such support could take the form of short-term jobs, subsistence support, salary maintenance, or similar arrangements.
15) The resettlement plan must consider the needs of those most vulnerable to the adverse
impacts of resettlement (including the poor, those without legal title to land, ethnic minorities, women, children, elderly and disabled) and ensure they are considered in

1-75
resettlement planning and mitigation measures identified. Assistance should be provided to help them improve their socio-economic status.
16) PAPs will be involved in the process of developing and implementing resettlement plans 17) PAPs and their communities will be consulted about the project, the rights and options
available to them, and proposed mitigation measures for adverse effects, and to the extent possible be involved in the decisions that are made concerning their resettlement.
18) Adequate budgetary support will be fully committed and made available to cover the costs
of land acquisition (including compensation and income restoration measures) within the agreed implementation period. The funds for all resettlement activities will come from NTDCL.
19) Displacement shall not occur before provision of compensation and of other assistance
required for relocation. Sufficient civic infrastructure must be provided in resettlement sites prior to relocation. Acquisition of assets, payment of compensation, and the resettlement and start of the livelihood rehabilitation activities of PAPs, will be completed prior to any construction activities, except when a court of law orders such in expropriation cases. (Livelihood restoration measures must also be in place but not necessarily completed prior to construction activities, as these may be ongoing activities.)
20) Organization and administrative arrangements for the effective preparation and
implementation of the resettlement plan will be identified and in place prior to the commencement of the process; this will include the provision of adequate human resources for supervision, consultation, and monitoring of land acquisition and rehabilitation activities.
21) Appropriate reporting (including auditing and redress functions), monitoring and
evaluation mechanisms, will be identified and set in place as part of the resettlement management system. An external monitoring group will be hired
<Cut-off date> The cut-off-date of eligibility refers to the date prior to which the occupation or use of the project area makes residents/users of the same eligible to be categorized as PAPs and be eligible to Project entitlements. In the Project, cut-off dates for titleholders will be the date of
1-76
notification under the Land Acquisition Act and for non-titled holders will be the beginning date of the population census. This date has been disclosed to each affected village by the relevant local governments and the villages have disclosed to their populations. The establishment of the eligibility cut-off date is intended to prevent the influx of ineligible non-residents who might take advantage of Project entitlements.
<Replacement Cost >
Compensation costs for all of the items after the cut-off date is determined based on the replacement costs. Replacement cost is sum of asset expenses excluding depreciation and amortization, procedure costs, taxes, registration fees, re-acquisition price, etc.
Implementing structure and grievance redress mechanism
NTDCL established the Environmental and Social Impacts Cell (ESIC) in 1997 for the environmental management. ESIC is an organization under the Chief Engineer of EHV, and it is in charge of the environmental and social issues management for the construction, operation and maintenance of the NTDCL project. However, ESIC is operated by only a few members including one director, two assistant directors and one deputy manager. Therefore it seems to be difficult to monitor all NTDCL projects in depth. ESIC had not been informed about this project until the survey team came, and had not requested any consultation for environmental and social issues in NTDCL. The survey team had reviewed PC-1 of this project, but the description of environmental and social issues was very simple and general. These are common subjects for all NTDCL project and not specific considerations for this project. NTDCL has established the Project Managing Unit (PMU) and Project Implementing Unit (PIU) for the project. PIU is mainly working on field level problems. These units also have important functions for land acquisition and resettlement. These units cover the manpawer shortage of ESIC. NTDCL makes a Land Acquisition and Resettlement Plan (LARP) to determine all detailed procedures. ESIC has responsibility to check the validity of the plan, i.e., consultation, valuation of compensation, etc. A Grievance Redress Committee (GRC) has been established and is working with ESIC as a venue for redress of grievances of Project Affected Persons (PAPs). NTDCL has an obligation to make a plan of land acquisition, to implement the plan and bear the

1-77
costs of the plan. On the other hand, PMU and PIU are responsible for the practical aspects. PIU is mainly concerned with field level activity and it is expected to contribute significantly to PAP. The members of the PIU are as follows.
・ Executive Engineer (NTDC) ・ District Officer (Revenue)/ LAC ・ Representative of ESIC, PMU (AM, Social Safeguards) ・ Assistant Manager (Social Mobilization/ Social Mobilizer) ・ Contractor ・ Project Management Consultant (Safeguard Implementation Specialist) ・ Patwari [village accountant] ・ Representative of Affected Persons Committee (APC).
The function of each unit is summarized in Table 6.4.1.
Table 6.4.1 Structure of implementation of land acquisition and resettlement Name Duty PMU • Direction and supervision
• Finalization of draft LARP ESIC • Project level implementation and supervision of LARP through the PIU
on the basis of LARF • Adjustment of grievance redness between PIU and GRC • Management of measurement, survey and valuation • Preparation of monitoring report and reporting to funding agencies • Disclosure of information to PAP
PIU • Distribution of notice to PAP about compensation • Support PAP for preparation of necessary document and its submission • Support of making complaint • Support of participation of local community
Local government • Adjustment of land acquisition if necessary • Valuation of the land by land acquisition officer or land record officer
APC (Affected Person Committee)
• Advisory committee by chairmen of rural communities
(Source: JICA Survey Team)

1-78
Organisation of Project Implementation and Maintenance The organisation of NTDCL
Organisational structure of NTDCL
NTDCL is composed of 11,700 personnel positions, led by the managing director. In fact, however, 3,200 positions are vacant and only 8,500 person are employed. The organization chart of NTDCL is as below.
(Source: JICA Survey Team)
Figure 7.1.1 Organisation Chart of NTDCL
Boad of Directors NTDCLCompany Secretary
Manager Internal(Audit)
GM(CCC)
Managing Director NTDCL Manager( Media & PR)
Finance Director
Legal Advisor
IT Director
Chief Security Officer
HR & Admin Diretcor
Consultants
Chief Engineer(C&M)
Chief Engineer(Civil)
Chief Engineer(Dasu T/L Project)
G.M(Projects)
G.M(System Protection)
GM(GSC)
GM(GSO)
Technical Director
GM(Service Division)
GM(Planning)
GM(Sys-Operation)NPCC
GM(HV & SC Lab)
Organogram NTDCL
1-79
The role of each department in NTDCL
The role of each department is shown as follows.
(1) Board of Directors The Board of Directors approves large-scale projects which cannot be authorised by MD. Members are administrative vice-ministers or superintendents of governmental offices such as politicians, experts and so on. (2) Company Secretary The Company Secretary is in charge of coordinating meetings of the Board of Directors and the handling of adminstrative work. (3) Internal Audit It is responsible for the internal audit of NTDCL.
(4) CCC CCC deal with general contracts related to procurement.
(5) Legal Advisor The Legal Advisor is the corporate lawyer of NTDCL.
(6) Managing Director The Managing Director is the president of NTDCL.
(7) Information Technology It is responsible for management of the website.
(8) Finance It is the department responsible for finance in general.
(9) Technical Director It provides technical support for the Managing Director.
(10) Consultants They are hired by NTDCL.

1-80
(11) System Protection System Protection is the department which is responsible for protection facilities of the transmission network.
(12) Projects Projects is the department which is responsible for progress management of the project and also plays a role as the project management unit for Asian Development Bank's agenda items.
(13) (HV&SC) Rawat (HV&SC) Rawat is the management operation department of the high pressure - short circuit examination room. An examination room is established next to Rawat New Grid Station.
(14) (SO) NPCC NPCC is the national electric power control center which is located in Islamabad.
(15) Service Division The Service Division is resuponsible for design and training in NTDCL and so on.
(16) Grid System Operation(GSO) Grid System Operation is responsible for operation of substations and power transmission facilities and daily maintenance.
(17) Grid System Construction(GSC) Grid System Construction is responsible for construction of substations and power transmission facilities and the repair of existing facilities. The department in charge depends on the location where the project is implemented. EHV-1 (based in Lahore, Northern regional affairs, with branches in Islamabad and Faisalabad) and EHV-2 (based in Hyderabad in the Southern department). Regarding this project, EHV-1 Islamabad will be responsible. (18) Planning Department It is responsible for formulation of the 5-year maintenance plan, procedures related to formulation and approval of the project implementation plan (Prifirma PC-1), based on the National Power Policy created at NEPRA.
1-81
Organisation of the project implementation
Departments related to project implementation
The relevant departments, mainly design and construction, are as below.
(1) Planning The Planning department analyzes system and confirms an optimal plan. The PlanningDepartment also creates estimates of the construction cost and an annual budget plan and so on. Moreover, this department obtains the approvals which is in the project implementation plan document (PC-1) from Planning Commission under MOWP. This department also notifies the Design Department after obtaining the approval of Planning Commission.
(2) Design The Design Department is responsible for designing the study such as measures based on the optimal plan drafted by the Planning Department. The Design Department also designs power transmission facilities based on the results of this study. The Design Department has sections responsible for the parts (the power-transmission wire and the steel towers) of the transmission line and also for the EHV (Extra High Voltage, mainly, the design of a substation). In this part of the project, the section mainly responsible is the one responsible for the The design of the Transmission Line, and it takes charge of the design but regarding the extension of Islamabad University Grid Station, the Design EHV section takes charge. Also, the Design Department creates the order book in addition to the design. (3) MP&M MP&M is the section which carries out general administrative work for construction procurement. Also, this section does the announcement of the construction project and performs the recruitment and selection of the bidders.. This section publishes the invitation to tender and examies of the tender documents for bids received. (4) CCC The CCC section mainly conducts negotiations with the funding organizations (World Bank, ADB, JICA and so on) about the contract and the agreement.
1-82
(5) GSC The GSC section primarily supervises vendors and managers. This section supervises the construction implementation status of the vendors. Also, this section negotiates on relocation of resident and related compensation and so on. (6) Environmental & Social Impact Group This organization is responsible for matters in general about the environment and society being
considered by the administration. This organization takes charge of obtaining the approval of
EIA・IEE・RAP and so on.
Relevant Governmental Agencies
The agencies which relates to this project are the Ministry of Water and Power (MoWP), the Water and Power Development Authority (WAPDA), the Environmental Protection Agency (EPA), the Planning Commission, and the Ministry of Finance.
(1) Ministry of Water and Power(MoWP) NTDC is the subsidiary of MoWP. The plan and the implementation of the project must obtain approval by the manager of MoWP in charge of NTDC.
(2) Water and Power Development Authority (WAPDA) WAPDA controls the electric power plant. WAPDA conducts the planning and design and construction of the electric power plant facilities. Also, WAPDA performs maintenance at the electric power plant. WAPDA also manages the switching-station which connects with the power plant. NTDC separated from WAPDA in 1998 and was established as an independent organization. Therefore, much of the regulation of NTDC about power transmission and the transformation of electrical energy was worked out when it belonged to WAPDA.
(3) Environmental Protection Agency (EPA) The Environmental Protection Agency is the government office which conducts the approval of the environmental impact assessment about development activities, and maintains environment relation legislation and so on. As for this project, this government office approves the environmental impact assessment of
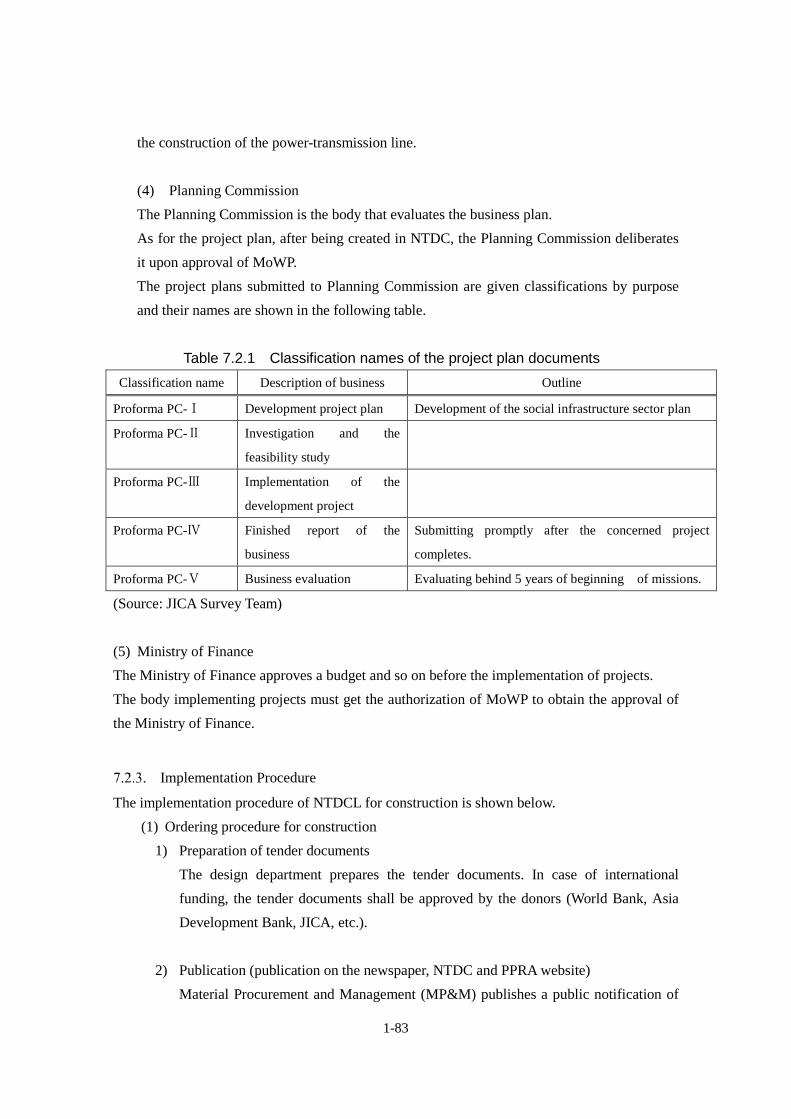
1-83
the construction of the power-transmission line.
(4) Planning Commission The Planning Commission is the body that evaluates the business plan. As for the project plan, after being created in NTDC, the Planning Commission deliberates it upon approval of MoWP. The project plans submitted to Planning Commission are given classifications by purpose and their names are shown in the following table.
Table 7.2.1 Classification names of the project plan documents Classification name Description of business Outline
Proforma PC-Ⅰ Development project plan Development of the social infrastructure sector plan
Proforma PC-Ⅱ Investigation and the
feasibility study
Proforma PC-Ⅲ Implementation of the
development project
Proforma PC-Ⅳ Finished report of the
business
Submitting promptly after the concerned project
completes.
Proforma PC-Ⅴ Business evaluation Evaluating behind 5 years of beginning of missions.
(Source: JICA Survey Team) (5) Ministry of Finance The Ministry of Finance approves a budget and so on before the implementation of projects. The body implementing projects must get the authorization of MoWP to obtain the approval of the Ministry of Finance.
Implementation Procedure
The implementation procedure of NTDCL for construction is shown below. (1) Ordering procedure for construction
1) Preparation of tender documents The design department prepares the tender documents. In case of international funding, the tender documents shall be approved by the donors (World Bank, Asia Development Bank, JICA, etc.).
2) Publication (publication on the newspaper, NTDC and PPRA website)
Material Procurement and Management (MP&M) publishes a public notification of

1-84
the tender invitation in the newspape and on the NTDC and PPRA websites, in accordance with PPRA’s regulation.
3) Bidding Original bidding documents along with two copies are submitted by bidders. The bid review committee (the central contract unit, the financial person in charge, the MP&M person in charge, the technical expert) examines bids placed after receiving one original and two copies of the tender document or the proposal. Also, a copy of the tender documents is evaluated by the designing department or a consultant. The evaluation for procurement is conducted within 15 days, or at least 30 days when procuring internationally.
4) Approval of the vendor The President has authority about the approval up to an order value of PKR 100 million. When order value exceeds PKR 100 million, it is decided by the board of directors. Incidentally, in case of funds loaned from a donor, the donor must approve.
5) Publication of the vendor name The name of the vendor is published on the websites of NTDCL and the public procurement agency as the evaluation result of the president or the board of directors.
(2) Ordering procedure of the consulting service
1) Preparation of tender documents The design department prepares the tender documents.
Also, this department obtains the approval of the donor when it procures using international funds (loans by the World Bank, Asian Development Bank, JICA and so on).
2) Official announcement (publication in the newspaper and on the NTDC website) The Material Procurement Management department publishes the tender invitation in the newspaper according to the regulations of the Public Procurement Regulation Agency and rules of the donor.
Moreover, this department announces the tender invitation officially on websites (of

1-85
NTDC, the donor and the Public Procurement Regulation Agency). 3) Bidding
The bid review committee (the central contract cell, the financial person in charge, the MP&M person in charge, and a technical expert) examines bids placed after receiving one original and two copies of the tender document or the proposal. Also, the copy of the tender documents is evaluated by the designing department or the consultant.
The evaluation for procurement is conducted within 15 days, or at least 30 days when procuring internationally.
4) Approval of the vendor The Managing Director has authority about the approval up to an order value of PKR 4 million. When order value exceeds PKR 4 million, it is decided by the board of directors.
Incidentally, in case of funds loaned from a donor, the donor must approve.
5) Publication of the vendor The name of the vendor is published on the websites of NTDCL and the public procurement agency as the evaluation result of the president or the board of directors.
The Project Staff plan
In this project, the planning for manpower needed is specified in PC-1
Figure 7.2.1 Manpower planning of the project staff Number
of staff
Period
(months)
1 expert 3 30
2 finance
responsibility
1 30
3 clerk 3 30
4 service engineer 5 30
5 voluntary worker 4 30
6 others 4 30
total 20
(Source: JICA Survey Team)
1-86
The project implementation system
(1) In this project, Chief Engineer EHV-1 in Lahore has the entire responsibility for the projects.
There are about 590 staff members in the entire EHV-1. The composition is about 350 technical staff and about 240 non-technical staff. (2) Project Director (PD) EHV-Ⅰ Islamabad office is charged with implementing this project during the construction period. The whole staff of PD EHV-1 Islamabad number about 200. The composition is 130 technical staff and 70 non-technical staff. (3) At Islamabad office, Project Director (PD) has as subordinates one Deputy Manager and three Assistant Managers. PD EHV-1 has one Executive Engineer (XEN) in each Division. Each XEN has 3 Sub Divisional Engineers (SDE). PD EHV Islamabad supervises the progress of the construction and then reports status to CE EHV-Ⅰin Lahore (4) Executive Engineer (XEN) Rawalpindi Division and 1 SDE perform project supervision. Executive Engineer (XEN) Rawalpindi supervises the progress of the construction and then reports the status to PD EHV-ⅠIslamabad. XEN Rawalpindi Division has about 40 technical staff, and there are about 20 other staff who engage in this project. (5) Incidentally, as for the social environment, it is special. This organisation is administered by GM (Project) and does not belong to EHV-1. There is an Environment and Social Impact Cell (E&SIC) and the member is as follows.
1) Manager, E&SIC, NTDC Wapda House Lahore. 2) Deputy Manager (Environment) 3) Assistant Manager (Social precaution) 4) Assistant Manager (Environment)
Social environment supervision is performed at the site, being sent from ESIC. (6) Material Procurement and Management (MP&M) MP&M belongs to GM (Project) and does not belong to EHV-1. They perform the commissioning of construction in addition to the purchasing of the material.
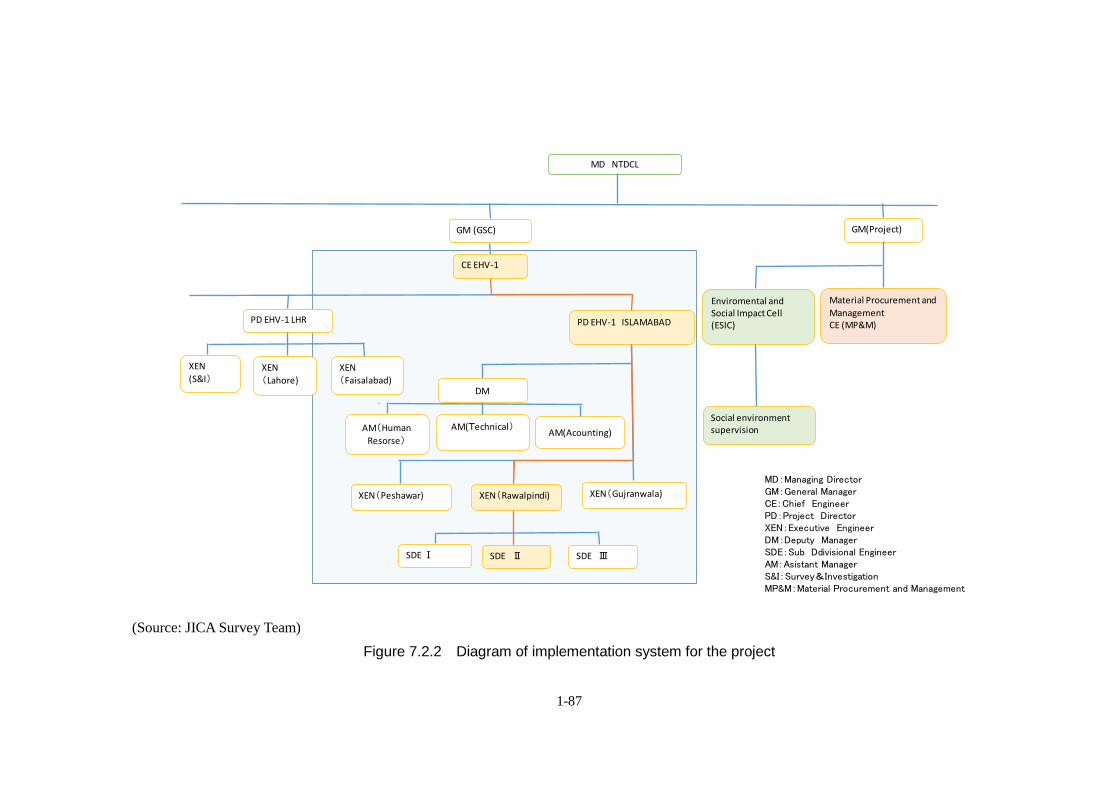
1-87
(Source: JICA Survey Team) Figure 7.2.2 Diagram of implementation system for the project
MD:Managing DirectorGM:General ManagerCE:Chief Engineer PD:Project DirectorXEN:Executive EngineerDM:Deputy ManagerSDE:Sub Ddivisional EngineerAM:Asistant ManagerS&I:Survey&InvestigationMP&M:Material Procurement and Management
PD EHV-1 ISLAMABAD
DM
AM(HumanResorse)
AM(Technical) AM(Acounting)
XEN (S&I)
GM (GSC) GM(Project)
Enviromental and Social Impact Cell(ESIC)
Material Procurement and ManagementCE (MP&M)
Social environment supervision
XEN(Peshawar) XEN(Gujranwala)
SDEⅠ SDE Ⅲ
CE EHV-1
PD EHV-1 LHR
XEN(Lahore)
XEN(Faisalabad)
XEN(Rawalpindi)
SDE Ⅱ
MD NTDCL
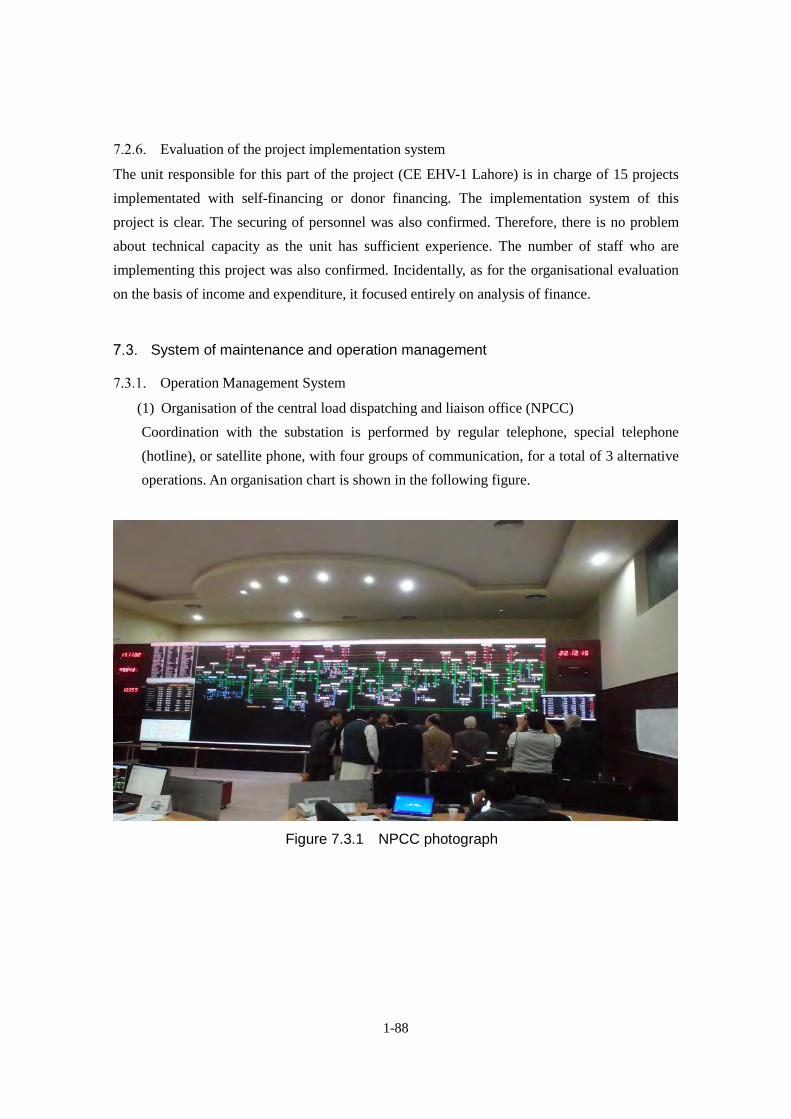
1-88
Evaluation of the project implementation system
The unit responsible for this part of the project (CE EHV-1 Lahore) is in charge of 15 projects implementated with self-financing or donor financing. The implementation system of this project is clear. The securing of personnel was also confirmed. Therefore, there is no problem about technical capacity as the unit has sufficient experience. The number of staff who are implementing this project was also confirmed. Incidentally, as for the organisational evaluation on the basis of income and expenditure, it focused entirely on analysis of finance.
System of maintenance and operation management
Operation Management System
(1) Organisation of the central load dispatching and liaison office (NPCC) Coordination with the substation is performed by regular telephone, special telephone (hotline), or satellite phone, with four groups of communication, for a total of 3 alternative operations. An organisation chart is shown in the following figure.
Figure 7.3.1 NPCC photograph
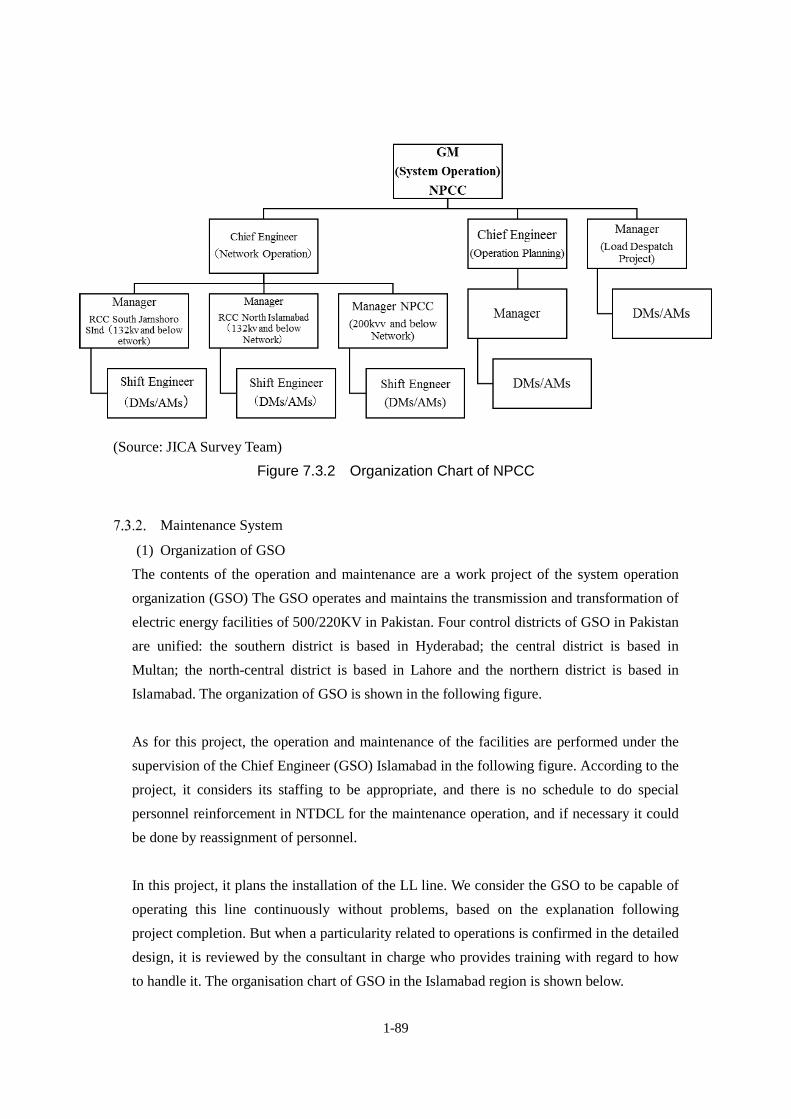
1-89
(Source: JICA Survey Team) Figure 7.3.2 Organization Chart of NPCC
Maintenance System
(1) Organization of GSO The contents of the operation and maintenance are a work project of the system operation organization (GSO) The GSO operates and maintains the transmission and transformation of electric energy facilities of 500/220KV in Pakistan. Four control districts of GSO in Pakistan are unified: the southern district is based in Hyderabad; the central district is based in Multan; the north-central district is based in Lahore and the northern district is based in Islamabad. The organization of GSO is shown in the following figure. As for this project, the operation and maintenance of the facilities are performed under the supervision of the Chief Engineer (GSO) Islamabad in the following figure. According to the project, it considers its staffing to be appropriate, and there is no schedule to do special personnel reinforcement in NTDCL for the maintenance operation, and if necessary it could be done by reassignment of personnel. In this project, it plans the installation of the LL line. We consider the GSO to be capable of operating this line continuously without problems, based on the explanation following project completion. But when a particularity related to operations is confirmed in the detailed design, it is reviewed by the consultant in charge who provides training with regard to how to handle it. The organisation chart of GSO in the Islamabad region is shown below.
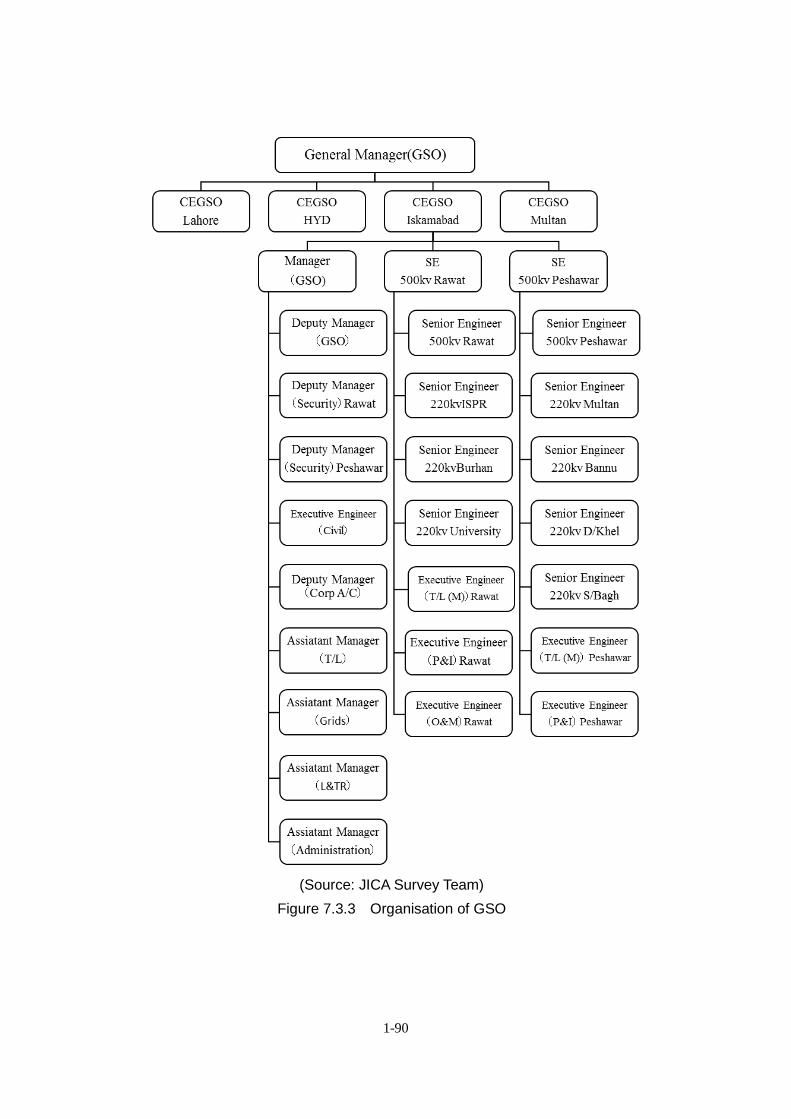
1-90
(Source: JICA Survey Team) Figure 7.3.3 Organisation of GSO

1-91
(2) The system of inspection and maintenance Inspection and maintenance system at each substation is as follows.
i) Operation & Maintenance of Grid Stations (a) Operational Crew Staff is deployed around the clock to operate, monitor and record the metering system, and has close liaison with Control Centers (NPCC / RCC / PDC).
(b) Maintenance crew Maintenance staff is responsible for the maintenance of power transformer and ancillary equipment. Routine maintenance and testing of equipment, replacement of defective equipment, if any, including CBs, CTs, isolators and station batteries is carried out by the crew.
(c) P&I crew Protection and instrumentation staff is responsible for maintaining all the protection systems installed. Attend all kinds of faults round the clock and isolate the defective points to ensure uninterrupted power supply Protection schemes installed on various equipment, integrated relays and control accessories are properly tested by the staff.
ii) Operation & Maintenance of T/Lines 500kv T/Line・・・・・・・・・ (939.34 ㎞)
220kv T/Line・・・・・・・・・ (2507.01 ㎞)
Maintenance of T/Lines is carried out by the following staff:
(a) Dead line crew Responsible for routine patrolling of T/Lines, maintenance at site and remedying all kinds of breakdowns. Cutting / trimming of trees underneath T/Lines, backfilling of tower bases, reporting problems and remedying all problems on T/Lines is the responsibility of this crew.
(b) Live line crew Responsible for maintenance work on live lines such as conductor repair, damaged / punctured insulation discs replacement and spacers repair / replacement.
iii) An example of the distribution of personnel at a substation is shown below.

1-92
Figure 7.3.4 Example of distribution of personnel at a substation
DEPUTY MANAGER(1)
ASSISTANT MANAGER
OPERATION(1)
ASISTANT MANAGER
SHIFT(2)
SHIFT OPERRATOR(16)
DRIVER(1)
ASSISTANT MANAGER
MENTENANCE(1)
FOREMAN(1)
ASSISTANT FORMAN(2)
OTHERS(8)
DRIVER(1)
SUB ENGINEER(1)
MASON(1)
MALI(6)
OTHERS(5)
ASSISTANT MANAGER(1)
TEST INSPECTOR(1)
LAB ASSISTANT(1)
OTHERS(3)
DIVISIONAL ACOUNTS OFICER(1)
ACOUNT ASSISTANT(1)
OTHERS(3)
SECURITY OFFICER(1)
SECURITY INSPECTOR(1)
SECURITY SERGENT(4)
SECURITY GUARD(26)

1-93
Invitation to Japan Purpose
The purpose of the visit was to inspect the power transmission lines of a Japanese electric power company and other advanced technologies employed by the Japanese electric power company. Therefore NTDCL mission members visited Japanese electric power company and electric power facilities which utilised the latest advanced technologies developed by Japanese commercial companies (electric power companies and manufacturers) and then an explanatory meeting was held to examine how to apply these Japanese advanced technologies to NTDCL.
Mission Members of Japan Visit
The National Transmission and Distribution Company Limited (NTDCL) selected approximately 9 persons below the General Manager Class and they were invited to Japan. Members are shown as below Table 8.2.1.
Table 8.2.1 NTDCL Invitees to Japan Post, Position Office place
1 General Manager (Planning), Lahore PIA building, Lahore
2 Chief Engineer (Planning), Lahore PIA building, Lahore
3 Dy, Manager T/L (EHV-2), Multan Multan
4 PD (EHV-1), Islamabad Islamabad
5 Additional Manager 220kV G/S, Mardan Mardan
6 Deputy Manager 220kV G/S, Sangjani Islamabad
7 Deputy Manager (Design), Lahore WAPDA house, Lahore
8 Deputy Manager T/L (M) Div. 500kV G/S, Peshawar Peshawar
9 Assistant Manager Planning (Power) Lahore PIA Building, Lahore
(Source: JICA Survey Team)

1-94
Schedule
The schedule is shown in Table 8.3.1. The main facilities of the electric power company to be visited were the Central Control Center which controls the main electric power system of Kansai Electric Power, an AC-DC converter station named Kihoku Converter Station which receives 500 kV DC power from the power station in Shikoku island, a 500 kV substation and the East Area Control Center which controls several 500 kV substations of Kansai Electric Power. Furthermore, in the Kanto area of Japan, NTDCL visited advanced high technology conductors, which are low loss conductors (The maker was JPS in Hitachi factory). They also visited an electric power equipment maker, Toshiba, in its Hamakawasaki factory.

1-95
Table 8.3.1 Overall schedule of knowledge co-creation program for NTDCL officers from February 10th to 20th, 2016
February 10th, 2016
(Source: JICA Survey Team)
Outcome of Invitations for Training in Japan
(1) NTDCL members inspected the Central Control Center of Kansai Electric Power Company and they learned the control conditions of Japanese electric power company. It is very useful for NTDCL to improve the control conditions of their transmission grid in Pakistan.
Date Description of Activities Location for Activities
1 Feb 10th (Wed)
Lahore ‐ Bangkok N/A
2 Feb 11th
(Thu) Bangkok – Tokyo Tokyo - Osaka
(Osaka)
3 Feb 12th
(Fri) To visit the Central power control center of KEPCO
KANSAI Central power control center (Osaka)
4 Feb 13th
(Sat) Internal meeting and document settlement
(Osaka)
5 Feb 14th
(Sun) Internal meeting and document settlement
(Osaka)
6 Feb 15th
(Mon) -To visit the Kihoku Convertor station (AC-DC) of KEPCO -To visit Mobile Transformer of KEPCO
-KANSAI Kihoku convertor station (AC-DC) -KANSAI substation
(Osaka)
7 Feb 16th (Tue)
-To visit Nishi kyoto Control center of KEPCO -Travel from Kyoto to Hitachi
-KANSAI Nishi kyoto Control center (Hitachi)
8 Feb 17th
(Wed)
-To visit the transmission line conductor factory of the Sumitomo Denko -Travel from Hitachi to Tokyo
-Sumitomo Denko Hitachi factory
(Tokyo)
9 Feb 18th
(Thu) -To visit the Toshiba Hamakawasaki and Futyu factories
Power Analysis Simulator and GIS inspection
-Toshiba Hamakawasaki and Futyuu factories
(Tokyo)
10
Feb 19th
(Fri)
-Courtesy call to Pakistan Embassy in Japan -The meeting with JICA HQ officers
Wrap-up Discussion with JICA HQ officers and JICA Expert team
-Travel from Tokyo to Narita air port
-Pakistan Embassy -JICA HQ
(Tokyo)
11 Feb 20th
(Sat)
[Return to Pakistan] Narita, Tokyo – Bangkok Bangkok - Lahore
N/A

1-96
(2) They visited the Kihoku DC convertor center and DC transmission line of Kansai Electric Power. They deepened their knowledge of construction of future DC transmission lines in Pakistan.
(3) They visited a 500 kV substation of Kansai Electric Power and they deepened their knowledge of GIS which will be constructed in the near future in Pakistan.
(4) They inspected the low loss transmission line conductor (LL-ACSR) which was manufactured by Sumitomo Electric factory and observered the manufacturing process of LL-ACSR. They were briefed on the performance of LL-ACSR and they deepened their knowledge of LL-ACSR which will be used in future projects in Pakistan.
(5) They visited Toshiba, the electric power equipment manufacturer which manufactured GIS and Arrestor. Then they deepened their knowledge of Japanese electric power equipment which has not been supplied so often in Pakistan.

1-97
ANNEX
1.4.1-1 IKL map in the area of existing transmission line
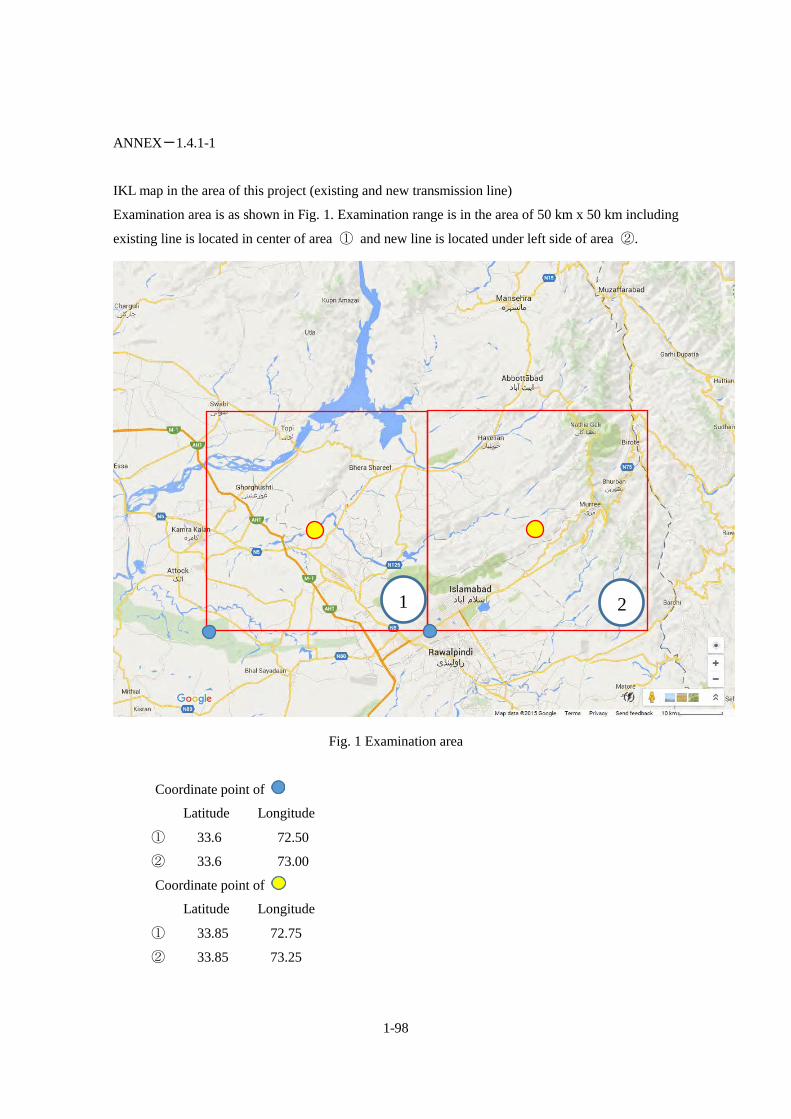
1-98
ANNEX-1.4.1-1
IKL map in the area of this project (existing and new transmission line)
Examination area is as shown in Fig. 1. Examination range is in the area of 50 km x 50 km including
existing line is located in center of area ① and new line is located under left side of area ②.
Fig. 1 Examination area
Coordinate point of
Latitude Longitude
① 33.6 72.50
② 33.6 73.00
Coordinate point of
Latitude Longitude
① 33.85 72.75
② 33.85 73.25
1 2
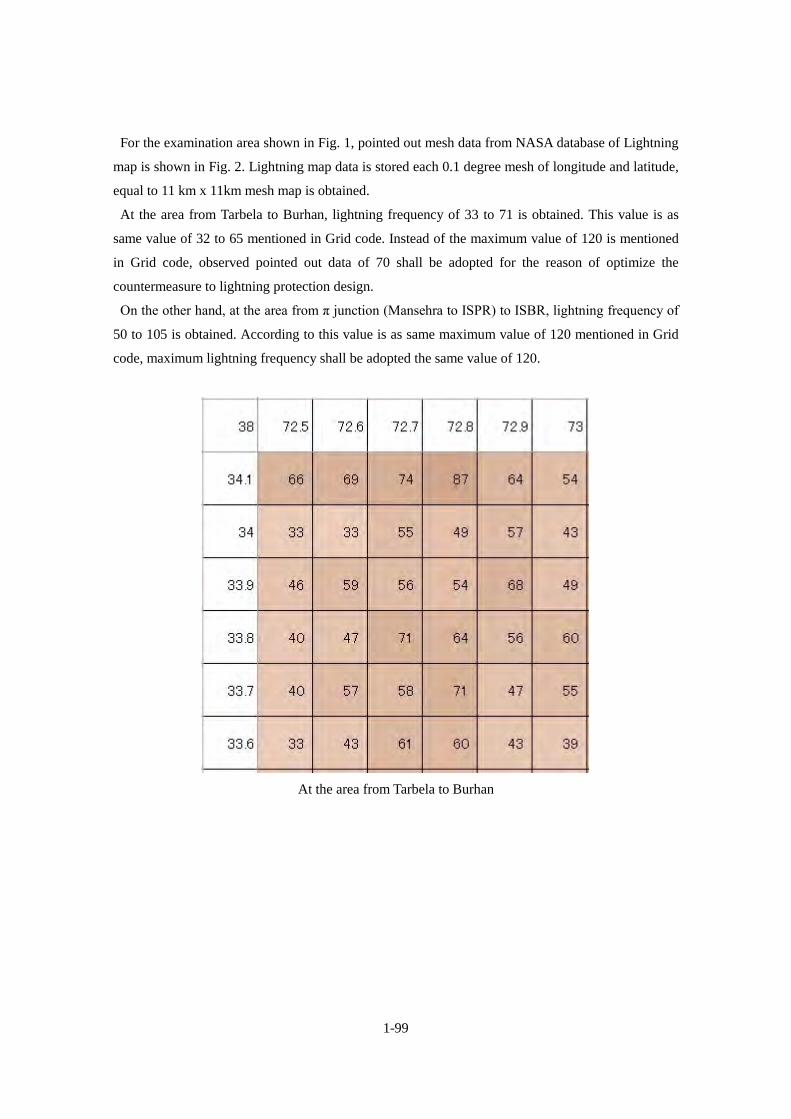
1-99
For the examination area shown in Fig. 1, pointed out mesh data from NASA database of Lightning
map is shown in Fig. 2. Lightning map data is stored each 0.1 degree mesh of longitude and latitude,
equal to 11 km x 11km mesh map is obtained.
At the area from Tarbela to Burhan, lightning frequency of 33 to 71 is obtained. This value is as
same value of 32 to 65 mentioned in Grid code. Instead of the maximum value of 120 is mentioned
in Grid code, observed pointed out data of 70 shall be adopted for the reason of optimize the
countermeasure to lightning protection design.
On the other hand, at the area from π junction (Mansehra to ISPR) to ISBR, lightning frequency of
50 to 105 is obtained. According to this value is as same maximum value of 120 mentioned in Grid
code, maximum lightning frequency shall be adopted the same value of 120.
At the area from Tarbela to Burhan

1-100
At the area from π junction (Mansehra to ISPR) to ISBR
Fig. 2 Pointed out mesh data from lightning map supplied by NASA (55 km x 55 km)

Volume 2.
Plan of Reinforcement of Existing Transmission Line

2-i
Contents –Vol.2–
Volume.2 Plan of Reinforcement of Existing Transmission Line ......................................................... 1 Purpose of this Work ........................................................................................................ 1 Current Situation of Power Flow and Voltage of the Target System of the Project .......... 2
Power Flow and Voltage ......................................................................................................... 2 Power System Analysis ........................................................................................................... 3
Outline of Existing Transmission Line Reinforcement Plan .......................................... 19 Transmission Line ................................................................................................................. 19 Substations ............................................................................................................................ 40
Drawings ........................................................................................................................ 51 Outline Drawings of Tower ................................................................................................... 51 Outline Drawings of Tower Foundation................................................................................ 53
Construction Method ...................................................................................................... 54 Problems of Current Construction Method ........................................................................... 54 Study of Construction Method .............................................................................................. 54 Special Construction Method and Special Instructions ......................................................... 54 Safety Measures during Construction ................................................................................... 55 Implementation Schedule (Confidential) .............................................................................. 55
Cost Estimation of Existing Transmission Line Reinforcement ..................................... 56 Cost Estimation of Existing Transmission Line Reinforcement (Confidential) .................... 56 Consulting Service ................................................................................................................ 56
Financial and Economic Analysis and Business Evaluation........................................... 59 Financial and Economic Analysis ......................................................................................... 59 Estimation of reduction of CO2 ............................................................................................ 67 Operation and effect Indicators ............................................................................................. 68 Project evaluation .................................................................................................................. 71
Environmental Social Consideration .............................................................................. 74 Basic Social and Natural Environment ................................................................................. 74 Comparison of Alternatives .................................................................................................. 76 Scoping Result and TOR of Survey ...................................................................................... 79 Results of social and environmental survey (Including projection) ...................................... 85 Mitigation Measures and Its Cost ....................................................................................... 102 Monitoring Plan .................................................................................................................. 104 Stakeholder meetings .......................................................................................................... 106 Necessity of land acquisition, resettlement and its extent ................................................... 106

2-ii
Practical Measures of Compensation and Assistance ......................................................... 107 Community Consultation .................................................................................................. 108 Monitoring Form (Draft) ................................................................................................... 108 Environmental Checklist ................................................................................................... 109

2-iii
Contents of Tables –Vol.2–
Table 2.1.1 Power Flow Record of the Project Target 220kV System in 2013 and 2014 ... 2 Table 2.1.2 Bus Voltage Record of Substations in the Target 220kV System under Normal
Operating Conditions in 2014 ........................................................................................ 3 Table 2.2.1 Project Scope for Analysis ............................................................................... 7 Table 2.2.2 Conductor Types assumed for Power System Analysis Model (“Without
project” Case) ................................................................................................................. 8 Table 2.2.3 Line Constants used for Power System Analysis Model ................................. 8 Table 2.2.4 Fault Sections Assumed for N-1 Contingency Condition ................................ 8 Table 2.2.5 Power Flow Analysis Results (2018 Summer Peak) ...................................... 10 Table 2.2.6 Power Flow Analysis Results (2020 Summer Peak and Winter Off-peak Load
Conditions) ................................................................................................................... 12 Table 2.2.7 Three-phase Short-circuit Fault Current in 2018 ........................................... 16 Table 2.2.8 Three-phase Short-circuit Fault Current in 2020 ........................................... 16 Table 2.2.9 Fault Section .................................................................................................. 17 Table 2.2.10 Fault Sequence ............................................................................................. 17 Table 2.2.11 Transient Stability Analysis Results ............................................................. 18 Table 3.1.1 Distance of Section for Existing Transmission Line ...................................... 19 Table 3.1.2 Tower Type and Numbers of Tower for Existing Transmission Line ............ 20 Table 3.1.3 List of Tower Type for Each Existing Transmission Line ............................. 20 Table 3.1.4 Existing Transmission Line Tarbela-Burhan .................................................. 27 Table 3.1.5 Existing Transmission Line Tarbela-Burhan-ISPR ........................................ 28 Table 3.1.6 Characteristics of Conductors ........................................................................ 35 Table 3.1.7 Specifications of Insulators ............................................................................ 37 Table 3.1.8 Suspension tower Design Condition .............................................................. 37 Table 3.2.1 Basic Specifications of each Substation ........................................................ 41 Table 3.2.2 Maximum current flow of Each of Each Main Busbar .................................. 42 Table 7.1.5 Benefits of implementation of the project...................................................... 60 Table 7.1.6 Assumptions for estimating IRR .................................................................... 60 Table 7.1.7 Financial internal rate of return (FIRR) ......................................................... 62 Table 7.1.8 Assumptions for estimation of IRR ............................................................... 64 Table 7.1.9 Economic internal rate of eturn (EIRR) ......................................................... 66 Table 7.3.1 Operation and Effect Indicators (Part 1) , Plant Factor (%) ........................... 69 Table 7.3.2 Basic Data for Calculation of Operation and Effect Indicators for Maximum
Load (MW) .................................................................................................................. 69

2-iv
Table 7.3.3 Basic Data for Calculation of Operation and Effect Indicators Rated Capacity of Transmission Line (MVA) ....................................................................................... 70
Table 7.3.4 Operation and effect indicators (2) the amount of transmitted power (MWh) ..................................................................................................................................... 70
Table 7.3.5 Operation and Effect Indicators (Part 3) Loss Power Rate (%) ..................... 71 Table 7.4.1 Internal Rate of Return, Investment Recovery Period and B / C ratio ........... 71 Table 7.4.2 Sensitivity Analysis of Financial Internal Rate of Return (FIRR) ................. 72 Table 7.4.3 Sensitivity Analysis of Economic Internal Rate of Return (EIRR)................ 73 Table 8.1.1 Population of Project Area ............................................................................. 75 Table 8.1.2 Literacy Rates in the Project Area ................................................................. 76 Table 8.2.1 Result of comparison of alternatives.............................................................. 78 Table 8.2.2 Comparison of reinforcement of towers ........................................................ 79 Table 8.3.1 Result of Scoping ........................................................................................... 80 Table 8.3.2 Draft TOR for Environmental and Social Survey ............................................... 83 Table 8.4.1 Ambient Air Quality of the Project Area ............................................................ 86 Table 8.4.2 Water Quality Standards and Sample Results ................................................. 88 Table 8.4.3 Status of Species Belonging to Dominant Families ............................................ 91 Table 8.4.4 Breakdown of Species by Life Form ................................................................. 91 Table 8.4.5 List of birds under protection ............................................................................ 92 Table 8.4.6 List of birds observed in the survey area ....................................................... 93 Table 8.4.7 List of mammals observed/reported in the project area ................................. 95 Table 8.4.8 List of reptiles reported from study area ........................................................ 96 Table 8.4.9 Number of encroachments................................................................................ 97 Table 8.4.10 Number of Hospitals ...................................................................................... 98 Table 8.4.11 Assumed accidents and countermeasures .................................................. 100 Table 8.4.12 Scoping and Survey Result ........................................................................... 101 Table 8.5.1 Mitigation Measures ...................................................................................... 103 Table 8.6.1 Monitoring Plan ........................................................................................... 105 Table 8.7.1 Stakeholder meetings ................................................................................... 106 Table 8.8.1 Land for Compensation ............................................................................... 107 Table 8.9.1 Entitlement Matrix ....................................................................................... 108 Table 8.11.1 Monitoring form (Construction Stage) ...................................................... 109 Table 8.11.2 Monitoring form (Compensation) .............................................................. 109 Table 8.12.1 Environmental Checklist ............................................................................ 110

2-v
Contents of Figures –Vol.2–
Figure 2.2.1 Power Flow Diagram (Year 2015, N-1 Contingency Condition, Fault Section: Tarbela-Burhan Circuit No.3) .......................................................................... 4
Figure 2.2.2 Power Flow Diagram (Year 2017, Normal Operation Condition) ................. 5 Figure 2.2.3 Power Flow Diagram (Year 2020, N-1 Contingency Condition, Fault
Section: Tarbela-Burhan Circuit No.3) .......................................................................... 6 Figure 2.2.4 System Configuration of the Project Scope to be Analysed (Year 2018) ....... 7 Figure 2.2.5 Power Flow Diagram for Plan 8 (Normal Operation: 2018 Summer Peak) . 10 Figure 2.2.6 System Configuration of the Project Target Area in 2020 ............................ 11 Figure 2.2.7 Power Flow Diagram (2019 Summer Peak, N-1 Contingency Condition
(Fault section: Tarbela-Burhan Circuit No.1) .............................................................. 13 Figure 2.2.8 Power Flow Diagram (Without Project: Under Normal Operating
Conditions) ................................................................................................................... 14 Figure 2.2.9 Power Flow Diagram (Without Project: N-1 Contingency Condition) ........ 15 Figure 3.1.1 Route Map of Existing Transmission Line ................................................... 19 Figure 3.1.2 Framing Elevation of Suspension Tower ..................................................... 22 Figure 3.1.3 Framing Elevation of Strain Tower .............................................................. 23 Figure 3.1.4 Outline Drawings of Spread Footing ........................................................... 24 Figure 3.1.5 Outline Drawings of Pile Foundations ......................................................... 25 Figure 3.1.6 Numbers of accidents for existing transmission line relate to this project ... 26 Figure 3.1.7 Landform around Target Area ...................................................................... 29 Figure 3.1.8 Longitudinal Profile of Tarbela-Burhan ....................................................... 30 Figure 3.1.9 Longitudinal Profile of Burhan-ISPR .......................................................... 30 Figure 3.1.10 Outline of Project Scope for Reinforcement of Existing Transmission Line
..................................................................................................................................... 33 Figure 3.1.11 Outline diagram of OP-AC97sq ................................................................. 36 Figure 3.1.12 Comparison of sag of each conductor (No wind and snow, 90 deg. C,
T=1,970kg/wire) .......................................................................................................... 38 Figure 3.1.13 Evaluation of Transmission Loss ............................................................... 40 Figure 3.2.1 Layout of Burhan Substation ........................................................................ 44 Figure 3.2.2 Single Line Diagram of Burhan Substation ................................................. 45 Figure 3.2.3 Layout of ISPR Substation ........................................................................... 47 Figure 3.2.4 Single line diagram of ISPR Substation ....................................................... 48 Figure 3.2.5 Single line diagram (220kV line) of Tarbela Substation .............................. 50 Figure 4.1.1 Framing elevation of EA-Type Suspension Tower ....................................... 51

2-vi
Figure 4.1.2 Framing Elevation of EG-Type Tension Tower ............................................ 52 Figure 4.2.1 Outline Drawings of Spread Foundation ...................................................... 53 Figure 4.2.2 Outline Drawings of Pile Foundation ........................................................... 53 Figure 8.1.1 Administrative Boundaries ........................................................................... 74 Figure 8.4.1 Natural reserves and protected areas near the project site ............................ 85 Figure 8.4.2 Water Sources and sampling points .............................................................. 87

2-1
Volume.2 Plan of Reinforcement of Existing Transmission Line Purpose of this Work
In order to respond to the increased electric power demand of the Burhan district of the Islamabad・Capital Area in Pakistan, the fourth expansion of the Tarbela Hydro Power Station (1410 MW) is proceeding until the year of 2017. The purpose of this work is; Transmission line reinforcement responding to the expansion of power from Tarbela Hydro
Power Station. To respond to future increased electric power demand in the Tarbela-Burhan-ISPR
transmission network. To improve reliability of electric power supply to IESCO.
The replacement of two transmission lines from Tarbela Hydro Power Station to Burhan substation (1 route, 2 transmission lines) is carried out by NTDCL itself and another two transmission lines from Tarbela – Burhan – ISPR (1 route, 2 transmission lines) are replaced by international funding agencies. LL-ACSR is to be used as the new transmission conductor in Pakistan. LL-ACSR decreases loss of transmission lines effectively. It provides cost reduction for operation and maintenance as well as environmental protection. This project contributes to increased reliability of electric power supply in the Islamabad and Burhan area.

2-2
Current Situation of Power Flow and Voltage of the Target System of the Project
Power Flow and Voltage The power flow record of the 220kV project target system in 2013 and 2014 is summarised in
Table 2.1.1. The loading of the circuits 1 to 3 of the section between Tarbela power station and Burhan substation (transmission capacity is 337MVA) was between 65.5 to 67.7%. Until completion of 4th extension of the Tarbela Hydro Power Station, the power flow of the remaining circuits would be within 100% of the transmission capacity even if single circuit fault occurs.1
Table 2.1.1 Power Flow Record of the Project Target 220kV System in 2013 and 2014
From
To
Circuit
No. Conductor
Thermal
Capacity
(MVA)
Loading (%, MW)
2013 2014
Tarbela Burhan 1 Single-Rail 337 67.7% 65.5%
194MW 188MW
Tarbela Burhan 2 Single-Rail 337 67.7% 65.5%
194MW 188MW
Tarbela Burhan 3 Single-Rail 337 67.7% 65.5%Ta
194MW 188MW
Tarbela ISPR 1 Single-Rail 337 70% 52%
201MW 149MW
(Source: JICA Survey Team (based on information provided by NPCC))
The record of the highest and lowest bus voltage of each substation in the target 220kV system under normal operating conditions in 2014 is shown in Table 2.1.2. The NEPRA Grid Code requires that voltage fluctuation range under normal operating conditions remains within a range of + 8% to -5% of the nominal voltage (238kV ~ 209kV) for 220kV system. However, at Tarbela power plant 220kV bus and Islamabad University substation 220kV bus, incidents where the bus voltage which exceeded 238kV (+8% of nominal voltage) have been recorded. The voltage rise exceeding the allowable range was recorded for a short time due to disturbance on system particularly in rainy weather in winter, and is thus not a chronic situation. In order to 1 Based on the power flow analysis result, power flow increase under single circuit fault of the circuit 1 or 2 of Tarbela-Burhan section is 129%. Therefore, the power flow in the case of the fault in question is estimated as 87.4% considering that the maximum recorded loading of the Tarbela-Burhan section was 67.7%.

2-3
maintain bus voltage within the allowable range, such voltage control measures as generator excitation, on-load tap changing transformers, capacitor bank operation on DISCO’s network, and in extreme cases, load shedding, are implemented.
Table 2.1.2 Bus Voltage Record of Substations in the Target 220kV System under Normal Operating Conditions in 2014
Name of Power
Station/Grid Station
Maximum
Voltage (kV)
% of Nominal
Voltage
Minimum
Voltage (kV)
% of Nominal
Voltage
Tarbela 245 111.3 224 101.8
Burhan 236 107.3 211 95.9
ISPR 231 105.0 210 95.5
(Source: JICA Survey Team (based on information provided by NPCC))
Power System Analysis Review of PC-1
In PC-1, power flow analysis was carried out for the summer peak in 2015, 2017, and 2020. According to the analysis results, without implementation of transmission line reinforcement of Tarbela-Burhan and Tarbela-Burhan-ISPR sections (replacement of single Rail conductor with twin-bundled Rail conductor), either Tarbela-Burhan circuit No.1 or No.2 was overloaded under N-1 contingency condition (either single circuit fault of Tarbela-Burhan circuit No.3 or Tarbela-ISPR circuit No.1) (Figure 2.2.1). In the analysis; LGJQ-4002 conductor is assumed as the conductor for Tarbela-Burhan circuit 1 and 2, whereas a single Rail conductor is actually used for the section.
2 LGJ stands for a type of Chainese Aluminum Conductor Steel Rainforced (ACSR) and Q is omissible.
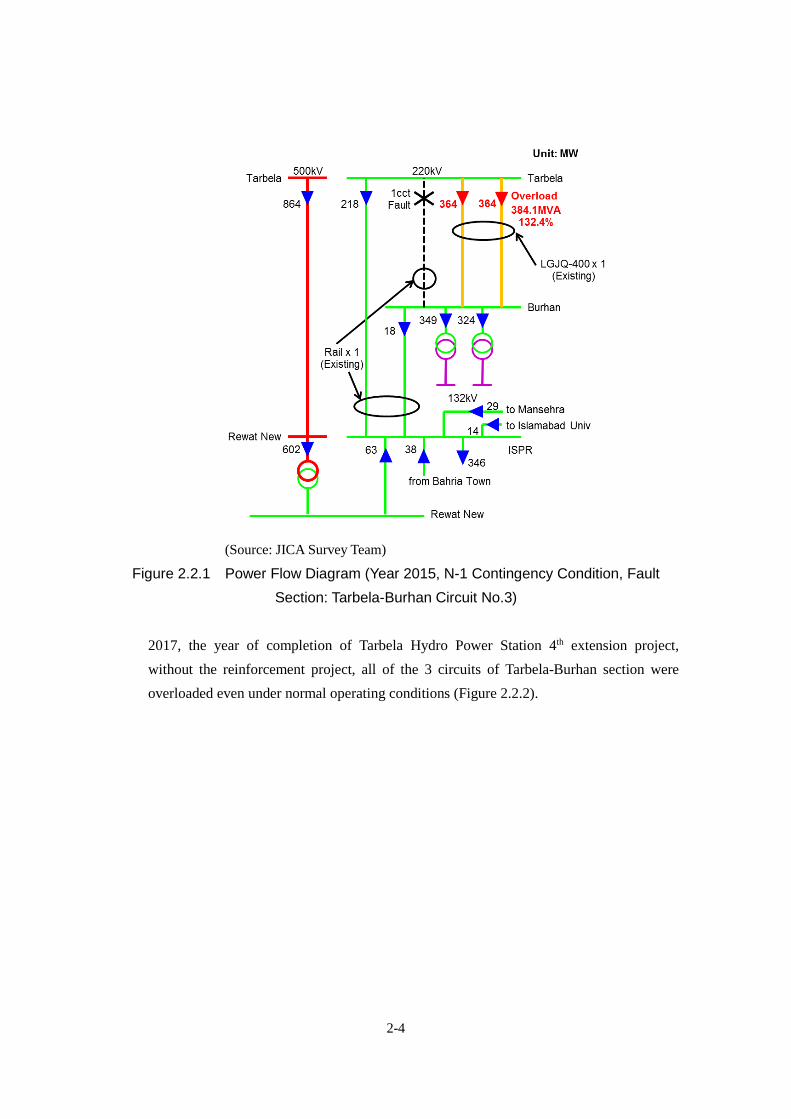
2-4
(Source: JICA Survey Team)
Figure 2.2.1 Power Flow Diagram (Year 2015, N-1 Contingency Condition, Fault Section: Tarbela-Burhan Circuit No.3)
2017, the year of completion of Tarbela Hydro Power Station 4th extension project, without the reinforcement project, all of the 3 circuits of Tarbela-Burhan section were overloaded even under normal operating conditions (Figure 2.2.2).

2-5
(Source: JICA Survey Team)
Figure 2.2.2 Power Flow Diagram (Year 2017, Normal Operation Condition)
In 2020, after start of operation of the Islamabad West substation, the power flow of the Tarbela-Burhan section will be greatly reduced, thus even under severest the fault condition, in other words, in the case of N-1 contingency of Tarbela-Burhan circuit No.3 or that of Tarbela-Kamra circuit No.1, power flow on the other transmission lines as well as voltage profile of the system would remain within limits (Figure 2.2.3). On the other hand, with the transmission reinforcement project, no overload of the transmission lines occurred for the summer peak in 2015, 2017, and 2020, respectively.

2-6
(Source: JICA Survey Team)
Figure 2.2.3 Power Flow Diagram (Year 2020, N-1 Contingency Condition, Fault Section: Tarbela-Burhan Circuit No.3)
Power Flow and Voltage Analysis
As the power flow and voltage analysis study years, 2018 (immediately after completion of Tarbela hydropower station 4th extension project 3 (1,410MW)) and 2020 (expected completion year of Tarbela hydropower station 5th extension project (1,410MW)) were selected. For 2018, the summer peak load condition, and for 2020, both summer peak load and winter off-peak load conditions were analysed.
System Configuration for Analysis The system configuration to be analysed includes both the project to be implemented by NTDCL’s own fund and that to be implemented in the scope of this project as shown in Table 2.2.1. The system configuration of the project scope is shown in Figure 2.2.4 for the other project scopes that were examined in the course of consultation with NTDCL in this survey are shown in ANNEX 2.2.2.-1.
3 According to the information in the PC-1 prepared by NTDCL Planning Power in July 2014, the expected Tarbela 4th extension project completion year was 2017; however, based on the information obtained inthe interview with the World Bank in December 2015, the expected commissioning year will be 2018. Therefore, the updated information was taken into consideration.
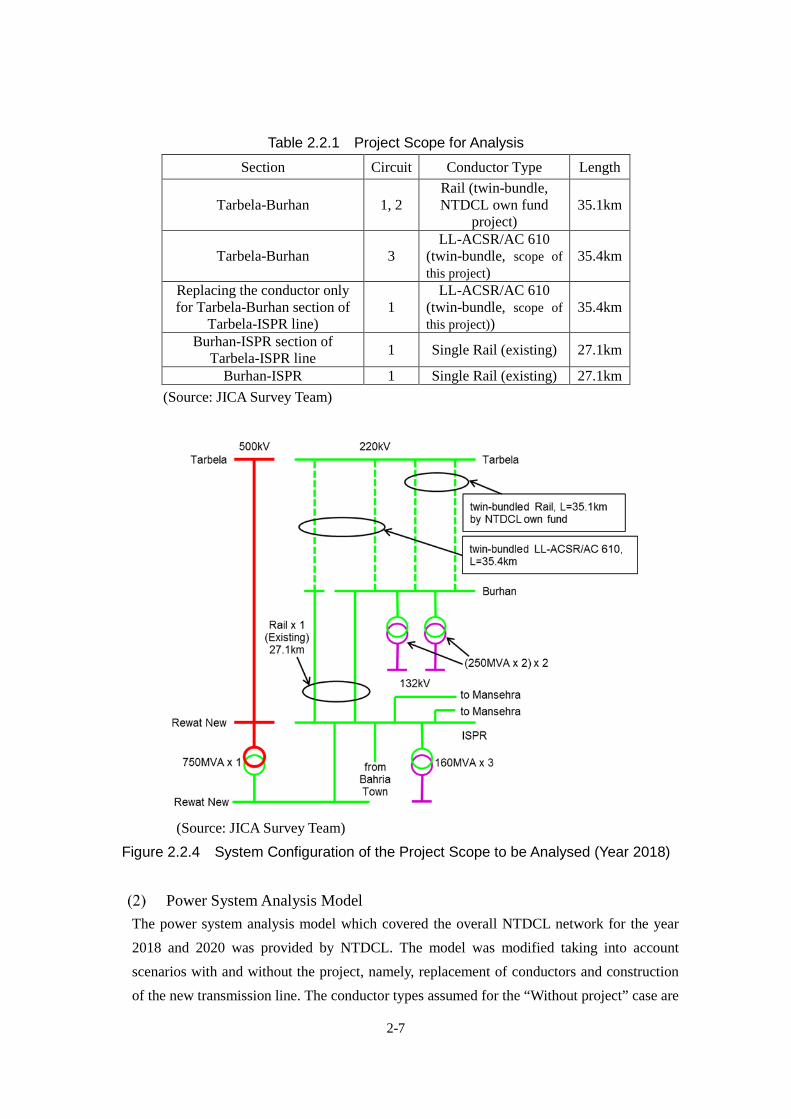
2-7
Table 2.2.1 Project Scope for Analysis Section Circuit Conductor Type Length
Tarbela-Burhan 1, 2 Rail (twin-bundle, NTDCL own fund
project) 35.1km
Tarbela-Burhan 3 LL-ACSR/AC 610
(twin-bundle, scope of this project)
35.4km
Replacing the conductor only for Tarbela-Burhan section of
Tarbela-ISPR line) 1
LL-ACSR/AC 610 (twin-bundle, scope of this project))
35.4km
Burhan-ISPR section of Tarbela-ISPR line 1 Single Rail (existing) 27.1km
Burhan-ISPR 1 Single Rail (existing) 27.1km (Source: JICA Survey Team)
(Source: JICA Survey Team) Figure 2.2.4 System Configuration of the Project Scope to be Analysed (Year 2018)
Power System Analysis Model The power system analysis model which covered the overall NTDCL network for the year 2018 and 2020 was provided by NTDCL. The model was modified taking into account scenarios with and without the project, namely, replacement of conductors and construction of the new transmission line. The conductor types assumed for the “Without project” case are
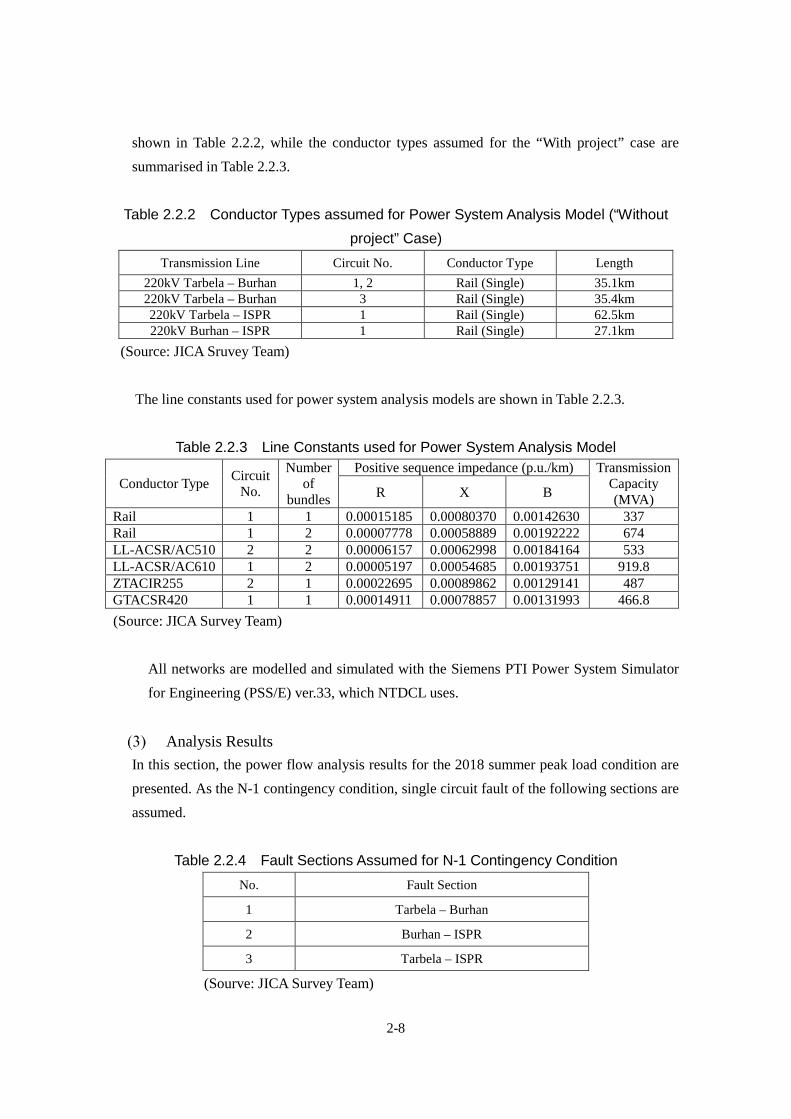
2-8
shown in Table 2.2.2, while the conductor types assumed for the “With project” case are summarised in Table 2.2.3.
Table 2.2.2 Conductor Types assumed for Power System Analysis Model (“Without project” Case)
Transmission Line Circuit No. Conductor Type Length 220kV Tarbela – Burhan 1, 2 Rail (Single) 35.1km 220kV Tarbela – Burhan 3 Rail (Single) 35.4km 220kV Tarbela – ISPR 1 Rail (Single) 62.5km 220kV Burhan – ISPR 1 Rail (Single) 27.1km
(Source: JICA Sruvey Team)
The line constants used for power system analysis models are shown in Table 2.2.3.
Table 2.2.3 Line Constants used for Power System Analysis Model
Conductor Type Circuit No.
Number of
bundles
Positive sequence impedance (p.u./km) Transmission Capacity (MVA) R X B
Rail 1 1 0.00015185 0.00080370 0.00142630 337 Rail 1 2 0.00007778 0.00058889 0.00192222 674 LL-ACSR/AC510 2 2 0.00006157 0.00062998 0.00184164 533 LL-ACSR/AC610 1 2 0.00005197 0.00054685 0.00193751 919.8 ZTACIR255 2 1 0.00022695 0.00089862 0.00129141 487 GTACSR420 1 1 0.00014911 0.00078857 0.00131993 466.8 (Source: JICA Survey Team)
All networks are modelled and simulated with the Siemens PTI Power System Simulator for Engineering (PSS/E) ver.33, which NTDCL uses.
Analysis Results In this section, the power flow analysis results for the 2018 summer peak load condition are presented. As the N-1 contingency condition, single circuit fault of the following sections are assumed.
Table 2.2.4 Fault Sections Assumed for N-1 Contingency Condition No. Fault Section
1 Tarbela – Burhan
2 Burhan – ISPR
3 Tarbela – ISPR
(Sourve: JICA Survey Team)

2-9
With Project Case [Power Flow Analysis Results (2018 Summer Peak Load Condition)] The power flow analysis result for the year 2018 summer peak load condition is summarised in Table 2.2.5. Also, the power flow diagrams for N-1 contingency condition are shown in Appendix 2.2.2-2. 3 units of 220/132kV transformers (160MVA/unit) at the ISPR substation are overloaded with 102.2% (163.4MVA/unit) loading of the rated capacity of the transformers even under normal operating conditions. In the case of single line fault of Tarbela-Burhan section, the loading of the transformers reaches 102.6% (164.2MVA/unit); however, it is regarded permissible under emergency operating conditions. In the case of single line fault of either Tarbela-ISPR or Burhan-ISPR, loading of the 220/132kV transformers at ISPR substation decreases below 100% of their rated capacities. On the other hand, loading of the 220/132kV transformers (250MVA/unit) at Burhan substation becomes from 102.2 (255.6MVA/unit) to 103.8% (259.6MVA/unit) of the rated capacity of the transformers. No overload occurred to 220kV transmission lines of the relevant sections. The power flow diagram under normal operating conditions is shown in Figure 2.2.5.

2-10
(Source: JICA Sruvey Team) Figure 2.2.5 Power Flow Diagram for Plan 8 (Normal Operation: 2018 Summer Peak)
Table 2.2.5 Power Flow Analysis Results (2018 Summer Peak)
(Source: JICA Survey Team)
Tarbela-Burhan(circuit 1 or circuit 2)
Tarbela-Burhan(circuit 3) Tarbela-ISPR Burhan-ISPR
Loading of three (3)220/132kV transformers(160MVA/unit) at ISPRsubstation is 102.2%
(163.4MVA/unit)
Loading of three (3)220/132kV transformers(160MVA/unit) at ISPRsubstation is 102.6%
(164.2MVA/unit)
Loading of three (3)220/132kV transformers(160MVA/unit) at ISPRsubstation is 102.6%
(164.2MVA/unit)
Loading of two (2)220/132kV transformers(250MVA/unit) at Burhan
substation is 102.2%(255.6MVA/unit)
Loading of two (2)220/132kV transformers(250MVA/unit) at Burhan
substation is 103.8%(259.6MVA/unit)
Normal Operation
N-1 Contingency

2-11
[Power Flow Analysis Results for the Year 2020] Power flow analysis was carried out for both summer peak and winter off-peak conditions in 2020. The system configuration of the project target area in 2020 is shown in Figure 2.2.6 and the power flow analysis result for the system in 2020 for both summer peak and winter off-peak load conditions are summarised in Figure 2.2.9. The power flow diagrams for N-1 contingency condition are shown in Appendix 2.2.2-3.
(Source: JICA Survey Team) Figure 2.2.6 System Configuration of the Project Target Area in 2020

2-12
As shown in Table 2.2.6, no overload occurred to the relevant transmission lines and transformers under normal operation and N-1 contingency conditions for both summer peak load and winter off-peak load conditions in 2020.
Table 2.2.6 Power Flow Analysis Results (2020 Summer Peak and Winter Off-peak Load Conditions)
(Source: JICA Survey Team) [Power Flow Analysis for the construction period] In the summer of 2019, namely, during the construction period of the project, power supply to Burhan substation will depend on only two lines: Tarbela-Burhan circuit No.1 and 2, reinforcement of which is planned via self-financing by NTDCL since the two circuits 1) Tarbela-Burhan circuit No. 3 and 2) Tarbela-Burhan section of Tarbela-Burhan-ISPR line will become out-of-service. The power flow analysis under N-1 contingency condition (fault section: Tarbela-Burhan circuit No.1) was carried out in order to confirm if the power supply to Burhan by the remaining sound circuit is possible from the viewpoint of the transmission capacity. The following assumptions were used for the analysis: As the power flow analysis model, the model for the 2020 summer peak load condition was
used for modification since the power flow analysis model for the year 2019 summer peak load condition was not provided by NTDCL. The power demand in 2020 is much heavier than that in 2019.
The generators of Tarbela 5th extension project (1,410MW), the expected year of commencement of commercial operation of which is 2020, were set to out-of-service.
The sections 1) Tarbela-Burhan circuit No. 3 and 2) Tarbela-Burhan section of Tarbela-Burhan-ISPR line were set to out-of-service.
Tarbela-Burhan circuit No.1 was assumed as the fault section.
Mansehra-IslamabadWest
Mansehra-IslamabadUniversity
Islamabad University-Islamabad West
Summer PeakNo overloading of
transmission lines ortransformers
Same as on the left Same as on the left Same as on the left
Winter Off-peakNo overloading of
transmission lines ortransformers
Same as on the left Same as on the left Same as on the left
N-1 Contingency
Load Condition Normal Operation

2-13
The power flow analysis result based on the aforementioned assumptions is shown in Figure 2.2.7 Power Flow Diagram (2019 Summer Peak, N-1 Contingency Condition (Fault section: Tarbela-Burhan Circuit No.1). The power flow of the Tarbela-Burhan circuit No. 2, the remaining sound circuit, was 699MW (732.2MVA), which was 108.6% of the transmission capacity of twin-bundled Rail conductor (674MVA). The value is within the allowable limit of overload (120%) under N-1 contingency condition. Strictly speaking, it is recommended to carry out the transient stability analysis; however, the Surge Impedance Load (SIL) of the section in question is approximately 180MW and the length of the section is 35.1km. With this condition, based on the Line Loadability Curve4, the transmission capacity is expected to be 4 times of the SIL, namely, approximately 720MW. Therefore, theoretically, the calculated power flow of 699MW is considered to be within the transmission capacity from the viewpoint of stability. Therefore, theoretically, the calculated power flow of 699MW is considered within the transmission capacity from the viewpoint of stability.
(Source: JICASurvey Team) Figure 2.2.7 Power Flow Diagram (2019 Summer Peak, N-1 Contingency Condition
(Fault section: Tarbela-Burhan Circuit No.1)
4 Analytical Development of Loadability Characteristics for EHV and UHV Transmission Lines, IEEE Transactions on Power Apparatus and Systems, Vol. PAS-98, No.2 March/April 1979
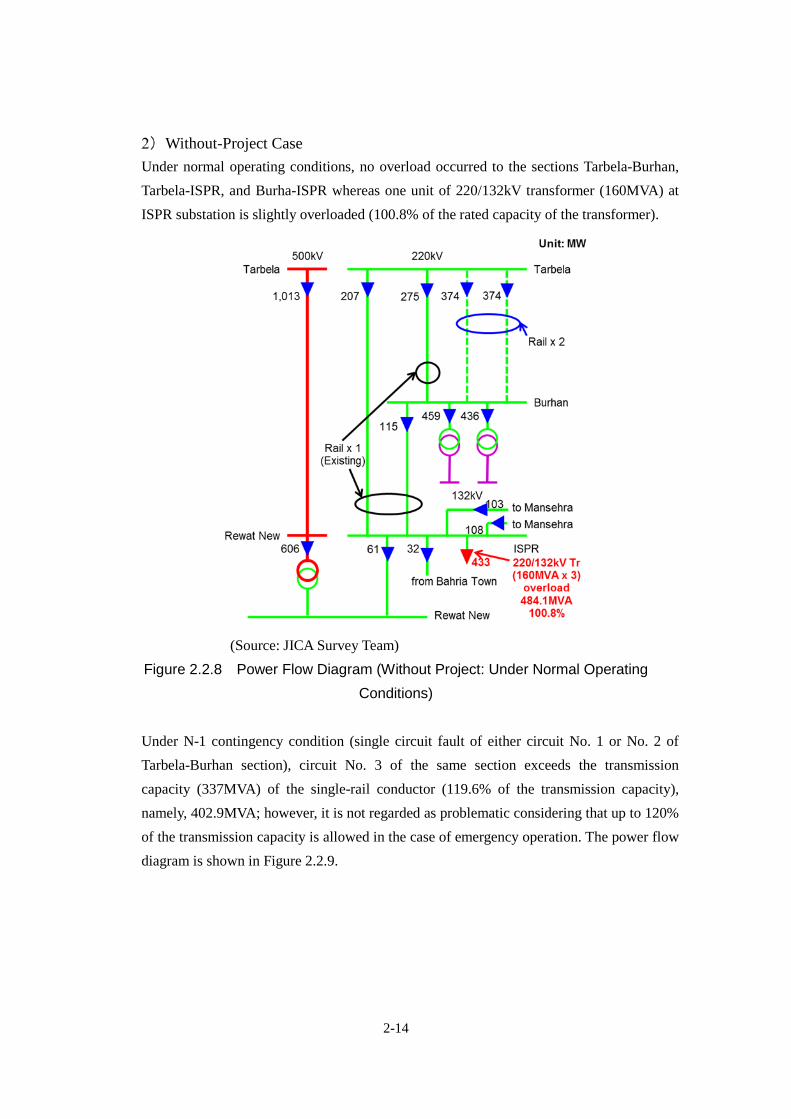
2-14
Without-Project Case Under normal operating conditions, no overload occurred to the sections Tarbela-Burhan, Tarbela-ISPR, and Burha-ISPR whereas one unit of 220/132kV transformer (160MVA) at ISPR substation is slightly overloaded (100.8% of the rated capacity of the transformer).
(Source: JICA Survey Team) Figure 2.2.8 Power Flow Diagram (Without Project: Under Normal Operating
Conditions)
Under N-1 contingency condition (single circuit fault of either circuit No. 1 or No. 2 of Tarbela-Burhan section), circuit No. 3 of the same section exceeds the transmission capacity (337MVA) of the single-rail conductor (119.6% of the transmission capacity), namely, 402.9MVA; however, it is not regarded as problematic considering that up to 120% of the transmission capacity is allowed in the case of emergency operation. The power flow diagram is shown in Figure 2.2.9.

2-15
Figure 2.2.9 Power Flow Diagram (Without Project: N-1 Contingency Condition)
Short-circuit Fault Current Analysis
The three-phase short-circuit fault current was calculated for the substation buses of the Islamabad-Burhan region and its peripheral system for the years 2018 and 2020. The analysis results are summarised in Table 2.2.7 and Table 2.2.8, respectively. In 2020, the three-phase short-circuit fault current value at 220kV Tarbela substation bus and 220kV Islamabad West substation exceeded 40kA, the breaking capacity of the commonly used circuit breakers in the NTDCL system. From the result, it is recommended that the circuit breakers with a breaking capacity of 50kA be adopted for the planned Islamabad West substation.

2-16
Table 2.2.7 Three-phase Short-circuit Fault Current in 2018
(Source: JICA Survey Team)
Table 2.2.8 Three-phase Short-circuit Fault Current in 2020
(Source: JICA Survey Team)
Tarbela 500 25.1
Rewat New 500 24.5
Tarbela 220 33.3
Rewat New-1 220 28.4
Rewat New-2 220 27.9
Burhan 220 27.1
ISPR 220 25.7
Islamabad University 220 22.0
Bus Name Bus Voltage(kV)
IEC60909Three Phase Short-circuit
Fault Current (kA)
Tarbela 500 39.3Islamabad West 500 34.5
Rewat New 500 31.1Tarbela-5th 500 23.5
Tarbela 220 43.2Kamra 220 20.0Burhan 220 32.7
Islamabad West 220 41.2ISPR 220 35.1
Islamabad University 220 29.4Rewat New-1 220 32.1Rewat New-2 220 31.4
Bus Name Bus Voltage(kV)
IEC60909Three Phase Short-circuit
Fault Current (kA)

2-17
Transient Stability Analysis
Transient stability analysis was carried out for the year 2018.5
Evaluation Criteria The system was considered stable if the amplitude of the oscillation waveform of the phase angle difference of the generator rotors of two primary power stations in northern Pakistan area which are close to the Islamabad and Burhan area is likely to converge under N-1 contingency condition of the project target transmission lines for both of the following two cases stated in NEPRA Grid Code:
i) Normal Clearing: Main Protection (5 cycles, 100msec) ii) Stuck Breaker Condition: Back-up Protection (9 cycles, 180msec)
Study Cases Single line three-phase short-circuit fault without reclosing of the sections shown in Table 2.2.9 was assumed for the analysis. The fault sequence is shown in Table 2.2.10.
Table 2.2.9 Fault Section Case No. Fault Section
1 Tarbela – Burhan
2 Burhan – ISPR
3 Tarbela – ISPR
(Source: JICA Survey Team)
Table 2.2.10 Fault Sequence Normal Clearing Condition Stuck Breaker Condition
Time Sequence Time Sequence 0 msec Single circuit three-phase short-
circuit fault occurs. 0 msec Single circuit three-phase short-
circuit fault occurs. 100 msec Fault Cleared (Trip the faulted
Line) 180 msec Fault Cleared (Trip the faulted
Line) 10 sec End of Calculation 10 sec End of Calculation
(Source: JICA Survey Team)
The reference of the phase angle difference is set to Muzaffargarh power station, which is also used by NTDCL Planning Power in their analysis. The following power stations
5 The analysis for the year 2020 cannot be performed at this time since the dynamic data that NTDCL provided was incomplete (the genetor models for several dozens of units were missing). It is necessary to confirm the transient stability in detailed design stage.
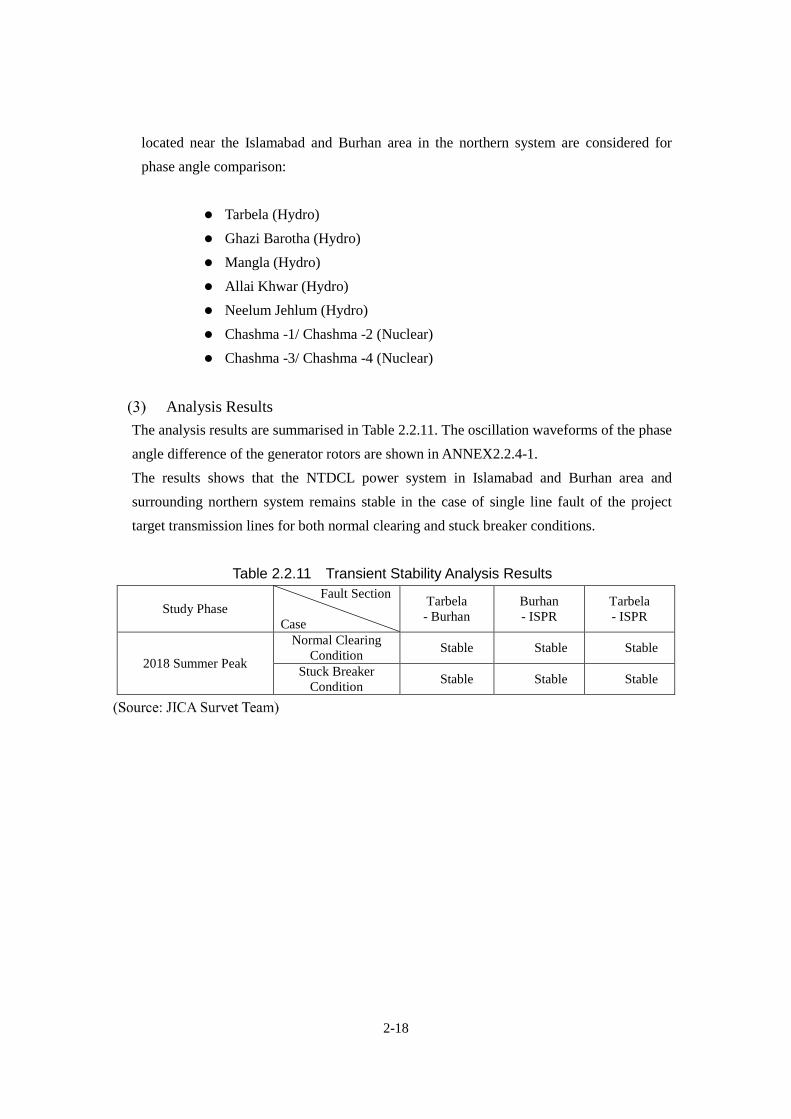
2-18
located near the Islamabad and Burhan area in the northern system are considered for phase angle comparison:
Tarbela (Hydro) Ghazi Barotha (Hydro) Mangla (Hydro) Allai Khwar (Hydro) Neelum Jehlum (Hydro) Chashma -1/ Chashma -2 (Nuclear) Chashma -3/ Chashma -4 (Nuclear)
Analysis Results The analysis results are summarised in Table 2.2.11. The oscillation waveforms of the phase angle difference of the generator rotors are shown in ANNEX2.2.4-1. The results shows that the NTDCL power system in Islamabad and Burhan area and surrounding northern system remains stable in the case of single line fault of the project target transmission lines for both normal clearing and stuck breaker conditions.
Table 2.2.11 Transient Stability Analysis Results
Study Phase Fault Section
Case
Tarbela - Burhan
Burhan - ISPR
Tarbela - ISPR
2018 Summer Peak
Normal Clearing Condition Stable Stable Stable
Stuck Breaker Condition Stable Stable Stable
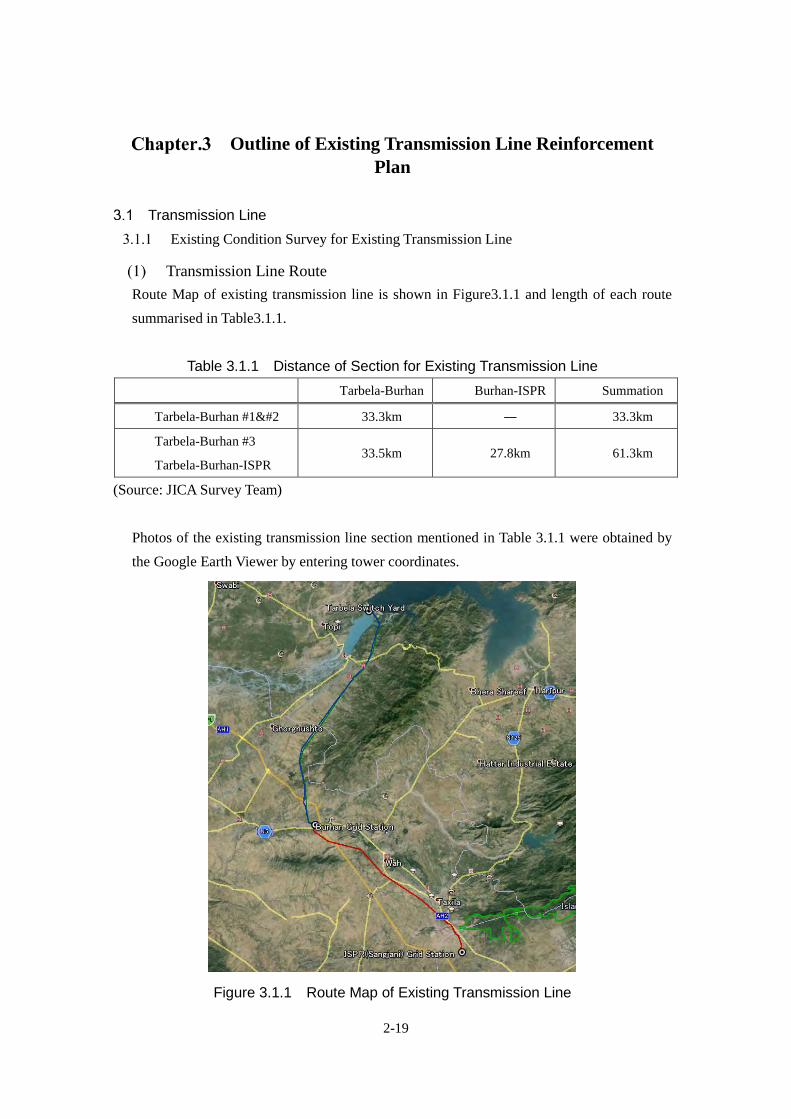
2-19
Outline of Existing Transmission Line Reinforcement Plan
Transmission Line Existing Condition Survey for Existing Transmission Line
Transmission Line Route Route Map of existing transmission line is shown in Figure3.1.1 and length of each route summarised in Table3.1.1.
Table 3.1.1 Distance of Section for Existing Transmission Line Tarbela-Burhan Burhan-ISPR Summation
Tarbela-Burhan #1 33.3km ― 33.3km
Tarbela-Burhan #3
Tarbela-Burhan-ISPR 33.5km 27.8km 61.3km
(Source: JICA Survey Team)
Photos of the existing transmission line section mentioned in Table 3.1.1 were obtained by the Google Earth Viewer by entering tower coordinates.
Figure 3.1.1 Route Map of Existing Transmission Line
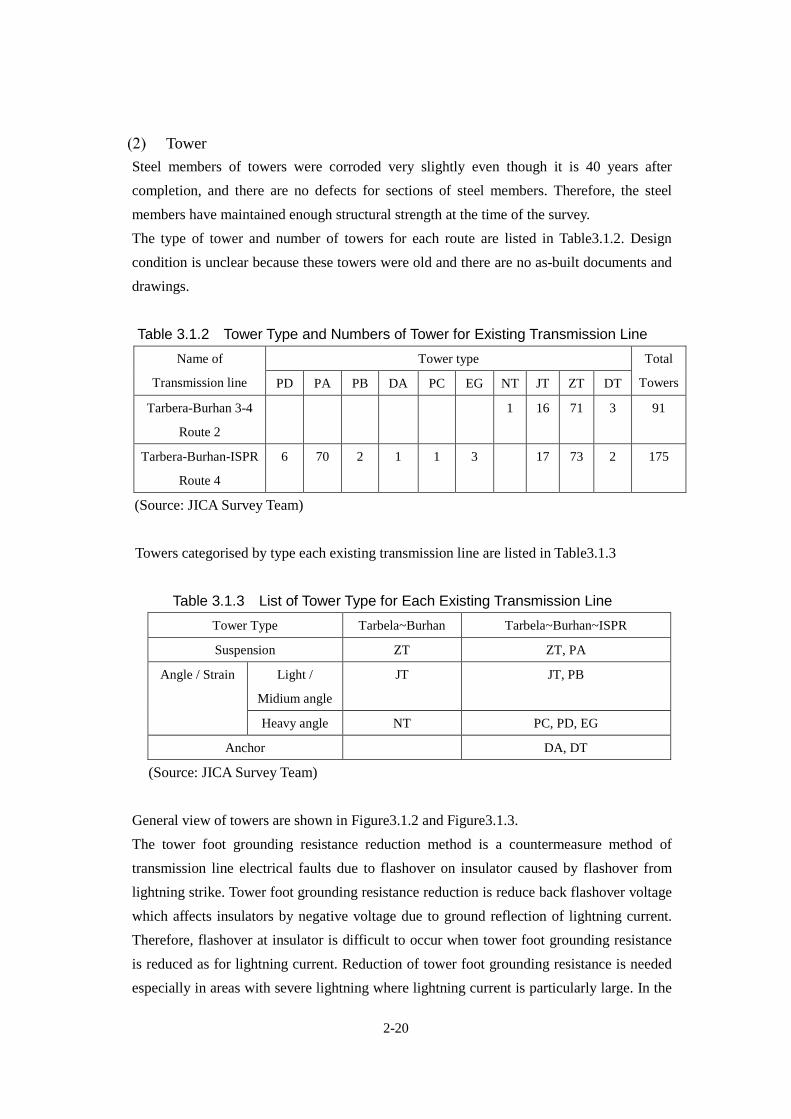
2-20
Tower Steel members of towers were corroded very slightly even though it is 40 years after completion, and there are no defects for sections of steel members. Therefore, the steel members have maintained enough structural strength at the time of the survey. The type of tower and number of towers for each route are listed in Table3.1.2. Design condition is unclear because these towers were old and there are no as-built documents and drawings.
Table 3.1.2 Tower Type and Numbers of Tower for Existing Transmission Line Name of
Transmission line
Tower type Total
Towers PD PA PB DA PC EG NT JT ZT DT
Tarbera-Burhan 3-4
Route 2
1 16 71 3 91
Tarbera-Burhan-ISPR
Route 4
6 70 2 1 1 3 17 73 2 175
(Source: JICA Survey Team)
Towers categorised by type each existing transmission line are listed in Table3.1.3
Table 3.1.3 List of Tower Type for Each Existing Transmission Line Tower Type Tarbela~Burhan Tarbela~Burhan~ISPR
Suspension ZT ZT, PA
Angle / Strain Light /
Midium angle
JT JT, PB
Heavy angle NT PC, PD, EG
Anchor DA, DT
(Source: JICA Survey Team)
General view of towers are shown in Figure3.1.2 and Figure3.1.3. The tower foot grounding resistance reduction method is a countermeasure method of transmission line electrical faults due to flashover on insulator caused by flashover from lightning strike. Tower foot grounding resistance reduction is reduce back flashover voltage which affects insulators by negative voltage due to ground reflection of lightning current. Therefore, flashover at insulator is difficult to occur when tower foot grounding resistance is reduced as for lightning current. Reduction of tower foot grounding resistance is needed especially in areas with severe lightning where lightning current is particularly large. In the

2-21
target area, IKL value is taken as 70 days/year, which is categorised as severe lightning area. The tower foot grounding resistance of existing towers should be checked. The targeted value of tower foot grounding resistance refer to technical specifications of Japan and Myanmar which recommend grounding resistance for electrical facilities shall be reduced to less than 10 ohms.

2-22
(Source: JICA Survey Team)
Figure 3.1.2 Framing Elevation of Suspension Tower
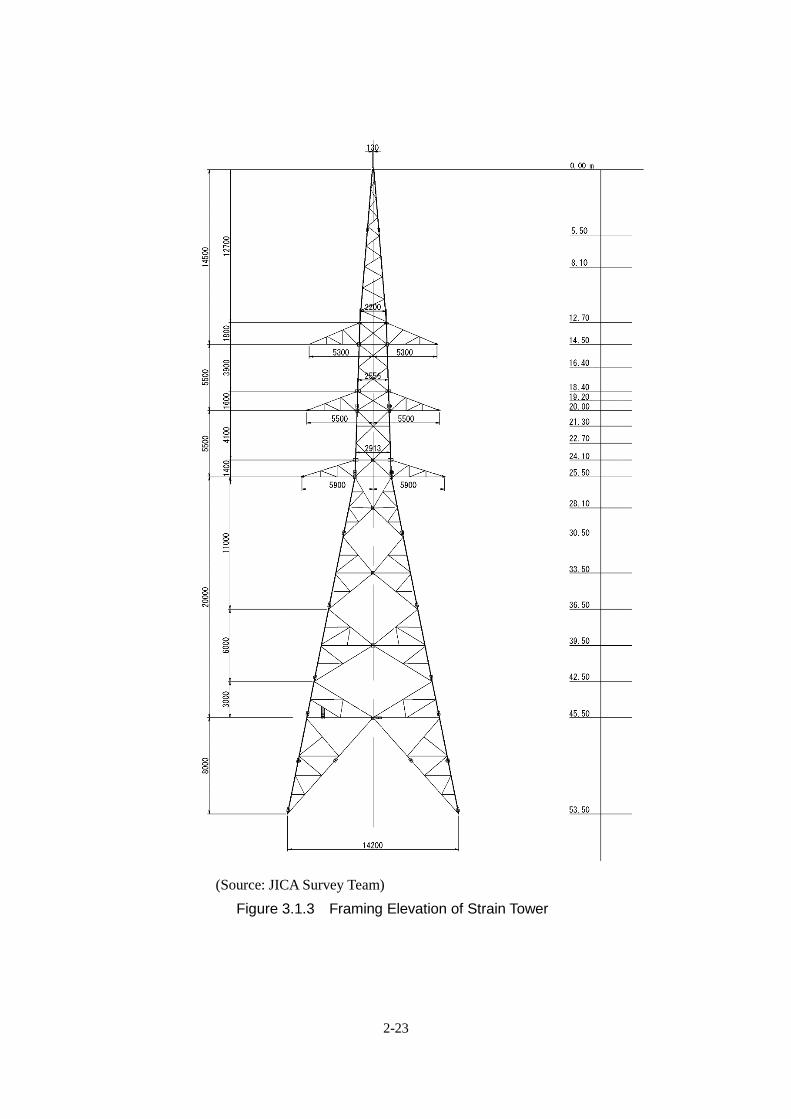
2-23
(Source: JICA Survey Team) Figure 3.1.3 Framing Elevation of Strain Tower
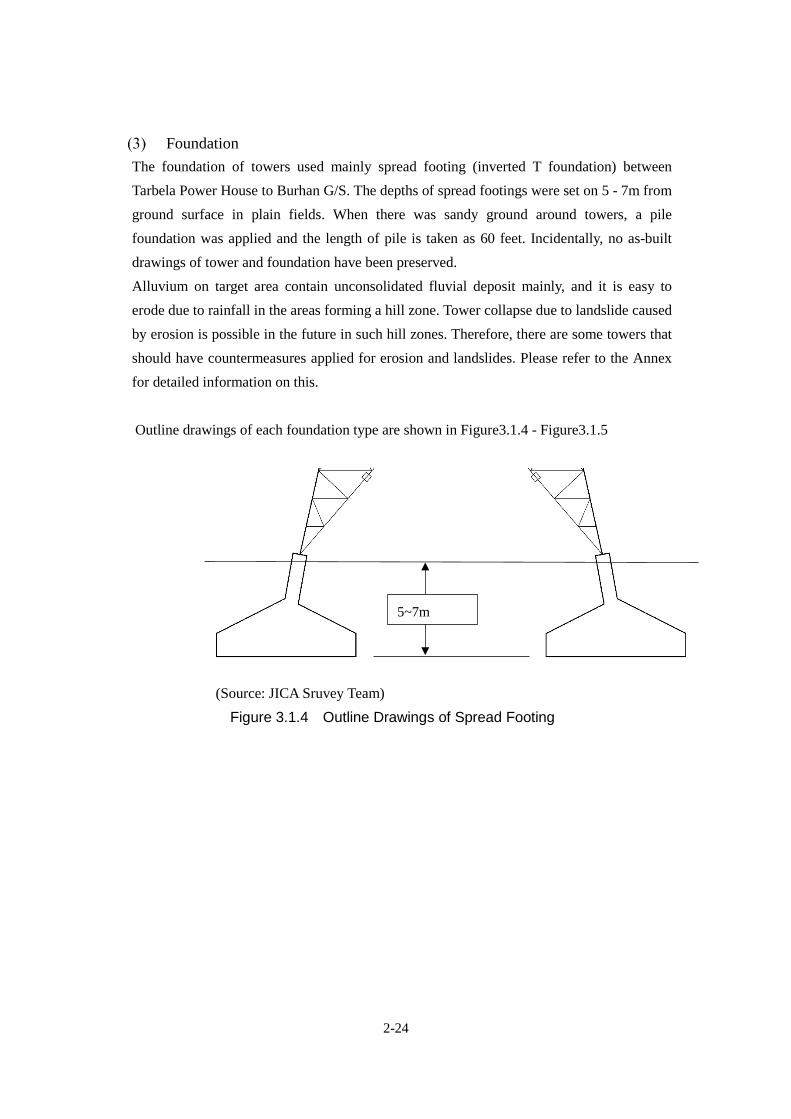
2-24
Foundation The foundation of towers used mainly spread footing (inverted T foundation) between Tarbela Power House to Burhan G/S. The depths of spread footings were set on 5 - 7m from ground surface in plain fields. When there was sandy ground around towers, a pile foundation was applied and the length of pile is taken as 60 feet. Incidentally, no as-built drawings of tower and foundation have been preserved. Alluvium on target area contain unconsolidated fluvial deposit mainly, and it is easy to erode due to rainfall in the areas forming a hill zone. Tower collapse due to landslide caused by erosion is possible in the future in such hill zones. Therefore, there are some towers that should have countermeasures applied for erosion and landslides. Please refer to the Annex for detailed information on this.
Outline drawings of each foundation type are shown in Figure3.1.4 - Figure3.1.5
(Source: JICA Sruvey Team)
Figure 3.1.4 Outline Drawings of Spread Footing
5~7m
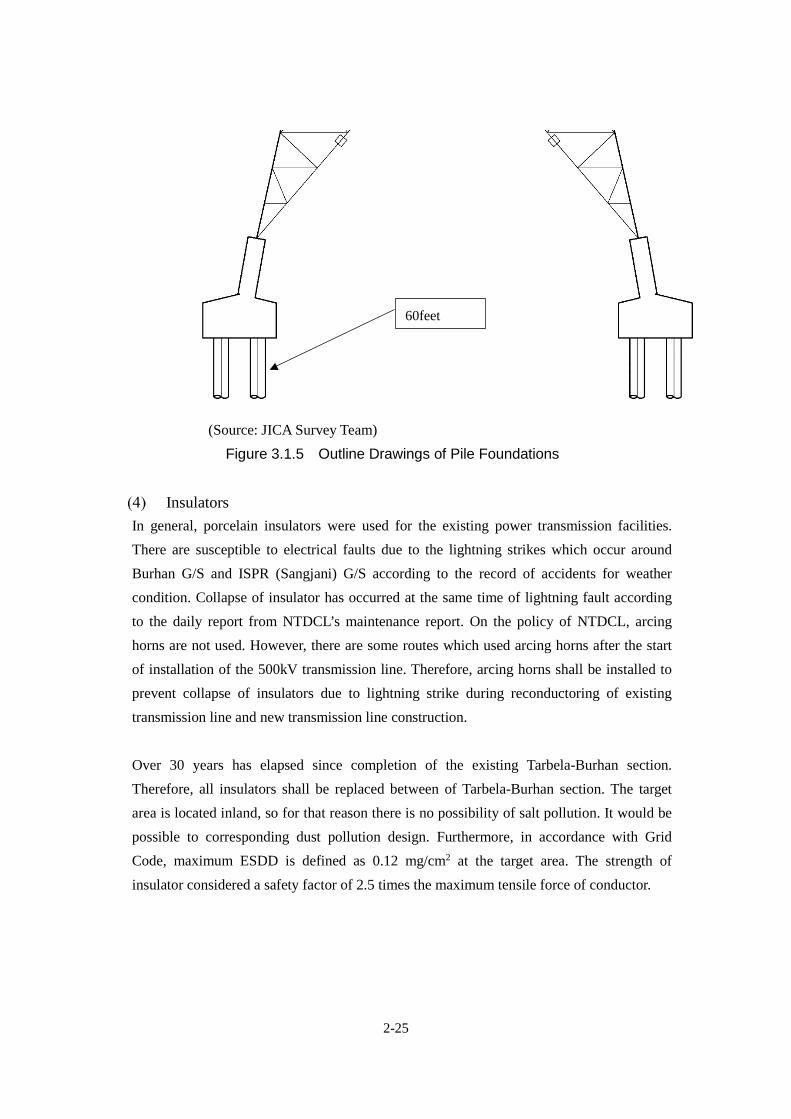
2-25
(Source: JICA Survey Team)
Figure 3.1.5 Outline Drawings of Pile Foundations
Insulators In general, porcelain insulators were used for the existing power transmission facilities. There are susceptible to electrical faults due to the lightning strikes which occur around Burhan G/S and ISPR (Sangjani) G/S according to the record of accidents for weather condition. Collapse of insulator has occurred at the same time of lightning fault according to the daily report from NTDCL’s maintenance report. On the policy of NTDCL, arcing horns are not used. However, there are some routes which used arcing horns after the start of installation of the 500kV transmission line. Therefore, arcing horns shall be installed to prevent collapse of insulators due to lightning strike during reconductoring of existing transmission line and new transmission line construction. Over 30 years has elapsed since completion of the existing Tarbela-Burhan section. Therefore, all insulators shall be replaced between of Tarbela-Burhan section. The target area is located inland, so for that reason there is no possibility of salt pollution. It would be possible to corresponding dust pollution design. Furthermore, in accordance with Grid Code, maximum ESDD is defined as 0.12 mg/cm2 at the target area. The strength of insulator considered a safety factor of 2.5 times the maximum tensile force of conductor.
60feet

2-26
(Source: JICA Survey Team) Figure 3.1.6 Numbers of accidents for existing transmission line relate to this project
Conductor and Ground Wire A single ASTM Code Rail conductor was used.6 GSW was used for ground wire in the the Tarbela-Burhan section that was completed in 1977 and OPGW was used for the Burhan-ISPR section when constructed in 1998. The outlines of transmission line facilities are shown in Table3.1.4 - Table3.1.5.
6 A Chinese conductor named as “LGJQ-400” was used for the 2 circuits of Tarbela-Burhan that mentioned in PC-1. On this section, conductors were in factapplied to ASTM Code Rail.
0
2
4
6
8
10
12
14
16
2011 ~'12
'12 ~'13
'13 ~'14
'14 ~'15
'15 ~'16
Num
ber o
f Fau
ls
Year
Faults Data on T/L conected to Tarbela,Burhan,ISPR,Mansehra
lightningstormyrainycloudother

2-27
Table 3.1.4 Existing Transmission Line Tarbela-Burhan
(Source: JICA Survey Team)
Section Tarbela - BurhanName of Line 220kV Tabela - Burhan Circuit-I & IICompletionLength of T/L kmNos of Tower ( Nos/km )Number of CircuitConductor
BundleASTM CodeOverall Diameter mm Strand Steel x ( mm2 )
Alminium x ( mm2 )Total ( mm2 )
Stringing condition kNKind of Ground Wire Gulbanaized Steel Wire(Optical fiber not installed)Kind of Insulator Porcelain, made by EMKO, 80kN
Arcing Horn Gap length Arcing horn are not installed on this transmission line.
09.06.1977
26.6
48 3.20 386.04
Railsingle
35.1091 2.59
19.58
2
7 2.50
517.3
34.36
NosType
14

2-28
Table 3.1.5 Existing Transmission Line Tarbela-Burhan-ISPR
(Source: JICA Survey Team)
Section Tarbela - Burhan - ISPR(Sangjani)Name of Line 220kV Tabela - Burhan - ISPR Circuit-III & IV
(Express Circuit, Route-II)Completion Tarbela - Burhan T/Line Circuit-III
Burhan - ISPR(Sangjani) T/LineTarbela - ISPR(Sangjani) Express T/Line
Length of T/L Tarbela - Burhan T/Line Circuit-III kmBurhan - ISPR(Sangjani) T/Line kmTarbela - ISPR(Sangjani) Express T/Line km
Nos of Tower Tabela - Burhan T/Line Circuit-III( Nos/km)
Burhan - ISPR(Sangjani) T/Line( Nos/km)
Tarbela - ISPR(Sangjani) Express T/Line( Nos/km)
Number of CircuitConductor
BundleASTM CodeOverall Diameter mm Strand Steel x ( mm2 )
Alminium x ( mm2 )Total ( mm2 )
Stringing condition kNKind of Ground Wire Gulbanaized Steel Wire(Optical fiber installed/OPGW)Kind of Insulator Porcelain, made by EMKO, 80kN
Arcing Horn Gap length Arcing horn are not installed on this transmission line.
2.60
3.06
2.80
19.58
singleRail
33.5445 3.70
2
17.12.199817.12.1998
175
35.40
2.457
83
92
27.1062.50
09.06.1977
TypeNos 14
483.8517.3
29.1

2-29
Landform and Terrestrial Formation Landform around Target Area
The target area of this project is a plain field located on the south edge of the Himalaya, Karakorum and Hindu Kush mountain ranges. The Tarbela-Burhan section sweeps away radially from the Indus River and land use is mainly for agriculture. The existing transmission line has placed at the base of mountain range extending south from Tarbela Dam. Rainwater runs through this plain field after rainfall. The ground surface has been eroded by streams due to rainwater and streams have created erosional cliffs. The Burhan-ISPR section is the plain field sweeping away radially from the Haro River. The land forms a downhill slope from Islamabad to Burhan. There are a scattering of small mountains.
Figure 3.1.7 Landform around Target Area
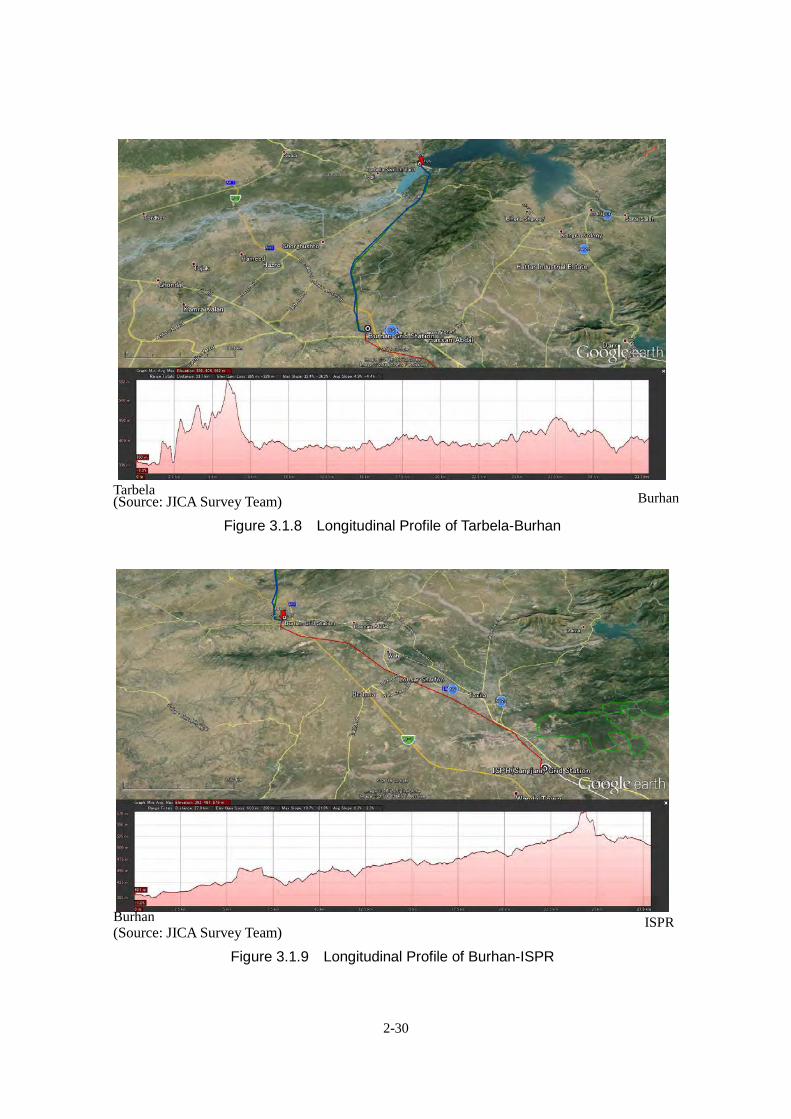
2-30
(Source: JICA Survey Team) Figure 3.1.8 Longitudinal Profile of Tarbela-Burhan
(Source: JICA Survey Team) Figure 3.1.9 Longitudinal Profile of Burhan-ISPR
Tarbela Burhan
Burhan ISPR

2-31
Terrestrial Formation around Target Area The target area is a plain field located on left bank of Indus River. The plain field is a Holocene alluvial formation. It contains silt, sand and gravel in alternate layers. This alluvial formation was accumulated on an old valley above bedrock. Some parts of the alluvial formation are over 200m deep. The alluvial formation contains unconsolidated and fluvial deposits. Sand-based deposits are easily influenced by erosion due to rainfall and excavation at sand pit.
Consideration of Present State of Existing Transmission Facilities
Existing towers were constructed 40 years ago, however corrosion of steel members are minimal and there are no loss of steel sections. Therefore the towers have retained enough structural strength from that time. However, there are no remaining design documents and drawings, so the design specifications of the existing transmission line has assumed to be a single conductor. Therefore, since twin-bundle LL-ACSR will be used for existing towers, new towers shall be constructed between existing towers to reduce loading spans, corresponding to the self-weight increment factor and tensile force. Moreover, there would be compensation for additional towers. Regarding reuse of existing towers, new towers would be constructed with the same number of towers and increase inspection work for maintenance. As a result, existing towers shall be dismantled and towers reconstructed accordingly for twin-bundle conductors.
Selection of Relevant Proposal
One of the 2 circuits between Tarbela Power Station and the ISPR Grid Station is the circuit in/out at Burhan Grid Station. The existing transmission line uses single conventional Rail conductors for both circuits. On the PC-1, the transmission line is planned as twin-bundle conductor as for the extension project of Tarbela Power Station. In this project, relevant proposal shall be selected among alternative proposals. 1) Replace single Rail to twin-bundle Rail 2) Replace singe Rail to single HTLS (High Temperature Low Sag) conductor 3) Replace single Rail to twin bundle LL-ACSR (Low Loss Conductor) Relevant proposals shall be considered in terms of load flow analysis and evaluation of transmission loss. Therefore, replacement of the existing transmission line with low loss conductors has been selected from among alternative proposals. (See Annex 3.1.5-1) In the case of using twin-bundle Rail conductors or twin-bundle LL-ACSR, the loads acting
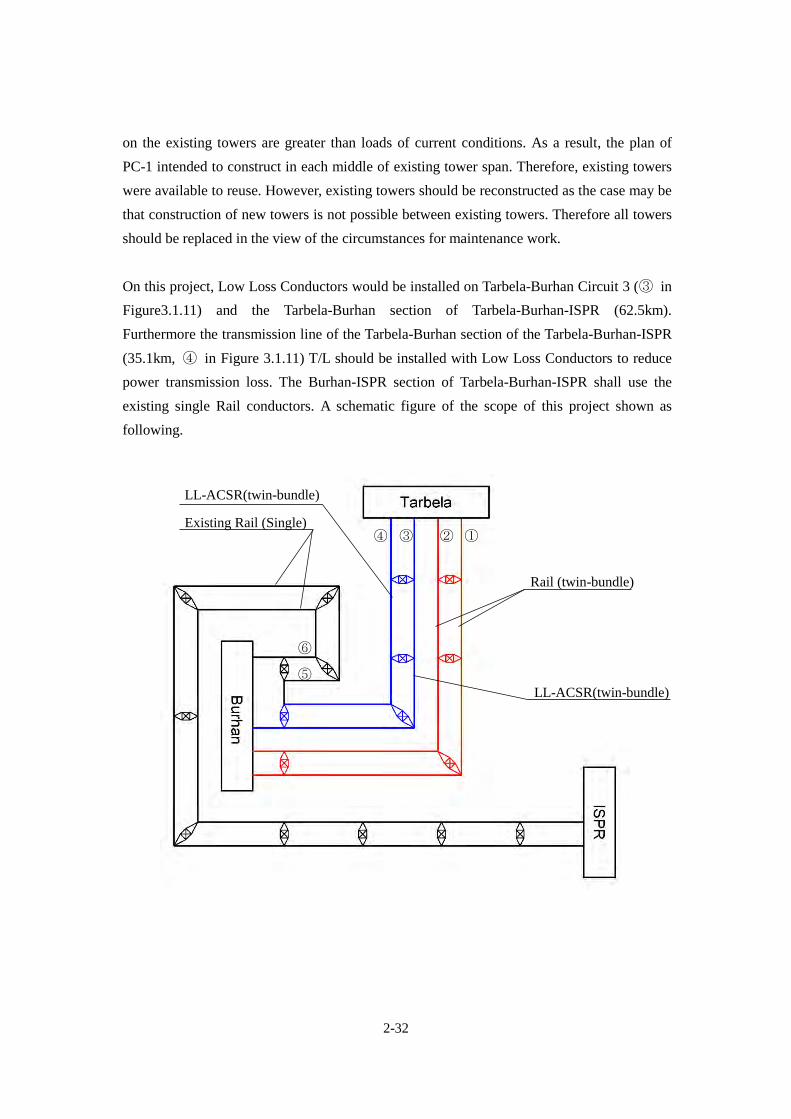
2-32
on the existing towers are greater than loads of current conditions. As a result, the plan of PC-1 intended to construct in each middle of existing tower span. Therefore, existing towers were available to reuse. However, existing towers should be reconstructed as the case may be that construction of new towers is not possible between existing towers. Therefore all towers should be replaced in the view of the circumstances for maintenance work. On this project, Low Loss Conductors would be installed on Tarbela-Burhan Circuit 3 (③ in Figure3.1.11) and the Tarbela-Burhan section of Tarbela-Burhan-ISPR (62.5km). Furthermore the transmission line of the Tarbela-Burhan section of the Tarbela-Burhan-ISPR (35.1km, ④ in Figure 3.1.11) T/L should be installed with Low Loss Conductors to reduce power transmission loss. The Burhan-ISPR section of Tarbela-Burhan-ISPR shall use the existing single Rail conductors. A schematic figure of the scope of this project shown as following.
Rail (twin-bundle)
LL-ACSR(twin-bundle)
Existing Rail (Single)
LL-ACSR(twin-bundle)
① ② ③ ④
⑤
⑥

2-33
(Source: JICA Survey Team) Figure 3.1.10 Outline of Project Scope for Reinforcement of Existing Transmission
Line
Route Circuit/Section Existing Reinforcement Remarks
Tarbela P/H
-Burhan G/S
① Circuit-Ⅰ Single Rail Twin-bundle Rail NTDC own
resource
② Circuit-Ⅱ Single Rail Twin-bundle Rail NTDC own
resource
③ Circuit-Ⅲ Single Rail Twin-bundle LL-ACSR JICA Fund
Tarbela P/H
-ISPR G/S
④ Tarbela P/H-Burhan G/S Single Rail Twin-bundle LL-ACSR JICA Fund
⑤ Burhan G/S-ISPR G/S Single Rail ---
Burhan G/S
-ISPR G/S
⑥ Burhan G/S -ISPR G/S Single Rail ---

2-34
Schematic Design
Design Specifications Applicable Standards Applicable standards for the design of transmission facilities are shown as follows: ・IEC60826 Design criteria of overhead transmission lines Third edition (2003-10) ・Building code of Pakistan (2007) ・WAPDA/NTDC Specifications
Allowable Continuous Current calculation specifications ・Based on IEEE738 ・Wind Velocity 3feet/s (Line Temperature 90℃) ・Ambient Temperature (40℃)
note: Line temperature under emergency shall be taken as 100℃ . Ambient temperature shall be taken corresponding to target area.
・Amount of Solar Radiation (0.1W/m2) Emissivity of conductor has been adopted as 0.5 in many countries in accordance with a study by CIGRE.
Insulating Distance ・Conductor-Tower (Normal Condition 2.1m, High Wind Condition 1.6m at 40m/sec ) ・Conductor- Ground (8m, Line Temperature 100℃)
Sag Calculation Condition ・Sag equivalent to Normal Tensile Force of ACSR Rail (17%UTS, Calm/No
accretion of snow and ice、Temperature 25℃) ・Spacing of Conductor(457mm) ・Wind Pressure (970Pa, no accretion of snow and ice, Temperature 25℃) ・Insulator String
: Single Rail (Porcelain 120kNx14nos、Length 2922 mm、Gap length of arcing horn 6 feet)
: Twin-bundle Rail (Porcelain 120kNx14nos×2string, Length 2922mm、
Anti-fog, Length of arcing horn 6 feet) ・Ground wires shall be installed at 80% of normal sag of conductor to prevent
lightning at the middle span and flashover due to switching surge.

2-35
Conductor and Ground Wire Design LL-ACSR designed equivalent to current capacity of twin-bundle Rail conductor planned in PC-1 and same diameter of Rail conductor (wind pressure equivalent to that of Rail) .Comparison of characteristics of Rail and LL-ACSR are shown in following table.
Table 3.1.6 Characteristics of Conductors
(Source: JICA Survey Team)
Recently, OPGW had been introduced in the transmission line. Within the scope of work of this project, OPGW is planned to be used as ground wires. Therefore, OPGW will be used in all sections of this project. The size of ground wires shall be adopted as OP-AC97sq
Items Unit ACSR LL-ACSR
ASTM:Rail LL-ACSR/AS610
Figure
construction 45/3.7-Al
7/2.47-St
16/TW-AL
11/TW-AL
8/TWAl
7/2.1-14EAS
Nominal Diameter mm 29.61 29.59
Min. Breaking Load kN 116.1 126.5
Cross section area:Al mm2 483.8 610.7
Core 33.54 24.25
Total 517.3 635.0
Nominal weight kg/km 1600 1867
DC Resistance at 20deg-C Ohm/km 0.0597 0.0471
Co-efficient of linear
expansion
/deg-C 20.9x10⁻⁶ 21.9x10⁻⁶
Current capacity A 956
at 90 deg-C
1207
at 90 deg-c
Sag (at 350m) m 14.4
at 90 deg-C
15.2
at 90 deg-C
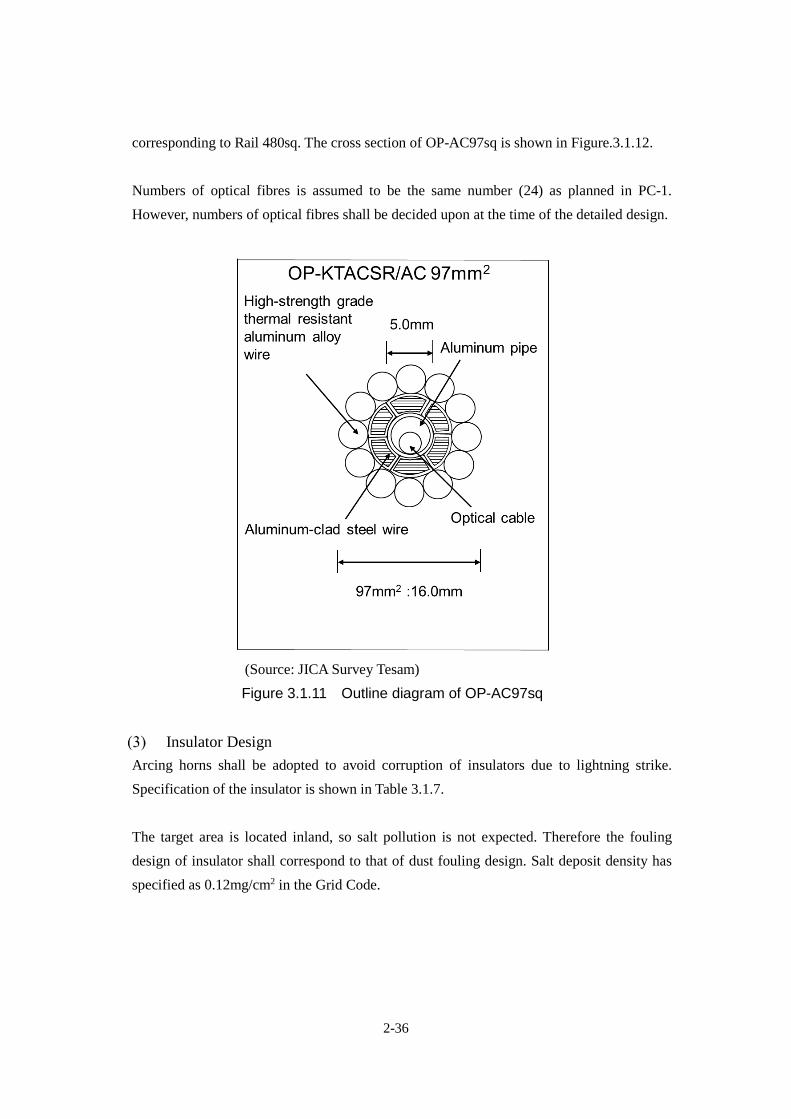
2-36
corresponding to Rail 480sq. The cross section of OP-AC97sq is shown in Figure.3.1.12.
Numbers of optical fibres is assumed to be the same number (24) as planned in PC-1. However, numbers of optical fibres shall be decided upon at the time of the detailed design.
(Source: JICA Survey Tesam) Figure 3.1.11 Outline diagram of OP-AC97sq
Insulator Design Arcing horns shall be adopted to avoid corruption of insulators due to lightning strike. Specification of the insulator is shown in Table 3.1.7.
The target area is located inland, so salt pollution is not expected. Therefore the fouling design of insulator shall correspond to that of dust fouling design. Salt deposit density has specified as 0.12mg/cm2 in the Grid Code.

2-37
Table 3.1.7 Specifications of Insulators Type/Shape Strength Nos
(nos)
Length
(mm)
Remarks
Single Strings for
Suspension
Porcelein, Normal 120kN 14 2,922 Twin-bundle
Conductor
Double Strings for
Suspension/Tension
Porcelein, Anti-fog 120kN
120kN,double
14 2,922 Twin-bundle
conductor
(Source: JICA Survey Team)
Shape of Tower and Tower Design The towers that are to be used are: standard EA-Type suspension towers, EG-Type angle towers and JKD-Type tension tower for use in the existing Mansehra-ISPR transmission line. Outline drawings of towers are shown in Section 4. The existing Mansehra-ISPR transmission line had been designed as twin-bundle Rail. These standard towers are applicable to reinforcement of the existing transmission line for this project. Design condition of towers is shown in Table 3.1.8.
Table 3.1.8 Suspension tower Design Condition
(Source: JICA Survey Team)
In the case of apply the LL-ACSR610 which has outer diameter equivalent to the Rail conductor, horizontal load (wind load) is equal. Because vertical load will be increased by the different of unit weight (1.867-1.600=0.267kg/m), foundation compression load also

2-38
will be increased and uplift load will be decreased. These loads are estimated to be about 320kg/foot for the 400m loading span. Because this is a variation of about 1 from the foundation load, LL-ACSR610 should be able to be used in the new construction line.
On the other hand, the sag of LL-ACSR610 will be increased under the same tension stringing condition as the Rail conductor because of increased unit weight. So, it is necessary to increase the tower height to keep the required distance from the ground. The additional height of tower will be about 2m average in the case of a 400m span. The different sag of each conductor is shown in Figure 3.1.13.
(Source: JICA Survey Team) Figure 3.1.12 Comparison of sag of each conductor (No wind and snow, 90 deg. C,
T=1,970kg/wire)
Foundation Design Basically, normal foundations (inverted T shape foundation) shall be employed for towers placed in plain fields as for the existing the transmission line, and pile foundations shall be
Span Length (m)

2-39
employed on sandy ground subject to erosion due to stream flow or nearby sand pits. The type of foundation shall be studied at the detailed design stage in accordance with the considerations listed in article 3.1.2 in this report.
Transmission Line Route RoW should not be changed from that of the existing transmission line. Existing towers must be dismantled and reconstructed as new towers on the same place corresponding to twin-bundle conductors . Clearance of conductors shall be secured at 8m as in the design specifications. Moreover the transmission line route shall be same as existing transmission line.
Application of New Technology
Use of Low Loss Conductor (LL-ACSR) In the case of introduction of low loss conductors, wind load and tensile force of the conductors shall be not exceed the design load corresponding to tower design for twin-bundle Rail. Therefore, low loss conductors shall be of an equivalent outer diameter and current capacity to conventional ACSR Rail conductors. Standard design of towers corresponding to twin-bundle ACSR Rail conductors is applicable to twin-bundle low loss conductors. Furthermore, transmission loss will be reduced after the start of operations when design specifications mentioned above have been fulfilled, so it will provide a benefit.
Features of Low Loss Conductors A low loss conductor is a stranded conductor composed of ACSR (aluminium conductor steel-reinforced cable) that uses trapezoidal aluminium strands. The share of the section area of the aluminium conductor is higher compared with conventional conductors. Furthermore, the steel core uses a high strength steel core to reduce the share of the section area of the steel core in the overall cross section area, so the weight of conductor will be reduced. AC resistance of low loss conductors is smaller than that of conventional conductors when using the same outer diameter, as the result of increasing the aluminium section area. Therefore, transmission loss is reduced.
In the case of equivalent AC resistance between low loss conductors and conventional conductors, the outer diameter and unit weight of low loss conductors are smaller than with conventional conductors. This makes possible the downscaling of the support structure.

2-40
Specifications of Low Loss Conductors LL-ACSR610sq is designed so as to secure the current capacity of conventional Rail conductors planned in PC-1 and a diameter equivalent to that of the conventional Rail conductor (thus equivalent wind pressure). The reason to adopt the same diameter as the conventional Rail conductor is so that wind load shall be the same as in the standard design of towers corresponding to twin-bundle Rail to avoid changing design specifications. Detailed information is shown in Annex 3.1.5-1.
Evaluation of Transmission Power Loss The evaluation of transmission loss of low loss conductors (LL-ACSR) compared with the conventional Rail conductor planned in PC-1 is shown in Figure 3.1.13. Detailed information is shown in Annex 3.1.5-1.
(Source: JICA Survey Team) Figure 3.1.13 Evaluation of Transmission Loss
Substations Current Status of Existing Substations
The substations subject to modification in this Transmission System Network Reinforcement Project are as following three (3) Substations; Burhan Substation
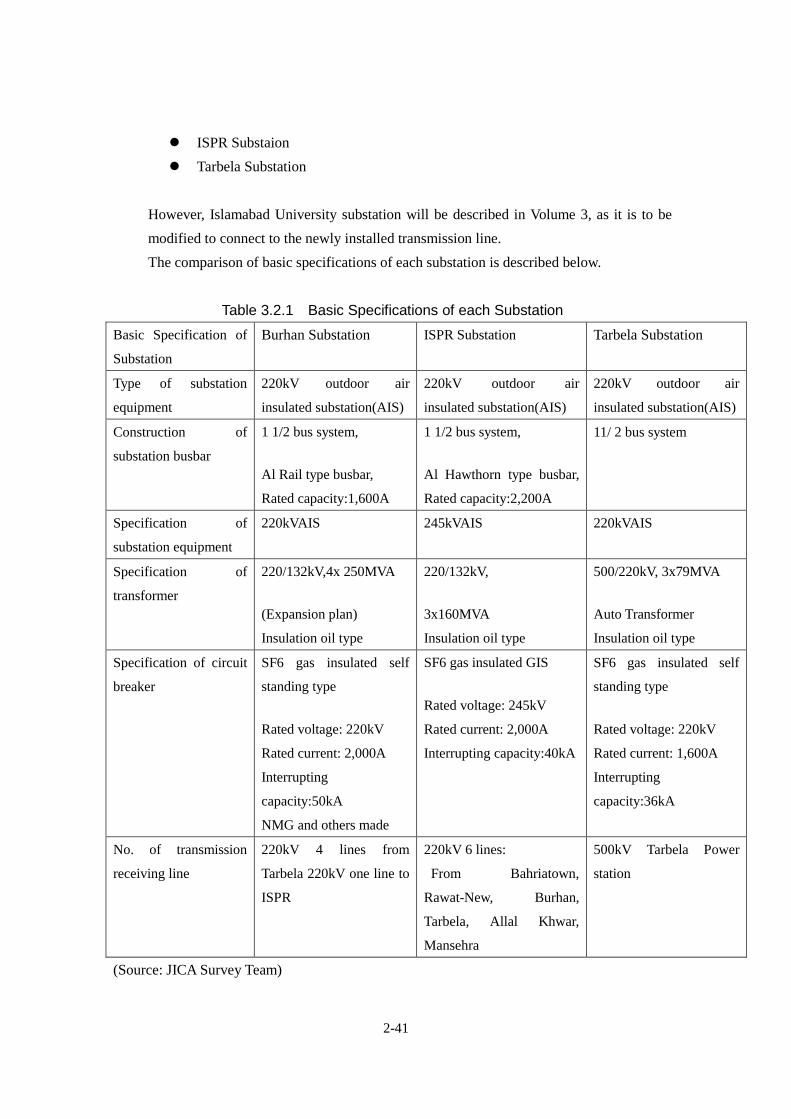
2-41
ISPR Substaion Tarbela Substation
However, Islamabad University substation will be described in Volume 3, as it is to be modified to connect to the newly installed transmission line. The comparison of basic specifications of each substation is described below.
Table 3.2.1 Basic Specifications of each SubstationBasic Specification of
Substation
Burhan Substation ISPR Substation Tarbela Substation
Type of substation
equipment
220kV outdoor air
insulated substation(AIS)
220kV outdoor air
insulated substation(AIS)
220kV outdoor air
insulated substation(AIS)
Construction of
substation busbar
1 1/2 bus system,
Al Rail type busbar,
Rated capacity:1,600A
1 1/2 bus system,
Al Hawthorn type busbar,
Rated capacity:2,200A
11/ 2 bus system
Specification of
substation equipment
220kVAIS 245kVAIS 220kVAIS
Specification of
transformer
220/132kV,4x 250MVA
(Expansion plan)
Insulation oil type
220/132kV,
3x160MVA
Insulation oil type
500/220kV, 3x79MVA
Auto Transformer
Insulation oil type
Specification of circuit
breaker
SF6 gas insulated self
standing type
Rated voltage: 220kV
Rated current: 2,000A
Interrupting
capacity:50kA
NMG and others made
SF6 gas insulated GIS
Rated voltage: 245kV
Rated current: 2,000A
Interrupting capacity:40kA
SF6 gas insulated self
standing type
Rated voltage: 220kV
Rated current: 1,600A
Interrupting
capacity:36kA
No. of transmission
receiving line
220kV 4 lines from
Tarbela 220kV one line to
ISPR
220kV 6 lines:
From Bahriatown,
Rawat-New, Burhan,
Tarbela, Allal Khwar,
Mansehra
500kV Tarbela Power
station
(Source: JICA Survey Team)
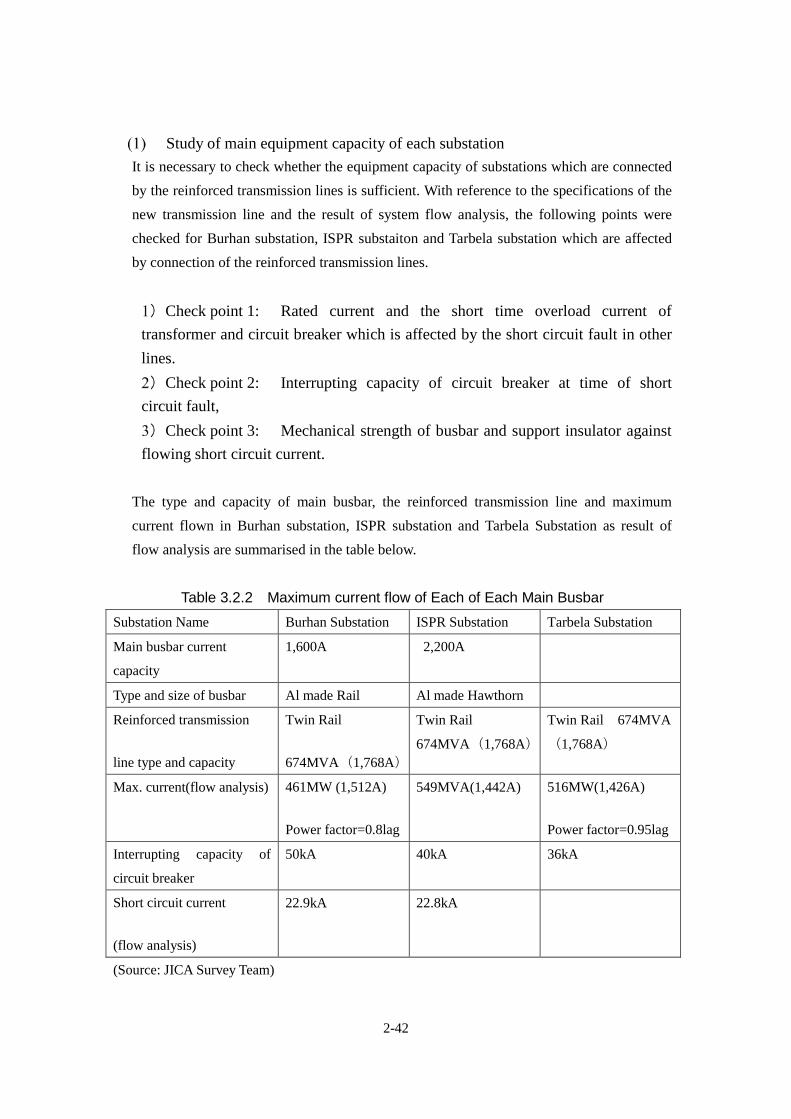
2-42
Study of main equipment capacity of each substation It is necessary to check whether the equipment capacity of substations which are connected by the reinforced transmission lines is sufficient. With reference to the specifications of the new transmission line and the result of system flow analysis, the following points were checked for Burhan substation, ISPR substaiton and Tarbela substation which are affected by connection of the reinforced transmission lines.
Check point 1: Rated current and the short time overload current of transformer and circuit breaker which is affected by the short circuit fault in other lines.
Check point 2: Interrupting capacity of circuit breaker at time of short circuit fault,
Check point 3: Mechanical strength of busbar and support insulator against flowing short circuit current.
The type and capacity of main busbar, the reinforced transmission line and maximum current flown in Burhan substation, ISPR substation and Tarbela Substation as result of flow analysis are summarised in the table below.
Table 3.2.2 Maximum current flow of Each of Each Main Busbar Substation Name Burhan Substation ISPR Substation Tarbela Substation
Main busbar current
capacity
1,600A 2,200A
Type and size of busbar Al made Rail Al made Hawthorn
Reinforced transmission
line type and capacity
Twin Rail
674MVA(1,768A)
Twin Rail
674MVA(1,768A)
Twin Rail 674MVA
(1,768A)
Max. current(flow analysis) 461MW (1,512A)
Power factor=0.8lag
549MVA(1,442A) 516MW(1,426A)
Power factor=0.95lag
Interrupting capacity of
circuit breaker
50kA 40kA 36kA
Short circuit current
(flow analysis)
22.9kA 22.8kA
(Source: JICA Survey Team)

2-43
As a result, the current capacity of main busbar in each substation was found to have sufficient capacity after the reinforcement project and the interrupting capacity of circuit breaker was also found to be sufficient. The electromagnetic force applied to the busbar in BUR-SUB and ISPR-SUB at time of short circuit fault in 220kV circuit was calculated and was found to be around 3kg/m based on short circuit current of 23kA and distance between phases of 4.75m. As the bending strength of insulator is 6 to 7kN according to data of NGK, the mechanical strength of busbar section is regarded as sufficient.
Burhan substation 220kV power is supplied through three circuits Tarbela-Burhan transmission line. Another circuit from Tarbela is also received and transmitted to the ISPR grid substation. The layout and single line diagram of this substation is shown below. 220kV switchgear is 11/2 busbar system installed on outdoor steel structure. 220kV circuit breakers are SF6 gas insulated type for newly installed ones and minimum oil insulated types made mainly made in Europe (manufacturer NMG, S&S, BBC, AREVA etc.) for older ones, and some transducers are made by Japanese companies (Nissin). Four 220/132kV transformers are installed (one 250MVA, three 160MVA). After expansion 160MVA transformers are planned to be replaced with 250MVA transformers) The total maximum load to this substation is 2,200 to 2,600A and the load distribution for transformers is a matter of concern.
1) According to substation staffs, no PCBs were used. Although SF6 gas is used for thecircuit breaker, and is harmless to human beings, it has strong global warmingpotential. Leakage was detected by use of a gas detector.
2) The 132kV switchyard is installed outdoors for power distribution purpose. Thissubstation was constructed in 1975. The control and monitoring equipment ofsubstation is of a conventional type and data loggers are not used. Therefore, datacollection and analysis/improvement is not easy. A modern DCS (distributed controlsystem) or PC-based control/monitoring system shall be used.

2-44
Figure 3.2.1 Layout of Burhan Substation

2-45
Figure 3.2.2 Single Line Diagram of Burhan Substation

2-46
ISPR substation 1) This substation is located at around 20km to the west of Islamabad and distributes power
to the areas west side of Islamabad. This substation receives 220kV power through fivetransmission lines from Tarbela Rawat-New, Bahia Town, Allal Khwar and Mansehra(infuture).There are three 220/132kV transformers (each 160MVA) and there is a 132kV outdoorswitchyard for power distribution. There are also three 132/11kV transformers fordistribution to neighbouring area and station service.
2) All 220kV circuit breakers are SF6 gas insulated and supplied by Europeanmanufacturers (NMG, Alstom, MG, AEG, ABB etc.).
3) The conductors of the 220kV busbar are aluminium Hawthorn twin conductor type andthe rated current is 2,200A. As the result of flow analysis, the maximum loading powerto this substation is 1,442A(549MVA) and capacity of busbar including feeder circuitswas found to be sufficient as explained in 3.2.1 (1).

2-47
Figure 3.2.3 Layout of ISPR Substation

2-48
Figure 3.2.4 Single line diagram of ISPR Substation

2-49
Tarbela Substation 1) The Tarbela Hydro Power Station has a generating capacity of 3,478MW (10x175MW,
4x432MW) . The maximum load recorded in July 2013 was 3,606MW. This powerstation has a 4th extension plan of 1,410MW (May 2017) and the fifth expansion planof 1,300MW. The substation is an outdoor steel structured type for 500kV and 220kVwith an 11/2busbar system.
2) Four 220kV transmission lines for supply to Burhan Substation and ISPR substationare fed from a 220kV circuit breaker. The single line diagram of this part of Tarbelasubstation is shown below. This reinforcement project will change the conductors oftransmission lines, therefore changing work shall be executed solving technicalproblems at the time of connecting new transmission conductors.
3) As a result of flow analysis by JICA survey team, maximum power of 516MW(1,469A at cosφ=0.922 (lag), 1,426A at cosφ=0.95(lag)) flows in one line of three lines fromTARBELA to BURHAN in summer peak of 2018. But, the circuit breaker of 220kV inTARBELA has a rated current capacity of 1,600A and an interrupting capacity of 36kA,which is regarded to be sufficient capacity.
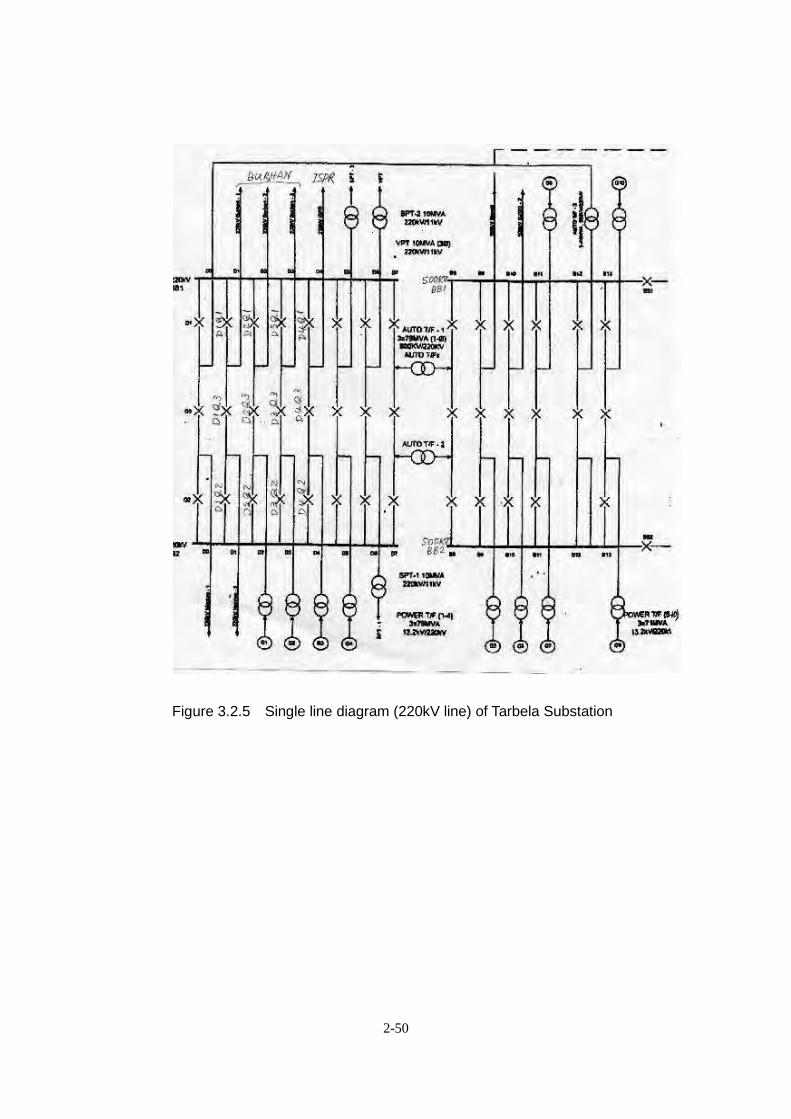
2-50
Figure 3.2.5 Single line diagram (220kV line) of Tarbela Substation

2-51
Drawings
Outline Drawings of Tower Standard Suspension /Tension Tower corresponding to twin-bundle conductors are shown in Figure4.1.1- Figure 4.1.2.
(Source: JICA Survey Team) Figure 4.1.1 Framing elevation of EA-Type Suspension Tower
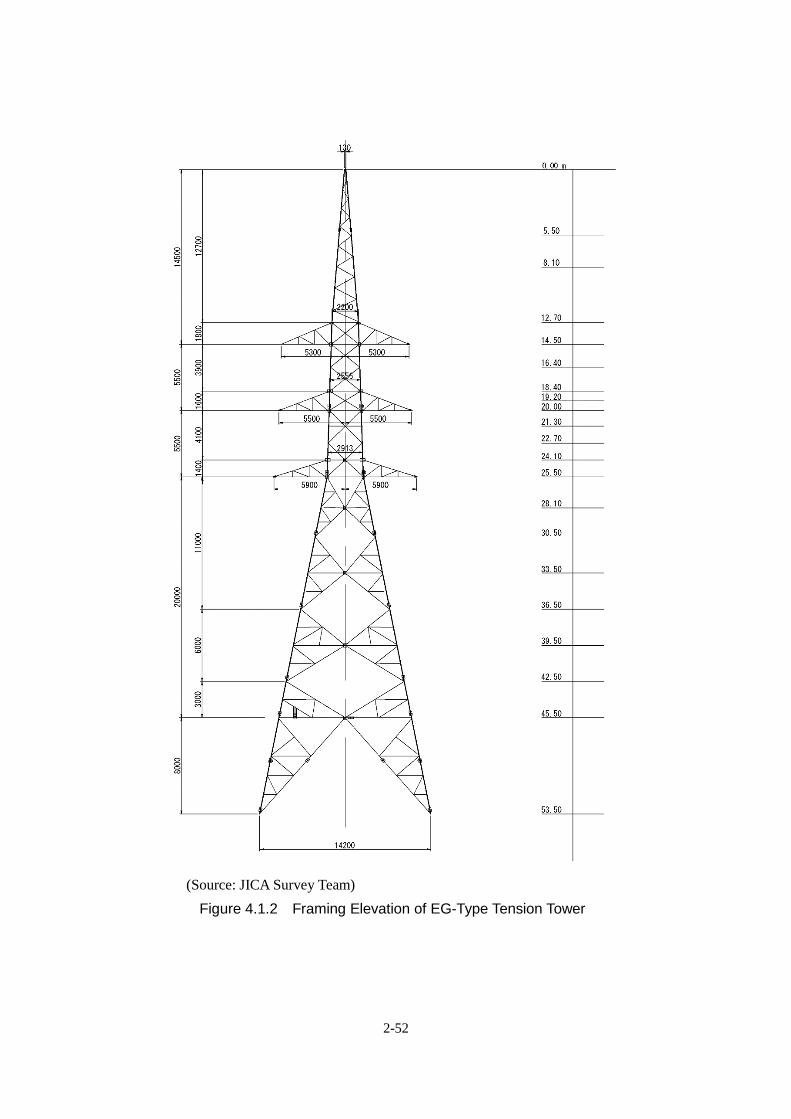
2-52
(Source: JICA Survey Team) Figure 4.1.2 Framing Elevation of EG-Type Tension Tower

2-53
Outline Drawings of Tower Foundation Spread foundations (inverted T shape foundation) will be employed for towers placed in plain fields. Pile foundations will be employed for towers placed on sandy ground where there has been erosion due to stream flow of rainwater and excavations for sand for commercial use. Outline drawings are shown in Figure 4.2.1-Figure 4.2.2.
(Source: JICA Survey Team) Figure 4.2.1 Outline Drawings of Spread Foundation
(Source: JICA Survey Team) Figure 4.2.2 Outline Drawings of Pile Foundation
2-54
Construction Method
Problems of Current Construction Method Existing towers should be dismantled and reconstructed as new towers with twin-bundle conductors. In the case of suspension of construction work during the summer peak (June to September), a duration of construction of several years will be needed. Therefore, availability of power transmission under N-1 contingency during construction of Tarbela-Burhan Circuit 3 and Tarbela-Burhan section of Tarbela-Burhan-ISPR express line confirmed through load flow analysis after completion of the double circuit which is self-funded by the NTDCL.
Study of Construction Method Transmission Line
This project replaces the single Rail conductors of the existing transmission line of the with twin-bundle LL-ACSR conductors. Therefore, existing towers should be dismantled and reconstructed as towers with twin-bundle conductors.
Duration of System Shutdown The Tarbela-Burhan Circuit No. 3 and Tarbela-Burhan-ISPR shall be shut down throughout the dismantlement of existing conductors until completion of installation of LL-ACSR.
Foundation Work Existing foundations shall be demolished. Subsequently, new foundations shall be constructed for the twin-bundle conductor towers.
Tower Erection Towers shall be constructed by standard methods.
Installation of Conductors In areas where buildings exist under the transmission line, installation work shall be executed after completion of temporary protective measures to avoid damage to third parties.
Special Construction Method and Special Instructions Around existing towers placed in the hilly area near Tarbela Power Station, cliffs have formed caused by extraction of sand for aggregate, and erosion due to stream flow of rainwater during monsoon season. In this area, these cliffs shall be protected by retaining walls, gabion mattresses and crib works. It may be possible to use pile foundations depending on location in sandy ground affected by erosion from extraction of sand. The need for pile foundations should be evaluated in the stage of detailed design with reference to the geotechnical survey.

2-55
Towers are to be reconstructed on same location of existing towers without changing the right of way. In this case, there is the possibility of cost reduction by reusing existing foundation when possible, if the foundation can be reinforced by connection foundations with underground beams. Reinforcement methods should be studied in the stage of detailed design. On the other hand, some part of the transmission line crosses the Haro River. The width of the dry riverbed is 70m to 170m. For the span crossing the Haro River, span length is about 450m. Since this span length exceeds standard span of standard towers, towers in the river-crossing part should be studied for the reinforcement method during installation of the new conductors.
Safety Measures during Construction The ground surface of target area has assumed as soft relatively because the ground is an alluvial formation. Therefore, there is the possibility of ground collapse during excavation of sandy ground. Such excavated slopes shall be secured with a stable gradient corresponding to the characteristics of the soil. There are risk that workers may fall down, so workers should wear safety belts, and safety and disaster prevention should be conducted during erection work. These things should be provided through instructions in pre-work meetings. During installation work, there are possibility that workers may when ascending or descending the tower or working at the tip of the crossarms. Worker should wear safety belt and thorough instruction should be provided in pre-work meetings. Furthermore, at the time of working around drums and engines, workers in danger of bruises and fractures caused by turnover due to lost balance from cables entwined around legs or stumbling during slipping of wire and conductor and wire/conductor spring. This information should be provided through instructions in pre-work meetings.
Moreover, in the case thunderclouds move closer to the site during work, there is the possibility of lightning strikes, and in that case work should be stopped immediately and workers should evacuate to shelter on ground. The place of shelter shall be selected before construction work and information should be provided through instructions in pre-work meeting.
Implementation Schedule (Confidential)
2-56
Cost Estimation of Existing Transmission Line Reinforcement
Cost Estimation of Existing Transmission Line Reinforcement (Confidential)
Consulting Service For technology transfer to NTDCL of Pakistan, an international consultant is necessary to teach the latest technology to NTDCL by insuring the transfer of reliable technology to NTDCL engineers. In this Project LL-ACSR is the first conductor which is to be applied to the 220 kV transmission line from Tarbela Hydro Power Station to ISPR substation through Burhan substation. Therefore the procurement and installation of LL-ACSR for the 220 kV line needs proper procedures for procurement and specific conductor setting technology. Therefore, an international consultant is necessary.
Implementation Plan for Consultant Services
The consulting service shall be provided by an international consulting firm (hereinafter referred to as “the Consultant”) in compliance with the Guidelines for Employment of Consultants under Japanese ODA Loans, October 2012. The objective of the consulting services is to achieve the efficient and proper preparation and implementation of the Project through following works:
1) To assist in preparation of Technical Requirements such as technical specifications and basic design.
2) To assist in preparation of Bidding Documents 3) To assist in evaluation of bids along with NTDCL 4) To assist in construction work, supervision and commissioning and Certification 5) Environmental Management 6) Technology transfer
Details of the consulting works 1) To assist in preparation of Technical Requirements, such as technical specification
preparation, basic design preparation. ・To assist in preparation of technical and necessary requirements such as technical
specifications, basic design, cost estimation, detailed project plan based on the

2-57
result of the field survey work along with NTDCL. ・All requirements are covered by the design documents based on the detailed design
along with NTDCL and then bidding documents are to be prepared. ・To assist in review and verification of all available primary and secondary data for
the project, Such as PC-1, JICA Preparatory report of Islamabad and Burhan Transmission Network System Reinforcement Project.
・To assist in preparation of Technical Requirements of the Project. The Consultant shall confirm the design and specification which meets NTDCL’s requirement.
・To assist NTDCL in making qualification criteria for the 220 kV transmission line. ・To assist NTDCL in making test inspection items and acceptance criteria for the 220
kV transmission line type.
2)Preparation of Bid ・To assist in preparation of bidding documents involving the qualification process, in
accordance with the latest version of Standard Bidding Documents under Japanese ODA Loans.
・To assist in clarification of pre-bid queries, prepare for addendum/corrigendum in relation to 220 kV transmission line.
3) Evaluation of bidders and selection of the contractor ・To assist NTDCL in evaluation of bids in accordance with the criteria set forth in the
bidding documents. ・To assist NTDCL in the selection of a bidder ・To assist NTDCL in negotiations with the bidder and in concluding the contract.
4) Supply management, construction supervision, testing, commissioning and
certification assistance In the installation work, the Consultant shall perform his duties during the contract implementation period of the contracts to be executed by NTDCL and the Contractor in accordance with the Standard Bidding Documents under Japanese ODA Loans for Building.
・To assist in reviewing and recommending for approval to NTDCL the Contractor's
design for the works to be constructed, working drawings, shop drawings and drawings for temporary works.
・To assist in supervising installation works.
2-58
・To assist in attending shop inspection and manufacturing tests in accordance with employer’s requirements.
・To assist in completion tests and commissioning ・To submit monthly progress report and completion report ・To assist in checking and certification of as-build drawings prepared by the
Contractor.
・To assist in checking and certification of the operation and maintenance manual prepared by the Contractor.
・Checking the measures which complete the assurance period.
5) Environmental Management ・Preparation of the Environmental Management Plan (EMP) ・Preparation of the Environmental Monitoring Plan (EMoP) ・Facilitation of implementation of EMP and EMoP 6) Technology transfer ・Carry out technology transfer to the NTDCL officers and staff to be involved. ・The Consultant shall brief staff and demonstrate the survey and basic design, the
bidding, evaluation of bids, contract, construction supervision, commissioning and operation/maintenance after completion of the works as comprehensive technology transfer. The consultant shall assist NTDCL and its staff to build their capacity as a part of on-the-job training under the Project.
Project consultants required as consultant engineers (Confidential)
Contract period (Confidential)
Consultant Schedule (Confidential)
Overall Cost (Confidential)
Supply Method (Confidential)