the practical uses of computational fluid dynamics not ... · load on fired heater 4.2mw 2mw ......
TRANSCRIPT
Page 1 © Copyright Cal Gavin 2010 www.calgavin.com
The Practical Uses of Computational
Fluid Dynamics – Not Just a Pretty
Picture
Presenter: William Osley
Company: CALGAVIN Ltd
Email: [email protected]

Page 2 © Copyright Cal Gavin 2010 www.calgavin.com
Contents: • Introduction
• Case Study 1: Air Cooled Heat Exchanger (ACHE)
Problems related to bypass and flow distribution
• Case Study 2: Shell and Tube Heat Exchanger
Maldistribution
• Case Study 3: Research and Development
• Case Study 4: Tube-side Flow stratification
• Case Study 5: Temperature Pinch
• Conclusion

Page 3 © Copyright Cal Gavin 2010 www.calgavin.com
• Software used:
CFD: ANSYS CFX
Geometry: ANSYS DesignModeler
• Heat Transfer: Heating and Cooling Investigated
• Reynolds range: Laminar and Turbulent
• Turbulence Model: k-ε (when needed)
Introduction

Page 4 © Copyright Cal Gavin 2010 www.calgavin.com
Case Study 1:
Air Cooled Heat Exchanger (ACHE)
Problems related to bypass and flow
distribution

Page 5 © Copyright Cal Gavin 2010 www.calgavin.com
Why use Computational Fluid Dynamics
to Investigate Air coolers? • Air coolers are designed using empirical
correlations that use assumptions such as:
all the liquid entering the header
subsequently flows through tubes
perfect air distribution over the
bundle
• When built, the mechanical design and build
quality / tolerances can have a profound effect
on such assumptions
• CFD can be used to investigate those
shortcomings and the effects on performance
Page 6 © Copyright Cal Gavin 2010 www.calgavin.com
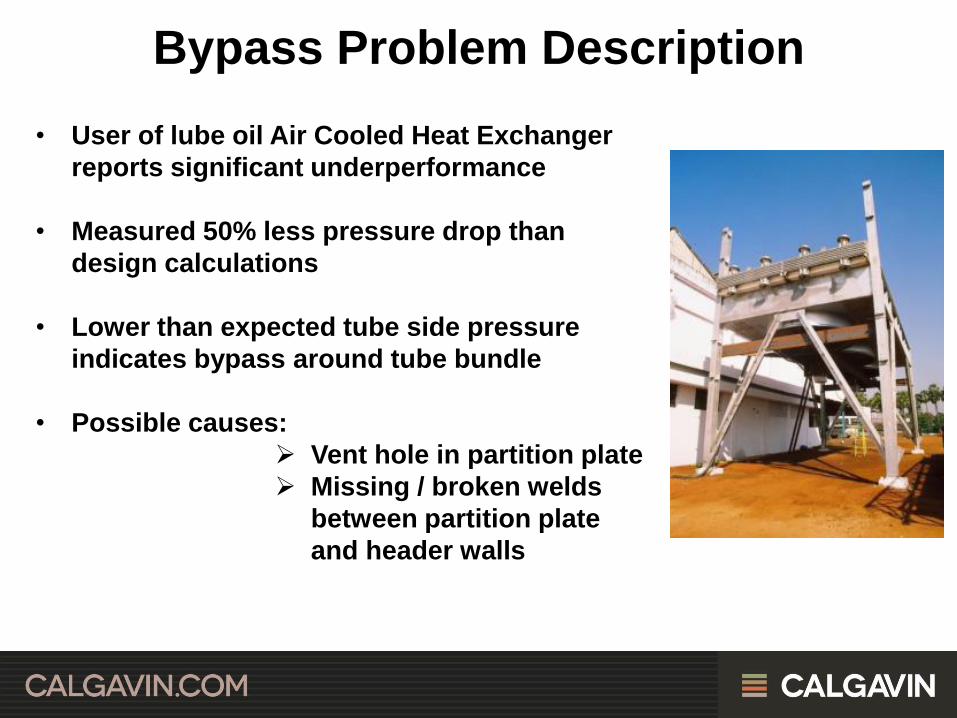
Bypass Problem Description
• User of lube oil Air Cooled Heat Exchanger
reports significant underperformance
• Measured 50% less pressure drop than
design calculations
• Lower than expected tube side pressure
indicates bypass around tube bundle
• Possible causes:
Vent hole in partition plate
Missing / broken welds
between partition plate
and header walls

Page 7 © Copyright Cal Gavin 2010 www.calgavin.com
Air Cooled Heat Exchanger Geometry
1. No Bypass, 2. 12mm vent hole and 3. 12mm vent hole and side gaps

Page 8 © Copyright Cal Gavin 2010 www.calgavin.com
• By comparing the no bypass geometry with: tube side
pressure drop (nozzles, header and tubes) results with heat
exchanger design software
• CFD simulation results within 8% of calculated pressure
drop from heat exchanger design software
Verification of CFD simulations

Page 9 © Copyright Cal Gavin 2010 www.calgavin.com
No Bypass
12mm vent hole
12mm vent hole and 1 mm gaps

Page 10 © Copyright Cal Gavin 2010 www.calgavin.com
Results
35% reduction in
pressure drop
11% reduction in
duty
• 12 mm vent hole = 20% mass flow bypass
• 12mm vent hole and 1mm gaps = 42% mass flow bypass
64% reduction in
pressure drop
27% reduction in
duty

Page 11 © Copyright Cal Gavin 2010 www.calgavin.com

Page 12 © Copyright Cal Gavin 2010 www.calgavin.com
Simulation Scenarios • API 661 Recommended 40% fan coverage
• Equations used to describe fan air
flow
• Same total mass-flow for each
scenario
• Three plenum depths for the three
fan layout:
• 500mm
• 720mm
• 1000mm
Fan
Plenum
Bundle

Page 13 © Copyright Cal Gavin 2010 www.calgavin.com
Verification and Results
• CFD results compared with Equation:
2
max****2 VNrfP bA
Equation commonly used to calculated cross flow air pressure drop
though a tube bundle(Serth and Lestian (2014))
• Eq 2 gives ΔPA= 86.4 Pa
• CFD gives ΔPA= 88.4 Pa
• CFD model accurately predicts
the air flow
Serth R.W., Lestian T., 2014, Process Heat Transfer (2nd Edition), Academic Press, Elsevier.

Page 14 © Copyright Cal Gavin 2010 www.calgavin.com
Effect of Increased Plenum Depth
More even
Velocity
Distribution
Increase in
Plenum
Depth

Page 15 © Copyright Cal Gavin 2010 www.calgavin.com
Effects of Maldistribution on Heat Transfer

Page 16 © Copyright Cal Gavin 2010 www.calgavin.com
Conclusions
• Care should be taken in sizing vent
holes and pass partition welds to
avoided bypass to ensure correct
performance
• Increased Plenum depth improved
distribution

Page 17 © Copyright Cal Gavin 2010 www.calgavin.com
Case Study 2:
Shell and Tube Heat Exchanger
Maldistribution

Page 18 © Copyright Cal Gavin 2010 www.calgavin.com
Shells: TEMA: AES
3 in series; 2 in parallel;
Bundle:
Tubes: 2521; 1pass
20mm x 1.8mm x 9m
Calculated Exchanger Performance
Tube side dp calc / allow. 2.5kPa / 45 kPa
Shell side HTC 900 W/m2K
Tube side HTC 285 W/m2K
Duty Measured 20 MW / real
+60%
Service:
• Heat recovery for hydro treatment reactor
Problem description:
• Calculated performance should be 60% higher
• No spare capacity of fired heater to increase
throughput
Page 19 © Copyright Cal Gavin 2010 www.calgavin.com
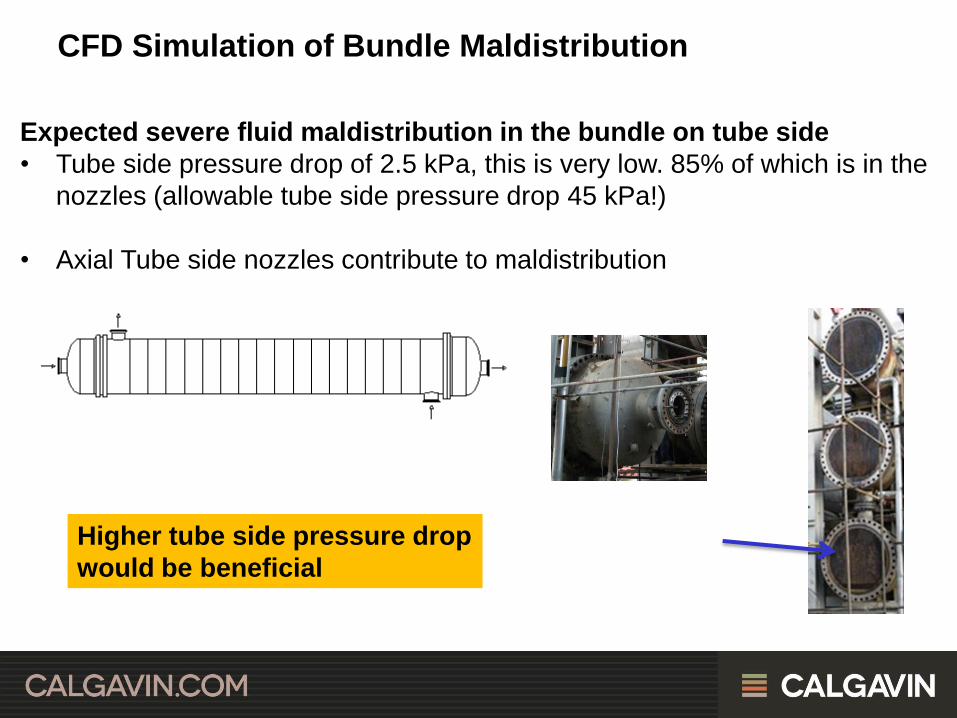
Expected severe fluid maldistribution in the bundle on tube side
• Tube side pressure drop of 2.5 kPa, this is very low. 85% of which is in the
nozzles (allowable tube side pressure drop 45 kPa!)
• Axial Tube side nozzles contribute to maldistribution
Higher tube side pressure drop
would be beneficial
CFD Simulation of Bundle Maldistribution

Page 20 © Copyright Cal Gavin 2010 www.calgavin.com
plane side view
CFD Simulation of Bundle Maldistribution

Page 21 © Copyright Cal Gavin 2010 www.calgavin.com
Plain empty hiTRAN
before (empty) after (hiTRAN)
Tube pressure drop 2.5 kPa (>85% nozzles) 20 kPa (~10% nozzles)
CFD Simulation of Bundle Maldistribution

Page 22 © Copyright Cal Gavin 2010 www.calgavin.com
hiTRAN installation and benefits
before (empty) after (hiTRAN)
Tube pressure drop 25mbar (>85% nozzles) 200mbar (~10% nozzles)
Tube side heat
transfer
<285 W/m2K ~980W/m2K
Shell feed outlet temp 240 ̊C 314 ̊C
Tube effluent outlet 115 82
Mass flow 27kg/sec 42kg/sec
Load on fired heater 4.2MW 2MW
Annual energy savings of $ 233000

Page 23 © Copyright Cal Gavin 2010 www.calgavin.com
Case Study 3:
Research and Development

Page 24 © Copyright Cal Gavin 2010 www.calgavin.com
Fluid movement, cooling
Re 253, 70 ̊C inlet and 7 ̊C wall

Page 25 © Copyright Cal Gavin 2010 www.calgavin.com
CFD Simulation Plain empty tube
Simulation verified with experimental data for different Reynolds numbers
70 ̊C Inlet temperature; 7 ̊C Wall temperature, 2.5m tube length; Viscosity 12cP
70 ̊C Inlet
Outlet bulk
CFD 62 ̊C; measured 61.8 ̊C
Velocity profile
Reynolds 253
• Stratified flow
• Long residence
time
at bottom of tube
• Low heat transfer
70 ̊C Inlet
Reynolds 935
Outlet bulk
CFD 66.2 ̊C; measured 66.2 ̊C
Page 26 © Copyright Cal Gavin 2010 www.calgavin.com
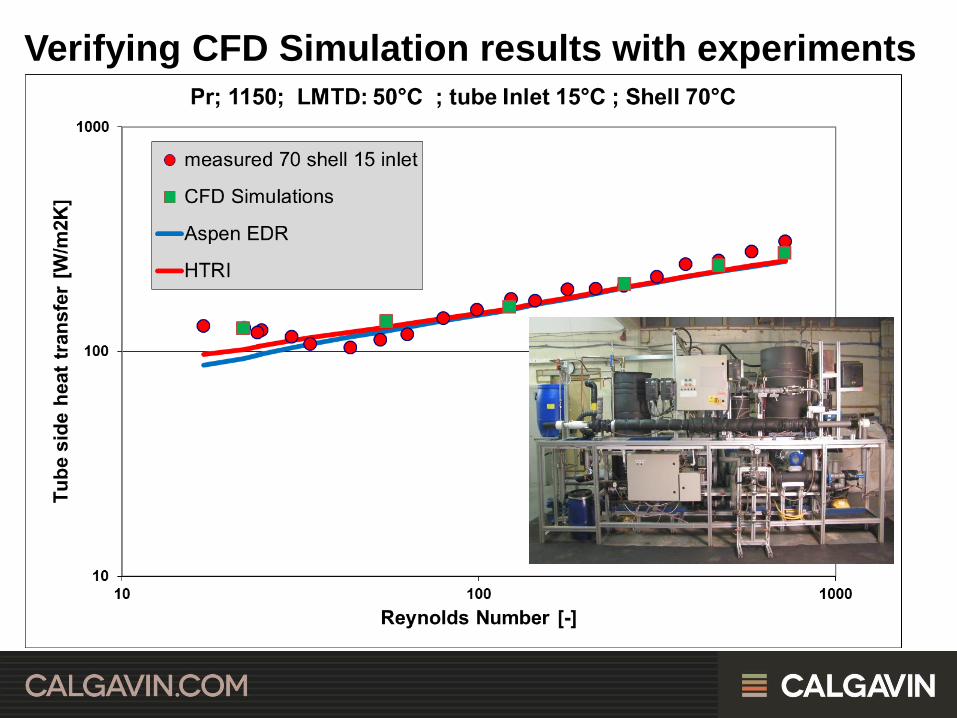
Verifying CFD Simulation results with experiments

Page 27 © Copyright Cal Gavin 2010 www.calgavin.com

Page 28 © Copyright Cal Gavin 2010 www.calgavin.com
Dye Stream hiTRAN

Page 29 © Copyright Cal Gavin 2010 www.calgavin.com
Verifying CFD Simulation results with
Cal Gavin heat transfer measurements for
hiTRAN
65˚C INLET Temperature,
40˚C Wall temperature,
1000mm test section Outlet Temperature
(°C)
%
dev
Reynolds
number CALGAVIN CFD
190 60.98 60.61 0.6
496 62.08 61.94 0.2
1014 62.71 62.61 0.16
1993 63.28 63.17 0.17

Page 30 © Copyright Cal Gavin 2010 www.calgavin.com
Fluid movement hiTRAN Re 253, 70 ̊C Inlet and 7 ̊C Wall Velocity profile at outlet

Page 31 © Copyright Cal Gavin 2010 www.calgavin.com
CFD Simulation Plain empty tube compared to enhance hiTRAN flow
Example Simulation verified with experimental data:
70 ̊C Inlet temperature; 7 ̊C Wall temperature
2.5m tube length; Reynolds number 253; mass flow 195kg/hr; Viscosity 12cP
70° C Inlet 70° C Inlet
Outlet bulk CFD 62 ̊C; measured 61.8 ̊C
Outlet bulk CFD 50.7 ̊C; measured 49.9 ̊C
hiTRAN tube
Velocity profile plain
plain tube
Velocity profile hiTRAN
• Stratified flow
• Long residence
time
at bottom of tube
• Low heat transfer
• Good fluid
distribution
• High heat transfer
with low outlet
temperature

Page 32 © Copyright Cal Gavin 2010 www.calgavin.com
Flow Stratification
Tube ID: 22 mm, Tube Length: 2500mm, Reynolds number 190, Inlet 65˚C Wall 40˚C
Highest velocity
in centre of tube
Highest velocity
towards tube wall
Empty Tube hiTRAN: Low density
Outlet:
60.7˚C
Outlet:
55.9˚C
Page 33 © Copyright Cal Gavin 2010 www.calgavin.com
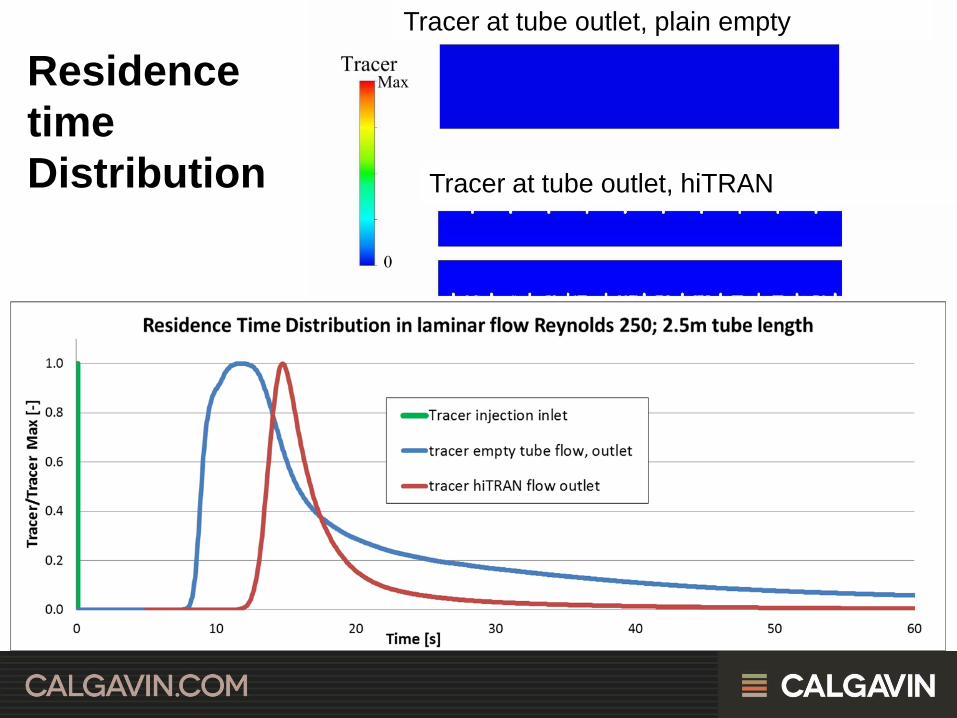
Residence
time
Distribution
Tracer at tube outlet, plain empty
Tracer at tube outlet, hiTRAN

Page 34 © Copyright Cal Gavin 2010 www.calgavin.com
Static mixer Heat Transfer – Heating
Experimental and CFD comparison
Fluid used: Glycerol
Viscosity: 350 cP at ~35 ̊C
Reynolds number Range: laminar 1 to 28
Inlet Temperature: ~30 ̊C
Wall Temperature: ~64 ̊C

Page 35 © Copyright Cal Gavin 2010 www.calgavin.com
Comparison of Experimental and CFD results

Page 36 © Copyright Cal Gavin 2010 www.calgavin.com
Static Mixer: Re 16, Inlet
30 ̊C and Wall 60 ̊C
hiTRAN: Re 14, Inlet 30 ̊C
and Wall 51 ̊C
Page 37 © Copyright Cal Gavin 2010 www.calgavin.com
Case Study 4:
Tube-side Flow stratification

Page 38 © Copyright Cal Gavin 2010 www.calgavin.com
47600kg/hr
~ 115W/m2K
38.2 ̊C 101 ̊C / dp 2.7bar
condensing steam
9.2bar
176 ̊C
12000W/m2K
Viscous polymer
~2000cP / inlet
~ 800cP / outlet
AEL 4pass, 372 tubes
25.4mm x 1.65mm x 4000mm
Goal of Revamp is to increase polymer outlet temperauter

Page 39 © Copyright Cal Gavin 2010 www.calgavin.com
Plain
9.2bar
hiTRAN
6.3bar
No of passes 4 2
Steam pressure [bar] 9.2 6.3
Steam temp. [C] 176 160
tube side HTC
[W/m2K]
100 206
Tube side outlet [C] 101 124
Tube side dp [bar] 2.7 2.9
Steam temperature (176 ̊C)
Inlet temperature (38 ̊C)

Page 40 © Copyright Cal Gavin 2010 www.calgavin.com
Mixed Convection causes flow stratification
Temperature distribution; tube Inlet:
Temperature distribution; middle of tube
Temperature distribution; tube exit
Plain empty hiTRAN
38 ̊C 38 ̊C
101 ̊C 124 ̊C

Page 41 © Copyright Cal Gavin 2010 www.calgavin.com
Case Study 5:
Temperature Pinch

Page 42 © Copyright Cal Gavin 2010 www.calgavin.com
190kg/sec
83kg/sec
65 ̊C
Wet crude
~ 1000cP
103 ̊C
60 ̊C
85 ̊C
Produced water
~15MW
Heat transfer Plain design
Tube side /
Reynolds ~
1800
400 W/m2K
Shell side 300 W/m2K
Overall U 140 W/m2K
EMTD ~9 ̊C
plain
No of shells [-] 2 parallel
Total tubes [-] 10348 x 12.8m long
Total area [m2] 7821

Page 43 © Copyright Cal Gavin 2010 www.calgavin.com
In tube temperature pinch in conventional design
HTRI warning message on plain tube design:
Empty tube hiTRAN
CFD simulation over 10.2m tube length with: water inlet 103 ̊C
Page 44 © Copyright Cal Gavin 2010 www.calgavin.com
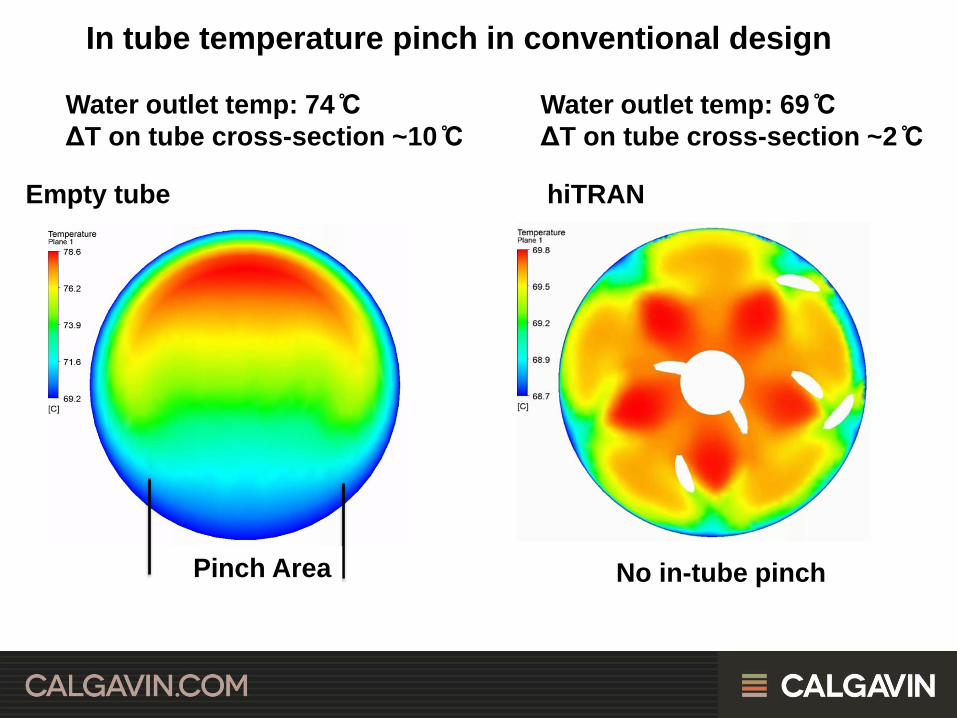
In tube temperature pinch in conventional design
Empty tube hiTRAN
Water outlet temp: 74 ̊C
ΔT on tube cross-section ~10 ̊C
Water outlet temp: 69 ̊C
ΔT on tube cross-section ~2 ̊C
Pinch Area No in-tube pinch

Page 45 © Copyright Cal Gavin 2010 www.calgavin.com
Conclusion • This presentation has shown a variety of uses for
CFD they include:
Identification for the cause of an air cooled heat
exchanger underperformance
Investigation ACHE air-side flow distribution
Shell and tube tube-side maldistribution
Identification of flow stratification and temperature
pinch
Research and development
• There are many more possibilities to explore using
CFD:
New heat transfer enhancement geometries
Turbulence flows
2-phase flow

Page 46 © Copyright Cal Gavin 2010 www.calgavin.com
CALGAVIN Limited, UK Specialist Heat Exchange Engineers
• What we do?
Provide thermal engineering solutions
to:
Optimize plant production
Solve production limitation problems
Reduce energy costs
Enhancement technology (hiTRAN)

Page 47 © Copyright Cal Gavin 2010 www.calgavin.com
CALGAVIN:
Solving Problems, Saving Costs • Study to revamp operations - Providing
consultancy advice through project engineering
to improve plant operations.
• Design Services - Enhancing heat
exchangers using various software such as
HTRI, Aspentech and hiTRAN SP.
• Analytical engineering services - Analysing
the performance and operation of existing heat
exchangers, making comparisons between
original designs and enhanced designs for
improved efficiency.

Page 48 © Copyright Cal Gavin 2010 www.calgavin.com
Any Questions? Email: [email protected]
Tel: +44 1789 400401
Fax: +44 1789 400411