the power of brand sel es in consumer-generated …on2110/papers/hartmann_et_al_2019.pdfthe power of...
TRANSCRIPT

The Power of Brand Selfies in
Consumer-Generated Brand Images
March 2019
Jochen Hartmann1
Mark Heitmann2
Christina Schamp3
Oded Netzer4
Funding:
This work was funded by the German Research Foundation (DFG) research unit 1452, “How Social
Media is Changing Marketing”, HE 6703/1-2.
1Jochen Hartmann is Doctoral Student at the University of Hamburg, Hamburg Business School,
Moorweidenstrasse 18, 20148 Hamburg, Germany. [email protected].
2Mark Heitmann is Professor of Marketing & Customer Insight at the University of Hamburg,
Hamburg Business School, Moorweidenstrasse 18, 20148 Hamburg, Germany. mark.heitmann@uni-
hamburg.de.
3Christina Schamp is Postdoctoral Researcher at the University of Hamburg, Hamburg Business
School, Moorweidenstrasse 18, 20148 Hamburg, Germany. [email protected].
4Oded Netzer is Professor of Business, Columbia Business School, 520 Uris Hall, 3022 Broadway,
New York, NY 10027-6902, USA. [email protected].
The Power of Brand Selfies in
Consumer-Generated Brand Images
March 2019
Abstract
Smartphones have made sharing images of branded experiences on social media nearly
effortless. Tracking and understanding how brands appear online is relevant to brands
both as an indicator of social media brand interest, and to incentivize consumers to
create and share certain brand images. This research investigates consumer-generated
brand images. Aside from packshots (i.e., standalone product images), the authors
identify two different types of brand-related selfie images: consumer selfies, i.e., im-
ages featuring both brand logos and consumers’ faces, and brand selfies, i.e., invisible
consumers holding a branded product. Classifying nearly half a million Twitter brand
images across 185 different brands and 6,926 Instagram images prompted by a Star-
bucks campaign using deep convolutional neural networks and text mining tools to
measure consumers’ engagement with brands, the authors demonstrate that the three
brand image types generate different engagement levels among receivers. Specifically,
the authors find that an emerging phenomenon, which they term brand selfies, leads to
high levels of brand engagement from consumers. A controlled lab experiment repli-
cates these findings and provides indications on the psychological mechanism.
Keywords: User-Generated Content; Social Media; Deep Learning; Natural Language
Processing.
Every day more than 5 billion images are shared on social media networks such as Facebook,
Twitter, or Instagram.1 Of particular interest to marketers are images that feature brands
and consumption experiences. Both interviews with industry experts and the assessment of
a sample of images from social media suggest that brand-related images contribute approxi-
mately 1% of all social media images.2 That is, 50 million social media images feature brand
logos daily. This magnitude of brand image content is likely to exceed any other advertising
channel by an order of magnitude, generating an immense level of reach.
One of the biggest trends introduced by smartphone cameras and social media are selfies.
Selfies have quickly become so popular that Oxford Dictionaries named selfie the word of the
year in 2013. According to estimates, individual millennial users will take more than 25,000
selfies in their lifetime (Glum 2015). Today, more than 383 million images with the hashtag
#selfie exist on a single photo-sharing platform such as Instagram (www.instagram.com).
The emergence of selfies merits the question of how brands appear in selfie images and
how observers respond to this type of social media brand images. As a matter of fact, recent
marketing practice attempts to capitalize on the selfie phenomenon. For example, compa-
nies such as Unilever (Axe deodorant), Dunkin’ Donuts, or Coca-Cola actively encouraged
consumers to post selfies of their product encounters (see Appendix A). Coca-Cola even con-
structed a “Selfie Bottle” to assist consumers in taking pictures of themselves while drinking
(Coca-Cola 2016). Brand images are also of interest to firms when passively listening in to
social media posts. Among other things, companies track brand logo presence on social me-
dia to understand social media popularity, rank consumer-generated images on their social
media brand page, or use such images as part of their own marketing campaigns. How-
ever, not all brand logo appearances are created equal. Some may generate more valuable
consumer-brand engagement than others.
Accordingly, the objective of this research is to investigate how brands appear in consumer-
1Estimate based on Meeker (2016) and social media growth (Statista 2019).2Based on a random sample of one image each day on Twitter in 2018.
2
generated images and to examine the effectiveness of different types of social media brand
images on generating engagement among consumers. Specifically, we investigate both sender
engagement objectives in terms of how brand images may generate image engagement (i.e.,
likes or comments) and brand engagement objectives in terms of how brand images may gen-
erate brand engagement (i.e., brand-related comments). Academic research provides ample
evidence for the effectiveness of images in advertising (e.g., Hanssens and Weitz 1980; Xiao
and Ding 2014). Recent studies have also explored the motivations to share content and
take photos and how this impacts subsequent sender behavior (e.g., Barasch, Zauberman
and Diehl 2018; Grewal, Stephen and Coleman 2019). However, little is known about how
observers respond to brand images in social media.
Using both manual annotations of a sample of images and convolutional neural networks
(CNN) for automated image classification of nearly half a million brand images related to
185 different brands that were posted on Twitter over two years, we identify three types of
user-generated brand images that differ in terms of human and facial presence. Consumers
post either images of products in isolation or holding products themselves (i.e., selfies). We
find that these brand-related selfies exist in two forms with consumers either visible (their
face) or invisible to the viewer (e.g., first-person point of view of the product). We name
the former consumer selfie and the latter brand selfie to indicate the focus in brand selfies
is exclusively on the product and differentiate it from consumer selfies where the face of the
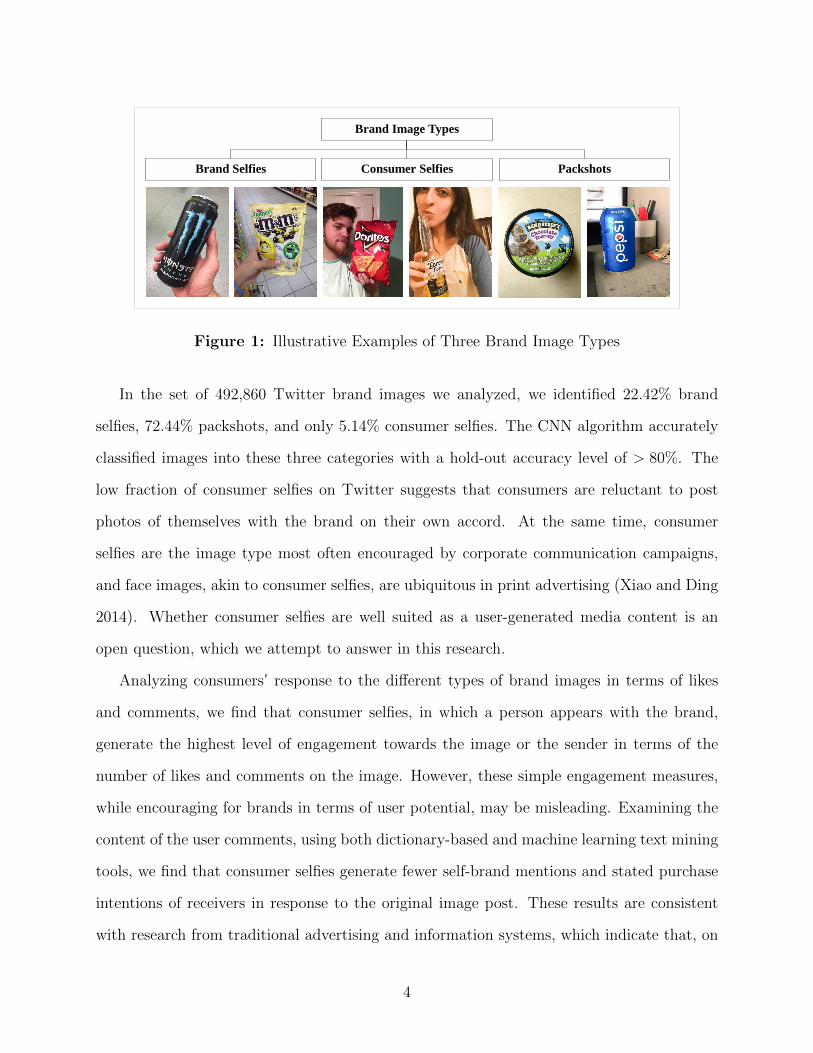
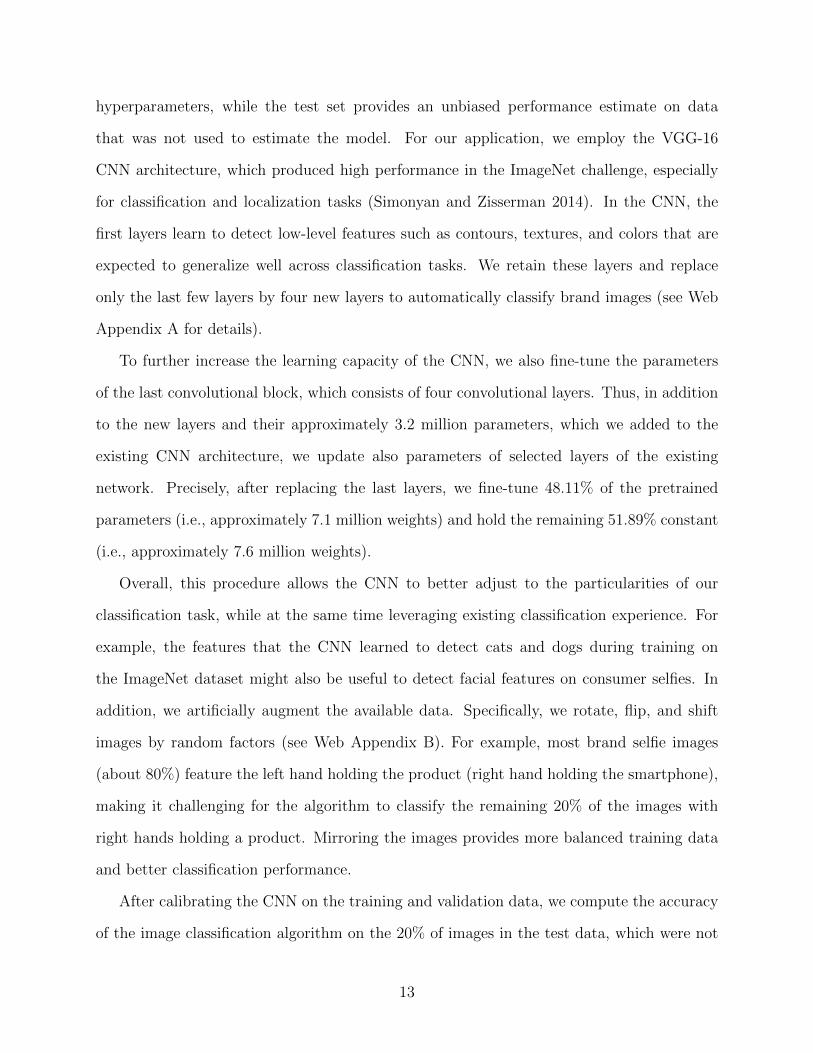
sender is visible. This results in the following typology of brand images (see Figure 1):3
1. Brand Selfies: branded products held by an invisible consumer,
2. Consumer Selfies: visible consumer faces together with a branded product,
3. Packshots: standalone images of branded products.
3Note, we distinguish brand and consumer selfies based on the visibility of consumer faces. Conceptually,the term selfie suggests the person on the image took the photo herself. Yet, in some cases, a third personmay have photographed the sender (< 3% of brand selfies and < 39% of consumer selfies in our Twitterdata). As Figure 1 illustrates, this can be difficult to distinguish empirically for both the human eye and anautomated image classifier.
3
Brand Selfies Consumer Selfies Packshots
Brand Image Types
Figure 1: Illustrative Examples of Three Brand Image Types
In the set of 492,860 Twitter brand images we analyzed, we identified 22.42% brand
selfies, 72.44% packshots, and only 5.14% consumer selfies. The CNN algorithm accurately
classified images into these three categories with a hold-out accuracy level of > 80%. The
low fraction of consumer selfies on Twitter suggests that consumers are reluctant to post
photos of themselves with the brand on their own accord. At the same time, consumer
selfies are the image type most often encouraged by corporate communication campaigns,
and face images, akin to consumer selfies, are ubiquitous in print advertising (Xiao and Ding
2014). Whether consumer selfies are well suited as a user-generated media content is an
open question, which we attempt to answer in this research.
Analyzing consumers’ response to the different types of brand images in terms of likes
and comments, we find that consumer selfies, in which a person appears with the brand,
generate the highest level of engagement towards the image or the sender in terms of the
number of likes and comments on the image. However, these simple engagement measures,
while encouraging for brands in terms of user potential, may be misleading. Examining the
content of the user comments, using both dictionary-based and machine learning text mining
tools, we find that consumer selfies generate fewer self-brand mentions and stated purchase
intentions of receivers in response to the original image post. These results are consistent
with research from traditional advertising and information systems, which indicate that, on
4
the one hand, images with faces catch more attention than those without faces (Bakhshi,
Shamma and Gilbert 2014; Xiao and Ding 2014), but, on the other hand, may detract
attention away from the brand itself (Erfgen, Zenker and Sattler 2015).
In a second empirical application, we validate and extend these findings by investigating
a company-initiated campaign. Specifically, we analyze images posted as part of a Starbucks
campaign that incentivized consumers to post images of Starbucks cups on Instagram. The
results largely corroborate the analysis of the Twitter data. We find that brand selfies are
consistently the top performing user-generated brand images in terms of brand engagement.
However, unlike the more general social media image analysis on Twitter, brand selfies
dominate consumer selfies even in generating image- or sender-related engagement (likes
and comments), which is plausible given the brand-centric campaign context.
We complement these results with a lab experiment, which allows us to control for the
prominence of the brand in the image and collect brand attitude and purchase intent ratings,
as well as to test potential psychological mechanisms that may trigger consumers’ varying
reaction to different brand image types. The results of the experiment further suggest that
brand selfies have a superior impact on brand attitude and purchase intent compared to
consumer selfies. In addition, it suggests the differential impact of brand selfies is related to
easier and more accessible self-reference and mental simulation offered by these image types.
The remainder of the paper is organized as follows: In the next section, we discuss
the literature related to the role of user-generated brand content and consumer response
to branded images. We then describe the analysis of the extensive Twitter image dataset
and the deep learning algorithms we deployed to identify the three types of brand images
(brand selfies, consumer selfies, and packshots). The subsequent section analyzes the impact
of the different types of images in the context of a company-initiated (Starbucks) campaign,
followed by a controlled lab experiment, which allows us to dig in deeper into the possible
underlying mechanisms that lead to consumer reactions to the image types. We conclude
with a discussion and suggestions for future research.
5
BRAND IMAGES IN SOCIAL MEDIA
The Role of User-Generated Brand Content in Social Media
Numerous studies demonstrate the importance of user-generated content (UGC) as a plat-
form for social listening and understanding of customer needs, as well as in terms of affecting
consumer behavior (Moe, Netzer and Schweidel 2017). The majority of this research has re-
lied either on summaries of text content such as volume and valance (e.g., Chevalier and
Mayzlin 2006; Godes and Mayzlin 2004; Liu 2006) or on analyzing user-generated texts to
automatically capture consumer perception (Netzer et al. 2012; Tirunillai and Tellis 2014).
UGC has been shown to predict demand (e.g., Chevalier and Mayzlin 2006; Liu 2006),
customer-based brand equity (e.g., Schweidel and Moe 2014), and stock returns (e.g., Col-
icev et al. 2018). In addition, individual elements of text content (e.g., valence and arousal)
differ in viral potential, perceived usefulness to receivers, and impact on corporate commu-
nication effectiveness (e.g., Berger and Milkman 2012; Yin, Bond and Zhang 2017). Taken
together, this research demonstrates that communication content on social media carries
important information to consumers, linking social media response to brand performance.
However, despite the increasing role of images in social media, academic research on
UGC has mainly focused on textual analysis and summaries of text content. Only very few
recent papers have made use of advances in image classification and deep learning to study
images in UGC (e.g., Liu, Dzyabura and Mizik 2018; Zhang and Luo 2018; Zhang et al.
2018). Most important to this research, Liu, Dzyabura and Mizik (2018) investigate how
social media images can reflect perceptual brand attributes. This research provides valuable
insights into the impact of user-generated images on receivers. Relatedly, Klostermann et al.
(2018) uses and tags social media images related to the McDonald’s brand to create an
associative network. From the sender perspective, Grewal, Stephen and Coleman (2019)
finds that sharing images serves important social objective in terms of identity signaling.
We build on both of these streams of research to study how different types of brand
6
images on social media relate to both sender-related engagement in terms of the number of
likes and comments as well as brand engagement in terms of the content of brand-related
communication while controlling for the text content of the image post.
Consumer Responses to Different Brand Image Perspectives
The three types of consumer-generated brand images we identified (brand selfies, consumer
selfies, and packshots) differ in terms of human presence (both types of selfies with human
presence vs. packshots without) and facial presence (consumer selfies with facial presence
vs. brand selfies and packshots without). While research on the role of selfies in marketing
is scarce, we can draw on findings from traditional advertising and image research on the
role of both human and facial presence in images.
Human presence. In print advertising, human presence is common practice in over 50% of
ads (Xiao and Ding 2014). Marketing scholars extensively studied this from the perspective
of brand endorsement (Knoll and Matthes 2017). Similarly, consumers holding a branded
product as in both selfie types is likely to be a stronger personal endorsement than a packshot.
At the same time, image endorsements are non-trivial and can backfire (Knoll and Matthes
2017). For example, celebrities in advertising can overshadow brands and inhibit brand
recall (Erfgen, Zenker and Sattler 2015). Outside the selfie and branding context, social
media users often seek popularity within their personal network (Ansari et al. 2018) and
self-advertise themselves when posting images (Toubia and Stephen 2013). The fact that
even paid brand ambassadors on professional images can be detrimental to brand recall
suggests similar effects are conceivable when self-interested consumers post self-generated
images. This can result in brand engagement falling short of image engagement and result
in increasing discrepancies as the visibility of the sender increases in brand and consumer
selfies.
Facial presence. While brand selfies and consumer selfies differ from packshots in en-
dorsement and consumer presence, consumer selfies also differ from both packshots and
7
brand selfies in terms of facial sender presence. In addition, unlike consumer selfies where
the receiver looks directly at the sender, brand selfies but also packshots typically involve a
shared point of view between senders and receivers.
As the amount of available information proliferates, facial images can play a pivotal role
in attracting selective attention (Tomalski, Csibra and Johnson 2009). Indeed, social media
research reports the “faces engage us” effect, suggesting that the most liked and commented
images on social media are those containing faces (Bakhshi, Shamma and Gilbert 2014).
This is consistent with findings that faces capture more attention than competing visual
stimuli and are processed at higher speed and in greater detail (e.g., Devue, Belopolsky
and Theeuwes 2012). This attentional bias has also been demonstrated in print advertising
(Guido, Pichierri and Pino 2018). From a brand perspective, facial consumer images in UGC
can be a double-edged sword. On the one hand, faces increase attention to the image itself,
but on the other hand, the brand has to share a physical space with the sender’s face, which
can result in smaller brand logos on average and lower attention to the brand itself compared
to the other two brand image types.
When it comes to brand selfie images, the necessity for a brand selfie photographer to be
within arm’s length of the camera and the natural position within the center of the image
might ensure the featured product is subjectively within intimate space to the receiver. In
advertising, this proximity is associated with heightened attention, more intense involvement,
salience, and brand-related engagement (Messaris 1997).
The three types of brand images may also trigger different types of psychological pro-
cesses. Specifically, first-person perspectives result in more vivid mental visualizations com-
pared to third-person perspectives (Bone and Ellen 1992). Consequently, viewers can relate
the brand more easily to themselves, which may result in higher levels of elaboration and
depth of encoding than information unrelated to the self (e.g., Bower and Gilligan 1979).
These benefits of self-reference processing have produced robust effects in terms of elabora-
tion and recall across a wide variety of domains (Symons and Johnson 1997). In contrast,
8
faces of other consumers visibly holding a product are likely to drive other- as opposed to
self-related thoughts, suggesting brand selfies, and to some extent packshots, are likely to
lead to higher levels of self-reference and consequential engagement than consumer selfies.
Furthermore, brand selfies can result in mental visualizations of connections to the prod-
uct, which in turn may lead to subjective feelings of psychological ownership, i.e., consumers
feeling as if they possessed the presented product (Peck, Barger and Webb 2013; Weiss and
Johar 2018). In contrast, consumer selfies emphasize actual ownership of another individ-
ual, which can inhibit psychological ownership perceptions (Kirk, Peck and Swain 2017) and
inhibit assimilations of product traits towards the self-image of the viewer (Weiss and Johar
2013). This suggests brand engagement is stronger whenever sender and receiver share the
same point of view as in brand selfies and packshots (Peck and Shu 2009; Shu and Peck
2011). Additionally, the egocentric perspective of brand selfies may serve as an executional
cue that facilitates actions over and above subjective feelings of ownership or self-reference
thoughts (Krishnamurthy and Sujan 1999). Previous research has linked such mental sim-
ulations of actions to brand-related behavioral outcomes such as purchase intentions (e.g.,
Elder and Krishna 2012; Zhao, Hoeffler and Zauberman 2011).
In summary, research on endorsement and attention to faces suggest that consumer selfies
are likely to attract higher levels of engagement (e.g., impressions and likes) than the other
two image types. At the same time, endorsement research indicates that the presence of faces
can detract attention away from the brand, in particular, when senders are motivated to pro-
mote themselves rather than the brand. Self-reference, psychological ownership, and mental
simulation theories suggest that brand selfies, which often involve a consumer touching the
brand from the point of view of the viewer, may generate higher levels of brand-related
information processing, memory recall, and brand purchase desire. Empirically, both brand
selfies and packshots appear very similar to a superficial observer as they share similar im-
age compositions and differ mainly in the presence of the sender hand. We investigate next
whether such subtle differences can result in a detectable impact on social media response.
9
EMPIRICAL APPLICATION: BRAND IMAGES ON TWITTER
To investigate the prevalence of the different brand image types and their impact on brand
engagement, we analyze an extensive set of images shared via Twitter, a social network with
high reach both in terms of individual (321 million monthly active users as of 2018; Twitter
2019) and corporate users (91% of Fortune 500 companies; Barnes, Kane and Maloney 2018).
Moreover, in recent years, the amount of image content on Twitter has increased rapidly and
approached as much as 20% of all posts (Vicinitas 2018).
Data
As a first step, we wish to collect a comprehensive dataset of Twitter images that include
brands. An intuitive approach to identify brand logos on Twitter is accessing all image posts
featuring a brand name as a hashtag. While it is relatively simple to collect such data, such
approaches can be potentially misleading because the majority of the posted brand logos
(85%) do not feature the respective brand hashtag (Cass 2016).4 Furthermore, brand images
that include brand hashtags (e.g., #brand) or handletags (e.g., @brand) may be inherently
different from brand images that do not, as the decision to add a brand mention may involve
more conscious brand deliberations by the sender.
Our analysis, therefore, requires more comprehensive access to brand images. For this
purpose, we collaborate with a U.S.-based vendor with a Twitter firehose access to a random
sample of 10% of all tweets on Twitter. This allowed automatic tracking of logo appearances
for 185 brands across 10 categories (including sweet and salty snacks, non-alcoholic and
alcoholic beverages, cereals and ice cream) over two years (January 2014 to December 2016).
The vendor identifies images that contain brand logos using machine learning. The resulting
data comprises 883,304 brand logo images in total and contains the original image, the size,
4We found similar figures in our data, which involves only branded images. Only 13.44% of the imagesmention the brand as a hashtag or handletag in the sender caption.
10
and location of the detected logo as well as an identification number of the original tweet,
allowing us to augment the data.
We assess the quality of the brand logo detection in two ways. First, a research assistant
inspected a random sample of 16,949 images to identify potential false positives (4:45 hours
of manual work). This revealed a precision (i.e., the share of correct classifications of all
identified logos) of 95.9%, suggesting negligible false classifications. These high values of
accuracy are plausible given that identifying brand logos is a relatively easier task than
common image recognition tasks with much higher levels of heterogeneity across items (see
Deng et al. 2009, introducing the large-scale ImageNet dataset). Second, we conducted
hashtag searches of individual brands on Twitter to see all available images and inspect
recall, i.e., whether all relevant logos on Twitter are systematically captured. A comparison
with the subset of our data with brand hashtags suggests high levels of recall. For example,
for the brand hashtag #Heineken we find 115 logo appearances in a single month. For the
same month, our image data contains 13 brand logo appearances with Heineken hashtag
(246 without), which is in line with expectations for a random Twitter sample of 10%.
Using the identification number of the original tweet, we augment this data by accessing
the original Twitter post of each image and collecting the number of likes each image has
received, the number of comments, the caption of the post (i.e., the text accompanying the
image post) and all comments’ text content, hashtags and handletags of the post as well
as all available information on the senders (their posting activity, number of friends, and
number of followers). Note that we collected this information three months after the last
image was posted. However, because most comment responses and likes on Twitter happen
within the first 24 hours (Hennig-Thurau, Wiertz and Feldhaus 2015), we are confident that
our data contains the vast majority of the relevant responses to the posts. Additionally, we
control for post age in our econometric models.
11
Automated Image Classification
Recent advances in computer vision have produced remarkable accuracy levels, which in
certain domains exceed (expert) human capability, e.g., in lip reading from videos (Chung
et al. 2017). Having obtained a dataset of images with brand logos, we build on these deep
learning architectures to automatically classify the types of user-generated brand images. For
this purpose, we apply transfer learning. The idea of transfer learning is to obtain an existing
CNN pretrained on a large dataset (e.g., the 1.2 million ImageNet images, Deng et al. 2009)
and transfer the learning from that dataset to our context by adjusting the CNN through
modified and added layers. This procedure is common in image analysis as it reduces the
human-annotated training data and avoids overfitting to limited datasets (Yosinski et al.
2014; Zhang and Luo 2018).
Our training data comprises 16,949 randomly drawn images from the Twitter data. We
asked a research assistant, who was unaware of the purpose of this investigation, to manually
classify the brand images into the three brand image categories by visual inspection (brand
selfies, consumer selfies, and packshots). Because some of the images contain advertising
content such as banner ads, which are not user-generated, we added a fourth category to the
classification (advertising).
To speed up this coding process, a program displayed the images sequentially, allowing
the human coder to quickly assign each image to one of the four categories by pressing a
button (below one second per image, 4:45 hours in total). To assess the validity of the
resulting manual classification, we selected a random sample of 400 images (100 images per
class) and asked an independent research assistant to verify the classification. The results
of this reveal a correct classification of above 95% of the data (2.75% error rate), suggesting
the manual classification is a valid representation for training our deep learning algorithm.
We split the classified data into training (60%), validation, and test sets (20% each).
The training data is used to train the CNN, the validation set is used to tune the CNN
12
hyperparameters, while the test set provides an unbiased performance estimate on data
that was not used to estimate the model. For our application, we employ the VGG-16
CNN architecture, which produced high performance in the ImageNet challenge, especially
for classification and localization tasks (Simonyan and Zisserman 2014). In the CNN, the
first layers learn to detect low-level features such as contours, textures, and colors that are
expected to generalize well across classification tasks. We retain these layers and replace
only the last few layers by four new layers to automatically classify brand images (see Web
Appendix A for details).
To further increase the learning capacity of the CNN, we also fine-tune the parameters
of the last convolutional block, which consists of four convolutional layers. Thus, in addition
to the new layers and their approximately 3.2 million parameters, which we added to the
existing CNN architecture, we update also parameters of selected layers of the existing
network. Precisely, after replacing the last layers, we fine-tune 48.11% of the pretrained
parameters (i.e., approximately 7.1 million weights) and hold the remaining 51.89% constant
(i.e., approximately 7.6 million weights).
Overall, this procedure allows the CNN to better adjust to the particularities of our
classification task, while at the same time leveraging existing classification experience. For
example, the features that the CNN learned to detect cats and dogs during training on
the ImageNet dataset might also be useful to detect facial features on consumer selfies. In
addition, we artificially augment the available data. Specifically, we rotate, flip, and shift
images by random factors (see Web Appendix B). For example, most brand selfie images
(about 80%) feature the left hand holding the product (right hand holding the smartphone),
making it challenging for the algorithm to classify the remaining 20% of the images with
right hands holding a product. Mirroring the images provides more balanced training data
and better classification performance.
After calibrating the CNN on the training and validation data, we compute the accuracy
of the image classification algorithm on the 20% of images in the test data, which were not
13
used for training. For this purpose, we compute the harmonic mean (i.e., F1 score) between
the proportion of all images the network identifies correctly (recall) and the proportion
of the identified instances that are correct brand representations (precision). This results
in an F1 score of 81% overall, with the highest performance for packshots (83%) and the
lowest performance for consumer selfies (70%), suggesting that the brand image types can
be classified automatically with sufficient accuracy to warrant further analysis (see Web
Appendix C for further details).
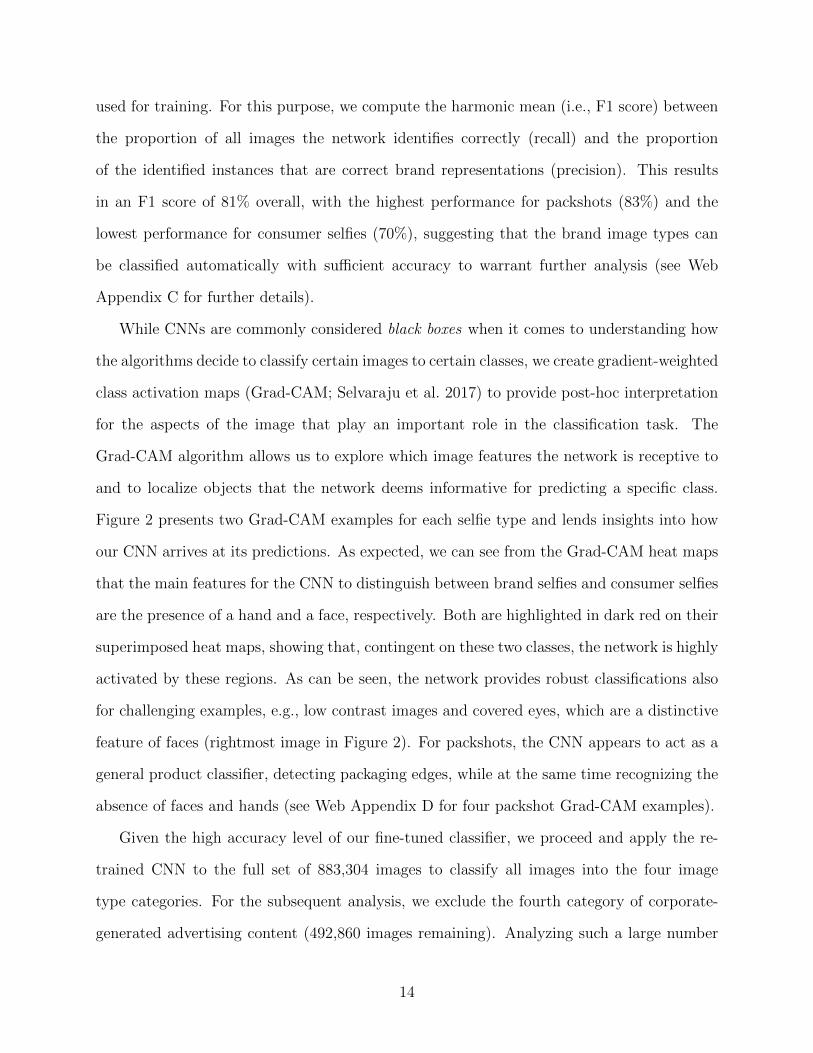
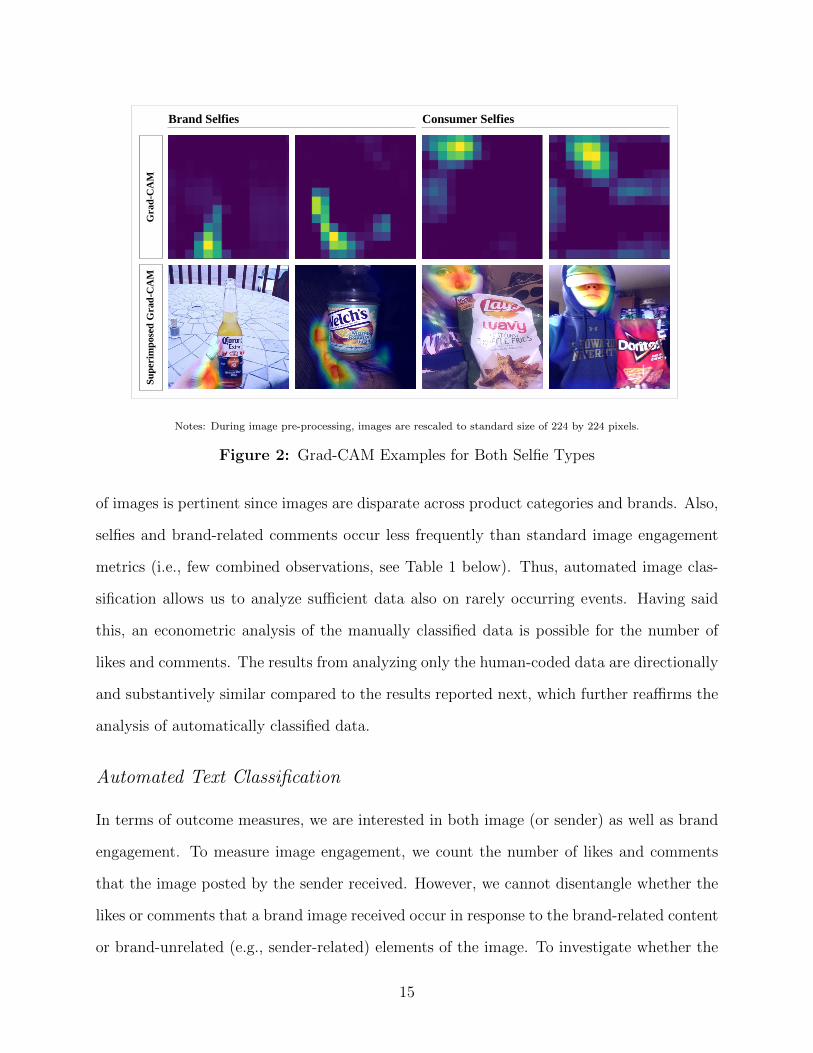
While CNNs are commonly considered black boxes when it comes to understanding how
the algorithms decide to classify certain images to certain classes, we create gradient-weighted
class activation maps (Grad-CAM; Selvaraju et al. 2017) to provide post-hoc interpretation
for the aspects of the image that play an important role in the classification task. The
Grad-CAM algorithm allows us to explore which image features the network is receptive to
and to localize objects that the network deems informative for predicting a specific class.
Figure 2 presents two Grad-CAM examples for each selfie type and lends insights into how
our CNN arrives at its predictions. As expected, we can see from the Grad-CAM heat maps
that the main features for the CNN to distinguish between brand selfies and consumer selfies
are the presence of a hand and a face, respectively. Both are highlighted in dark red on their
superimposed heat maps, showing that, contingent on these two classes, the network is highly
activated by these regions. As can be seen, the network provides robust classifications also
for challenging examples, e.g., low contrast images and covered eyes, which are a distinctive
feature of faces (rightmost image in Figure 2). For packshots, the CNN appears to act as a
general product classifier, detecting packaging edges, while at the same time recognizing the
absence of faces and hands (see Web Appendix D for four packshot Grad-CAM examples).
Given the high accuracy level of our fine-tuned classifier, we proceed and apply the re-
trained CNN to the full set of 883,304 images to classify all images into the four image
type categories. For the subsequent analysis, we exclude the fourth category of corporate-
generated advertising content (492,860 images remaining). Analyzing such a large number
14
Su
per
imp
ose
d G
rad
-CA
MG
rad
-CA
M
Brand Selfies Consumer Selfies
Notes: During image pre-processing, images are rescaled to standard size of 224 by 224 pixels.
Figure 2: Grad-CAM Examples for Both Selfie Types
of images is pertinent since images are disparate across product categories and brands. Also,
selfies and brand-related comments occur less frequently than standard image engagement
metrics (i.e., few combined observations, see Table 1 below). Thus, automated image clas-
sification allows us to analyze sufficient data also on rarely occurring events. Having said
this, an econometric analysis of the manually classified data is possible for the number of
likes and comments. The results from analyzing only the human-coded data are directionally
and substantively similar compared to the results reported next, which further reaffirms the
analysis of automatically classified data.
Automated Text Classification
In terms of outcome measures, we are interested in both image (or sender) as well as brand
engagement. To measure image engagement, we count the number of likes and comments
that the image posted by the sender received. However, we cannot disentangle whether the
likes or comments that a brand image received occur in response to the brand-related content
or brand-unrelated (e.g., sender-related) elements of the image. To investigate whether the
15

comments relate to the brand and consumers’ intentions about the brand, we employ text
mining tools.
Specifically, we text mine both the caption (text written by the sender accompanying
the image post) and the comments (public responses by receivers of the post). In terms of
captions, we use LIWC (Pennebaker et al. 2015) to obtain the share of first-person (senders
referencing themselves) and second-person (senders referencing receivers) words, the share
of words indicating a question, and the share of netspeak (e.g., thx, lol) out of all words
to control for differences in accompanying caption text between the image types. Explicit
mentions of the brand in the image caption and brand tags can also drive brand-related
response. We therefore also control for the number of brand tags (both hashtags and han-
dletags) as well as occurrences of the full brand name in the caption based on a custom
brand dictionary for the 185 brands in our analysis.5 Additionally, we code the sentiment of
the caption by calculating the positive and negative word share in the caption using VADER
sentiment dictionary (Hutto and Gilbert 2014).6
To analyze the impact of user-generated images on brand engagement, we investigate the
comments receivers of the image made. Specifically, we look at consumers mentioning the
brand visible in the image with references to themselves (e.g., “I also love Pepsi”), as well as
receivers mentioning purchase intentions of the product (e.g., “omg, now I also want one!!”).
To capture self-brand mentions, we count co-occurrence of a first-person receiver statement
based on the LIWC dictionary and a brand mention similar to the approach used for the
captions.7 Capturing purchase intent is more difficult as it involves a sequence of words
with a specific semantic relationship. Accordingly, we train a machine learning algorithm
5A set of ten brands (e.g., Crush, Extra, Surge) also occur as part of natural language. Eliminating thesebrands results in stable findings. We therefore kept all data on all brands for subsequent analyses.
6We use VADER because it provided better results on sentiment analysis than other sentiment dictionariessuch as LIWC (Hartmann et al. 2018). Additionally, a model controlling for sentiment based on LIWCresulted in similar conclusions.
7A model based on all brand mentions (without requiring co-occurrence with self-related speech) resultsin directionally and substantively similar findings. Since such brand mention extraction is less clearly relatedto brand engagement of the receiver, the following is based on self-related brand speech.
16
to capture these expressions. Creating training data for purchase intent using a random
sample of comments can be inefficient due to the low frequency of purchase intent statements
across all comments. To address this issue, we use selective sampling (Donkers, Franses and
Verhoef 2003) by employing a two-step sampling approach. First, to increase the likelihood of
purchase intent expressions, a research assistant labeled a random sample of 1,000 comments
that mention a brand on whether the comment included a purchase intent. Second, we train
a random forest (RF) based on these annotated data to learn what words are most predictive
of expressed purchase intentions (i.e., “want”, “buy”, and “bring”) to identify another set
of 1,000 comments with an above-average probability of purchase intent statements. We
collected three independent judgments for each of the additional 1,000 comments through
MTurk with the majority vote as the final annotation (inter-coder agreement: 80.6%). This
procedure resulted in an oversampled number of purchase intentions of 553 (27.65% of all
instances used for training).
We then use ten-fold cross-validation with 80% training and 20% hold-out data to train an
RF model for this binary classification task (Hartmann et al. 2018). We obtain a hold-out
classification accuracy of 81.95% (average cross-validation accuracy of 81.07%, suggesting
overfitting is not an issue).8
To summarize, we obtained the number of likes and comments the image received to
capture image engagement directly from the data. To capture brand engagement, we use
a dictionary-based text mining approach to capture self-mentions of the brand, and an RF
machine learning approach to capture expressed purchase intents. We also control for the
textual information in the image caption.
8We compare the performance of the RF classifier to that of a support vector machine (SVM), commonlyused in marketing (e.g., Ordenes et al. 2019). The SVM resulted in a lower accuracy level (80.95%) relativeto the RF model.
17
Descriptive Characteristics of Brand Selfies, Consumer Selfies, and Packshots
Before analyzing the level of engagement that different types of brand images generate, it is
useful to examine some model-free evidence on differences between the three types of images.
As can be seen in Table 1, we find that most brand images are packshots (72.44%), followed
by brand selfies (22.42%), and consumer selfies (5.14%). Interestingly, consumer selfies, in
which consumers take a selfie with the brand, are not common among social media images,
suggesting that users are not self-motivated to take and post pictures of themselves with
branded products. This is also in contrast to the prevalence of faces in 50% of all images in
traditional advertising (Xiao and Ding 2014), and inconsistent with many brand campaigns
on social media, which encourage consumers to take consumer selfie images with brands (see
Appendix A).
— Insert Table 1 about here —
In terms of image and brand engagement, consumer selfies generate most likes (7.45 on
average vs. 5.09 and 4.34 for brand selfies and packshots, p < .01) and most comments (.52
vs. .44 on average for both brand selfies and packshots, respectively p < .05). Conversely,
relative to consumer selfies, brand selfies result in higher levels of self-brand mentions (.03
vs. .02, p < .01) and expressed purchase intents (.08 vs. .05, p < .01). We do note that these
differences between the engagement that different brand images generate may be the result
of other factors, such as image prominence or the text in the caption that accompanies the
image, which we control for in the subsequent analysis.
As expected, brand selfies on average feature the largest brand logo, which is almost twice
the size compared to consumer selfies (logo share of 3.11% vs. 1.60%, p < .01). In addition,
brand selfies seem to induce natural gravitation of the brand logo towards the image center,
reflected in the lowest distance of the logo midpoint from the image center at 178.05 pixels.
In contrast, brand logos on consumer selfies are on average 270.33 pixels away from the
image center. Packshots are at an intermediate position in terms of both logo share and
18
distance. In terms of objective image quality measures such as visual complexity (JPEG file
size divided by the image area; Pieters, Wedel and Batra 2010), image brightness (average
pixel illumination; Matz et al. 2019), and contrast of image brightness (SD of illumination
across all image pixels; Zhang et al. 2018), we see comparable values across image types,
suggesting image type reflects image content rather than photographic technicalities.
Table 1 also reveals that brand selfies tend to come with shorter captions as well as fewer
hashtags and handletags than both other types of brand images. Interestingly, brand selfies
have the highest share of first-person pronouns of caption words, suggesting senders who
post images without showing their face talk more about themselves (5.41% vs. 4.58% and
4.35% for consumer selfies and packshots, respectively). At the same time, brand selfies refer
equally often to the receiver, as we see a similar share of second-person captions across all
three brand image types. In line with the spontaneous snapshot characteristics and social
media connotation of selfie-type images, both brand and consumer selfies feature a higher
share of netspeak than packshots (2.29% and 2.22%, respectively vs. 1.93%). In terms of text
valence, we find that fewer positive and more negative words accompany brand selfies. This
would suggest a less favorable brand response to brand selfies relative to consumer selfies
based on the text alone. Interestingly, despite and possibly because of the visual prominence
of the brand in brand selfies relative to consumer selfies, we see that only 6.27% of brand
selfies are accompanied with a brand caption, relative to 7.09% of the consumer selfies.
To investigate whether brand images with brand tags differ from those without, we also
look exclusively at brand images that are accompanied by brand hashtags or handletags (see
’Brand Tags’ columns in Table 1). We find some notable differences. Specifically, posts with
brand tags are more likely to feature brand selfies (24.33% vs. 22.42%), and are less likely
to contain packshots (70.98% vs. 72.44%; χ2(2) = 133.86 , p < .01). As expected, brand
images accompanied by a brand tag feature significantly larger brand logos across all three
image types and are more central on the image. Also, the caption text differs and contains
less brand mentions and first-person text content when brand tags are present. These obser-
19
vations suggest that senders who employ brand tags intend to send messages systematically
different from the majority of brand images that do not contain hashtags, which highlight
the risk of relying on hashtags in analyzing social media brand images.
Impact of Brand Image Type on Image and Brand Engagement
To analyze the impact of brand image type on engagement, we explore four behaviors. To
capture image (or sender) engagement, we examine the number of likes and comments the
brand image received. To capture brand engagement, we examine whether the comments to
the image include self-related mentions of the brand and expressions of purchase intent. As all
these behaviors are collected as count data and their distributions indicate overdispersion, we
estimate negative binomial regressions (e.g., Akpinar and Berger 2017; Ordenes et al. 2019).
The four receiver reactions serve as dependent variables and the brand image type as an
independent variable, while controlling for the aforementioned text and image characteristics,
sender characteristics (post age, number of posts, followers, and friends of the sender), and
brand-level fixed effects to take brand-level heterogeneity into account (e.g., brand equity,
differences in logos, or overall product desirability).9
The analysis of the number of self-brand mentions and expressed purchase intentions is
by definition limited to those brand images that receive at least one comment (16.49% of
all posts). Within this group, the probability of self-brand mentions and purchase intent
expressions increases with the number of comments. To interpret the impact of brand image
type over and above the impact on the absolute number of comments, we control for the
number of comments in these two models. We inspect variance inflation values to investigate
whether this high level of control results in multicollinearity and find that all values for all
models are well below 3. Table 2 summarizes the results of the regressions.
9We also estimated Poisson regressions which resulted in qualitatively similar results, but had lower modelfit. Because these controls may not capture all differences in post texts potentially associated with the threeimage types, we run another text classification model based on RF and predict each image class based onthe caption text (predictive accuracy of 73.43%). Controlling for these predicted values leads to consistentresults.
20
— Insert Table 2 about here —
The impact of control variables with clear theoretical expectations are all in the expected
direction. Specifically, having more followers results in more likes and comments (.72 and
.52, both p < .01). If the sender posts more content, individual posts compete for attention
and receive fewer likes and comments (-.24 and -.02, both p < .01). Larger logo share re-
ceives more self-brand mentions (2.51, p < .05). More central logo positions (i.e., with lower
logo distance from image midpoint) also benefit self-brand mentions (-.16, p < .01) and pur-
chase intentions (-.05, p < .10). Interestingly, these effects reverse for likes and comments,
suggesting that viewers are less interested in brands and brand logos compete for attention
with other aspects of the image such as consumer faces. Thus, the objective of the sender to
garner popularity and virality may be misaligned with the objective of the brand to achieve
brand-specific engagement.
In line with these image content observations, brand tags are undesirable in terms of likes
and comments, but, as expected, result in more self-brand mentions. Conversely, questions
result in more likes and comments while at the same time being associated with fewer self-
brand mentions. Also, prior research reports neither too high nor too low levels of visual
complexity are desirable (e.g., Pieters, Wedel and Batra 2010), which is what we find as
evidenced by a positive linear (.17 and .25, both p < .01) and a negative quadratic impact
(-.02, and -.03, both p < .01) for likes and comments, respectively. Longer captions result
in fewer likes (-.08, p < .01), but appear to contain more topics for discussion and result in
more comments (.07, p < .01). Interestingly, negative sentiment generates more likes and
comments than positive sentiment.
More important to this investigation is the effect of the three image types on the four
behaviors. Consistent with social media research (Bakhshi, Shamma and Gilbert 2014), the
appearance of faces drives image engagement. Specifically, we observe the highest number
of likes for consumer selfies compared to brand selfies (-.37, p < .01) and packshots (-.54,
p < .01), with brand selfies generating more likes than packshots (p < .01). While a like
21
requires no more than the click of a mouse and needs little consideration, comments re-
quire more processing of the posted information content and require higher effort in terms
of phrasing and typing. Faces attract immediate attention (Tomalski, Csibra and Johnson
2009), but may not necessarily result in more thorough information processing. For com-
ments, we indeed observe that consumer selfies and brand selfies generate similar levels of
comments (-.003, p > .10). Similarly, the difference between consumer selfies and packshots
is also smaller for comments than for likes (-.12 vs. -.54, both p < .01).
From a brand perspective, the fact that consumer selfies achieve more likes does not
necessarily translate into higher levels of brand engagement. Interestingly, brand selfies
attract a significantly higher number of self-brand mentions relative to consumer selfies (.64,
p < .01). This effect of brand selfies is also higher than that of packshots (.64 vs. .42,
p < .05), which also outperform consumer selfies (p < .05), suggesting that faces can divert
attention away from the brand. Brand selfies and packshots also receive more purchase
intents (.44 for brand selfies and .41 for packshots, both p < .01) relative to consumer selfies.
The difference between packshots and brand selfies is not statistically different (p > .10).
Taken together, these results suggest that consumer selfies and consumer faces can be a
double-edged sword for marketers. While consumer selfies can represent a stronger level of
endorsement, they also risk diverting attention away from the brand (see Knoll and Matthes
(2017) for similar findings in advertising). Our results also suggest reconsidering the mar-
keting value of likes of consumer-generated brand images. Both brand selfies and packshots
receive fewer likes, but more self-brand mentions and purchase intents, implying that likes
often refer to brand-unrelated content (e.g., the sender) as opposed to how the brand is per-
ceived on the images. When comparing both forms of selfies in terms of commenting, brand
selfies dominate consumer selfies as they produce a highly similar number of comments,
but brand selfies provide more brand-related comments and higher purchase intent expres-
sions. Next, we test whether these findings replicate in a campaign setting where a brand
(Starbucks) encourages consumers to join a brand image contest on social media (Instagram).
22
COMPANY-INITIATED BRAND IMAGE CONTEST
The objective of the second empirical application is to replicate and extend the results of
the first empirical application to a different platform (Instagram, as opposed to Twitter in
the first application). Moreover, we now explore a context in which the firm is encouraging
consumers to share photos as part of a marketing campaign. Hence, all images are expected
to have a branded product in them. Also, by analyzing a specific brand campaign, we can
hold the brand constant across images, providing a more controlled setting for the analysis
of brand images and social media engagement.
In November 2015, Starbucks launched a brand image contest on Instagram. With 17.3
million followers, Starbucks is the brand with the largest followership in the food and bev-
erages category on Instagram (Paul 2018). Starbucks encouraged its followers to create and
share Starbucks images and tag them with a dedicated campaign hashtag, which has become
a common marketing strategy. All participants had the chance to win a Starbucks gift card,
incentivizing them to share appealing image content with a spotlight on the Starbucks brand.
With more than 1 billion monthly active users, Instagram is considered the most popular
image-sharing platform (Statista 2019). In contrast to Twitter as a micro-blogging platform,
Instagram provides significantly higher entertainment and less information value, providing
a native visual environment for the creation and curation of creative content (Voorveld et al.
2018). For the Starbucks campaign, user comments such as “this literally looks like a screen-
shot of a Starbucks commercial” or “I thought this was one of those advertisements until
looked at the screen name” indicate that the level of image quality produced by consumers
is likely to be higher than the average social media image.
Data
We identified 6,926 public Instagram posts that appeared as part of Starbucks’ contest, fea-
tured the campaign hashtag, included the Starbucks logo, and appeared after the campaign
23
launch. Hashtag identification is meaningful in this context because only those tagged im-
ages could participate in the contest. Given the relatively smaller size of available campaign
images for Instagram (compared to almost 900,000 Twitter images) and the efficiency of
image coding, we manually coded all available Starbucks images (approximately 2 hours of
a human coder).
Additionally, we compare the manual classification of images to those based on an au-
tomated CNN classification. We compare three classification approaches. The first simply
takes the model trained on the Twitter data and applies the classification to the Starbucks
data. This is a difficult task because the Twitter dataset is in many ways quite differ-
ent from the Starbucks dataset (more than twice as many labeled images, multiple brands,
and product categories, and many advertising images, which do not exist in the Starbucks
data). Even this simple approach, which fully transfers the training from the Twitter data to
the Starbucks application with no additional training leads to reasonable accuracy levels of
F1 = 73%. A second approach is to mimic the approach we used in the Twitter application
and to retrain a CNN trained on ImageNet specifically for the Starbucks application using
80% of the data for calibrating the model (training and validation sets) and retain 20% as a
hold-out test set. As expected, we find that training the CNN using data from the specific
application leads to a substantial increase in accuracy (F1 = 84%; see Web Appendix E).
A limitation of the second approach is that it does not transfer the learning from the
Twitter application to the Starbucks application. Accordingly, in the third approach, we
leverage the CNN that we trained to classify Twitter images in the previous analysis (see
Web Appendixes A and B), and retrain only the last couple of layers in the CNN to the new
application. This approach is similar in spirit to the Twitter application, in which we took a
CNN trained on millions of ImageNet images and retrained it to the Twitter application by
fine-tuning only a subset of the layers and parameters. As this approach leverages both the
ImageNet data and the Twitter data it is expected to lead to higher accuracy levels. Indeed,
we find that this approach yields the highest average F1 score for the test data of 88%.
24
These findings suggest it is useful to transfer the knowledge of classifying brand image types
across domains and improve classification accuracy by using transfer learning. Specifically,
in our application previous training of a related task in another environment (different social
network, brands, and product categories) benefits classification of a more narrow problem
on a smaller dataset.
The high levels of classification accuracy are encouraging. As in the Twitter analysis,
results of the analyses comparing the three image types are directionally consistent between
manual and the different automated classification. For the following analysis, we make use
of the best level of data quality available to us and study the human image classification.
For the Twitter analysis we studied many more images (N = 492,860). This allowed us
to run meaningful analysis on rarely occurring events such as purchase intent statements.
The lower number of campaign observations does not permit such analysis for the Starbucks
campaign. However, we can replicate the analysis on likes and comments to study differences
between solicited and unsolicited brand images.
Web Appendix F contains exemplary Instagram images for all three brand image types.
Most user-generated campaign images are packshots, contributing a share of 56.27%. 31.11%
are brand selfies, and 12.62% are consumer selfies. Compared to the organic Twitter content,
this distribution is shifted from packshots to consumer selfies, suggesting either the campaign
context or the Instagram platform prompted more users to reveal their face. At the same
time, consumer selfies continue to be the least commonly used category, supporting our
previous observation that consumers themselves do not appear inclined to take the types of
consumer selfie images that marketing campaigns encourage them to do (see Appendix A).
Similar to the Twitter analysis, we collect information on the number of likes, comments,
and self-related brand mentions. However, on Instagram, and particularly in the image
contest under investigation, conversations are few and brief. As a consequence, we are not
able to replicate the purchase intent analysis due to a limited set of observations. Instead,
we observe many more compliments towards the posted images (27.26% of all comments,
25
e.g., “I like your pictures, keep it up” or “Aww love this shot!! Amazing!!”), which is much
more common than in the organic Twitter data. We follow the same machine learning
approach used to classify expressed purchase intents in the Twitter analysis to classifying
response comments in terms of compliments (inter-coder agreement of two judges: 91.94%,
disagreements were resolved through discussion). The RF trained for compliments achieves
a predictive accuracy on a hold-out test set of 81.07%.10
We control for the same set of variables as in the Twitter application excluding the brand
hashtag as we exclusively focus on posts with Starbucks-related hashtags. As in the previ-
ous analysis, we also include the number of comments in the compliments and self-brand
mentions regressions because the probability of each increases with the number of comments.
Results
Similar to the previous analysis, we run negative binomial models for all four dependent
variables to take overdispersion in the count variables into account. In terms of control
variables, the results replicate those of the Twitter analysis (see Table 2). Specifically, visual
complexity has an inverted U-shaped impact on image engagement. The posts compete for
attention with more posts, resulting in fewer likes and comments, while conversely a larger
followership results in more likes and comments. Also, branded captions are detrimental to
achieving likes, but have a positive impact on self-brand mentions. Similarly, larger logo size
leads to fewer likes, comments, and compliments, suggesting that also in the campaign con-
text users react adversely to images dominated by brand logos. However, there are also some
noteworthy differences between the two empirical applications. For example, more central
logo positions have a positive effect on likes and comments (-.24 and -.16, both p < .01),
presumably because the contest objective was to produce Starbucks-related images making
a reasonable compromise between logo centrality and the desirable size. Variance inflation
10As a robustness check, we again train five SVM varying the cost parameter c, all producing inferior results(highest of 79.13% accuracy) compared to the RF. Thus, we use the RF predictions for our econometricmodel.
26
values are again all well below 3.
— Insert Table 3 about here —
Turning to brand image type, the Starbucks data from Instagram results in more consis-
tent evidence in favor of brand selfies. In particular, brand selfies generate significantly more
likes (.23, p < .01), comments (.13, p < .05), and compliments (.13, p < .10) than consumer
selfies. This consistent evidence suggests that the brand image type plays a different role in
a social media image-centric campaign. Specifically, faces appear less needed to catch atten-
tion, as the images themselves are of higher quality and more inspirational. Brand selfies also
result in significantly more self-brand mentions than packshots (.44, p < .05), more compli-
ments (.15, p < .01), more comments (.14, p < .01), and more likes (.19, p < .01) while the
coefficients for consumer selfies and packshots do not differ significantly for any of the four
dependent variables (p > .10). However, unlike the Twitter results, we find only directional
but no statistically significant evidence in favor of brand selfies relative to consumer selfies in
terms of self-brand mentions (.06, p > .10), presumably due to lack of statistical power (only
471 consumer selfie posts with comments). In terms of image contest success, three of the
five winning and most engaging customer-submitted Starbucks images of the 2015 campaign
were in fact brand selfies (Starbucks 2015). While this is merely anecdotal evidence, it is in
line with our findings.
Overall, we find that brand selfies are superior to packshots as well as to consumer selfies
when we take into account the full range of objectives. Interestingly, across all objectives,
and consistent with the Twitter analysis, the type of image, which is posted most frequently
(i.e., packshots), is inferior. Also, the image type promoted by social media campaigns and
common advertising practice (consumer selfies with consumer faces) do not produce consis-
tently better results. In the context of a company-initiated campaign, we find that brand
selfies can produce an alignment between user and firm objectives to generate higher levels
of engagement. Consequently, firms could benefit in terms of brand engagement by encour-
aging users to post brand selfies. The superiority of brand selfies raises the question which
27
underlying psychological mechanism drives the superiority of this image type. It is possible
that brand selfies reflect the sender perspective that may in turn generate stronger feelings of
ownership and mental simulation (Weiss and Johar 2018). Accordingly, in the next section,
we conducted a lab experiment that allows us to investigate such psychological mechanisms.
EXPERIMENTAL EVIDENCE ON CONSUMER RESPONSE
TO USER-GENERATED BRAND IMAGES
While the field data and analysis so far is useful because of its external validity presenting a
large number of brand images in two actual social media platforms, as with any secondary
data, it comes with some limitations. First, Table 1 demonstrates that the three brand
image types differ significantly in terms of size and centrality of logos. While we statistically
control for these in all analyses, it is not clear whether the statistical control is sufficient,
e.g., due to measurement error or functional form assumptions, and whether the subjective
or perceived prominence brand logo is controlled for. Second, in our previous analysis,
we have taken sender-level heterogeneity into account by controlling for the size of their
followership and their past activity, i.e., number of posts. However, senders may vary with
respect to other relevant dimensions. For instance, ego-networks of senders might differ
in terms of connectedness and virality potential, such that likes of certain followers may
produce likes of additional followers. Third, in the previous analysis, we statistically control
for the captions that accompany the text, however, because textual information is often
rich, it is difficult to control for all aspects of the text. Fourth, our measures of purchase
intent and brand engagement rest on indirect incidental commenting behavior, which may
only imperfectly reflect true brand attitude or purchase intentions. As we could not ask
social media users about their preferences and underlying deliberations, we are unable to
investigate these measures directly nor the theoretical mechanisms that may lead to varying
engagement levels.
To address these limitations, we complement the secondary data analysis with an exper-
28
imental design with the objective of replicating the brand engagement effects of the prior
field studies in a controlled experimental setting, holding constant the sender information,
and removing any effect of the caption text that accompanies the image. We also use con-
ventional Likert-scale questions to directly elicit brand attitudes and purchase intentions,
testing whether our comment-based inferences on brand engagement are consistent with es-
tablished measures. Finally, we use the experimental design to explore potential theoretical
mechanisms underlying the observed effects.
Method
Experimental design. We recruited N = 412 MTurkers who were randomly assigned to
1 out of 90 images from our three experimental conditions (brand selfie, consumer selfie,
packshot). We selected actual social media images from the Starbucks campaign discussed
in the previous section to make the simulated social media setting as authentic as possible.
The selection of the 90 images followed the following criteria: Each image featured exactly
one Starbucks logo, exhibited a similar logo share (on average 5.54% for brand selfies, 5.55%
for packshots, and 5.54% for consumer selfies, p > .10 across the three conditions), and
featured no objects likely to divert receivers’ attention, e.g., animals or babies, to make
subjective logo prominence as comparable as possible.
To further investigate the subjective prominence of the logo, we asked experimental
subjects to rate how prominent they perceived each logo on a 7-point scale. Comparing
these values across conditions does not result in significant differences (MBrand Selfie = 5.72,
MConsumer Selfie = 5.45, MPackshot = 5.67, p > .10). To explore this further, we applied an
image visual attention software (VAS) by 3M — a machine-learning based eye-tracking
application (see Mormann, Towal and Koch (2016) measuring visual saliency with a similar
neuroscience-based algorithm). For all 90 images across the three conditions, we collect the
rank of the brand logo in eye fixations as well as the probability that individuals focus on
the region of the brand logo in their first fixation. Web Appendix F displays representative
29
images per condition as well as their respective areas of visual attention. For both measures,
we find no differences across the three brand image types selected for the experiment (F(2,87)
= .14, p = .87 for the rank; F(2,87) = 1.46, p = .23 for the probability measure). Although
faces received attention as well, this suggests the particular images we have selected are
comparable in terms of the actual size of the logo and their visual attention allowing us to
test whether effects above and beyond simple attention and logo prominence exist.
Procedure. Respondents first indicated their level of social media usage for Twitter, Insta-
gram, and Facebook, as well as pre-attitudes for a list of several brands including Starbucks.
To mimic actual behavior on social media, we created an Instagram online environment and
asked subjects to decide whether to comment and to like two hypothetical posts. These
did not feature any brands and were unrelated to our investigation. As a third task, sub-
jects were randomly assigned to one of the 90 Starbucks images followed by questions on
purchase likelihood and attitude towards Starbucks, both on 7-point Likert-scales. Sub-
jects then listed all associations that came to their mind based on the image they saw in
an open-ended format before responding to multi-item scales taken from prior research on
psychological ownership, self-reference, endorsement, and mental simulation (see Web Ap-
pendix G for an overview). Finally, the respondents answered several questions on brand
familiarity, the perceived prominence of the brand logo, the perceived sender attractiveness,
and demographics including the dominant hand of the respondent.
Results
Influence of image type on purchase likelihood. In line with our previous findings, purchase
likelihood is significantly lower for consumer selfies compared to brand selfies (MBrand Selfie =
4.48, MConsumer Selfie = 3.73, p < .05; see Figure 3). This main effect is also robust when
controlling for the perceived attractiveness of the sender, brand familiarity, pre-attitudes to-
wards Starbucks, and perceived logo prominence, as well as the respondents’ dominant hand,
and their social media usage in a regression analysis (βBrand Selfie = .41, p < .05; see Table
30
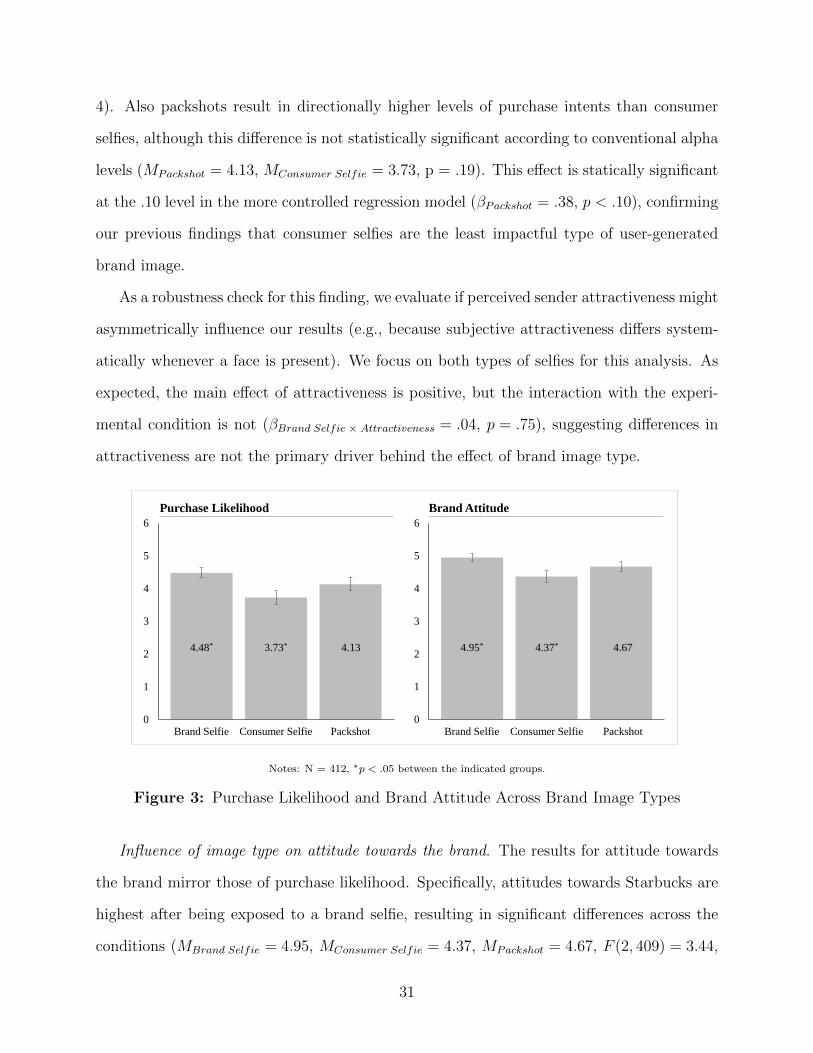
4). Also packshots result in directionally higher levels of purchase intents than consumer
selfies, although this difference is not statistically significant according to conventional alpha
levels (MPackshot = 4.13, MConsumer Selfie = 3.73, p = .19). This effect is statically significant
at the .10 level in the more controlled regression model (βPackshot = .38, p < .10), confirming
our previous findings that consumer selfies are the least impactful type of user-generated
brand image.
As a robustness check for this finding, we evaluate if perceived sender attractiveness might
asymmetrically influence our results (e.g., because subjective attractiveness differs system-
atically whenever a face is present). We focus on both types of selfies for this analysis. As
expected, the main effect of attractiveness is positive, but the interaction with the experi-
mental condition is not (βBrand Selfie × Attractiveness = .04, p = .75), suggesting differences in
attractiveness are not the primary driver behind the effect of brand image type.
Brand Selfie Consumer Selfie Packshot
Purchase Likelihood
0
1
2
3
4
5
6
Brand Attitude
0
1
2
3
4
5
6
Brand Selfie Consumer Selfie Packshot
4.134.48* 3.73* 4.674.37*4.95*
Notes: N = 412, ∗p < .05 between the indicated groups.
Figure 3: Purchase Likelihood and Brand Attitude Across Brand Image Types
Influence of image type on attitude towards the brand. The results for attitude towards
the brand mirror those of purchase likelihood. Specifically, attitudes towards Starbucks are
highest after being exposed to a brand selfie, resulting in significant differences across the
conditions (MBrand Selfie = 4.95, MConsumer Selfie = 4.37, MPackshot = 4.67, F (2, 409) = 3.44,
31
p < .05; see Figure 3). Brand attitude in the brand selfie condition is significantly higher
than that of the consumer selfie condition (p < .05). However, while the brand attitude in
the brand selfie condition is directionally higher than that of the packshot, the difference is
not statistically significant (p = .18). The regression analysis controlling for all confounds
mentioned above further reveals that the consumer selfie performs significantly worse than
both the brand selfie and the packshot condition (βBrand Selfie = .27, p < .05; βPackshot = .30,
p < .05; see Table 4).
Impact of brand familiarity. Theoretically, higher levels of brand familiarity and memory
accessibility should increase the probability of self-reference thoughts and mental simulation
concerning the brand. This suggests a potential interaction between brand familiarity and
image type. When adding such interaction effects to the purchase likelihood regression, we
indeed find positive interactions with both the brand selfie (βBrand Selfie × BF = .38, p < .05)
and the packshot (βPackshot × BF = .36 p < .05) compared to the consumer selfie as the
reference category. For brand attitude, we find a positive interaction with the brand selfie
(βBrand Selfie × BF = .29, p < .01) but not with the packshot (βPackshot × BF = .12, p = .24).
Taken together, this suggests the negative impact of faces on brand engagement is amplified
when brand memory is more accessible, presumably because brand familiarity makes self-
reference thoughts and mental simulations more likely.
Mediation. To explore the potential psychological drivers behind the relative performance
of the different brand image types more directly, we run a simultaneous mediation analysis
for the four potential mediators psychological ownership, self-reference, mental simulation,
and brand endorsement. As all multi-item scales produce acceptable levels of Cronbach’s
alpha larger than .78, we averaged the items in each scale (see Web Appendix G). We
performed mediation analyses on both brand image dummy variables with consumer selfies
as the reference category employing 1,000 bootstrapping iterations to obtain standard errors
for the conditional indirect effects (Preacher and Hayes 2008).
For purchase likelihood, we find that the impact of brand image type on purchase likeli-
32
hood is fully mediated by both mental simulation and self-reference and the indirect effects
are significant (p < .05), whereas psychological ownership and brand endorsement do not
have significant effects on purchase intent. Compared to brand selfies and packshots, con-
sumer selfies appear less effective in helping consumers picture drinking a Starbucks coffee
and fostering self-brand connections. For brand attitudes, we find that the effects of brand
image type are fully mediated by self-reference (p < .05 for indirect effect), with no effect of
mental simulation, psychological ownership, or brand endorsement. Our results suggest the
behavioral intent measures are more directly related to actions on brand images and mental
simulation of coffee consumption.
To further explore the mental simulation and self-reference account, we manually coded
relevant keywords and the sentiment (as positive, negative, or neutral) of the associations
that the respondents provided after seeing the respective brand image. Both the number of
associations (MBrand Selfie = 8.81, MConsumer Selfie = 8.92, MPackshot = 9.42, F (2, 409) = .17,
p = .85), and the sentiment (χ2(2) = 4.97 , p = .29) do not differ across the three brand
image conditions. However, respondents in the brand selfie condition revealed significantly
more associations referring to the warm sensation of holding a Starbucks coffee (e.g., “This
picture describes coffee perfectly on a cold winter day where the warm coffee will keep you
going and keep you warm”) than for consumer selfies, which appear to inhibit mentally sim-
ulating consumption (χ2(2) = 8.37, p < .01).
Discussion
The results of the controlled lab experiment corroborate the empirical findings of the field
data. Specifically, brand selfies clearly outperform consumer selfies. This effect holds when
using an experimental design, holding constant the image composition and subjective logo
prominence, as well as sender characteristics and captions. Due to the sender’s physical
touch of the branded product, brand selfies might be most attractive to receivers as they
help receivers relate the depicted products to themselves and induce favorable consumer
33
responses, while at the same time avoiding overshadowing the brand with a competing face
of another consumer.
The types of associations, the interaction with brand familiarity as well as the mediation
analysis suggest self-reference and mental simulation play a role as underlying psychological
processes. These results suggest that the previous field results are theoretically consistent
and unlikely a function of the peculiarities of the respective dataset.
CONCLUSION
Brand images are ubiquitous on social media. This paper investigates and structures this
medium of user-generated social media communication. Employing a combination of deep
learning algorithms for visual UGC and natural language processing for textual UGC, we
identified three types of user-generated brand images and study their social media impact.
We demonstrate that this distinction between different brand image types in UGC is both
theoretically meaningful and practically relevant. Specifically, we find that an emerging
phenomenon called brand selfie, in which consumers take a selfie image of the brand itself
as opposed to themselves, leads to the highest brand engagement. Additionally, we find
that consumers seldom take an image of the brand together with themselves, despite brands’
attempts to encourage consumers to do so. Furthermore, such consumer selfies are not
necessarily beneficial to brands either, as they are likely to generate lower brand engagement.
Specifically, we find that in organic social media brand images − in line with previous
research about the value of faces in social media and advertising − consumer selfies lead
to more likes from other people than other brand image types. Likes can be of interest to
brands in terms of lower-funnel engagement metrics such as reach to a receiver potential.
However, this engagement is not unlikely to translate into brand engagement. Using natural
language processing of user responses make a meaningful analysis of metrics such as self-
related brand mentions and expressed purchase intent possible. We find that, possibly due
to attention given to the sender in consumer selfies, these images lead to lower self-brand
34
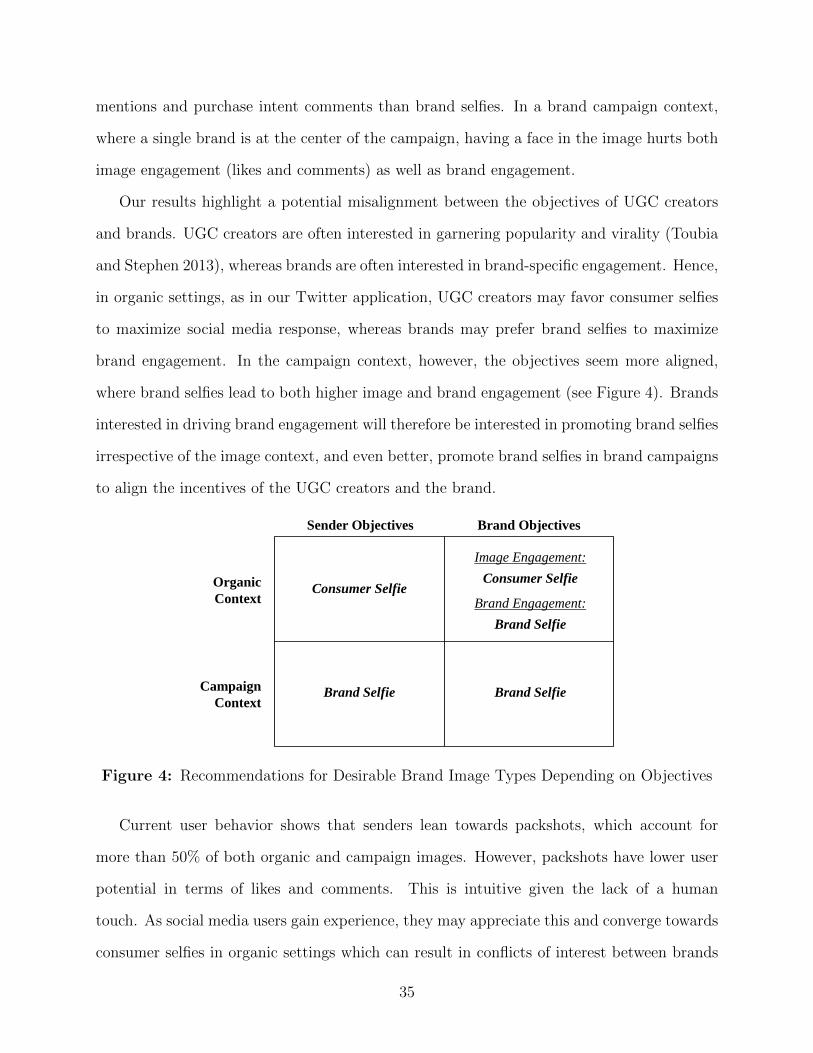
mentions and purchase intent comments than brand selfies. In a brand campaign context,
where a single brand is at the center of the campaign, having a face in the image hurts both
image engagement (likes and comments) as well as brand engagement.
Our results highlight a potential misalignment between the objectives of UGC creators
and brands. UGC creators are often interested in garnering popularity and virality (Toubia
and Stephen 2013), whereas brands are often interested in brand-specific engagement. Hence,
in organic settings, as in our Twitter application, UGC creators may favor consumer selfies
to maximize social media response, whereas brands may prefer brand selfies to maximize
brand engagement. In the campaign context, however, the objectives seem more aligned,
where brand selfies lead to both higher image and brand engagement (see Figure 4). Brands
interested in driving brand engagement will therefore be interested in promoting brand selfies
irrespective of the image context, and even better, promote brand selfies in brand campaigns
to align the incentives of the UGC creators and the brand.
Sender Objectives Brand Objectives
Organic
Context
Campaign
Context
Consumer Selfie
Brand Selfie
Consumer Selfie
Brand Selfie
Image Engagement:
Brand Selfie
Brand Engagement:
Figure 4: Recommendations for Desirable Brand Image Types Depending on Objectives
Current user behavior shows that senders lean towards packshots, which account for
more than 50% of both organic and campaign images. However, packshots have lower user
potential in terms of likes and comments. This is intuitive given the lack of a human
touch. As social media users gain experience, they may appreciate this and converge towards
consumer selfies in organic settings which can result in conflicts of interest between brands
35

and senders.
Our results suggest that brand selfies are a new and relevant image archetype that may
have received less attention than they deserve by marketing research and practice so far. In
particular, brands such as Coca-Cola or Dunkin’ Donuts, which promoted consumer selfies
with social media contests, may not have exploited their campaigns’ full potential. Con-
sidering the risk that faces can divert attention away from the brand and inhibit favorable
brand-related deliberations, we caution the (sole) use of consumer selfies in large-scale com-
munication campaigns but instead suggest considering brand selfie campaigns.
Brands can benefit from brand selfie images in two ways: First, fostering brand selfies can
serve as a subtle and organic communication vehicle to induce consumers to place the brand
more centrally and prominently in an image (see Table 1). In addition, the mere visible
touching of branded products appears to foster self-brand connections of the viewer and
helps to stimulate mental simulations of product interactions. Note, our empirical analysis
controlled for differences in image composition and found effects of brand selfies over and
above differences in size and logo position, i.e., the impact of subjective perspective and logo
prominence are additive rather than substitutive. This suggests that selecting brand selfies
for display on corporate social media channels can be a powerful vehicle to increase brand
engagement. In addition, brand selfies tend to feature the arm or at least the hand of the
photographer on the photo, naturally guiding receiver eyes towards the product (Zhang et al.
2018).
We applied a multi-method approach of combining deep learning-based image classifi-
cation with natural language processing and behavioral experiments. The combination of
machine learning approaches can benefit tracking and evaluating a brand’s social media
presence. Simply counting visibility of brand logos on images or the number of likes and
comments these images receive can be misleading. Our data suggest that both image and
brand engagement must be assessed to obtain a comprehensive understanding of a brand’s
standing in social media. Our research highlights that identifying relevant images based on
36
textual information (e.g., hashtags) can result in a biased view of multimedia content. Ac-
cordingly, we provide a scalable machine learning approach to classify images into different
types, which are meaningfully different from both a theoretical and a practical perspective.
We intend to make our classification algorithm publicly available as an online tool to both
researchers and practitioners.
From a theoretical point of view, our research provides a first large-scale demonstration,
using secondary social media data, of how the point of view from which an image is taken
and the existence of other individuals in the image can relate to consumers’ engagement with
the brand. We identify mental simulation and self-reference as possible drivers behind the
success of brand selfies, which help viewers simulate the consumption of the product (Weiss
and Johar 2018). We encourage future research to explore more directly the underlying
psychological mechanisms induced by different types of social media brand images.
Social media text data has received much attention from marketing research (e.g., Netzer
et al. 2012; Timoshenko and Hauser 2019; Tirunillai and Tellis 2014). At the same time,
images and videos are likely to proliferate further. Empirical research on these types of
data remains scarce. Studying relevant image data with a multi-method approach including
deep learning image recognition, machine learning and dictionary-based text mining tools,
econometric models, as well as lab experiments has resulted in theoretically plausible findings.
This appears a promising approach for related research questions. For example, it is not clear
theoretically whether findings on the virality of text content translates to images and how
different types of text and image content interact in terms of social media success. Such
questions could be investigated with similar approaches as ours.
There are of course limitations to this research, which further studies may address.
First, further research might elaborate on the sender perspective, the motivations of sharing
product-related content and its impact on sender behavior. For example, Grewal, Stephen
and Coleman (2019) suggests conditions under which posting identity-relevant content can
inhibit subsequent purchase intentions. Descriptively, we find fewer consumer selfies with
37
visible consumer faces than the other two brand image types, suggesting consumers are re-
luctant to affiliate with products in this way. It is worth studying how and why consumers
choose the brand image type they post. For example, consumers may be more involved and
engaged in sharing consumer selfies with their face visible than to post a packshot with the
sender invisible. Consequently, it is not clear that our findings on observer response translate
to sender behavior. Additionally, if brand images are taken during consumption, they might
impact the enjoyment of the sender experience itself (e.g., Barasch, Zauberman and Diehl
2018). As the downstream consequences can be noteworthy, an investigation into sender
motivations and behavior appears promising.
Second, future research might also test the applicability of our findings outside of the
social media context. In fact, the laboratory experiment we conducted is akin to print adver-
tising with unknown spokespersons promoting a brand. In that respect, the brand selfie with
its photographic peculiarities might be worthwhile to explore in other settings. In addition,
analyzing the three brand image types with established tools from the field of neuroscience
and visual saliency would be a promising avenue for further research (e.g., Mormann, Towal
and Koch 2016; Towal, Mormann and Koch 2013). Given the high competition for attention
in social media across and within images (e.g., brand vs. sender for consumer selfies), using
eye-tracking and fMRI tools could help better understand the different types of brand images
and the role of visual attention in distingusihing between the different brand images. Third,
in terms of multimedia content, our typology of brand images is conceptually applicable to
video content as well. These can also differ in perspectives (first-hand vs. third-hand) and
prominence of the sender. In addition, videos allow changing perspectives. Such dynamics
are likely to have interesting effects on brand response.
Overall, our study provides a first step to explore the plethora of user-generated brand
images posted on social media. Identifying relevant image types as well as their respective
role is useful given the diversity of brand images. Selfies are here to stay as a prevalent
component of social media, but they are also a matter of perspective. In terms of marketing
38
objectives, faces on selfies are a double-edged sword. They draw engagement to the image
but can also draw attention away from the brand, inhibiting self-related brand thoughts and
mental simulation. There is still much to learn about how seeing brands through the eyes
of other consumers relates to information processing and how this impacts customer-based
brand equity and consumer behavior. We hope our work stimulates further research in these
and related directions.
39

References
Akpinar, Ezgi and Jonah Berger (2017), “Valuable Virality,” Journal of Marketing Research,
54 (2), 318–330.
Ansari, Asim, Florian Stahl, Mark Heitmann and Lucas Bremer (2018), “Building a Social
Network for Success,” Journal of Marketing Research, 55 (3), 321–338.
Bakhshi, Saeideh, David A. Shamma and Eric Gilbert (2014), “Faces Engage Us: Photos
with Faces Attract More Likes and Comments on Instagram,” in Proceedings of the ACM
Conference on Human Factors in Computing Systems, Toronto, Canada: ACM, 965–974.
Barasch, Alixandra, Gal Zauberman and Kristin Diehl (2018), “How the Intention to Share
Can Undermine Enjoyment: Photo-Taking Goals and Evaluation of Experiences,” Journal
of Consumer Research, 44 (6), 1220–1237.
Barnes, Nora G., Allison Kane and Kylie Maloney (2018), “The 2018 Fortune
500 Target Millennials and Seek Uncensored Expression,” (accessed 2019-02-12),
https://www.umassd.edu/cmr/social-media-research/2018-fortune-500/.
Berger, Jonah and Katherine L. Milkman (2012), “What Makes Online Content Viral?”
Journal of Marketing Research, 49 (2), 192–205.
Bone, Paula F. and Pam S. Ellen (1992), “The Generation and Consequences of
Communication-Evoked Imagery,” Journal of Consumer Research, 19 (1), 93–104.
Bower, Gordon H. and Stephen G. Gilligan (1979), “Remembering Information Related to
One’s Self,” Journal of Research in Personality, 13 (4), 420–432.
Cass, Mary (2016), “David Rose, CEO, Ditto Labs,” (accessed 2019-01-13),
https://www.jwtintelligence.com/2016/03/david-rose-ceo-ditto-labs.
Chevalier, Judith A. and Dina Mayzlin (2006), “The Effect of Word of Mouth on Sales:
Online Book Reviews,” Journal of Marketing Research, 43 (3), 345–354.
Chung, Joon S., Andrew Senior, Oriol Vinyals and Andrew Zisserman (2017), “Lip Reading
Sentences in the Wild,” in Proceedings of the IEEE Conference on Computer Vision and
Pattern Recognition, Honolulu, HI: IEEE, 3444–3453.
Coca-Cola (2016), “Photogenic Package: Coca-Cola Israel Creates First-Ever ’Selfie
Bottle’,” (accessed 2019-03-01), https://www.coca-cola.co.uk/stories/photogenic-package-
coca-cola-israel-creates-first-ever-selfie-bottle.
40
Colicev, Anatoli, Ashwin Malshe, Koen Pauwels and Peter O’Connor (2018), “Improving
Consumer Mindset Metrics and Shareholder Value Through Social Media: The Different
Roles of Owned and Earned Media,” Journal of Marketing, 82 (1), 37–56.
Deng, Jia, Wei Dong, Richard Socher, Li-Jia Li, Kai Li and Li Fei-Fei (2009), “ImageNet:
A Large-Scale Hierarchical Image Database,” in Proceedings of the IEEE Conference on
Computer Vision and Pattern Recognition, Miami, FL: IEEE, 2–9.
Devue, Christel, Artem V. Belopolsky and Jan Theeuwes (2012), “Oculomotor Guidance
and Capture by Irrelevant Faces,” PloS ONE, 7 (4), e34598.
Donkers, Bas, Philip H. Franses and Peter C. Verhoef (2003), “Selective Sampling for Binary
Choice Models,” Journal of Marketing Research, 40 (4), 492–497.
Elder, Ryan S. and Aradhna Krishna (2012), “The ’Visual Depiction Effect’ in Advertis-
ing: Facilitating Embodied Mental Simulation Through Product Orientation,” Journal of
Consumer Research, 38 (6), 988–1003.
Erfgen, Carsten, Sebastian Zenker and Henrik Sattler (2015), “The Vampire Effect: When Do
Celebrity Endorsers Harm Brand Recall?” International Journal of Research in Marketing,
32 (2), 155–163.
Glum, Julia (2015), “Millennials Selfies: Young Adults Will Take More Than
25,000 Pictures of Themselves During Their Lifetimes: Report,” (accessed 2019-
02-06), https://www.ibtimes.com/millennials-selfies-young-adults-will-take-more-25000-
pictures-themselves-during-2108417.
Godes, David and Dina Mayzlin (2004), “Using Online Conversations to Study Word-of-
Mouth Communication,” Marketing Science, 23 (4), 545–560.
Grewal, Lauren, Andrew T. Stephen and Nicole V. Coleman (2019), “When Post-
ing About Products on Social Media Backfires: The Negative Effects of Consumer
Identity Signaling on Product Interest,” Journal of Marketing Research, forthcoming
https://doi.org/10.1177/0022243718821960.
Guido, Gianluigi, Marco Pichierri and Giovanni Pino (2018), “Effects of Face Images and
Face Pareidolia on Consumers’ Responses to Print Advertising: An Empirical Investiga-
tion,” Journal of Advertising Research, 58 (3), 1–13.
Hanssens, Dominique M. and Barton A. Weitz (1980), “The Effectiveness of Industrial Print
Advertisements Across Product Categories,” Journal of Marketing Research, 17 (3), 294–
306.
41
Hartmann, Jochen, Juliana Huppertz, Christina Schamp and Mark Heitmann (2018), “Com-
paring Automated Text Classification Methods,” International Journal of Research in
Marketing, forthcoming https://doi.org/10.1016/j.ijresmar.2018.09.009.
Hennig-Thurau, Thorsten, Caroline Wiertz and Fabian Feldhaus (2015), “Does Twitter Mat-
ter? The Impact of Microblogging Word of Mouth on Consumers’ Adoption of New
Movies,” Journal of the Academy of Marketing Science, 43 (3), 375–394.
Hutto, Clayton J. and Eric Gilbert (2014), “VADER: A Parsimonious Rule-Based Model
for Sentiment Analysis of Social Media Text,” in Proceedings of the International AAAI
Conference on Weblogs and Social Media, Palo Alto, CA: AAAI, 216–225.
Kirk, Colleen P., Joann Peck and Scott D. Swain (2017), “Property Lines in the Mind: Con-
sumers’ Psychological Ownership and Their Territorial Responses,” Journal of Consumer
Research, 45 (1), 148–168.
Klostermann, Jan, Anja Plumeyer, Daniel Boger and Reinhold Decker (2018), “Extracting
Brand Information from Social Networks: Integrating Image, Text, and Social Tagging
Data,” International Journal of Research in Marketing, 35 (4), 538–556.
Knoll, Johannes and Jorg Matthes (2017), “The Effectiveness of Celebrity Endorsements: A
Meta-Analysis,” Journal of the Academy of Marketing Science, 45 (1), 55–75.
Krishnamurthy, Parthasarathy and Mita Sujan (1999), “Retrospection Versus Anticipation:
The Role of the Ad Under Retrospective and Anticipatory Self-Referencing,” Journal of
Consumer Research, 26 (1), 55–69.
Liu, Liu, Daria Dzyabura and Natalie Mizik (2018), “Visual Listening In: Ex-
tracting Brand Image Portrayed on Social Media,” SSRN, (Working Paper,
https://papers.ssrn.com/sol3/papers.cfm?abstract id=2978805).
Liu, Yong (2006), “Word of Mouth for Movies: Its Dynamics and Impact on Box Office
Revenue,” Journal of Marketing, 70 (3), 74–89.
Matz, Sandra C., Cristina Segalin, David Stillwell, Sandrine R. Muller and Maarten W. Bos
(2019), “Predicting the Personal Appeal of Marketing Images Using Computational Meth-
ods,” Journal of Consumer Psychology, forthcoming https://doi.org/10.1002/jcpy.1092.
Meeker, Mary (2016), “Internet Trends 2016,” (accessed 2019-01-12),
https://www.kleinerperkins.com/perspectives/2016-internet-trends-report.
Messaris, Paul (1997), Visual Persuasion: The Role of Images in Advertising, Thousand
Oaks, CA: Sage.
42
Moe, Wendy W., Oded Netzer and David A. Schweidel (2017), “Social Media Analytics,”
in Handbook of Marketing Decision Models , B.Wierenga, ed. New York, NY: Springer,
483–504.
Mormann, Milica M., Regan B. Towal and Christof Koch (2016), “What the Eye
Does Not Admire the Brain Does Not Desire: How Visual Properties of Prod-
uct Packaging Affect Consumer Attention and Choice,” SSRN, (Working Paper,
https://papers.ssrn.com/sol3/papers.cfm?abstract id=2709187).
Netzer, Oded, Ronen Feldman, Jacob Goldenberg and Moshe Fresko (2012), “Mine Your
Own Business: Market-Structure Surveillance Through Text Mining,” Marketing Science,
31 (3), 521–543.
Ordenes, Francisco V., Dhruv Grewal, Stephan Ludwig, Ko De Ruyter, Dominik Mahr and
Martin Wetzels (2019), “Cutting Through Content Clutter: How Speech and Image Acts
Drive Consumer Sharing of Social Media Brand Messages,” Journal of Consumer Research,
45 (5), 988–1012.
Paul, Mackayla (2018), “50 Most Followed Brands on Instagram 2018,” (accessed 2019-03-
01), https://www.plannthat.com/50-most-followed-brands-instagram-2018/.
Peck, Joann and Suzanne B. Shu (2009), “The Effect of Mere Touch on Perceived Owner-
ship,” Journal of Consumer Research, 36 (3), 434–447.
Peck, Joann, Victor A. Barger and Andrea Webb (2013), “In Search of a Surrogate for Touch:
The Effect of Haptic Imagery on Perceived Ownership,” Journal of Consumer Psychology,
23 (2), 189–196.
Pennebaker, James W., Ryan L. Boyd, Kayla Jordan and Kate Blackburn (2015), The
Development and Psychometric Properties of LIWC2015, Austin, TX: University of Texas
at Austin.
Pieters, Rik, Michel Wedel and Rajeev Batra (2010), “The Stopping Power of Advertising:
Measures and Effects of Visual Complexity,” Journal of Marketing, 74 (5), 48–60.
Preacher, Kristopher J. and Andrew F. Hayes (2008), “Asymptotic and Resampling Strate-
gies for Assessing and Comparing Indirect Effects in Multiple Mediator Models,” Behavior
Research Methods, 40 (3), 879–891.
Schweidel, David A. and Wendy W. Moe (2014), “Listening In on Social Media: A Joint
Model of Sentiment and Venue Format Choice,” Journal of Marketing Research, 51
(4), 387–402.
43
Selvaraju, Ramprasaath R., Michael Cogswell, Abhishek Das, Ramakrishna Vedantam, Devi
Parikh and Dhruv Batra (2017), “Grad-CAM: Visual Explanations from Deep Networks
via Gradient-Based Localization,” in Proceedings of the IEEE International Conference
on Computer Vision, Venice, Italy: IEEE, 618–626.
Shu, Suzanne B. and Joann Peck (2011), “Psychological Ownership and Affective Reac-
tion: Emotional Attachment Process Variables and the Endowment Effect,” Journal of
Consumer Psychology, 21 (4), 439–452.
Simonyan, Karen and Andrew Zisserman (2014), “Very Deep Convolutional Networks for
Large-Scale Image Recognition,” arXiv, (http://arxiv.org/abs/1409.1556).
Starbucks (2015), “Top Customer-Submitted Starbucks Instagram Photos,” (accessed
2019-01-29), https://stories.starbucks.com/stories/2015/2015-top-starbucks-instagram-
photos/.
Statista (2019), “Most Popular Social Networks Worldwide as of January 2019,” (ac-
cessed 2019-02-24), https://www.statista.com/statistics/272014/global-social-networks-
ranked-by-number-of-users/.
Symons, Cynthia S. and Blair T. Johnson (1997), “The Self-Reference Effect in Memory: A
Meta-Analysis,” Psychological Bulletin, 121 (3), 371–394.
Timoshenko, Artem and John R. Hauser (2019), “Identifying Customer
Needs from User-Generated Content,” Marketing Science, forthcoming
https://doi.org/10.1287/mksc.2018.1123.
Tirunillai, Seshadri and Gerard J. Tellis (2014), “Mining Marketing Meaning from Online
Chatter: Strategic Brand Analysis of Big Data Using Latent Dirichlet Allocation,” Journal
of Marketing Research, 51 (4), 463–479.
Tomalski, Przemyslaw, Gergely Csibra and Mark H. Johnson (2009), “Rapid Orienting
Toward Face-Like Stimuli with Gaze-Relevant Contrast Information,” Perception, 38
(4), 569–578.
Toubia, Olivier and Andrew T. Stephen (2013), “Intrinsic vs. Image-Related Utility in Social
Media: Why Do People Contribute Content to Twitter?” Marketing Science, 32 (3), 368–
392.
Towal, Regan B., Milica M. Mormann and Christof Koch (2013), “Simultaneous Modeling
of Visual Saliency and Value Computation Improves Predictions of Economic Choice,”
Proceedings of the National Academy of Sciences, 110 (40), E3858–E3867.
44
Twitter (2019), “Q4 and Fiscal Year 2018 Letter to Shareholders,” (accessed 2019-01-12),
https://s22.q4cdn.com/826641620/files/doc financials/2018/q4/Q4-2018-Shareholder-
Letter.pdf.
Vicinitas (2018), “2018 Research on 100 Million Tweets: What it Means for Your Social Me-
dia Strategy for Twitter,” (accessed 2019-02-12), https://www.vicinitas.io/blog/twitter-
social-media-strategy-2018-research-100-million-tweets.
Voorveld, Hilde A.M., Guda van Noort, Daniel G. Muntinga and Fred Bronner (2018),
“Engagement with Social Media and Social Media Advertising: The Differentiating Role
of Platform Type,” Journal of Advertising, 47 (1), 38–54.
Weiss, Liad and Gita V. Johar (2013), “Egocentric Categorization and Product Judgment:
Seeing Your Traits in What You Own (and Their Opposite in What You Don’t),” Journal
of Consumer Research, 40 (1), 185–201.
Weiss, Liad and Gita V. Johar (2018), “Psychological Ownership in Egocentric Categoriza-
tion Theory,” in Psychological Ownership and Consumer Behavior , J.Peck and S. B.Shu,
eds New York, NY: Springer, 33–51.
Xiao, Li and Min Ding (2014), “Just the Faces: Exploring the Effects of Facial Features in
Print Advertising,” Marketing Science, 33 (3), 338–352.
Yin, Dezhi, Samuel D. Bond and Han Zhang (2017), “Keep Your Cool or Let It Out: Non-
linear Effects of Expressed Arousal on Perceptions of Consumer Reviews,” Journal of
Marketing Research, 54 (3), 447–463.
Yosinski, Jason, Jeff Clune, Yoshua Bengio and Hod Lipson (2014), “How Transferable Are
Features in Deep Neural Networks?” in Proceedings of the International Conference on
Neural Information Processing Systems, Montreal, Canada: ACM, 3320–3328.
Zhang, Mengxia and Lan Luo (2018), “Can User Generated Content Predict Restau-
rant Survival: Deep Learning of Yelp Photos and Reviews,” SSRN, (Working Paper,
https://papers.ssrn.com/sol3/papers.cfm?abstract id=3108288).
Zhang, Shunyuan, Dokyun Lee, Param Vir Singh and Kannan Srinivasan (2018),
“How Much Is an Image Worth? Airbnb Property Demand Analytics Lever-
aging a Scalable Image Classification Algorithm,” SSRN, (Working Paper,
https://papers.ssrn.com/sol3/papers.cfm?abstract id=2976021).
Zhao, Min, Steve Hoeffler and Gal Zauberman (2011), “Mental Simulation and Product Eval-
uation: The Affective and Cognitive Dimensions of Process Versus Outcome Simulation,”
Journal of Marketing Research, 48 (5), 827–839.
45
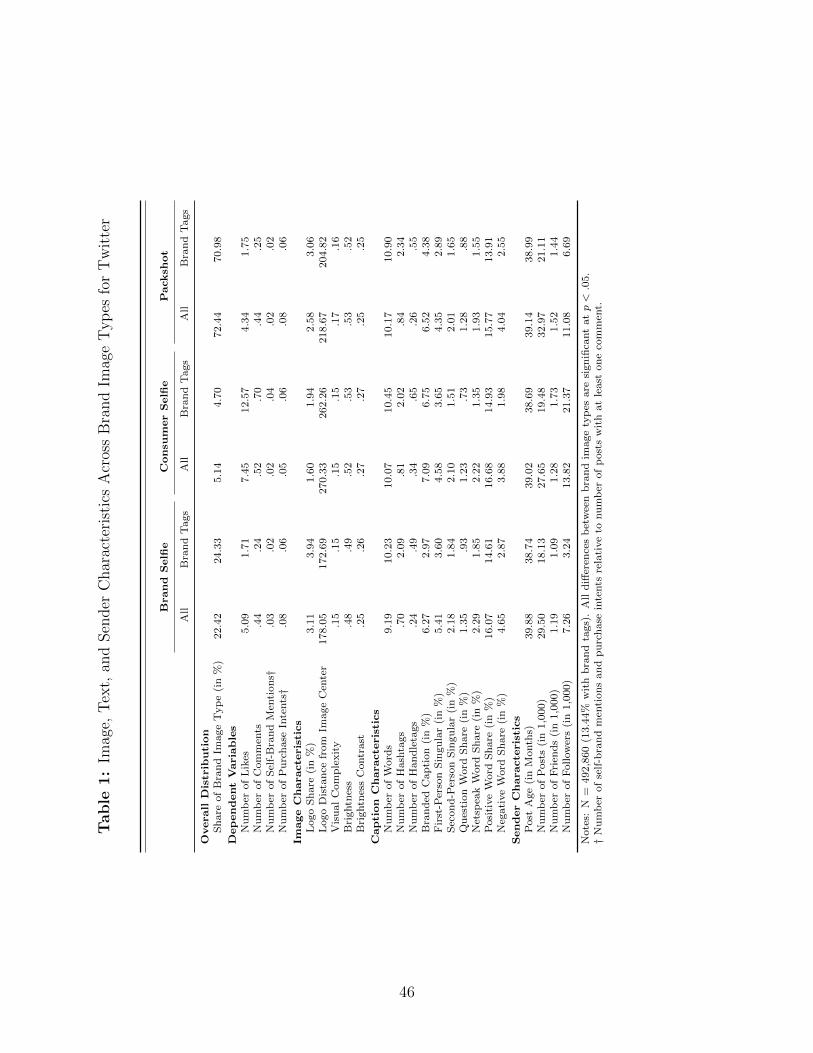
Table
1:
Imag
e,T
ext,
and
Sen
der
Char
acte
rist
ics
Acr
oss
Bra
nd
Imag
eT
yp
esfo
rT
wit
ter
Bran
dS
elfi
eC
on
sum
er
Selfi
eP
acksh
ot
All
Bra
nd
Tags
All
Bra
nd
Tags
All
Bra
nd
Tags
Overall
Dis
trib
uti
on
Sh
are
of
Bra
nd
Image
Typ
e(i
n%
)22.4
224.3
35.1
44.7
072.4
470.9
8
Dep
en
dent
Varia
ble
sN
um
ber
of
Lik
es5.0
91.7
17.4
512.5
74.3
41.7
5N
um
ber
of
Com
men
ts.4
4.2
4.5
2.7
0.4
4.2
5N
um
ber
of
Sel
f-B
ran
dM
enti
on
s†.0
3.0
2.0
2.0
4.0
2.0
2N
um
ber
of
Pu
rch
ase
Inte
nts†
.08
.06
.05
.06
.08
.06
Image
Ch
aracte
ris
tics
Logo
Sh
are
(in
%)
3.1
13.9
41.6
01.9
42.5
83.0
6L
ogo
Dis
tan
cefr
om
Image
Cen
ter
178.0
5172.6
9270.3
3262.2
6218.6
7204.8
2V
isu
al
Com
ple
xit
y.1
5.1
5.1
5.1
5.1
7.1
6B
rightn
ess
.48
.49
.52
.53
.53
.52
Bri
ghtn
ess
Contr
ast
.25
.26
.27
.27
.25
.25
Cap
tion
Ch
aracte
ris
tics
Nu
mb
erof
Word
s9.1
910.2
310.0
710.4
510.1
710.9
0N
um
ber
of
Hash
tags
.70
2.0
9.8
12.0
2.8
42.3
4N
um
ber
of
Han
dle
tags
.24
.49
.34
.65
.26
.55
Bra
nd
edC
ap
tion
(in
%)
6.2
72.9
77.0
96.7
56.5
24.3
8F
irst
-Per
son
Sin
gu
lar
(in
%)
5.4
13.6
04.5
83.6
54.3
52.8
9S
econ
d-P
erso
nS
ingu
lar
(in
%)
2.1
81.8
42.1
01.5
12.0
11.6
5Q
ues
tion
Word
Sh
are
(in
%)
1.3
5.9
31.2
3.7
31.2
8.8
8N
etsp
eak
Word
Sh
are
(in
%)
2.2
91.8
52.2
21.3
51.9
31.5
5P
osi
tive
Word
Sh
are
(in
%)
16.0
714.6
116.6
814.9
315.7
713.9
1N
egati
ve
Word
Sh
are
(in
%)
4.6
52.8
73.8
81.9
84.0
42.5
5
Sen
der
Ch
aracte
ris
tics
Post
Age
(in
Month
s)39.8
838.7
439.0
238.6
939.1
438.9
9N
um
ber
of
Post
s(i
n1,0
00)
29.5
018.1
327.6
519.4
832.9
721.1
1N
um
ber
of
Fri
end
s(i
n1,0
00)
1.1
91.0
91.2
81.7
31.5
21.4
4N
um
ber
of
Follow
ers
(in
1,0
00)
7.2
63.2
413.8
221.3
711.0
86.6
9
Note
s:N
=492,8
60
(13.4
4%
wit
hb
ran
dta
gs)
.A
lld
iffer
ence
sb
etw
een
bra
nd
image
typ
esare
sign
ifica
nt
atp<.0
5.
†N
um
ber
of
self
-bra
nd
men
tion
san
dp
urc
hase
inte
nts
rela
tive
tonu
mb
erof
post
sw
ith
at
least
on
eco
mm
ent.
46
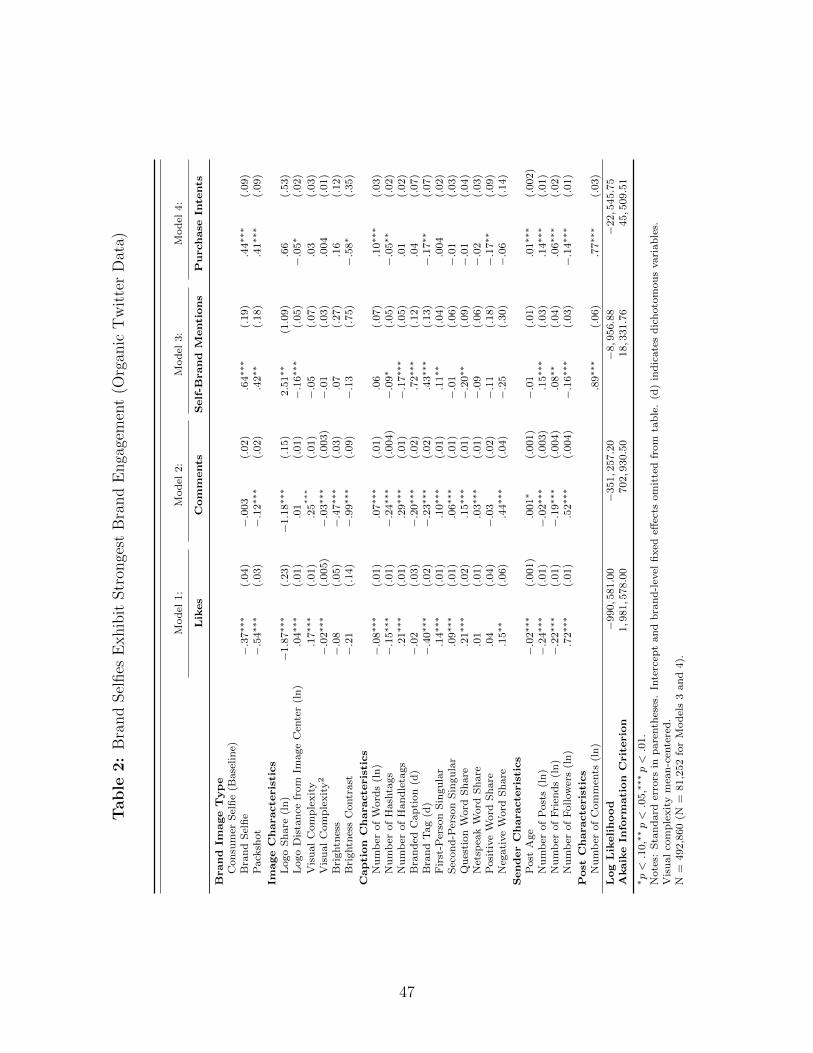
Table
2:
Bra
nd
Sel
fies
Exhib
itStr
onge
stB
rand
Enga
gem
ent
(Org
anic
Tw
itte
rD
ata)
Mod
el1:
Mod
el2:
Mod
el3:
Mod
el4:
Lik
es
Com
ments
Self
-Bran
dM
enti
on
sP
urch
ase
Inte
nts
Bran
dIm
age
Typ
eC
on
sum
erS
elfi
e(B
ase
lin
e)B
ran
dS
elfi
e−.3
7∗∗
∗(.
04)
−.0
03
(.02)
.64∗∗
∗(.
19)
.44∗∗
∗(.
09)
Pack
shot
−.5
4∗∗
∗(.
03)
−.1
2∗∗
∗(.
02)
.42∗∗
(.18)
.41∗∗
∗(.
09)
Image
Ch
aracte
ris
tics
Logo
Sh
are
(ln
)−
1.8
7∗∗
∗(.
23)
−1.1
8∗∗
∗(.
15)
2.5
1∗∗
(1.0
9)
.66
(.53)
Logo
Dis
tan
cefr
om
Image
Cen
ter
(ln
).0
4∗∗
∗(.
01)
.01
(.01)
−.1
6∗∗
∗(.
05)
−.0
5∗
(.02)
Vis
ual
Com
ple
xit
y.1
7∗∗
∗(.
01)
.25∗∗∗
(.01)
−.0
5(.
07)
.03
(.03)
Vis
ual
Com
ple
xit
y2
−.0
2∗∗
∗(.
005)
−.0
3∗∗
∗(.
003)
−.0
1(.
03)
.004
(.01)
Bri
ghtn
ess
−.0
8(.
05)
−.4
7∗∗
∗(.
03)
.07
(.27)
.16
(.12)
Bri
ghtn
ess
Contr
ast
−.2
1(.
14)
−.9
9∗∗
∗(.
09)
−.1
3(.
75)
−.5
8∗
(.35)
Cap
tion
Ch
aracte
ris
tics
Nu
mb
erof
Word
s(l
n)
−.0
8∗∗
∗(.
01)
.07∗∗
∗(.
01)
.06
(.07)
.10∗∗
∗(.
03)
Nu
mb
erof
Hash
tags
−.1
5∗∗
∗(.
01)
−.2
4∗∗
∗(.
004)
−.0
9∗
(.05)
−.0
5∗∗
(.02)
Nu
mb
erof
Han
dle
tags
.21∗∗
∗(.
01)
.29∗∗
∗(.
01)
−.1
7∗∗
∗(.
05)
.01
(.02)
Bra
nd
edC
ap
tion
(d)
−.0
2(.
03)
−.2
0∗∗
∗(.
02)
.72∗∗
∗(.
12)
.04
(.07)
Bra
nd
Tag
(d)
−.4
0∗∗
∗(.
02)
−.2
3∗∗
∗(.
02)
.43∗∗
∗(.
13)
−.1
7∗∗
(.07)
Fir
st-P
erso
nSin
gu
lar
.14∗∗
∗(.
01)
.10∗∗
∗(.
01)
.11∗∗
(.04)
.004
(.02)
Sec
on
d-P
erso
nSin
gu
lar
.09∗∗
∗(.
01)
.06∗∗
∗(.
01)
−.0
1(.
06)
−.0
1(.
03)
Qu
esti
on
Word
Sh
are
.21∗∗
∗(.
02)
.15∗∗
∗(.
01)
−.2
0∗∗
(.09)
−.0
1(.
04)
Net
spea
kW
ord
Sh
are
.01
(.01)
.03∗∗
∗(.
01)
−.0
9(.
06)
−.0
2(.
03)
Posi
tive
Word
Sh
are
.04
(.04)
−.0
3(.
02)
−.1
1(.
18)
−.1
7∗∗
(.09)
Neg
ati
ve
Word
Sh
are
.15∗∗
(.06)
.44∗∗
∗(.
04)
−.2
5(.
30)
−.0
6(.
14)
Sen
der
Ch
aracte
ris
tics
Post
Age
−.0
2∗∗
∗(.
001)
.001∗
(.001)
−.0
1(.
01)
.01∗∗
∗(.
002)
Nu
mb
erof
Post
s(l
n)
−.2
4∗∗
∗(.
01)
−.0
2∗∗
∗(.
003)
.15∗∗
∗(.
03)
.14∗∗
∗(.
01)
Nu
mb
erof
Fri
end
s(l
n)
−.2
2∗∗
∗(.
01)
−.1
9∗∗
∗(.
004)
.08∗∗
(.04)
.06∗∗
∗(.
02)
Nu
mb
erof
Follow
ers
(ln
).7
2∗∗
∗(.
01)
.52∗∗
∗(.
004)
−.1
6∗∗
∗(.
03)
−.1
4∗∗
∗(.
01)
Post
Ch
aracte
ris
tics
Nu
mb
erof
Com
men
ts(l
n)
.89∗∗
∗(.
06)
.77∗∗
∗(.
03)
Log
Lik
eli
hood
−990,5
81.0
0−
351,2
57.2
0−
8,9
56.8
8−
22,5
45.7
5A
kaik
eIn
form
ati
on
Crit
erio
n1,9
81,5
78.0
0702,9
30.5
018,3
31.7
645,5
09.5
1
∗p<.1
0,∗
∗p<.0
5,∗
∗∗p<.0
1.
Note
s:S
tan
dard
erro
rsin
pare
nth
eses
.In
terc
ept
an
db
ran
d-l
evel
fixed
effec
tsom
itte
dfr
om
tab
le.
(d)
ind
icate
sd
ich
oto
mou
svari
ab
les.
Vis
ual
com
ple
xit
ym
ean
-cen
tere
d.
N=
492,8
60
(N=
81,2
52
for
Mod
els
3an
d4).
47
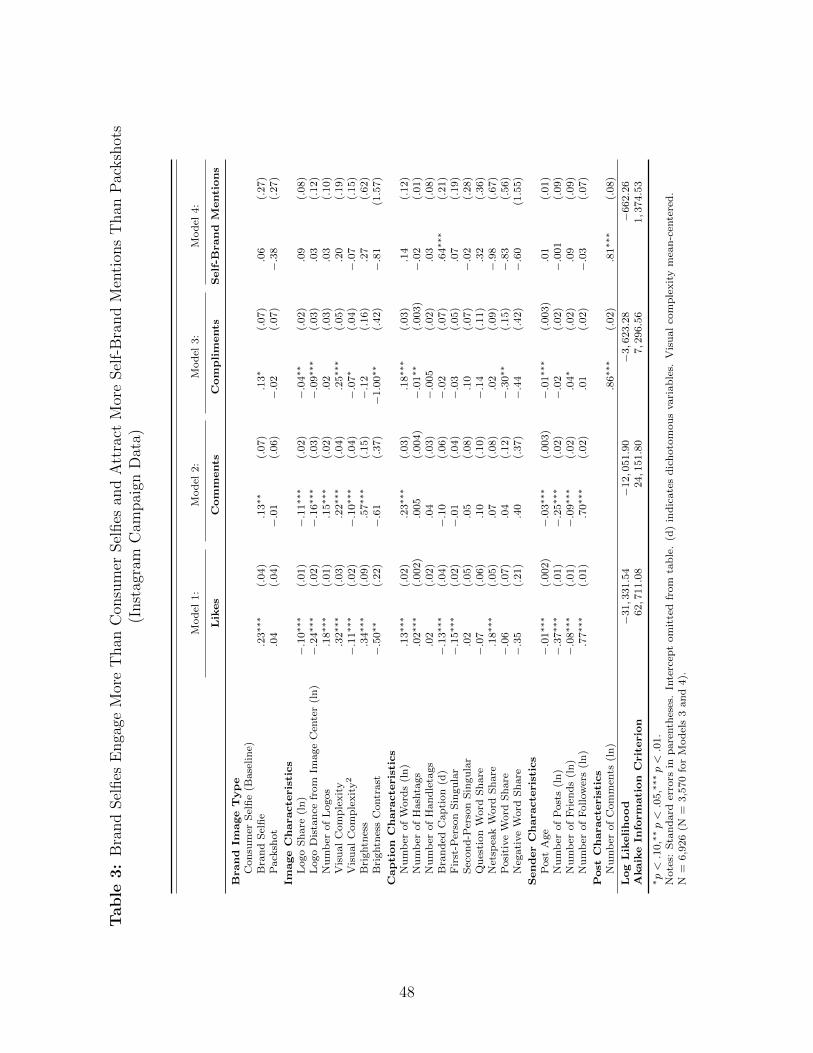
Table
3:
Bra
nd
Sel
fies
Enga
geM
ore
Than
Con
sum
erSel
fies
and
Att
ract
Mor
eSel
f-B
rand
Men
tion
sT
han
Pac
ksh
ots
(Inst
agra
mC
ampai
gnD
ata)
Mod
el1:
Mod
el2:
Mod
el3:
Mod
el4:
Lik
es
Com
ments
Com
pli
ments
Self
-Bran
dM
enti
on
s
Bran
dIm
age
Typ
eC
on
sum
erS
elfi
e(B
ase
lin
e)B
ran
dS
elfi
e.2
3∗∗
∗(.
04)
.13∗∗
(.07)
.13∗
(.07)
.06
(.27)
Pack
shot
.04
(.04)
−.0
1(.
06)
−.0
2(.
07)
−.3
8(.
27)
Image
Ch
aracte
ris
tics
Logo
Sh
are
(ln
)−.1
0∗∗
∗(.
01)
−.1
1∗∗
∗(.
02)
−.0
4∗∗
(.02)
.09
(.08)
Logo
Dis
tan
cefr
om
Image
Cen
ter
(ln
)−.2
4∗∗
∗(.
02)
−.1
6∗∗
∗(.
03)
−.0
9∗∗
∗(.
03)
.03
(.12)
Nu
mb
erof
Logos
.18∗∗
∗(.
01)
.15∗∗
∗(.
02)
.02
(.03)
.03
(.10)
Vis
ual
Com
ple
xit
y.3
2∗∗
∗(.
03)
.22∗∗
∗(.
04)
.25∗∗
∗(.
05)
.20
(.19)
Vis
ual
Com
ple
xit
y2
−.1
1∗∗
∗(.
02)
−.1
0∗∗
∗(.
04)
−.0
7∗
(.04)
−.0
7(.
15)
Bri
ghtn
ess
.34∗∗
∗(.
09)
.57∗∗
∗(.
15)
−.1
2(.
16)
.27
(.62)
Bri
ghtn
ess
Contr
ast
−.5
0∗∗
(.22)
−.6
1(.
37)
−1.0
0∗∗
(.42)
−.8
1(1.5
7)
Cap
tion
Ch
aracte
ris
tics
Nu
mb
erof
Word
s(l
n)
.13∗∗
∗(.
02)
.23∗∗
∗(.
03)
.18∗∗
∗(.
03)
.14
(.12)
Nu
mb
erof
Hash
tags
.02∗∗
∗(.
002)
.005
(.004)
−.0
1∗∗
(.003)
−.0
2(.
01)
Nu
mb
erof
Han
dle
tags
.02
(.02)
.04
(.03)
−.0
05
(.02)
.03
(.08)
Bra
nd
edC
ap
tion
(d)
−.1
3∗∗
∗(.
04)
−.1
0(.
06)
−.0
2(.
07)
.64∗∗
∗(.
21)
Fir
st-P
erso
nS
ingula
r−.1
5∗∗
∗(.
02)
−.0
1(.
04)
−.0
3(.
05)
.07
(.19)
Sec
on
d-P
erso
nS
ingula
r.0
2(.
05)
.05
(.08)
.10
(.07)
−.0
2(.
28)
Qu
esti
on
Word
Sh
are
−.0
7(.
06)
.10
(.10)
−.1
4(.
11)
.32
(.36)
Net
spea
kW
ord
Sh
are
.18∗∗
∗(.
05)
.07
(.08)
.02
(.09)
−.9
8(.
67)
Posi
tive
Word
Sh
are
−.0
6(.
07)
.04
(.12)
−.3
0∗∗
(.15)
−.8
3(.
56)
Neg
ati
ve
Word
Sh
are
−.3
5(.
21)
.40
(.37)
−.4
4(.
42)
−.6
0(1.5
5)
Sen
der
Ch
aracte
ris
tics
Post
Age
−.0
1∗∗
∗(.
002)
−.0
3∗∗
∗(.
003)
−.0
1∗∗
∗(.
003)
.01
(.01)
Nu
mb
erof
Post
s(l
n)
−.3
7∗∗
∗(.
01)
−.2
5∗∗
∗(.
02)
−.0
2(.
02)
−.0
01
(.09)
Nu
mb
erof
Fri
end
s(l
n)
−.0
8∗∗
∗(.
01)
−.0
9∗∗
∗(.
02)
.04∗
(.02)
.09
(.09)
Nu
mb
erof
Follow
ers
(ln
).7
7∗∗
∗(.
01)
.70∗∗
∗(.
02)
.01
(.02)
−.0
3(.
07)
Post
Ch
aracte
ris
tics
Nu
mb
erof
Com
men
ts(l
n)
.86∗∗
∗(.
02)
.81∗∗
∗(.
08)
Log
Lik
eli
hood
−31,3
31.5
4−
12,0
51.9
0−
3,6
23.2
8−
662.2
6A
kaik
eIn
form
ati
on
Crit
erio
n62,7
11.0
824,1
51.8
07,2
96.5
61,3
74.5
3
∗p<.1
0,∗
∗p<.0
5,∗
∗∗p<.0
1.
Note
s:S
tan
dard
erro
rsin
pare
nth
eses
.In
terc
ept
om
itte
dfr
om
tab
le.
(d)
ind
icate
sd
ich
oto
mou
svari
ab
les.
Vis
ual
com
ple
xit
ym
ean
-cen
tere
d.
N=
6,9
26
(N=
3,5
70
for
Mod
els
3an
d4).
48
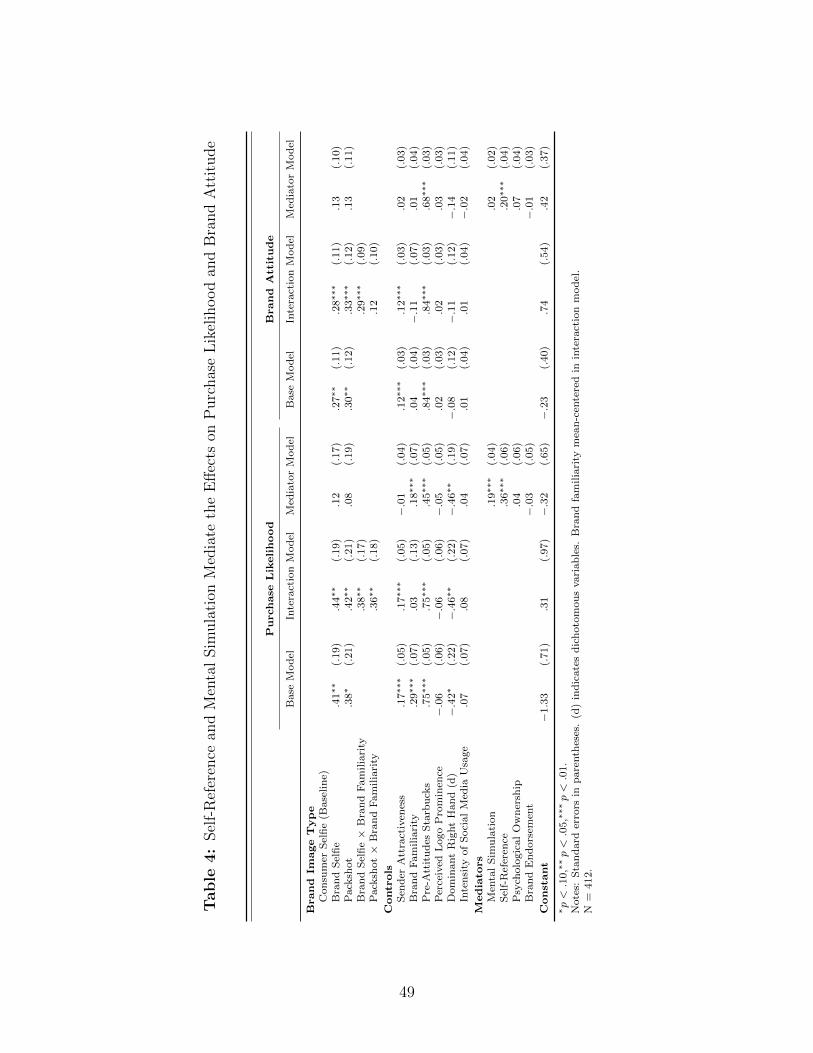
Table
4:
Sel
f-R
efer
ence
and
Men
tal
Sim
ula
tion
Med
iate
the
Eff
ects
onP
urc
has
eL
ikel
ihood
and
Bra
nd
Att
itude
Pu
rch
ase
Lik
eli
hood
Bran
dA
ttit
ud
e
Base
Mod
elIn
tera
ctio
nM
od
elM
edia
tor
Mod
elB
ase
Mod
elIn
tera
ctio
nM
od
elM
edia
tor
Model
Bran
dIm
age
Typ
eC
on
sum
erS
elfi
e(B
ase
lin
e)B
ran
dS
elfi
e.4
1∗∗
(.19)
.44∗∗
(.19)
.12
(.17)
.27∗∗
(.11)
.28∗∗
∗(.
11)
.13
(.10)
Pack
shot
.38∗
(.21)
.42∗∗
(.21)
.08
(.19)
.30∗∗
(.12)
.33∗∗
∗(.
12)
.13
(.11)
Bra
nd
Sel
fie×
Bra
nd
Fam
ilia
rity
.38∗∗
(.17)
.29∗∗
∗(.
09)
Pack
shot×
Bra
nd
Fam
ilia
rity
.36∗∗
(.18)
.12
(.10)
Contr
ols
Sen
der
Att
ract
iven
ess
.17∗∗
∗(.
05)
.17∗∗
∗(.
05)
−.0
1(.
04)
.12∗∗
∗(.
03)
.12∗∗
∗(.
03)
.02
(.03)
Bra
nd
Fam
ilia
rity
.29∗∗
∗(.
07)
.03
(.13)
.18∗∗
∗(.
07)
.04
(.04)
−.1
1(.
07)
.01
(.04)
Pre
-Att
itu
des
Sta
rbu
cks
.75∗∗
∗(.
05)
.75∗∗
∗(.
05)
.45∗∗
∗(.
05)
.84∗∗
∗(.
03)
.84∗∗
∗(.
03)
.68∗∗
∗(.
03)
Per
ceiv
edL
ogo
Pro
min
ence
−.0
6(.
06)
−.0
6(.
06)
−.0
5(.
05)
.02
(.03)
.02
(.03)
.03
(.03)
Dom
inant
Rig
ht
Han
d(d
)−.4
2∗
(.22)
−.4
6∗∗
(.22)
−.4
6∗∗
(.19)
−.0
8(.
12)
−.1
1(.
12)
−.1
4(.
11)
Inte
nsi
tyof
Soci
al
Med
iaU
sage
.07
(.07)
.08
(.07)
.04
(.07)
.01
(.04)
.01
(.04)
−.0
2(.
04)
Med
iato
rs
Men
tal
Sim
ula
tion
.19∗∗
∗(.
04)
.02
(.02)
Sel
f-R
efer
ence
.36∗∗
∗(.
06)
.20∗∗
∗(.
04)
Psy
cholo
gic
al
Ow
ner
ship
.04
(.06)
.07
(.04)
Bra
nd
En
dors
emen
t−.0
3(.
05)
−.0
1(.
03)
Con
stant
−1.3
3(.
71)
.31
(.97)
−.3
2(.
65)
−.2
3(.
40)
.74
(.54)
.42
(.37)
∗p<.1
0,∗
∗p<.0
5,∗
∗∗p<.0
1.
Note
s:S
tan
dard
erro
rsin
pare
nth
eses
.(d
)in
dic
ate
sd
ich
oto
mou
svari
ab
les.
Bra
nd
fam
ilia
rity
mea
n-c
ente
red
inin
tera
ctio
nm
od
el.
N=
412.
49

APPENDIX
Appendix A: Examples of Companies Soliciting Consumer Selfies with Campaigns
Notes: Coca-Cola (top-left), Dunkin’ Donuts (bottom-left), Unilever: Axe deodorant (right).
50
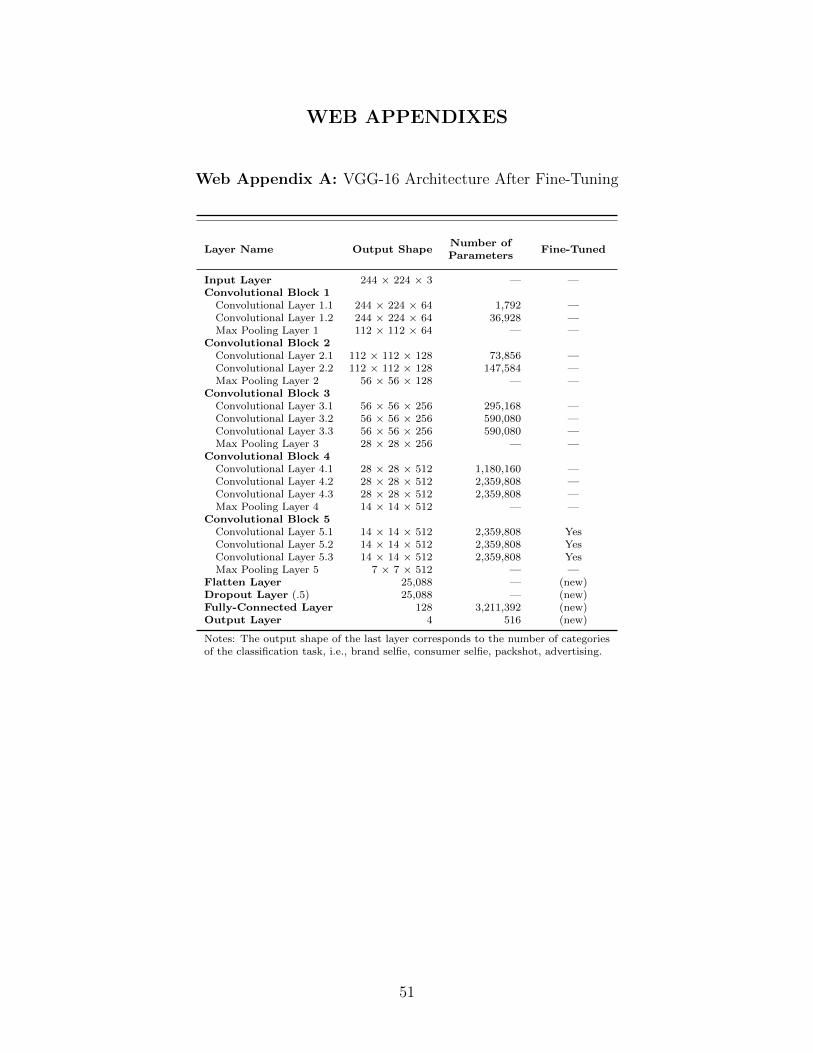
WEB APPENDIXES
Web Appendix A: VGG-16 Architecture After Fine-Tuning
Layer Name Output ShapeNumber ofParameters
Fine-Tuned
Input Layer 244 × 224 × 3 — —Convolutional Block 1
Convolutional Layer 1.1 244 × 224 × 64 1,792 —Convolutional Layer 1.2 244 × 224 × 64 36,928 —Max Pooling Layer 1 112 × 112 × 64 — —
Convolutional Block 2Convolutional Layer 2.1 112 × 112 × 128 73,856 —Convolutional Layer 2.2 112 × 112 × 128 147,584 —Max Pooling Layer 2 56 × 56 × 128 — —
Convolutional Block 3Convolutional Layer 3.1 56 × 56 × 256 295,168 —Convolutional Layer 3.2 56 × 56 × 256 590,080 —Convolutional Layer 3.3 56 × 56 × 256 590,080 —Max Pooling Layer 3 28 × 28 × 256 — —
Convolutional Block 4Convolutional Layer 4.1 28 × 28 × 512 1,180,160 —Convolutional Layer 4.2 28 × 28 × 512 2,359,808 —Convolutional Layer 4.3 28 × 28 × 512 2,359,808 —Max Pooling Layer 4 14 × 14 × 512 — —
Convolutional Block 5Convolutional Layer 5.1 14 × 14 × 512 2,359,808 YesConvolutional Layer 5.2 14 × 14 × 512 2,359,808 YesConvolutional Layer 5.3 14 × 14 × 512 2,359,808 YesMax Pooling Layer 5 7 × 7 × 512 — —
Flatten Layer 25,088 — (new)Dropout Layer (.5) 25,088 — (new)Fully-Connected Layer 128 3,211,392 (new)Output Layer 4 516 (new)
Notes: The output shape of the last layer corresponds to the number of categoriesof the classification task, i.e., brand selfie, consumer selfie, packshot, advertising.
51
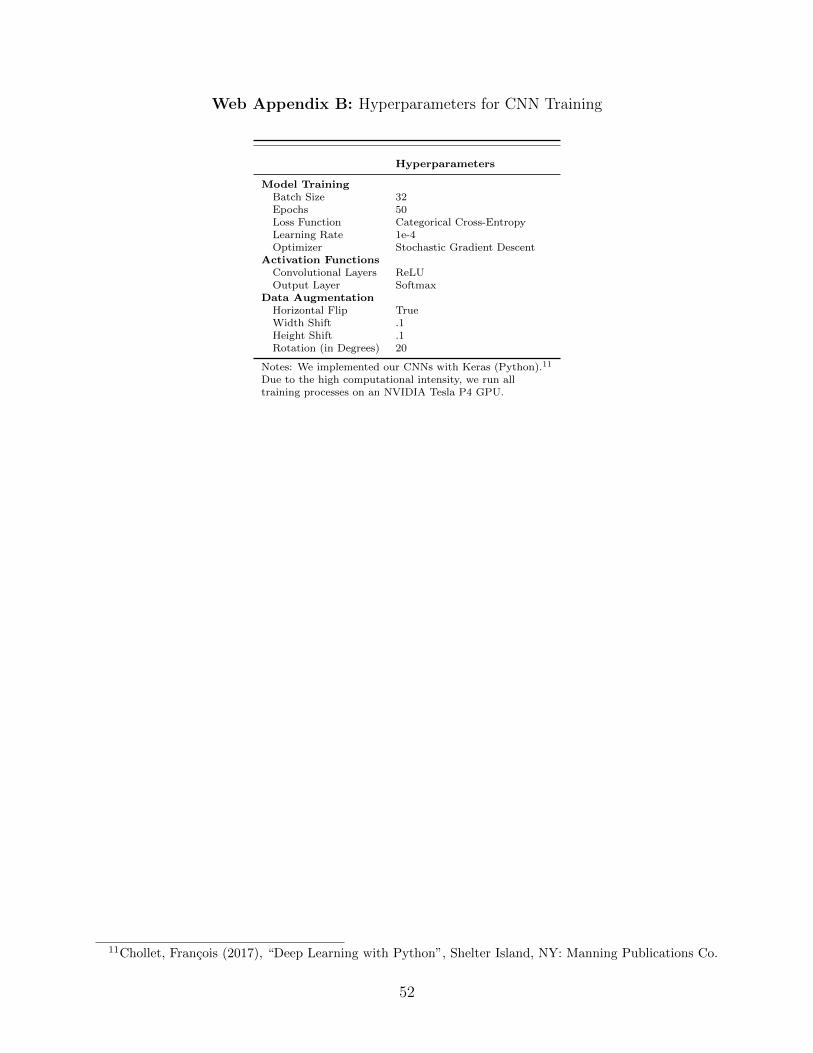
Web Appendix B: Hyperparameters for CNN Training
Hyperparameters
Model TrainingBatch Size 32Epochs 50Loss Function Categorical Cross-EntropyLearning Rate 1e-4Optimizer Stochastic Gradient Descent
Activation FunctionsConvolutional Layers ReLUOutput Layer Softmax
Data AugmentationHorizontal Flip TrueWidth Shift .1Height Shift .1Rotation (in Degrees) 20
Notes: We implemented our CNNs with Keras (Python).11
Due to the high computational intensity, we run alltraining processes on an NVIDIA Tesla P4 GPU.
11Chollet, Francois (2017), “Deep Learning with Python”, Shelter Island, NY: Manning Publications Co.
52
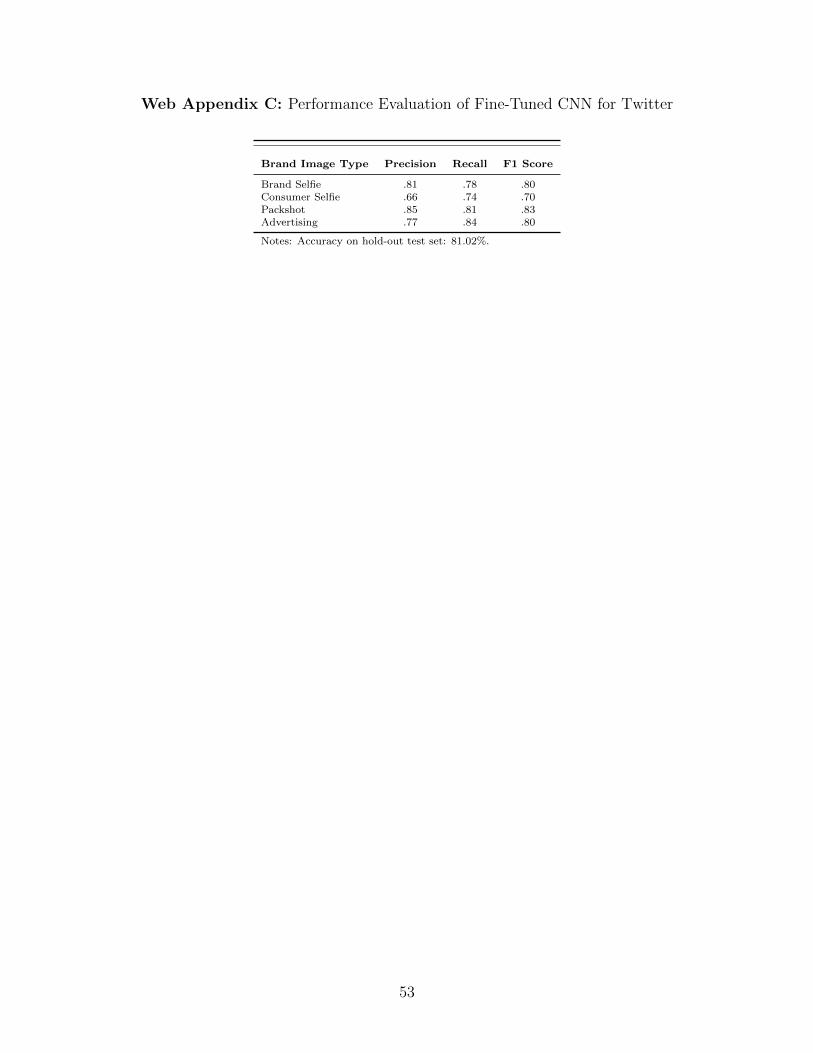
Web Appendix C: Performance Evaluation of Fine-Tuned CNN for Twitter
Brand Image Type Precision Recall F1 Score
Brand Selfie .81 .78 .80Consumer Selfie .66 .74 .70Packshot .85 .81 .83Advertising .77 .84 .80
Notes: Accuracy on hold-out test set: 81.02%.
53
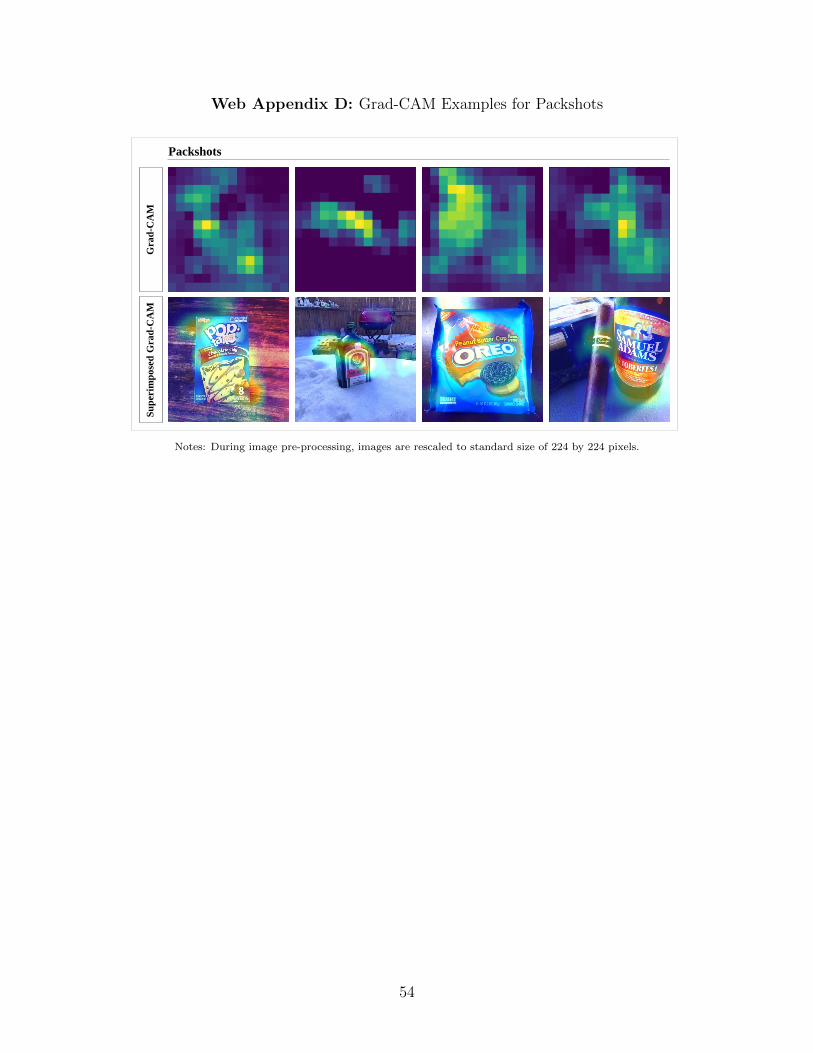
Web Appendix D: Grad-CAM Examples for Packshots
Su
per
imp
ose
d G
rad
-CA
MG
rad
-CA
MPackshots
Notes: During image pre-processing, images are rescaled to standard size of 224 by 224 pixels.
54
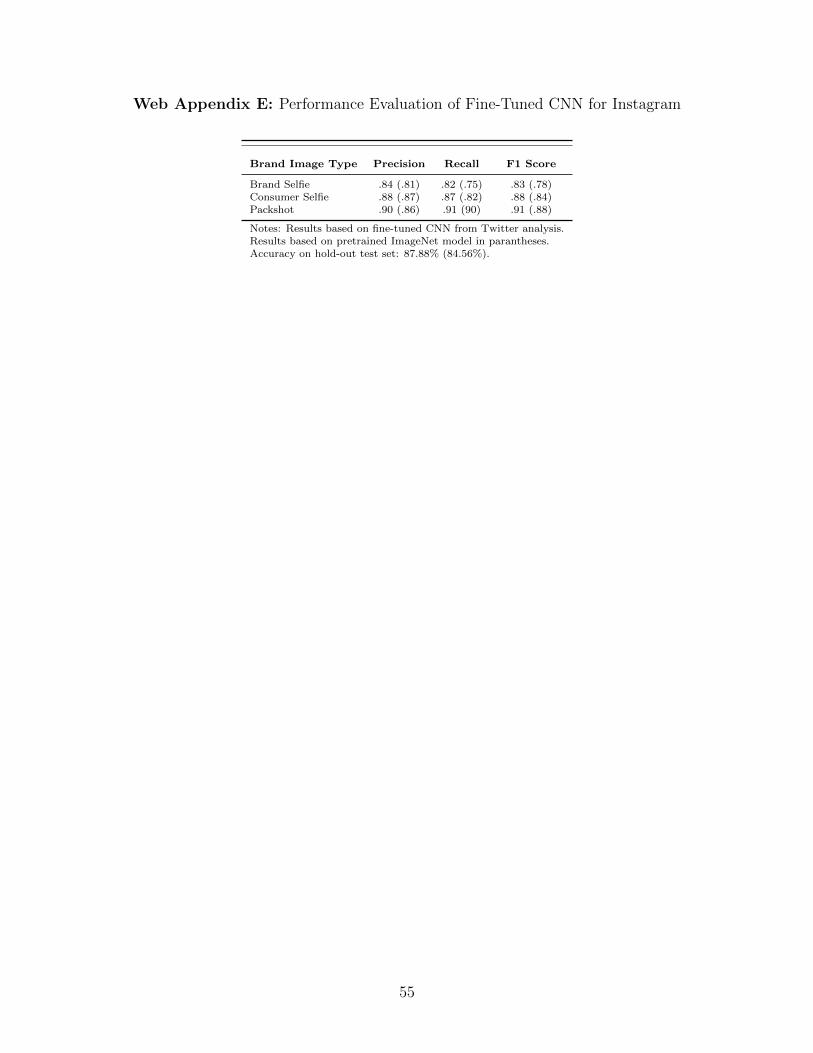
Web Appendix E: Performance Evaluation of Fine-Tuned CNN for Instagram
Brand Image Type Precision Recall F1 Score
Brand Selfie .84 (.81) .82 (.75) .83 (.78)Consumer Selfie .88 (.87) .87 (.82) .88 (.84)Packshot .90 (.86) .91 (90) .91 (.88)
Notes: Results based on fine-tuned CNN from Twitter analysis.Results based on pretrained ImageNet model in parantheses.Accuracy on hold-out test set: 87.88% (84.56%).
55
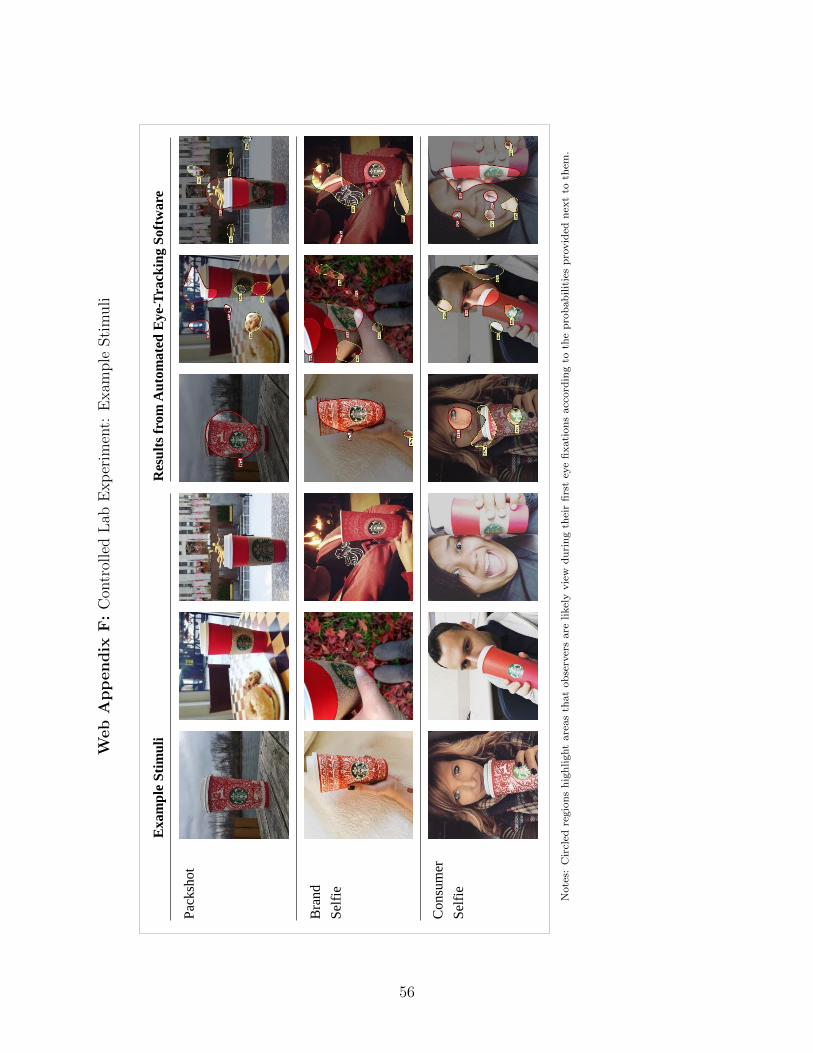
Web
Appendix
F:
Con
trol
led
Lab
Exp
erim
ent:
Exam
ple
Sti
muli
F
Ex
am
ple
Sti
mu
li
Pac
ksh
ot
Bra
nd
Sel
fie
Co
nsu
mer
Sel
fie
Res
ult
s fr
om
Au
tom
ate
d E
ye-
Tra
ckin
g S
oft
wa
re
Note
s:C
ircl
edre
gio
ns
hig
hlight
are
as
that
ob
serv
ers
are
likel
yvie
wd
uri
ng
thei
rfi
rst
eye
fixati
on
sacc
ord
ing
toth
ep
rob
ab
ilit
ies
pro
vid
edn
ext
toth
em.
56

Web
Appendix
G:
Con
trol
led
Lab
Exp
erim
ent:
Ove
rvie
wof
Op
erat
ional
izat
ions
and
Sca
les
Measu
res
Scale
sC
on
stru
ct
Lia
bil
ity
Dep
en
dent
Varia
ble
sB
ran
dA
ttit
ud
eW
hat
isyou
ratt
itu
de
tow
ard
sS
tarb
uck
s?1:
ver
yn
egati
ve,
7:
ver
yp
osi
tive
—P
urc
hase
Inte
nt
Ifth
en
eed
aro
se,
how
likel
yw
ou
ldyou
be
top
urc
hase
aS
tarb
uck
sco
ffee
?1:
ver
yu
nlikel
y,7:
ver
ylikel
y—
Ass
oci
ati
on
sP
lease
list
all
ass
oci
ati
on
syou
have
wit
hth
eS
tarb
uck
sb
ran
d.
free
text
—
Med
iato
rs
Pych
olo
gic
al
Ow
ner
ship
Itfe
els
like
this
Sta
rbu
cks
coff
eeis
min
e.1:
stro
ngly
dis
agre
e,7:
stro
ngly
agre
eα
=.8
9S
tarb
uck
sfe
els
close
tom
eon
that
pic
ture
.1:
stro
ngly
dis
agre
e,7:
stro
ngly
agre
eS
elf-
Ref
eren
ceI
can
per
son
ally
rela
teto
Sta
rbu
cks
on
that
pic
ture
.1:
stro
ngly
dis
agre
e,7:
stro
ngly
agre
eα
=.9
4I
can
per
son
ally
rela
teto
the
sen
der
on
that
pic
ture
.1:
stro
ngly
dis
agre
e,7:
stro
ngly
agre
eW
hen
seei
ng
this
ph
oto
,I
can
pu
tm
yse
lfin
the
shoes
of
the
sen
der
.1:
stro
ngly
dis
agre
e,7:
stro
ngly
agre
eB
ran
dE
nd
ors
emen
tT
he
sen
der
isre
com
men
din
gS
tarb
uck
sto
me.
1:
stro
ngly
dis
agre
e,7:
stro
ngly
agre
eα
=.7
8T
he
sen
der
convey
sa
sin
cere
op
inio
nab
ou
tS
tarb
uck
s.1:
stro
ngly
dis
agre
e,7:
stro
ngly
agre
eT
he
sen
der
istr
yin
gto
per
suad
em
eto
bu
yS
tarb
uck
sco
ffee
.1:
stro
ngly
dis
agre
e,7:
stro
ngly
agre
eM
enta
lS
imu
lati
on
Wh
envie
win
gth
isim
age,
Ica
nim
agin
ed
rin
kin
ga
Sta
rbu
cks
coff
eem
yse
lf.
1:
not
at
all,
7:
ver
ym
uch
α=
.79
Ica
nver
yviv
idly
rem
emb
erth
ela
stti
me
Ih
ad
aSta
rbu
cks
coff
eem
yse
lf.
1:
not
at
all,
7:
ver
ym
uch
Contr
ols
Soci
al
Med
iaU
sage
Ple
ase
ind
icate
how
oft
enyou
use
the
follow
ing
soci
al
med
iap
latf
orm
s:N
ever
,on
cea
month
,on
cea
wee
k,
on
cea
day,
—T
wit
ter,
Face
book,
Inst
agra
m2-5
tim
esa
day,
more
than
5ti
mes
ad
ay
—P
re-A
ttit
ud
esH
ow
isyou
ratt
itu
de
tow
ard
sth
efo
llow
ing
bra
nd
s:1:
ver
yn
egati
ve,
7:
ver
yp
osi
tive
—S
tarb
uck
s,C
oca
-Cola
,G
od
iva
Ch
oco
late
Sen
der
Att
ract
iven
ess
How
att
ract
ive
do
you
fin
dth
ese
nd
erof
that
ph
oto
?1:
ver
yu
natt
ract
ive,
7:
ver
yatt
ract
ive
—L
ogo
Pro
min
ence
How
pro
min
ent
do
you
per
ceiv
eth
eS
tarb
uck
slo
go
on
this
pic
ture
?1:
not
at
all,
7:
ver
yp
rom
inen
t—
Bra
nd
Fam
ilia
rity
Ple
ase
ind
icate
how
fam
ilia
ryou
are
wit
hS
tarb
uck
s.1:
nev
erh
eard
bef
ore
,7:
ver
yfa
milia
r—
57