the potential role of producer and consumer food policies
TRANSCRIPT

1
The potential role of producer and consumer food policies in the EU to sustainable food and nutrition security
Deliverable No. 10.3
Catharina Latka (UBO), Thomas Heckelei (UBO), Miroslav Batka (IIASA), Esther Boere (IIASA), Chiao-Ya Chang (UBO), David Cui (WecR), Marianne Geleijnse (WU), Petr Havlík (IIASA), Anneleen Kuijsten (WU), Marijke Kuiper (WecR), Adrian Leip (JRC), Pieter van’t Veer (WU), Heinz-Peter Witzke (UBO), Friederike Ziegler (RISE)
This deliverable reports on Task 10.3. It tests
the long‐term models of SUSFANS and their
extensions during the project with respect to
their ability to model relevant policies and to
assess policies’ contribution to sustainable
FNS. Instruments under scrutiny include
health and nutrition policies, the Common
Agricultural & Fisheries Policy and market
stabilisation policy.
Version Release date Changed Status Distribution
V1 31/10/2018 - Final Public
This project has received funding from the European Union’s Horizon 2020 research and innovation programme under grant agreement No 633692

SUSFANS
Report No. D10.3
2
SUSFANS Deliverable document information Project name SUSFANS
Project title: Metrics, Models and Foresight for European SUStainable Food And Nutrition Security
Project no 633692
Start date: April 2015
Report:
D10.3
Work package WP 10
WP title (acronym): Foresight
WP leader: IIASA
Period, year: 3, 2018
Responsible Authors: Thomas Heckelei (UBO)
Participant acronyms: UBO, IIASA, WECR, RISE
Dissemination level: Public
Version V1
Release Date 31/10/2018
Planned delivery date: 31/03/2018
Status Final
Distribution Public
Public

SUSFANS
Report No. D10.3
3
ACKNOWLEDGMENT & DISCLAIMER This project has received funding from the European Union’s Horizon 2020 research and innovation program under grant agreement No 633692. Neither the European Commission nor any person acting on behalf of the Commission is responsible for how the following information is used. The views expressed in this publication are the sole responsibility of the author and do not necessarily reflect the views of the European Commission. Reproduction and translation for non-commercial purposes are authorised, provided the source is acknowledged and the publisher is given prior notice and sent a copy.
SUSFANS
Report No. D10.3
4
TABLE OF CONTENT SUSFANS Deliverable document information ....................................................................................................... 2 Acknowledgment & disclaimer ................................................................................................................................... 3 Table of Content ............................................................................................................................................................... 4 List of Acronyms ............................................................................................................................................................... 6 Deliverable short summary for use in media ........................................................................................................ 8 Teaser for social media .................................................................................................................................................. 9 Abstract .............................................................................................................................................................................. 10 1 Introduction ........................................................................................................................................................... 12 2 Link to other WPs and outline of D10.3 ..................................................................................................... 15 3 SFNS assessment of producer and consumer food policies in the EU .......................................... 16
3.1 Scenario overview .......................................................................................................................................... 16 3.2 Health and nutrition policies ..................................................................................................................... 18
3.2.1 Room for manoeuvring diets at national level..................................................................... 19 3.2.1.1 A framework for ranking policy interventions ................................................................. 20 3.2.1.2 Evidence on impact and costs of policy instruments ................................................... 24 3.2.1.3 What room for manoeuvre at which cost? ....................................................................... 35
3.2.2 Diet scenarios based on nutritional considerations ........................................................... 37 3.2.2.1 Food-based dietary guideline scenario ............................................................................. 37 3.2.2.2 Energy-based diet scenario .................................................................................................... 41 3.2.2.3 Nutrition-based diet scenarios with phasing .................................................................. 41
3.2.3 Projected changes in targeted food groups ......................................................................... 42 3.2.4 Conclusions and next steps ......................................................................................................... 44
3.3 Common agricultural policy (CAP) ......................................................................................................... 45 3.3.1 Reducing animal density for improving SFNS? .................................................................... 46
3.3.1.1 Soil nutrient surpluses and LU density in the EU ........................................................... 46 3.3.1.2 Potential policy implications of a LU density restriction ............................................. 49
3.3.2 Scenario implementation in CAPRI ........................................................................................... 50 3.3.2.1 Scenario description .................................................................................................................. 50
3.3.3 Results and implications on SUSFANS indicators ............................................................... 51 3.3.3.1 Resulting livestock densities................................................................................................... 52 3.3.3.2 Quantifiable SUSFANS indicators ......................................................................................... 54
3.3.4 Conclusions and next steps ......................................................................................................... 62 3.4 Common fisheries policy (CFP)................................................................................................................. 63
3.4.1 Background on EU common fisheries policy ....................................................................... 63 3.4.2 EU aquaculture policies ................................................................................................................. 65 3.4.3 Scenario implementation in GLOBIOM and CAPRI ............................................................ 66 3.4.4 Results and implications on SUSFANS indicators ............................................................... 69
3.4.4.1 GLOBIOM CFP results ................................................................................................................ 69 3.4.4.2 CAPRI CFP results........................................................................................................................ 77
3.4.5 Conclusions and next steps ......................................................................................................... 84 3.5 Market stabilisation policies ...................................................................................................................... 86
3.5.1 Background on EU stabilisation policies ................................................................................. 86 3.5.2 EU market stabilisation policies ................................................................................................. 87 3.5.3 The cause of market instability: production shortfalls ...................................................... 89 3.5.4 Results and implications on SUSFANS indicators ............................................................... 93 3.5.5 Conclusions and next steps ...................................................................................................... 101
SUSFANS
Report No. D10.3
5
4 Overall conclusions and next steps ........................................................................................................... 104 5 References ........................................................................................................................................................... 107 6 Annexes ................................................................................................................................................................ 121

SUSFANS
Report No. D10.3
6
LIST OF ACRONYMS BMI Body Mass Index
CAP Common Agricultural Policy
CAPRI Common Agricultural Policy Regionalised Impact Modelling System
CBD Convention on Biological Diversity
CCP Common Commercial Policy
CFP Common Fisheries Policy
CHD Coronary Heart Disease
EBFM Ecosystem-Based Fisheries Management
FBDGs Food-Based Dietary Guidelines
FPAs Fisheries Partnership Agreements
F&V Fruits and Vegetables
GHG Greenhouse gas
GLOBIOM GLObal BIOsphere Management model
IGC International Grain Council
ISSCAAP International Standard Statistical Classification of Aquatic Animals and Plants
LU Livestock Unit
MAGNET Modular Applied GeNeral Equilibrium Tool
MEY Maximum Economic Yield
MFF Multiannual Financial Framework

SUSFANS
Report No. D10.3
7
MSY Maximum Sustainable Yield
N Nitrogen or Nitrate
P Phosphorus or Phosphate
pP per Person
RFMOs Regional Fisheries Management Organisations
SDGs Sustainable Development Goals
SPEI Standardized Precipitation Evapotranspiration Index
SSB Sugar Sweetened Beverages
SFNS Sustainable Food and Nutrition Security
TAC Total Allowable Catch
UNCLOS United Nations Convention on the Law of the Sea

SUSFANS
Report No. D10.3
8
DELIVERABLE SHORT SUMMARY FOR USE IN MEDIA The aim of the research presented in SUSFANS D10.3 is threefold: (1) We identify a set of interesting and relevant policies in the areas of EU health and nutrition, agricultural, fisheries, and storage, i.e. market stabilisation, policies. (2) The SUSFANS modelling toolbox is applied. This gives the possibility to test and debug the most recent model developments following from previous SUSFANS work and identify further necessary improvements towards the end of the project. (3) We test the selected policy measures and assess their impacts on the EU agro-food system applying the SUSFANS metrics framework. Our results show, how the assessed policies may impact EU producers and consumers and how these can contribute to improving sustainability in the food system. Different established macro models are applied for the foresight analysis of the various policies. The policies tested are distinct from each other and are not run with all models available in the toolbox. In this sense, the presented research serves as a pre-test for the final foresight work in SUSFANS which will involve combined approaches of policies and models. Nevertheless, our results give already an insight on the directions of impacts as well as on the applicability and quantifiability of the metrics framework.
The assessment of health and nutrition policies is based on an overview about the variety of discussed and implemented policies in this area. A hierarchy of policy instruments is composed taking into account effectiveness of policy measures and in how far individuals’ choices may be constrained by these. A combination of market-based (like food taxes and subsidies) and information-based instruments (e.g. campaigns) is designed as a promising scenario for modelling and actual implementation.
The analysed agricultural policy is a restriction of livestock density in order to avoid over-fertilization and soil nutrient surpluses arising from excessive availability of manure. An EU wide restriction would improve the quantified environmental sustainability indicators, however reducing EU competitiveness on agricultural markets due to export decreases.
In contrast to that, the tested fisheries policies (capture at maximum sustainable/ economic yield, aquaculture production growth) have a positive influence on EU seafood production and competitiveness. Fishing at maximum sustainable yield (MSY), and even more at maximum economic yield (MEY), is known to reduce

SUSFANS
Report No. D10.3
9
environmental impacts compared to other scenarios. However, further work is needed to assess these improvements also for fisheries in the models.
Measures under both the EU’s common agricultural policy (CAP) and common fisheries policy (CFP) reveal hardly any effect on EU food consumption and nutrition. Domestic production changes tend to influence trade balances rather than domestic consumption. For the CAP scenario this means that a restriction of animal density in the EU would likely shift negative environmental impacts from the EU to other countries.
Resulting from the storage policies assessment, increased storage facilities for crops vulnerable to climate change and weather extremes help to reduce price volatility caused by yield shocks. They furthermore increase openness and competitiveness.
The modelling outcomes highlight the interrelations of EU policies to world markets and vice versa. Therefore, trade effects need to be taken into account when designing EU policies for reaching EU food and nutrition security in a truly sustainable way. Absent effects on the consumer side in some of the tested producer policies furthermore stress the need for a combined and harmonized attempt of producer and consumer policies.
TEASER FOR SOCIAL MEDIA Harmonized consumer and producer policies are needed to achieve sustainable EU food and nutrition security. We identify a set of key aqua-agro-food system policies and apply the SUSFANS metrics framework to assess the policies’ impact on important indicators. While approaching several policy targets, trade-offs and leakage effects, which stem from impact of EU policies to non-EU regions, require further investigation.

SUSFANS
Report No. D10.3
10
ABSTRACT EU sustainable food and nutrition security is no sure-fire success. The future of the agro-food system is uncertain and subject to different macro-level trends. Previous analysis revealed the role of food system drivers creating challenges and opportunities for dietary and environmental improvements under certain future constellations. However, these challenges and opportunities need to be addressed by policies to allow for actual improvements in the sustainability performance of EU food systems, for people, planet and profit. In this deliverable, an assessment and pre-test of potential policy measures is carried out. The policy analyses are contrasted to a ‘business-as-usual’ baseline scenario with current trends of food system drivers. We apply the SUSFANS modelling toolbox in order to test relevant policy measures in four distinct aqua-agro-food policy sectors.
Regarding health and nutrition of the EU population, we provide a ranking of potential dietary policies and interventions based on their effectiveness, implementation costs and restrictiveness for consumers and producers. Based on this overview, options for health and nutrition policy are designed containing a mixture of different policy instruments. These apply – in line with the allocation of policy responsibilities in the EU - at the level of individual member states and not at the realms of an EU policy. In the context of the Common Agricultural Policy (CAP), we assess the impact of a livestock density restriction on EU agricultural areas. Results indicate a reduction of soil nutrient surpluses (-9 to -13%) and of greenhouse gas emissions (-9%) at EU average and considerably stronger in the livestock density and over-fertilization hotspots. Trade openness restricts the impact on food consumption and dietary change of EU consumers. Three Common Fisheries Policies (CFP) are tested with the newly developed fish modules of GLOBIOM and CAPRI: Directing capture in EU waters to levels that keep fish stocks at the maximum sustainable yield (MSY), or at the maximum economic yield (MEY), and the implementation of national aquaculture growth plans composed by EU member states. Our results show limited policy impacts due to the relatively small size of the EU fish producing sector with some trade but limited consumption changes. Finally, different storage policies are tested with the new short-term volatility module of GLOBIOM. The scenarios reveal that storage availability and intervention prices reduce price volatility caused by yield shocks. The assessments illustrate that individual, yet unaligned policy measures can already contribute significantly to reaching sustainable food and nutrition security. On the way to the final foresight assessment extensions are required

SUSFANS
Report No. D10.3
11
regarding a) metrics quantifiability, b) the harmonization of metrics computation approaches, and c) smaller model improvements.

SUSFANS
Report No. D10.3
12
1 INTRODUCTION EU sustainable food and nutrition security is no sure-fire success. The future of the agro-food system is uncertain and subject to different macro-level trends. Current, high, and low challenges affecting food system drivers have been compared in D10.2 (Frank et al., 2018). Their analysis revealed opportunities for nutritional and environmental improvements under certain, opportune future constellations. However, just these opportunities need to be taken up by policies to result in actual improvements for people, planet and profits. Moreover, less favourable future trends would increase the need for effective policy measures even more. Before combining foresight on macro-drivers (population, economic growth, trade, and climate) and EU agro-food policies as planned in SUSFANS D10.4, an assessment and pre-test of potential policy measures is carried out in the present deliverable. The policy analyses are contrasted to a ‘business-as-usual’ baseline scenario considering current trends in food system drivers. We apply the SUSFANS modelling toolbox in order to test relevant policy measures in four distinct agro-food policy sectors. Doing so we get first insights on a) scope and direction of model results and required further morel improvements b) the applicability of the SUSFANS performance metrics framework, needed adjustments, and missing pieces to enable quantification of the different variables, and c) likely implications on sustainable food and nutrition security indicators arising from tested policy measures.
Regarding health and nutrition of the EU population, previous work in the SUSFANS project stressed the need and direction for dietary changes (e.g. Mertens et al. (2018)). Results from previous foresight assessments (D10.1 (Havlík et al., 2018) and D10.2 (Frank et al., 2018)) have shown that the required consumption changes will even be more challenging in the future. Here, we provide a ranking of potential dietary policies and interventions based on their effectiveness, implementation costs and restrictiveness for consumers and producers. Based on this overview, a health and nutrition policy is designed that will be implemented in D10.4. It will contain a mixture of different policy instruments, namely food taxes and subsidies and further interventions that potentially induce a preference shift at consumer level. For the purpose of this analysis, this policy mix will be considered as if implemented at EU level although the policies lie in the remit of individual member states in accordance with the current allocation of policy responsibility in the EU governance framework.
On the producer side, we assess an agricultural policy composed as a livestock density restriction on EU agricultural areas with the modelling system CAPRI. The
SUSFANS
Report No. D10.3
13
restriction is dependent upon local soil nutrient needs and aims for a reduction of soil nutrient surpluses as well as agricultural greenhouse gas emissions. The results indicate a reduction of soil nutrient surpluses (-9 to -13%) and of greenhouse gas emissions (-9%) at EU average. Especially in the livestock density and over-fertilization hotspots, nutrient surpluses are even more strongly affected as a consequence of the policy. However, EU agricultural competitiveness is slightly reduced. Food consumption of EU consumers does not change much since changes in domestic livestock production are offset by increasing imports.
In the context of EU seafood production, three common fisheries policies (CFP) are tested with the newly developed fish modules of GLOBIOM and CAPRI: Directing capture in EU waters to levels that keep fish stocks at the maximum sustainable yield (MSY), or at the maximum economic yield (MEY), and the implementation of national aquaculture growth plans composed by EU member states. Our results stress the relatively small size of the EU fish producing sector a) compared to the overall EU agricultural sector and b) in contrast to global seafood production. Strong impacts are found on trade also with respect to aquaculture feed components. EU seafood consumption hardly changes. Capture and aquaculture production are influencing each other to some extent.
Under the expectation of more frequent extreme climatic events, the need for farm risk management and possibly a higher availability of storage facilities for likely affected crops becomes evident. Therefore, different storage policies are tested with the new short-term volatility module of GLOBIOM. In these scenarios, storage facilities are available at a limited or unlimited amount and include a guaranteed intervention price when selling crops to storage. The scenarios reveal that storage policies help to reduce price volatility caused by yield shocks. They furthermore increase openness and competitiveness, a perhaps somewhat surprising result. Intervention prices on the other hand can have a distortive effect.
The assessments illustrate that individual, yet unaligned policy measures can already contribute significantly to reaching sustainable food and nutrition security, but trade-offs between policy goals may be unavoidable. However, on the way to the final foresight assessment in D10.4, further extensions are required regarding a) metrics quantifiability, b) the harmonization of metrics computation approaches, and c) smaller model improvements. Furthermore, a full list of policy target and policy vision values is needed for a transparent interpretation of the modelling results in the scope of SUSFANS indicators and variables. Only then, a
SUSFANS
Report No. D10.3
14
more comprehensive quantitative assessment of the metrics framework and a communicable visualization of the results can be achieved.

SUSFANS
Report No. D10.3
15
2 LINK TO OTHER WPS AND OUTLINE OF D10.3 The report at hand can be summarized as a foresight exercise building on numerous aspects of foregoing project work. One of the objectives is the application of the SUSFANS conceptual framework and the quantification of SUSFANS performance metrics and related, more detailed indicators and variables for testing possibilities of changing the food system (D1.3, Zurek et al., 2017a). In D6.2, Zurek et al. (2017b) it is announced that the foresight exercise will be used to assess responses of the agro-food system through policies in form of an ex ante analysis. The SUSFANS toolbox and the development of model linkages and new model features in WP9 (Rutten et al., 2016) are applied and tested in the policy assessment presented in the following chapters. Thereby, gaps for further improvements are discovered that are planned to be addressed in the forthcoming SUSFANS D10.4.
The results from this deliverable will be used for WP11 activities on creating awareness and communicating policy implications on the agro-food system with respect to sustainability and food and nutrition security.
In the following chapter, an overview on the policy scenarios under investigation in this report and the respectively employed models is given. Detailed descriptions and discussions of problem and policy backgrounds, model implementations, results and implications on SUSFANS indicators are provided for each policy analysis separately. The impacts on sustainable food and nutrition security are assessed for EU health and nutrition policies (3.2), the common agricultural policy (3.3), the common fisheries policy (3.4) and market stabilisation policies (3.5). The report concludes with a wrap-up of the assessments and research gaps to be addressed and closed in SUSFANS D10.4 (4).

SUSFANS
Report No. D10.3
16
3 SFNS ASSESSMENT OF PRODUCER AND CONSUMER FOOD POLICIES IN THE EU
The foresight assessment is carried out with three long-run macro models (and their modified versions) that are part of the SUSFANS model toolbox. The connection to the micro-level dietary model is still under development and not yet applied in the presented analysis. Potential agro-food policies are investigated regarding their future implications on the food system.
3.1 Scenario overview The underlying scenario narratives are in line with scenario drivers defined in D10.1 (Havlík et al., 2018) and assessed in D10.2 (Frank et al., 2018). Producer and consumer food policies are implemented on top of these narratives. The scenario narratives taken from previous SUSFANS work simulate either ongoing (REF0), high (REF-) or low (REF+) challenges to EU food and nutrition security in the future. In D10.1 a business as usual baseline, REF0, was developed. It represents the reference scenario with respect to which policies are tested in the present report.

SUSFANS
Report No. D10.3
17
Table 1: Policy scenario overview
Scenario narratives
Policies
REF0 REF- REF+
Baseline ● Current EU consumer and producer food policies Health and nutrition (MAGNET)
● Food-based dietary guideline scenario ● Energy-based diet scenario
CAP (CAPRI)
● Livestock density restriction dependent upon regional soil nutrient needs (LU density restricted)
CFP (CAPRI, GLOBIOM)
● Maximum sustainable yield (MSY) ● Maximum economic yield (MEY) ● National aquaculture growth plans (Aqua Plan)
Market stabilisation (GLOBIOM-X)
● Yield shock without storage possibilities (NoStore) ● Yield shock with current storage capacities in the
EU (Store) ● Yield shock with unlimited storage capacities in the
EU (StoreUnlim) ● Yield shock with unlimited storage capacities in the
EU and intervention prices (StoreUnlimInt)

SUSFANS
Report No. D10.3
18
3.2 Health and nutrition policies The case for moving Europeans towards healthier and more nutritious diets is well established: 33 million Europeans are at risk of malnutrition while at the same time 20 percent of the population is obese. With an ageing population the public health toll of individual diet choices is expected to rise. Currently EU member states already spend 0.8% of GDP on diseases at least in part associated with diets (heart attacks, diabetes and cancer) (Fabbri, 2017). Moving towards a healthier aging population would thus have great individual as well as societal benefits.
In contrast to the common agricultural policy (CAP) governing agricultural production there is no equivalent European food or diet policy. Several calls are made in this direction, for example arguing for an integrated common agricultural and food policy to help the European food supply chain from farm to fork deal with the upcoming societal challenges (Fresco and Poppe, 2016). For now the EU policy setting is that Directorate General for Health and Food Safety (SANTE) addresses sustainability and public & consumer health separately from the food chain while the European Food Safety Authority (EFSA) addresses food safety from a supply chain perspective and advises on recommended intakes. There are thus coordinated EU level policies regarding agricultural production, food safety and nutritional recommendations, while public health measures are defined at member state level. At country level definition and implementation of food and health policies are commonly done separate from economic and environmental policies (van’t Veer et al., 2017).
In the absence of a common EU food policy the Sustainable Development Goals (SDGs) become the effective shared policy commitment at EU level, notably SDG2 (End hunger, achieve food security and improved nutrition and promote sustainable agriculture), SDG3 (Ensure healthy lives and promote well-being for all ages) and SDG 10 (Reduce inequality within and among countries) (Fabbri, 2017). A second, although indirect, set of policies are those linked to the Paris agreement (COP 21) due to the potentially large repercussions of climate change adaptation and mitigation policies for the food system (Fabbri, 2016). The search for healthy as well as sustainable European diets forms the core of the SUSFANS project and combined impacts of various policies will be taken up in the upcoming D10.4 deliverable. Given the observed gap between recommended and actual intakes in the four SUSFANS case study countries (Mertens et al., 2018) and the projected trends in the business-as-usual scenarios (reported in D10.2 (Frank et al., 2018)) we focus here on the scope for steering diets through policies or

SUSFANS
Report No. D10.3
19
other interventions to support the definition of an integrated approach to sustainable and healthy diets in D10.4.
The next section reviews the available evidence on the effectiveness of diet policies set within a conceptual framework of behavioural change, aiming to establish the room for manoeuvring diets at national level based on past interventions. The third section then establishes the direction in which, from a nutritional point of view, diets should be moving given the currently observed diets. The fourth section pulls these two threads together by comparing these desired changes with the projected developments in the three contextual SUSFANS scenarios (REF0, REF- and REF+) to establish the nutritional challenges faced by the European food system. The final section concludes and outlines next steps.
3.2.1 Room for manoeuvring diets at national level The most visible health consequence of past and current diets, obesity, already afflicts one in five Europeans (Fabbri, 2017). While there is variation in obesity and overweight by gender and education, the extent of the weight problem clearly extends beyond small subgroups in the population. A national level and persistent change in diets is needed to change the tide, not only in terms of overweight and obesity but also to reduce less visible effects of unhealthy diets like diabetes and cancer.
While there is already an extensive body of literature on how changes in diets may serve health and/or environmental objectives (see for example Springmann et al., 2016; Tilman and Clark, 2014; Tukker et al., 2011; Westhoek et al., 2014; Wolf et al., 2011), these existing modelling studies tend to quickly gloss over the required instruments - improved diets are mostly forced upon the model through taxes/subsidies or costless preference shifts. While useful in assessing resulting food system changes and health changes the lack of grounding of the choice of policy instruments is likely to reduce their impact of the policy formation process. Attention for the framing and choice of instruments is especially relevant since the decision what to eat is made by every single individual several times a day. The target group is therefore not only much larger and more diverse than for example when setting up a common agricultural policy, it also touches a very personal choice framed by among others culture, habits and marketing. Factors linked to identity and history are not easily quantified and tend to be ignored in policy design (Fox and Smith, 2011).

SUSFANS
Report No. D10.3
20
Without pretending to solve this complex policy design issue for once and for all in the SUSFANS project, we target our contribution to this policy focussed deliverable not on running yet another scenario along the lines of the already existing literature, but instead on finding more solid ground for defining policy instruments for the large scale behavioural change demanded from a future European diet policy. We start by placing diet policies into perspective of established theories of behavioural change from the public health domain and use this to structure a review of existing evidence on the effectiveness of diet interventions and their costs, which is an often overlooked part in modelling exercises of diet policies.
3.2.1.1 A framework for ranking policy interventions National level changes in diet through policies touch on the domain of public health. The discussions on if and how to intervene are strongly influenced by the Nuffield intervention ladder developed in the 2007 Nuffield Council on Bioethics report “Public health: ethical issues” (Hepple and Nuffield Council on Bioethics, 2007), reproduced in Figure 1. The ladder is clearly framed as choosing a point in between two extremes of no intervention (at the bottom) and no individual freedom by full control of choices (at the top). Griffiths and West (2015) argue that this framing may unnecessarily hamper the development of public health policies by always requiring a justification of the loss of individual freedom. They argue that in line with the subtleties in the Nuffield report (that easily get lost in the ladder) as well as a in the underlying political theory of John Stuart Mill a more balanced intervention ladder can be developed. The main differences is contrasting interventions that promote public health at the expense of public liberty (thus requiring justification) from interventions that do not curtail individual choice (Figure 2).

SUSFANS
Report No. D10.3
21
Figure 1: Nuffield intervention ladder (Hepple and Nuffield Council on Bioethics, 2007, p. 42)
The framework of Griffiths and West (2015) for designing public health interventions contains six measures where policies aim to influence individual choice without limiting the individual choice. Some of these do not sit well with the regular assumption in neoclassical economic models of perfect information (nudging by changing the default situation, providing information or education), but can be captured as change in preferences implicitly assuming that the information available to consumers has been updated for all at the same time. Other interventions might not affect the individual choice of consumers, but do constrain the freedom of actors in the supply chain (regulating the default situation, requiring that healthy options are available on menus).

SUSFANS
Report No. D10.3
22
Figure 2: A balanced intervention ladder (Griffiths and West, 2015, p. 1069)
The appealing feature of the balanced ladder of Griffiths and West (2015) is that it provides a ranking of commonly used policy instruments grounded in long line of thinking on political economy and whether or not the state should intervene in individual decision making on diets. Focussing on the consumer perspective (thus ignoring the restrictions or costs imposed on supply chain actors) we reorder the ladder from most to least preferred from a consumer liberty point of view and identify the most commonly used or proposed policy instruments with each step. We furthermore indicate the implications for consumers and supply chain actors (not explicit in their paper) which also affects the ordering assuming that less interference with choice is better (Table 2).
Compared to the framework of Griffiths and West (2015) we not only reorder, but also add some finer distinctions for information provision. We separate information campaigns, for example advising to eat fruit and vegetables, from compulsory information by supply chain actors, like mandatory nutritional information. While both provide information to consumers the latter is deemed less desirable in terms of limiting the freedom of for example processed food

SUSFANS
Report No. D10.3
23
producers or restaurant owners. The ranking in terms of infringing on the freedom of choice of consumers or supply chain actors provides an alternative perspective on intervention design to the economic evaluation of policies in terms of welfare losses (Irz et al., 2016) or in terms of costs of intervention implementation versus benefits or impacts attained.
Table 2: Ranking policy instruments based on the balanced intervention ladder
Intervention ranking (number refers to rows in Table 2 of Griffiths and West (2015)
Instrument in modelling
Consumer choice Supply chain actors choice
0 Do nothing (0) None Not restricted Not restricted
1 Provide information (+1) Preference shift Not restricted Not restricted
2 Educate for autonomy from choice manipulation or (+2)
Preference shift Not restricted Not restricted
3 Compulsory information on products
Preference shift Not restricted Restricted
4 Nudge through changing default policy (0)
Preference shift Not restricted Restricted
5 Ban marketing aimed at agents with limited decision-making capacity (e.g. children) (+2)
Preference shift Not restricted Restricted
6 Ensure healthy choices are available (+3)
Product variety Not restricted Restricted
7 Enable choice by behavioural change programs (+4)
Preference shift Not restricted, but requires spending effort/time
Restricted
8 Guide choices through incentives (-1)
Subsidies Restricted Restricted
9 Guide choices through disincentives (-2)
Taxes Restricted Restricted
10 Restrict choice through regulation (-3)
Regulation Restricted Restricted
11 Eliminate choice (-4) Regulation Restricted Restricted

SUSFANS
Report No. D10.3
24
3.2.1.2 Evidence on impact and costs of policy instruments Instruments that rank high from a political economy point of view in Table 2 may not be sufficient in terms of achieving the desired large scale transformation in diets. We therefore review the evidence of interventions grouped in accordance with the desirability ranking of Table 2. The first observation from the resulting overview in Table 3 is that our review does not include any references to option 2, educating consumers in terms of marketing strategies employed to manipulate their choices. One or more examples of all other interventions are found, with more or less evidence on their effectiveness.
Many modelling studies and also some studies evaluating actual fiscal policies targeted at dietary shifts have been conducted in the recent past. Numerous review studies have been composed in order to compare and assess the dietary, health and welfare impacts found in these studies. Due to the divergence in study types, variations in the policy set ups (e.g. tax rates), targeted food groups or nutrients, the consideration of substitution and distributional effects, and the combined analysis of policy packages, the results of these studies are difficult to compare, and they differ and are partly even contradictory.
Thow et al. (2014) review 38 studies analysing the effectiveness of taxes and subsidies on food consumption and find a consistent effect on improved intakes in terms of obesity and chronic disease prevention. Across studies based on different methodologies, taxes and subsidies between 10% and 20% show effects on the target food consumption. The authors conclude that more interventions studies and those testing implemented fiscal policy levels are needed, especially as part of a broader intervention package.
Nutrition-driven taxes have become a popular measure in the recent past, since their comparable effectiveness is validated increasingly Mazzocchi (2017). Mostly these taxes fall below 10% of the retail prices, even though some countries in Central and South America have implemented higher levels recently (Mazzocchi, 2017). Most food taxes that have been implemented so far were targeted at sugary drinks, in some cases taxes were imposed on foods high in saturated fat or salt (Mazzocchi, 2017). To increase public acceptance, government revenues from food taxes could be invested in public health measures (Garnett et al., 2015).
Health improvements arising from sugar or fat taxes, or subsidies on fruits and vegetables (F&V) are potential however, evidence on magnitude is scarce and undesired substitution effects may arise from single nutrient taxes (Garnett et al., 2015). One problem of monetary measures for adopting healthier diets is the

SUSFANS
Report No. D10.3
25
missing intrinsic motivation and the risk of falling back to unhealthy eating patterns as soon as the incentive is removed (Garnett et al., 2015).
Besides effects on consumption and health, food taxes likely impact profitability, competitiveness and employment in the entire food supply chain (ECSIP Consortium, 2014). In sustainability-focussed analysis, evaluated food taxes are often designed in order to reduce emissions. The implied consumption and health effects depend very much on the tax scenario set up (Garnett et al., 2015). To achieve health improvements and further sustainability goals (e.g. reduced environmental impacts, impacts on actors along the supply chain) fiscal measures and intervention levels need to be chosen carefully (Garnett et al., 2015).
Studies addressing interventions increasing vegetable consumption are reviewed by Appleton et al. (2016). Interventions based on hedonic, environmental or cognitive factors indicate increases in vegetable acceptance and consumption however, effects are small and inconsistent in tendency. The interventions described are set up in an experimental or family environment.
Reisch et al. (2017) find generally high support for nudges among European consumers with however, some differences between countries (lower approval rates e.g. in Denmark compared to e.g. France or Italy). Nudges include government campaigns, labels, choice architecture in food stores, or choice editing i.e. meat-free days in canteens. The study focuses on the acceptance of nudges and does not assess impacts of actual consumption or purchases.
Darmon and Drewnowski (2015) discover a tendency for nutrient-dense foods and healthy diets to be comparably expensive. In order to stimulate a change in dietary patterns economic interventions may be helpful, however, these may have a negative effect on social inequalities in dietary quality. Their review focuses on socioeconomic differences in relation to dietary quality and food expenses, but does not address food policies as such.
Otero et al. (2018) argue that income inequality and the market shaping power of food producers and distributors (which have a strong influence on prices and offers) shape consumers’ food choices.
To be able to design policies based on findings regarding food choices and consumption behaviour, Leng et al. (2017) stress that potential unintended consequences, needs of particular population groups and possible compliance and measuring difficulties need to be understood. Modelling attempts can contribute the needed evidence for effective policy measures.

SUSFANS
Report No. D10.3
26
Similarly, Mozaffarian et al. (2018) conclude the need for governments to assess effectiveness, disparities and unintended consequences of food policies and that multisector and multilevel approaches are required. The authors provide a comprehensive overview on good policy strategies, including their strengths and weaknesses, however, without referring to the potential magnitude of consumption changes.
A dietary policy debate in Western countries with focus on obesity- and health-related issues has been arising in the recent past and has led to an increasing number of implemented interventions especially targeted at children and people in lower socio-economic groups. Fox and Smith (2011) stress that besides health, various factors related to identity and history influence food choices and dietary habits, which is often not recognised in policy designs.
Fox and Smith (2011) and Kaldor (2018) discuss the ethical problem behind dietary policies and their intrusiveness when restricting individuals’ and markets’ freedoms.
Mazzocchi (2017) review evidence on the effectiveness of different types of health and nutrition policies implemented at national levels using counterfactual methods. Due to the lack of long-term data that is needed for a profound analysis of health and weight changes, the evaluation is limited to impacts on short-term variables and intakes. While information measures are mostly implemented, school food interventions and more restrictive policies like labelling or bans are increasingly taken up. The EU prepared the ground for the implementation of regulations at national level. Fiscal measures can have an impact on consumption, especially when the induced price change is large. On top of the price effect, the signalling effect leads to an increase in awareness, which is combined with information campaigns and social marketing a promising health policy bundle (Mazzocchi, 2017).
Garnett et al. (2015) assess a broad range of literature related to sustainable and healthy food consumption including literature on attitudes to particular foods and consumption changes, model-based and experimental studies on interventions, and actual past policy and economic changes. While evidence for measures targeting an increase in fruit and vegetable consumption or a decrease in sugar consumption is widely available, interventions addressing meat, fish and palm oil consumption are rarely analysed in the context of health impacts (Garnett et al., 2015).

SUSFANS
Report No. D10.3
27
Capacci et al. (2012) compose a structured review on food and health policies in Europe. They classify 129 policy interventions into a systematic scheme of intervention types and find a need for further research focussing on actual behavioural change as many studies analyse the effect on attitudes.
Hyseni et al. (2017) find that multi-component and price interventions as well as reformulation appear to be effective policies in terms of stimulating healthier eating patterns and performed better than food labelling or food restrictions. The authors conduct a review on systematic and non-systematic review studies on dietary policies. They provide a comprehensive overview for comparing policy impacts of different types of policies.
Pérez-Cueto et al. (2012) evaluate policy interventions on awareness, consumption and health impacts across EU member states. The authors identify the need for comparable and harmonized indicators to measure policy effectiveness.
Combined nudging interventions (visibility, accessibility and availability of products) are found to increase sales of healthy products (3-12%) and to decrease sales of less healthy items (2-39%) (Wilson et al., 2016).
Hoek et al. (2017) conduct choice experiments and find a stronger effect on shifting to healthier food choices when the price is decreased and when healthier, but similar alternative products are provided compared to the effect of health or sustainability labels.

SUSFANS
Report No. D10.3
28
Table 3: Evidence of effectiveness of interventions
Description Target group Impact Size/direction of impact Cost of intervention Limitations Sources 1 - Provide information 1 Social
marketing and public information campaigns (e.g. UK’s 5-a-day campaign (Pérez-Cueto et al., 2012))
General population with focus on overweight/obese
‐ Increase consumption of fruit and vegetables
‐ Reducing salt intake ‐ Healthier eating, awareness ‐ Industry food reformulation
triggered through campaigns
‐ While mass media campaigns have a very large coverage, the effect on obesity reduction is very small (about -0.2%) (Sassi et al., 2009)
‐ Awareness increase ‐ Effective measure with significant and positive
impacts (however, often small) ‐ Increased servings of fruits and vegetables per
day (+0.2 to +0.77 servings) (Capacci et al., 2012)
‐ US 2.27$ per capita (advertising (2/3) and staff to supervise intervention (1/3))
‐ 53 billion $ PPP in all OECD countries, 1.8$ PPP per capita (in the whole population) (Sassi et al., 2009)
‐ Short-run campaigns fail given current choice environment
‐ Real impact requires decade-long campaign
‐ Information campaigns are found to increase awareness but rarely impact consumption and health and should therefore be accompanied by other interventions (Pérez-Cueto et al., 2012)
(Brambila-Macias et al., 2011) (Mazzocchi, 2017) (Pérez-Cueto et al., 2012) (Capacci et al., 2012)
1 Nutrition education
Children in school; general population (if dietary guidelines are regarded as education measure as done in (Mozaffarian et al., 2018), or adult training sessions (Pérez-Cueto et al., 2012))
‐ Non-homogeneous impact on healthy eating across the population
‐ Among men in Northern France it is found that nutrition knowledge influences food and nutrient intake, persons with higher nutrition knowledge show lower intakes of fat and monounsaturated fat of animal origin (Dallongeville et al., 2001)
‐ A study in England shows that participants with the highest nutritional knowledge are 25 times more likely to meet intake recommendations than those with the lowest nutritional knowledge (Wardle et al., 2000)
‐ A study based on survey data from Taiwan shows that obesity health risk knowledge is positively related to BMI for males with a low BMI and negatively for extremely overweight persons (Kan and Tsai, 2004)
‐ No available evidence (Mazzocchi, 2017) ‐ Adult training sessions in Portugal led to a
reduced energy intake of 6.3%, a reduced cholesterol intake of 9.2%, a reduced total fat intake of 12.2% and a reduced saturated fat intake of 15.6% while fibre intake increased by 7.6% (Pérez-Cueto et al., 2012)
‐ 1% increase in funding in USA results in 0.006% decrease in BMI per year
‐ Knowledge gaps, and thus scope for intervention, in of adults unclear
‐ Nutrition education in the form of cooking classes are criticized to neglect the consideration of local, contextual spatial factors (Fox and Smith, 2011)
(Brambila-Macias et al., 2011; Mazzocchi, 2017)

SUSFANS
Report No. D10.3
29
‐ Much lower (unhealthy) snack consumption in treated group (16% compared to 76% proportion of children), increase of healthy snack consumption (+3% proportion of targeted children) (Capacci et al., 2012)
3 - Compulsory information on products 3 Nutritional
labelling of products (i.e. guideline daily amounts, traffic lights, certified logos)
General population & food industry (reformulation incentive of disclosure)
‐ EU rules on voluntarily repeated nutrition information in the principal field of vision (‘front of pack’) and mandatory (‘back of pack’) nutrition declaration (in effect since December 13, 2016)
‐ 2/3 people read label, of these minority of health conscious read nutrition label
‐ Consumer welfare increases by enabling informed choice (not necessarily healthy)
‐ Avoidance of specific nutrients seen as bad
‐ Simpler labels increase impact
‐ Awareness for issue ‐ Industry food reformulation
triggered
‐ it does not necessarily encourage people to buy products rich in good nutrients (e.g. fibre) whereas labelled information on “bad nutrients” e.g. fat affect perception on disease risk. There is no effect of health claims on purchase intention and only a weak one on disease risk perception (Garretson and Burton, 2000)
‐ UK consumers show a strong preference to reduce the intake of nutrients labelled in red in the traffic light system (Balcombe et al., 2010)
‐ Effective in inducing reformulation ‐ Less effective, suggestive for food intake ‐ Specific measures are more effective than
broad initiatives ‐ Calorie labels on sugared beverage were
found in one study to even increased sales by 7.3% (Jue et al., 2012)
‐ Traffic light signals increased sales of the healthy option (by 2-10%) and decreased sales of the unhealthy one (by 0.3-24%) (impacts differ by study and products) (Wilson et al., 2016)
‐ Decreased average daily intake of fat (-6.9%), saturated fat (-2.1%), cholesterol (-6.9mg), sodium (29.58mg), increased average intake of fibre by 7.51g (Capacci et al., 2012)
‐ Labelling induced reformulation reduced products’ fat and salt contents (Capacci et al., 2012)
‐ Social benefits outweigh costs
‐ 53 billion $ PPP in all OECD countries, 2.16 $ PPP per capita (in the whole population) (Sassi et al., 2009)
‐ Front-of-pack labelling may increase impact
‐ No information on alternative products high in good nutrients (i.e. encouraging healthier substitution)
‐ Causal identification of impact on BMI or health is difficult as various diet policies are implemented at the same time
(Brambila-Macias et al., 2011) (Mazzocchi, 2017) (Capacci et al., 2012)
3 Nutrition information on menus (in (Mazzocchi, 2017) part of
Restaurant customers
‐ Consumer welfare increases by enabling informed choice (not necessarily healthy)
‐ Uncertain impact on diets and obesity
‐ No data ‐ Limited impact on energy intake, if any
‐ Costs may close small restaurants, reducing consumer choice
‐ So far the only mandatory adoption is in the state of NY
(Brambila-Macias et al., 2011)

SUSFANS
Report No. D10.3
30
nutrition labelling)
4 - Nudge through changing default policy 4 Choice
Architecture, Measures targeting accessibility to healthy foods and availability of unhealthy foods
General population
‐ Nudging (in particular: altering product properties, placement) is found to increase the choice of fruit and vegetables significantly, however the effect is only small (Broers et al., 2017)
‐ Food choices can be influenced by manipulating food order and proximity (Bucher et al., 2016)
‐ Nudging effects may differ by set up, products, preferences for these; it may change product purchase shares by 4% to 25% (effect magnitudes by different studies, see (Bucher et al., 2016))
‐ Shelf-product placement and visibility can affect how often a product is chosen, however, results between studies vary strongly (0-44%) and are hardly comparable (Wilson et al., 2016)
‐ High availability of healthy snacks (3/4 of all snacks) makes healthy choice 2.9 times more likely (van Kleef et al., 2012)
‐ Even though choice architecture potentially reduced calorie intake, existing studies are poor in quality and rarely investigate a real-life setting (Skov et al., 2013)
‐ Missing research on the magnitude of nudging effects on food intake particularly in the long-run (Bucher et al., 2016)
(Garnett et al., 2015) (Mazzocchi, 2017) (Mozaffarian et al., 2018)
5 -Ban marketing aimed at agents with limited decision-making capacity (e.g. children) 5 Advertising
control (i.e. restriction on advertisement especially of sweets for children, could also include mandatory health message advertising as done in France (Pérez-Cueto et al., 2012))
Unhealthy products marketed to children
‐ Exposure reduction ‐ Some (weak) evidence of
small reductions in unhealthy food consumption
‐ No data provided ‐ Likely impact small since targeted on small
part of products consumed by children and general advertising still allowed
‐ Only comprehensive regulation (strict ban) is found to be effective
‐ Fast-food advertising ban reduced fast food purchase propensity by 13% (Dhar and Baylis, 2011)
‐ Change in eating or food purchasing habits by 17-21% (Capacci et al., 2012)
‐ Food advertising regulations are found to reduce obesity by 5% across the whole population and by 7.5% for 25 year olds (Sassi et al., 2009)
‐ Unclear who bears cost of ban
‐ 38 billion $ PPP in all OECD countries, 1.4$ PPP per capita (in the whole population) (Sassi et al., 2009)
‐ Exposure impact partially diluted by lack of coordination in EU & restrictions on limiting advertising from other countries
‐ Potential substitution by other (general) advertising promoting unhealthy eating
‐ The impact is suggestive and short-term
‐ Not all media channels included, limited time slots make instrument ineffective
‐ Industry may try to avoid regulation by switching advertisement channels or adapting packaging/ food
(Brambila-Macias et al., 2011) (Mazzocchi, 2017) (Garnett et al., 2015) (Capacci et al., 2012)

SUSFANS
Report No. D10.3
31
formulation (Lee et al., 2017)
6 -Ensure healthy choices are available 6 Food
availability in school or workplace
Students and working population
‐ Free or subsidized school meals increase awareness and intake of fruit and veg
‐ Nutrition information + health activities + catering increases fruit and veg + physical activities of workers; effect seems to persist after retirement
‐ Ban of vending machines, unhealthy foods and soft drinks in and near schools is effective in changing school eating behaviour
‐ Meatless Mondays (Garnett et al., 2015)
‐ A meta-analysis on school food programs revealed an increase of 0.25 portions of F&V intake per day among school children between 5-12 years (Evans et al., 2012)
‐ The Italian programme “Eating Together” reported an increase of a comparably healthy snack (yoghurt) by 13% among kindergarten and 8% among school children, a 13% increase of fruit consumption among adolescents and a 6.3% decrease in sweet beverages (Pérez-Cueto et al., 2012)
‐ The Danish 6-a-day workplace action included the provision of free fruit to the employees and resulted in a daily fruit consumption of 3.42 units (no comparison number provided) (Pérez-Cueto et al., 2012)
‐ Healthy snack vending machine installation increased their consumption by 21%,introduction and promotion of healthy menus increased healthy food consumption by 35% (Capacci et al., 2012)
142 billion $ PPP for worksite interventions and 85 billion $ PPP for school based interventions in all OECD countries, 4.51 and 2.59 $ PPP per capita (in the whole population) (respectively) (Sassi et al., 2009)
‐ School eating behaviour may change but this does not necessarily change the overall diet meaningfully especially if not accompanied with education measures
‐ Little evidence on long-term behaviour
(Brambila-Macias et al., 2011) (Mazzocchi, 2017) (Pérez-Cueto et al., 2012)
6 Local built environment (i.e. availability of supermarkets, farmers’ markets, restaurants and fast food outlets)
Local populations
‐ Access to and availability of healthy food
‐ Can improve equity
‐ Not well studied yet ‐ Needs to be connected to city planning and infrastructure development
(Mozaffarian et al., 2018)
7 - Enable choice by behavioural change programs 7 Physician-
dietician counselling
Malnourished/ overweight/ obese population
‐ Largest effects on obesity reduction, chronic disease incidences, DALYS
‐ Concentrated on people who may benefit most from intervention
‐ Decrease in obesity rates of 6.5%, reduced disease incidences (-0.3 to – 1.35%), increase of nearly 40 million live years (almost 50 million DALYs) (Sassi et al., 2009)
503 billion $ PPP in all OECD countries,7.16 $ PPP per capita (in the whole population) (Sassi et al., 2009)
Comparably expensive instrument
(Sassi et al., 2009)
8 -Guide choices through incentives

SUSFANS
Report No. D10.3
32
8 (income-based) vouchers, food assistance programmes
Disadvantaged or vulnerable consumers
‐ Increase fruit and vegetable consumption in target population
‐ Some evidence of weight gain female participants in USA
‐ May affect prices of healthy foods for non-target population
‐ May help reducing disparities
‐ USA: 734 US $ food stamps increases consumption by 0.35 – 0.40% (Lin et al., 2010)
‐ UK vouchers for fruit, vegetable, milk improved nutrient composition of households shopping basket; each additional pound spent on vouchers increases fruit and vegetable purchases by 14 pence, increased spending of 19.4% (TOT effect) (Griffith et al., 2018)
‐ Income subsidy of food stamps appear less cost effective than subsidy targeted at low income consumers
‐ Obesity has multi-factorial determinants and affects all age and social groups so that a narrowly targeted incentive has limited impact at population level (Sassi et al., 2009)
(Brambila-Macias et al., 2011) (Mazzocchi, 2017) (Mozaffarian et al., 2018)
8 Thin subsidies General population
‐ Health benefits of fruit and vegetable subsidy outweigh cost
‐ Progressive, larger impact on poor population further below threshold
‐ Increased availability of healthy foods
‐ Improved dietary outcomes ‐ Improvement of diets and
potentially health
‐ 1% decrease in the price of all fruits & vegetables could prevent nearly 10,000 disease incidences in the US; costs of saving a life of a low income consumer are 30% less than for a high income consumer (Cash et al., 2005)
‐ USA: 10% subsidy of fruit, veg and milk for low income consumers closes the consumption gap by 4-7%; a 22% subsidy is required to close the consumption gap for vegetables (Lin et al., 2010)
‐ The 30% F&V subsidy in the US would increase consumption by half a portion/ day
‐ Subsidies ranging from 1.8% to 50% revealed increases in purchases of the targeted foods between 1.5% and 25%; however, some studies find that the effect of subsidies (10%-30%) increased overall food consumption and calorie intake by 1%-17% (Thow et al., 2014)
‐ Economic and administrative costs are unclear
‐ 10% fruit and veg subsidy = 734 million US $/year
‐ 30% subsidy on F&V costs up to $4.5 billion per year in US (Mazzocchi, 2017)
‐ A 10% food subsidy would cost $734 million a year in the US (Lin et al., 2010)
‐ Complex to design with varying price elasticities across population
‐ Feasibility and administrative costs not fully assessed
‐ Only evidence for high income countries
‐ Extremely expensive opposed to taxes
(Brambila-Macias et al., 2011) (Mazzocchi, 2017) (Garnett et al., 2015)
9- Guide choices through disincentives 9 Taxes (fat,
sugar) General population
‐ Differential VAT schemes not fully geared to healthy food promotion, e.g. EU VAT imposed for revenue generation (Caraher and Cowburn, 2005)
‐ Denmark introduced a fat tax in 2011 (€2.14/ kg) but abolished it after about 1 year; SSB tax in Finland, France, Belgium; Hungary
‐ A fat tax implemented in France that increases the price of sugar-fat products by 10% would decrease total energy purchased by 0.79% (well-off households) to 1.2% (modest income households) (Allais et al., 2010)
‐ Sweden: 50% subsidy on whole grain bread and cereals to reach 38% fibre intake
‐ Effective in changing prices and consumption, suggestive
‐ Internalizing external costs of health increases social welfare
‐ Economic and administrative costs are unclear
‐ Generate potential fiscal revenues
‐ Complex to design with varying price elasticities across population
‐ Simulations based on aggregate food categories miss substitution within categories
‐ Disproportionate negative impact on the poor
‐ Distributional effects range from none to a higher
(Brambila-Macias et al., 2011) (Mazzocchi, 2017) (Garnett et al., 2015) (Powell et al., 2013)

SUSFANS
Report No. D10.3
33
introduced tax on products high in sugar, saturated fats and salt (Mazzocchi, 2017) Ireland introduced soda tax in 2018 http://europa.eu/rapid/press-release_IP-18-3521_en.htm
‐ Can influence but fat taxes of realistic size have only modest effects
‐ Signalling effect increase awareness for unhealthy foods
‐ Improvement of diets and potentially health
‐ If policy targeted at variety of products, significant reduction in purchased quantity found
‐ Studies suggest no full substitution but reduction in overall intake
‐ Minimal impacts on weight (Powell et al., 2013)
‐ Sugary beverages tax of 0.07 EUR per litre has led to a sales decline of 3.3% in France (Lavin and Timpson, 2013)
‐ A 10% soda tax in Mexico induced 10% decline in taxed and a 7% increase in non-taxed beverage sales (Garnett et al., 2015)
‐ Depending on the height of the tax, intake of sugar sweetened beverages (SSB) could be reduced by 8% to 20%, fat taxes have comparably lower effects on intake however, tested tax levels are lower as well (Hyseni et al., 2017)
‐ Studies analysing taxes and subsidies to stimulate healthier consumption show very different results: While some estimate a reduction in energy, fat or sugar intake, increases in fruit, vegetable and fibre intake, and a decrease in diet-related diseases, other studies predict overall increases in food expenditure, diet-related deaths, welfare losses, and undesired substitution effects (Capacci et al., 2012)
‐ Analysed SSB taxes range between 5% and 30% mostly show reduced intake of these by 5%-48%; taking into account substitution as well shows a decrease in caloric intake of 10% - 48%in adults and 5%-8% in children (Thow et al., 2014)
‐ Nutrient taxes (fat, sugar, salt) of 5% to 40% reduce intake of the respective nutrient by 0-8%, substitution of low- for high-fat options are likely, sodium tax would increase price of salty food and decrease sodium intake, sugar tax of 1€/ kg could reduce 23% of sugary food consumption (Thow et al., 2014)
‐ “unhealthy food tax” (e.g. “red” labelled foods in traffic light) reduces consumption of the
‐ Overall all fiscal measures: -33 billion $ PPP (due to tax revenues) in all OECD countries, 0.28 $ PPP per capita (in the whole population) (Sassi et al., 2009)
likeliness that low income households change consumption in response to a tax; several studies find greater positive dietary and health effects for this consumer group (Thow et al., 2014)
‐ Targeting reduction in one nutrient can cause undesirable changes in others
‐ Feasibility and administrative costs not fully assessed
‐ Only evidence for high income countries
‐ Often low tax level changes induce price reductions probably not large enough to affect health/ weight meaningfully
‐ Locally implemented tax lead to a change in shopping location to non-taxed shop
‐ Combination of tax and subsidy or vouchers (for certain income groups) for healthy options to prevent unintended substitution often suggested alternative (Hyseni et al., 2017; Powell and Chaloupka, 2009)
‐ Some unintended substitutions found e.g. fat taxes leads to reduced fat intake but increased salt and decreased fruit and vegetable intake (Thow et al., 2014)
(Thow et al., 2014)

SUSFANS
Report No. D10.3
34
respective foods strongly and even more effectively among obese persons than among non-obese (generally an unhealthy food consumption reduction of 10%-40% is found (Thow et al., 2014)
10- Restrict choice through regulation 10 Nutrition
standards (in regular restaurants, but also in canteens of public institutions),
General population
‐ Can apply to portion sizes or composition
‐ No existing policies on portion sizes (ban value pricing of lower price for super-size, eg USA)
‐ Transfats are targeted by range of interventions but not published impact assessment
‐ Promotion of healthy foods in unserved areas or the restriction of unhealthy foods
‐ Target sales and retail
‐ NY ban of trans-fat products sold in restaurants found to be effective in reducing intake and mortality from CVD (Mazzocchi, 2017)
‐ Market dynamics seem to be more powerful in driving supply and retail than voluntary health goals
(Brambila-Macias et al., 2011)
(Voluntary) Reformulation
General population
‐ Reformulation to prevent regulation & gain first mover advantage with increasing awareness among consumers
‐ No studies on eating and obesity
‐ Effective ‐ Industry self-regulation and public private partnerships are often relied on by policy makers (especially though in low and middle income countries) despite the lack of evidence of their effectiveness in addressing non-communicable disease prevalence (Moodie et al., 2013)
(Brambila-Macias et al., 2011) (Mazzocchi, 2017)
11- Eliminate choice 11 (Mandatory)
Reformulation, industry quality standards
General population via standards imposed on producers
Reformulation as required by regulation (content of salt, sodium or transfats)
Good compliance, effective in reducing unhealthy nutrients
‐ Particularly intrusive policy as restricting freedom of choice and markets, discussed to be unethical (Kaldor, 2018)
(Mazzocchi, 2017) (Mozaffarian et al., 2018)

SUSFANS
Report No. D10.3
35
3.2.1.3 What room for manoeuvre at which cost?
The wide variety of interventions with different specifications, duration and target groups prevent final conclusions on the effectiveness of interventions from Table 3. The evidence of size of intervention, however, does provide an idea of the order of magnitude of change in diets that may be attained which we can place alongside the desired change in diets from a nutritional point of view (section 3.2.2) and the projected changes in diets without a dedicated intervention, in other words a “do nothing” policy (section 3.2.3).
Ignoring the richness of the studies and insights discussed above we construct a very rough summary of the evidence by intervention in terms of size of change and costs involved looking across the studies found by intervention and selecting (”cherry picking”) evidence easily compared or linked to diet recommendations in the SUSFANS modelling toolbox (Table 4).
The variation across studies is clear from the variability in metrics used to describe the impact of the intervention. Some studies refer to obesity, with a reduction ranging from 0.2% (total population) with information campaigns (1), 5% from food advertising regulation (5) and 6.5% for targeted behavioural change for groups at risk (7). Less intrusive measures appear less effective but are not necessarily cheaper (of these three cases advertising regulation was least expensive). Given the extent of the current obesity problem, with one in five Europeans affected (Fabbri, 2017), additional measures appear needed.
Looking at measures for which reductions in specific nutrients are reported the least intrusive option of informing targeted populations (1) appears more effective than compulsory product information (3) (at maximum 15.6% saturated fat versus 2.1% reduction with information) and taxing specific nutrients (9) which yields up to 8% reduction (with a sizeable 40% tax rate). Regarding taxes there are concerns about undesirable substitutions suggesting these should be accompanied by information campaigns to explain the reasoning behind the taxes. In terms of cost taxation of course stands out in generating public revenue in implementation, however at the cost of producer income.
Large scale influence on product choice through shelf-placement or visibility (nudging, 4) can have a strong by highly variable impact (0-44%) with no cost estimates available (while changing product placement can be hypothesized to be not too costly it will by design change sales, and assuming current profit

SUSFANS
Report No. D10.3
36
maximization by supermarkets reduce profits). More targeted interventions assuring the availability of healthy options (6) can increase fruit consumption by 13% and reduce sweet beverage consumption by 6.3%. Table 4: Size of change and cost by measure (selection from entries in Table 3)
Intervention Size of diet change Cost of intervention
1 Provide information a) General population
0.2% obesity reduction / 0.2-0.77 increase in fruit and veg servings
1.8 $ PPP/capita (whole population) in OECD countries
b) Targeted subgroup Adult reduced intake of energy (-6.3%, cholesterol (-9.2%), total fat (-12.2%), saturated fat (-15.6%) and increase in fibre intake (7.6%)
3 Compulsory information on products
Decreased average daily intake of fat (-6.9%), saturated fat (-2.1%), cholesterol (-6.9mg), sodium (29.58mg), increased average intake of fibre by 7.51g
2.16 $ PPP per capita (whole population) in OECD countries
4 Nudge through changing default policy
Shelf-product placement and visibility can affect choice but results between studies vary strongly (0-44%) and are hardly comparable
No data
5 Ban marketing aimed at agents with limited decision-making capacity (e.g. children)
Food advertising regulations can reduce obesity by 5% across the whole population
1.4 $ PPP per capita (whole population) in OECD countries
6 Ensure healthy choices are available
13% increase of fruit consumption among adolescents and a 6.3% decrease in sweet beverages
2.59 $ PPP per capita (whole population) in OECD countries
7 Enable choice by behavioural change programs
Decrease in obesity rates of 6.5%, 7.16 $ PPP per capita (whole population) in OECD countries
8 Guide choices through incentives
Subsidies ranging from 1.8% to 50% increased purchases of targeted foods between 1.5% and 25%; however, some studies find that the effect of subsidies (10%-30%) increased overall food consumption and calorie intake by 1%-17%
A 10% food subsidy would cost $734 million a year in the US
9 Guide choices through disincentives
Nutrient taxes (fat, sugar, or salt) of about 5% to 40% reduce intake of the respective nutrient by 0-8%, substitution of low-fat for high- fat options are likely, sugar tax of 1€/ kg could reduce 23% of sugary food consumption
Fiscal revenue of 0.28 $ PPP per capita (whole population)
10 Restrict choice through regulation
Seems effective but no evidence on size of impact
No data
11 Eliminate choice Effective but not evidence on size of impact No data

SUSFANS
Report No. D10.3
37
Glancing across the table no clear pattern emerges, although the most preferred options from a freedom of choice perspective (public campaigns) shows limited impact and often modelled options of taxes and subsidies can be effective but risk undesirable substitution effects. The latter may be addressed by acknowledging that prices do not necessarily convey all necessary information (as generally assumed in economic models) and combine taxes and/or subsidies with regulation on information or targeted information campaigns – both show potential to move diets in the desired direction.
3.2.2 Diet scenarios based on nutritional considerations
So far we have established a ranking of policy instruments based on the extent to which freedom of choice (of both consumers and supply chain actors) is curtailed and explored the size of potential shifts in diet that can be attained by the various instruments. We now turn to gauging the direction to which European diets might be steered with these instruments. While eventually the targets in terms of diets will be attained from the SHARP model developed in WP7 taking multiple objectives into account, for the time being we develop diet scenarios based on the diet intake assessments in WP2 combined with nutritional expert knowledge available in the SUSFANS project. This results in two alternative scenarios, one focussed on food groups the second one on energy intake thus addressing both concerns on nutritional adequacy and overweight or obesity. We will first discuss the rationale behind each of these scenarios and then summarize into a format suitable for comparison with both, the projected baseline developments as well as the implementation in the SUSFANS model toolbox.
3.2.2.1 Food-based dietary guideline scenario In the SUSFANS project we use food-based dietary guidelines (FBDGs) to address inadequacies in diets. FBDGs provide a basic framework on the average amount of foods that individuals within a population should be eating in terms of foods instead of nutrients, while still aiming at supporting desirable food and nutrient intakes to promote overall health and prevent chronic diseases. Because FBDGs are usually defined at the national level, differences exist across Europe. In D2.2 we therefore first established a common set of FBDGs that aligns food choices of European population groups (described in detail D2.2 (Mertens et al., 2016) and replicated in Table 5 for convenience). The food-based approach was primarily chosen because increasing evidence points out that specific foods and dietary patterns have a substantial role in the prevention of chronic diseases (Mozaffarian and Ludwig, 2010).

SUSFANS
Report No. D10.3
38
Table 5: Food-based dietary guidelines used in SUSFANS (Mertens et al., 2016)
Food Guideline
Foods to increase
Fruit ≥ 200 g/day
Vegetables ≥ 200 g/day
Legumes ≥ 135 g/week (≥ 19 g/day)
(unsalted) Nuts and seeds ≥ 15 g/day
Dairy (products) ≥ 300 g/day
Fish ≥ 150 g/week (≥ 21 g/day)
Foods to decrease
Red and processed meat ≤ 500 g/week (≤ 71 g/day)
Hard Cheese ≤ 150 g/week (≤ 21 g/day)
Sugar-sweetened beverages ≤ 500 ml/week (≤ 71 ml/day)
Alcohol (Ethanol) ≤ 10 g/day
Salt ≤ 6 g/day
Foods to replace b
Whole grains Replace white grains by whole grains
White meat Replace red and processed meat by white meat
Soft margarine and oils Replace butter and hard margarines by soft margarine and oils

SUSFANS
Report No. D10.3
39
In the paper by Mertens et al. (2018) the diversity of food and nutrient intakes of four European countries has been described according to the FBDGs (see also D7.1 (Mertens et al., 2017)). This shows considerable variation in food patterns across countries and a low adherence to the food based dietary guidelines in general. To increase the health of population, as defined in SUSFANS by adherence to the FBDGs, diet pattern shifts are needed. It should be noted that there is a wide variation in intake within populations, using population averages for the scenario definition thus has limitations. Complementary measures targeting specific subgroups in the population may thus be required, for example by targeted information campaigns or behavioural interventions for groups at risk as discussed in the previous section. The target food groups in the scenario definition are aligned with the food groups used in the SUSFANS nutrition metrics defined in D1.3 (Zurek et al., 2017a).
Fruits, vegetables & nuts
Population adherence to fruit intake ranges between 20-40% in the four countries Czech Republic, Denmark, France and Italy; mean intake range: 118-199 g/d). Population adherence to vegetable intake ranges between 10-53% in the four countries (mean intake range: 95-239 g/d). Increasing fruit and vegetable intake is therefore needed. Such an increase is also in line with the WHO target to increase fruit and vegetable intake as a contribution to obesity reduction. Furthermore, fruit and vegetable intake are associated with reduced risks in CHD, stroke, oesophageal cancer and lung cancer (Micha et al., 2014; Zurek et al., 2017a). Although one may argue that a differentiation across countries could be justified, given current differences in intake, the scenario is for now kept straightforward as an increase in fruit and vegetables (and nuts which also need to increase in intake in case possible/visible in the rather aggregate representation of food in the macro models).
Target: to increase the fruit, vegetable & nuts (in other crops) intake by 100% in 2050. So, each decade an increase of 25%.
Fish
Population adherence to fish intake ranges between 17-43% in the four countries (mean intake range: 12-45 g/d). Increasing fish intake would benefit consumers, however, in populations there is a large group of non-fish consumers. These non-

SUSFANS
Report No. D10.3
40
consumers are not likely to increase their intake. In contrast, for the fish consumers the adherence to the guidelines is much higher and there is no need to increase their intake. Overall, an increase in fish consumption would not be realistic. It is however useful to track the national projected changes in fish consumption to assess if adherence can be expected to change.
Red and processed meat
Population adherence to red and processed meat intake ranges between 39-51% in the four countries (mean intake range: 84-94 g/d). Decreasing meat intake is a step to improve adherence to the guidelines. Red and processed meat intakes are selected because these are related to increased risk of CHD, diabetes and colorectal cancer.
Target: to decrease the meat intake (livestock: cattle, other ruminants & pig and other intensive livestock + processed foods: beef meat products, other bovine meat products & pork and other meat products) by 50% in 2050. So, each decade a decrease of 12.5%.
Sugar
Population adherence to sugar sweetened beverages ranges between 40-63%. This is however due to a large group of non-consumers. In consumers only, these percentages are much lower. So, decreasing the intake of sugar sweetened beverages (SSB) might improve health outcomes. SSB cannot be modelled as such given the aggregate food representation in the SUSFANS macro models, but sugar as commodity is an important ingredient of SSB and an indirect target may be derived from the share of sugar used for SSB in the base year. Again, a reduction in SBB aligns with the WHO target to reduce obesity by decreasing added sugars in foods and beverages. Furthermore, SSB were included due to their relation with increased risks diabetes and increase in body mass index (BMI) (Singh et al., 2015).
Target: to decrease the added sugar intake by 50% in 2050. So, each decade a decrease of 12.5%. This will lead to higher adherence of populations with regard to SSB.
Given the concerns regarding unwanted substitutions also discussed above with the tax and subsidy instruments the food based scenario is designed to be

SUSFANS
Report No. D10.3
41
energy-neutral, i.e. the calorie content of the diet should remain constant. This is to avoid exacerbation of the overweight and obesity problems.
3.2.2.2 Energy-based diet scenario The second diet scenario focuses on the increasing overweight and obesity problems in Europe. From the intakes surveys analysed in WP2 we know that 40-50% of consumers are overweight (BMI >25). Overweight and obesity are the result of an imbalance between energy intake (for which we have data from intake surveys) and energy use through physical activity (on which we lack both survey data and model representations). While acknowledging the importance of physical availability we thus focus on the diet or intake part of the energy equation.
According the WHO guidelines a healthy BMI ranges between 21-23, thus 22.5 on average. One unit of BMI reduction requires a 3 kilogram reduction in weight. Working towards a national average policy which is rough by design, we ignore variations in age, weight and sex. We translate the weight reduction into an energy reduction using FAO energy-needs tables (http://www.fao.org/docrep/007/y5686e/y5686e08.htm).
Target: 10% average nation energy intake reduction by 2050. So, each decade a decrease of 2.5%.
3.2.2.3 Nutrition-based diet scenarios with phasing The diet scenarios described above are defined based on data for the four case study countries which are selected to be representative of the EU. By using a national average diet specification we can arrive at two diet scenarios to be applied to the EU countries summarized in Table 6. Note that for simplicity we assume a linear implementation over the SUSFANS projection period which runs up to 2050. As sensitivity on the food system changes required to meet these targets, the phasing in of the diet changes could be pulled forward to 2030, aligning with the time horizon of the Food 2030 agenda of the EU (Fabbri, 2017).

SUSFANS
Report No. D10.3
42
Table 6: Nutrition-based SUSFANS national average diet scenarios for EU member states
SCENARIO I 2020 2030 2040 2050 TOTAL
Fruit, vegetables (nuts) +25% +25% +25% +25% +100%
Red meat & meat products -12.5% -12.5% -12.5% -12.5% -50%
Sugar -12.5% -12.5% -12.5% -12.5% -50%
Energy (isocaloric) 0% 0% 0% 0% 0%
SCENARIO II 2020 2030 2040 2050 TOTAL
Energy -2.5% -2.5% -2.5% -2.5% -10%
3.2.3 Projected changes in targeted food groups While the implementation of the diet scenarios in the model toolbox will be done as part of D10.4, we can place the desired changes in diet as reflected in the diet scenarios alongside the projected changes in SUSFANS reference scenarios reported in D10.2 (Frank et al., 2018). This provides a first perspective on the required change in diets using the existing or innovative interventions.
Figure 3 presents the EU28 average changes in food groups according to the GEnUS product classification. It should be noted that the GEnUS database lacks detail on processed foods (see D9.2 (Kuiper et al., 2018b) for details) and thus provides a limited representation of changes of especially sugary beverages (fruit juices is taken as indicative of SSB) and processed meat. This representation will be improved upon by the link between MAGNET and SHARP food intake database developed in D9.5 (Kuiper et al., 2018a).

SUSFANS
Report No. D10.3
43
Figure 3: EU28 projections of targeted food groups by SUSFANS contextual scenario and time period, Source: MAGNET GEnUs projections using the SUSFANS contextual scenarios (see D10.1 (Havlík et al., 2018) & D10.2 (Frank et al., 2018))
Despite these caveats the projected developments in the absence of any diet related policy are clearly misaligned with the direction and size of change envisaged form of a nutritional point of view: for about all periods the direction of projected change is opposite the targeted change in diets. This implies that the currently observed lack of adherence to recommended dietary guidelines is

SUSFANS
Report No. D10.3
44
expected to worsen in the future, and along with it the spread of diet related diseases.
3.2.4 Conclusions and next steps This chapter first looked at dietary change from a behavioural change perspective, reviewing available evidence on the effectiveness of policies ranked by their desirability from a political economy point of view. We then switched perspective defining desired changes in diets based on current adherence to dietary guidelines and energy intake. Finally we had a first, rough, look at the projected changes in diets in the absence of any policies or other interventions.
Pulling these strands together we conclude that a major change in diets is required. Given that the projected changes for key food groups move in the opposite direction of the diet scenarios, the required change is even larger than established from currently observed lack of adherence to the dietary guidelines. Furthermore, the size of change (up to a doubling of current intake) is well beyond reported size of change in diets from a single type of intervention in our literature review. A combination of policies and potentially innovative interventions is needed to move the European diets on a healthier trajectory.
Next steps will be to assess the development in diets anticipating changes in well-established policies like the CAP, CFP and potential stabilization policies. These producer-focussed policies will alter the food system and may thus affect the consumer diets. Within this broader policy context we then propose to establish the responsiveness of the European diets to a combination of taxes and subsidies to reach the targeted intake changes. Given the sizeable gap between desired and projected trends the size of required taxation levels can be expected to exceed politically feasible levels and/or cause too large undesired substitution effects as measured by the SUSFANS nutrition metrics. We will then complement the taxes/subsidies with a consumer preference shift, which is a very rough proxy for various interventions of the consumer decision-making process (see the mapping between interventions and model representation in Table 2). The result scenario will by design meet the scenario targets and can be evaluated along the four dimensions of the SUSFANS metrics (health and nutrition, profitability, environment and equity). In addition the resulting combination of interventions can be placed in context of the existing evidence discussed above and the insights in consumer motivation or drivers of change explored in WP2.

SUSFANS
Report No. D10.3
45
3.3 Common agricultural policy (CAP) The common agricultural policy (CAP) of the EU influences sustainable food and nutrition security in various ways. The CAP shapes agricultural competitiveness on domestic and global markets. On the production side, the CAP is described as a direct driver for livestock, seafood and crop production in EU member states (van Zanten et al., 2016; Zimmermann and Latka, 2017). The policy aims at ensuring the provision of affordable food for consumers, a reasonable living for farmers, the preservation of rural areas, while also contributing to cope with climate change and managing natural resources sustainably (European Commission, n.d.). In order to be better equipped for current and future challenges, in June 2018 the European Commission proposed objectives for the CAP after 2020. A stronger ambition regarding environmental and climate action is included in the proposal targeting improvements in water quality and reduced ammonia and nitrous oxide levels (European Commission, n.d.). Surplus soil nutrients that are not utilized by plants can dissolve into the air or leach into close by water bodies or even the groundwater. This can negatively affect drinking water quality, ecosystem functions, and the climate (Schröder et al., 2004). Nutrient surpluses in water bodies can cause eutrophication and impede the use of rivers and lakes for recreational or consumption purposes (Eurostat, 2017).
Livestock dense areas are hotspots for soil nutrient surpluses and contribute substantially to agricultural greenhouse gas emissions. The underlying interdependencies regarding livestock production and environmental impacts are described and discussed in chapter 3.3.1.
To achieve sustainable food production as aimed for in “SDG 2: Zero hunger” and in the objectives of the future CAP, reducing nitrogen surpluses and agricultural greenhouse gas emissions is inevitable. In the present analysis we investigate whether a restriction of livestock density under consideration of soil nutrient needs can contribute to reaching this goal.
The policy scenario is tested with the Common Agricultural Policy Regionalised Impact (CAPRI) modelling system (3.3.2). The assessment takes into account possible interplays and conflicts of CAP objectives using the SUSFANS indicator framework, as far as applicable (3.3.3).

SUSFANS
Report No. D10.3
46
3.3.1 Reducing animal density for improving SFNS? The broad spectrum of objectives targeted by the CAP allows assessing various scenarios with respect to their potential impacts on the food system.
CAP scenarios analysed in the literature have often been implemented to test effects of reducing the overall CAP budget (Boulanger and Philippidis, 2015; Manos et al., 2013), changing the budget of one of the CAP pillars (Barnes et al., 2016; Boulanger and Philippidis, 2015; Lampiris et al., 2018; Manos et al., 2013; Renwick et al., 2013) or of removing the CAP as such (Bartolini and Viaggi, 2013; Lange et al., 2013; Latruffe et al., 2013; Manos et al., 2013; Raggi et al., 2013; Weltin et al., 2017). Fewer studies have focused on specific measures aimed at improving the environment (Boulanger et al., 2017; Kirchner et al., 2015) or land quality (Matthews et al., 2013), single area payments (Boulanger et al., 2017; Kirchner et al., 2015), labour subsidies (Helming and Tabeau, 2018), cross-compliance measures (Salmoral et al., 2017), or the removal of export subsidies (Renwick et al., 2013).
In contrast to the mentioned policy scenarios investigated in the literature, the present analysis focuses on a comparably narrow sector of the CAP with however, possibly far reaching implications.
The reduction of animal density in nitrogen hotspot areas has the potential to address various sustainability determinants at once: reducing over-fertilization and nitrogen surpluses, increasing space per animal which potentially improves animal welfare, and decreasing agricultural greenhouse gas emissions.
3.3.1.1 Soil nutrient surpluses and LU density in the EU Nitrogen and phosphorous surpluses have decreased between 2003 and 2013 on EU average (European Commission, 2017). Nevertheless, nutrient surpluses remain a major environmental burden in the EU (European Commission, 2018).
Since 2010 the EU gross nitrogen balance has stagnated at a high level of around 51 kg/ ha in the past years with around 80% of the nitrogen surplus coming from mineral fertilizers and manure (Eurostat, 2017, p. 48). Even though there is a declining trend for nitrate emissions in groundwater, this does not reflect remaining serious problems at local hotspots (Eurostat, 2017, p. 48). Phosphorous largely from agricultural fertilization and manure application dissolves into river bodies in which it is contained as phosphate. Even though on EU average a declining trend of phosphate concentrations in rivers is observed, high

SUSFANS
Report No. D10.3
47
concentrations are still present in in areas with high agricultural and population densities (Eurostat, 2017, p. 141).
Regional heterogeneity: Hotspots vs. Deficiencies
There are strong regional differences with respect to animal density, fertilization, and soil nutrient supply within the EU, also at a local level. While in the new EU member states negative NP balances are predominant, positive, even though declining, NP balances and oversupply prevail in the EU15 countries (Csathó and Radimszky, 2009). Western Europe is globally among the highest regarding fertilizer application and manure nutrient production rates (Potter et al., 2010). The ratio of manure to mineral fertilizer application varies on a regional level within the EU. In some EU areas more fertilizers are used than manures, in other areas it is the other way around (Potter et al., 2010). In line with heterogeneity in soil nutrient balances, fertilizer and manure application rates, spatial differences regarding livestock densities can be considerable also within countries (Wang et al., 2018).
On the other hand, NP undersupply is also problematic as it can result in low yields, underutilized crop productivity and economic problems at farm and market levels (Csathó and Radimszky, 2009). Despite declining tendencies, fertilizer application rates in the EU are high in a global comparison and numerous potential as well as documented eutrophication sites across the EU illustrate an existing problem of soil nutrient oversupply in this area (Potter et al., 2010).
Livestock density’s correlation with soil nutrient surpluses and emissions
Nitrogen and phosphorous surpluses occur predominantly in regions characterized by high livestock densities (Svanbäck et al., 2019). Jørgensen et al. (2018) describe zones with comparably high stocking densities as N hotspots with a higher nitrate leaching risk than low stocking density areas in which they find N-surplus levels in the range of the legal norms under comparable settings. Wironen et al. (2018) analyse P flows and legacy and similarly identify livestock density as a good predictor for nutrient surpluses. Also greenhouse gas, especially ammonia, emissions are correlated with livestock density and affected by a reduction in it (Eurostat, 2017). With increasing stocking density and NP oversupply, initial positive impacts from organic N supply on soils are outweighed by negative implications from excessive active N forms, reduced soil C sequestration and mean C residence time (Soussana and Lemaire, 2014).

SUSFANS
Report No. D10.3
48
The role of manure trade
The separation of crop and livestock is another determinant of nutrient surpluses (Svanbäck et al., 2019). Increasing options for trade have created a regional soil nutrient imbalance. Animal unit density increased in some locations exceptionally due to increasing feed imports (Wironen et al., 2018).
The trade of manure creates the possibility to redistribute N from livestock dense areas to soil nutrient deficient locations which can increase nutrient use efficiency (Hanserud et al., 2017). In some cases, manure export can help closing the nutrient cycles. For example the highly intensified pig production in the Netherlands relies on feed imports from and manure exports to Germany. Even though this exchange contributes to closing the feed-manure cycle, the livestock density in the Netherlands and the related manure production is 2 to 4 times too high to reach this balance (Willems et al., 2016). Even though manure trade is a needed, supplementary option to tackle hotspot nutrient surpluses, at current livestock density levels soil absorption capacities are surpassed (Buckwell and Nadeau, 2018).
Buckley and Fealy (2012) find that even though a share of mostly arable, younger farmers would be willing to pay for the import of manure, more farmers would be willing to receive the surplus manure from livestock producers if they get it at no cost. This finding stresses how manure trade including its potential environmental benefits is influenced by the price of manure but also by the price of chemical fertilizers, the direct substitute. Kuhn et al. (2018) show that manure transport can create clear environmental improvements if it leads to a reduction in mineral fertilizer usage, however dependent on transport distances and the avoidance of empty drives.
EU legislation on soil nutrient balances in force
The EU legislation in force partly addresses the interplay of nitrogen balances and livestock density. Implemented as part of the Nitrate Directive, the manure application limit of 170kg N per ha presumably has affected livestock density (Chang et al., 2015; Velthof et al., 2014). For some pastures this implies a limitation to 1.7 LU/ ha effectively (Chang et al., 2015). Water framework directive measures are found to increase transport of manure and to reduce livestock numbers in the Netherlands (Helming and Reinhard, 2009).
However, manure N application thresholds are often violated (European Commission, 2018, p. 87). There is no European policy regarding P application limits yet in force (Schoumans et al., 2015).

SUSFANS
Report No. D10.3
49
Livestock density thresholds in the literature
Different livestock density thresholds are assessed in published literature. Velthof et al. (2014) define intensive livestock systems as those with more than 1.3 livestock units (LU)/ ha on average and impose a 1% yearly reduction rate on these. According to Wang et al. (2018) and Tamminga (2003) 2 LU/ ha is a critical threshold that should not be exceeded in order to avoid negative environmental impacts. To reduce N leaching from manure, animal density per ha is regulated in many EU countries (Kirchmann et al., 2002). Nesme et al., (2015) find large nutrient surpluses in locations with more than 1.1 LU/ ha agricultural area.
Buckwell and Nadeau (2018) define ruminant livestock densities of 0.5 to 1 LU/ ha as sustainable boundaries for the preservation of permanent pastures. With this attempt, the authors acknowledge the conservation contribution from livestock on pastures. However, once a boundary is exceeded, overgrazing can affect the ecosystem negatively (Buckwell and Nadeau, 2018).
3.3.1.2 Potential policy implications of a LU density restriction Soil nutrient imbalances are not only caused by manure application. The interplay with mineral fertilizers plays a decisive role. In some regions, livestock manure contributes only an insufficient share of P and N to the regional soil needs (Tampio et al., 2017). An advantage for the application of mineral fertilizers lies in its lower N leaching rates compared to manure (Kirchmann et al., 2002). Even if mineral nitrogen may be more accessible to plants, in some regions higher yields and improved soil quality are revealed when manure is applied instead of mineral fertilizer (Martínez et al., 2017). Interrelations between manure and mineral fertilizers are multi-layered and will be further disclosed in the discussion on the policy implications (chapter 3.3.3).
Besides impacts on the soil nutrient balances, a reduction in livestock density likely affects further aspects related to sustainable food and nutrition security (SFNS). Reducing stocking density can imply a loss of farm income and additional production costs, whereas price premiums on products or savings of external inputs may possibly improve farm income (Grethe, 2007; Helming and Reinhard, 2009; van Grinsven et al., 2015). A livestock policy shift aiming at increasing environmental and animal welfare standards is feared by producers not only for likely implied costs, but also for a potential loss in competitiveness (Buckwell and Nadeau, 2018).
Furthermore, animal stocking density is an inherent part of the animal welfare debate. For example, Moynagh (2000) state that a stocking density exceeding

SUSFANS
Report No. D10.3
50
30kg/ m² likely results in animal welfare problems. In combination with straw provision, reduced stocking density shows a positive effect on reducing damage from tail biting among pigs according to Larsen et al. (2018).
According to Buckwell and Nadeau (2018) animal welfare as well as economic and social impacts from a potential EU wide reduction in animal production and consumption requires further investigation. The present analysis aims to contribute in closing this research gap.
3.3.2 Scenario implementation in CAPRI Based on the presented interlinkages between livestock density, nutrient surpluses and agricultural greenhouse gas emissions, we analyse the potential effects of an EU policy that imposes restrictions on livestock density. Such a policy could be justified for environmental, but potentially also for animal welfare reasons. It may be a reasonable piece within the CAP post-2020 regulations for increasing ambitions on environmental and climate action.
The policy measure is assessed with CAPRI, a comparative static, partial equilibrium and global agricultural sector model. The common agricultural policy of the EU as well as global trade flows and policies are simulated ex ante to assess impacts on production, trade, markets, and the environment (Britz and Witzke, 2014).
The livestock sector in CAPRI is linked to supply, demand and production functions. Livestock production is constrained by farm inputs, obtainable area, and costs, and it is affected by subsidies and agricultural policies. The need for animal feed is one of the determinants of crop production. In the model these factors are taken as cost factors. Internal feed production competes with feed that can be bought on the market. Despite its substitutability in terms of ingredients and origin, feed composition needs to fulfil nutrient requirements and further constraints. Crop nutrient needs furthermore need to be met by the application of manure and purchased mineral fertilizers. Fulfilling crop fertilizer needs thus is one of the constraints to maximizing regional farm incomes in CAPRI. Furthermore, environmental impacts are quantified arising from crop and livestock production as well as fertilizer usage. More detailed explanations of these model interlinkages are provided in Britz and Witzke (2014).
3.3.2.1 Scenario description The livestock density restriction scenario is set up in the following way: The nutrient need for reaching baseline yield levels is calculated. Livestock density is

SUSFANS
Report No. D10.3
51
restricted so that the derived manure output could cover those soil nutrient needs. For those regions for which this calculation results in very low estimated animal densities, a safety maximum bound is set higher, to 0.5 livestock units (LU)/ ha. This gives flexibility for fertilization increases in regions that may lack sufficient nutrients in soils. The scenario definition allows for locally defined livestock density boundaries under consideration of environmental thresholds in the respective locality. Scenario results are compared for 2030 in contrast to a business as usual reference (baseline).
The soil nutrient need is calculated by subtracting the nutrient input from crop residues, biological nitrogen fixation, and atmospheric nitrogen deposition from the nutrients exported in the form of agricultural products. Dividing this nutrient deficit by the respective utilized agricultural area reveals the nutrient need per ha as average over each NUTS2 region. Under consideration of the amount of manure output per livestock unit, this can be translated into the required amount of livestock units per ha for balancing the regional soil nutrient need.
It may be considered that the plant availability of nitrogen in manure is less than 100%. On the other hand farmers will compensate this incomplete availability with additional fertiliser application (which implies some nitrogen losses to the environment). The scenario rule thus does not prevent losses but aims at a transparent policy to reduce them.
In the scenario set up, the availability of mineral fertilizer is neglected. In principle it could be possible to fulfil soil nutrient needs by application of mineral fertilizers alone. However, the aim of the policy is to give an upper limit of manure application by restricting livestock density to fertilizer needs. The underlying problem that is targeted is the surplus of manure application in livestock dense hotspot areas. Nevertheless, the model also allows for the usage of mineral fertilizers. Therefore, nutrient surpluses could still be possible due to additional application of mineral fertilizers. The possibility of manure trade is not represented in the model.
3.3.3 Results and implications on SUSFANS indicators In the following, the CAPRI modelling results for the livestock density restriction policy are presented in comparison to the 2030 baseline scenario for the EU. First, the direct effect on livestock densities is shown. Second, further impacts are discussed applying the SUSFANS metrics concept.

SUSFANS
Report No. D10.3
52
3.3.3.1 Resulting livestock densities On EU average the restriction of livestock density dependent on soil nutrient requirements causes a reduction of livestock numbers by about 70,000 heads (-14%). Livestock density is effectively reduced by 0.39 livestock units per ha. However, between EU regions there is a substantial variety of initial livestock density levels as well as of livestock density changes induced by the policy scenario.
Initial livestock density in the 2030 baseline scenario ranges from 0.003 LU/ ha in the Greek region Kriti to 2.417 LU/ ha in the Dutch region Utrecht for cattle activities and from 0.008 LU/ ha in French Ile de France to 7.292 LU/ ha in Dutch Noord-Brabant for non-cattle activities.
Regional densities also differ by livestock types. While some regions have a low cattle density, these may have a comparably high density of non-cattle animals. Nevertheless, among the most cattle dense regions there are also those that have the highest non-cattle density as shown in the figure below.
Figure 4: Livestock density in the 2030 reference scenario (baseline) for all cattle and non-cattle activities by region (only selected region names displayed)
The change in cattle density ranges from -1.102 LU/ ha in Antwerpen, Belgium to 0.135 LU/ ha Hainaut, Belgium. This result stresses that within one country livestock densities can differ strongly. Regarding non-cattle activities, the region with the highest livestock density, Noord-Brabant, experiences the highest change of -6.425 LU/ ha after the policy shock. The highest increase in non-cattle

SUSFANS
Report No. D10.3
53
density is found for the German region Stuttgart with 0.303 LU/ ha. The change over all livestock categories follows the same pattern: The highest reduction in livestock density occurs in Noord-Brabant (-7.134 LU/ ha) and the highest increase in Stuttgart (0.333 LU/ha).
Figure 5: Absolute change in livestock density (LU/ ha utilized agricultural area) by NUTS2 region for all livestock categories (only selected region names displayed)
Figure 6: Livestock density (LU/ ha) in the reference scenario (baseline) and after the policy shock by region (only selected region names displayed)
Considering all livestock categories, the model results show that the policy shift leads to a livestock density reduction in areas with the highest livestock densities in the reference situation. According to the literature discussed in chapter 3.3.1 these areas often show large nutrient surpluses. On EU average, the livestock

SUSFANS
Report No. D10.3
54
density restriction reduces the application of mineral nitrogen (-4%) as well as of manure nitrogen (-9%) in comparison to the 2030 baseline. While manure phosphate usage is reduced (-5%), mineral phosphate application increases by 2% on EU average. In the following, results on environmental indicators are presented in order to assess whether the expected improvement in nutrient balances and emission levels occurs.
3.3.3.2 Quantifiable SUSFANS indicators Within the SUSFANS project, indicators are developed that allow for a comprehensive sustainability assessment in the sphere of food and nutrition security. The agricultural sector model CAPRI is not capable of delivering the full scope of these indicators. However, those indicators and variables that can be composed based on the CAPRI output are presented furthermore.
Planet: Reduction of environmental impacts
The policy under investigation, the restriction of livestock densities, has the main aim to reduce soil nutrient surpluses due to their detrimental environmental impacts in form of emissions into the soil, the air and surrounding waters. Climate stabilization is one of the SUSFANS performance metrics under the policy goal “reduction of environmental impacts”. In order to reach this goal, the EU set the agricultural greenhouse gas emission reduction target to 36-37% by 2030 compared to 1990 emission levels (European Commission, 2011). Between 1990 and 2012, yearly emissions from the EU agricultural sector decreased by 23.8 % (Eurostat, 2018). For the EU in total, our model results indicate that agricultural greenhouse gas emissions decrease by 9% CO₂eq as consequence of the livestock density policy compared to the reference case in 2030. This shows that a livestock density restriction could contribute a substantial part to reaching EU agricultural greenhouse gas emission targets. The indicator for achieving clean air is expressed as the reduction of N surpluses. Soil nutrient surpluses are reduced by 12% on EU average due to the policy shift compared to the baseline. Gaseous N losses are reduced by 9% in total with manure emissions being reduced by 10% and mineral fertilizer emissions by 4%. The livestock density policy also reveals progress on the way to clean water. N leaching is reduced by 14% and N run-off from fertilizers (-4%) and manure (-8%) overall by 6% on EU 2030 average compared to the reference case.

SUSFANS
Report No. D10.3
55
Figure 7: Total N surplus in reference (baseline) scenario for 2030 by NUTS2 region
Figure 8: Total N surplus as absolute change after livestock density restriction policy for 2030 by NUTS2 region

SUSFANS
Report No. D10.3
56
Besides N, also P surpluses need to be reduced to reach the target of clean air and water. The livestock density restriction leads to a reduction of nearly 13% in P surpluses on EU average.
The goal biodiversity conservation can only partly be assessed based on the CAPRI model output since the model does not capture impacts on the non-agricultural biodiversity. Crop diversity however is captured by Shannon’s diversity index. On EU average changes are marginal. The index shows an increase in landscape heterogeneity from 2.76 (baseline) to 2.77 (livestock density restricted) in 2030. On a regional level, changes in the index range from -0.2 to 0.2 as shown in the figure below.
Figure 9: Absolute change in Shannon’s diversity index after livestock density restriction policy for 2030 by NUTS2 region

SUSFANS
Report No. D10.3
57
Table 7: CAP induced changes regarding the reduction of environmental impacts
Reduction of environmental impacts
Performance metric Aggregate indicator Change due to policy (%)
Climate stabilization Reduction of total GHGE -9
Clean air Reduction of N emissions to atmosphere
-9
Clean water Reduction of N emissions to hydrosphere
-10
Clean air and water Reduction of P surplus -13
Biodiversity conservation Shannon index 0.5
Besides the expected impact on the environmental indicators, the change in livestock density is assumed to affect further SUSFANS metrics dimensions as well. Related livestock production decreases and price increases that stimulate effects on trade, competitiveness and human consumption could result from the policy shock. Animal welfare and consumers’ acceptance of agricultural production may be affected as well.
People: Balanced and sufficient diets for EU citizens
The impacts of the livestock density restriction policy on EU diets can only be assessed to a limited extent based on the CAPRI output.
The indicator food based summary score can approximately be produced for those food groups that are covered by the model. The results in g/day or week/person for the reference scenario, the LU density restriction scenario and the recommended intake value according to Zurek et al. (2017) for the computable food groups are shown in the table below.

SUSFANS
Report No. D10.3
58
Table 8: CAP induced changes regarding balanced and sufficient diets: The food based summary score in human consumption per person (pP) and food group for the EU 2030 average
Balanced and sufficient diets for EU citizens
Food based summary score
Food group Reference scenario (pP)
LU density restricted (pP)
Recommended intake (pP)
Vegetables & Fruits 490 g/ day 492 g/ day > 200 g/ day & > 200 g/ day
Legumes 26 g/ week 27 g/ week > 150 g/ week
Fish 379 g/ week 382 g/ week > 150 g/ week
Dairy 307 g/ day 306 g/ day > 300 g/ day
Red/ processed meat
935 g/ week 884 g/ week < 500 g/ week
The model output indicates that EU average intakes of fruits and vegetables, fish and dairy products are in line with recommendations with and without the livestock density policy. For legumes minimum intake levels are not reached in both scenarios and the intake of red and processed meat exceeds recommended intake levels with and without the policy. Nevertheless, with the policy in place meat intake gets closer to the targeted amount.
Food and nutrient intake model outputs from CAPRI need to be interpreted with care. CAPRI is no dietary model, intake values are highly aggregated and do not account for intra-population differences, and the intake values are derived based on food availability data. This data type tends to overestimate actual food intake amounts (Hallström and Börjesson, 2013, p. 44). Due to these reasons, the nutrient based summary score is not presented based on the aggregated model output since score values tend to be out of reasonable scope for the index. Furthermore, changes in human nutrient intake due to the policy shift result to be marginal (+/- 1% in daily nutrient intake/ capita).
People: Equitable outcomes and conditions
To assess the policy goal equitable outcomes and conditions most indicators are chosen in order to quantify the distribution of impacts. This level of

SUSFANS
Report No. D10.3
59
disaggregation is not available for most of the CAPRI output. The composable equity indicators and variables are presented furthermore.
We understand food availability as domestic food production per capita by region. To quantify this indicator we divide domestic net agricultural production by the number of inhabitants for each scenario. Product availability per person decreases in the EU from 2.25 thousand tonnes/ year to 2.21 thousand tonnes/ year. Per person product availability increases slightly in the rest of the world from 1.1586 thousand tonnes/ year to 1.1592 thousand tonnes/ year. These values however include non-food agricultural products.
The reduction of the share of protein of animal origin by region represents another variable for food availability. The tested CAP scenario does not influence the share of animal protein in total protein intake neither for the EU average nor for the rest of the world. Protein animal origin stays constant for the EU at 58% (49% excluding aquatic product consumption) and at 39% (29% excluding aquatic product consumption) for the rest of the world in 2030.
One of the variables for quantifying food accessibility is consumption per capita and region. Measured as calorie intake/ per person this changes only slightly as consequence of the policy change. The strongest decrease occurs in Finland with roughly 13 calories/ day/ person. In most non-EU regions calorie intake increases, mostly limited to a less than 10 daily calories per person increase. Merely the group of non-EU European countries and South Korea experience a calorie increase of more than 30 calories/ day/ person. Nevertheless, in relative terms the strongest calorie change makes up not even 2% of the respective daily calorie intake.
The suggested variable to test for food utilization is the share of calories from fruit and vegetables by region. Interestingly this share is constant at 7% with and without the CAP policy shock as well for the EU region as for the rest of the world. In absolute calorie terms however, daily fruit and vegetable intake per person differs between both spatial aggregates (EU: 226 calories, rest of the world: 161 calories). The constant consumption shares may be owed to the modest impact on food consumption in general due to the LU density change and a minor model inherent substitution of fruit and vegetables for animal products in the diets.
Stability can among others be assessed by looking at the cereal import dependency ratio by region. We calculate this variable for the EU by dividing

SUSFANS
Report No. D10.3
60
the imported cereal quantity by the domestic cereal market use. The dependency is reduced by 15% after livestock density is restricted in the EU.
All the presented equity indicators are subsumed under the performance metric equity among consumers: food system outcomes. An overview on the discussed equity metrics is presented in the table below.
Table 9: CAP induced changes regarding equitable outcomes and conditions among consumer system outcomes, indicators for EU and non-EU in 2030, changes (%) are relative to the 2030 baseline scenario without policy intervention
Equitable outcomes and conditions
Among consumer system outcomes
Aggregate indicator
Derived variable
Baseline variable value in
EU
Baseline variable value in non-EU
Change due to policy (%)
in EU
Change due to policy
(%) in non-EU
Availability Domestic food production
2.25 1,000t/ capita/
year
1.16 1,000t/ capita/
year
-1 0
Availability Reduced share of animal protein
58% 39% 0 0
Accessibility Consumption 3,171 cal/ capita
2,470 cal/ capita
-0.18 0.05
Utilization Share of fruit and vegetable
calories
7% 7% 0 0
Stability Cereal import dependency
17% 17% -15 1
Unlike the environmental variables, food consumption based metrics do not show strong changes as consequence of the livestock density restriction policy. The presented environmental indicators are influenced by EU domestic production changes. Shifts in trading patterns are not accounted in these. EU human consumption on the other hand is affected by changes in trade flows. SUSFANS trade and competitiveness metrics are discussed further on.

SUSFANS
Report No. D10.3
61
Profit: Competitiveness of EU agri-food business
SUSFANS competitiveness variables are designed in monetary terms (USD). CAPRI trade and productivity variables are given in Mio Euro. The derived variable values for the reference and policy scenario for EU 2030 are reported in the table below.
Table 10: CAP induced changes regarding the competitiveness of EU agri-food business, variables refer to the agricultural sector, derived from scenario results in Mio Euro for EU 2030
Competitiveness of EU agri-food business
Performance metric
Derived variable
Formula Baseline scenario
LU density scenario
Trade and production
Openness
0.75 0.69
Trade and production
Self- sufficiency
1.11 1.07
Trade Export share
0.02 0.02
Trade Normalized trade
balance
0.14 0.10
In contrast to the previously discussed SUSFANS performance metrics, a negative impact on the trade-related competitiveness variables results from the livestock density restriction policy. The implemented CAP measure causes a reduction in EU net production by about 10% for meat products compared to the reference scenario. While domestic meat consumption decreases only by 2% compensated by increasing meat imports (6%), the production decline results in an export decrease of 38% of meat products after the policy change. The reduction in pork, sheep and goat meat exports reaches more than 65%. Also EU production and export of dairy products, eggs, soya oil and grain maize decline. The drop in domestic demand for animal feed however results in an export increase of various feed products like pulses, oil cakes and processing by-products. However, these export increases do not outweigh the competitiveness loss due to the livestock density restriction as reflected in the competitiveness indicators presented in the table.
SUSFANS metrics and CAPRI model outputs do not account for impacts on animal welfare and consumer acceptance. Depending on the practical implementation of the livestock density restriction policy benefits for both dimensions may likely arise. Potentially increased available space per animal may improve what is
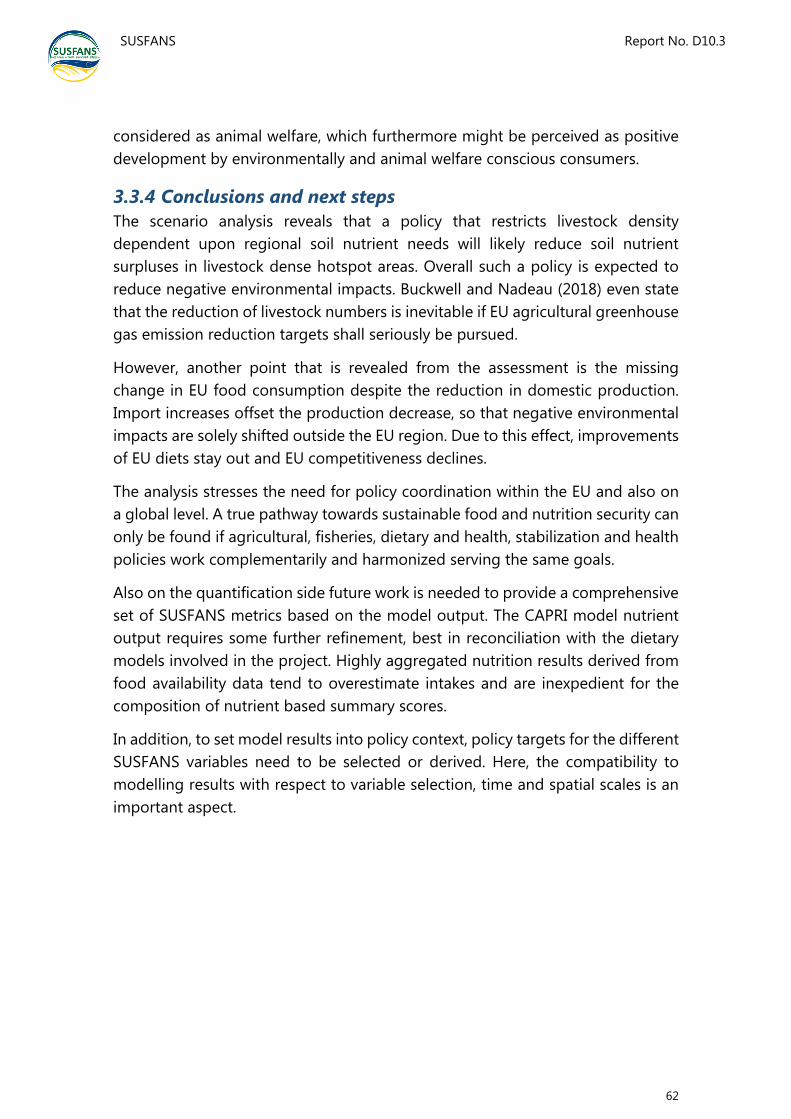
SUSFANS
Report No. D10.3
62
considered as animal welfare, which furthermore might be perceived as positive development by environmentally and animal welfare conscious consumers.
3.3.4 Conclusions and next steps The scenario analysis reveals that a policy that restricts livestock density dependent upon regional soil nutrient needs will likely reduce soil nutrient surpluses in livestock dense hotspot areas. Overall such a policy is expected to reduce negative environmental impacts. Buckwell and Nadeau (2018) even state that the reduction of livestock numbers is inevitable if EU agricultural greenhouse gas emission reduction targets shall seriously be pursued.
However, another point that is revealed from the assessment is the missing change in EU food consumption despite the reduction in domestic production. Import increases offset the production decrease, so that negative environmental impacts are solely shifted outside the EU region. Due to this effect, improvements of EU diets stay out and EU competitiveness declines.
The analysis stresses the need for policy coordination within the EU and also on a global level. A true pathway towards sustainable food and nutrition security can only be found if agricultural, fisheries, dietary and health, stabilization and health policies work complementarily and harmonized serving the same goals.
Also on the quantification side future work is needed to provide a comprehensive set of SUSFANS metrics based on the model output. The CAPRI model nutrient output requires some further refinement, best in reconciliation with the dietary models involved in the project. Highly aggregated nutrition results derived from food availability data tend to overestimate intakes and are inexpedient for the composition of nutrient based summary scores.
In addition, to set model results into policy context, policy targets for the different SUSFANS variables need to be selected or derived. Here, the compatibility to modelling results with respect to variable selection, time and spatial scales is an important aspect.

SUSFANS
Report No. D10.3
63
3.4 Common fisheries policy (CFP) Seafood production and consumption play an ambivalent role with respect to sustainable food and nutrition security. On the one hand, aquatic food production has the potential to contribute to ensuring sufficiently available food for a growing world population (Merino et al., 2012). On EU level, the qualitative improvement of diets in terms of healthiness and nutritional richness includes the recommended consumption of seafood on a weekly basis (Zurek et al., 2017a). On the other hand, seafood production relates to several sustainability issues. Uncontrolled capture tends to deplete wild fish stocks. This overfishing endangers future fishery production and the income basis of people working in this sector (Allan et al., 2005; Quaas et al., 2012). Aquaculture production may have a direct negative impact through influxes into the ocean from coastal production sites in terms of nutrients, antibiotics or invasive species (Frankic and Hershner, 2003). Indirect environmental effects arise from agricultural production of fish feed. Competition for feed and land with land animal production systems may have far-reaching consequences on the future agricultural sector (Froehlich et al., 2018). Nevertheless, aquaculture production likely increases the competitiveness of the EU fishing industry (Hornborg et al., 2016).
The common fisheries policy (CFP) chosen for this assessment introduces the rule that stocks in EU waters are harvested in a way that maintains them at levels producing the maximum sustainable yield (MSY). In addition, also the maximum economic yield, a presumably more profitable harvesting approach that also leads to lower environmental impacts, is inspected regarding its effects on seafood production and various sustainability indicators. In addition, the effects of implementing EU member states national aquaculture growth plans are assessed. We examine the effectiveness of these policy scenarios for ensuring future yields and seafood supply. In the analysis, careful attention is given to land-based feed inputs as the need is pointed out in Heckelei et al. (2018) (D9.3).
3.4.1 Background on EU common fisheries policy Capture fisheries in the EU are regulated through the common fisheries policy (CFP) comprising of a combination of different management tools. These include a combination of i) requiring licence to fish; ii) important stocks are scientifically assessed in terms of fishing mortality and abundance; iii) input controls such as restrictions in fishing effort (time spent fishing, engine power) and/or use of gears; iv) output controls in terms of the amount of fish allowed to land, i.e. fishing quotas, Total Allowable Catch (TAC) (Marchal et al., 2016). Overall, the latest CFPs

SUSFANS
Report No. D10.3
64
can roughly be described as aiming to adapt the fleet to the resource, i.e. decreasing fishing effort to achieve sustainable fisheries. The EU fishing fleet has had (and still has in some fleet segments) severe overcapacity (i.e. a much higher catch capacity than what can be caught sustainably), and wasteful practices in the form of discard. The reforms of the CFP have as a result been characterized over time by increased micro-management from Brussels, until the latest reform, which encourages regionalization. The management objectives and scientific basis for providing advice to EU fisheries has been changing over time (Lassen et al., 2013), but in general terms, TACs should be set according to the scientific advice, in the EU provided by the International Council for Exploration of the Sea (ICES). However, it has been shown that political overfishing, i.e. that quotas negotiated exceed scientific advice, can be substantial. During 2001-2015, seven out of ten TACs exceeded advice, on average by 20% (Carpenter et al., 2016). The risk of deviation increases with stock size, number of countries involved in the fishery (the more countries fish for a stock the greater the deviation), level of fish consumption and the unemployment rate (Hoffmann et al., 2015). Still, the EU has agreed on that, at the latest by 2020, all stocks should be fished at a level allowing for them to produce long-term Maximum Sustainable Yield (MSY). Beyond the complex CFP, there are a number of other external or EU policies and regulations that directly or indirectly affect fisheries, to mention a few: the United Nations Convention on the Law of the Sea (UNCLOS), the Convention on Biological Diversity (CBD), the Habitats Directive, the Birds Directive and the Marine Strategy Framework Directive. For the future, there may be benefits of utilizing more innovative management objectives, such Maximum Economic Yield (MEY) instead of MSY, an integral part of e.g. Australian fisheries management. MEY implies a lower yield objective but allows for more profitable fisheries and has been shown to also lead to lower environmental impacts (Farmery et al., 2014) through reduction of effort with a “biological buffer” and possibly more proactively managed fisheries (Marchal et al., 2016). This may also support the progress towards ecosystem-based approaches to fisheries management (Pikitch et al., 2004), mandated not only from the CFP, but also through internationally agreements. The implementation of Ecosystem-Based Fisheries Management (EBFM) principles into operational fisheries management in various EU countries is challenging but is likely to affect future fisheries production.
The landing obligation for species with a TAC that was presented in the current CFP in 2013 (European Commission, 2013a) and is now being implemented at varying pace in EU fisheries through regional collaborations is intended to lead to lower discards and more selective fisheries. Another novelty in the 2013 CFP

SUSFANS
Report No. D10.3
65
was the possibility to distribute fishing quotas based on other aspects than fishing history in volume, e.g. based on transparent criteria measuring sustainability performance (European Commission, 2013a). While the distribution of TACs between countries is firm (regulated by the so called relative stability), a different distribution of national quotas between fleet segments or individual fishers might reduce environmental impacts, improve profitability, while landing the same volume of catch. On the longer-term, a changed distribution between member states, based on performance indicators could also be considered. The EU has fisheries partnership agreements (FPAs) with third countries, such as tuna agreements, which allows the EU fleet to exploit distant waters (EU, 2014). Furthermore, the EU plays an active role in 15 Regional Fisheries Management Organisations (RFMOs), which are organisations formed by countries with fishing interests in an area to safe-guard sustainable exploitation. The effects of the CFP will be tested in the models using a capture fisheries MSY scenario, based on the paper by Guillen et al. (2016), which summarizes the year 2013 TACs per fish stock and the estimated long-term MSY levels for key fish stocks in the Northeast Atlantic EU fishery. We simulate the full implementation of MSY by changing the EU capture fisheries production to these MSY levels starting in 2020. The MSY scenario calls for capture production from 2020 onwards to be approx. 895,000 tons (31%) higher than in the reference scenario. This production increase is comprised of an approx. 545,000 ton (48%) increase in catches of demersal (bottom-living) fish species and a 350,000 ton (20%) increase in catches of pelagic fish species (living higher in the water column). In addition, an additional scenario simulates the management of the EU fishery in accordance with MEY potential, which we assume to be at 80% of the estimated MSY potential. This is supposed to be a meaningful and realistic target (Froese et al., 2018) and close to the MEY catches estimated by Holt (2009) of about 85% of the MSY. This scenario calls for capture production from 2020 onwards to be approx. 142,000 tons (5%) higher than in the reference scenario, comprised of a 208,000 ton (18%) increase in demersal fish catches and a 66,000 ton (-4%) decrease in pelagic fish catches.
3.4.2 EU aquaculture policies In contrast to capture fisheries, the EU tries to promote growth in aquaculture production. This sector has failed to keep up with the global pace of growth, aquaculture being the fastest growing food production sector globally (FAO, 2018a) and Strategic Guidelines for the sustainable development of EU aquaculture were presented in 2013 (European Commission, 2013b). The European Commission is assisting with the identification of bottlenecks and

SUSFANS
Report No. D10.3
66
facilitates cooperation, coordination, and exchange of best practices between EU countries. In response to the Strategic Guidelines, member states are encouraged to develop multiannual national aquaculture development plans. These plans include specific aquaculture production growth objectives, and in addition also identify best practices and list best responses to the four strategic priorities included in the guidelines: reducing administrative burdens; improving access to space and water; increasing competitiveness; and exploiting competitive advantages due to high quality, health and environmental standards (European Commission, 2016). Aquaculture development is similar to fisheries also affected by environmental policies of the EU, such as the Water Framework Directive and the Marine Strategy Framework Directive, perhaps even stronger since new enterprises over a certain production volume need to perform an Environmental Impact Assessment. The effects of the EU aquaculture policy will be investigated using an aquaculture scenario, which simulates the full implementation of the multiannual national aquaculture development plans in member countries. In the period from 2013 to 2020, the objectives call for a combined aquaculture production increase of 437,000 tons (36%), comprised of 162,000 tons (25% increase) of freshwater fish, 133,000 tons (75% increase) of marine fish, and 142,000 tons of molluscs (25% increase).
3.4.3 Scenario implementation in GLOBIOM and CAPRI The present assessment includes three CFP-scenarios. We implement two scenarios on EU fish capture and one scenario affecting EU aquaculture production in two macro-economic models. The two models used for the CFP scenario estimations are GLOBIOM and CAPRI and the implementation is proceeded in a comparable way.
Scenario implementation in GLOBIOM
In order to analyse the EU fishery and aquaculture policies in the SUSFANS project, a fish module has been developed and integrated into the existing GLOBIOM model. The fish module covers global production, trade, and consumption of fish, fishmeal, and fish oil. Fish in the GLOBIOM model is defined as finfish, crustaceans, and molluscs contained in Divisions 1-5 of the International Standard Statistical Classification of Aquatic Animals and Plants (FAO, 2018a). They are disaggregated into 21 species-group production systems which map into 10 commodity products. Capture and aquaculture production systems are represented separately; they are linked by supplying the same product markets, and they are also linked via the feed markets, as aquaculture production requires fishmeal and fish oil. Aquaculture production also requires crop feeds, and the

SUSFANS
Report No. D10.3
67
aquaculture sector is thus also linked to the agriculture sector via the feed markets. Maximum levels of capture and aquaculture production in the model are constrained exogenously by a maximum production capacity. In practice, aquaculture production is further moderated by the changing costs of production (feeds) and consumers’ price sensitivity, while capture production ends up being determined completely exogenously. Similarly to the CAPRI model, policy scenarios are analysed against a reference scenario to 2030.
The MSY scenario in GLOBIOM is implemented by increasing the capture production capacity of EU countries in the Northeast Atlantic fishery from 2020 onwards. The increase is a percentage increase over the 2010 capture production levels in the GLOBIOM model, which are based on historical statistics (FAO, 2017). The value of the percentage increase is based on the percentage difference between 2013 TACs and long-term MSY levels in Guillen et al. (2016), and for the different GLOBIOM model species-group production systems they are: selected demersal fish1 +93%, other demersal fish2 +39%, and other pelagic fish3 +20%.
The MEY scenario in GLOBIOM is implemented by changing the capture production capacity of EU countries in the Northeast Atlantic fishery from 2020 onwards. The capacity for the GLOBIOM model species-group production systems of selected demersal fish, other demersal fish, and other pelagic fish is set at 80% of the levels under the MSY scenario (Froese et al., 2018; Holt, 2009).
The aquaculture growth scenario in GLOBIOM is implemented by changing the year 2020 aquaculture production capacity in EU countries to the levels stated or implied for that year in their Multiannual national aquaculture plans, while trying to match as best as possible the targeted fish species from the national plans to species-group production systems in the GLOBIOM model. For 2030, it is assumed that the annual levels of production increases envisaged in the national plans would continue for the entire decade between 2020 and 2030.
Scenario implementation in CAPRI
Within the SUSFANS project, a fish sector module has been developed operating as part of the global market module of the partial equilibrium model CAPRI (for
1 Lefteye flounders nei, Turbot, Bastard halibut, Atlantic cod, European seabass, Large yellow croaker, Red drum, Silver seabream, Gilthead seabream, Eastern pomfred, Japanese seabass, Puffers nei, Korean rockfish 2 ISSCAAP Groups 31-34 and 38, except species previously included in selected demersal fish and except mullets 3 ISSCAAP groups 35-37, except Tunas, Cobia, Japanese amberjack

SUSFANS
Report No. D10.3
68
detailed description see e.g. Heckelei et al. (2018)). This recent development is applied for assessing the impacts of different EU fishery policies. Impacts are investigated with respect to changes in fish stocks, aquaculture production, livestock and crop production, human consumption, prices and trade. In the present analysis, we compare all policy scenario results to a reference scenario for the year 2030.
As discussed in chapter 3.4.1, the largest volume of fish that can be harvested sustainably is the maximum sustainable yield. In CAPRI, catch quantities of aquatic products are given exogenously. The capture shift towards MSY is implemented based on projections from Guillen et al. (2016). Adjusted to CAPRI baseline capture quantities and the represented fish species, catching at maximum sustainable yield implies an increase in capture of about 12% for pelagic4 and 35% for demersal5 fish species in the CAPRI model by all EU member states. The capture changes diverge from the implemented shares in GLOBIOM due to differences in represented aquatic species between both models. In specific the pelagic fish group in CAPRI contains tuna which is not included in the GLOBIOM pelagic fish group. Based on these differences, the MSY shares are adapted in the scenario implementation.
The maximum economic yield is supposed to be more profitable and sustainable than the MSY. In the present analysis, the MEY is implemented as an 80% share of the MSY, everything else accordingly.
National aquaculture growth plans of EU member states are translated into policy scenario assumptions for 2030. For this purpose we assume that the growth foreseen in published targets could be extrapolated with a linear growth trend (more conservative than geometric) towards 2030. To avoid implausible increases a cut-off limit of 10 times the national 2010 aquaculture production level is implemented in the code. Considering that definitions in the published plan data and the model database may differ, a factor has been applied based on the historical data to acknowledge these differences. In Annex Table 1 national aquaculture growth targets are summarized for the EU member states. Aquaculture production quantities are provided for the reference year, which is either 2012, 2013, or 2014, and for the target year, for which the aquaculture production growth is planned (either 2020, 2022, 2023, or 2025). Under consideration of reference and target years in the respective national policy plans,
4 Cobia and swordfish, tuna, other pelagics (based on FAOstat pelagic fish group) 5 Major demersals, mullet (based on FAOstat demersal fish group)

SUSFANS
Report No. D10.3
69
annual aquaculture growth trends are calculated that are needed to reach the planned production quantity linearly. Based on historical aquaculture production data, the total aquaculture production target is allocated to three aquatic product groups, i.e. freshwater production, marine production, and molluscs.
3.4.4 Results and implications on SUSFANS indicators In the following, the GLOBIOM and CAPRI modelling results for the CFP scenarios are presented in comparison to the 2030 baseline scenario for the EU. First, the direct effects on production, consumption, trade and prices are shown. Second, further impacts are discussed applying the SUSFANS metrics concept.
3.4.4.1 GLOBIOM CFP results The table below shows selected results of the GLOBIOM scenario simulations aggregated across the 28 EU member countries.
The MSY scenario results in nearly a one million ton increase in capture production in the EU. Only a small portion (10%) of this production increases finds its way into increased food consumption in the EU. Instead, higher domestic production results in a small decrease in imports, while by far the strongest effect is a large increase in fish exports, where ultimately about 80% of the production increase ends up abroad. This result indicates that demand in other countries is more elastic and reacts more strongly to the decrease in market price. At any rate, the effect on world prices is relatively minor, given the fact that the EU catches represent only a small portion (5%) of global capture production.
The MSY scenario has no effect on aquaculture production in the EU, but this is not to say that there is no effect on aquaculture whatsoever. Aquaculture production globally increases close to 500,000 tons, mostly in Southeast and East Asia. This is the result of perhaps the strongest effect of the MSY scenario, which seems to be a 7% decrease in fishmeal market price. It’s notable that a million ton increase in capture production has such a strong knock-on effect on the aquaculture sector, albeit in a different region. This is an indication of the level of integration of the capture and aquaculture sectors, and the need for integrated analysis of these two sectors.

SUSFANS
Report No. D10.3
70
Table 11: GLOBIOM results as absolute values and relative change after policy compared to the baseline for EU 28 aggregate/average in 2030
Baseline quantities
1000t prices Euro/t
MSY quantities
1000t prices Euro/t
MEY quantities
1000t prices Euro/t
Aqua Plan quantities
1000t prices Euro/t
Total fish production 6,326 7,385 (17%)
6,565 (4%)
7,041 (11%)
Aquaculture production 1,117 1,117 (0%)
1,117 (0%)
1,832 (64%)
Capture production 5,209 6,268 (20%)
5,448 (5%)
5,209 (0%)
Meat production 53,580 53,580 (0%)
53,580 (0%)
53,580 (0%)
Cereal production 592,324 592,329 (0%)
592,343 (0%)
592,319 (0%)
Oilseed production 53,534 53,569 (0%)
53,543 (0%)
53,617 (0%)
Fish imports 6,963 6,850 (-2%)
7,027 (1%)
6,592 (-5%)
Fish exports 1,118 1,876 (68%)
1,365 (22%)
1,286 (15%)
Fish food consumption 11,678 11,797 (1%)
11,703 (0%)
11,854 (2%)
Fish market price 2,635 2,570 (-2%)
2,610 (-1%)
2,579 (-2%)
Salmon and trout production
404 404 (0%)
404 (0%)
629 (56%)
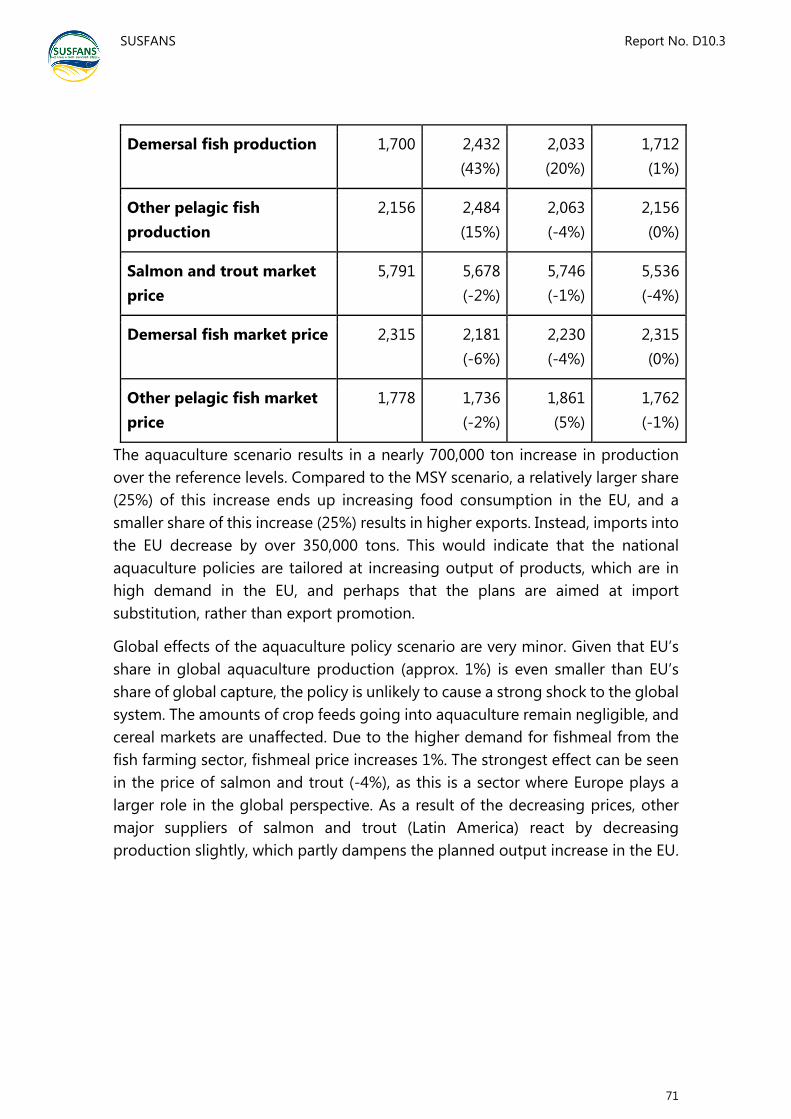
SUSFANS
Report No. D10.3
71
Demersal fish production 1,700 2,432 (43%)
2,033 (20%)
1,712 (1%)
Other pelagic fish production
2,156 2,484 (15%)
2,063 (-4%)
2,156 (0%)
Salmon and trout market price
5,791 5,678 (-2%)
5,746 (-1%)
5,536 (-4%)
Demersal fish market price 2,315 2,181 (-6%)
2,230 (-4%)
2,315 (0%)
Other pelagic fish market price
1,778 1,736 (-2%)
1,861 (5%)
1,762 (-1%)
The aquaculture scenario results in a nearly 700,000 ton increase in production over the reference levels. Compared to the MSY scenario, a relatively larger share (25%) of this increase ends up increasing food consumption in the EU, and a smaller share of this increase (25%) results in higher exports. Instead, imports into the EU decrease by over 350,000 tons. This would indicate that the national aquaculture policies are tailored at increasing output of products, which are in high demand in the EU, and perhaps that the plans are aimed at import substitution, rather than export promotion.
Global effects of the aquaculture policy scenario are very minor. Given that EU’s share in global aquaculture production (approx. 1%) is even smaller than EU’s share of global capture, the policy is unlikely to cause a strong shock to the global system. The amounts of crop feeds going into aquaculture remain negligible, and cereal markets are unaffected. Due to the higher demand for fishmeal from the fish farming sector, fishmeal price increases 1%. The strongest effect can be seen in the price of salmon and trout (-4%), as this is a sector where Europe plays a larger role in the global perspective. As a result of the decreasing prices, other major suppliers of salmon and trout (Latin America) react by decreasing production slightly, which partly dampens the planned output increase in the EU.
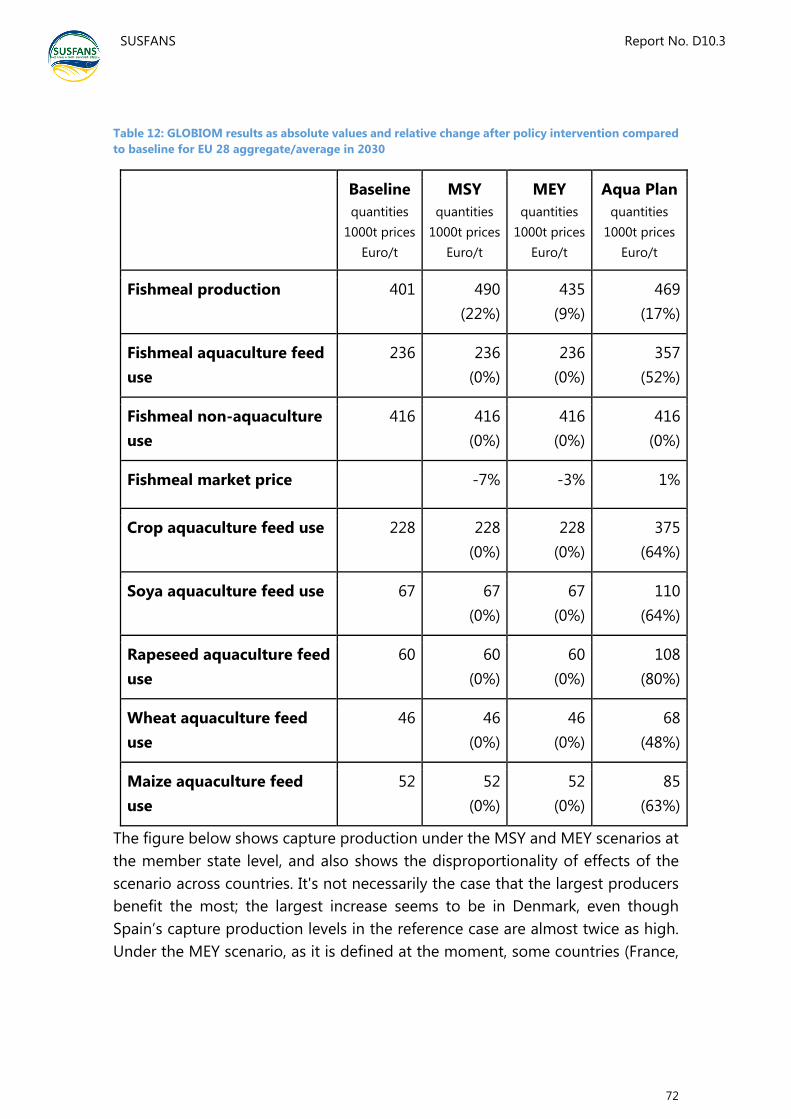
SUSFANS
Report No. D10.3
72
Table 12: GLOBIOM results as absolute values and relative change after policy intervention compared to baseline for EU 28 aggregate/average in 2030
Baseline quantities
1000t prices Euro/t
MSY quantities
1000t prices Euro/t
MEY quantities
1000t prices Euro/t
Aqua Plan quantities
1000t prices Euro/t
Fishmeal production 401 490 (22%)
435 (9%)
469 (17%)
Fishmeal aquaculture feed use
236 236 (0%)
236 (0%)
357 (52%)
Fishmeal non-aquaculture use
416 416 (0%)
416 (0%)
416 (0%)
Fishmeal market price -7% -3% 1%
Crop aquaculture feed use 228 228 (0%)
228 (0%)
375 (64%)
Soya aquaculture feed use 67 67 (0%)
67 (0%)
110 (64%)
Rapeseed aquaculture feed use
60 60 (0%)
60 (0%)
108 (80%)
Wheat aquaculture feed use
46 46 (0%)
46 (0%)
68 (48%)
Maize aquaculture feed use
52 52 (0%)
52 (0%)
85 (63%)
The figure below shows capture production under the MSY and MEY scenarios at the member state level, and also shows the disproportionality of effects of the scenario across countries. It's not necessarily the case that the largest producers benefit the most; the largest increase seems to be in Denmark, even though Spain’s capture production levels in the reference case are almost twice as high. Under the MEY scenario, as it is defined at the moment, some countries (France,

SUSFANS
Report No. D10.3
73
Netherlands, UK) might experience a reduction in catches compared to the reference scenario.
Figure 10: Capture production (1,000 t) by EU member states in 2030 for the reference (baseline), MSY, and MEY scenarios
The figure below shows the aquaculture production levels at the member state level under the reference scenario and the aquaculture policy scenario. In the model results, some countries (Netherlands, UK) are actually seeing lower production in the scenario than in the reference case. This is likely due to the fact that the scenario is implemented in GLOBIOM as an increase in production capacity, but the model has the option not to utilize the given capacity if production is unprofitable. It appears that the simultaneous increase in production in many of the same target species without a major shift in demand results in a decrease in market prices, and production in some higher-cost producing countries is crowded out by the new capacity.

SUSFANS
Report No. D10.3
74
Figure 11: Aquaculture production (1,000 t) by EU member states in 2030 for the reference (baseline) and aquaculture policy scenarios
Quantifiable SUSFANS indicators based on GLOBIOM results
In the following, the SUSFANS indicators and variables that can be composed based on the GLOBIOM output are presented. At the present state, the quantification of only a limited number of these metrics is feasible.
Planet: Reduction of environmental impacts
Direct indicators of environmental impacts (e.g. fuel use, GHG emissions, water use, energy use, fertilizer use, antibiotics use, pollution and waste, habitat conversion, etc.…) of either the capture or aquaculture production process are not yet implemented in the GLOBIOM model.
Indirect environmental impacts are partly accounted for via the accounting of the environmental impacts of the production of crop feeds required for aquaculture production. These potentially include land use, GHG emissions, N emissions, water use, soil fertility, etc...; however, the share of aquaculture feed use in the total crop feed use in the EU is extremely small (approx. one tenth of a percent, even in the aggressive aquaculture growth scenario), which means that these effects are negligible.
SUSFANS
Report No. D10.3
75
People: Balanced and sufficient diets for EU citizens
Even though the effects of the scenarios on aggregate fish food consumption (shown in Table above) are rather small, more significant results appear at the disaggregated commodity level. The aquaculture scenario shows the strongest effect in that freshwater fish food consumption increases 2%, salmon and trout 4%, and molluscs 5%; these increases reflect the species which are targeted in the national plans.
In the MSY scenario, which targets demersal and pelagic fish catch, food use of these fish increases by 2% and 1.4% respectively. It’s worth noting that a secondary effect is the increase of food consumption of salmon and trout (2%) and crustaceans (1.3%), which are not targeted by the policy, but benefit from the higher abundance and lower prices of fish meal.
People: Equitable outcomes and conditions
Since the share of seafood in the total EU food production and consumption is very small, the CFP and aquaculture scenarios have a negligible effect on the performance metrics of the aggregate sector. Instead, in the Table below we present the performance metrics for the fish sector. We can see that the scenarios have an effect on values in the EU, but have only a small effect on non-EU accessibility and no effect at all on non-EU availability.

SUSFANS
Report No. D10.3
76
Table 13: CFP induced changes regarding equitable outcomes and conditions among consumer system outcomes, indicators for EU and non-EU in 2030 for CFP scenarios for the aggregate fish sector
Equitable outcomes and conditions
Among consumer system outcomes
Aggregate indicator
Derived variable
Baseline MSY MEY Aqua Plan
Availability (EU)
Domestic food production
11.9 kg/capita/
year
13.7 kg/capita/
year
12.3 kg/capita/
year
13.2 kg/capita/
year
Availability (non-EU)
Domestic food production
20.4 kg/capita/
year
20.4 kg/capita/
year
20.4 kg/capita/
year
20.4 kg/capita/
year
Accessibility (EU)
Food consumption
22.2 kg/capita/
year
22.4 kg/capita/
year
22.2 kg/capita/
year
22.5 kg/capita/
year
Accessibility (non-EU)
Food consumption
19.2 kg/capita/
year
19.4 kg/capita/
year
19.3 kg/capita/
year
19.3 kg/capita/
year
Profit: Competitiveness of EU agri-food business
Again, because the share of seafood in the total EU aqua-agri-food production and trade is very small, the CFP and aquaculture scenarios have a negligible effect on the performance metrics of the aggregate agri-food sector. Instead, in the Table below we present the performance metrics for the aggregate fish sector, where we see results which confirm previously discussed findings. As would be expected, both the MSY and the Aquaculture scenario increase self-sufficiency, and reduce the EU seafood trade deficit. The MSY scenario helps to increase EU’s share in global exports much more than the aquaculture scenario, although here again we see that the EU is a relatively minor player in the global seafood export market.

SUSFANS
Report No. D10.3
77
Table 14: CFP induced changes regarding the competitiveness of EU seafood business, variables refer to the aggregated fish sector for EU28 in 2030
Competitiveness of EU agri-food (seafood) business
Performance metric
Derived variable
Formula Baseline
MSY MEY Aqua Plan
Trade and production
Openness
1.29 1.21 1.30 1.13
Trade and production
Self- sufficiency
0.52 0.59 0.53 0.57
Trade Export share
0.04 0.07 0.05 0.05
Trade Normalized trade
balance
-0.72 -0.52 -0.67 -0.67
3.4.4.2 CAPRI CFP results Selected CAPRI model outputs for the 2030 baseline scenario, the MSY and MEY policy scenarios and the implementation of national aquaculture production growth plans (aqua plan) are presented in the table below for EU-28 (EU) average.
Following the scenario design, total seafood production increases in all CFP scenarios compared to the 2030 reference case. The strongest increase in total fish production arises from the aquaculture growth policies (20%). Aquaculture production increases strongly by 112% compared to the reference situation in this scenario. In consequence of the capture policies, aquaculture production declines by 2%. This can be explained by the combination of simultaneous effects: Capture increases by 17% in the MSY scenario (14% in the MEY scenario) which increases domestic supply and translates into a strong increase of fish exports by 19% (15% in the MEY scenario). Imports of aquatic products (or seafood) decline (1-2%) but a drop in prices stimulates human consumption of these products slightly (0-1%).
In contrast, in the aquaculture policy scenario the amount of EU capture does not change at all with respect to the baseline scenario. The increase in domestic supply leads to a strong increase of EU exports from the fish sector. Especially producer but also consumer prices drop visibly.

SUSFANS
Report No. D10.3
78
Table 15: CAPRI results as absolute values and relative change after policy compared to baseline for EU average in 2030, *and other aquatic products
Baseline quantities 1000t
prices Euro/t
MSY quantities 1000t
prices Euro/t
MEY quantities 1000t
prices Euro/t
Aqua Plan quantities 1000t
prices Euro/t
Total fish* production
6,367 7,232 (14%)
7,059 (11%)
7,662 (20%)
Aquaculture production
1,152 1,131 (-2%)
1,134 (-2%)
2,447 (112%)
Capture 5,215 6,102 (17%)
5,924 (14%)
5,215 (0%)
Meat production
49,527 49,515 (0%)
49,517 (0%)
49,515 (0%)
Cereal production
311,289 311,245 (0%)
311,244 (0%)
311,424 (0%)
Oilseed production
40,782 40,776 (0%)
40,777 (0%)
40,778 (0%)
Fish* imports 8,152 8,010 (- 2%)
8,036 (-1%)
8,022 (-2%)
Fish* exports 3,539 4,208 (19%)
4,073 (15%)
4,665 (32%)
Fish* consumption
9,772 9,822 (1%)
9,810 (0%)
9,809 (0%)
Fish* producer price
2,828 2,765 (-2%)
2,776 (-2%)
2,396 (-15%)
Fish* consumer price
3,189 3,106 (-3%)
3,122 (-2%)
3,071 (-4%)
While meat, cereal and oilseed production do not shift in consequence of the implemented CFP measures, EU fishmeal and fish oil production and trade are strongly affected. The changes in fishmeal quantities and prices are summarized

SUSFANS
Report No. D10.3
79
in the table below. As fish oil changes follow a similar pattern, these are not displayed explicitly. EU fishmeal production does not reveal strong changes, however, the allocation of fishmeal for feed use changes. In the capture policy scenarios the decline in aquaculture production leads to a shift of fishmeal usage from aquaculture feed to land animal feed. The aquaculture policy results in the exact opposite effect, even though stronger in relative terms. To balance the additional fishmeal feed demand from aquaculture in this setting, fishmeal imports increase by 21%.
Table 16: CAPRI fishmeal results as absolute value and relative change after policy compared to the baseline for EU average in 2030
Fishmeal Baseline quantities 1000t
prices Euro/t
MSY quantities 1000t
prices Euro/t
MEY quantities 1000t
prices Euro/t
Aqua Plan quantities 1000t
prices Euro/t
Production 390 394 (1%)
393 (1%)
392 (0%)
Land animal feed
480 501 (4%)
497 (3%)
406 (-15%)
Aquaculture feed
166 161 (-3%)
162 (-2%)
373 (124%)
Imports 646 664 (3%)
660 (2%)
780 (21%)
Exports 390 394 (1%)
393 (1%)
391 (0%)
Producer price
1,283 1,242 (-3%)
1,250 (-3%)
1,396 (9%)
Capture quantities vary strongly between EU member states. As shown in the figure below capture quantities in the 2030 reference scenario range from 500t in Austria to 889,000t in Spain. Since capture is not affected by the aquaculture policies, capture quantities are at the same level as in the reference scenario. At the maximum sustainable yield, capture increases in all EU member states except for Czech Republic, Slovakia, Romania, and Hungary that reveal stable capture quantities. This is owed to the underlying scenario definition in CAPRI. The MSY as well as the MEY scenario affect only the demersal and pelagic fish groups. The listed countries however do no capture any of these in the CAPRI baseline

SUSFANS
Report No. D10.3
80
scenario. The increase in total capture of fish and other aquatic products in the MSY scenario depends for each country on the reference level of capture and the composition of total capture i.e. the respective importance of pelagic and demersal fish species. MEY results are not shown explicitly in the diagram since capture increases according to the MSY scenario only to a lower extent. So far, it cannot be assessed with CAPRI whether capture at MEY indeed is more economic than at MSY to justify the legitimacy of the MEY scenario.
Figure 12: Capture of fish and other aquatic products (1,000 t) by EU member state for the 2030 reference (baseline) scenario, MSY and national aquaculture plans (Luxembourg is aggregated to Belgium in CAPRI output)
As shown in the figure below, aquaculture production decreases slightly or stays nearly constant in the MSY scenario compared to the 2030 reference situation for all EU member states. In consequence of implementing the aquaculture growth plans aquaculture production increases strongly in almost all EU countries. Only in Czech Republic and Estonia production levels decrease. In comparison to the national aquaculture growth plans for 2020 to 2025, in most countries 2030 production exceeds these values following the implemented trends. However, in the cases of France, Hungary, Italy, Malta, and Spain the planned production levels are not reached in the Aqua Plan scenario. In these cases, the implemented cut off value of 10 times the historical production amount of 2010 comes into play and restricts production growth. Even though model feasibility considerations do not need to be applicable to real life cases, a critical assessment of the practical viability of these production growth plans may be a relevant analysis.

SUSFANS
Report No. D10.3
81
Figure 13: Aquaculture production (1,000t) by EU member state for the 2030 reference (baseline) scenario, MSY and national aquaculture plans in comparison to aquaculture growth targets for the respective target years between 2020 and 2025 (Luxembourg is aggregated to Belgium in CAPRI output)
An overview table of baseline, MSY and Aqua Plan scenario results by EU member state is provided in Annex Table 2.
The changes in the CFP also affect fish sectors outside the EU. Net production of aquatic products declines between 0.01% in North America and 0.86% in Oceania. The small but visible impacts in the rest of the world are entirely caused by changes in aquaculture production. Aquaculture production, taken individually, ranges between -0.1% in North America in the MEY scenario and an increase of 4.86% in North America as consequence of the implemented national aquaculture growth plans.
Quantifiable SUSFANS indicators based on CAPRI results
In the following, the SUSFANS indicators and variables that can be composed based on the CAPRI output are presented. At the present state, the quantification of only a limited number of these metrics is feasible. A more detailed description on the derivation of the different indicators and variables is given in context of the CAP policy assessment in chapter 3.3.3.2.
Planet: Reduction of environmental impacts
The presented fish scenario simulations are run without the CAPRI supply side module and thus without calculation of environmental indicators. Therefore we do not present greenhouse gas emission and soil nutrient balances for the tested

SUSFANS
Report No. D10.3
82
fish scenarios at this point. Nevertheless, at the current model state environmental balances are anyhow only influenced by changes in crop and land animal production. Environmental impacts from the fish sector are not yet accounted for in CAPRI. So far, we can compose one SUSFANS performance metric for quantifying the fish policy impacts on the planet, namely the preservation of natural resources (fish).
Table 17: CFP induced changes regarding the reduction of environmental impacts: The distance (%) to MSY for demersal and pelagic fish capture as estimated in the CAPRI MSY scenario on EU average
Reduction of environmental impacts
Preservation of natural resources (fish)
Fish group Baseline % Distance to
MSY
MSY % Distance to
MSY
MEY % Distance to
MSY
Aqua Plan % Distance to
MSY
Demersal fish 26 0 5 26
Pelagic fish 11 0 2 11
People: Balanced and sufficient diets for EU citizens
Human food consumption in the EU is not substantially affected by any of the fish policy scenarios. Total EU average calorie intake changes marginally (-0.01%) in all fish policy scenarios compared to the 2030 reference scenario. The highest, but still very small changes are found for the consumption of fish and other aquatic products. A consumption reduction of 0.48% in the MSY scenario and of 0.39% in the MEY scenario relative to the reference case in 2030 is estimated for the EU average. However, when national aquaculture expansion plans are considered, also EU average consumption of fish and aquatic products increases, even though also only by 1.97% compared to the reference case.
People: Equitable outcomes and conditions
SUSFANS equity indicators and variables can only partly be computed with the CAPRI model output. Those variables that are derivable are presented in the table below. However, no fish policy scenario seems to impact any of the variables in this performance metric domain neither in the EU nor in the aggregated rest of the world. The missing impact can be explained by the low share of seafood production relative to total agricultural production in the EU. Furthermore, the caloric contribution from fish and other aquatic products in the average EU diet is very low. Changes in the EU fish producing sector are offset by shifts in exports

SUSFANS
Report No. D10.3
83
and imports before they impact demand considerably. Trade effects are discussed in more detail in the following.
Table 18: CFP induced changes regarding equitable outcomes and conditions among consumer system outcomes, indicators for EU and non-EU in 2030, changes (%) are relative to the 2030 baseline scenario without policy intervention
Equitable outcomes and conditions
Among consumer system outcomes
Aggregate indicator
Derived variable
Baseline variable
value in EU
Baseline variable value
in non-EU
Change due to MSY or Aqua Plan (%) in EU and non-
EU
Availability Domestic food production
1.77 1,000t/
capita/ year
0.93 1,000t/ capita/
year
0
Availability Reduced share of animal protein
29% 29% 0
Accessibility Consumption 3,074 cal/ capita
2,400 cal/ capita
0
Utilization Share of fruit and vegetable
calories
7% 7% 0
Stability Cereal import dependency
12% 36% 0
Profit: Competitiveness of EU agri-food business
Some trade-related SUSFANS competitiveness variables are composable from the CAPRI scenario results. In comparison to the reference scenario, competitiveness of the total agricultural sector does not change much, if at all. Fish and other seafood production holds only a share of 1% in total net production of the sector as well as 3% in agricultural exports and 4% in agricultural imports based on the 2030 EU baseline scenario. Thus, a policy change targeted at the fish sector may not have a huge impact on EU agricultural competitiveness. However, competitiveness of the fish producing sector may indeed be affected by the assessed CFP measures. The SUSFANS competitiveness indicators are quantified for the seafood sector and presented in the table below.

SUSFANS
Report No. D10.3
84
Table 19: CFP induced changes regarding the competitiveness of EU seafood business, variables refer to the fish producing sector, underlying scenario results in Mio Euro for EU 2030
Competitiveness of EU agri-food (seafood) business
Performance metric
Derived variable
Formula Baseline
MSY MEY Aqua Plan
Trade and production
Openness
3.52 3.52 3.53 3.29
Trade and production
Self- sufficiency
0.44 0.48 0.47 0.53
Trade Export share
0.18 0.19 0.19 0.21
Trade Normalized trade balance
-0.35 -0.30 -0.31 -0.26
Compared to the 2030 baseline scenario, openness is nearly unchanged as consequence of the capture scenarios but decreases when the aquaculture growth plans are implemented. This can be explained by a strong EU production increase while changes in exports and imports are outweighing each other. Self-sufficiency increases in all CFP scenarios, strongest again in the aquaculture policy scenario. The export shares relative to world seafood exports increase in comparison to the reference scenario in consequence to all three policies. However, the values remain small which stresses the EU’s limited contribution to global seafood exports. The normalized trade balance is negative in all tested scenarios. Nevertheless, compared to the 2030 reference case the negative trade balances are declining triggered by increasing exports after all policy initiatives. Future CAPRI capture fish and aquaculture policy scenarios need to be run with both CAPRI modules to depict a more complete picture of the impacts on the SUSFANS policy dimensions. In the long run it would also be appreciated if direct environmental impacts arising from the fish sector were quantifiable within CAPRI.
3.4.5 Conclusions and next steps A comparison of the CAPRI and GLOBIOM fish models reveals some differences in the calibration of the two models in the reference runs, and also some differences in the magnitudes of the effects and the reactions to shocks. Generally, however, it is possible to draw several conclusions, supported by both models.

SUSFANS
Report No. D10.3
85
First, the size of the fish sector in the EU relative to the rest of the agri-food sector in the EU is relatively small, and fisheries and aquaculture scenarios therefore have little effect on the rest of the agricultural system in the EU.
Second, while EU seafood consumption has a major global impact due to EU’s seafood import dependency (Swartz et al., 2010), and this is also reflected in the modelling results presented above, the EU fisheries and aquaculture production sector is very small relative to the rest of the world. Therefore, the scenarios of EU policies tested here, which are focused on the production side, only have small impacts globally.
Third, because seafood is heavily traded globally, and because the EU is heavily engaged in trade, some of the strongest effects of the scenarios are on EU trade, rather than EU consumption. This might indicate that a strong complementary policy might be required on the demand/consumption side to go along with the primarily production-side focused policies of CFP and national aquaculture plans.
Finally, fishmeal and fish oil aquaculture feed markets provide a strong link between the capture and aquaculture sector. Carnivorous aquaculture production increases the pressure on wild fish stocks (Naylor et al., 2000). Therefore, secondary effects are observable from capture policies on the aquaculture sector and vice versa. This could suggest that EU aquaculture and capture policies be better thought of as a coordinated and integrated policy affecting a common seafood sector. One suggestion of a combined policy approach would be a restriction of growing aquaculture species that rely on fishmeal and fish oil from capture fish. Besides assessing the distance to maximum sustainable yields, no environmental indicator for the CFP scenarios is composed, or rather, due to the limited size of the fish sector, quantifiable agricultural pollution indicators would hardly change. However, pollution coverage from capture and aquaculture production in the models is deficient and maybe extended in the future. Only then, suggested measures for reaching an environmentally sustainable fish sector in the EU like fishing technologies or management systems (Hornborg et al., 2016) can be assessed with the models.

SUSFANS
Report No. D10.3
86
3.5 Market stabilisation policies The impacts of different EU storage policies on sustainable food and nutrition security in the EU are assessed using the GLOBIOM-X model. The policies are assessed from the short-term perspective (intra-annual) and long-term perspective. In the following, an overview on EU stabilization policies is given. On this basis, the policies for the model assessment are chosen. Model results with focus on the implications on SUSFANS performance metrics are presented and discussed thereafter.
3.5.1 Background on EU stabilisation policies The CAP has undergone significant changes over the past two decades, causing agricultural production and consumption to be more susceptible to changes on the market. The largest change in this direction was the decoupling of payments from production. With the introduction of the direct payment system, it became possible to switch between cropping activities without affecting the amount of support received. Due to these changes, the distorting impact of the CAP on trade and world markets has significantly reduced. For both producers and consumers, market support measures are still included in the CAP, however. On the producer side, intervention purchases at minimum guaranteed prices, as well as production limitations through quota or land set-aside influence the supply. On the consumer side, subsidized prices for certain products can influence the demand (Matthews et al., 2017).
Support to farmers and the agricultural sector in general can now be largely grouped into three themes: market management, farm income support and rural development aid. In this section of the deliverable we focus on those items of the CAP that are directly aimed at mitigating the fluctuations in prices, production, consumption and trade of agricultural products after a production shock is observed.
Public intervention aimed to stabilize internal markets through guaranteed prices as part of the CAP has gradually reduced, both with regard to the price producers get for products, the guaranteed quantities and the number of products eligible for the support (Matthews et al., 2017). It used to be organized through the public buying of products and storage at public facilities. Because of the gradual reduction of the public intervention system, the scope of the intervention system moved from a producer’s outlet of their products to a safety net measure (Arete
SUSFANS
Report No. D10.3
87
s.r.l., 2017). The current intervention prices at which products can be bought are EUR 101.31 per tonne of wheat, durum wheat, barley, sorghum, and maize, EUR 404.40 per tonne of sugar and 150.00 per tonne of rice. Over the 5-year period between 2009 and 2014, public intervention was used for wheat, barley and maize in 2009 and for wheat and barley in 2010 (Matthews et al., 2017). At the same time, storage capacity has significantly increased in Europe. Between 2005 and 2016, storage capacity increased by 20% to 359 million tonnes in the EU. The most notable rise in storage facilities is observed in Eastern Europe (Arete s.r.l., 2017).
The 2013 CAP reform also entails a risk management toolkit. The risk management toolkit can be triggered through significant production and price shocks and was introduced in the EU’s 2014-2020 Multiannual Financial Framework (MFF). It is financed for up to EUR 400 million per year, mostly through a reduction of direct payments. There are roughly three instruments that can take effect once major price and production shocks are observed: (1) financial contributions to crop and animal insurance; (2) financial contributions to mutual funds intended for financial compensations against economic losses related to environmental incidents; (3) an income stabilization tool that gives financial contributions once a severe drop in farmers’ incomes is observed. So far, the share of the funds spent as part of the risk management toolkit has been negligible, however (Matthews et al., 2017).
Next to the agricultural policies that are part of the CAP, also trade policies influence the situation of farmers and the agricultural sector. Trade policies are governed under the EU’s Common Commercial Policy (CCP). In terms of import tariffs, the WTO Uruguay Round reduced the amount of border measures. Export subsidies that were used to stabilize EU-markets have been largely removed. However, entry price systems and applied tariffs still exist for fruits, vegetables and cereals, amongst others (Matthews et al., 2017).
3.5.2 EU market stabilisation policies Different strategies to reduce yield vulnerability and to mitigate the negative effects of production shocks on output prices and food availability can be envisaged. Based on the 2013 CAP reform and recent policy debates we can distinguish three main themes that directly lead to potential stabilization policies: (1) The increased need for crisis risk management under the expectation that extreme climatic events will become more frequent and of a more severe

SUSFANS
Report No. D10.3
88
magnitude; (2) the increase in storage facilities that is observed over the past decade, mostly privately organized; (3) the decrease in market support measures such as intervention schemes. Based on these three main themes we construct the five scenarios listed below. These scenarios will be implemented in GLOBIOM-X, a non-stationary model for market stabilization policy design that has been developed as part of the SUSFANS project (Boere et al., 2018).
1. Base: This is the baseline scenario where yields remain stable over the entire simulation period of 20 time-steps. GLOBIOM-X is run over these time-steps without recursivity on land cover and trade and without changes to the exogenous parameters population, diets and technological change of crops. The reasoning behind this is that short-term fluctuations will not directly influence land expansion or lead to the establishment of new trade relationships. To disentangle the effects of supply shocks from other exogenous changes, we assume demand and crop management will remain constant. However, there will still be recursivity between simulation runs of the model on agricultural decisions within the respective land cover classes (e.g. changes in land use and crop management). For more information on the base scenario we refer the interested reader to D8.6 of SUSFANS (Boere et al., 2018).
2. NoStore: Compared to the baseline scenario, this scenario includes yield variability on a 200x200 km resolution caused by a severe drought. In section 3.5.3 we explain how the effects of the drought on different crop yields are calculated and how this is integrated in GLOBIOM-X. There are no specific policies introduced, meaning that any adaptation to the yield variability must come from autonomous market-based incentives that do not directly require government action, such as a change in management systems, increase in the area allocated to a certain crop, or a change in the demand for food or feed production.
3. Store: The goal of public storage facilities is to stock surpluses of crops in times of good harvests to make up for deficits in times of bad harvests. Although highly debated, storages are hereby able to mitigate price spikes and allow people access to food during periodic shortages in production. In the store scenario, we allow storage in the EU for all crops that are simulated to be affected by droughts. Storage facilities are modelled according to their 2000 capacity and initial stock level. Although there is

SUSFANS
Report No. D10.3
89
debate on the exact levels of both public and private storages, three major databases exist that report world-wide storage levels: the FAOstat which contains details on stock variation between calendar years, the USDA which contains detail on beginning and ending stock and the International grain Council (IGC) which reports selected data on world and country level. These three datasets are integrated in FAOamis, the Agricultural Market Information System of the FAO (FAO, 2018b). We choose to follow the USDA storage levels to define the 2000 beginning stock levels and set the maximum storage capacity at 1.5 times this level. Storage is implemented at the level of the 5 GLOBIOM EU-regions6.
4. StoreUnlim: This policy follows the assumptions of the Store scenario, with the exception that here, unlimited storage facilities are assumed to be available.
5. StoreUnlimInt: This policy follows the assumptions of the StoreUnlim scenario, with the exception that here, producers are able to sell their crops to storage facilities against a guaranteed intervention prices. Under higher prices, the storage facilities will sell the crops to the market. Intervention prices are the currently applicable prices of EUR 101.31 per tonne of wheat, durum wheat, barley, and maize. Stock clearance for other crops is set at 110% of the base-level price.
3.5.3 The cause of market instability: production shortfalls For the assessment of the effectiveness of market stabilization policies in reducing price spikes and improving food availability, we first have to quantify shortfalls in production that are based on realistic weather events. For this, we use the impact of droughts on crop production. To identify the impact of droughts on yield and production changes, we use the Standardized Precipitation Evapotranspiration Index (SPEI), calculated for the most important rainfed crops in Europe at a 1x1 km resolution over the past 22 to 25 years. The SPEI is a meteorological drought
6 The EU-regions are EU_Baltic, EU_Central-East, EU_MidWest, EU_North, and EU_South, where EU_Baltic represents Estonia, Latvia and Lithuania; EU_CentralEast represents Bulgaria, Czech Republic, Hungary, Poland, Romania, Slovakia and Slovenia; EU_MidWest represents Austria, Belgium, France, Germany, Luxembourg and the Netherlands; EU_North represents Denmark, Finland, Ireland, Sweden, and the UK; EU South represents Cyprus, Greece, Italy, Malta, Portugal and Spain.

SUSFANS
Report No. D10.3
90
index that measures the onset, duration and magnitude of drought conditions with respect to normal conditions at every location (Vincente-Serrano et al. 2010). The SPEI is calculated based on long-term frequency distribution of water deficit defined as precipitation minus potential evapotranspiration with monthly time steps, from 1990-1995 to 2017. The values are obtained from the CGMS25 database and, therefore, starting years vary between 1990 and 1995. Based on the SPEI value and the historic data, various drought scenarios can be composed. The SPEI value quantifies how rare a given water deficit is with respect to the frequency distribution. Potentially hazardous months in terms of droughts are those with a negative SPEI value, e.g. less than -1 or -2; potentially hazardous months in terms of wetness are those with positive SPEI values, e.g. higher than 1 or 2. The SPEI is available for all months and as the average of the growing season. To calculate the effects of droughts on crop yields, drought scenarios are created. We identify years for which the mean European growing season SPEI ranging from April to September, is below a certain threshold, indicating drought. Considering the different drought characteristics such as frequency, severity, duration or extend, we create different drought scenarios: (i) area under drought as percentage of European cropland with SPEI <= -1 (ii) area under severe drought as percentage of European cropland with SPEI <= -1.5 (iii) most severe drought over Europe as aggregated SPEI index. In combination with the process-based crop model EPIC, this will lead to a yield shock defined as the ratio of a crop yield under the selected SPEI drought shock to a crop yield based on normal (average) conditions. To be able to use the yield shocks further down in the analysis within the model, we aggregate the data to a 200x200km resolution. Zero yield values, which are artefacts of the EPIC modelling process, are excluded. Resulting yield shocks will be implemented in GLOBIOM-X (Boere et al., 2018). The model is based on the bio-economic land use model GLOBIOM and tailored to include inter-annual yield fluctuations, producers’ expectations and adaptation options such as storage. The model assesses the market stabilization measures storage, increased storage capacity, and intervention buying as market intervention mechanisms. Impacts are investigated with respect to changes in production, consumption, trade and prices of crops directly affected by a yield shock, as well as agricultural activities affected more indirectly, such as alternative crop and livestock activities. In the present analysis, we compare all policy

SUSFANS
Report No. D10.3
91
scenarios over a 20 year period, where yield fluctuations occur after a 5 year period. Figure 14 shows the yield shock defined as the ratio of a crop yield under the selected SPEI drought shock to a crop yield based on normal (average) conditions for the simulated crops wheat, maize, rapeseed, potatoes, sunflower and soybean.

SUSFANS
Report No. D10.3
92
Figure 14: Yield shock defined as the ratio of a crop yield under the selected SPEI drought shock to a crop yield based on normal (average) conditions for the simulated crops wheat, maize, rapeseed, potatoes, sunflower and soybean

SUSFANS
Report No. D10.3
93
3.5.4 Results and implications on SUSFANS indicators Crop losses caused by droughts lead to an increase in price of those crops because the production cannot fulfil the expected demand anymore. In subsequent years, under the expectation that this might happen again, profit-maximizing producers are likely to allocate a larger part of their land, or more intensive management to the production of the respective crops, acting based on the price increase. This autonomous adaptation may only take place in the next year with the planting decisions. Furthermore, trade should allow for the maximum use of current availabilities of products, thereby compensating regions that are more impacted by droughts with regions that are less impacted by droughts. In addition to these autonomous adaptations, storage and intervention buying may mitigate yield shocks. In this section, we will first highlight the results for the different scenarios for the crops barley, wheat, maize and potatoes at the EU level, then highlight the differences in spatial land decision making and subsequently analyse the impacts of the different scenarios on the SUSFANS-indicators. Figure 15 shows the impact of different storage policies on the average price of the product in the EU. It is immediately obvious from the figure that storage helps to mitigate price variability. In the NoStore scenario, prices rise with respectively 52.4, 19.7, 17.2, and 18.5% compared with the price of the Store scenario. The effects of both, the quantity of storage and the possibility of intervention prices are crop-dependent, however. For both barley and maize, unlimited storage possibilities in combination with intervention prices (StoreUnlimInt) lead to the second largest price volatility. This is likely due to the possibility of storing these crops against favourable prices. With a large price deviation between domestic and world markets, price volatility can be introduced not only through shocks, but also through production increases aimed at equalizing domestic and world market prices in one year, leading to an overflow of stored products on the market in the next year. In the case of wheat, the Store scenario leads to the second largest price volatility, meaning that the crop could profit from increased storage facilities.

SUSFANS
Report No. D10.3
94
Figure 15: Price developments for barley, wheat, corn and potatoes after a yield shock is observed
Figure 16 shows the impact of the different policy scenarios on trade. All scenarios show an increase in the variability of trade compared to the base scenario. For all crops however, trade flows are most stable the least under the scenario of only autonomous adaptation and no storage options. In fact, the larger the maximum amount that can be stored, the higher the variability in net trade between years. This is due to the fact that producers are able to oversupply the markets, storing products in one year, and under supplying in the following year. Moreover, intervention prices (StoreUnlimInt) lead to lower exports compared to a situation without intervention prices and unlimited stocks (StoreUnlim). In this case, storing is likely more favourable for the producer than exporting.

SUSFANS
Report No. D10.3
95
Figure 16: The impact of the different policy scenarios on trade
Changes in consumption between the different scenarios can be found in Figure 17. Except for potatoes, a situation without storage has the least impact on consumption. In general, consumption increases in situations with unlimited storage possibilities. Especially in the case of with maize with unlimited storage and intervention prices (StoreUnlimInt), consumption never drops below the base level consumption. This is correlated with the decreased level of trade for maize in the same scenario. Hence, the difference that exists between world market prices and domestic prices make it more favourable for producers to supply to storage facilities instead of the world market.

SUSFANS
Report No. D10.3
96
Figure 17: Changes in consumption between the different scenarios
The differences between the scenarios that can be found for trade and consumption are reflected also in the changes to area allocation. Even in the base scenario, small differences in area allocation between the years can be found. This is mostly an artefact of the model; there are multiple optimal solutions which lead to the same prices, consumption and trade, but slightly different area allocations. This variability is magnified under the situations with a yield shock. Without any storage possibilities (NoStore), there is a significantly lower area allocation for both wheat and potatoes. Unlimited storage possibilities with intervention prices lead to the highest area allocation for maize and potatoes. This mostly goes to domestic consumption and in the case of potatoes also to increased exports.

SUSFANS
Report No. D10.3
97
Figure 18: Difference in producer’s decision making on area allocation between a scenario without storage (NoStore) and a scenario with storage (Store)
As an illustration, Figure 18 shows the difference in producer’s decision making on area allocation between a scenario without storage (NoStore) and a scenario with storage (Store). The differences in area allocation because of the current storage capacities are generally small, which is likely due to the limited storage capacities currently available. In the case of maize, Store especially avoids land reallocation in Italy, but leads to slightly more land reallocation in the South-East of Europe. Italy is also one of the regions where maize yields are affected most by the yield reduction. In the case of potatoes, Store especially leads to less land conversion in the North-West of Europe, but leads to more land conversion in

SUSFANS
Report No. D10.3
98
Spain and Eastern Europe. Potato yields actually increase in the North-Eastern part of Europe, but decrease in the North-Western and South-Eastern part.
Figure 19: Area change that is saved because of storage for maize and potatoes in 1000 ha (negative numbers imply more area change with storage, positive numbers imply less area change with storage)
Quantifiable SUSFANS indicators
We have computed the SUSFANS indicators for the product group cereals, which, based on the crops included in the model, consists of barley, maize, rice, wheat and sorghum.
Planet: Reduction of environmental impacts
The presented stabilization scenario simulations are run without recursivity on land cover change, meaning that the land cover cropland remains constant over time. The reasoning behind this is that supply shocks are assumed to not lead to land cover conversion on the short term. Only when shortages are systematic and variability frequent production adjustments will eventually not only be made based on a change within the land cover cropland, but also in competition with other land cover classes. This assumption has an implication for the calculation of annual GHG emissions, i.e. emissions might be underestimated. However, differences in emissions from crop production can still be calculated. These differences are a result of crop intensification and changes between crops and are reported in the table below. The largest percentage changes in GHG emissions are observed in Central-East and Midwest regions and for NoStore and Store scenarios. Changes under unlimited storage scenarios are smaller, mostly because here large parts of the intensification already occurred before shock, because the increase in production could be stored against a favourable price.

SUSFANS
Report No. D10.3
99
Table 20: Storage policy induced changes regarding the reduction of environmental impacts: Percentage change in GHG emissions obtained from crop production in the year immediately after a production shock. Cereals are defined as barley, corn, wheat, rice, sorghum and millet.
Reduction of environmental impacts
Greenhouse gas emissions
EU Region Base NoStore Store StoreUnlim StoreUnlimInt
Central-East 153 152 3.76 5.20
Mid-West 146.3 146.3 0.24 -2.76
South -4.62 -5.07 0.67 -1.49
People: Equitable outcomes and conditions
SUSFANS equity indicators and variables related to equitable outcomes and conditions that can be derived using GLOBIOM-X are presented in the table below. Equity indicators are computed as the difference between the time-step just after the shock and the time-step of the shock and are computed for the aggregate cereals (rice, wheat, barley, maize and sorghum). Consumption, production, prices and import dependency are all significantly affected by the production shock. In all cases, an increase in production and prices and a decrease in imports is observed.
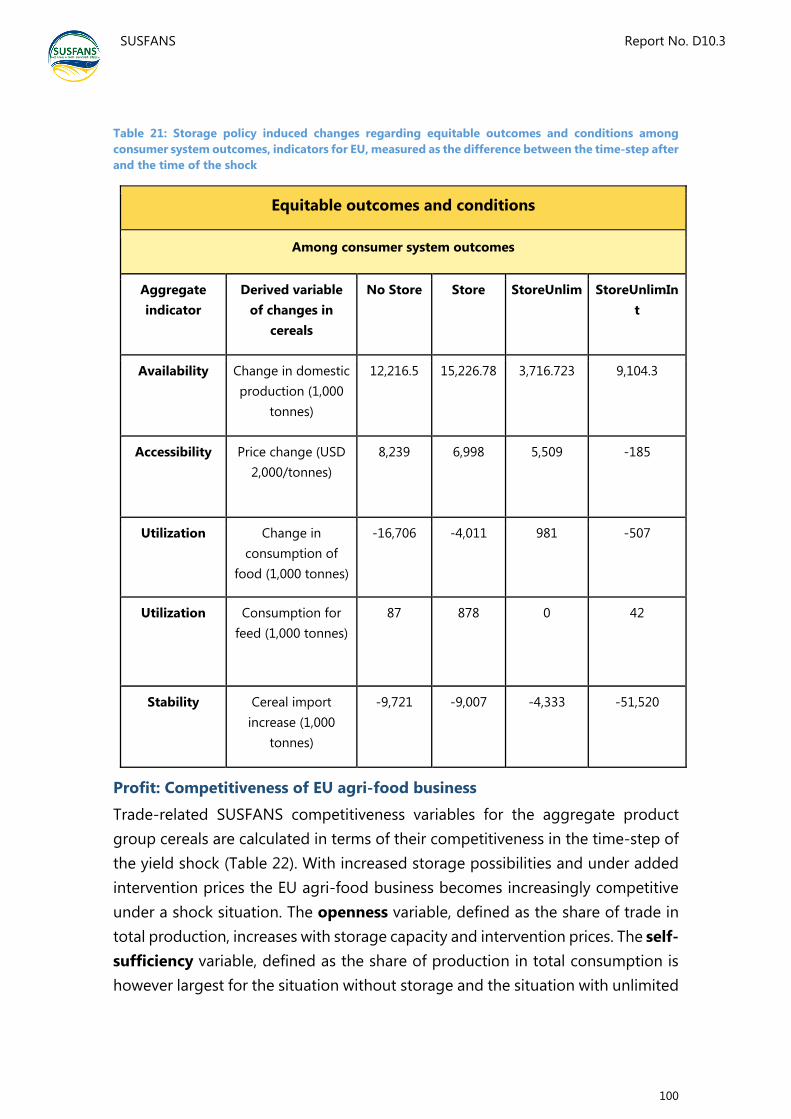
SUSFANS
Report No. D10.3
100
Table 21: Storage policy induced changes regarding equitable outcomes and conditions among consumer system outcomes, indicators for EU, measured as the difference between the time-step after and the time of the shock
Equitable outcomes and conditions
Among consumer system outcomes
Aggregate indicator
Derived variable of changes in
cereals
No Store Store StoreUnlim StoreUnlimInt
Availability Change in domestic production (1,000
tonnes)
12,216.5 15,226.78 3,716.723 9,104.3
Accessibility Price change (USD 2,000/tonnes)
8,239 6,998 5,509 -185
Utilization Change in consumption of
food (1,000 tonnes)
-16,706 -4,011 981 -507
Utilization Consumption for feed (1,000 tonnes)
87 878 0 42
Stability Cereal import increase (1,000
tonnes)
-9,721 -9,007 -4,333 -51,520
Profit: Competitiveness of EU agri-food business
Trade-related SUSFANS competitiveness variables for the aggregate product group cereals are calculated in terms of their competitiveness in the time-step of the yield shock (Table 22). With increased storage possibilities and under added intervention prices the EU agri-food business becomes increasingly competitive under a shock situation. The openness variable, defined as the share of trade in total production, increases with storage capacity and intervention prices. The self-sufficiency variable, defined as the share of production in total consumption is however largest for the situation without storage and the situation with unlimited

SUSFANS
Report No. D10.3
101
storage and intervention prices. For the situation without storage, this is related to the lower level of consumption. The normalized trade balance is highest for the Store and StoreUnlim scenarios, implying that storage benefits the trade balance, but that intervention prices work more trade-distorting. More precisely, compared to a shock without storage, the trade balance increases by 0.08 in the case of limited storage and 0.12 in the case of unlimited storage. With intervention prices, it decreases by 0.09, however. The available stocks in total production are by far largest in the case of StoreUnlimInt; however, surprisingly the share of the uptake in consumption is lowest here. This might be due to the model assumption that the uptake of stocked crops takes place against the same price as the storage of those crops. As long as imported products are cheaper than this price, very little consumption of stocked products will happen.
Table 22: Storage policy induced changes regarding the competitiveness of EU agri-food business, SUSFANS competitiveness indicators calculated in the time-step in which the yield shock occurs
Competitiveness of EU agri-food business
Performance metric
Derived variable
Formula No Store
Store StoreUnlim
StoreUnlimInt
Trade and production
Openness
0.45 0.49 0.50 0.51
Trade and production
Self-sufficiency
1.12 1.08 1.06 1.19
Trade Normalized trade
balance
-0.23 -0.15 -0.11 -0.32
Trade and production
Production buffer
0.05 0.12 0.45
Trade and consumption
Consumption buffer
0.05 0.08 0.01
3.5.5 Conclusions and next steps The previous CAP reforms have led to an adjustment of EU’s internal prices to world market prices, thereby enhancing the EU’s position as a net exporter of

SUSFANS
Report No. D10.3
102
cereals. However, the EU remains an importer of e.g. maize and oilseeds, and at the same time, the world market is experiencing an increasing degree of production and price volatility. Storage facilities can therefore play an important role in ensuring a steady supply of products at reasonable prices (Arete s.r.l., 2017).
In this section, we apply a model developed as part of SUSFANS D8.6, GLOBIOM-X. The model is used as a tool for policy design aiming at the stabilization of agricultural commodity markets. Three different stabilization options, storage at current levels, unlimited storage, and unlimited storage in combination with intervention prices are compared to a situation without drought a drought scenario and a situation with a drought scenario but without storage possibilities. The comparison of these policies leads us to the following main conclusions:
(1) Storage policies help to reduce price volatility caused by yield shocks and increase the openness and competitiveness of the sector;
(2) Intervention prices are distortive and enhance price volatility compared to a situation with only storage options;
(3) Storage is able to circumvent spatial reallocation of crops to a limited extend;
(4) Storage with intervention prices drives a wedge between the domestic and the world market, leading to larger differences in trade and consumption.
The current model can be improved in several ways. First, we have seen that moderate yield fluctuations may lead to very large changes to prices in the short run. One reason for these large price reactions are the naïve way in which price expectations are set. Thus far, price expectations are taken as the result of observed prices of the previous time-step. The reason for doing so is test the model performance to over- and under-shoot in terms of prices, area allocation and production, and to evaluate its capacity to oscillate, converge and diverge from its original equilibrium. A further calibration of prices and the interactions of prices and yields under shocks may improve the representation of the model. Results of the econometric modelling framework may be used to set more realistic price expectations and to better inform reactions on the supply and demand side. Second, whereas crop allocation decisions are fixed and based on expected prices, we have assumed that livestock activities are allowed to freely adjust based on full information on prices. This may not lead to a correct representation of the interaction between the crop and livestock sector. Third, the work can be further extended by including recursivity on landcover change and

SUSFANS
Report No. D10.3
103
trade relationship as well as through the calibration of historical price patterns and storage behaviour.
Nevertheless, the results show the trade-offs between different levels of storage possibilities and guaranteed prices for different crops and at different spatial locations. Based on the results, it is recommended to expand storage possibilities, but make them as competitive with the world market as possible, in order to achieve the desired effect on reducing price volatility, but at the same time not act in a trade distortive way.

SUSFANS
Report No. D10.3
104
4 OVERALL CONCLUSIONS AND NEXT STEPS This deliverable described and assessed the impacts of a distinct set of policies focussing on health and nutrition, the animal sector in the context of the CAP, fishing quota and aquaculture policies under the CFP, and storage and intervention policies for market stabilisation. The purpose was to test the improved foresight models of the SUSFANS toolbox and to offer directions for promising further modelling improvement and the design of final foresight work in the project.
The policies assessed all show some potential to strengthen sustainable food and nutrition security. However, results indicate trade-offs between policy goals as expected and it is clear that single policy approaches will not move the agro-food system towards higher food and nutrition security with respect to all its dimensions. The deliverable provided valuable information for the further work in work package 10, specifically the assessment of policies for different scenario narratives as targeted in D10.4. This activity will combine the variation of food system drivers with the design of policy scenarios to allow for a more comprehensive policy evaluation under different boundary conditions.
The following next steps can be identified for the different policy areas:
Health and nutrition policies need to be assessed quantitatively including a full functioning link between SHARP and MAGNET. Not only by themselves but also anticipating changes in well-established policies like the CAP, CFP and potential stabilization policies. These producer-focussed policies will alter the food system and may thus affect consumer diets. Within this broader policy context we propose to establish the responsiveness of the European diets to a combination of taxes and subsidies to reach the targeted changes of nutrient intakes. Given the sizeable gap between desired and projected trends, the size of required taxation levels can be expected to exceed politically feasible levels and/or cause too large undesired substitution effects as measured by the SUSFANS nutrition metrics. We will then complement the taxes/subsidies with a consumer preference shift, which is a very rough proxy for various interventions into the consumer decision-making process. The result scenario will by design meet the scenario targets and can be evaluated along the four dimensions of the SUSFANS metrics (health and nutrition, profitability, environment and equity).
The range of reform options of the CAP currently debated by politicians across the EU are not very likely to affect the EU food and nutrition security to a large

SUSFANS
Report No. D10.3
105
extent. Only more radical measures will make a difference with respect to environmental sustainability indicators in the EU and may affect nutrition positively. The restriction on animal stocking densities assessed here showed the direction where imposing costs on the animal sector will move the food system. However, it also showed that a policy only implemented by the EU under current WTO rules will lead to environmental leakage through the change of trade flows. We need to discuss if it is worthwhile combining trade policy restrictions with sectoral policies under some narratives for the final foresight work in the project. Also on the quantification side, some more work is needed to provide a more complete and more accurate set of SUSFANS metrics based on the model output. The CAP policy assessment demonstrated that the CAPRI model nutrient output requires some further refinement, best in reconciliation with the dietary models involved in the project. Highly aggregated nutrition results derived from food availability data tend to overestimate intakes and are inexpedient for the composition of nutrient based summary scores.
The CFP options show some similar issues as just mentioned above. Because seafood is heavily traded globally, and because the EU is heavily engaged in trade, some of the strongest effects of the scenarios are on EU trade, rather than EU consumption. This might indicate that a strong complementary policy might be required on the demand/consumption side to go along with the primarily production-side focused policies of CFP and national aquaculture plans. Apart from assessing the distance to maximum sustainable yields, no direct environmental indicators for the fishery and aquaculture production can be currently calculated. Only indirect environmental impacts in other sectors are quantified, but those reactions are small. It is outside the scope of SUSFANS, but coverage of emissions from capture and aquaculture production in the models needs to be extended in the future. One improvement that should and will be implemented within SUSFANS is a more differentiated definition of MSY and MEY scenarios by countries which will make such foresight study more realistic.
Some further steps improving the ability to model volatilities and thereby market stabilization policies are envisaged. Additional attention to the calibration and interactions of prices and yields under shocks may improve the representation of the model. Results of the econometric modelling framework may be used to set more realistic price expectations and to better inform reactions on the supply and demand side. Also, whereas crop allocation decisions are fixed and based on expected prices, we have assumed that livestock activities are allowed to freely

SUSFANS
Report No. D10.3
106
adjust based on full information on prices. This may not lead to a correct representation of the interaction between the crop and livestock sector.
Some technical issues regarding the SUSFANS metrics and presentation of results shall be pointed out at the end in terms of the following bullet points
To set model results into policy context, policy targets for the different SUSFANS variables need to be selected or derived. Here, the compatibility to modelling results with respect to variable selection, time and spatial scales is an important aspect.
Similarly, reference points for policy targets need to be set, i.e. the "null line” in the spider diagram requires definition.
Agreement is needed on which indicators and metrics (with precise formulas) are to be calculated by which models.
An automation of model output compilation with reporting templates would help
All of the above is required to achieve the clearly defined production and easy understandability of the SUSFANS visualization tool (the spider diagram).
SUSFANS
Report No. D10.3
107
5 REFERENCES Allais, O., Bertail, P., Nichèle, V., 2010. The Effects of a Fat Tax on French
Households’ Purchases: A Nutritional Approach. Am. J. Agric. Econ. 92, 228–245. https://doi.org/10.1093/ajae/aap004
Allan, J.D., Abell, R., Hogan, Z., Revenga, C., Taylor, B.W., Welcomme, R.L., Winemiller, K., 2005. Overfishing of inland waters. Bioscience 55, 1041–1051. https://doi.org/10.1641/0006-3568(2005)055[1041:OOIW]2.0.CO;2
Appleton, K.M., Hemingway, A., Saulais, L., Dinnella, C., Monteleone, E., Depezay, L., Morizet, D., Armando Perez-Cueto, F.J., Bevan, A., Hartwell, H., 2016. Increasing vegetable intakes: rationale and systematic review of published interventions. Eur. J. Nutr. 55, 869–896. https://doi.org/10.1007/s00394-015-1130-8
Arete s.r.l., 2017. Study on Storage Capacity and Logistical Infrastructure for EU Agricultural Commodities Trade. With a special focus on Cereals, the Oilseed Complex and Protein Crops (COP). (Final Report). European Commission, Luxembourg.
Balcombe, K., Fraser, I., Falco, S.D., 2010. Traffic lights and food choice: A choice experiment examining the relationship between nutritional food labels and price. Food Policy 35, 211–220. https://doi.org/10.1016/j.foodpol.2009.12.005
Barnes, A., Sutherland, L.-A., Toma, L., Matthews, K., Thomson, S., 2016. The effect of the Common Agricultural Policy reforms on intentions towards food production: Evidence from livestock farmers. Land Use Policy 50, 548–558. https://doi.org/10.1016/j.landusepol.2015.10.017
Bartolini, F., Viaggi, D., 2013. The common agricultural policy and the determinants of changes in EU farm size. Land Use Policy 31, 126–135. https://doi.org/10.1016/j.landusepol.2011.10.007
Boere, E., Havlík, P., Gaupp, F., Ermolieva, T., 2018. Models for designing policies aimed at market stabilization (Deliverable No. 8.6), SUSFANS project H2020/ SFS-19- 2014: Sustainable food and nutrition security through evidence based EU agro-food policy, GA no. 633692.
Boulanger, P., Dudu, H., Ferrari, E., M’barek, R., Philippidis, G., 2017. 2030 European agricultural policy: A new CAP at a crossroad between market competitiveness and sustainability. Presented at the 20th Annual Conference on Global Economic Analysis, West Lafayette, IN USA.
Boulanger, P., Philippidis, G., 2015. The EU budget battle: Assessing the trade and welfare impacts of CAP budgetary reform. Food Policy 51, 119–130. https://doi.org/10.1016/j.foodpol.2015.01.004
Brambila-Macias, J., Shankar, B., Capacci, S., Mazzocchi, M., Perez-Cueto, F.J.A., Verbeke, W., Traill, W.B., 2011. Policy Interventions to Promote Healthy

SUSFANS
Report No. D10.3
108
Eating: A Review of What Works, What Does Not, and What is Promising. Food Nutr. Bull. 32, 365–375. https://doi.org/10.1177/156482651103200408
Britz, W., Witzke, H.-P., 2014. CAPRI model documentation 2014. Broers, V.J.V., De Breucker, C., Van den Broucke, S., Luminet, O., 2017. A systematic
review and meta-analysis of the effectiveness of nudging to increase fruit and vegetable choice. Eur. J. Public Health 27, 912–920. https://doi.org/10.1093/eurpub/ckx085
Bucher, T., Collins, C., Rollo, M.E., McCaffrey, T.A., De Vlieger, N., Van der Bend, D., Truby, H., Perez-Cueto, F.J.A., 2016. Nudging consumers towards healthier choices: a systematic review of positional influences on food choice. Br. J. Nutr. 115, 2252–2263. https://doi.org/10.1017/S0007114516001653
Buckley, C., Fealy, R., 2012. Intra-national importation of pig and poultry manure: acceptability under EU Nitrates Directive constraints [WWW Document]. URL https://www.ingentaconnect.com/content/iagrm/ijam/2012/00000001/00000004/art00006 (accessed 9.27.18).
Buckwell, A., Nadeau, E., 2018. What is the Safe Operating Space for EU livestock? RISE foundation, Brussels.
Capacci, S., Mazzocchi, M., Shankar, B., Brambila Macias, J., Verbeke, W., Pérez-Cueto, F.J., Kozioł-Kozakowska, A., Piórecka, B., Niedzwiedzka, B., D’Addesa, D., Saba, A., Turrini, A., Aschemann-Witzel, J., Bech-Larsen, T., Strand, M., Smillie, L., Wills, J., Traill, W.B., 2012. Policies to promote healthy eating in Europe: a structured review of policies and their effectiveness. Nutr. Rev. 70, 188–200. https://doi.org/10.1111/j.1753-4887.2011.00442.x
Caraher, M., Cowburn, G., 2005. Taxing food: implications for public health nutrition. Public Health Nutr. 8, 1242–1249. https://doi.org/10.1079/PHN2005755
Carpenter, G., Kleinjans, R., Villasante, S., O’Leary, B.C., 2016. Landing the blame: The influence of EU Member States on quota setting. Mar. Policy 64, 9–15. https://doi.org/10.1016/j.marpol.2015.11.001
Cash, S.B., Sunding, D.L., Zilberman, D., 2005. Fat taxes and thin subsidies: Prices, diet, and health outcomes. Acta Agric. Scand. Sect. C — Food Econ. 2, 167–174. https://doi.org/10.1080/16507540500534879
Chang, J., Viovy, N., Vuichard, N., Ciais, P., Campioli, M., Klumpp, K., Martin, R., Leip, A., Soussana, J.-F., 2015. Modeled Changes in Potential Grassland Productivity and in Grass-Fed Ruminant Livestock Density in Europe over 1961–2010. PLOS ONE 10, e0127554. https://doi.org/10.1371/journal.pone.0127554
Csathó, P., Radimszky, L., 2009. Two Worlds within EU27: Sharp Contrasts in Organic and Mineral Nitrogen–Phosphorus Use, Nitrogen–Phosphorus

SUSFANS
Report No. D10.3
109
Balances, and Soil Phosphorus Status: Widening and Deepening Gap between Western and Central Europe. Commun. Soil Sci. Plant Anal. 40, 999–1019. https://doi.org/10.1080/00103620802693151
Dallongeville, J., Marécaux, N., Cottel, D., Bingham, A., Amouyel, P., 2001. Association between nutrition knowledge and nutritional intake in middle-aged men from Northern France. Public Health Nutr. 4, 27–33. https://doi.org/10.1079/PHN200052
Darmon, N., Drewnowski, A., 2015. Contribution of food prices and diet cost to socioeconomic disparities in diet quality and health: a systematic review and analysis. Nutr. Rev. 73, 643–660. https://doi.org/10.1093/nutrit/nuv027
Dhar, T., Baylis, K., 2011. Fast-Food Consumption and the Ban on advertising Targeting Children: The Quebec Experience. J. Mark. Res. 48, 799–813. https://doi.org/10.1509/jmkr.48.5.799
ECSIP Consortium, 2014. Food taxes and their impact on competitiveness in the agri-food sector, a study - Growth - European Commission (Final Report). For DG Enterprise and Industry, Rotterdam.
EU, 2014. Facts and figures on the Common Fisheries Policy, 2014th ed, Basic statistical data.
European Commission, 2018. Report from the Commission to the Council and the European Parliament on the implementation of Council Directive 91/676/EEC concerning the protection of waters against pollution caused by nitrates from agricultural sources based on Member States reports for the period 2012-2015 (Accompanying the document No. COM(2018) 257 final), Commission staff working document. Brussels.
European Commission, 2017. Modernising & simplifying the CAP. Climate & Environmental challenges facing agriculture and rural areas (Background Document). European Commission Directorate-General for agriculture and rural development, Brussels.
European Commission, 2016. Multiannual national plans [WWW Document]. Fish. - Eur. Comm. URL https://ec.europa.eu/fisheries/cfp/aquaculture/multiannual-national-plans_en (accessed 9.26.18).
European Commission, 2013a. Regulation (EU) No 1380/2013 of the European Parliament and of the Council of 11 December 2013 on the Common Fisheries Policy, amending Council Regulations (EC) No 1954/2003 and (EC) No 1224/2009, and repealing Council Regulations (EC) No 2371/2002 and (EC) No 639/2004, and Council Decision 2004/585/EC. Official Journal of the European Union 28.12.2013 (2013).
European Commission, 2013b. Strategic Guidelines for the Sustainable Development of EU Aquaculture, COM, 229 final.

SUSFANS
Report No. D10.3
110
European Commission, 2011. Communication from the Commission to the European Parliament, the Council, the European Economic and Social Committee and the Committee of the Regions. A Roadmap for moving to a competitive low carbon economy in 2050. COM(2011) 112 final.
European Commission, n.d. The common agricultural policy at a glance [WWW Document]. Eur. Comm. - Eur. Comm. URL https://ec.europa.eu/info/food-farming-fisheries/key-policies/common-agricultural-policy/cap-glance_en (accessed 9.27.18a).
European Commission, n.d. Future of the common agricultural policy [WWW Document]. Eur. Comm. - Eur. Comm. URL https://ec.europa.eu/info/food-farming-fisheries/key-policies/common-agricultural-policy/future-cap_en (accessed 9.27.18b).
Eurostat, 2018. Archive:Agriculture - greenhouse gas emission statistics [WWW Document]. Stat. Explain. URL https://ec.europa.eu/eurostat/statistics-explained/index.php?title=Archive:Agriculture_-_greenhouse_gas_emission_statistics (accessed 10.4.18).
Eurostat, 2017. Sustainable development in the European Union. Monitoring report on the progress towards the SDGs in an EU context, Statistical books. European Commission, Luxembourg.
Evans, C.E.L., Christian, M.S., Cleghorn, C.L., Greenwood, D.C., Cade, J.E., 2012. Systematic review and meta-analysis of school-based interventions to improve daily fruit and vegetable intake in children aged 5 to 12 y. Am. J. Clin. Nutr. 96, 889–901. https://doi.org/10.3945/ajcn.111.030270
Fabbri, K., 2017. FOOD 2030: Future-Proofing Our Food Systems through Research and Innovation.
Fabbri, K., 2016. European Research & Innovation for Food & Nutrition Security: FOOD 2030 High-Level Conference (Background Document).
FAO, 2018a. The current International Standard Statistical Classification of Aquatic Animals and Plants (ISSCAAP) in use from 2000. Food and Agriculture Organization of the United Nations, Rome.
FAO, 2018b. AMIS Agricultural Management Information System Statistics [WWW Document]. AMIS Mark. Database. URL http://statistics.amis-outlook.org/data/index.html (accessed 10.4.18).
FAO, 2017. Fisheries and aquaculture software. FishStatJ - software for fishery statistical time series, FAO Fisheries and Aquaculture Department [online]. Rome. Updated 21 July 2016.
Farmery, A., Gardner, C., Green, B.S., Jennings, S., 2014. Managing fisheries for environmental performance: the effects of marine resource decision-making on the footprint of seafood. J. Clean. Prod. 64, 368–376. https://doi.org/10.1016/j.jclepro.2013.10.016

SUSFANS
Report No. D10.3
111
Fox, R., Smith, G., 2011. Sinner Ladies and the gospel of good taste: Geographies of food, class and care. Health Place 17, 403–412. https://doi.org/10.1016/j.healthplace.2010.07.006
Frank, S., Havlík, P., van Dijk, M., Achterbosch, T., Cui, D., Heckelei, T., Kuiper, M., Latka, C., Witzke, H.-P., 2018. Quantified future challenges to sustainable food and nutrition security in the EU (Deliverable No. 10.2), SUSFANS project H2020/ SFS-19- 2014: Sustainable food and nutrition security through evidence based EU agro-food policy, GA no. 633692.
Frankic, A., Hershner, C., 2003. Sustainable aquaculture: developing the promise of aquaculture. Aquac. Int. 11, 517–530. https://doi.org/10.1023/B:AQUI.0000013264.38692.91
Fresco, L.O., Poppe, K.J., 2016. Towards a common agricultural and food policy. Raad van Bestuur, LEI Programmamanagement, LEI Wageningen UR. https://doi.org/10.18174/390280
Froehlich, H.E., Runge, C.A., Gentry, R.R., Gaines, S.D., Halpern, B.S., 2018. Comparative terrestrial feed and land use of an aquaculture-dominant world. Proc. Natl. Acad. Sci. U. S. A. 115, 5295–5300. https://doi.org/10.1073/pnas.1801692115
Froese, R., Winker, H., Coro, G., Demirel, N., Tsikliras, A.C., Dimarchopoulou, D., Scarcella, G., Quaas, M., Matz-Lück, N., 2018. Status and rebuilding of European fisheries. Mar. Policy 93, 159–170. https://doi.org/10.1016/j.marpol.2018.04.018
Garnett, T., Mathewson, S., Angelides, P., Borthwick, F., 2015. Policies and actions to shift eating patterns: What works? A review of the evidence of the effectiveness of interventions aimed at shifting diets in more sustainable and healthy directions. Food Climate Research Network, University of Oxford.
Garretson, J.A., Burton, S., 2000. Effects of Nutrition Facts Panel Values, Nutrition Claims, and Health Claims on Consumer Attitudes, Perceptions of Disease-Related Risks, and Trust. J. Public Policy Mark. 19, 213–227. https://doi.org/10.1509/jppm.19.2.213.17133
Grethe, H., 2007. High animal welfare standards in the EU and international trade – How to prevent potential ‘low animal welfare havens’? Food Policy 32, 315–333. https://doi.org/10.1016/j.foodpol.2006.06.001
Griffith, R., von Hinke, S., Smith, S., 2018. Getting a healthy start: The effectiveness of targeted benefits for improving dietary choices. J. Health Econ. 58, 176–187. https://doi.org/10.1016/j.jhealeco.2018.02.009
Griffiths, P.E., West, C., 2015. A balanced intervention ladder: promoting autonomy through public health action. Public Health 129, 1092–1098. https://doi.org/10.1016/j.puhe.2015.08.007

SUSFANS
Report No. D10.3
112
Guillen, J., Calvo Santos, A., Carpenter, G., Carvalho, N., Casey, J., Lleonart, J., Maynou, F., Merino, G., Paulrud, A., 2016. Sustainability now or later? Estimating the benefits of pathways to maximum sustainable yield for EU Northeast Atlantic fisheries. Mar. Policy 72, 40–47. https://doi.org/10.1016/j.marpol.2016.06.015
Hallström, E., Börjesson, P. al, 2013. Meat-consumption statistics: reliability and discrepancy. Sustain. Sci. Pract. Policy 9.
Hanserud, O.S., Lyng, K.-A., Vries, J.W.D., Øgaard, A.F., Brattebø, H., Hanserud, O.S., Lyng, K.-A., Vries, J.W.D., Øgaard, A.F., Brattebø, H., 2017. Redistributing Phosphorus in Animal Manure from a Livestock-Intensive Region to an Arable Region: Exploration of Environmental Consequences. Sustainability 9, 595. https://doi.org/10.3390/su9040595
Havlík, P., van Dijk, M., Achterbosch, T., Batka, M., Boere, E., Folberth, C., Frank, S., Götz, C., Heckelei, T., Valin, H., Ziegler, F., Zurek, M., 2018. Quantified SUSFANS scenario drivers ready to be used by the modeling toolbox (Deliverable No. 10.1), SUSFANS project H2020/ SFS-19- 2014: Sustainable food and nutrition security through evidence based EU agro-food policy, GA no. 633692.
Heckelei, T., Batka, M., Chang, C.-Y., Havlík, P., Kuiper, M., Latka, C., Leclere, D., Tamas, K., 2018. Enhanced modelling of sustainable food and nutrition security: food supply and use of scarce resources (Deliverable No. 9.3), SUSFANS project H2020/ SFS-19- 2014: Sustainable food and nutrition security through evidence based EU agro-food policy, GA no. 633692.
Helming, J., Reinhard, S., 2009. Modelling the economic consequences of the EU Water Framework Directive for Dutch agriculture. J. Environ. Manage. 91, 114–123. https://doi.org/10.1016/j.jenvman.2009.07.002
Helming, J., Tabeau, A., 2018. The economic, environmental and agricultural land use effects in the European Union of agricultural labour subsidies under the Common Agricultural Policy. Reg. Environ. Change 18, 763–773. https://doi.org/10.1007/s10113-016-1095-z
Hepple, B., Nuffield Council on Bioethics, 2007. Public health: ethical issues. Nuffield Council on Bioethics, London.
Hoek, A.C., Pearson, D., James, S.W., Lawrence, M.A., Friel, S., 2017. Healthy and environmentally sustainable food choices: Consumer responses to point-of-purchase actions. Food Qual. Prefer. 58, 94–106. https://doi.org/10.1016/j.foodqual.2016.12.008
Hoffmann, J., Voss, R., Llope, M., Schmidt, J.O., Möllmann, C., Fricke, L., Quaas, M.F., 2015. Social-economic drivers in (political) TAC setting decisions, in: CM Documents. Presented at the ICES Annual science conference, Copenhagen.

SUSFANS
Report No. D10.3
113
Holt, S., 2009. Sunken Billions – But how many? Fish. Res. 97, 3–10. https://doi.org/10.1016/j.fishres.2008.12.019
Hornborg, S., Bergman, K., Ziegler, F., 2016. The drivers of fisheries and aquaculture production in the EU (Deliverable No. 4.2), SUSFANS project H2020/ SFS-19- 2014: Sustainable food and nutrition security through evidence based EU agro-food policy, GA no. 633692.
Hyseni, L., Atkinson, M., Bromley, H., Orton, L., Lloyd-Williams, F., McGill, R., Capewell, S., 2017. The effects of policy actions to improve population dietary patterns and prevent diet-related non-communicable diseases: scoping review. Eur. J. Clin. Nutr. 71, 694–711. https://doi.org/10.1038/ejcn.2016.234
Irz, X., Leroy, P., Réquillart, V., Soler, L.-G., 2016. Welfare and sustainability effects of dietary recommendations. Ecol. Econ. 130, 139–155. https://doi.org/10.1016/j.ecolecon.2016.06.025
Jørgensen, U., Thuesen, J., Eriksen, J., Horsted, K., Hermansen, J.E., Kristensen, K., Kongsted, A.G., 2018. Nitrogen distribution as affected by stocking density in a combined production system of energy crops and free-range pigs. Agrofor. Syst. 92, 987–999. https://doi.org/10.1007/s10457-018-0200-3
Jue, J.J.S., Press, M.J., McDonald, D., Volpp, K.G., Asch, D.A., Mitra, N., Stanowski, A.C., Loewenstein, G., 2012. The impact of price discounts and calorie messaging on beverage consumption: A multi-site field study. Prev. Med. 55, 629–633. https://doi.org/10.1016/j.ypmed.2012.10.009
Kaldor, J.C., 2018. What’s Wrong with Mandatory Nutrient Limits? Rethinking Dietary Freedom, Free Markets and Food Reformulation. Public Health Ethics 11, 54–68. https://doi.org/10.1093/phe/phx019
Kan, K., Tsai, W.-D., 2004. Obesity and risk knowledge. J. Health Econ. 23, 907–934. https://doi.org/10.1016/j.jhealeco.2003.12.006
Kirchmann, H., Johnston, A.E.J., Bergström, L.F., 2002. Possibilities for Reducing Nitrate Leaching from Agricultural Land. AMBIO J. Hum. Environ. 31, 404–408. https://doi.org/10.1579/0044-7447-31.5.404
Kirchner, M., Schmidt, J., Kindermann, G., Kulmer, V., Mitter, H., Prettenthaler, F., Rüdisser, J., Schauppenlehner, T., Schönhart, M., Strauss, F., Tappeiner, U., Tasser, E., Schmid, E., 2015. Ecosystem services and economic development in Austrian agricultural landscapes — The impact of policy and climate change scenarios on trade-offs and synergies. Ecol. Econ. 109, 161–174. https://doi.org/10.1016/j.ecolecon.2014.11.005
Kuhn, T., Kokemohr, L., Holm-Müller, K., 2018. A life cycle assessment of liquid pig manure transport in line with EU regulations: A case study from Germany. J. Environ. Manage. 217, 456–467. https://doi.org/10.1016/j.jenvman.2018.03.082

SUSFANS
Report No. D10.3
114
Kuiper, M., Kalter, J., Mertens, E., Latka, C., Heckelei, T., Leip, A., Kanellopoulos, A., Havlík, P., 2018a. The SUSFANS toolbox for assessing EU Sustainable food and nutrition security (Deliverable No. 9.5), SUSFANS project H2020/ SFS-19- 2014: Sustainable food and nutrition security through evidence based EU agro-food policy, GA no. 633692.
Kuiper, M., Oudendag, D., Bartelings, H., Shutes, L., Verma, M., Tabeau, A., 2018b. Enhanced modelling of sustainable food and nutrition security: food consumption and nutrition behaviour of European households (Deliverable No. 9.2), SUSFANS project H2020/ SFS-19- 2014: Sustainable food and nutrition security through evidence based EU agro-food policy, GA no. 633692.
Lampiris, G., Karelakis, C., Loizou, E., 2018. Evaluation of the impacts of CAP policy measures on a local economy: The case of a Greek region. Land Use Policy 77, 745–751. https://doi.org/10.1016/j.landusepol.2018.06.019
Lange, A., Piorr, A., Siebert, R., Zasada, I., 2013. Spatial differentiation of farm diversification: How rural attractiveness and vicinity to cities determine farm households’ response to the CAP. Land Use Policy 31, 136–144. https://doi.org/10.1016/j.landusepol.2012.02.010
Larsen, M.L.V., Andersen, H.M.-L., Pedersen, L.J., 2018. Which is the most preventive measure against tail damage in finisher pigs: tail docking, straw provision or lowered stocking density? animal 12, 1260–1267. https://doi.org/10.1017/S175173111700249X
Lassen, H., Kelly, C., Sissenwine, M., 2013. ICES advisory framework 1977-2012: From Fmax to precautionary approach and beyond. ICES J. Mar. Sci. 71, 166–172. https://doi.org/10.1093/icesjms/fst146
Latruffe, L., Dupuy, A., Desjeux, Y., 2013. What would farmers’ strategies be in a no-CAP situation? An illustration from two regions in France. J. Rural Stud. 32, 10–25. https://doi.org/10.1016/j.jrurstud.2013.04.003
Lavin, R., Timpson, H., 2013. Exploring the Acceptability of a Tax on Sugar-Sweetened Beverages Brief Evidence Review. Applied Health and Wellbeing Partnership Centre for Public Health, Liverpool John Moores University.
Lee, Y., Yoon, J., Chung, S.-J., Lee, S.-K., Kim, H., Kim, S., 2017. Effect of TV food advertising restriction on food environment for children in South Korea. Health Promot. Int. 32, 25–34. https://doi.org/10.1093/heapro/dat078
Leng, G., Adan, R.A.H., Belot, M., Brunstrom, J.M., de Graaf, K., Dickson, S.L., Hare, T., Maier, S., Menzies, J., Preissl, H., Reisch, L.A., Rogers, P.J., Smeets, P.A.M., 2017. The determinants of food choice. Proc. Nutr. Soc. 76, 316–327. https://doi.org/10.1017/S002966511600286X

SUSFANS
Report No. D10.3
115
Lin, B.-H., Yen, S.T., Dong, D., Smallwood, D.M., 2010. Economic incentives for dietary improvement among food stamp recipients. Contemp. Econ. Policy 28, 524–536. https://doi.org/10.1111/j.1465-7287.2009.00193.x
Manos, B., Bournaris, T., Chatzinikolaou, P., Berbel, J., Nikolov, D., 2013. Effects of CAP policy on farm household behaviour and social sustainability. Land Use Policy 31, 166–181. https://doi.org/10.1016/j.landusepol.2011.12.012
Marchal, P., Andersen, J.L., Aranda, M., Fitzpatrick, M., Goti, L., Guyader, O., Haraldsson, G., Hatcher, A., Hegland, T.J., Le Floc’h, P., Macher, C., Malvarosa, L., Maravelias, C.D., Mardle, S., Murillas, A., Nielsen, J.R., Sabatella, R., Smith, A.D.M., Stokes, K., Thoegersen, T., Ulrich, C., 2016. A comparative review of fisheries management experiences in the European Union and in other countries worldwide: Iceland, Australia, and New Zealand. Fish Fish. 17, 803–824. https://doi.org/10.1111/faf.12147
Martínez, E., Domingo, F., Roselló, A., Serra, J., Boixadera, J., Lloveras, J., 2017. The effects of dairy cattle manure and mineral N fertilizer on irrigated maize and soil N and organic C. Eur. J. Agron. 83, 78–85. https://doi.org/10.1016/j.eja.2016.10.002
Matthews, A., Salvatici, L., Scoppola, M., 2017. Trade Impacts of Agricultural Support in the EU (Commissioned Paper No. 19). International Agricultural Trade Research Consortium.
Matthews, K.B., Buchan, K., Miller, D.G., Towers, W., 2013. Reforming the CAP—With area-based payments, who wins and who loses? Land Use Policy 31, 209–222. https://doi.org/10.1016/j.landusepol.2012.06.013
Mazzocchi, M., 2017. Ex-post evidence on the effectiveness of policies targeted at promoting healthier diets (Technical Report). Food and Agricultural Organization of the United Nations, Rome.
Merino, G., Barange, M., Blanchard, J.L., Harle, J., Holmes, R., Allen, I., Allison, E.H., Badjeck, M.C., Dulvy, N.K., Holt, J., Jennings, S., Mullon, C., Rodwell, L.D., 2012. Can marine fisheries and aquaculture meet fish demand from a growing human population in a changing climate? Glob. Environ. Change 22, 795–806. https://doi.org/10.1016/j.gloenvcha.2012.03.003
Mertens, E., Kuijsten, A., Dofková, M., Mistura, L., D’Addezio, L., Turrini, A., Dubuisson, C., Favret, S., Havard, S., Trolle, E., van’t Veer, P., Geleijnse, J.M., 2018. Geographic and socioeconomic diversity of food and nutrient intakes: a comparison of four European countries. Eur. J. Nutr. https://doi.org/10.1007/s00394-018-1673-6
Mertens, E., Kuijsten, A., Geleijnse, M., van ’t Veer, P., 2016. Protocol for defining the nutritional adequacy of total diets and foods consumed in EU countries (Deliverable No. 2.2), SUSFANS project H2020/ SFS-19- 2014: Sustainable food and nutrition security through evidence based EU agro-food policy, GA no. 633692.

SUSFANS
Report No. D10.3
116
Mertens, E., Kuijsten, A., Geleijnse, M., van’t Veer, P., 2017. The initial model to design SHARP diets, based on nutritional adequacy and preliminary sustainability metrics (Deliverable No. 7.1), SUSFANS project H2020/ SFS-19- 2014: Sustainable food and nutrition security through evidence based EU agro-food policy, GA no. 633692.
Micha, R., Khatibzadeh, S., Shi, P., Fahimi, S., Lim, S., Andrews, K.G., Engell, R.E., Powles, J., Ezzati, M., Mozaffarian, D., on behalf of the Global Burden of Diseases Nutrition and Chronic Diseases Expert Group (NutriCoDE)., 2014. Global, regional, and national consumption levels of dietary fats and oils in 1990 and 2010: a systematic analysis including 266 country-specific nutrition surveys. BMJ 348, g2272–g2272. https://doi.org/10.1136/bmj.g2272
Moodie, R., Stuckler, D., Monteiro, C., Sheron, N., Neal, B., Thamarangsi, T., Lincoln, P., Casswell, S., 2013. Profits and pandemics: prevention of harmful effects of tobacco, alcohol, and ultra-processed food and drink industries. The Lancet 381, 670–679. https://doi.org/10.1016/S0140-6736(12)62089-3
Moynagh, J., 2000. EU Regulation and Consumer Demand for Animal Welfare. Httpwwwagbioforummissourieduv3n23v3n23a06-Moynaghhtm.
Mozaffarian, D., Angell, S.Y., Lang, T., Rivera, J.A., 2018. Role of government policy in nutrition—barriers to and opportunities for healthier eating. BMJ k2426. https://doi.org/10.1136/bmj.k2426
Mozaffarian, D., Ludwig, D.S., 2010. Dietary Guidelines in the 21st Century—a Time for Food. JAMA 304, 681–682. https://doi.org/10.1001/jama.2010.1116
Naylor, R.L., Goldburg, R.J., Primavera, J.H., Kautsky, N., Beveridge, M.C.M., Clay, J., Folke, C., Lubchenco, J., Mooney, H., Troell, M., 2000. Effect of aquaculture on world fish supplies. Nature 405, 1017–1024. https://doi.org/10.1038/35016500
Nesme, T., Senthilkumar, K., Mollier, A., Pellerin, S., 2015. Effects of crop and livestock segregation on phosphorus resource use: A systematic, regional analysis. Eur. J. Agron. 71, 88–95. https://doi.org/10.1016/j.eja.2015.08.001
Otero, G., Gürcan, E.C., Pechlaner, G., Liberman, G., 2018. Food security, obesity, and inequality: Measuring the risk of exposure to the neoliberal diet. J. Agrar. Change 18, 536–554. https://doi.org/10.1111/joac.12252
Pérez-Cueto, F.J., Aschemann-Witzel, J., Shankar, B., Brambila-Macias, J., Bech-Larsen, T., Mazzocchi, M., Capacci, S., Saba, A., Turrini, A., Niedzwiedzka, B., Piorecka, B., Kozioł-Kozakowska, A., Wills, J., Traill, W.B., Verbeke, W., 2012. Assessment of evaluations made to healthy eating policies in Europe: a review within the EATWELL Project. Public Health Nutr. 15, 1489–1496. https://doi.org/10.1017/S1368980011003107
Pikitch, E.K., Santora, C., Babcock, E.A., Bakun, A., Bonfil, R., Conover, D.O., Dayton, P., Doukakis, P., Fluharty, D., Heneman, B., Houde, E.D., Link, J., Livingston,

SUSFANS
Report No. D10.3
117
P.A., Mangel, M., McAllister, M.K., Pope, J., Sainsbury, K.J., 2004. Ecosystem-Based Fishery Management. Science 305, 346–347. https://doi.org/10.1126/science.1098222
Potter, P., Ramankutty, N., Bennett, E.M., Donner, S.D., 2010. Characterizing the Spatial Patterns of Global Fertilizer Application and Manure Production. Earth Interact. 14, 1–22. https://doi.org/10.1175/2009EI288.1
Powell, L.M., Chaloupka, F.J., 2009. Food Prices and Obesity: Evidence and Policy Implications for Taxes and Subsidies. Milbank Q. 87, 229–257. https://doi.org/10.1111/j.1468-0009.2009.00554.x
Powell, L.M., Chriqui, J.F., Khan, T., Wada, R., Chaloupka, F.J., 2013. Assessing the Potential Effectiveness of Food and Beverage Taxes and Subsidies for Improving Public Health: A Systematic Review of Prices, Demand and Body Weight Outcomes. Obes. Rev. Off. J. Int. Assoc. Study Obes. 14, 110–128. https://doi.org/10.1111/obr.12002
Quaas, M.F., Froese, R., Herwartz, H., Requate, T., Schmidt, J.O., Voss, R., 2012. Fishing industry borrows from natural capital at high shadow interest rates. Ecol. Econ. 82, 45–52. https://doi.org/10.1016/j.ecolecon.2012.08.002
Raggi, M., Sardonini, L., Viaggi, D., 2013. The effects of the Common Agricultural Policy on exit strategies and land re-allocation. Land Use Policy, Themed Issue 1-Guest Editor Romy GreinerThemed Issue 2- Guest Editor Davide Viaggi 31, 114–125. https://doi.org/10.1016/j.landusepol.2011.12.009
Reisch, L.A., Sunstein, C.R., Gwozdz, W., 2017. Viewpoint: Beyond carrots and sticks: Europeans support health nudges. Food Policy 69, 1–10. https://doi.org/10.1016/j.foodpol.2017.01.007
Renwick, A., Jansson, T., Verburg, P.H., Revoredo-Giha, C., Britz, W., Gocht, A., McCracken, D., 2013. Policy reform and agricultural land abandonment in the EU. Land Use Policy 30, 446–457. https://doi.org/10.1016/j.landusepol.2012.04.005
Rutten, M., Achterbosch, T.J., de Boer, I.J.M., Cuaresma, J.C., Geleijnse, J.M., Havlík, P., Heckelei, T., Ingram, J., Leip, A., Marette, S., van Meijl, H., Soler, L.-G., Swinnen, J., van’t Veer, P., Vervoort, J., Zimmermann, A., Zimmermann, K.L., Zurek, M., 2016. Metrics, models and foresight for European sustainable food and nutrition security: The vision of the SUSFANS project. Agric. Syst. https://doi.org/10.1016/j.agsy.2016.10.014
Salmoral, G., Willaarts, B.A., Garrido, A., Guse, B., 2017. Fostering integrated land and water management approaches: Evaluating the water footprint of a Mediterranean basin under different agricultural land use scenarios. Land Use Policy 61, 24–39. https://doi.org/10.1016/j.landusepol.2016.09.027
Sassi, F., Cecchini, M., Lauer, J., Chisholm, D., 2009. Improving Lifestyles, Tackling Obesity: The Health and Economic Impact of Prevention Strategies. https://doi.org/10.1787/220087432153

SUSFANS
Report No. D10.3
118
Schoumans, O.F., Bouraoui, F., Kabbe, C., Oenema, O., van Dijk, K.C., 2015. Phosphorus management in Europe in a changing world. AMBIO 44, 180–192. https://doi.org/10.1007/s13280-014-0613-9
Schröder, J.J., Scholefield, D., Cabral, F., Hofman, G., 2004. The effects of nutrient losses from agriculture on ground and surface water quality: the position of science in developing indicators for regulation. Environ. Sci. Policy 7, 15–23. https://doi.org/10.1016/j.envsci.2003.10.006
Singh, G.M., Micha, R., Khatibzadeh, S., Lim, S., Ezzati, M., Mozaffarian, D., 2015. Estimated Global, Regional, and National Disease Burdens Related to Sugar-Sweetened Beverage Consumption in 2010. Circulation 132, 639–666. https://doi.org/10.1161/CIRCULATIONAHA.114.010636
Skov, L.R., Lourenço, S., Hansen, G.L., Mikkelsen, B.E., Schofield, C., 2013. Choice architecture as a means to change eating behaviour in self-service settings: a systematic review. Obes. Rev. Off. J. Int. Assoc. Study Obes. 14, 187–196. https://doi.org/10.1111/j.1467-789X.2012.01054.x
Soussana, J.-F., Lemaire, G., 2014. Coupling carbon and nitrogen cycles for environmentally sustainable intensification of grasslands and crop-livestock systems. Agric. Ecosyst. Environ. 190, 9–17. https://doi.org/10.1016/j.agee.2013.10.012
Springmann, M., Mason-D’Croz, D., Robinson, S., Wiebe, K., Godfray, H.C.J., Rayner, M., Scarborough, P., 2016. Mitigation potential and global health impacts from emissions pricing of food commodities. Nat. Clim. Change 7, 69–74. https://doi.org/10.1038/nclimate3155
Svanbäck, A., McCrackin, M.L., Swaney, D.P., Linefur, H., Gustafsson, B.G., Howarth, R.W., Humborg, C., 2019. Reducing agricultural nutrient surpluses in a large catchment – Links to livestock density. Sci. Total Environ. 648, 1549–1559. https://doi.org/10.1016/j.scitotenv.2018.08.194
Swartz, W., Rashid Sumaila, U., Watson, R., Pauly, D., 2010. Sourcing seafood for the three major markets: The EU, Japan and the USA. Mar. Policy 34, 1366–1373. https://doi.org/10.1016/j.marpol.2010.06.011
Tamminga, S., 2003. Pollution due to nutrient losses and its control in European animal production. Livest. Prod. Sci. 84, 101–111. https://doi.org/10.1016/j.livprodsci.2003.09.008
Tampio, E., Lehtonen, E., Kinnunen, V., Mönkäre, T., Ervasti, S., Kettunen, R., Rasi, S., Rintala, J., 2017. A demand-based nutrient utilization approach to urban biogas plant investment based on regional crop fertilization. J. Clean. Prod. 164, 19–29. https://doi.org/10.1016/j.jclepro.2017.06.172
Thow, A.M., Downs, S., Jan, S., 2014. A systematic review of the effectiveness of food taxes and subsidies to improve diets: Understanding the recent evidence. Nutr. Rev. 72, 551–565. https://doi.org/10.1111/nure.12123

SUSFANS
Report No. D10.3
119
Tilman, D., Clark, M., 2014. Global diets link environmental sustainability and human health. Nature 515, 518–522. https://doi.org/10.1038/nature13959
Tukker, A., Goldbohm, R.A., de Koning, A., Verheijden, M., Kleijn, R., Wolf, O., Pérez-Domínguez, I., Rueda-Cantuche, J.M., 2011. Environmental impacts of changes to healthier diets in Europe. Ecol. Econ. 70, 1776–1788. https://doi.org/10.1016/j.ecolecon.2011.05.001
van Grinsven, H.J.M., Erisman, J.W., de Vries, W., Westhoek, H., 2015. Potential of extensification of European agriculture for a more sustainable food system, focusing on nitrogen. Environ. Res. Lett. 10, 025002. https://doi.org/10.1088/1748-9326/10/2/025002
van Kleef, E., Otten, K., van Trijp, H.C., 2012. Healthy snacks at the checkout counter: A lab and field study on the impact of shelf arrangement and assortment structure on consumer choices. BMC Public Health 12, 1072. https://doi.org/10.1186/1471-2458-12-1072
van Zanten, H., van Hal, O., de Boer, I., 2016. The drivers of livestock production in the EU (Deliverable No. 4.1), SUSFANS project H2020/ SFS-19- 2014: Sustainable food and nutrition security through evidence based EU agro-food policy, GA no. 633692.
van’t Veer, P., Poppe, K.J., Fresco, L.O., 2017. Towards a European Food and Nutrition Policy. Wageningen University & Research.
Velthof, G.L., Lesschen, J.P., Webb, J., Pietrzak, S., Miatkowski, Z., Pinto, M., Kros, J., Oenema, O., 2014. The impact of the Nitrates Directive on nitrogen emissions from agriculture in the EU-27 during 2000–2008. Sci. Total Environ. 468–469, 1225–1233. https://doi.org/10.1016/j.scitotenv.2013.04.058
Wang, J., Liu, Q., Hou, Y., Qin, W., Lesschen, J.P., Zhang, F., Oenema, O., 2018. International trade of animal feed: its relationships with livestock density and N and P balances at country level. Nutr. Cycl. Agroecosystems 110, 197–211. https://doi.org/10.1007/s10705-017-9885-3
Wardle, J., Parmenter, K., Waller, J., 2000. Nutrition knowledge and food intake. Appetite 34, 269–275. https://doi.org/10.1006/appe.1999.0311
Weltin, M., Zasada, I., Franke, C., Piorr, A., Raggi, M., Viaggi, D., 2017. Analysing behavioural differences of farm households: An example of income diversification strategies based on European farm survey data. Land Use Policy 62, 172–184. https://doi.org/10.1016/j.landusepol.2016.11.041
Westhoek, H., Lesschen, J.P., Rood, T., Wagner, S., De Marco, A., Murphy-Bokern, D., Leip, A., van Grinsven, H., Sutton, M.A., Oenema, O., 2014. Food choices, health and environment: Effects of cutting Europe’s meat and dairy intake. Glob. Environ. Change 26, 196–205. https://doi.org/10.1016/j.gloenvcha.2014.02.004

SUSFANS
Report No. D10.3
120
Willems, J., van Grinsven, H.J.M., Jacobsen, B.H., Jensen, T., Dalgaard, T., Westhoek, H., Kristensen, I.S., 2016. Why Danish pig farms have far more land and pigs than Dutch farms? Implications for feed supply, manure recycling and production costs. Agric. Syst. 144, 122–132. https://doi.org/10.1016/j.agsy.2016.02.002
Wilson, A.L., Buckley, E., Buckley, J.D., Bogomolova, S., 2016. Nudging healthier food and beverage choices through salience and priming. Evidence from a systematic review. Food Qual. Prefer. 51, 47–64. https://doi.org/10.1016/j.foodqual.2016.02.009
Wironen, M.B., Bennett, E.M., Erickson, J.D., 2018. Phosphorus flows and legacy accumulation in an animal-dominated agricultural region from 1925 to 2012. Glob. Environ. Change 50, 88–99. https://doi.org/10.1016/j.gloenvcha.2018.02.017
Wolf, O., Pérez-Domínguez, I., Rueda-Cantuche, J.M., Tukker, A., Kleijn, R., de Koning, A., Bausch-Goldbohm, S., Verheijden, M., 2011. Do healthy diets in Europe matter to the environment? A quantitative analysis. J. Policy Model. 33, 8–28. https://doi.org/10.1016/j.jpolmod.2010.10.009
Zimmermann, A., Latka, C., 2017. The drivers of crop production at regional level in the EU: an econometric analysis (Deliverable No. 4.5), SUSFANS project H2020/ SFS-19- 2014: Sustainable food and nutrition security through evidence based EU agro-food policy, GA no. 633692.
Zurek, M., Leip, A., Kuijsten, A., Terluin, I., Shutes, L., Hebinck, A., Zimmermann, A., Götz, C., Hornborg, S., van Zanten, H., Ziegler, F., Havlík, P., Garrone, M., Geleijnse, M., Kuiper, M., Turrini, A., Dofkova, M., Trolle, E., Mistura, L., Dubuisson, C., van’t Veer, P., Achterbosch, T., Crespo Cuaresma, J., Ingram, J., 2017a. Sustainability metrics for the EU food system: a review across economic, environmental and social considerations (Deliverable No. 1.3), SUSFANS project H2020/ SFS-19- 2014: Sustainable food and nutrition security through evidence based EU agro-food policy, GA no. 633692.
Zurek, M., Vervoort, J., Hebinck, A., 2017b. A systematic review of existing EU-wide scenarios related to the EU sustainable food and nutrition security, identification of most salient features, and resulting synthesis scenarios for exploring sustainable diets (Deliverable No. 6.2), SUSFANS project H2020/ SFS-19- 2014: Sustainable food and nutrition security through evidence based EU agro-food policy, GA no. 633692.

SUSFANS
Report No. D10.3
121
6 ANNEXES Annex Table 1: Aquaculture production quantities (in t) are presented for the reference year and for the policy target year that are referred to in the national policy plans (Source: European Commission (2016))
EU member state Aquaculture production in reference year in t (2012/2013/2014)
Aquaculture production plan in target year in t (2020/2022/2023/2025)
Austria 3,100 5,500
Bulgaria 14,000 20,000
Belgium 332 1,032
Croatia 13,916 24,050
Cyprus 5,339 6,332
Czech Republic 19,360 20,000
Denmark 44,000 55,000
Estonia 733
Finland 13,700 20,000
France 218,000 265,000
Germany 26,500 52,000
Greece 114,000 170,000
Hungary 21,500 27,000
Ireland 36,700 81,700
Italy 140,879 206,854
Latvia 644 2,256
Lithuania 3,845 6,400
Malta 8,606 10,500
Netherlands 46,605

SUSFANS
Report No. D10.3
122
Poland 40,000 61,000
Portugal 10,317 35,000
Romania 10,146 36,000
Slovakia 1,085
Slovenia 1,155 2,420
Spain 267,000 320,000
Sweden 12,500 25,000
United Kingdom 205,000 254,000
CAPRI CFP scenario results
Annex Table 2: CAPRI results for CFP scenarios (MSY and Aqua Plan) and reference scenario (baseline) in 2030 by EU member state (Luxembourg is aggregated to Belgium in CAPRI output)
EU member state
Reference MSY Aqua Plan
Aquacult quantities 1000t
Capture quantities 1000t
Aquacult quantities 1000t
Capture quantities 1000t
Aquacult quantities 1000t
Capture quantities 1000t
Austria 1.92 0.5 1.92 0.5 9.38 0.5
Bulgaria 7.38 10.72 7.39 11.22 22.05 10.72
Belgium 23.1 29.65 23.1
Croatia 21.45 48.08 20.42 53.82 75.02 48.08
Cyprus 5.43 2.93 4.96 3.51 6.74 2.93
Czech Republic
29.57 4.21 29.46 4.21 23.38 4.21
Denmark 34.09 731.49 33.37 891.99 76.72 731.49
Estonia 0.94 98.15 0.94 108.99 0.73 98.15
Finland 15.94 152.7 15.92 166.22 36.69 152.7

SUSFANS
Report No. D10.3
123
France 114.92 466 114.39 553.25 194.1 466
Germany 47.24 267.07 47.14 313.48 226.31 267.07
Greece 134.98 87.49 124.46 101.67 268.45 87.49
Hungary 23.48 6.94 23.39 6.94 24.41 6.94
Ireland 38.98 224.18 38.9 264.84 194.36 224.18
Italy 118.85 255.64 117.31 286.44 205 255.64
Latvia 0.39 154.28 0.39 173.28 2.58 154.28
Lithuania 4.11 169.7 4.12 192.79 9.45 169.7
Malta 3.95 1.13 3.65 1.26 6.19 1.13
Netherlands
40.83 399.52 40.71 472.35 55.56 399.52
Poland 60.64 163.06 60.44 185.4 137.16 163.06
Portugal 6.25 222.95 6.04 263.37 58.06 222.95
Romania 19.92 4.45 19.96 4.45 123.62 4.45
Slovakia 1.13 1.79 1.13 1.79 3.41 1.79
Slovenia 1.01 0.6 1.01 0.67 2.81 0.6
Spain 137.29 889.22 132.22 1,048.86 190.74 889.22
Sweden 9.23 225.4 9.22 258.35 45.39 225.4
United Kingdom
271.96 603.57 271.65 702.3 449 603.57