the potential role of ammonia as marine fuel-based on
TRANSCRIPT

The Potential Role of Ammonia as Marine Fuel-Based on EnergySystems Modeling and Multi-Criteria Decision Analysis
Downloaded from: https://research.chalmers.se, 2022-02-09 22:26 UTC
Citation for the original published paper (version of record):Hansson, J., Brynolf, S., Fridell, E. et al (2020)The Potential Role of Ammonia as Marine Fuel-Based on Energy Systems Modeling andMulti-Criteria Decision AnalysisSustainability, 12(8)http://dx.doi.org/10.3390/su12083265
N.B. When citing this work, cite the original published paper.
research.chalmers.se offers the possibility of retrieving research publications produced at Chalmers University of Technology.It covers all kind of research output: articles, dissertations, conference papers, reports etc. since 2004.research.chalmers.se is administrated and maintained by Chalmers Library
(article starts on next page)

sustainability
Article
The Potential Role of Ammonia as MarineFuel—Based on Energy Systems Modeling andMulti-Criteria Decision Analysis
Julia Hansson 1,2,* , Selma Brynolf 1, Erik Fridell 2 and Mariliis Lehtveer 3
1 Department of Mechanics and Maritime Sciences, Maritime Environmental Sciences, Chalmers University ofTechnology, SE-412 96 Gothenburg, Sweden; [email protected]
2 Sustainable Society, IVL Swedish Environmental Research Institute, Box 530 21, SE-400 14 Gothenburg,Sweden; [email protected]
3 Department of Space, Earth and Environment, Energy Technology, Chalmers University of Technology,SE-412 96 Gothenburg, Sweden; [email protected]
* Correspondence: [email protected]
Received: 15 March 2020; Accepted: 15 April 2020; Published: 17 April 2020�����������������
Abstract: To reduce the climate impact of shipping, the introduction of alternative fuels is required.There is a range of different marine fuel options but ammonia, a potential zero carbon fuel, has recentlyreceived a lot of attention. The purpose of this paper is to assess the prospects for ammonia as a futurefuel for the shipping sector in relation to other marine fuels. The assessment is based on a synthesisof knowledge in combination with: (i) energy systems modeling including the cost-effectivenessof ammonia as marine fuel in relation to other fuels for reaching global climate targets; and (ii) amulti-criteria decision analysis (MCDA) approach ranking marine fuel options while consideringestimated fuel performance and the importance of criteria based on maritime stakeholder preferences.In the long-term and to reach global GHG reduction, the energy systems modeled indicate thatthe use of hydrogen represents a more cost-effective marine fuel option than ammonia. However,in the MCDA covering more aspects, we find that ammonia may be almost as interesting forshipping related stakeholders as hydrogen and various biomass-based fuels. Ammonia may tosome extent be an interesting future marine fuel option, but many issues remain to be solved beforelarge-scale introduction.
Keywords: shipping; alternative fuels; ammonia; decarbonization; biofuels; greenhouse gas emissiontargets; scenarios; multi-criteria decision making
1. Introduction
In 2018, the International Maritime Organization (IMO) agreed to reduce greenhouse gas (GHG)emissions from international shipping by at least 50% by 2050, phase them out by 2100 at the latest,and to reduce the carbon dioxide (CO2) emissions per transport work by 40% in 2030 and 70% in 2050,relative to 2008 [1]. To reach these objectives, the conventional use of fossil fuels needs to be drasticallyreduced and combined with the introduction of operational and technical measures that reduce fuelconsumption in combination with the introduction of energy carriers with low or near zero GHGemissions [2–7].
There is a range of different marine fuel options with varying characteristics in terms of, for example,availability, cost, energy density, technical maturity, and environmental impact [2,8,9]. In recent years,ammonia has been proposed as a potential marine fuel that would give no emissions of CO2 from theship since it is a carbon-free molecule [8,10–14].
Sustainability 2020, 12, 3265; doi:10.3390/su12083265 www.mdpi.com/journal/sustainability

Sustainability 2020, 12, 3265 2 of 20
Ammonia (NH3) produced from hydrogen and nitrogen may thus contribute to low climate impactif produced from renewable energy sources (or combined with carbon capture and storage, CCS).However, ammonia is currently mainly produced from fossil fuel-based hydrogen while productionprocesses for renewable ammonia are still under development [15,16].
Ammonia, as energy carrier, can, with the development of existing technologies, be used in fuel cellsor in internal combustion engines (ICE). There are some scientific papers assessing ammonia as transportfuel. For example, Kang and Holbrook [17] assessed the GHG reduction potential of introducingammonia fueled light-duty vehicles in the US transportation sector to 2040. For shipping, some studieshave applied multi-criteria decision analysis (MCDA) to assess and rank selected marine fuel options,for example liquefied natural gas (LNG), fossil methanol, and hydrogen [9,18–20]. However, whileHansson et al. [9] included several renewable options, none of these studies include ammonia.
By developing decarbonization pathways for international shipping that combine differenttechnologies including ammonia as fuel, Halim et al. [21] assess the possible CO2 reduction potentialby 2035. The study assumes in some cases that hydrogen and ammonia may represent about 70%or more of the total marine fuel demand in 2035 [21]. Ben Brahim et al. [22] presented pathways toclimate-neutral shipping by 2050 for the Danish maritime cargo sector and found that hydrogen,methanol, and ammonia are the most preferable from a socioeconomic cost perspective. However,to assess the potential role of ammonia as marine fuel in the future, there is a need for more studiesclarifying the knowledge gaps and its prerequisites in relation to other options, for example whenconsidering also other energy demand sectors and several other criteria such as safety, distribution,and development of engines/fuel cells.
The aim of this paper is to assess the prospects for ammonia as a future fuel for the shipping sectorin relation to other marine fuel options. The paper includes a synthesis of knowledge on ammonia asan alternative marine fuel, which is used partly as basis for: (i) an assessment of the cost-effectivenessof ammonia as marine fuel for reaching global climate targets using energy systems modeling; and (ii)a multi-criteria decision analysis (MCDA) resulting in a ranking of different marine fuels.
From an overall point of view, this paper discusses prospects for ammonia as marine fuel with abroader perspective and in more detail than many other studies. In the long-term and to reach globalGHG reduction, the energy systems modeled in this paper indicate that the use of hydrogen representsa more cost-effective option for the shipping sector than ammonia. However, in the MCDA coveringmore aspects, we find that ammonia may be almost as interesting for shipping related stakeholdersas hydrogen and various biomass-based fuels. Due to primarily the potential low climate impact,ammonia has potential as future marine fuel, but many issues remain to be solved before it can beintroduced in large-scale and more detailed additional assessments and comparisons are needed.
2. Materials and Methods
Initially, a literature review on ammonia covering for example production pathways, costs,and environmental impact was performed. Based on this the prospects for ammonia as marinefuel in relation to other fuel options were then assessed by: (i) energy systems modeling of thecost-effectiveness of ammonia as marine fuel compared to other alternative marine fuel options forreaching global climate targets; and (ii) applying a multi-criteria decision analysis (MCDA) approachthat is based on the estimated fuel performance and on input from a panel of maritime stakeholderswith varying preferences.
2.1. Ammonia as Fuel—A Brief Synthesis of Knowledge
Approximately 80% of the total global ammonia consumption is used in the production offertilizers, such as urea, ammonium nitrate, ammonium phosphate, or direct use of ammonia while therest is used in various industrial applications, e.g., explosives, healthcare, cosmetic, animal nutrition,nutrition, plastics, resins, and electronics, as well as in NOX control systems in the automotiveindustry [16,23]. The global production amounted to approximately 180 million tons in 2016 [16,23].
Sustainability 2020, 12, 3265 3 of 20
Ammonia is currently produced mainly by the electricity demanding Haber–Bosch (HB) processand the nitrogen used is produced from air via the reforming step or by a separate air separationprocess [16,24].
Besides fossil fuels, hydrogen can also be produced from reforming biogas and renewable methaneor from electrolysis of water using renewable energy sources, e.g., wind, solar, and water power.Electrochemical synthesis, where ammonia is synthesized in a single electrochemical reactor usingwater or steam, nitrogen, and electricity, represents another possible ammonia production pathwaywith for example potentially reduced energy use [25]. However, further development is neededto obtain ammonia production rates high enough for commercialization for this process [16,25,26].A technology representing an integration of the electrolyzer and the HB units, without the need for anair separation unit is also being developed by Haldor Topsoe potentially resulting in reduced cost andenergy use [27].
Globally, there are several initiatives for production of renewable ammonia. For example, theammonia producer Yara plans to build a demonstration plant for ammonia from solar energy inAustralia and Haldor Topsoe aims to demonstrate its next-generation green ammonia synthesis plant(using a solid oxide electrolysis cell) by 2025 [27,28].
2.1.1. Ammonia Fuel Performance
Ammonia has been demonstrated as a fuel in compression ignition (CI) engines, spark ignition(SI) engines, and fuel cells [29–34]. A recent review of the literature on engine tests with ammoniashows that there are a limited number of tests published on ammonia in combustion engines andthat significant amounts of ignition fuel (e.g., hydrogen, diesel, or alcohols) are needed for both CIand SI engines [35]. The review concludes that there are remaining issues with ignition, specific fuelconsumption, materials, and emissions [35]. Besides ammonia slip, there are potential emissions ofNOX, CO, hydrocarbons (depending on pilot fuel), and N2O, even if it seems likely that these emissionscan be handled with after treatment further assessments are needed.
In fuel cells, either ammonia can be used directly or ammonia is split into hydrogen and N2 andthe hydrogen then used in the fuel cell. Two fuel cell options that may be used in marine applicationsare proton-exchange membrane fuel cells (PEM) using purified hydrogen and solid oxide fuel cells(SOFC) using ammonia [36]. PEM fuel cells are commercial and tested in marine applications [37].Fuel cells using ammonia directly, besides SOFC also, e.g., alkaline and alkaline membrane, are underdevelopment [31]. No reports from tests onboard vessels have been found, but SOFC using methanoland methane have been tested [37].
Ammonia linked to fuel cells might compared to combustion engines potentially offer higherthermal efficiencies, less noise, and lower emissions of air pollutants. However, the emissions associatedwith ammonia fuels cells need to be confirmed. There is for example a risk for NOx emission [31].The ammonia fuel cell pathway might also be relatively costly.
No ammonia driven propulsion technologies for marine operation have been commercialized yet.However, there are initiatives; for example, MAN Energy solutions claim that their dual-fuel enginedeveloped for LPG may use liquid ammonia in a dual fuel setup [38]. MAN Energy solutions togetherwith Shanghai Merchant Ship Design & Research Institute (SDARI) and American Bureau of Shipping(ABS) also has a development project for an ammonia-fueled feeder container vessel intended to usethis technology. There is also an EU funded project, ShipFC, that aims to convert an offshore vessel torun on an ammonia fuel cell.
Ammonia is a toxic substance. Ammonia released into the atmosphere in high concentrationsprovides health risks and is lethal over certain concentrations and time periods. It may also contributeto formation of secondary particles. Ammonia is toxic for organisms living in water with potentiallong-term effects mainly in the case of direct exposure [11,28,36]. Ammonia in water will be convertedinto ammonium ions [36]. Ammonia released in the air will due to its lower density dilute andevaporate upwards; however, several factors influence how fast and to what extent ammonia diffuses

Sustainability 2020, 12, 3265 4 of 20
in the air [28]. Ammonia may, for example, also, as many other fuels, form explosive mixtures with airand hydrogen from cracked ammonia is a very flammable gas [36].
Leakage and potential exposure to humans and the environment (including aquatic life) representkey safety issues linked to ammonia used as marine fuel and specific safety regulations will be needed.
Ammonia is corrosive and this need to be considered in the design of marine fuel systems [38].The safety regulations and associated safety measures will influence the fuel handling system forbunkering and during operation, likely increasing the cost but potentially also the use of the spaceon-board [24,35,36].
2.1.2. Potential Cost and Supply
From 2016 to mid-2019, the global ammonia price corresponded to a range of about 10–20 USD/GJ(using a lower heating value of 18.8 MJ/ton for ammonia) [39]. The production cost for renewableammonia was estimated to range within about 7–23 USD/GJ ammonia by Tun et al. (2014) and in aforthcoming study by Hochman [40] the cost of renewable ammonia production in 2040 amounts toapproximately 20 and 25–35 USD/GJ for electrochemical ammonia production and electrolysis of waterfollowed by the HB synthesis in large and small scale, respectively.
The additional propulsion system cost for an ammonia-fueled vessel with an internal combustionengine has been estimated to approximately 2–60% compared to a conventional HFO-fueled vesseland in the case of fuel cells 8–300% due to large uncertainties about requirements [14].
Ammonia is more energy dense than compressed hydrogen and liquid hydrogen. It is normallystored in insulated pressurized tanks, which require larger space requirement onboard ships than LNGand methanol [8]. However, there is no need for cryogenic storage, which is required for liquefiedhydrogen [10].
There does not seem to be any main issues with fuel infrastructure or bunkering related toammonia as marine fuel. However, a well-functioning fuel infrastructure and bunkering systems needto be implemented.
In terms of reliable supply of fuel in order for ammonia to be used as marine fuel, the globalproduction needs to be increased, in particular from renewable sources. This will require large amountsof electricity, but the production is not constrained by any other raw materials. For comparison,the current total global ammonia production could replace about 30% of the global shippingfuel consumption if assuming equal efficiencies when used in ship propulsion systems (calculatedusing [16,23,41]).
2.2. Energy Systems Modeling
The cost-effectiveness of ammonia compared to other alternative marine fuel options for reachingglobal climate targets is performed using energy systems modeling with the Global Energy Transition(GET) Model version 10.0 [42]. The GET model has in this study been developed by adding ammoniaas marine fuel.
2.2.1. Model Structure and Main Assumptions
GET is a cost minimizing “bottom-up” systems model of the global energy system constructed asa linear programming problem with 10-year time steps and divided into 10 regions. The GET model isused to study various carbon mitigation strategies and the objective is to minimize the discountedtotal energy system cost for the studied period (in our case, 2010–2100) while meeting an externallydefined energy demand and a carbon constraint [42]. The carbon constraint is in the form of a carbonbudget corresponding to a maximum atmospheric CO2 concentration by the year 2100. The model hasa supply side focus but has five end use sectors covering electricity, transport, residential–commercialheat, industrial process heat, and feedstock.
In the GET-model, the included primary energy sources (primarily coal, oil, natural gas, nuclear,wind, hydro, solar energy, and biomass) are by different technologies converted into secondary energy
Sustainability 2020, 12, 3265 5 of 20
carriers (e.g., heat, electricity, and different transport fuels), used to supply the energy demand in thedifferent sectors. Thus, the demand in each sector can be met by various technologies that are assumedto be available in all ten regions.
All the technologies are described by the energy carriers they can convert and estimates of theirindividual characteristics, e.g., costs (expressed in real terms), efficiencies, carbon emissions, and loadfactors. Scarcity of relevant resources, e.g., oil and biomass, are considered by maximal supply levelsand are allocated endogenously to fulfill the demand in the sectors where the model finds it mostcost-effective to use them. Carbon capture and storage (CCS) for stationary combustion of fossil fuelsand biomass is included and linked to a maximum carbon storage capacity [42]. This applies also forfossil fuel-based ammonia production for which this option is available at a cost.
Scenarios for the demand in the different sectors, except transport, are based on the B2 scenariosfrom the IIASA GGI Scenario Database (for details, see Lehtveer et al. [42]). Transport includes demandfor freight and personal transportation. For transport demand scenarios used for road, train, andaviation, see Grahn et al. [43]. Shipping is described in the next section. To better describe the realworld, there are constraints included in the model on, e.g., how rapidly technologies can be introducedand expanded in the system (generally representing a turnover of 50 years for the entire system) andmaximal extraction limits for the included energy sources.
The net present value calculations include a global discount rate of 5% per year. Since perfectforesight is assumed, the GET model identifies the least-cost solution for the entire period included inthe assessment. The solutions for each region are aggregated to represent global results.
As with all models, the GET model represents a simplified description of the real energy system,for example by basing choices only on cost-effectiveness and perfect foresight, considering a limitednumber of technologies, and assuming a price inelastic demand. The model cannot be used to predictthe future but is used to produce scenarios and assess the potential role of different options in relationto the development for other options in a carbon constrained world, potentially providing usefulinsights for industry, researchers, and policy makers.
2.2.2. Marine Fuel Options and Climate Targets
The marine fuel options included in the model are marine gas oil (MGO) and heavy fuel oil(HFO), liquefied natural gas (LNG), methanol (MeOH), hydrogen, and ammonia. For several ofthe fuels, different production pathways are possible. Methanol is used as a proxy for: (i) severaldifferent biofuels but represented by the characteristics of biomass-based methanol; (ii) fossil fuel-basedmethanol; and (iii) different kinds of electrofuels that are represented by the characteristics of theelectro-methanol pathway. Electrofuels are fuels produced from CO2 and water using electricity.Hydrogen can be produced from natural gas, biomass, or through electrolysis using electricity.
Ammonia is assumed to be produced by the HB process with nitrogen and hydrogen as feedstock,and thus requires the production of hydrogen through any of the possible pathways included.A conversion efficiency of the HB process of 74% is assumed and the process is assumed to be used80% of the year. The current investment cost for ammonia production is estimated as 2100 USD/kWand is assumed to decrease to 1900 USD/kW in 2050 [42].
Onboard the ship, the fuels can be used in internal combustion engines (ICE) or fuel cells (FC).Thus, hybrid and electric engines are not considered in this study.
In the GET model, the shipping sector is divided in three ship categories: (i) short sea ships;(ii) deep sea ships; and (iii) container ships. The ship cost consists of the construction cost that dependson the cost of engines, fuel tanks, and other extra costs such as pipeline and gas alarm system.The propulsion efficiency of the ship depends on the ship type. The ship characteristics and the cost forthe ammonia propulsion technologies included are presented in Table 1. A 30-year lifetime is assumedfor all ship types.
For technology performance and costs of marine fuels besides ammonia, see Lehtveer et al. [42]and Taljegard et al. [6]. The total fuel cost is calculated based on the primary energy cost, engine

Sustainability 2020, 12, 3265 6 of 20
and other investment cost, conversion efficiency, capacity factor, operation and maintenance cost,distribution cost, and scarcity rent.
Table 1. Characteristics and costs for the propulsion technologies for ammonia for the three shipcategories in 2050, based on estimates by Lövdahl and Magnusson [44] and Taljegard et al. [6].
Characteristics Unit Short Sea Ship Deep Sea Ship Container Ship
Engine power kWoutput 2400 11,000 23,000Voyage range full speed h 162 720 360
Tank capacity GJ 3500 71,300 74,600ICE engine cost 1 USD/kWoutput 800 600 600
ICE propulsion efficiency 1 %, LHV 45 40 40FC stack cost 2 USD/kWoutput 925 925 925
FC propulsion efficiency % LHV 45 60 45Storage cost 3 USD/GJ 55 35 35
SCR cost for ICE USD/kWoutput 133 133 1331 Assumed equal to H2 ICE. 2 Estimated as the mean value of the range 350–1500 USD/kW where the formerrepresents low cost estimates for FC and 1500 USD/kW is the higher estimate of SOFC cost by van Biert et al. [45].3 Assumed to be half the storage cost for LNG estimated at 35 USD/GJ [6].
Our assessments are made with two different climate scenarios, 450 and 550 ppm. This means thatwe apply cumulative carbon emission constraints that correspond to atmospheric CO2 concentrationsin 2100 of 450 and 550 ppm roughly corresponding to 70% and 50% likelihood of keeping the globalaverage warming below 2 ◦C. The model considers CO2 emissions and methane leakage from the useof gas in engines (at 2%) is included as CO2 equivalents.
2.2.3. Sensitivity Assessment: Monte Carlo Analysis
Cost developments (linked to fuel and propulsion technology and infrastructure) and othercharacteristics for new marine fuels are uncertain. In our assessment, key parameters include: (i) theinvestment costs for ammonia synthesis (including nitrogen generation) in 2050; (ii) the efficiency ofammonia synthesis; and (iii) the additional cost for different vessels compared to conventional marinegas oil fueled ships, which depend on engine cost, fuel cell cost, and additional storage cost. To confirmour findings related to ammonia as marine fuel, a Monte Carlo (MC) analyses, in which the values ofthese key parameters are varied within specific intervals, are performed. The intervals used for eachparameter in the MC analysis are presented in Table 2. The parameter values are varied simultaneouslyand uniformly within these intervals for 100 model runs. The climate target is set to 450 ppm of CO2
for the MC analysis.
Table 2. Intervals used for the Monte Carlo sensitivity analysis. The parameter values are variedsimultaneously and uniformly within these intervals for 100 model runs. For assumptions andunderlying references, see Lövdahl and Magnusson [44].
Parameters Changed Unit Minimum Value Base Case Value Maximum Value
Efficiency of ammoniaproduction %, LHV 68% 74% 80%
Ammonia productioninvestment cost USD/kW 1700 1900 2100
Additional cost compared toconventional MGO ship for
different ship types:kUSD/ship
MGO FC Container ship 200 1500 2800MeOH FC Container ship 200 1500 2800
Bio FC Container ship 300 1600 2900LNG FC Container ship 400 1700 3000H2 FC Container ship 1300 2200 3100
NH3 FC Container ship 200 1500 2800NH3 ICE Container ship 800 1100 1400

Sustainability 2020, 12, 3265 7 of 20
Table 2. Cont.
Parameters Changed Unit Minimum Value Base Case Value Maximum Value
MGO FC Deep sea ship 1000 7000 13,000MeOH FC Deep sea ship 1000 7000 13,000
Bio FC Deep sea ship 2000 8000 14,000LNG FC Deep sea ship 3500 10,000 16,500H2 FC Deep sea ship 12,000 16,000 20,000
NH3 FC Deep sea ship 1000 8000 15,000NH3 ICE Deep sea ship 5000 6000 7000
MGO FC Short sea ship 200 1600 3000MeOH FC Short sea ship 200 1600 3000
Bio FC Short sea ship 300 1500 2800LNG FC Short sea ship 400 1700 3000H2 FC Short sea ship 400 1800 3200
NH3 FC Short sea ship 200 1600 3000NH3 ICE Short sea ship 1200 1500 1800
2.3. Multi-criteria Decision Analysis
The range of MCDA methods is used to find the optimal and most consensual solution whileconsidering both qualitative and quantitative information and stakeholders’ preferences to differentextent. The multi-criteria decision analysis approach based on the Analytic Hierarchy Process (AHP)and set up applied by Hansson et al. [9] is adapted and used in this study. This approach combinesestimated fuel performance and input on criteria importance from a panel of maritime stakeholders.
AHP is chosen due to its strengths in combining quantitative and qualitative input data whilespecifically considering the views of different stakeholders and since it has been used in other studiesof alternative marine fuels [9,18–20]. The chosen approaches rank marine fuel options based ontheir relative performance for included criteria and the relative importance of the criteria consideringstakeholder preferences providing weights, in both cases by applying pairwise comparisons andresulting in pairwise comparison matrices [46,47]. For a more detailed description of the method used,see below and further in Appendix A and Hansson et al. [9].
The main difference to the assessment by Hansson et al. [9] is that two production pathways forammonia are included as fuel option both for ICEs and fuel cells in ships (i.e., four more options).
2.3.1. Marine Fuel Options and Criteria
In total, 11 alternative marine fuel options—liquefied natural gas (LNG), liquefied biogas (LBG,from organic waste), methanol from natural gas (NG-MeOH), renewable methanol (renewable MeOH,from willow), hydrogen for fuel cells produced from natural gas (NG-H2) or electrolysis based onrenewable electricity (elec-H2), hydrotreated vegetable oil (HVO, from tall oil), and ammonia for bothfuels cells and ICEs produced from natural gas (NG-NH3) or electrolysis based on renewable electricity(elec-NH3)—are included. The other fuels are assumed used in ICEs.
The 11 fuel options are ranked by ten different performance criteria that influence the choice ofmarine fuel and their relative importance based on stakeholder preferences. The performance criteriainclude economic, environmental, technical, and social aspects. The following criteria are included,and described in Table 3: (i) investment cost for propulsion; (ii) operational cost; (iii) fuel price; (iv)available infrastructure; (v) reliable supply of fuel; (vi) acidification; (vii) health impact; (viii) climatechange; (ix) safety; and (x) upcoming legislation. The time perspective of the MCDA is 2030 andthe focus is on deep sea shipping. The specific criteria were selected through a survey for Swedishmaritime stakeholders [9,48].

Sustainability 2020, 12, 3265 8 of 20
Table 3. Description of the criteria included in the multi-criteria decision analysis (MCDA).
Criterion Description
Economic
Investment cost forpropulsion
Defined as capital cost of propulsion and associatedon-board infrastructure per installed engine capacityin terms of power output and includes cost ofengines, fuel tanks, pipelines, etc., on-board.
Operational cost Includes crew related cost and maintenanceinsurance cost.
Fuel cost
Defined as the estimated relative cost differences ofthe fuels based on estimates of production costs,raw-material prices, and production efficiencies butthe efficiency of the propulsion is also considered.
TechnicalAvailable infrastructure
Defined as compatibility with current infrastructureincluding storage, distribution, and bunkeringfacilities as well as maturity level of the propulsiontechnology.
Reliable supply of fuel Includes availability of raw material, existingproduction and use, and energy security.
Environmental
Acidification Acidification potential due to NOx and SO2emissions from fuel combustion.
Health impact Defined as particulate matter (PM) formationpotential from combustion (in terms of PM2.5-equiv.).
Climate changeGlobal warming potential (GWP100) for emissions ofCO2, methane (CH4), and nitrous oxide (N2O) inlifecycle perspective.
SocialSafety
Includes risk of fire, explosion, and health hazardsrelated to fuel handling, considering fuel propertiessuch as toxicity.
Upcoming legislation Defined as the likelihood for meeting known andfuture emission regulations.
2.3.2. Comparison of Marine Fuel Performance
The characteristics of the included marine fuels are mapped through a literature review.The information used to represent the various criteria for the ammonia pathways are presentedin Table 4. Data for LNG are included for comparison. For assumptions related to the non-ammoniafuel options, the reader is referred to Hansson et al. [9] and, for underlying assumptions linked toships, see Table 1.
For four criteria (available infrastructure, reliable supply of fuel, safety, and upcoming legislation)that are difficult to represent by a single quantitative parameter, a four-level scale (1–4, representingpoor, moderate, fairly good, and good) is used for grading underlying aspects (see Table 5) and theaverage of this grading represent the criteria. The grading for the aspect available infrastructure isbased on a judgement from a panel of experts, provided specifically for this study including shipowners,an ammonia producer, a fuel producer and supplier, and marine fuel experts. In the MCDA assessmentas well, the other criteria are converted to the range 1–4, where 1 represents the lowest value and 4 thehighest, while the remaining parameter values are expressed as their relative value since the relativerelation between the options represents a central feature of the assessment. The marine fuel optionsare then compared and scored, based on their relative estimated performance.

Sustainability 2020, 12, 3265 9 of 20
Table 4. Marine fuel performance for the included ammonia fuel options produced from natural gas(NG-NH3) or electrolysis based on renewable electricity (elec-NH3) and for use in fuels cells (FC) andinternal combustion engines (ICE) and liquefied natural gas (LNG).
NG-NH3 FC Elec-NH3 FC NG-NH3 ICE Elec-NH3 ICE LNG
Capital cost for thepropulsion system
(USD2015/kW)5300–11,400 1 5300–11,400 1 5200–7710 1 5200–7710 1 5100–7710
[6,42]
Operational cost(USD2015/MWh) 11 2 11 2 9 2 9 2 9 [49]
Indicative fuel cost in 2030(USD2015/GJ)3 27 [6,39,50–53] 35 [54] 27 [6,50,51] 35 [54] 7 [6,50,51]
Available infrastructure 4 1.5 1.5 1.5 1.5 2.4Reliable supply of fuel 4 2.2 2.8 2.2 2.8 2.6
Acidification potential (moleH+ equiv./MJ fuel) 5 0 6 0 6 2 × 10⁻⁴ 7 2 × 10⁻⁴ 7 8 × 10⁻⁵
[55–57]Health impact as PM2.5equivalents (mg/MJ) 8 0 0 3.4 9 3.4 9 1.4 [55–57]
Climate change entirelifecycle, GWP100 (g
CO2-equiv /MJ)10140 30 140 30 80 [56–59]
Safety 4 2.3 11 2.3 11 2.3 11 2.3 11 2.5 11
Upcoming legislation 4 3.6 12 3.9 12 3.012 3.3 12 2.9 12
1 SCR technology is assumed applied for the ICE alternatives (at 133 USD/kW), assumed ICE engine price 600 USD/kWand SOFC price 925–1315 USD/kW [44]. Storage cost is assumed to be in the range from half of the LNG storage costto the same as the LNG storage cost estimated at 35–70 USD/GJ [6]. 2 Assumed to have slightly higher operationalcost than LNG, but lower than H2 [6]. 3 It is difficult to predict fuel prices in 2030. Our estimate is therefore basedon available data on fuel production cost, historical prices, and rough estimates based on raw material prices andconversion efficiencies. 4 A four-level scale (1–4, representing Poor, moderate, fairly good, and good) is used forgrading underlying aspects for these parameters and the average value represent the criteria. For some aspectsthis is partly based on judgement from a panel of experts. Available infrastructure is for input on current loadinginfrastructure of ammonia in ports based on [24]. 5 Acidification potential is based on NOx and SO2 emissionsfrom combustion using characterization factors for acidification potential based accumulated exceedance methodsfor NOx and SO2 resulting in 0.74 and 1.31 mol of charge (mole) per kg substance emitted respectively [60,61].6 For ammonia used in fuel cells, there is a risk of nitrogen oxides (NOX) and N2O emission but, due to the lack ofquantitative data, zero emission is used here. There is also a risk of ammonia emissions for all ammonia pathwayspotentially influencing acidification but due to lack of data that has not been considered in this study. 7 Assumed tohave the same level of acidifying emissions as LNG. 8 Human health impact is based on emissions of PM10, SO2,and NOX from combustion and represented by mass PM2.5-equivalents. Characterization factors for PM10, SO2,and NOX are 0.2278, 0.0611, and 0.0072, respectively [61]. 9 Assumed to be associated with the same level of PM2.5equivalents emissions as MeOH ICE [9]. 10 Estimated based on emission data by Bicer and Dincer [62], Kramer etal. [63], and Wood [64]. 11 Based on safety data in various ammonia safety sheets and Zamfirescu and Dincer [65].12 Based on Ash [24], Bartels [66], and Reiter and Kong [67].
Table 5. Expert evaluation of the underlying aspects of the criteria “available infrastructure”, “reliablesupply of fuel”, “safety” and “upcoming legislation”. The scale 1–4 (poor, moderate, fairly well,and good) is applied and for the underlying aspects linked to “available infrastructure” the averageevaluation is presented with range given in parenthesis.
NG-NH3 FC Elec-NH3 FC NG-NH3 ICE Elec-NH3 ICE
Available infrastructureCompatibility to existing
infrastructure 1.86 (1–3) 1.86 (1–3) 1.86 (1–3) 1.86 (1–3)
Adaptability to existing ships 1.57 (1–2) 1.57 (1–2) 1.57 (1–2) 1.57 (1–2)Engine technology maturity 1.71 (1–3) 1.71 (1–3) 1.71 (1–3) 1.71 (1–3)
Current amount of storage andbunkering capability 1 1 1 3
Reliable supply of fuel
Raw material availability 3 4 3 4Current production 4 1 4 1
Current use as marine fuel 1 1 1 1Energy security 1: Global supply
potential distribution 1 4 1 4
Energy security 2: Politicalstability 2 4 2 4

Sustainability 2020, 12, 3265 10 of 20
Table 5. Cont.
NG-NH3 FC Elec-NH3 FC NG-NH3 ICE Elec-NH3 ICE
Safety
Risk of explosion or fire 3 3 3 3Toxicity 1 1 1 1
Health hazards 1 1 1 1In terms of cryogenic liquid 4 4 4 4
Upcoming legislation
Sulphur dioxide (SO2) global 2020 4 4 4 4NOX Tier III 4 4 2 2
IMO 2050 GHG target (exhaustemissions) 4 4 4 4
IMO 2100 GHG targets (life cycleperspective) 1 4 1 4
Particle mass 4 4 3 3Particle numbers 4 4 2 2
Methane emissions 4 4 4 4Ammonia emissions 3 3 3 3
Scrubber ban 4 4 4 4
2.3.3. Weighting of Criteria
The weights of the different criteria applied in this study are based on Hansson et al. [9] andMånsson [48]. These weights were settled during a workshop with a group of shipping relatedstakeholders. The stakeholders included ship-owners, engine manufacturers, fuel producers, Swedishgovernment authority representatives, and relevant researchers.
Weightings were produced individually and in groups representing the preferences of: (i)ship-owners; (ii) fuel producers; (iii) engine manufacturers; and (iv) Swedish government authorities.The base case, representing the “combined view” of the stakeholders is based on the weighted geometricmean of all stakeholders individually produced pairwise comparison matrices for the included criteriashowing their individual preferences.
In terms of outcome for the relative importance of the overall criteria, the economic criteria are themost important, followed by social and environmental criteria for the combined group. Ship-owners,fuel producers, and engine manufacturers also value economic criteria the highest, but followedby social and technical aspects for ship-owners while technical and social for the other groups.On the other hand, government authorities value environmental and social aspects most, followed byeconomic criteria.
In terms of outcome for the relative importance of each criterion, fuel cost is, as expected, the mostimportant economic criterion (followed by investment cost), and reliable supply the most importanttechnical criterion, for all stakeholder groups. As environmental criterion climate change is consideredthe most important, except for engine manufacturers that give health impact higher weight. In termsof social criterion, upcoming legislation is the most important except for ship-owners that valuesafety most.
As the final step of the MCDA, the included fuel options are ranked based on the scoring ofalternatives and the criteria weighting, i.e., by combining the pairwise comparison matrices (linearcombination of normalized priority vectors) produced following the AHP approach. For more detailson the method, see Appendix A. The influence of different criteria weights on the final fuel ranking(outcome of the MCDA) is assessed with the weightings of the different stakeholder groups. Thisrepresents the sensitivity analysis of the MCDA assessment.
3. Results
3.1. Cost-effective Future Marine Fuel Options
In the beginning of the studied time period, the use of MGO and LNG in ICEs dominates the fueluse in the shipping sector. In the 450-ppm scenario, the use of MGO starts to decrease from 2020 and

Sustainability 2020, 12, 3265 11 of 20
is almost phased out by 2100. The use of LNG in ICEs increases but peaks around 2040; thereafter,it decreases and instead LNG in FCs are introduced to some extent. Further, from 2050, the use ofhydrogen in FCs increases substantially replacing the major share of all other fuels. The developmentuntil 2040 is similar in the 550-ppm scenario. However, in this scenario, LNG in FCs becomes thedominating fuel, replacing most of the MGO and LNG in ICEs while H2 in FCs is found cost-effectivefirst from around 2080. The cost-effective fuel options for shipping in 2050 and 2070 for the two climatescenarios in energy terms are presented in Figure 1. The share of different fuel options of the total fueluse for shipping in 2050 and 2070 for the two climate scenarios are also presented in Figure 1.
Sustainability 2020, 12, x FOR PEER REVIEW 11 of 21
and is almost phased out by 2100. The use of LNG in ICEs increases but peaks around 2040; thereafter, it decreases and instead LNG in FCs are introduced to some extent. Further, from 2050, the use of hydrogen in FCs increases substantially replacing the major share of all other fuels. The development until 2040 is similar in the 550-ppm scenario. However, in this scenario, LNG in FCs becomes the dominating fuel, replacing most of the MGO and LNG in ICEs while H2 in FCs is found cost-effective first from around 2080. The cost-effective fuel options for shipping in 2050 and 2070 for the two climate scenarios in energy terms are presented in Figure 1. The share of different fuel options of the total fuel use for shipping in 2050 and 2070 for the two climate scenarios are also presented in Figure 1.
Figure 1. Fuel volumes (in EJ/year) for different fuel/powertrain combinations in cost-effective fuel choices for shipping in 2050 and 2070 for the two climate scenarios 450 and 550 ppm. The share of different fuel options of the total fuel use for shipping (in percentage) in the four cases are presented at the end of each bar. FC, fuel cells; ICE, internal combustion engine; MGO/HFO, conventional fossil oil; LNG, liquefied natural gas; NH3, ammonia; H2, hydrogen; MeOH, biofuels, fossil MeOH, and electro-methanol.
To summarize, the energy systems modeled indicate that in climate scenarios the use of oil-based marine fuels decreases as expected and in the short-term natural gas-based fuels in the form of LNG represent cost-effective fuel choices. However, in the long-term and in the case of more stringent climate targets, the use of hydrogen represents the most cost-effective option for the shipping sector, thus being more cost-effective than ammonia. The reason is that, although ammonia has significantly
Figure 1. Fuel volumes (in EJ/year) for different fuel/powertrain combinations in cost-effective fuelchoices for shipping in 2050 and 2070 for the two climate scenarios 450 and 550 ppm. The share ofdifferent fuel options of the total fuel use for shipping (in percentage) in the four cases are presentedat the end of each bar. FC, fuel cells; ICE, internal combustion engine; MGO/HFO, conventionalfossil oil; LNG, liquefied natural gas; NH3, ammonia; H2, hydrogen; MeOH, biofuels, fossil MeOH,and electro-methanol.
To summarize, the energy systems modeled indicate that in climate scenarios the use of oil-basedmarine fuels decreases as expected and in the short-term natural gas-based fuels in the form of LNGrepresent cost-effective fuel choices. However, in the long-term and in the case of more stringentclimate targets, the use of hydrogen represents the most cost-effective option for the shipping sector,thus being more cost-effective than ammonia. The reason is that, although ammonia has significantlylower storage costs on container ships, this does, in our model setup, not outweigh the additionalcost of converting hydrogen to ammonia in a system perspective. For example, in terms of electricitydemand, in the case of renewable ammonia produced from electricity, it is estimated that an electricityinput of 3–4 times the actual work propelling the ship is needed.

Sustainability 2020, 12, 3265 12 of 20
Biofuels and methanol pathways do not turn out to be cost-effective fuel options in the shippingsector either. The reason is that the biomass is used for other energy sectors, which with the givenmodel set up is found more cost-effective.
The Monte-Carlo analyses performed on efficiency and investment cost of ammonia production aswell as ship costs also confirm that this finding does not seem to be sensitive to key parameter valuessince only very marginal amounts of ammonia are introduced in these runs. Thus, using hydrogen inthe case of stringent climate targets turns out to be more cost effective in all cases.
3.2. Ranking of Marine Fuels Based on the MCDA Assessment
The relative performances of the included marine fuels for the different criteria is presented inFigure 2. A high value represents a better performance, e.g., lower cost, lower emissions, higherlevel of reliable supply of fuel, etc. None of the investigated options performs best for all criteria.Ammonia produced from renewable electricity and used in fuel cells has comparable performance tohydrogen produced from renewable electricity used in fuel cells. Ammonia used in ICEs has worseperformance related to acidification and health impacts and ammonia produced from natural gas hasworse performance connected to climate change.
Sustainability 2020, 12, x FOR PEER REVIEW 12 of 21
lower storage costs on container ships, this does, in our model setup, not outweigh the additional cost of converting hydrogen to ammonia in a system perspective. For example, in terms of electricity demand, in the case of renewable ammonia produced from electricity, it is estimated that an electricity input of 3–4 times the actual work propelling the ship is needed.
Biofuels and methanol pathways do not turn out to be cost-effective fuel options in the shipping sector either. The reason is that the biomass is used for other energy sectors, which with the given model set up is found more cost-effective.
The Monte-Carlo analyses performed on efficiency and investment cost of ammonia production as well as ship costs also confirm that this finding does not seem to be sensitive to key parameter values since only very marginal amounts of ammonia are introduced in these runs. Thus, using hydrogen in the case of stringent climate targets turns out to be more cost effective in all cases.
3.2. Ranking of Marine Fuels Based on the MCDA Assessment
The relative performances of the included marine fuels for the different criteria is presented in Figure 2. A high value represents a better performance, e.g., lower cost, lower emissions, higher level of reliable supply of fuel, etc. None of the investigated options performs best for all criteria. Ammonia produced from renewable electricity and used in fuel cells has comparable performance to hydrogen produced from renewable electricity used in fuel cells. Ammonia used in ICEs has worse performance related to acidification and health impacts and ammonia produced from natural gas has worse performance connected to climate change.
Figure 2. Relative marine fuel performance for each criterion: (a) the ammonia fuel options and LNG; and (b) the remaining fuel options. Higher values represent better performance.
The rankings of the studied marine fuels for the combined stakeholder group and for the different stakeholder subgroups are presented in Figure 3 and the ranking order for the ammonia options is in Table 6. The presented ranking is valid for the assumptions linked to criteria and performance made in this study.
For the combined stakeholder case, LNG is ranked highest with hydrotreated vegetable oil (HVO ICE) second, and then renewable hydrogen in fuel cells (Elec-H2 FC). Renewable ammonia in fuel cells (Elec-NH3 FC) and in internal combustion engines (Elec-NH3 ICE) are ranked fifth and eighth, respectively, while natural gas-based ammonia ends up in the bottom of the ranking. For ship-owners, fuel producers, and engine manufacturers, LNG is ranked highest followed by natural gas-based methanol (NG-MeOH ICE). The ammonia options end up in the bottom or lower part of the ranking for all these stakeholder groups (seventh or lower) and there are only minor differences between the other included fuel options. The main reason behind the similar ranking for these stakeholder groups is their relatively high weight on economy and particularly fuel cost and similar
Figure 2. Relative marine fuel performance for each criterion: (a) the ammonia fuel options and LNG;and (b) the remaining fuel options. Higher values represent better performance.
The rankings of the studied marine fuels for the combined stakeholder group and for the differentstakeholder subgroups are presented in Figure 3 and the ranking order for the ammonia options is inTable 6. The presented ranking is valid for the assumptions linked to criteria and performance made inthis study.
For the combined stakeholder case, LNG is ranked highest with hydrotreated vegetable oil (HVOICE) second, and then renewable hydrogen in fuel cells (Elec-H2 FC). Renewable ammonia in fuelcells (Elec-NH3 FC) and in internal combustion engines (Elec-NH3 ICE) are ranked fifth and eighth,respectively, while natural gas-based ammonia ends up in the bottom of the ranking. For ship-owners,fuel producers, and engine manufacturers, LNG is ranked highest followed by natural gas-basedmethanol (NG-MeOH ICE). The ammonia options end up in the bottom or lower part of the rankingfor all these stakeholder groups (seventh or lower) and there are only minor differences between theother included fuel options. The main reason behind the similar ranking for these stakeholder groupsis their relatively high weight on economy and particularly fuel cost and similar weighting overall. Theviews of governmental authorities result in Elec-H2 FC being ranked highest followed by Elec-NH3
FC, but here biomass-based methanol (Bio-MeOH ICE) is in third place, HVO ICE in fourth place, andElec-NH3 ICE in fifth place. The reason for this is that these stakeholders consider GHG emissions andthe potential to meet regulations as the top criteria. The natural gas-based ammonia options are in thebottom of the ranking for governmental authorities.

Sustainability 2020, 12, 3265 13 of 20
Sustainability 2020, 12, x FOR PEER REVIEW 13 of 21
weighting overall. The views of governmental authorities result in Elec-H2 FC being ranked highest followed by Elec-NH3 FC, but here biomass-based methanol (Bio-MeOH ICE) is in third place, HVO ICE in fourth place, and Elec-NH3 ICE in fifth place. The reason for this is that these stakeholders consider GHG emissions and the potential to meet regulations as the top criteria. The natural gas-based ammonia options are in the bottom of the ranking for governmental authorities.
Figure 3. Ranking of the studied marine fuels for the combined stakeholder group and for the different stakeholder groups. The value “1” is assigned to the fuel ranked the highest and the values for the other fuel are expressed relative to the fuel ranked the highest.
Table 6. Ranking order of the ammonia fuel options (from 1 to 11, where 1 indicates highest ranking) in the different stakeholder groups.
Fuels Combined Group
Gov. Authorities
Ship-owner
Fuel Producer
Engine Manufacturer
NG-NH3 FC 10 9 11 11 10 Elec-NH3 FC 5 2 10 8 7 NG-NH3 ICE 11 11 9 10 11 Elec-NH3 ICE 8 5 8 7 9
4. Discussion
0 0.2 0.4 0.6 0.8 1
Combined stakeholder group
Authority
Ship owner
Fuel manufacturer
Engine manufacturer
Elec-NH3 ICE NG-NH3 ICE Elec-NH3 FC NG-NH3 FCHVO ICE Elec-H2 FC NG-H2 FC Bio-MeOH ICENG-MeOH ICE LBG ICE LNG ICE
Figure 3. Ranking of the studied marine fuels for the combined stakeholder group and for the differentstakeholder groups. The value “1” is assigned to the fuel ranked the highest and the values for theother fuel are expressed relative to the fuel ranked the highest.
Table 6. Ranking order of the ammonia fuel options (from 1 to 11, where 1 indicates highest ranking)in the different stakeholder groups.
Fuels CombinedGroup
Gov.Authorities Ship-Owner Fuel
ProducerEngine
Manufacturer
NG-NH3 FC 10 9 11 11 10Elec-NH3 FC 5 2 10 8 7NG-NH3 ICE 11 11 9 10 11Elec-NH3 ICE 8 5 8 7 9
4. Discussion
To support a demand for ammonia as fuel in shipping, the production of renewable ammonianeeds to increase substantially. As ammonia is currently mainly used for fertilizer production, thismight lead to competition with potentially higher ammonia prices and higher food prices at least inthe short-term. However, compared to biofuels, large-scale production of renewable based electricityneeded for renewable ammonia production does not have the same physical restrictions.
Currently, the price related to energy content of ammonia is substantially higher than for MGOand LNG. However, when comparing future cost estimates of alternative marine fuels, the price forammonia is expected to be in almost the same range as hydrogen.
Regarding performance of ammonia as a fuel, there are remaining issues with ignition, specificfuel consumption, materials, and emissions linked to ammonia as marine fuel. Emissions from the use

Sustainability 2020, 12, 3265 14 of 20
of ammonia as fuel can possibly be dealt with and the engines can be improved. However, beforeammonia can be used on ships further demonstrations of emissions and efficiencies are called for.There are also remaining issues linked to safety that is a major concern when considering ammonia asa fuel. Firm rules for design of ammonia systems and for the handling of such systems are needed inorder to avoid negative impacts. It remains to conclude if safety issues will represent a key obstacle forammonia as marine fuel.
Although ammonia is not considered to be the most cost-effective option in the GET model inthis study, ammonia may still be of interest for marine applications, as indicated by the MCDA. Forexample, the current version of the GET model does not consider the possibility to produce ammoniadirectly from hydrogen without compression or liquefaction. Including this might influence the resultfor ammonia. In addition, it is possible that the shipping sector in the future will not be dominated byonly one alternative fuel but a combination of fuels. The introduction of dual-fuel engines supportsthis, and this might improve the prerequisites for ammonia as marine fuel. There might also besituations where ammonia becomes a cost-effective option also in future energy scenarios developedwith cost-minimization. For example, if hydrogen liquefaction, storage, distribution, and use in fuelcells turns out to be more expensive than expected while the ammonia production process improves,the use in ICEs ammonia might be more attractive.
In addition, unexpected development for other options in the shipping as well as other sectorsmight also influence the outcome since the development in other sectors influences the cost-effectivefuel choices in the shipping sector. Future cost estimates are always uncertain and assuming a highercost for individual parts of the chain might also change the cost-effectiveness of ammonia vs. hydrogen.The sensitivity analysis performed tests uncertainties linked to some of the parameter values. However,more sensitivity assessments might yield more insights. For example, costs linked to liquefaction ofhydrogen (which is needed for use in ships) and cost for converters should be studied more. It shouldalso be remembered that the GET model is not used to predict the future but to understand how futurefuel choices are influenced by different assumptions.
The modeling and scenario development by ben Brahim et al. [22] indicate that changes in costsfor a specific fuel technology influences the outcome to a large extent; for example, in the case of a20% reduction in costs for ammonia or methanol, they would take over the role of hydrogen as themain renewable fuel in their scenarios. However, in our energy systems modeling, the prospectsfor ammonia is not found sensitive to changes in costs to the same extent with the given set up andsensitivity assessments made. The reason might be the different system boundaries, the focus onDanish shipping in the study by ben Brahim et al. [22] vs. the total global energy system in this studyor different assumptions regarding fuel cost relations and how linked they are.
The ranking of the included alternative marine fuel options varies depending on the preferencesamong stakeholder groups. The ranking in this study is only valid for the included criteria, i.e.,extending with additional criteria may change the ranking. The key insight from the MCDA assessmentis that ammonia is only ranked high for governmental authorities and to some extent for the totalstakeholder group and then primarily renewable ammonia in fuel cells. It is also important to notethat the ranking is very sensitive to assumption about the fuel prices in 2030; a change in the relativefuel prices has the potential to change the overall ranking in the MCDA.
From an overall perspective in the MCDA, using ammonia in fuel cells seems to perform betterthan ammonia in internal combustion engines. This is partly due to the higher efficiency of the fuelcells but also due to better performance in terms of health impact and acidification, and it is thereforesomewhat more likely that the fuel cell pathway will meet upcoming legislation However, ship ownersand fuel producers rank ammonia in ICEs somewhat higher than corresponding FC options. Thus,this relation should be further assessed as more certainty in cost, performance, etc. becomes available.
Further sensitivity assessment of the parameter values judged most uncertain would also bevaluable (i.e., to change the scoring of selected criteria). For example, estimating the fuel price in 2030
Sustainability 2020, 12, 3265 15 of 20
is very difficult. It would be interesting to further test the influence on the fuel ranking in the MCDAof changes in the fuel prices.
The fuel ranking is also influenced by the selection of criteria. Adding more criteria may changethe outcome to some extent. The impact in terms of fuel ranking will depend on the performanceand weight of the new criteria in comparison to the already included criteria and is not possible topredict. However, the criteria included in this study cover several key aspects, and it is not clearthat a larger number of criteria will clarify the role of ammonia. However, it would be interestingto specifically study the effect on cargo capacity, more issues related to the toxicity of ammonia, andthe impact of current investments. Thus, the criteria included in the MCDA cover a limited numberof all sustainability aspects related to marine fuels and the study should not be seen as a completesustainability assessment.
Ammonia from natural gas with CCS is another option with potentially low climate impact andcould be further assessed in future studies. Policy makers need to consider that some ammonia routesare more beneficial than others and make sure that policy and regulations promote these pathways.
To conclude, in the long-term and to reach global GHG reduction, the energy systems modeled inthis paper indicate that the use of hydrogen represents a more cost-effective option for the shippingsector than ammonia. However, in the MCDA covering more aspects but with a shorter time perspective,we find that ammonia may be almost as interesting for shipping related stakeholders as hydrogenand various biomass-based fuels. Due to primarily the potential low climate impact, ammonia haspotential as a future marine fuel, but many issues remain to be solved before it can be introduced inlarge-scale, and more detailed additional assessments and comparisons are needed. The followingfuture research areas are suggested:
• In-depth assessments of ammonia as marine fuel from a system perspective comparing ammoniawith other potential marine fuel options and considering technical and economic feasibility, safety,and environmental performance are needed.
• Feasibility studies could assess the possibility of introducing ammonia as a marine fuel coveringassessments of fuel systems, bunkering, safety routines, etc.
• Demonstration projects could convert marine engines to use ammonia as fuel.• Demonstration projects could test fuels cells in combination with ammonia to show a business
case regarding costs and durability.• Additional assessments with an energy-system perspective with more detailed representation of
the shipping and aviation sector will increase understanding about under which circumstancesdifferent renewable marine fuels are cost-effective and interesting for different parts of theshipping sector.
A large-scale introduction of alternative marine fuels, ammonia as well as others, needs tobe supported by policy measures. The choice and design of these policies will also influence theprerequisites for different marine fuels. Thus, policy analysis clarifying the impact of different policiesand policy designs on different marine fuel options are also needed.
Author Contributions: Conceptualization and overall methodology, J.H. and S.B.; literature review of ammoniaand data collection, J.H., S.B., and E.F.; energy system modeling, M.L. and S.B.; multi-criteria assessment, J.H.and S.B.; analysis and investigation, J.H., S.B., E.F., and M.L.; writing—original draft preparation, J.H., S.B.,E.F., and M.L.; writing—review and editing, J.H., S.B., E.F., and M.L.; visualization, J.H., S.B., and M.L.; projectadministration, J.H.; and funding acquisition, J.H., S.B., and E.F. All authors have read and agreed to the publishedversion of the manuscript.
Funding: This research was funded by the Swedish Energy Agency, grant number 47479-1 Pathways towards50% reduction of GHGs from shipping until 2050 and the Swedish Transport Administration’s industry programSustainable shipping led by the Swedish Maritime Competence Centre (Lighthouse), grant number FS2_2019 Thepotential of ammonia as fuel for shipping and FP2_E_2020 Assessment of hydrogen, ammonia and battery-electricpropulsion for future zero carbon shipping.
Acknowledgments: We gratefully acknowledge Josefin Lövdahl and Maria Magnusson for the initial assessmentperformed in their Master Thesis at Chalmers University of Technology supervised by the authors of this paper.

Sustainability 2020, 12, 3265 16 of 20
Conflicts of Interest: The authors declare no conflict of interest. The funders had no role in the design of thestudy; in the collection, analyses, or interpretation of data; in the writing of the manuscript, or in the decision topublish the results.
List of Abbreviations
Abbreviation MeaningAHP Analytic Hierarchy ProcessCCS Carbon capture and storageCH4 MethaneCI Compression ignitionCO2 Carbon dioxideElec-H2 Hydrogen from electrolysis based on renewable electricityElec-NH3 Ammonia from electrolysis based on renewable electricityFC Fuel cellGET Global Energy Transition ModelGHG Greenhouse gasGWP100 Global warming potential over 100-year time horizonH2 HydrogenHB Haber–BoschHFO Heavy fuel oilHVO Hydrotreated vegetable oilICE Internal combustion engineIMO International Maritime OrganizationLBG Liquefied biogasLNG Liquefied natural gasMCDA Multi-criteria decision analysisMeOH MethanolMGO Marine gas oilNG Natural gasNG-H2 Hydrogen from natural gasNG-MeOH Methanol from natural gasNG-NH3 Ammonia from natural gasNH3 AmmoniaN2O Nitrous oxideNOX Nitrogen oxidesPEM FC Proton-exchange membrane fuel cellPM Particulate matterSCR Selective Catalytic ReductionSI Spark ignitionSO2 Sulphur dioxideSOFC Solid oxide fuel cellsUSD US dollar
Appendix A. Pairwise Comparisons in the Analytic Hierarchy Process (AHP)
The pairwise comparison matrices for the included criteria applied in this study are expressed in mathematicalterms by Equation (A1) where aij > 0 expresses the degree of preference of aspect xi to xj using the fundamentalscale of absolute numbers for intensities defined by Saaty in AHP (Table A1).
PCM =(aij
)n × n
PCM =
a11 a12a21 a22
· · · a1n· · · a2n
......
an1 an2
. . ....
· · · ann
(A1)
Sustainability 2020, 12, 3265 17 of 20
Table A1. Fundamental scale of absolute numbers used in pairwise comparisons of alternatives andcriteria defined by Saaty in AHP [47].
Intensity of Importance. Definition Explanation
1 Equal importance Two elements contribute equallyto the objective
3 Moderate importance Experience or judgment slightlyfavors one element over another
5 Strong importance Experience or judgment stronglyfavors one element over another
7 Very strong importance One element is favored verystrongly over another
9 Extreme importanceThe evidence favoring oneelement over another is the
highest possible
A consistency check of the comparisons in the matrices is done by solving the characteristic equation(Equation (A2)). The maximum eigenvalue, λ_max, is used for calculating a consistency index (CI), Equation (A3),and thereafter a consistency ratio (CR), Equation (A4), where n is the size of the pairwise comparison matrix andRIn a random index.
det(PCM− λ·I) = 0 (A2)
CI(PCM) =λmax − n
n − 1(A3)
CR(PCM) =CI(PCM)
RIn(A4)
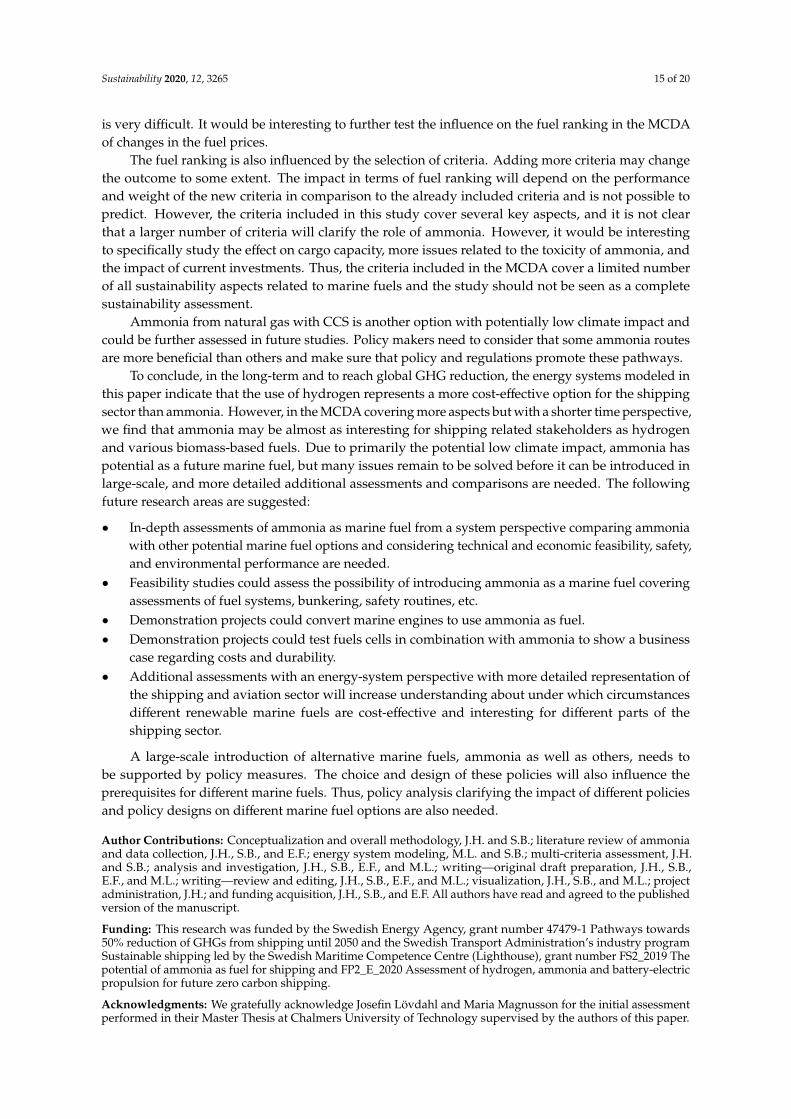
The normalized priority vector is for each matrix calculated as the geometric mean divided by the sum ofthe priorities. Based on the individual stakeholder pairwise comparison matrices, group priority vectors areconstructed by aggregation of individual priorities assuming equal importance and using the weighted geometricmean. The normalized priority (i.e., relative importance) for each criterion is presented in Table A2. The finalranking of the alternative marine fuels is then derived by linear combination of the group priority vectors and thenormalized priority vector from the pairwise comparison.
Table A2. Relative importance of the criteria expressed as normalized priorities (rounded figures)based on the pairwise comparisons of the criteria performed by the stakeholders individually and forthe stakeholder groups.
Criteria CombinedCase Authorities Ship-Owners Fuel
ProducersEngine
Manufacturers
Investment cost 0.26 0.25 0.20 0.23 0.23Operational cost 0.16 0.25 0.07 0.12 0.12
Fuel cost 0.58 0.50 0.73 0.65 0.65Available infrastructure 0.29 0.17 0.20 0.20 0.20Reliable supply of fuel 0.71 0.83 0.80 0.80 0.80
Acidification 0.21 0.19 0.10 0.11 0.26Health impact 0.30 0.08 0.23 0.31 0.64
Climate change 0.50 0.73 0.67 0.58 0.11Safety 0.48 0.25 0.80 0.17 0.17
Upcoming legislation 0.52 0.75 0.20 0.83 0.83
References
1. IMO. Adoption of the Initial IMO Strategy on Reduction of GHG Emissions from Ships and Existing IMO ActivityRelated to Reducing GHG Emissions in the Shipping Sector; Note by the International Maritime Organization tothe UNFCCC Talanoa Dialogue; International Maritime Organization: London, UK, 2018; pp. 1–27.
2. Balcombe, P.; Brierley, J.; Lewis, C.; Skatvedt, L.; Speirs, J.; Hawkes, A.; Staffell, I. How to decarboniseinternational shipping: Options for fuels, technologies and policies. Energy Convers. Manag. 2019, 182, 72–88.[CrossRef]
Sustainability 2020, 12, 3265 18 of 20
3. Bouman, E.A.; Lindstad, E.; Rialland, A.I.; Strømman, A.H. State-of-the-art technologies, measures, andpotential for reducing GHG emissions from shipping—A review. Transp. Res. Part D Transp. Environ. 2017,52, 408–421. [CrossRef]
4. ICCT. Reducing Greenhouse Gas Emissions from Ships—Cost Effectiveness of Available Options; White PaperNumber 11; International Council on Clean Transportation: Washington DC, WA, USA, 2011.
5. Psaraftis, H.N. Ship routing and scheduling: The cart before the horse conjecture. Marit. Econ. Logist. 2017,21, 111–124. [CrossRef]
6. Taljegard, M.; Brynolf, S.; Grahn, M.; Andersson, K.; Johnson, H. Cost-Effective Choices of Marine Fuelsin a Carbon-Constrained World: Results from a Global Energy Model. Environ. Sci. Technol. 2014, 48,12986–12993. [CrossRef] [PubMed]
7. Traut, M.; Larkin, A.; Anderson, K.; McGlade, C.; Sharmina, M.; Smith, T. CO2 abatement goals forinternational shipping. Clim. Policy 2018, 18, 1066–1075. [CrossRef]
8. DNV GL. Comparison of Alternative Marine Fuels; DNV GL AS Maritime: Høvik, Norway, 2019.9. Hansson, J.; Månsson, S.; Brynolf, S.; Grahn, M. Alternative marine fuels: Prospects based on multi-criteria
decision analysis involving Swedish stakeholders. Biomass Bioenergy 2019, 126, 159–173. [CrossRef]10. Kirstein, L.; Halim, R.; Merk, O. Decarbonising Maritime Transport—Pathways to Zero-Carbon Shipping by 2035;
OECD International Transport Forum: Paris, France, 2018.11. Klüssmann, J.N.; Ekknud, L.R.; Ivarsson, A.; Schramm, J. The Potential for Ammonia as a Transportation Fuel—A
Literature Review; The Technical University of Denmark (DTU): Lyngby, Denmark, 2019.12. Maritime Knowledge Centre, TNO and TU. Framework CO2 Reduction in Shipping; Maritime Knowledge
Centre, TNO and TU: Delft, The Netherlands, 2017.13. CSR Netherlands. Ship 2040: Pioneers of the Maritime Sector; MVO Nederland: Utrecht, the Netherlands, 2017.14. Lloyd’s Register and University Maritime Advisory Services (UMAS). Zero-Emission Vessels 2030. How Do We
Get There; Lloyd’s Register Group Limited: London, UK, 2017.15. Ahlgren, S.B.F.; Hulteberg, C. Produktion av Kvävegödsel Baserad på Förnybar Energi—En översikt av Teknik,
Miljöeffekter och Ekonomi för Några Alternativ; Sveriges Lantbruksuniversitet: Uppsala, Sweden, 2015.16. Giddey, S.; Badwal, S.P.S.; Munnings, C.; Dolan, M. Ammonia as a Renewable Energy Transportation Media.
ACS Sustain. Chem. Eng. 2017, 5, 10231–10239. [CrossRef]17. Kang, D.W.; Holbrook, J.H. Use of NH3 fuel to achieve deep greenhouse gas reductions from US transportation.
Energy Rep. 2015, 1, 164–168. [CrossRef]18. Deniz, C.; Zincir, B. Environmental and economical assessment of alternative marine fuels. J. Clean. Prod.
2016, 113, 438–449. [CrossRef]19. Ren, J.; Liang, H. Measuring the sustainability of marine fuels: A fuzzy group multi-criteria decision making
approach. Transp. Res. Part D Transp. Environ. 2017, 54, 12–29. [CrossRef]20. Ren, J.; Lützen, M. Selection of sustainable alternative energy source for shipping: Multi-criteria decision
making under incomplete information. Renew. Sustain. Energy Rev. 2017, 74, 1003–1019. [CrossRef]21. Halim, R.; Kirstein, L.; Merk, O.; Martinez, L. Decarbonization Pathways for International Maritime Transport:
A Model-Based Policy Impact Assessment. Sustainability 2018, 10, 2243. [CrossRef]22. Ben Brahim, T.; Wiese, F.; Münster, M. Pathways to climate-neutral shipping: A Danish case study. Energy
2019, 188. [CrossRef]23. Yara. Fertilizer Industry Handbook; Yara: Oslo, Norway, 2018.24. Ash, N.; Scarbrough, T. Sailing on Solar: Could Green Ammonia Decarbonise International Shipping; Environmental
Defense Fund: London, UK, 2019.25. Soloveichik, G. Electrochemical synthesis of ammonia as a potential alternative to the Haber–Bosch process.
Nat. Catal. 2019, 2, 377–380. [CrossRef]26. Shipman, M.A.; Symes, M.D. Recent progress towards the electrosynthesis of ammonia from sustainable
resources. Catal. Today 2017, 286, 57–68. [CrossRef]27. Brown, T. Green Ammonia: Haldor Topsoe’s Solid Oxide Electrolyzer; Ammonia Industry: Brooklyn, NY, USA,
2019; Volume 2020, Available online: https://ammoniaindustry.com/ (accessed on 4 December 2019).28. Valera-Medina, A.; Xiao, H.; Owen-Jones, M.; David, W.I.F.; Bowen, P.J. Ammonia for power. Progress Energy
Combust. Sci. 2018, 69, 63–102. [CrossRef]29. Frigo, S.; Gentili, R. Analysis of the behaviour of a 4-stroke Si engine fuelled with ammonia and hydrogen.
Int. J. Hydrogen Energy 2013, 38, 1607–1615. [CrossRef]

Sustainability 2020, 12, 3265 19 of 20
30. Gross, C.W.; Kong, S.-C. Performance characteristics of a compression-ignition engine using direct-injectionammonia–DME mixtures. Fuel 2013, 103, 1069–1079. [CrossRef]
31. Lan, R.; Tao, S. Ammonia as a Suitable Fuel for Fuel Cells. Front. Energy Res. 2014, 2. [CrossRef]32. Mørch, C.S.; Bjerre, A.; Gøttrup, M.P.; Sorenson, S.C.; Schramm, J. Ammonia/hydrogen mixtures in an
SI-engine: Engine performance and analysis of a proposed fuel system. Fuel 2011, 90, 854–864. [CrossRef]33. Pochet, M.; Truedsson, I.; Foucher, F.; Jeanmart, H.; Contino, F. Ammonia-Hydrogen Blends in
Homogeneous-Charge Compression-Ignition Engine. SAE Tech. Pap. 2017. [CrossRef]34. Ryu, K.H.; Zacharakis-Jutz, G.; Kong, S.-C. Effects of Fuel Compositions on Diesel Engine Performance Using
Ammonia-DME Mixtures. SAE Tech. Pap. 2013. [CrossRef]35. Hansson, J.F.E.; Brynolf, S. On the Potential of Ammonia as Fuel for Shipping—A Synthesis of Knowledge;
Lighthouse—Hållbar Sjöfart: Gothenburg, Sweden, 2020.36. De Vries, N. Safe and Effective Application of Ammonia as a Marine Fuel; Delft University of Technology: Delft,
The Netherlands, 2019.37. Tronstad, T.; Åstrand, H.H.; Haugom, G.P.; Langfeldt, L. Study on the Use of Fuel Cells in Shipping; European
Maritime Safety Agency (EMSA), DNV GL Maritime: Hamburg, Germany, 2017.38. MAN Energy Solutions. Engineering the Future Two-Stroke Green-Ammonia Engine; MAN Energy Solutions:
Copenhagen, Denmark, 2019.39. Fertecon. Ammonia Market Report. 6 June 2019. Available online: https://agribusinessintelligence.informa.com/
products-and-services/data-and-analysis/fertecon/ammonia-market-report (accessed on 12 March 2020).40. Hochman, G.G.A.; Felder, F.A.; Mayer, J.; Miller, A.; Holland, P.L. The Potential Economic Feasibility of Direct
Electrochemical Nitrogen Reduction as a Route to Ammonia; ChemRxiv: New Jersey, NJ, USA, 2019.41. Olmer, N.C.; Roy, B.; Mao, X.; Rutherford, D. Greenhouse Gas Emissions from Global Shipping, 2013–2015;
International Council on Clean Transportation: Washington, DC, USA, 2017.42. Lehtveer, M.; Brynolf, S.; Grahn, M. What Future for Electrofuels in Transport? Analysis of Cost
Competitiveness in Global Climate Mitigation. Environ. Sci. Technol. 2019, 53, 1690–1697. [CrossRef][PubMed]
43. Grahn, M.; Azar, C.; Williander, M.I.; Anderson, J.E.; Mueller, S.A.; Wallington, T.J. Fuel and VehicleTechnology Choices for Passenger Vehicles in Achieving Stringent CO2 Targets: Connections betweenTransportation and Other Energy Sectors. Environ. Sci. Technol. 2009, 43, 3365–3371. [CrossRef] [PubMed]
44. Lövdahl, J.; Magnusson, M. Evaluation of Ammonia as a Potential Marine Fuel; Department of Mechanics andMaritime Technology, Chalmers University of Technology: Gothenburg, Sweden, 2019.
45. Van Biert, L.; Godjevac, M.; Visser, K.; Aravind, P.V. A review of fuel cell systems for maritime applications.J. Power Sources 2016, 327, 345–364. [CrossRef]
46. Brunelli, M. Introduction to the Analytic Hierarchy Process; Springer International Publishing: Cham,Switzerland; New York, NY, USA; Dordrecht, The Netherlands; London, UK, 2015.
47. Saaty, T.L. Decision making with the analytic hierarchy process. Int. J. Serv. Sci. 2008, 1, 83–98. [CrossRef]48. Månsson, S. Prospects for Renewable Marine Fuels; Chalmers University of Technology: Gothenburg,
Sweden, 2017.49. Bengtsson, S.A.K.; Ellis, J.; Haraldsson, L.; Ramne, B.; Stefenson, P. Criteria for Future Marine Fuels.
In Proceedings of the IAME 2012 Conference, Taipei, Taiwan, 6–8 September 2012.50. Danish Maritime Authority. North European LNG Infrastructure Project—A Feasibility Study for an LNG
Filling Station Infrastructure and Test of Recommendations; The Danish Maritime Authority: Copenhagen,Denmark, 2012.
51. Moniz, E.J.H.D.; Meggs, A.J.M. The Future of Natural Gas—An Interdisciplinary MIT Study; MassachusettsInstitute of Technology: Cambridge, MA, USA, 2012.
52. Schnitkey, G. Fertilizer Costs in 2017 and 2018. Farmdoc Daily, 11 July 2017.53. Economic Research Service. All Fertilizer Use and Price Tables in a Single Workbook. Available online:
https://www.ers.usda.gov/data-products/fertilizer-use-and-price/ (accessed on 28 November 2019).54. Nelissen, D.; Faber, J.; Veen, R.v.d.; Grinsven, A.v.; Shanthi, H.; Toorn, E.v.d. Availability and Costs of Liquefied
Bio- and Synthetic Methane—The Maritime Shipping Perspective; CE Delft: Delft, The Netherlands, 2020.55. Anderson, M.; Salo, K.; Fridell, E. Particle- and Gaseous Emissions from an LNG Powered Ship. Environ. Sci.
Technol. 2015, 49, 12568–12575. [CrossRef]

Sustainability 2020, 12, 3265 20 of 20
56. Brynolf, S.; Fridell, E.; Andersson, K. Environmental assessment of marine fuels: Liquefied natural gas,liquefied biogas, methanol and bio-methanol. J. Clean. Prod. 2014, 74, 86–95. [CrossRef]
57. Gilbert, P.; Walsh, C.; Traut, M.; Kesieme, U.; Pazouki, K.; Murphy, A. Assessment of full life-cycle airemissions of alternative shipping fuels. J. Clean. Prod. 2018, 172, 855–866. [CrossRef]
58. Verbeek, R.K.; Mensch, P.V.; Wulffers, C.; Beemt, B.v.d.; Fraga, F. Environmental and Economic Aspects of UsingLNG as a Fuel for Shipping in The Netherlands; TNO: Delft, The Netherlands, 2011.
59. Lowell, D.W.; Lutsey, N. Assessment of the Fuels Cycle Impacts of Liquefied Natural Gas as Used in InternationalShipping; The International Council on Clean Transportation: Washington DC, WA, USA, 2013.
60. Posch, M.; Seppälä, J.; Hettelingh, J.-P.; Johansson, M.; Margni, M.; Jolliet, O. The role of atmosphericdispersion models and ecosystem sensitivity in the determination of characterisation factors for acidifyingand eutrophying emissions in LCIA. Int. J. Life Cycle Assess. 2008, 13, 477–486. [CrossRef]
61. IES. Characterisation factors of the ILCD Recommended Life Cycle Impact Assessment methods -Database andSupporting Information; European Commission, Joint Research Centre, Institute for Environment andSustainability: Luxembourg, 2012.
62. Bicer, Y.; Dincer, I. Environmental impact categories of hydrogen and ammonia driven transoceanic maritimevehicles: A comparative evaluation. Int. J. Hydrogen Energy 2018, 43, 4583–4596. [CrossRef]
63. Kramer, K.J.; Moll, H.C.; Nonhebel, S. Total greenhouse gas emissions related to the Dutch crop productionsystem. Agric. Ecosyst. Environ. 1999, 72, 9–16. [CrossRef]
64. Wood, S.; Cowie, A. A Review of Greenhouse Gas Emission Factors for Fertilizer Production; Cooperative ResearchCentre for Greenhouse Accounting: Research and Development Division, State Forests of New South Wales;NSW Department of Primary Industries: Armidale, Australia, 2004.
65. Zamfirescu, C.; Dincer, I. Ammonia as a green fuel and hydrogen source for vehicular applications. FuelProcess. Technol. 2009, 90, 729–737. [CrossRef]
66. Bartels, J.R. A Feasibility Study of Implementing an Ammonia Economy; Iowa State University: Ames, IA,USA, 2008.
67. Reiter, A.J.; Kong, S.-C. Combustion and emissions characteristics of compression-ignition engine using dualammonia-diesel fuel. Fuel 2011, 90, 87–97. [CrossRef]
© 2020 by the authors. Licensee MDPI, Basel, Switzerland. This article is an open accessarticle distributed under the terms and conditions of the Creative Commons Attribution(CC BY) license (http://creativecommons.org/licenses/by/4.0/).