the potential of subsurface infiltration for the treatment
TRANSCRIPT

Management Studies, December 2015, Vol. 3, No. 11-12, 281-299
doi: 10.17265/2328-2185/2015.1112.003
The Potential of Subsurface Infiltration for the Treatment of
Biofil Toilet Technology Effluent
Peter Owusu-Antwi, Richard Buamah, Helen Essandoh
Kwame Nkrumah University of Science & Technology, Kumasi, Ghana
Adane Sewhunegn Molla
Hawassa University, Hawassa, Ethiopia
Esi Awuah
University of Energy & Natural Resources, Sunyani, Ghana
Kweku Akuam Anno
Biological Filters & Composters Limited (BIOFILCOM), Accra, Ghana
Generally discharges from on-site sanitation (OSS) system could be a source of pollution to the environment if not
well managed. This work illustrates the potential of subsurface infiltration to treat secondary effluent from a novel
on-site vermi-biofiltration system called the Biofil Toilet Technology (BTT). In practice, the BTT effluent is
discharged via sub-surface infiltration. The focus of the research was to determine possible contaminant removal
within the first 1.5 m depth of soil column. To achieve this objective, laboratory scale soil columns were designed
and constructed for the treatment of secondary domestic wastewater from the BTT. Four different soil columns,
each with 1.5 m depth of soil (sandy soil—SS, loamy soil—LS, clayey soil—CS, and red laterite soil—RLS) and
fifth column with 0.45 m multi-layer sand filter were constructed and characterized. The columns were fed with the
BTT effluent and sampled at ports spaced at 0.3 m, 0.8 m, and 1.5 m depths. Using the samples, parameters like
COD, BOD5, TSS, T-N, NO3-N, NO2-N, PO4-P, and pathogenic indicator microbes were monitored. RLS and SS
columns efficiently removed COD, BOD5, and TSS from the BTT effluent below the Ghana Environmental
Protection Agency (GH EPA) guideline values. Up to 99% COD removal were observed in RLS column. A two to
five log pathogen removal was recorded for the soil columns. The RLS and SS were found to have a high efficacy
for contaminant removal with up to 80% of all contaminants being removed at a depth of 0.3 m along the soil
columns. Thus the subsurface infiltration system can serve as a promising technology for the BTT effluent
treatment. The study recommends the incorporation of infiltration systems to the BTT especially for areas with high
water table or clayey soils.
Keywords: Biofil, on-site, blackwater, infiltration, vermicomposting, toilet, soil, eudrilus euginae
Acknowledgement: This study was financed by the Bill and Melinda Gates Foundation under the SaniUp Project.
Peter Owusu-Antwi, Ph.D. fellow, Kwame Nkrumah University of Science & Technology, Kumasi, Ghana.
Richard Buamah, Ph.D., Kwame Nkrumah University of Science & Technology, Kumasi, Ghana.
Helen Essandoh, Ph.D., Kwame Nkrumah University of Science & Technology, Kumasi, Ghana.
Adane Sewhunegn Molla, M.Sc., Hawassa University, Hawassa, Ethiopia.
Esi Awuah, Ph.D., professor, University of Energy & Natural Resources, Sunyani, Ghana.
Kweku Akuam Anno, B.Sc., Biological Filters & Composters Limited (BIOFILCOM), Sunyani, Ghana.
Correspondence concerning this article should be addressed to Peter Owusu-Antwi, KNUST, College of Engineering,
Department of Civil Engineering, Kumasi, Ghana. E-mail: [email protected].
DAVID PUBLISHING
D

TREATMENT OF BIOFIL TOILET TECHNOLOGY EFFLUENT
282
Introduction
Properly designed biological filters or infiltration systems have the capacity to significantly reduce effluent
concentrations of pathogenic microorganisms and physico-chemical parameters in wastewater (Stevik, Aab,
Auslanda, & Hanssen, 2004). Soil treatment of wastewater has emerged as a crucial concept for many
sanitation technologies. In this concept, pre-treated wastewater is allowed to infiltrate through the aerated
unsaturated soil zone where it undergoes purification via filtration, adsorption, chemical processes, and
biodegradation (Nema, Ojha, Kumar, & Khanna, 2001). On-site sanitation (OSS) technologies are increasingly
used in small towns, suburban, and rural areas in many developing countries (Stevik et al., 2004). In Ghana for
instance, approximately 85% of inhabitants are served by OSS facilities with only 7% coverage for sewer
systems in Accra, Kumasi, and Akosombo cities (Koné & Strauss, 2004). Many of such OSS facilities—pit
latrines generally lack physical barriers, such as concrete or block lining, between stored excreta and soil (Van
Ryneveld & Fourie, 1997) which may allow contaminants from pits to potentially leach into groundwater. In
addition, owing to: (i) the aggravating issue of limited space in urban areas; (ii) inaccessible septic tanks; (iii)
occurrence of occasional toilet spillages and indiscriminate discharge of faecal matter; (iv) long haulage
distance to disposal facilities; and (v) the escalating cost of transport and disposal, the sanitation menace is
likely to increase and affect public health (Thrift, 2007).
The Biofil Toilet Technology (BTT) is a household blackwater treatment unit and comprises of a compact
concrete panel box measuring 1.8 m 0.6 m 0.6 m (Figure 1). It is installed subsurface at a maximum depth
of 0.3 m depending upon the level of the water table or presence of rock bedding. The technology uses aerobic
processes for decomposition of faecal matter and other organic components. It has a porous concrete filter (PCF)
for rapid solid-liquid separation of blackwater.
Solids remain in the box as residue and are broken down by the action of waste digesters and their
interaction with microbes. Effluent after solid-liquid separation within the digester is discharged into the
sub-surface soil via a drain field with the bottom of the digester lined (as a full flush) or directly with the
bottom of the digester unlined (as a microflush). The main effluent discharge after the BTT is by sub-surface
infiltration (Figure 1). On top of the PCF is coir to act as bulking material to create an enabling environment for
the main waster digester (eudrilus euginae). Since the emergence of the technology, there is little or no
literature regarding its treatment mechanism and how it works.
Figure 1. Schematic of the Biofil Toilet Technology (Biofilcom design by author).
TREATMENT OF BIOFIL TOILET TECHNOLOGY EFFLUENT
283
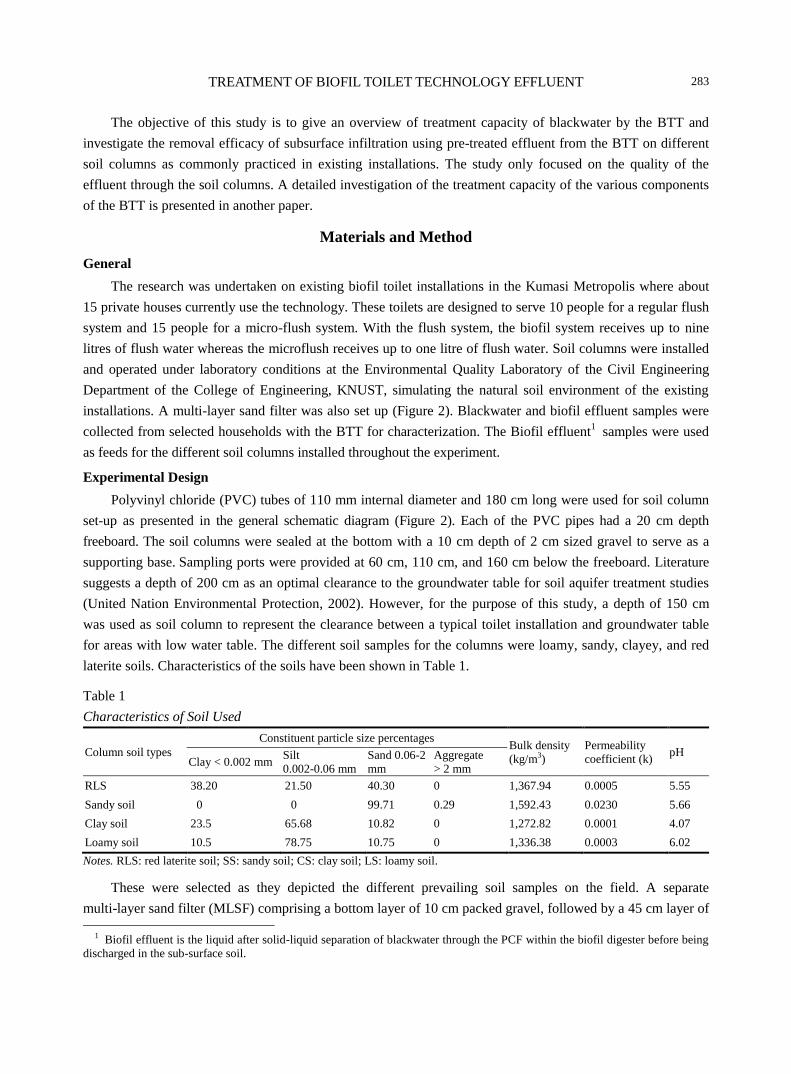
The objective of this study is to give an overview of treatment capacity of blackwater by the BTT and
investigate the removal efficacy of subsurface infiltration using pre-treated effluent from the BTT on different
soil columns as commonly practiced in existing installations. The study only focused on the quality of the
effluent through the soil columns. A detailed investigation of the treatment capacity of the various components
of the BTT is presented in another paper.
Materials and Method
General
The research was undertaken on existing biofil toilet installations in the Kumasi Metropolis where about
15 private houses currently use the technology. These toilets are designed to serve 10 people for a regular flush
system and 15 people for a micro-flush system. With the flush system, the biofil system receives up to nine
litres of flush water whereas the microflush receives up to one litre of flush water. Soil columns were installed
and operated under laboratory conditions at the Environmental Quality Laboratory of the Civil Engineering
Department of the College of Engineering, KNUST, simulating the natural soil environment of the existing
installations. A multi-layer sand filter was also set up (Figure 2). Blackwater and biofil effluent samples were
collected from selected households with the BTT for characterization. The Biofil effluent1 samples were used
as feeds for the different soil columns installed throughout the experiment.
Experimental Design
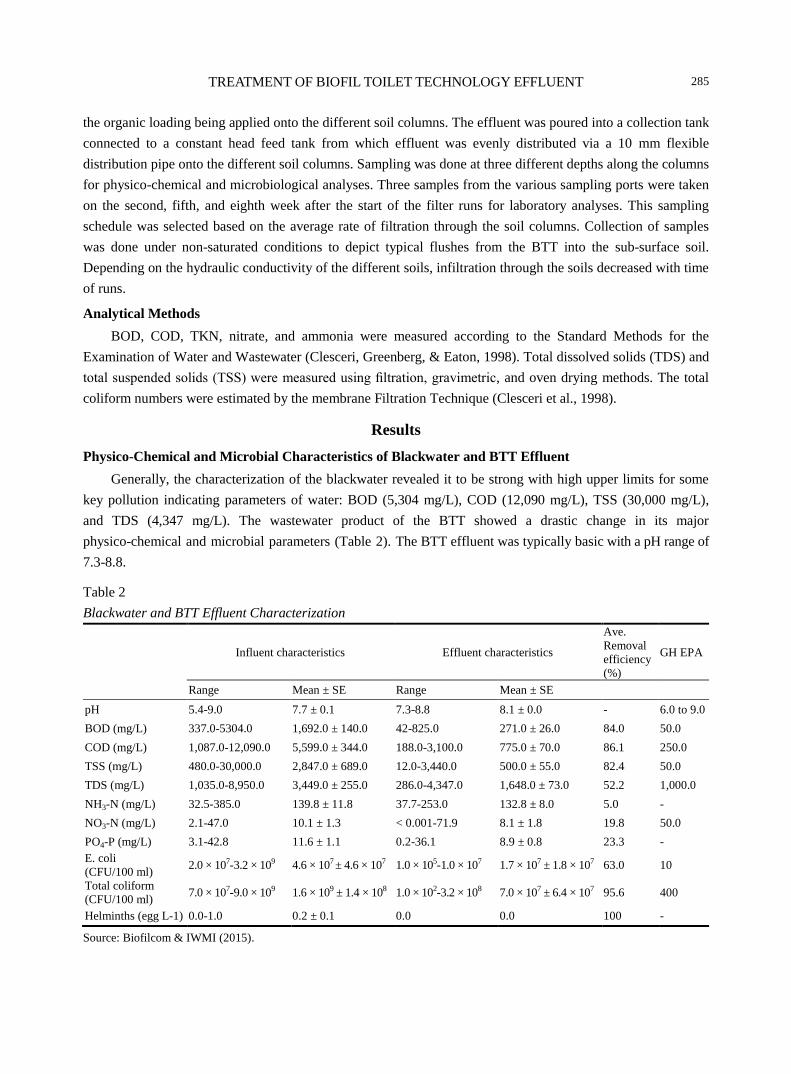
Polyvinyl chloride (PVC) tubes of 110 mm internal diameter and 180 cm long were used for soil column
set-up as presented in the general schematic diagram (Figure 2). Each of the PVC pipes had a 20 cm depth
freeboard. The soil columns were sealed at the bottom with a 10 cm depth of 2 cm sized gravel to serve as a
supporting base. Sampling ports were provided at 60 cm, 110 cm, and 160 cm below the freeboard. Literature
suggests a depth of 200 cm as an optimal clearance to the groundwater table for soil aquifer treatment studies
(United Nation Environmental Protection, 2002). However, for the purpose of this study, a depth of 150 cm
was used as soil column to represent the clearance between a typical toilet installation and groundwater table
for areas with low water table. The different soil samples for the columns were loamy, sandy, clayey, and red
laterite soils. Characteristics of the soils have been shown in Table 1.
Table 1
Characteristics of Soil Used
Column soil types
Constituent particle size percentages Bulk density
(kg/m3)
Permeability
coefficient (k) pH
Clay < 0.002 mm Silt
0.002-0.06 mm
Sand 0.06-2
mm
Aggregate
> 2 mm
RLS 38.20 21.50 40.30 0 1,367.94 0.0005 5.55
Sandy soil 0 0 99.71 0.29 1,592.43 0.0230 5.66
Clay soil 23.5 65.68 10.82 0 1,272.82 0.0001 4.07
Loamy soil 10.5 78.75 10.75 0 1,336.38 0.0003 6.02
Notes. RLS: red laterite soil; SS: sandy soil; CS: clay soil; LS: loamy soil.
These were selected as they depicted the different prevailing soil samples on the field. A separate
multi-layer sand filter (MLSF) comprising a bottom layer of 10 cm packed gravel, followed by a 45 cm layer of
1 Biofil effluent is the liquid after solid-liquid separation of blackwater through the PCF within the biofil digester before being
discharged in the sub-surface soil.

TREATMENT OF BIOFIL TOILET TECHNOLOGY EFFLUENT
284
washed sand (effective particle size of 0.25-0.65 mm and uniformity coefficient of 3-4) and a 5 cm gravel layer
with particle size of 6-12 mm (adopted from Baig, Mahmood, Nawab, Shafqat, & Pervez, 2011) was used.
Only one sampling port was provided to collect filtrate samples from the MLSF column at the bottom. The
MLSF was adopted and tested as a modified sand filter for cleaning the effluent.
Figure 2. Conceptual scheme of the experimental soil column set-up.
Column Feeding Regime and Periodic Sampling Schedule
Biofil effluent was collected every morning between 6:00 am and 7:00 am for two consecutive months
from private homes and transported immediately to the experimental setup. Blackwater was initially
characterized for its physico-chemical and microbiological constituents as baseline data. The BTT effluent was
also characterized to determine the contaminant removal from the blackwater by the Biofil digester to establish
TREATMENT OF BIOFIL TOILET TECHNOLOGY EFFLUENT
285
the organic loading being applied onto the different soil columns. The effluent was poured into a collection tank
connected to a constant head feed tank from which effluent was evenly distributed via a 10 mm flexible
distribution pipe onto the different soil columns. Sampling was done at three different depths along the columns
for physico-chemical and microbiological analyses. Three samples from the various sampling ports were taken
on the second, fifth, and eighth week after the start of the filter runs for laboratory analyses. This sampling
schedule was selected based on the average rate of filtration through the soil columns. Collection of samples
was done under non-saturated conditions to depict typical flushes from the BTT into the sub-surface soil.
Depending on the hydraulic conductivity of the different soils, infiltration through the soils decreased with time
of runs.
Analytical Methods
BOD, COD, TKN, nitrate, and ammonia were measured according to the Standard Methods for the
Examination of Water and Wastewater (Clesceri, Greenberg, & Eaton, 1998). Total dissolved solids (TDS) and
total suspended solids (TSS) were measured using filtration, gravimetric, and oven drying methods. The total
coliform numbers were estimated by the membrane Filtration Technique (Clesceri et al., 1998).
Results
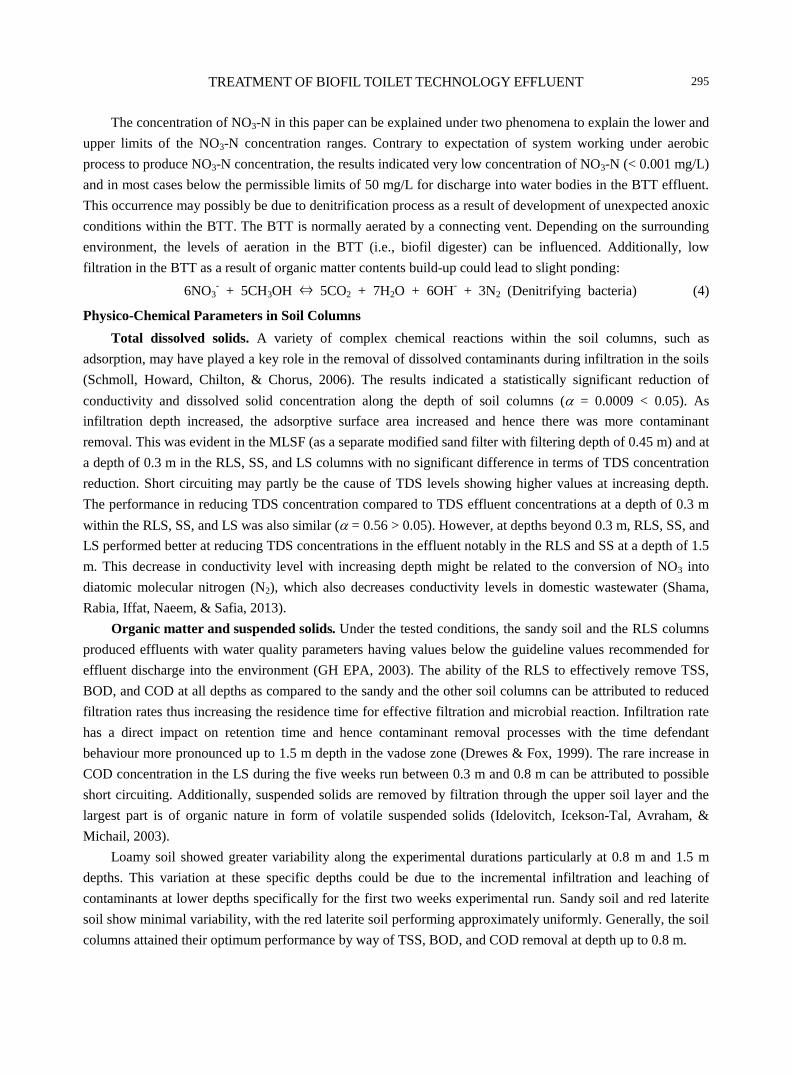
Physico-Chemical and Microbial Characteristics of Blackwater and BTT Effluent
Generally, the characterization of the blackwater revealed it to be strong with high upper limits for some
key pollution indicating parameters of water: BOD (5,304 mg/L), COD (12,090 mg/L), TSS (30,000 mg/L),
and TDS (4,347 mg/L). The wastewater product of the BTT showed a drastic change in its major
physico-chemical and microbial parameters (Table 2). The BTT effluent was typically basic with a pH range of
7.3-8.8.
Table 2
Blackwater and BTT Effluent Characterization
Influent characteristics Effluent characteristics
Ave.
Removal
efficiency
(%)
GH EPA
Range Mean ± SE Range Mean ± SE
pH 5.4-9.0 7.7 ± 0.1 7.3-8.8 8.1 ± 0.0 - 6.0 to 9.0
BOD (mg/L) 337.0-5304.0 1,692.0 ± 140.0 42-825.0 271.0 ± 26.0 84.0 50.0
COD (mg/L) 1,087.0-12,090.0 5,599.0 ± 344.0 188.0-3,100.0 775.0 ± 70.0 86.1 250.0
TSS (mg/L) 480.0-30,000.0 2,847.0 ± 689.0 12.0-3,440.0 500.0 ± 55.0 82.4 50.0
TDS (mg/L) 1,035.0-8,950.0 3,449.0 ± 255.0 286.0-4,347.0 1,648.0 ± 73.0 52.2 1,000.0
NH3-N (mg/L) 32.5-385.0 139.8 ± 11.8 37.7-253.0 132.8 ± 8.0 5.0 -
NO3-N (mg/L) 2.1-47.0 10.1 ± 1.3 < 0.001-71.9 8.1 ± 1.8 19.8 50.0
PO4-P (mg/L) 3.1-42.8 11.6 ± 1.1 0.2-36.1 8.9 ± 0.8 23.3 -
E. coli
(CFU/100 ml) 2.0 × 10⁷-3.2 × 10⁹ 4.6 × 10⁷ ± 4.6 × 10⁷ 1.0 × 10⁵-1.0 × 10⁷ 1.7 × 10⁷ ± 1.8 × 10⁷ 63.0 10
Total coliform
(CFU/100 ml) 7.0 × 10⁷-9.0 × 10⁹ 1.6 × 10⁹ ± 1.4 × 10⁸ 1.0 × 10²-3.2 × 10⁸ 7.0 × 10⁷ ± 6.4 × 10⁷ 95.6 400
Helminths (egg L-1) 0.0-1.0 0.2 ± 0.1 0.0 0.0 100 -
Source: Biofilcom & IWMI (2015).

TREATMENT OF BIOFIL TOILET TECHNOLOGY EFFLUENT
286
Preliminary experiments on existing BTT installations suggested a high percentage removal for TSS, BOD5,
and COD concentrations (80%-85% reduction in blackwater) with a fair percentage removal for TDS
concentration (approximately 50% reduction in blackwater). This notwithstanding, the upper limits of the BTT
effluent recorded concentrations (i.e., BOD5 825 mg/L; COD 3,100 mg/L; and TSS 3,440 mg/L) above the
acceptable Ghana Environmental Protection Agency (GH EPA) limits for discharge into water bodies. The
results also indicated a relatively low removal capacity for nutrients (NH3-N, NO3-N, and PO4-P: < 40%
reduction). The results revealed a decrease in NH3-N concentration and an increase in the NO3-N concentration in
the BTT effluent. NO3-N concentrations in the BTT effluent were typically within the GH EPA acceptable limits
for discharge into water bodies. There was generally high percentage removal of total coliforms and E. coli in the
BTT effluent; though the upper limit concentrations indicated values not permissible for discharge into natural
water bodies. The BTT also indicated an excellent removal for helminth.
Physico-Chemical Characteristics in the Soil Columns
Filtrates collected from the sampling ports were analyzed for pH, conductivity, TDS, COD, TSS, BOD5,
NH4-N, NO2-N, NO3-N, faecal, and total coliform.
The pH of the influent and effluent from the soil columns were typically basic within a range of 6.5 to 8.86.
The effluent sampled at a depth of 1.5 m from the SS column was acidic with a value of 5.04.
Conductivity concentration generally varied at different depths of the soil columns with the lowest
concentration of 417 µS/cm measured at a depth of 1.5 m in RLS. The maximum was observed in the MLSF
(Figure 3). Throughout the experiment, a minimum average temperature of 28.2 oC and maximum 31.8
oC
(mean deviations of 0.3 to 1.8) was recorded.
There was a general trend of decreasing TDS concentration with increasing depth in the different soil
columns (Figure 4) with the influent concentration (1,200-1,500 mg/L) reducing to 500 mg/L in the RLS at a
depth of 1.5 m for instance. An exception was observed in the SS and MLSF where TDS concentrations
generally did not change from the influent concentration. LS, SS, and RLS recorded an average of 50%, 60%,
and 80% TDS removal respectively at the maximum depth of 1.5 m. The RLS demonstrated good percentage
removal at depth of 1.5 m.
A similar trend of decreasing COD concentrations with increasing depth was recorded (Figure 4). The
influent concentration was generally reduced from a range between 900-1,200 mg/L to below 300 mg/L in the
RLS and SS. The RLS and SS performed better (with residual COD concentration below 250mg/L) than LS
and the MLSF. Effective COD removal occurred within 30 cm of these soil columns. However, the COD
concentration for LS between 0.3 m and 0.8 m increased in the five weeks run.
The RLS and SS columns also achieved better TSS and BOD5 concentration removals than the LS and
MLSF (Figure 5). TSS concentrations were efficiently reduced in the RLS and SS columns from an average of
500 mg/L in the effluent to below 50 mg/L at a depth of 0.8 m. The MLSF also achieved good TSS concentration
reduction of approximately 400 mg/L. A similar trend was observed with the BOD5 concentrations in the RLS
and SS columns. The influent concentrations were reduced by 450 mg/L with the residual concentration within
the EPA acceptable limits of 50 mg/L for discharge. In the case of the LS, the TSS concentration was not
consistent with increasing depth. An increase in concentration occurred at a depth of 0.8 m.
Generally TSS and BOD5 concentrations were effectively reduced within a depth of 0.3 m of the RLS and
SS columns.

TREATMENT OF BIOFIL TOILET TECHNOLOGY EFFLUENT
287
Figure 3. pH and conductivity levels of influent and effluent in soil columns.
2
3
4
5
6
7
8
9
10
0.3m 0.8m 1.5m 0.3m 0.8m 1.5m 0.45m 0.3m 0.8m 1.5m
Influent Loam Soil Sand Soil MLSF Red L. Soil
pH
2 wks run 5 wks run
8 wks run
0.3m 0.8m 1.5m 0.3m 0.8m 1.5m 0.3m 0.8m 1.5m 0.45m
Influent Loamy Soil Sandy Soil Red Latrite Soil MLSF
2 Wks run 2,333 2,023 1,133 1,163 2,540 938 851 417 2,709
5 Wks run 2,511 2,286 1,679 2,614 2,560 1,232 2,033 2,011 955 2,714
8 Wks run 2,870 2,490 1,716 1,556 2,630 2,480 1,081 2,563 2,000 952 2,780
(1,000)
(500)
-
500
1,000
1,500
2,000
2,500
3,000
3,500
4,000
Con
du
ctiv
ity
(µ
S/c
m)

TREATMENT OF BIOFIL TOILET TECHNOLOGY EFFLUENT
288
Figure 4. TDS (EPA value of 1,000 mg/L) and COD (EPA value of 250 mg/L) performance in soil column tests.
0.3m 0.8m 1.5m 0.3m 0.8m 1.5m 0.3m 0.8m 1.5m 0.45m
Influent Loamy Soil Sandy Soil Red Latrite Soil MLSF
2 Wks run 1,172 1,021 813 576 1,275 1,180 469 425 209 1,358
5 Wks run 1,253 1,141 842 1,306 1,280 617 1,016 1,006 477 1,358
8 Wks run 1,437 1,243 859 779 1,313 540 1,283 980 474 1,381
(500)
-
500
1,000
1,500
2,000
TD
S (
mg
/L)
0.3m 0.8m 1.5m 0.3m 0.8m 1.5m 0.3m 0.8m 1.5m 0.45m
Influent Loamy Soil Sandy Soil Red Latrite Soil MLSF
2 Wks run 1,196 1,000 936 912 411 240 440 180 288 520
5 Wks run 920 384 459 301 280 605 100 54 27 263
8 Wks run 883 299 245 232 280 456 85 32 11 272
(400)
(200)
-
200
400
600
800
1,000
1,200
1,400
1,600
1,800
CO
D (
mg
/L)

TREATMENT OF BIOFIL TOILET TECHNOLOGY EFFLUENT
289
Figure 5. TSS and BOD5 levels of the biofil effluent and soil column effluent compared to GH EPA guideline values
of 50 mg/L.
0.3m 0.8m 1.5m 0.3m 0.8m 1.5m 0.3m 0.8m 1.5m 0.45m
Influent Loamy Soil Sandy Soil Red Latrite Soil MLSF
2 Wks run 511 290 230 231 59 158 22 16 77
5 Wks run 561 198 177 79 40 33 26 13 4 80
8 Wks run 514 95 87 58 78 36 42 8 12 7 58
(300)
(200)
(100)
-
100
200
300
400
500
600
700
800
TS
S (
mg
/lL
)
0.3m 0.8m 1.5m 0.3m 0.8m 1.5m 0.3m 0.8m 1.5m 0.45m
Influent Loamy Soil Sandy Soil Red Latrite Soil MLSF
2 Wks run 630.3 90.12 180.35 240.12 69.12 55.00 72.00 2.28 6.03 111.12
5 Wks run 390.00 54.00 226.80 33.60 48.00 12.00 15.00 12.60 6.60 123.60
8 Wks run 400.00 78.00 76.00 54.00 70.00 12.00 10.00 5.00 4.00 64.00
-200
-100
0
100
200
300
400
500
600
700
800
BO
D (
mg
/L)

TREATMENT OF BIOFIL TOILET TECHNOLOGY EFFLUENT
290
Figure 6. Percentage removal of TSS, BOD, and COD at different infiltration depths of soil columns.
The nutrient levels in the BTT influent had high concentrations of T-N and NH4-N up to 250 mg/L (Figure
7), compared with the GH EPA general effluent guideline values for discharge to natural water bodies (50 mg/L
NO3-N) (GH EPA, 2003). Most of the nutrient levels recorded (particularly NO3-N) were very low (0.06 mg/L
for NO3-N). There were significant reduction in these concentrations at depths of 0.8 m. NO3-N and a NO2-N
concentration in both the influent and effluent were generally less than 50 mg/L, but observed to increase at a
depth of 1.5 m within the soil columns, notably in the SS. Similarly, T-N concentrations increased at a depth of
1.5 m in the SS. RLS column were effective in reducing the concentrations of T-N and NO3-N in the BTT effluent
compared to the other sol columns. Phosphorus concentrations (PO4-P) in the influent were above the
Ghana-EPA guidelines but were significantly reduced in the soil columns notably in the RLS.
Pathogen Characteristics in Soil Columns
The levels of total and faecal coliforms applied as feed onto the different soil columns were 1.63 108 and
8.47 107 cfu/100ml respectively. Analyses of the effluent collected at various depths of the soil columns
revealed good reductions in coliform counts with increasing depth. The highest removal rates were recorded
within the RLS, SS, and LS columns in that order (Figure 8). Faecal and total coliform removals of 2-5 log
were recorded in the RLS and SS columns (Figure 9).

TREATMENT OF BIOFIL TOILET TECHNOLOGY EFFLUENT
291
Figure 7. Nutrient concentrations in soil column effluent.
0
50
100
150
200
250
300
350
0.3m 1.5m 0.8m 1.5m 0.45m
Influent Sand soil Red Lateritic soil MLSF
Con
cen
trati
on
(m
g/L
)
T-Nitrogen
NH4-N
NO3-N
NO2-N
0
2
4
6
8
10
12
14
0.3m 0.8m 0.3m 0.8m 1.5m 0.3m 0.8m 1.5m
Influent Loamy soil Sand soil Red Lateritic soil
Con
cen
trati
on
(m
g/L
)
NO3-N PO4-P

TREATMENT OF BIOFIL TOILET TECHNOLOGY EFFLUENT
292
Figure 8. Pathogen levels in influent and effluent of soil columns.
-400
-200
0
200
400
600
800
1000
1200
1400
1600
0.3m 0.8m 1.5m 0.3m 0.8m 1.5m 0.3m 0.8m 1.5m 0.45m
Influent Loamy Soil Sandy Soil Red Latrite Soil MLSF
FC
1
03
cfu
/10
0m
L
2 Wks run 5 Wks run 8 Wks run
-100
0
100
200
300
400
500
600
0.3m 0.8m 1.5m 0.3m 0.8m 1.5m 0.3m 0.8m 1.5m 0.45m
Influent Loamy Soil Sandy Soil Red Latrite Soil MLSF
TC
1
04
cfu
/10
0 m
L
2 Wks run 5 Wks run 8 Wks run

TREATMENT OF BIOFIL TOILET TECHNOLOGY EFFLUENT
293
Figure 9. Faecal and total coliform log removal rates of experimental soil columns.
Discussion
Overview of the Performance of the BTT for Contaminant Removal in Blackwater
Studies have indicated that COD and BOD concentrations less than 100 mg/L and 50 mg/L respectively
can be considered as stable wastewater (Molla & Kaba, 2011). Blackwater characterization in this study seems
to agree with the assertion. The decomposition of organic fractions of wastewater, mainly by microbes in water,
0
0.5
1
1.5
2
2.5
3
3.5
4
4.5
5
5.5
0.3m 0.8m 1.5m 0.3m 0.8m 1.5m 0.3m 0.8m 1.5m 0.45m
FC
Log
rem
oval
2 Wks run
5 Wks run
8 Wks run
0
0.5
1
1.5
2
2.5
3
3.5
4
4.5
5
5.5
0.3m 0.8m 1.5m 0.3m 0.8m 1.5m 0.3m 0.8m 1.5m 0.45m
Loamy Soil Sandy Soil Red Latrite Soil MLSF
TC
Log
rem
oval

TREATMENT OF BIOFIL TOILET TECHNOLOGY EFFLUENT
294
produces some species of mineralized organic materials (CO32-
, NH4+, and NO
3−) which play an important role
in shifting of pH scale (Suthar & Tomar, 2011). The high urea content in urine which forms a major part of
blackwater may have contributed to basic nature of the BTT effluent and seem to correspond to existing studies.
It is reported that urea will be hydrolysed rapidly by the enzyme urease to form ammonium ions, according to
the following reaction equation (Orhon & Artan, 1994):
(NH2)2CO + 2H2O ⇔ 2NH4+ + CO3
2- (1)
The production of carbonate ions increases the alkalinity of the liquid and thereby causes an increase in
the pH. The high concentration of BOD5, COD, and TSS can be attributed to the presence of non-faecal
materials, such as anal cleansing (i.e., toilet paper) in the blackwater. The pollution potential of toilet paper as
reported by Almeida, Butler, and Friedler (1999) indicated as much as 706 and 546 mg per sheet for COD and
TSS concentrations respectively. Their removal from the blackwater by the BTT is mainly due to solid-liquid
separation by physical straining. However, the proliferation of COD, BOD, and TSS concentrations in the BTT
effluent seems to suggest the presence of slowly biodegradable organic matter contents or dissolved organic
matter contents in the effluent and would need to be trapped for continuous breakdown. The COD/BOD ratio of
4.1 suggests that part of the organic matter content is difficult to degrade biologically (Asia & Akporhonor,
2007). Different researches agreed that COD/BOD ratios in the range of 1.5-2.0 have easy removal of organics.
The BTT effluent had a COD/BOD ratio of 2.6 after the rapid solid-liquid separation suggesting the removal of
such resistant organic contaminant as part of the TSS within the BTT digester. Moreover, particulates of
organic matter contents may be carried out through the filtration system of the BTT with continuous flushing.
Additionally, the high removal of Total coliform and E. coli from the influent blackwater seems to conform to
the high removal of TSS. TSS generally provides adsorption sites for chemical and biological agents and is
removed from the liquid portion of the blackwater. Other studies seem to suggest the presence of food substrate
as a determining factor for the fluctuating levels of coliforms (Monroy, Aira, & Domínguez, 2009). This is
indicative with this study where there is very high removal of coliforms and E. coli in blackwater but the
emerging effluent still has some high concentrations of coliforms and E. coli.
That for nutrients (i.e., NH3-N, NO3-N, and PO4-P) was relatively low due to limited contact time for
chemical transformation and precipitation. The increase in NH4-N in the BTT effluent leading to the production
of NH3-N and NO3-N can be attributed to the disposal of urine with faeces (Koné & Strauss, 2004). The urine
fraction contributes 93% of the total nitrogen concentration. In this fraction, 84% consists of urea-nitrogen,
which is readily converted to ammonia. Urea is hydrolysed rapidly by the enzyme urease to form ammonium
ions (Orhon & Artan, 1994). The ammonium ions (NH4+) produced during the hydrolysis of urea is also kept in
equilibrium with ammonia (NH3) according to the following reaction equation (Benefield, Judkins, & Weand,
1982):
NH3 + H2O ⇔ NH4+ + OH
- (2)
When the pH increases, the equilibrium of the reaction will shift to the left and ammonium ions will form
ammonia gas. Ammonia gas is very insoluble in water and will escape to the atmosphere (Metcalf & Eddy Inc.,
2003). In this study, the results indicate a reduction in the concentration of NH3-N from the BTT which seems
to agree with the phenomenon described. Additionally, NH4-N in the presence of oxygen undergoes
nitrification to form NO3-N (Metcalf & Eddy Inc., 2003):
NH4+ + 2O2 ⇔ NO3
- + 2H
+ + H2O (Nitrifying bacteria) (3)
TREATMENT OF BIOFIL TOILET TECHNOLOGY EFFLUENT
295
The concentration of NO3-N in this paper can be explained under two phenomena to explain the lower and
upper limits of the NO3-N concentration ranges. Contrary to expectation of system working under aerobic
process to produce NO3-N concentration, the results indicated very low concentration of NO3-N (< 0.001 mg/L)
and in most cases below the permissible limits of 50 mg/L for discharge into water bodies in the BTT effluent.
This occurrence may possibly be due to denitrification process as a result of development of unexpected anoxic
conditions within the BTT. The BTT is normally aerated by a connecting vent. Depending on the surrounding
environment, the levels of aeration in the BTT (i.e., biofil digester) can be influenced. Additionally, low
filtration in the BTT as a result of organic matter contents build-up could lead to slight ponding:
6NO3- + 5CH3OH ⇔ 5CO2 + 7H2O + 6OH
- + 3N2 (Denitrifying bacteria) (4)
Physico-Chemical Parameters in Soil Columns
Total dissolved solids. A variety of complex chemical reactions within the soil columns, such as
adsorption, may have played a key role in the removal of dissolved contaminants during infiltration in the soils
(Schmoll, Howard, Chilton, & Chorus, 2006). The results indicated a statistically significant reduction of
conductivity and dissolved solid concentration along the depth of soil columns ( = 0.0009 < 0.05). As
infiltration depth increased, the adsorptive surface area increased and hence there was more contaminant
removal. This was evident in the MLSF (as a separate modified sand filter with filtering depth of 0.45 m) and at
a depth of 0.3 m in the RLS, SS, and LS columns with no significant difference in terms of TDS concentration
reduction. Short circuiting may partly be the cause of TDS levels showing higher values at increasing depth.
The performance in reducing TDS concentration compared to TDS effluent concentrations at a depth of 0.3 m
within the RLS, SS, and LS was also similar ( = 0.56 > 0.05). However, at depths beyond 0.3 m, RLS, SS, and
LS performed better at reducing TDS concentrations in the effluent notably in the RLS and SS at a depth of 1.5
m. This decrease in conductivity level with increasing depth might be related to the conversion of NO3 into
diatomic molecular nitrogen (N2), which also decreases conductivity levels in domestic wastewater (Shama,
Rabia, Iffat, Naeem, & Safia, 2013).
Organic matter and suspended solids. Under the tested conditions, the sandy soil and the RLS columns
produced effluents with water quality parameters having values below the guideline values recommended for
effluent discharge into the environment (GH EPA, 2003). The ability of the RLS to effectively remove TSS,
BOD, and COD at all depths as compared to the sandy and the other soil columns can be attributed to reduced
filtration rates thus increasing the residence time for effective filtration and microbial reaction. Infiltration rate
has a direct impact on retention time and hence contaminant removal processes with the time defendant
behaviour more pronounced up to 1.5 m depth in the vadose zone (Drewes & Fox, 1999). The rare increase in
COD concentration in the LS during the five weeks run between 0.3 m and 0.8 m can be attributed to possible
short circuiting. Additionally, suspended solids are removed by filtration through the upper soil layer and the
largest part is of organic nature in form of volatile suspended solids (Idelovitch, Icekson-Tal, Avraham, &
Michail, 2003).
Loamy soil showed greater variability along the experimental durations particularly at 0.8 m and 1.5 m
depths. This variation at these specific depths could be due to the incremental infiltration and leaching of
contaminants at lower depths specifically for the first two weeks experimental run. Sandy soil and red laterite
soil show minimal variability, with the red laterite soil performing approximately uniformly. Generally, the soil
columns attained their optimum performance by way of TSS, BOD, and COD removal at depth up to 0.8 m.

TREATMENT OF BIOFIL TOILET TECHNOLOGY EFFLUENT
296
In all the soil columns, relatively limited contaminant removal performance was observed for the first two
weeks possibly due to microorganisms adapting to the new environment. Literature has it that a period of 50 to
90 days is required at 10-30 oC for soil microorganisms to acclimatize, adapt, and degrade organic matter
(Essandoh, Tizaoui, Mohamed, Amy, & Brdjanovic, 2011).
A multivariate statistical analysis of the results revealed that there is a significant performance difference
across the various soil columns in terms of TSS and BOD removal; loamy soil vs. sandy soil ( = 0.021),
loamy soil vs. red laterite soil ( = 0.001), RLS vs. MLSF ( = 0.044). From the analysis, it follows that RLS
performed extremely better than the loamy soil and the MLSF column with respect to BOD and TSS removal
( = 0.001 and 0.044 for BOD and = 0.000 and 0.032 for TSS respectively). Loamy soil and MLSF
performed the same ( = 0.843 > 0.05) meaning that both performed poorly. As stated by Ireland
Environmental Protection Agency (2009), filtration, micro-straining, and aerobic biological decomposition
processes in the biomat and infiltration zone remove more than 90% of BOD and suspended solids and 99% of
the bacteria. Statistics also confirmed that the first two weeks of experimental run demonstrated lower rates of
contaminant removals as compared with the fifth and eighth week run; meanwhile, there was no significant
difference in the results observed between the fifth and eighth week of experimental run. These confirmatory
tests agreed with justifications presented above by various researchers for the development of biomat
(Essandoh et al., 2011). Generally red laterite soil exhibited an exceptionally remarkable contaminant removal
performance for TSS, BOD, and COD.
Pathogen characteristics in soil columns. Coliform removal in filters has generally been associated
with the removal of suspended particles and adsorption processes within the filter bed. Adsorption of cells to
the porous media is influenced by the content of organic matter, degree of biofilm development, and
electrostatic attraction, due to ion strength of the solution or electrostatic charges of cell- and particle-surfaces
(Stevik et al., 2004). Multivariate statistical analysis on the faecal coliform removal capacity of the different
soil types revealed that there was no statistically significant difference (using a 95% confidence level;
= 0.093 > 0.05) in the extent of performances of the soils. The total coliform reduction, however, showed
some significant differences ( = 0.001 < 0.05 for RLS vs. MLSF: = 0.003 < 0.05 for sandy soil vs. MLSF
and = 0.046 < 0.05 for RLS vs. loamy soil). Studies have suggested faecal coliforms to be relatively naturally
resistant and living longer compared to other coliform groups (Bitton, 2005). MLSF performed poorly
compared to RLS column ( = 0.001 < 0.05). The RLS and SS performed similarly in terms of pathogen
removal. Comparison of the performance of the SS with LS however did not show significant difference
( = 0.364 > 0.05).
Generally, the columns showed remarkable pathogen removal potential, however, the effluent of all the
columns did not satisfy the effluent guideline requirement of ≤ 10 MPN/100ml and ≤ 400 MPN/100ml for
faecal and total coliform respectively for discharges into the environment (GH EPA, 2003). The study seems to
suggest that the microbes multiplied quickly with the right conditions for growth. One way ANOVA test for the
various soil depths did not appear to have statistically significant impact on pathogen reduction despite high
removal. The reason can be attributed to the continuous application of wastewater onto the soil columns. The
absence of alternate drying and wetting regimes that would have made the environment hostile for pathogens
survival might have led to their proliferation and continuous presence (Crites, Middlebrooks, & Reed, 2006).
To employ subsoil infiltration to polish the effluent from the BTT, the depth of the soil column is a critical
factor to consider in the light of the water table prevalent in a location. For locations with high water table, the

TREATMENT OF BIOFIL TOILET TECHNOLOGY EFFLUENT
297
need for a filter system that can effectively remove pathogens within a shallow depth (of about 0.3-0.5 m)
cannot be over emphasized.
Nutrients. The composition of the biodegradable nitrogen and organic compounds in effluent normally
change, as it moves through soils due to natural biological processes that occur (Babel, Sae-Tang, & Pecharaply,
2009). Some researches indicated elevated concentrations of nitrogen species specifically nitrate in
groundwater surrounding pit latrines (Tredoux, Talma, & Engelbrecht, 2000). However, significant nitrification
and simultaneous denitrification can occur during soil infiltration, facilitating removal of nitrogen from the
system (Güngör & Ü nlü, 2005) depending on the redox potential (Fox, Houston, Westerhoof, & Drewes,
2001a). To promote denitrification, a considerable amount of carbon source, nitrate-N and anoxic condition
(sufficient BOD level) should prevail.
The generally low concentrations of NO3-N in the soil column seem to suggest the existence of anoxic
conditions within the first 1.5 m vadose zone of the different soils. Anoxic conditions promote carbon
degradation and denitrification with nitrate as the electron acceptor. As wastewater percolates through the
vadose zone, dissolved oxygen can become rapidly exhausted and the redox potential decreases. With
decreasing redox potential, nitrate is converted to nitrogen gas (Fox et al., 2001a). In the loamy soil column for
instance, the highest concentration of NO3-N (2.04 mg/L) was recorded at 0.3 m depth, dropping down to 0.47
mg/L at 0.8 m depth of the same column. In all of the other soil columns in this experiment, the NO3-N
concentrations were below EPA guideline values. Though denitrification occurs under anoxic conditions, it has
been reported to also occur in limited anaerobic pockets in the aerobic zone making it localized and partial
(Idelovitch et al., 2003). The proliferation of NO3-N at a depth of 1.5 m can be attributed to a possible
re-aeration of the gravel supporting base of the soil columns experimental setup through the outflow nozzle.
Under aerobic conditions, nitrification will take place in an unsaturated zone and part of the nitrogen adsorbed
on soil particles undergoes nitrification (Fox, Narayanaswamy, Genz, & Drewes, 2001b). A rare scenario was
noticed in the SS where the T-N seemed to increase. This may have been caused by limited dissolved oxygen to
accelerate the conversion of T-N to NO3-N at a depth of 1.5 m. This phenomenon is also confirmed with the
sudden drop in pH of 5.0 in the two weeks run in the SS. Bacteria involved in the second stage nitrification may
have been inhibited by the drop in pH causing elevation of the T-N concentration, due to possible accumulation
by continuous inflow of the influent T-N (Anthonisen, Loehr, Prakasam, & Srinath, 1976).
The relatively low phosphorus removal trend observed for the sandy soil and the MLSF could be attributed
to the exhaustion of the adsorption capacity of the layer for phosphorus. All the samples from the various
depths of the red laterite soil and deeper depths of the sandy soil removed significant amounts of the
phosphorus; this trend of removal could be due to the adsorption onto iron and aluminum containing minerals
and/or precipitation with these minerals (Reemtsma, Gnirß, & Jekel, 2000). Laterite soils generally have a high
content of iron oxides and oxyhydroxides that have zeta potentials that enhance adsorption at pH beyond six. In
addition, the iron ions are capable of bonding with the phosphate groups (Gidigasu, 1976) and eventually
render them soluble. This probably explains the occurrence of phosphates in the effluents. Removal efficiency
of total nitrogen and ammonia has been reported to reduce with time of operation due to the formation of
anaerobic conditions in the soil zones preventing ammonia to nitrate conversion process since growth of
nitrifyers requires oxygen. In comparison, the removal efficiency of phosphorous is generally more stable
(Idelovitch et al., 2003).

TREATMENT OF BIOFIL TOILET TECHNOLOGY EFFLUENT
298
Conclusions
Under the test conditions, the sandy, RLS, and loamy soil columns showed up to 90% contaminant
removal within the 1.5 m vadose depth. Up to 80 % contaminant removal was achieved for all the different soil
columns within the top 0.3 m depth of the soil columns.
The RLS was the most effective in the removal of both organics and nutrients in the biofil effluent (TDS,
COD, BOD, TSS, T-N, NO3-N, NO2-N, PO4-P, TC, and FC), followed by the sandy soil. Subsurface
infiltration demonstrates a good option for pre-treated BTT effluent suggesting the incorporation of biological
filters or infiltration systems for areas with high water table or clayey soils.
The study suggests better contaminant removal, such as pathogens with alternating wetting and drying
regime during subsurface infiltration. This is in line with existing studies where microbial adsorption to the soil
solid material during the wetting time and decay during the drying time typically occurs.
Detailed analyses of pathogen removal should be conducted under low to high hydraulic loading rates to
determine the optimum hydraulic loading rate for pathogen removal in the technology development.
References
Almeida, M. C., Butler, D., & Friedler, E. (1999). At-source domestic wastewater quality. Urban Water, 1, 49-55.
Anthonisen, A. C., Loehr, R. C., Prakasam, T. B. S., & Srinath, E. G. (1976). Inhibition of nitrification of ammonia and nitrous
acid. Journal of the Water Pollution Control Federation, 48(5), 835-852.
Asia, I. O., & Akporhonor, E. E. (2007). Characterization and physicochemical treatment of wastewater from rubber processing
factory. International Journal of Physical Sciences, 2(3), 61-67.
Babel, S., Sae-Tang, J., & Pecharaply, A. (2009). Anaerobic co-digestion of sewage and brewery sludge for biogas production and
land application. International Journal of Environmental Science and Technology, 6(1), 131-140.
Baig, S., Mahmood, A. Q., Nawab, B., Shafqat, M. N., & Pervez, A. (2011). Improvement of drinking water quality by
using plant biomass through household biosand filter—A decentralized approach. Ecological Engineering, 37,
1842-1848.
Benefield, L. D., Judkins, J. F., & Weand, B. L. (1982). Processes chemistry for water and wastewater treatment. Englewood
Cliffs: Prentice-Hall, Inc.
Biofilcom & IWMI. (2015). Performance evaluation of Biofilcom treatment and filtration technologies in urban areas of Accra,
Ghana (Evaluation analyses report).
Bitton, G. (2005). Wastewater microbiology (3rd ed.). Hoboken: John Wiley & Sons, Inc.
Clesceri, L. S., Greenberg, A. E., & Eaton, A. D. (1998). Standard methods for the examination of water and wastewater (20th
ed.). Washington, DC: American Public Health Association.
Crites, R. W., Middlebrooks, J., & Reed, S. C. (2006). Natural wastewater treatment systems. Boca Raton, FL: Francis &
Taylor/CRC Press.
Drewes, J. E., & Fox, P. (1999). Fate of natural organic matter (NOM) during ground water recharge using reclaimed water.
Water Science and Technology, 40(9), 241-248.
Essandoh, H. M. K., Tizaoui, C., Mohamed, M. H. A., Amy, G., & Brdjanovic, D. (2011). Soil aquifer treatment of artificial
wastewater under saturated conditions. Water Research, 45, 4211-4226.
Fox, P., Houston, S., Westerhoof, P., & Drewes, J. E. (2001a). An investigation of soil aquifer treatment for sustainable water
reuse. Denver: AWWA Research Foundation and American Water Works Association.
Fox, P., Narayanaswamy, K., Genz, A., & Drewes, J. E. (2001b). Water quality transformation during soil aquifer treatment at the
mesa northwest water reclamation. Water Science and Technology, 43(10), 343-350.
Ghana Environmental Protection Agency [GH EPA]. (2003). Sector specific effluent guidelines for discharge into natural water
bodies. In E. O. Agyemang, E. Awuah, L. Darkwah, R. Arthur, and G. Osei (2013). Water quality assessment of a
wastewater treatment plant in a Ghanaian Beverage Industry. International Journal of Water Resources and Environmental
Engineering, 5(5), 272-279.
Gidigasu, M. (1976). Laterite soil engineering: Pedogenesis and engineering principles. Geotechnical Engineering, 9, 219.

TREATMENT OF BIOFIL TOILET TECHNOLOGY EFFLUENT
299
Güngör, K., & Ü nlü, K. (2005). Nitrite and nitrate removal efficiencies of soil aquifer treatment columns. Turkish Journal of
Engineering and Environmental Sciences, 29, 159-170.
Idelovitch, E., Icekson-Tal, N., Avraham, O., & Michail, M. (2003). The long term performance of soil aquifer treatment for
effluent reuse water science and technology. Water Supply, 3(4), 239-246.
Ireland Environmental Protection Agency. (2009). Code of practice: Wastewater treatment and disposal systems serving single
houses. Retrieved from
http://www.epa.ie/pubs/advice/water/wastewater/code%20of%20practice%20for%20single%20houses/#.VfrQvN_tmko
Koné, D., & Strauss, M. (2004). Low-cost options for treating faecal sludge (FS) in developing countries—Challenges and
performance. Proceedings from 9th Int. Conf. on Wetland Systems, Avignon, France.
Metcalf & Eddy Inc. (2003). Wastewater engineering, treatment, disposal and reuse (4th ed.). New York: McGraw-Hill.
Molla, A. S., & Kaba, T. (2011). Performance evaluation and situation analysis of stabilization ponds: The case for Hawassa
University Referral Hospital WSP, Hawassa Ethiopia. Saarbrücken: LAP Lambert Academic Publishing.
Monroy, F., Aira, M., & Domínguez, J. (2009). Reduction of total coliform numbers during vermicomposting is caused by
short-term direct effects of earthworms on microorganisms and depends on the dose of application of pig slurry. Science of
the Total Environment, 407, 5411-5416.
Nema, P., Ojha, C. S. P., Kumar, A., & Khanna, P. (2001). Techno-economic evaluation of soil-aquifer treatment using primary
effluent at Ahmedabad, India. Water Research, 35(9), 2179-2190.
Orhon, D., & Artan, N. (1994). Modeling of activated sludge systems. Lancaster: Technomic Publishing Co., Inc.
Reemtsma, T., Gnirß, R., & Jekel, M. (2000). Infiltration of combined sewer overflow and tertiary municipal wastewater: An
integrated laboratory and field study on nutrients and dissolved organics. Water Research, 34(4), 1179-1186.
Schmoll, O., Howard, G., Chilton, J., & Chorus, I. (2006). Protecting groundwater for health: Managing the quality of drinking
water sources. WHO Drinking-Water Quality Series. London: IWA Publishing.
Shama, S., Rabia, A., Iffat, N., Naeem, A., & Safia, A. (2013). Reduction of contaminants (physical, chemical, and microbial) in
domestic wastewater through hybrid constructed wetland. Retrieved from http://dx.doi.org/10.1155/2013/350260
Stevik, K. T., Aab, K., Auslanda, G., & Hanssen, J. F. (2004). Retention and removal of pathogenic bacteria in wastewater
percolating through porous media: A review. Water Research, 38, 1355-1367.
Suthar, S., & Tomar, P. (2011). Urban wastewater treatment using vermi-biofiltration system. Desalination, 282, 95-103.
Thrift, C. (2007). Sanitation policy in Ghana: Key factors and the potential for ecological sanitation solutions. Retrieved from
http://www.ecosanres.org/pdf_files/SanitationPolicyInGhana-CharlesThrift.pdf
Tredoux, G., Talma, A. S., & Engelbrecht, J. F. P. (2000). The increasing nitrate hazard in groundwater in the rural areas.
Proceedings from WISA 2000 Biennial Conference, Sun City, South Africa.
United Nation Environmental Protection. (2002). International source book on environmentally sound technologies for
wastewater and stormwater management. Retrieved from http://www.iwaponline.com/wpt/002/0089/0020089.pdf
Van Ryneveld, M. B., & Fourie, A. B. (1997). A strategy for evaluating the environmental impact of on-site sanitation systems.
Water SA, 23(4), 279-291.