the possible use of combined electrical impedance and
TRANSCRIPT
Physiological Measurement
PAPER bull OPEN ACCESS
The possible use of combined electricalimpedance and ultrasound velocity measurementsfor the non-invasive measurement of temperatureduring mild hyperthermiaTo cite this article Naimul Islam et al 2013 Physiol Meas 34 1103
View the article online for updates and enhancements
You may also likeA comprehensive analysis of the responsetime of MR dampersJeong-Hoi Koo Fernando D Goncalvesand Mehdi Ahmadian
-
Source function determination of glasscapillary breaksY H Kim and H C Kim
-
Excitation signals influence on ultrasonictransit time flow meters performanceL Svilainis P Kabisius A Aleksandrovas etal
-
This content was downloaded from IP address 18310766203 on 18022022 at 0058
OPEN ACCESSIOP PUBLISHING PHYSIOLOGICAL MEASUREMENT
Physiol Meas 34 (2013) 1103ndash1122 doi1010880967-33343491103
The possible use of combined electrical impedance andultrasound velocity measurements for the non-invasivemeasurement of temperature during mildhyperthermia
Naimul Islam12 Rebecca Hale1 Matthew Taylor1 and Adrian Wilson13
1 Department of Physics University of Warwick Gibbet Hill Road Coventry CV4 7AL UK2 Department of Physics University of Dhaka Dhaka-1000 Bangladesh3 Department of Clinical Physics and Bioengineering University Hospital Coventry CV2 2DXUK
E-mail adrianwilsonwarwickacuk
Received 14 May 2013 accepted for publication 23 July 2013Published 23 August 2013Online at stacksioporgPM341103
AbstractThis paper explores the possibility of using combined measurementsof electrical impedance and changes in ultrasound time of flight fordetermining deep body temperature during mild hyperthermia Simultaneouselectrical impedance spectra (1 kHzndash1024 kHz) and ultrasound time-of-flightmeasurements were made on layered sheep liver and fat tissue samples asthe temperature was increased from 30ndash50 C The change in propagationvelocity for 100 fat and 100 liver samples was found to vary linearlywith temperature and the temperature coefficient of the time-of-flight wasshown to vary linearly with the fat in the sample (0009 Cminus1minus1)Tetrapolar impedance measurements normalized to 8 kHz were shown to havea small sensitivity to temperature for both liver (0001 Cminus1 45 C) andfat (0002 Cminus1 512 kHz) and the best linear correlation between thenormalized impedance and the fat in the sample was found at 256 kHz(gradient 0026minus1 r2 = 065) A bootstrap analysis on 15 layered tissuesamples evaluated using the normalized impedance at 256 kHz to determinethe fat in the sample and the temperature coefficient of the time of flightto determine the temperature The results showed differences (including somelarge differences) between the predicted and measured temperatures and anerror evaluation identified the possible origins of these
Keywords electrical impedance ultrasound temperature
Content from this work may be used under the terms of the Creative Commons Attribution 30licence Any further distribution of this work must maintain attribution to the author(s) and the title
of the work journal citation and DOI
0967-333413091103+20$3300 copy 2013 Institute of Physics and Engineering in Medicine Printed in the UK amp the USA 1103
1104 N Islam et al
1 Introduction
Mild hyperthermia in which a tumour but not the surrounding tissue is selectively heated tobetween 41 and 43 C has been shown to give improvements in tumour control and five yearsurvival rate when used in conjunction with radiotherapy or chemotherapy (Triantopoulou et al2013 Sauer et al 2012 ter Haar 1999) Currently the technique is only applicable to surfacetumours and tumours that can be accessed through body cavities due to problems of producingcontrolled localized heating deep within the body (Lagendijk 2000 van Rhoon and Wust 2005)We have recently reported the design principles for a phased array ultrasound transducercapable of creating localized heating of solid tumours deep within the body (Aitkenheadet al 2008 2009) but the problems of non-invasive temperature measurement to achievecontrol remain unresolved A variety of temperature dependent physical properties have beeninvestigated to address this problem including ultrasound propagation velocity (Miller et al2002 2004 Seip and Ebbini 1995) ultrasound back scattered energy (Staube and Arthur 1994Arthur et al 2003) electrical impedance imaging (Conway et al 1985 Paulson and Jiang 1997Ferraioli et al 2009) and relaxation times in magnetic resonance imaging (MRI) (Rieke andPauly 2008) Mild hyperthermia treatments can last up to an hour and therefore temperaturemeasurement methods based on electrical impedance or ultrasound are more appropriate thantechniques based on MRI Work on ultrasound backscattered energy was based on syntheticscatterers introduced into the tissue (Arthur et al 2003) and thus is not truly non-invasiveand in addition the thermal properties of the tissue containing the scatterers is unknownTherefore a technique based on ultrasound propagation velocity or electrical impedance inparticular a technique based on ultrasound propagation velocity using the same ultrasoundtransducer to create mild hyperthermia and to measure temperature would be particularlyattractive
The published data on ultrasound propagation velocity show aqueous cellular tissues (egliver) to peak at about 50 C having a positive propagation velocity temperature coefficientbelow this temperature and a negative propagation velocity temperature coefficient above itwhilst fat has a negative propagation velocity temperature coefficient for all temperatures(Bamber 1998) Using the analyses from Chambre (1959) and Apfel (1983) it can be shownthat the total propagation velocity cT for a mixture of N chemically non-reacting materials isgiven by
1
cT=
Nsum
i=1
fi
ci(1)
where fi and ci are the fractional volume and propagation velocity of the ith component ofthe mixture respectively The propagation velocity of pure water as a function of temperaturewas measured at atmospheric pressure by Del Grosso and Mader (1972) and found to riseup to 75 C and then fall thereafter Using these data a fifth order polynomial was used todescribe the propagation velocity versus temperature profile (Del Grosso and Mader 1972)This change in the propagation velocity with temperature is a result of the compressibility ofthe water molecule (Kell 1975) In addition to ionic intra- and extra-cellular fluids which havethe propagation velocity characteristics of water aqueous cellular tissues contain condensedmatter (mostly lipids elastin and collagen) which have a negative change in propagationvelocity with temperature The combined propagation velocity of these components givesliver (and other aqueous tissues) a peak in the measured propagation velocity at around50 C (Bamber 1998) a finding that can be predicted using equation (1) (Miller et al2002) One application of the previous work on ultrasound propagation velocity was aimedat identifying the target volume for high intensity focused ultrasound (HIFU) treatments
Ultrasound and electrical impedance temperature measurement 1105
(Miller et al 2002 2004) In order to do this it was proposed to operate the HIFU transducerat pre-ablative intensities so that the temperature rise was less than 50 C otherwise thechanges in propagation velocity would be non-unique Since the objective of this work wasvisualization of the volume to be heated rather than temperature measurement the effect of anynonlinearity in the propagation velocity versus temperature characteristic up to 50 C couldbe ignored
The physical principle behind using electrical impedance measurements for determiningtemperatures is that the conductivity of physiological saline changes by about 2 Cminus1 andwas one of the early applications proposed for electrical impedance tomography (Conwayet al 1985) Work on the electrical impedance of living tissue showed that the observedimpedance changes were not simply due to changes in conductivity of the intra- and extra-cellular fluids but also due to intra- and extra-cellular fluid volume changes and membraneconductance changes (Esrick and McRae 1994) Gersing (1999) suggested that extra-cellularvolume changes resulting from vasodilatation was the primary effect and that this occurredconcurrently with heating in normal tissue but was delayed in cancerous tissue Paulsonand Jiang (1997) proposed improvements in an electrical impedance image reconstructiontechnique which in a simulation study reduced the errors in temperature prediction from theorder of 10 C reported by many workers (eg Moskowitz et al 1994) to 2 C However thisaccuracy is unlikely to be achieved in clinical practice using electrical impedance measurementfrom patients and is above the 1 C accuracy normally cited for the clinical application of mildhyperthermia All the work on electrical impedance measurements to measure temperatureduring hyperthermia has used a tetrapolar impedance measurement technique Whilst tetrapolarmeasurements eliminate the effect of the electrode impedances which can be very much largerthan those of the tissue the spatial sensitivity is complex and contains maxima beneath theedges of the electrodes and regions of negative sensitivity between the drive and receiveelectrodes (Brown et al 2000a Islam et al 2010) This complex spatial sensitivity distributiongives an uncertainty in the position of any impedance changes related to temperature andis likely to be the source of the poor correlations reported between changes in electricalimpedance and temperature
Both ultrasound propagation velocity and electrical impedance are potential techniques tomeasure the temperature during mild hyperthermia for deep body solid tumours The previouswork in this area has demonstrated that neither method has the capability to non-invasivelymeasure temperature to the accuracy required for clinical mild hyperthermia In both caseswith the exception of the electrical impedance study by Gersing (1999) the work has beencarried out using imaging devices and the effect of the image processing algorithms on theresults reported is unknown although this is likely to be greater for electrical impedance thanultrasound because of the need for image reconstruction and the complex spatial sensitivityin the former Therefore in this paper we report a first experimental investigation into thepotential of simultaneous measurements of ultrasound propagation velocity and electricalimpedance as an approach to non-invasively measuring temperature in deep body mildhyperthermia
2 Materials and methods
In this work we used a Perspex test cell that allowed simultaneous tissue impedance andultrasound propagation velocity measurements on tissue samples (figure 1) The temperatureof the tissue sample in the test cell was controlled in the range 30ndash50 C by placing the cell ina thermostatically controlled water bath
1106 N Islam et al
Figure 1 An annotated photograph of the Perspex test cell showing the positions of the electrodesand PZT element The lsquoinner depthrsquo of the cell is the distance between the front face of the PZTelement and the inner surface of the base of the cell
21 Test cell
The part of the test cell holding the sample is cylindrical with a diameter of 40 mm and adepth of 36 mm A wall thickness of 2 mm was used as a compromise between robustnessand thermal resistance The top of the test cell contained four 25 mm diameter stainlesssteelbrass electrodes for electrical impedance measurements and a 7 mm diameter circular1 MHz lead zirconate titanate (PZT) element (PZT-8 Sparkler Ceramics Ltd India) forultrasound propagation velocity measurement The four electrodes for electrical impedancemeasurement were equi-spaced at a radius of 17 mm from the centre forming the cornersof a square giving an electrode spacing of 24 mm We have previously shown that for fourelectrodes arranged in a square there is a peak in the average sensitivity of a plane at a depthof 13 of the electrode separation (Brown et al 2001a Islam et al 2010)mdasha depth of 8 mmin the test cell If it is assumed that the circular PZT element behaves as a piston then theaxial intensity profile in the direction of propagation has the form of a Bessel function ofthe first type with the last axial maxima at a2λ where a is the radius of the transducer andλ is the wavelength in the media The value of λ for 1 MHz ultrasound in soft tissue isapproximately 15 mm A PZT transducer of 7 mm in diameter was selected to position thelast axial maxima at a depth of 8 mm Thus the maxima in the sensitivity of the electricalimpedance and ultrasound intensity are collocated in the sample chamber Tissue samples inthe sample chamber were heated by placing the test cell in a water bath created from a 1000 mlbeaker placed on top of a thermostatically controlled hotplate (Fisher Scientific 11ndash302ndash508HP) Throughout the measurements the tissue temperature was measured with a thermocouple
Ultrasound and electrical impedance temperature measurement 1107
positioned in the tissue sample at approximately half the depth of the test cell and at a radiusof 15 mm from its centre line This thermocouple was connected to a calibrated electronicthermometer (Digitron 2038T) Electrical impedance and ultrasound propagation velocitymeasurements were under computer control where the computer could trigger simultaneousmeasurements
22 Ultrasound measurement instrumentation
One of the design principles for our proposed ultrasound transducer to create deep body mildhyperthermia (Aitkenhead et al 2008) was that the PZT elements were air backed allowingthem to ring undamped following the application of a drive pulse to avoid loss of energy dueto absorption in the backing layer (Persson and Hertz 1985) Our aim was to use the samearrangement for mounting the PZT element for this study as was used in that transducerHowever for ultrasound propagation velocity measurements where the same element is to beused for transmission and echo detection this results in unwanted ringing of the transducerat 1 MHz To minimize the effect of this the transducer was driven with a 1 μs pulse wherethe first minima in the frequency spectra was at 1 MHz generating a single isolated 1 μspulse from the PZT element Following excitation the voltage from the PZT element wasamplified and digitized at 100 MHz using the first channel of a two channel high speed USBdigitizer (National Instruments USB-5133) All data processing was performed in Matlabwith a specially written C code routine used to transfer data from the data acquisition deviceto Matlab for processing Data acquisition was triggered from the start of the transmittedpulse and twenty consecutive 100 μs data sets were averaged to improve the signal-to-noiseratio Experimentally it was found that the transducer also generated sub-harmonic ringing atabout 200 kHz on both transmission and detection Therefore following data acquisition andaveraging an equi-ripple FIR band pass filter (length 284 passband 750 kHzndash125 MHz) wasused which provided greater than 40 dB attenuation of the 200 kHz component The time offlight (ToF) between the transducer and the base of the test cell was determined by visuallyinspecting the 1 MHz reflected signal (figure 2)
23 Electrical impedance measurement instrumentation
Tetrapolar electrical impedance measurements were made using the same technique as thatused in the Sheffield Mk35 electrical impedance temperature system (Wilson et al 2001)Current injection was achieved using a differential Howland current source circuit Electricalimpedance was measured simultaneously at 11 octave separated frequencies in the range1ndash1024 kHz The drive signal consisted of repeated 1 ms epochs of 11 summed sine wavessuch that repeated epochs provided a continuous sine wave at each frequency Each frequencyhad a peak-to-peak amplitude of 200 μA giving a maximum drive current of 12 mA peak-to-peak The voltage from the receive electrodes was amplified by a differential amplifier and thendigitized using the second channel of the National Instruments high speed digitizer samplingat 10 MHz As before (section 22) transfer of data from the digitizer to Matlab for processingwas controlled by a C-code routine and all data processing was performed in Matlab Twentyepochs of measured data were summed to improve the signal-to-noise ratio A fast Fouriertransform was performed on the averaged voltage data to determine the amplitude and phasespectrum for each of the drive frequencies and the former then scaled to determine the realpart of the transfer impedance in ohms
1108 N Islam et al
20 25 30 35 40 45 50 55 600
1
2
3
4
5
6
filte
red
refle
cted
ultr
asou
ndsi
gnal
V
time sμ
30oC
35oC
40oC
50oC
45oC
Figure 2 The reflected ultrasound signal in liver at 5 C intervals between 30 C and 50 Cshowing the reflected pulse from the base of the chamber at approximately 42 μs The signal foreach temperature has been offset by 1 V
24 Measurements
In this paper we report three sets of measurements measurements on liver samplesmeasurements on fat samples and measurements on layered liver and fat samples In allthree cases the tissue was obtained as fresh (never frozen) samples from sheep through retailbutchers For the single tissue measurements 40 mm diameter samples were cut from thetissue and placed in the sample chamber in the form of layers The typical layer thicknesswas 6 mm For the layered tissue samples the numbers of layers of fat and liver were alteredto simulate liver tissue containing different proportions of fat Samples of liver were takenfrom tissue where there was no visible fat content The density of the liver and fat used inthese experiments was established by measuring the volume (using water displacement) andmass for samples taken from the bulk tissue from which the measurement samples were takenThe percentage of fat (expressed as a percentage by volume) in the final sample was thendetermined by weighing the fat and liver components of the sample after the measurementFor the single tissue measurements the propagation velocity was calculated from the ToFmeasured as the time to the first peak in the reflected signal from the base of the test celland the distance between the PZT element and the base of the test cell As noted by Bamber(1998) the ToF method for determining the propagation velocity is dependent on being able toreproducibly detect the time of arrival of the reflected signal With the layered tissue samplesthere were multiple tissue interfaces increasing the number of reflections resulting in a morecomplex reflected signal and reducing its amplitude These made the first peak more difficultto detect and therefore the percentage change in ToF from a measurement at 30 C wasanalysed based on the first large peak after 40 μs for the layered tissue experiments The
Ultrasound and electrical impedance temperature measurement 1109
electrical impedance spectra for the 100 fat and 100 liver samples were interpreted interms of the spectrum expected based on a ColendashCole model (Cole and Cole 1941) of howtissue structure affects impedance It should be noted that the nature of the layered liver andfat sample meant that the percentage of fat in the different samples could not be accuratelyreproduced and therefore the reproducibility is based on the number of fat and liver layersin each sample and the relationship between the sample composition and the magnitude ofthe electrical impedance investigated using a line of best fit determined by the least squaresmethod and the Pearson r correlation coefficient Throughout the work the confidence intervalfor the slopes of the lines of best fit were calculated using the method of Liengme (2002)based on the t-statistic
3 Results
31 Ultrasound propagation velocity results
The propagation velocities for six samples of liver and six samples of fat measured at 5 Cintervals between 30 and 50 C are given in figures 3(a) and (b) respectively From thesefigures it can be seen that there is a large variation in the absolute value of propagation velocitybetween samples for both tissue types (range is approximately 50 msminus1 for both at 35 C) butthat the changes in velocity with temperature for individual samples follow a similar trajectoryThe focus of this work was non-invasively determining the temperature of a volume of tissuethat is to be heated Since the body temperature is closely controlled at 37 C determiningthe change in temperature from a pre-heated state is an acceptable approach To investigatethe feasibility of this approach the data were analysed by looking at the change in propagationvelocity with temperature starting from the propagation velocity at 30 C The results for thisanalysis on the data shown in figures 3(a) and (b) are given in figures 4(a) and (b) respectivelyIndividual samples of the same tissue type are identified by the same symbols in figures 3and 4
In looking at the data in figures 3(a) and 4(a) it should be noted that the propagationvelocities for the liver sample starting at approximately 1475 msminus1 (the sample with the starsymbol in figure 3(a)) are always less than the other samples but it is not the one with thelowest rate of change of propagation velocity with temperature as shown in figure 4(a) Withinthe temperature range 30ndash50 C the individual liver samples showed an approximately linearrise in the propagation velocity with temperature but a large difference in the slopes betweensamples Taken together these data gave a line of best fit with a slope of 093 msminus1 Cminus1 butwith a relatively low value of r2 of 062 For the fat there was a decrease in propagationvelocity with temperature of minus47 msminus1 Cminus1 (r2 = 091) In this work propagation velocityhas been measured at specific temperatures whereas in mild hyperthermia the propagationvelocity would be measured and the lines of best fit in figures 4(a) and (b) used to determinethe temperature in liver and fat respectively The technique based on the t-statistic used toestablish the 95 confidence interval for the slope of the line of best fit can be extended todetermine the measurement error from using the propagation velocity to measure temperature(Liengme 2002) As with any measurement the confidence interval is dependent on the numberof measurements made Assuming ten measurements the errors in predicting temperature fromthe lines of best fit in liver and fat are plusmn 43 C and plusmn 17 C respectively at 40 C
As noted in the methods section multiple reflections in the layered tissue samples reducedthe amplitude of the reflected signal making the start of the reflection from the base of the testcell more difficult to detect and therefore the ToF is reported for these experiments rather thanpropagation velocity The change in the propagation velocity for liver and fat with temperature
1110 N Islam et al
1450
1470
1490
1510
1530
1550
1570
30 35 40 45 50
velo
city
ms- 1
temperature degC
(a) 100 liver
1250
1300
1350
1400
1450
1500
30 35 40 45 50
velo
city
ms-1
temperature ˚C
(b) 100 fat
Figure 3 The propagation velocity of (a) 100 liver and (b) 100 fat with temperature Individualsamples of each tissue type are identified by symbols
(figure 4) when combined with equation (1) predict straight line relationships between thechange in ToF with temperature for mixtures of fat and liver where the gradient of the lineincreases as the fraction of fat in the sample increases The results from measurements on 15layered samples using the same measurement protocol as that used for the fat and liver confirmthis prediction and give lines of best fit with gradients between minus006 Cminus1 (r2 = 099) fora sample with 0 fat to 07 Cminus1 (r2 = 099) for a sample with 100 fat These data alsoallow investigation of how the temperature coefficient of the ToF (the percentage change in
Ultrasound and electrical impedance temperature measurement 1111
-5
0
5
10
15
20
25
30
30 35 40 45 50
chan
gein
velo
city
ms-1
temperature degC
(a) 100 liver
-120
-100
-80
-60
-40
-20
0
20
30 35 40 45 50
chan
gein
velo
city
ms-1
temperature
˚C
(b) 100 fat
Figure 4 The change in propagation velocity of (a) 100 liver and (b) 100 fat with temperatureIndividual samples of each tissue type are identified by symbols For each data set the line of bestfit is shown as a solid line and the 95 confidence interval for the slope of the line of best fit isshown as dashed lines
ToF per C) varies as a function of the percentage of fat in the sample (figure 5) Analysisshowed that there was a linear increase in the temperature coefficient of the ToF with thepercentage of fat in the sample (r2 = 089) with the equation of the line of best fit having theform
ToF30
T30= a f minus b (2)
1112 N Islam et al
-020
000
020
040
060
080
100
120
0 20 40 60 80 100
ToF
tem
pera
ture
coef
fici
ent
C
-1
Fat
Figure 5 The change in ToF per C with the percentage of fat in the sample Individualmeasurements are shown together with the line of best fit (solid line) and the 95 confidenceinterval of the slope of the line of best fit (dashed lines)
where ToF30 is the percentage change in the ToF from the ToF at 30 C T30 is the changein temperature from 30 C f is the percentage of fat in the sample and a and b are constantshaving values of 88 times 10minus3 and 73 times 10minus3 respectively
32 Electrical impedance results
Figure 6(a) shows the electrical impedance spectra of the 100 liver samples as the temperatureof the sample is raised from 30 to 50 C in 5 C steps From figure 6(a) it can be seen that thereis a single dispersion in the electrical impedance spectra of liver within the frequency rangemeasured with the roll-off starting at about 8 kHz The results presented in figure 6(b) showthe electrical impedance measurements of the 100 fat samples as the temperature of thesample is raised from 30 to 50 C in 5 C steps The results show that the electrical impedanceof the fat is largely independent of frequency up to and including a frequency of 512 kHz butthere is a decrease in impedance at 1 MHz the highest frequency measured
Analysis of the change in impedance with temperature using the mean values plotted infigure 6 showed a linear decrease in impedance with increasing temperature for both liver andfat at all frequencies but that the coefficient was different for different frequencies (figure 7)For fat there was little change in the temperature coefficient with frequency up to and including256 kHz with no statistically significant correlation found between the temperature coefficientand the logarithm of frequency (r2 = 0001 p = 092) However there was a positive linearcorrelation between the temperature coefficient and the logarithm of frequency for liver tissue(r2 = 092 p lt 001) with the slope of the line of best fit being 009 Cminus1 log(kHz)minus1
33 Combining ultrasound propagation velocity and electrical impedance measurements
The lack of a simple (linear) relationship between frequency and the temperature sensitivityof the electrical impedance for fat (figure 7) coupled with the large difference in the electricalimpedance spectra between liver and fat (figure 6) and the need to normalize these spectrato remove the effect of the electrode geometry suggested an approach of using the electrical
Ultrasound and electrical impedance temperature measurement 1113
0
10
20
30
40
50
60
70
80
1 10 100 1000
mag
nitu
deof
ZΩ
frequency kHz
(a) 100 Liver
30 C35 C40 C45 C50 C
0
50
100
150
200
250
300
350
400
1 10 100 1000
mag
nitu
deof
ZΩ
frequencykHz
(b) 100 fat
30degC35degC40degC45degC50degC
Figure 6 The effect of temperature on the electrical impedance spectra of (a) 100 liver and(b) 100 fat The error bars on both graphs are plusmn 1 SEM
-205
-2
-195
-19
-185
-18
-175
-171 10 100 1000
tem
pera
ture
coef
fici
ent
ordmC
--1
frequency kHz
Liver
Fat
095
Figure 7 The tempereature sensitivity of the electrical impedance measurements shown in figure 6The solid line is the line of best fit for the liver data The coefficient at 1024 kHz for fat was muchsmaller (minus095) than other values for both liver and fat and therefore has not been plotted to scale
1114 N Islam et al
04
05
06
07
08
09
1
1 10 100 1000
norm
aliz
edIm
peda
nce
frequencykHz
(a) 100 liver 30degC35degC40degC45degC50degC
0
02
04
06
08
1
1 10 100 1000
norm
aliz
edIm
peda
nce
frequencykHz
(b) 100 fat
30degC
35degC
40degC
45degC
50degC
Figure 8 The electrical impedance spectra for (a) 100 liver and (b) 100 fat normalized to8 kHz
impedance to determine the fraction of fat in the sample and the ultrasound propagationvelocity to determine the temperature using the relationship shown in figure 5
If the impedance spectra were to be used to determine the percentage fat then thenormalized impedance spectra should have minimum temperature sensitivity The error barsin figure 6(b) show the standard error in the impedance measurements for the 100 fatmeasurements This plot shows that up to and including 256 kHz the variability of thesemeasurements is small rising from 1 at 30 C to 3 at 50 C Above 256 kHz the variabilityis much larger having a maximum value of 13 for 1024 kHz at 30 C From figure 6(a) it canbe seen that the variability in the measured impedance decreases with increasing frequency atall temperatures for the 100 liver measurements Since the variability of the measurementsdecreases with increasing frequency the frequency used to normalize the measurements whichalso minimized the temperature variability was taken as the highest measured frequencybelow the frequency of dispersion for the liver tissue Therefore spectra from both 100 liverand 100 fat samples were normalized to the impedance at 8 kHz for each temperaturegiving the normalized spectra for liver and fat shown in figures 8(a) and (b) respectively The
Ultrasound and electrical impedance temperature measurement 1115
05
06
07
08
09
10
0 20 40 60 80 100
norm
aliz
edim
peda
nce
fat
Figure 9 The change in the normalized impedance at 256 kHz with the percentage of fat in thesample The solid line gives the line of best fit and the dashed lines the 95 confidence intervalfor its slope
normalization of the impedance spectra to the impedance at 8 kHz reduced the temperaturesensitivity of the measurements for liver to 020 plusmn 028 Cminus1 From figure 8(a) it is clearthat the normalized impedance at 50 C is higher than those for the other temperatures at256 kHz and above If the temperature sensitivity is recalculated without the data at 50 Cthe sensitivity for liver reduces to 0001 plusmn 020 Cminus1 For fat the temperature sensitivity ofthe normalized impedance data is 0002 plusmn 0035 Cminus1 for frequencies up to and including256 kHz
Having minimized the temperature sensitivity of the electrical impedance measurementsthe next step was to determine the frequency at which the normalized impedance gave the bestestimate of the percentage of fat in the sample The candidate frequencies are those above theroll-off frequency in the spectrum for liver (8 kHz) In this study we have shown that there is atemperature sensitivity of the normalized electrical impedance of fat at 512 kHz and at 1 MHzTherefore the frequency selected should be one of those measured between 8 and 256 kHzThe correlation between the percentage of fat by volume and the normalized impedance at64 128 and 256 kHz was determined from the electrical impedance spectra of the 15 layeredsamples measured in the same way as the fat and liver samples and then normalized to 8 kHzThe correlation analysis gave values of r2 of 047 054 and 065 at 64 kHz 128 kHz and256 kHz respectively Whilst these values of r2 are low all were statistically significant atp lt 0005 Since the normalized impedance at 256 kHz gave the highest value of r2 thenormalized impedance at 256 kHz was selected to determine the percentage of fat in tissuesamples (figure 9) The equation of the line of best fit for the data shown in figure 9 is givenby
Zn = 26 times 10minus3 f + 070 (3)
where Zn is the impedance at 256 kHz normalized to the impedance at 8 kHz and f is thepercentage of fat in the sample Based on the t-statistic used to determine the 95 confidenceinterval of the line of best fit (Liengme 2002) and ten measurements the predicted error indetermining the fat content for the line of best fit at 5 fat is plusmn 26 and at 50 fat is plusmn 18
To evaluate the ability of the proposed technique to predict the temperature a 15 cyclebootstrap analysis was run on the 15 layered tissue samples For each cycle a single sample
1116 N Islam et al
-50
-40
-30
-20
-10
0
10
20
30
40
0 50 100
erro
rin
pre d
icte
dfa
tcon
tent
Measured fat content
Figure 10 Error in estimating the fat content of the sample as a function of the measured fatcontent
Table 1 The results from the bootstrap analysis where the temperature was predicted using themeasured temperature coefficient of the ToF at 40 C firstly using the normalized impedance at256 kHz measured at 30 C to predict the fat content and secondly using the measured fat contentof the sample
Predicted PredictedMeasured Predicted Measured temperature using temperature using
Sample fat content fat content temperature predicted fat content measured fat contentnumber () () (C) (C) (C)
1 0 minus2 40 1172 minus1682 11 34 40 07 3583 18 37 40 08 3504 23 23 40 366 3665 39 49 40 423 4586 41 17 40 436 3577 44 48 40 404 4148 44 47 40 424 4319 47 5 40 1916 413
10 55 23 40 556 40311 63 75 40 401 42012 69 93 40 392 42513 74 47 40 481 42314 80 109 40 384 41515 100 121 40 367 381
was omitted from the data set and the two lines of best fit re-calculated for the remaining 14samples the first between the temperature coefficient of the ToF and the percentage fat andthe second between the normalized impedance at 256 kHz and the percentage fat The valuesobtained were then used to predict the temperature from the change in ToF for the omittedsample at 40 C using (a) the predicted fat composition from the normalized impedance at30 C and (b) the measured fat content The results from this analysis are shown in table 1
Table 1 shows a large variation in the difference between the measured fat content andthat predicted from the normalized impedance but there is no simple relationship between thatdifference and the percentage of fat in the sample (figure 10) For both the measured and the
Ultrasound and electrical impedance temperature measurement 1117
-400
-300
-200
-100
00
100
200
300
400
0 20 40 60 80 100
Err
orin
tem
pera
t ur e
esti
mat
ion
C
measured fat content
Predicted fat content
Measured fat content
-772 -1516
568
Figure 11 Error in estimating the temperature as a function of the measured fat content Sampleslying outside the range plusmn 50 are not plotted to scale
predicted fat content the error in the temperature predicted from the ultrasound propagationvelocity decreased with increasing fat content with that decrease being particularly noticeablefor samples with more than 50 fat content (figure 11) From figure 5 it can be seen that thetemperature coefficient for the ToF is close to zero for samples with a fat content close to zeroand the effect of this can be seen in samples 1 and 9 in table 1 In both samples where eitherthe predicted or measured fat content (or both) is close to zero there were large errors in thepredicted temperature
4 Discussion
The measured values for the changes in ultrasound propagation velocity with temperature forthe 100 liver and 100 fat samples are in agreement with values obtained by others (Duck1990) The results show a much greater inter-sample variability for liver than fat Equation (1)predicts the propagation velocity of a sample of liver in terms of the volumetric fraction ofcondensed matter and fluids it contains Whilst the origin of the inter-sample differences inpropagation velocity for the liver is unclear it is likely that a significant component of thiscould be due to differences in the fraction of condensed matter and fluid between samplesDifferences in composition may also explain the sample with a much lower propagationvelocity shown in figure 3 As noted by Miller et al (2004) separating the fluid and condensedmatter to estimate the fraction of each would be difficult Within this study we did attemptto do that by macerating liver tissue and then centrifuging it at 4500 rpm for 10 min butthis failed to produce any separation Optical microscopy of the centrifuged tissue confirmedthe cellular structure was still intact The only alternative is a chemical separation but thepropagation velocity and masses of all the reactants and products including gases would needto be measured for inclusion in an analysis using equation (1)
1118 N Islam et al
The ultrasound propagation velocity for liver rises with increasing temperature to about50 C (Bamber 1998) and falls thereafter This study shows that for the small temperature rangebetween 30 and 50 C the change can be approximated to be linear however any nonlinearitywill affect the confidence interval with which temperature can be predicted from a propagationvelocity measurement From the measurements made in this work the confidence intervals forpredicting the temperature from a change in the propagation velocity for liver and fat wereplusmn 43 C and plusmn 17 C at 40 C respectively To put this finding into context measurementsmade on water and sunflower oil combined in a 8020 mixture using equation (1) gave apeak in the propagation velocity at 50 C and a prediction error of plusmn 17 C The differencebetween this result and the measured results for fat and liver are due to variations in the tissuesamples It should be noted that a prediction error of plusmn 17 C is above the 1 C accuracyrequired clinically to deliver hyperthermia
The amplitude of the reflected signal decreased with increasing temperature which hasthe effect of producing an increasing error in the propagation velocity determination asthe temperature increased This temperature dependence of the intensity of the reflectedsignal has previously been proposed as a possible method of non-invasively measuring thetemperature where the property measured is termed the backscattered energy (Staube andArthur 1994 Arthur et al 2003) The origin of this temperature dependence is multi-factorialbut includes the temperature dependence of both the acoustic impedance and the attenuationof the propagating media (Staube and Arthur 1994) This temperature dependence combinedwith multiple reflections from interfaces in the layered tissue samples made the start of thereflected signal from the base of the test cell hard to reliably detect limiting the accuracy withwhich the propagation velocity could be determined Therefore the ToF based on the first largepeak in the reflected signal has been used for the layered tissue experiments
The analysis of the ultrasound ToF in the layered tissues showed a linear correlationbetween the percentage of fat in the sample and the change in the ToF This finding is inagreement with the findings of Shannon et al (2004) who showed a linear correlation betweenpropagation velocity and the lipid content of salmon muscle These findings are also consistentwith the relationship given in equation (1)mdasha relationship that was confirmed within thiswork through measurements on mixtures of sunflower oil and saline and sunflower oil anda lubricating oil (Mobil 10 W-40 semi-synthetic motor oil) in the test cell Shannon et al(2004) as part of their work derived a reciprocal squared relationship to relate the fraction ofdifferent components of a material and their individual propagation velocities to the overallpropagation velocity of the material However there was a mathematical error in the derivationand interestingly they fitted a linear line to their measured data
The original stimulus for the work reported in this paper was to explore the potentialof using simultaneous ultrasound and electrical impedance measurements for surfacedetermination of deep body temperature during mild hyperthermia used as part of cancertreatment Whilst a linear relationship was found between the temperature coefficient of theToF and the fat content (figure 5) the value of that coefficient is close to zero for small levelsof fat in the tissue Rearranging equation (2) and differentiating with respect to f gives thesensitivity of the change in temperature from 30 C ToF30 to the percentage fat content f in terms of the measured percentage change in the ToF from that at 30 C
partT30
part fasymp minusToF30
a( f minus 1)2asymp minus100 times ToF30
( f minus 1)2(4)
assuming a asymp b asymp 10minus2 Thus the sensitivity of the predicted temperature to errors in estimatingthe percentage of fat in the sample is a maximum at very low fat concentrations and decreasesas the percentage of fat in the sample increases The results from the bootstrap analysis confirmthis as errors in the temperature predictions are large for a small fat content (figure 10) and
Ultrasound and electrical impedance temperature measurement 1119
become smaller with increasing fat in the sample Increasing the fat content of the sample hastwo effects firstly it increases the magnitude of the temperature sensitivity of the propagationvelocity and secondly it reduces the effect of the nonlinearity in the propagation velocitycharacteristics of the water Whilst normal tissue would typically have a substantial fat contenttumours only have a low fat content and therefore the approach proposed is unlikely to workin a simple manner for mild hyperthermia
One possible solution to the low temperature coefficient of liver is to inject a non-ionicagent with a known linear propagation velocity temperature coefficient and thermal propertieswhich is taken up equally by the tumour and the surrounding tissue If the volume taken upcould be determined by a cross-sectional imaging technique then equation (1) could be usedto determine the effective propagation velocity of the agent and the liver However such anapproach moves away from the original concept of a non-invasive measurement As an initialexploration of the idea we measured the propagation velocity of a non-ionic x-ray contrastagent (Coviden Optiray 300 mg I mlminus1) The results of this together with the ToF results forliver combined using equation (1) suggested that adding 10 by volume of the contrast agentto liver would give a temperature coefficient for the ToF that would produce a good estimateof temperature based on the results obtained from the bootstrap analysis given in figure 11
The well understood electrical impedance properties of tissue coupled with the lack ofan intra-cellular fluid in fat cells makes electrical impedance measurement a candidate for thedetermination of the amount of fat in a sample The results obtained for the 100 liver samplesshown in figure 4(a) are consistent with a ColendashCole model of cellular tissue (Cole and Cole1941) although it should be noted that the highest frequency measured 1 MHz was below thefrequency at which the impedance plateaus The minimal change in impedance of the 100fat samples with frequency up to 512 kHz is consistent with fat cells having no intra-cellularfluid However the lipid within fat cells is a dielectric and the decrease in impedance at 1 MHzis consistent with this and has been confirmed by modelling (Islam 2012)
The results for the 100 liver samples show a decrease in the variability of the measuredelectrical impedance with frequency Whilst the origins of this are unclear the findings maybe due to the differences in the volume of extra-cellular fluid between samples It should benoted that this is analogous to the potential explanation for the variability found in the resultson the ultrasound propagation velocity in liver In contrast the variability in the electricalimpedance measurements for the 100 fat samples was much smaller and independent offrequency On epithelial tissues differences in cellular structure have been shown to producedifferences in the parameters of ColendashCole models fitted to measured electrical impedancespectra (Brown et al 2000b Gonzalez-Correa et al 1999) Within the context of this studydifferences in dispersion frequency or fitted parameters might have provided information onthe fluid and condensed matter content of the liver but neither the frequency range nor thefrequency resolution allowed this to be investigated
The electrode geometry and in particular the electrode spacing determines the absolutevalue of the measured impedance and therefore the spectra must be normalized to allowcomparisons between studies Within this study normalization was also required to minimizethe temperature sensitivity of the spectra In choosing a low frequency to normalize theimpedance measurements both the inter-sample variability and the effect of temperature mustbe taken into consideration as the former will have the effect of increasing the variabilityof the normalized high frequency values Results obtained in this study show there is littletemperature sensitivity below 256 kHz for fat and a linearly decreasing negative sensitivitywith frequency for liver The change in the temperature coefficient with frequency for theliver samples will also result in increased temperature sensitivity of the high to low frequency
1120 N Islam et al
ratio as the difference between the two frequencies increases Therefore 8 kHz the highestfrequency below the roll-off in impedance for the liver tissue was selected
A good correlation and a line of best fit with a small confidence interval for the slopeis required between the normalized impedance and the percentage of fat in the sample if thenormalized impedance is to be used to determine the percentage of fat in the tissue Allthe frequencies examined gave a statistically significant correlation coefficient (p lt 0005)with the percentage of fat but the use of 256 kHz gave the largest value of r2 (065) However thisis still small and gave a consequently large confidence interval for any predictions This resultis poorer than might have been expected given the results for fat and liver when measuredseparately This may be due to one of the underlying problems of tetrapolar impedancemeasurement that of a complex sensitivity distribution coupled with regions of negativesensitivity between the drive and receive electrodes (Islam et al 2010 Brown et al 2000a)We have previously shown (Islam et al 2010) that the sensitivity distribution can be improvedthrough summing multiple measurements made using different combinations of electrodesover the region of interest (Rabbani and Karal 2008) However even with this approacha complex sensitivity distribution results with regions of negative sensitivity close to theelectrodes (Islam et al 2010) Further improvement in the spatial distribution of sensitivity fortetrapolar impedance measurements is required before the technique proposed in this papercan be considered as a potential measurement technique in clinical mild hyperthermia
The work reported in this paper has not used living tissue and the values for the temperaturecoefficient of the impedance obtained for fat and liver are consistent with that of physiologicalsaline (minus2 Cminus1 Duck 1990) Gersing et al (1995) reported that different living tissuesyielded different temperature coefficients for electrical conductivity It is unclear whetherthese differences are the result of the non-electrolyte components of the tissue or metabolicchanges associated with heating (eg changes in blood flow and membrane conductivity) Ina later study Gersing (1999) reported that the onset of changes in the electrical impedance ofmalignant tissue was delayed when compared with normal tissue
The results reported in this study have quantified the changes in electrical impedancespectra and propagation velocity for liver and fat and have measured both in a layered tissuemodel to establish the effect of fat on both temperature coefficients Whilst linear relationshipswere found the confidence intervals from the predictions of fat and temperature particularlythe latter were not adequate for the combination of measurements to provide a tool for use inthe clinical environment The variability in the measurements has been quantified and possiblesources identified Further work is required to determine whether these can be minimized tothe level where a clinically useful tool can be implemented
Acknowledgments
NI gratefully acknowledges support from the British Council for a Commonwealth Scholarshipaward The authors also knowledge support from T F Yu who was funded through theWellcome Trust Vacation Scholarship scheme to implement the prototype of the electricalimpedance measurement instrumentation
References
Aitkenhead A H Mills J A and Wilson A J 2008 The design and characterization of an ultrasound phased arraysuitable for deep tissue hyperthermia Ultrasound Med Biol 34 1793ndash807
Aitkenhead A H Mills J A and Wilson A J 2009 An analysis of the origin of differences between measured andsimulated fields produced by a 15 element ultrasound phased array Ultrasound Med Biol 36 410ndash8
Ultrasound and electrical impedance temperature measurement 1121
Apfel R E 1983 The effective nonlinearity parameter for immiscible liquid mixtures J Acoust Soc Am 74 1866ndash8Arthur R M Straube W L Starman J D and Moros E G 2003 Noninvasive temperature estimation based on the energy
of backscattered ultrasound Med Phys 30 1021ndash9Bamber J C 1998 Acoustical characteristics of biological media Encyclopedia of Acoustics vol 4 ed M J Crocker
(New York Wiley) pp 1703ndash26Brown B H Tidy J A Boston K Blackett A D Smallwood R H and Sharp F 2000b Relation between tissue structure
and imposed electrical current flow in cervical neoplasia Lancet 355 892ndash5Brown B H Wilson A J and Bertemes-Filho P 2000a Bipolar and tetrapolar transfer impedance measurements from
a volume conductor Electron Lett 36 2060ndash2Chambre P L 1959 Speed of a plane wave in a gross mixture J Acoust Soc Am 26 329ndash31Cole K S and Cole R H 1941 Dispersion and absorption in dielectrics J Chem Phys 9 341ndash51Conway J Hawley M S Seagar A D Brown B H and Barber D C 1985 Applied potential tomography (APT) for
noninvasive thermal imaging during hyperthermia treatment Electron Lett 21 836ndash8Del Grosso V A and Madder C W 1972 Speed of sound in pure water J Acoust Soc Am 52 1442ndash6Duck F 1990 Physical Properties of Tissue (London Academic)Esrick M A and McRae D A 1994 The effects of hyperthermia-induced tissue conductivity changes on electrical
impedance temperature mapping Phys Med Biol 39 133ndash44Ferraioli F Formisano A and Martone R 2009 Effective exploitation of prior information in electrical impedance
tomography for thermal monitoring of hyperthermia treatments IEEE Trans Magn 45 1554ndash7Gersing E 1999 Monitoring temperature-induced changes in tissue during hyperthermia by impedance methods Ann
New York Acad Sci 873 13ndash20Gersing E Kruger W Osypka M and Vaupel P 1995 Problems involved in temperature measurements using EIT
Physiol Meas 16 A153ndash60Gonzalez-Correa C A Brown B H Smallwood R H Kalia N Stoddard C J Stephenson T J Haggie S J Slater D N
and Bardhan K D 1999 Virtual biopsies in Barrettrsquos esophagus using an impedance probe Ann New York AcadSci 873 313ndash21
Islam N 2012 The potential for using combined electrical impedance and ultrasound measurements for the non-invasive determination of temperature in deep body tumours during mild hyperthermia PhD Thesis Universityof Warwick
Islam N Rabbani K S-E and Wilson A 2010 The sensitivity of focused electrical impedance measurements PhysiolMeas 31 S97ndashS109
Kell G S 1975 Density thermal expansivity and compressibility of liquid water from 0ndash150 C correlations andtables for atmospheric pressure and saturation reviewed and expressed on 1968 temperature scale J Chem EngData 20 97ndash105
Lagendijk J J W 2000 Hyperthermia treatment planning Phys Med Biol 45 R61ndashR76Liengme B V 2002 Guide to Microsoft Excel for Scientists and Engineers (Oxford UK Butterworth-Heinemann)Miller N R Bamber J C and Meaney P M 2002 Fundamental limitations of non-invasive temperature imaging by
means of ultrasound echo strain estimation Ultrasound Med Biol 28 1319ndash33Miller N R Bamber J C and ter Haar G R 2004 Imaging of temperature-induced echo strain preliminary in vitro
study to assess feasibility for guiding focused ultrasound surgery Ultrasound Med Biol 30 345ndash56Moskowitz M J Paulsen K D Ryan T P and Pang D 1994 Temperature field estimation using electrical impedance
profiling methods II Experimental system description and phantom results Int J Hyperthermia 10 229ndash45Paulson K D and Jiang H 1997 An enhanced electrical impedance imaging algorithm for hyperthermia applications
Int J Hyperthermia 13 459ndash80Persson H W and Hertz C H 1985 Acoustic impedance matching of medical ultrasound transducers
Ultrasonics 23 83ndash89Rabbani K S and Karal M A S 2008 A new four electrode focused impedance measurement (FIM) system for
physiological study Ann Biomed Eng 36 1072ndash7Rieke V and Pauly K B 2008 MR thermometry J Magn Reson Imaging 27 376ndash90Sauer R Creeze H Hulshof M Issels R and Ott O 2012 Concerning the final report lsquoHyperthermia a systematic
reviewrsquo of the Ludwig Boltzmann Institute for Health Technology Assessment Vienna March 2010 StrahlentherUud Onkol 188 209ndash13
Seip R and Ebbini E S 1995 Noninvasive estimation of tissue temperature response to heating fields using diagnosticultrasound IEEE Trans Biomed Eng 42 828ndash39
Shannon R A Probert-Smith P J Lines J and Mayia F 2004 Ultrasound velocity measurement to determine the lipidcontent in salmon muscle the effects of myosepta Food Res Int 37 611ndash20
Staube W L and Arthur R M 1994 Theoretical estimation of the temperature dependence of backscattered ultrasonicpower for noninvasive thermometry Ultrasound Med Biol 20 915ndash22
1122 N Islam et al
ter Haar G R 1999 Therapeutic ultrasound Eur J Ultrasound 9 3ndash9Triantopoulou S Efstathopoulos E Platon K Uzunoglou N Kelekis N and Kouloulias V 2013 Radiotherapy in
conjunction with superficial and intracavitary hyperthermia for the treatment of solid tumours survival andthermal parameters Clin Transl Oncol 15 95ndash105
van Rhoon G C and Wust P 2005 Non-invasive thermometry for thermotherapy Int J Hyperthermia 21 489ndash95Wilson A J Milnes P Waterworth A R Smallwood R H and Brown B H 2001 Mk35 a modular multi-frequency
successor to the Mk3a EITEIS Syst Physiol Meas 22 49ndash54
- 1 Introduction
- 2 Materials and methods
-
- 21 Test cell
- 22 Ultrasound measurement instrumentation
- 23 Electrical impedance measurement instrumentation
- 24 Measurements
-
- 3 Results
-
- 31 Ultrasound propagation velocity results
- 32 Electrical impedance results
- 33 Combining ultrasound propagation velocity and electrical impedance measurements
-
- 4 Discussion
- Acknowledgments
- References
-
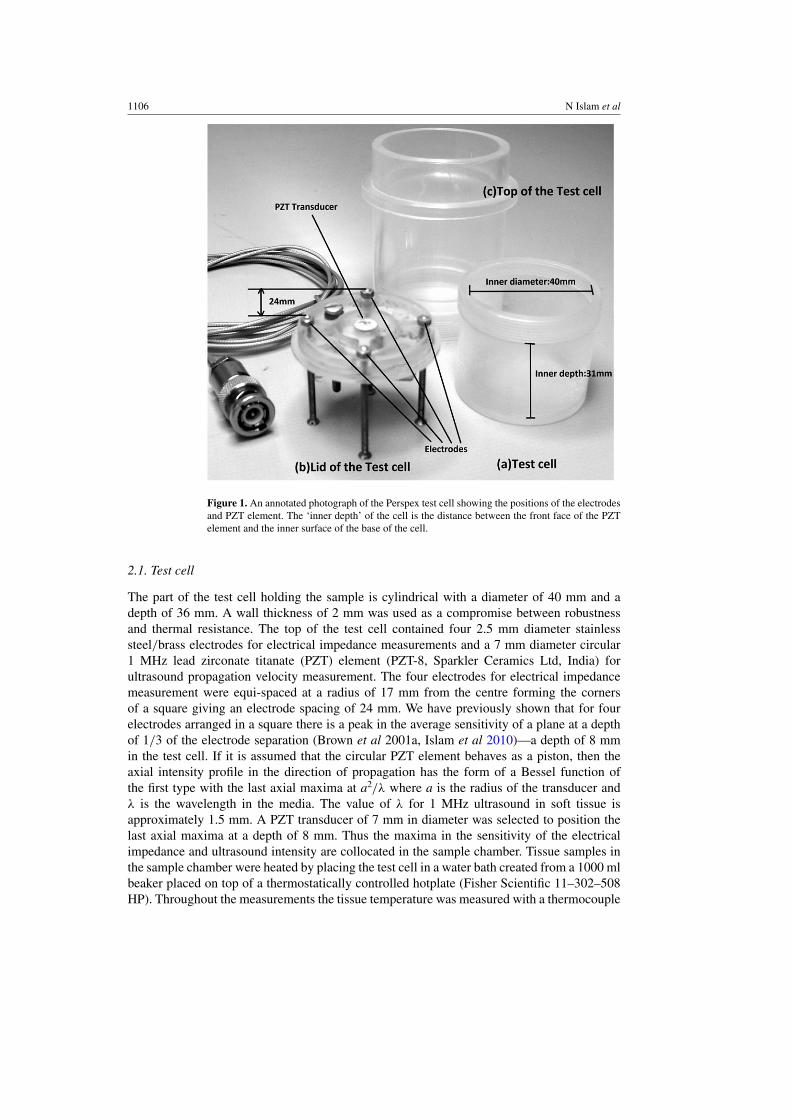
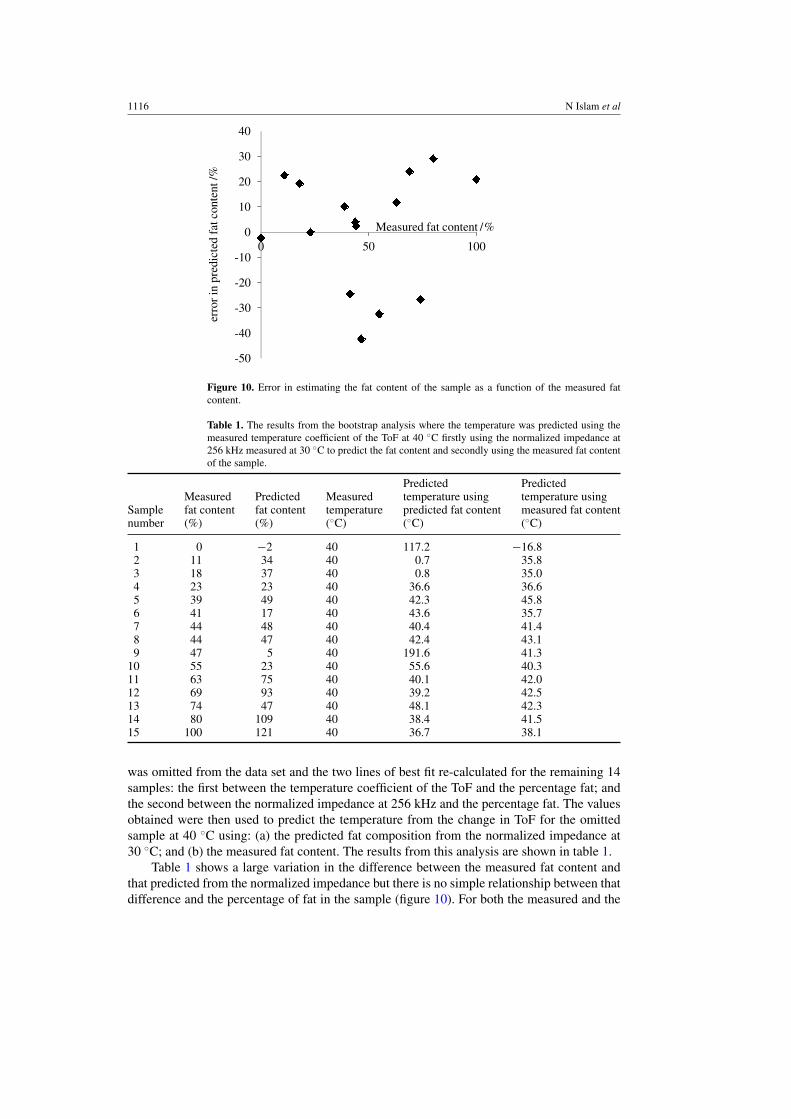