the portuguese banking system during the sovereign debt crisis publications...
TRANSCRIPT

The Portuguese Banking System during the SovereignDebt Crisis
Matteo CrosignaniNew York University Stern
Miguel Faria-e-CastroNew York University
Luís FonsecaBanco de Portugal
July 2015
AbstractWe describe the evolution of balance sheets of monetary financial institutions (MFI) inPortugal before, during, and after the sovereign debt crisis of the late 2000’s. We accountfor several dimensions of heterogeneity including size, type, and nationality. We findthat the Portuguese MFI sector rapidly expanded and increased its leverage before andduring the crisis until 2012, after which it started a long deleveraging process. Many of themajor aggregates, such as lending and deposits, follow this pattern. We observe a steadyrise of non-traditional banking activities on both sides of the balance sheet of domesticinstitutions. The crisis weakened the international integration of the Portuguese financialsector, as domestic banks became less exposed to international counterparties. Finally, theEurosystem and the Portuguese government have become relevant sources of funding asa result of the recent unprecedented monetary and fiscal interventions in the domesticfinancial system. (JEL: E50, E58, G20, G21, H63)
Introduction
The recent sovereign debt crisis in Europe has had an unprecedentedimpact on the macroeconomic conditions faced by several advancedeconomies, such as Portugal. While the sovereign debt crisis
was related to the worsening of fiscal fundamentals, it was primarilytriggered by the global financial crisis, which impaired the functioningof international financial markets. Dire funding conditions affected private
Acknowledgements: We are extremely grateful to Nuno Alves and Diana Bonfim for theirsupport and the Monetary Financial Institutions team of the Statistics Department at Banco dePortugal for helping us access and interpret the data. We thank Nuno Alves, António Antunes,Rafael Barbosa, Ângela Coelho and Rita Soares for helpful comments and suggestions. MatteoCrosignani is also grateful for the support of the Macro Financial Modeling Group dissertationgrant from the Alfred P. Sloan Foundation.The opinions expressed in this article are those of the authors and do not necessarily coincidewith those of Banco de Portugal or the Eurosystem. Any errors and omissions are the soleresponsibility of the authors.E-mail: [email protected]; [email protected]; [email protected]

44
financial institutions, whose stress was then transmitted to vulnerablesovereigns. The long-lasting recession that followed evidenced the importanceof financial intermediation in the propagation and amplification of businesscycles.
In this article, we contribute to understanding the dynamics offinancial intermediation by documenting and analyzing the evolution of thePortuguese monetary financial system before, during and after the sovereigndebt crisis. Using disaggregated data at the level of each monetary financialinstitution (MFI), we analyze the evolution of the main components oftheir balance sheet, industry concentration, and access to liquidity providingfacilities of the Eurosystem.
Our main findings are: (i) the number of monetary financial institutions(MFI) is stable throughout the sample period, and evenly divided betweendomestic and foreign institutions; (ii) domestic institutions own the bulk ofthe assets, and their importance has grown in the recent past; (iii) there issome evidence of increased industry concentration, especially when measuredin terms of total assets; (iv) the size and leverage of the monetary financialsystem increased steadily until early 2012, and have been decreasing sincethen; (v) lending comprises the bulk of assets, and seems to have been the keydriver of most movements in balance sheet size; (vi) non-government securityholdings have become an increasingly larger component of banks’ balancesheets; (vii) there has been substantial repatriation of domestic public debtholdings both during the crisis and the deleveraging periods, consistent withthe literature; (viii) most of the leveraging was undertaken by increasing debt,but the deleveraging has combined changes in debt and equity; (ix) depositfunding followed the leveraging and deleveraging trends, and has beenmostly sustained by domestic counterparties, with foreign ones decreasingin importance throughout the crisis; (x) reliance on securitized funding hasbecome increasingly relevant; (xi) the banking sector is overwhelminglyexposed to domestic counterparties, and international activities have lostimportance in the crisis and post-crisis periods; (xii) public funding from thecentral bank and the government has become an important source of liquidity.
Driven by this last finding, we study the characteristics of the institutionsthat have accessed the Eurosystem’s credit operations. While all institutionsin our sample, with the exception of money market funds, are, in principle,eligible for accessing these operations, only a small fraction of the MFI’s usethem. During the crisis, opportunities to obtain Eurosystem funding increasedsignificantly thanks both to the expansion of the offered amounts as wellas of the list of assets that are eligible as collateral. For this reason, evenrelatively specialized institutions had the opportunity to borrow from theEurosystem. These institutions, which tended to be smaller, may have alsorelied on other MFI’s funding and/or payment systems, since direct accessto the Eurosystem liquidity-providing operations may entail implicit costs.The expansion of the list of eligible assets was undertaken by each national

45
central bank independently, involving different criteria at the national level.Laxer requirements in Portugal may have led to the increase in the number offoreign institutions borrowing from the central bank.
Description of the Data
Our primary source of data is the Monetary and Financial Statistics dataset(MFS) from Banco de Portugal (BdP). The dataset we analyze includes detailedbalance sheet information for every MFI domiciled in Portugal, with theexception of the central bank. It is a monthly panel, and we focus on the periodranging from January 2005 to May 2014.1
The MFS is a multi-dimensional dataset. For both the asset and liabilitysides, an observation consists of the book value held by an institution i ∈ Nin a given month t ∈ T of an asset or liability in category j ∈ J (and,for some asset and liability types, with a certain remaining maturity), vis-à-vis all counterparties in a given institutional sector k ∈ K and in a givengeographical area s ∈ S. More specifically, the different dimensions for whichdata are available are:
1. Asset or liability category, (j).(a) Assets - banknotes and coins, loans (with repricing dates up to 1 year,
1 to 5 years, and more than 5 years), securities except equity holdings(up to 1 year, 1 to 2 years, more than 2 years), equity holdings, physicalassets, and other assets (including derivatives).
(b) Liabilities - overnight deposits, demand deposits (with a noticeperiod of less than 90 days, and more than 90 days), other deposits(with maturity less than 1 year, 1 to 5 years, and more than 5 years),repurchase agreements, securities (up to 1 year, more than 1 year),other liabilities, and capital and reserves.
2. Counterparty’s institutional sector, (k). Monetary financial institutions,2
social security administration, central government, regional government,local government, insurance and pension funds, households, otherfinancial intermediaries, non-financial firms, and other sectors/non-classified.
3. Counterparty’s geographical area, (s). Portugal, Germany, Austria,Belgium, Cyprus, Slovenia, Spain, Estonia, Finland, France, Greece,the Netherlands, Ireland, Italy, Latvia, Luxembourg, Malta, Slovakia,
1. The population of institutions coincides with the list of MFI’s published by the EuropeanCentral Bank in its website. The only exceptions are the central bank (BdP), and certain mutualagricultural banks that are consolidated at the parent level in our dataset - see Appendix A fordetails.2. We can separately identify the central bank as a counterparty for liabilities but not for assets.

46
Economic and Monetary Union (EMU) excluding Portugal,3 non-EMUCountries, and the European Central Bank (ECB).
The MFS dataset allows us, for example, to determine the book value of allnon-equity securities whose issuer was the German central government thatwere held by bank i in month t.
Finally, entities in the MFS are subject to a functional classification. Thecategories are:
1. Banks2. Savings banks (caixas económicas)3. Mutual agricultural credit banks4. Money market funds
A full list of the institutions that are present in the dataset, along withtheir classification and entry/exit dates may be found in Appendix B. Thevast majority of the institutions are banks. The second and third categoriesencompass institutions that are legally restricted to practice traditionalbanking activities only, but have largely become obsolete and, with oneexception, contain mostly small regional institutions. Finally, and as withother European countries, since the Portuguese financial system is mostlybank-based, the money market mutual fund sector is relatively undevelopedand these institutions are few and small.
In addition to this functional classification, we manually collectinformation regarding other institutional-level variables, which we use tocomplement and extend the MFS. Since our dataset contains the universeof MFI’s in Portugal, it necessarily includes some institutions that aresubsidiaries or branches of other institutions that are also present in thesample. For the remainder of the article, we refer to these institutions assubsidiaries. We manually classify and match each subsidiary with its parentcompany. In addition, we classify each institution according to its country oforigin (or that of its parent institution), extending the nationality criterion toany subsidiaries that may also be present in the sample.
Subsample Classification
We divide the available sample into three periods: (i) the pre-crisis period fromJanuary 2005 to April 2009, when government bond yields were close to theGerman 10-year benchmark; (ii) the crisis period from May 2009 to November2011, when Portuguese sovereign spreads increased from 4% to 14% and theshare of government debt held by domestic banks also increased from 4% to
3. The dataset treats countries that joined the EMU after the beginning of the sample as if theywere part of the Union throughout the entire sample, thus avoiding series breaks.

47
around 10%;4 (iii) the deleveraging period that starts in December 2011, whichalso coincides with the announcement by the ECB of the three-year Long-TermRefinancing Operations.
Number and size of MFI’s
We begin our descriptive analysis by looking at the evolution of the number,size and concentration of MFI’s over the period in our sample.
Number of Institutions
The left panel of Figure 1 plots the number of institutions in our sample,classified according to their functional type. The overall number of institutionsis relatively stable at around 76, slightly declining in the crisis anddeleveraging periods. The number of savings and agricultural banks is smalland stable (4 and 6, respectively). The number of money market fundsincreases from around 4 in the early sample to 10 starting in early 2012.Overall, the decline in the total number of institutions is explained by adecrease in the number of banks in the sample: from a peak number of 70in late 2008 to 56 in May 2014.5
The main explanation for this fluctuation in the number of institutionsseems to be related to entry and exit of foreign institutions. The right panelof Figure 1 discriminates domestic from foreign institutions. The number ofdomestic institutions is stable and slightly increasing towards the latter part ofthe sample: it reaches a peak of 44 at the end. Regarding foreign institutions,they reach a peak of 42 in late 2008, but only 35 are left by May 2014 (thelowest value in the sample). In spite of these movements, the sector seems tobe relatively evenly divided in terms of the number of domestic and foreigninstitutions. The same cannot be said of size, as illustrated in the followingsubsection.
4. May 2009 is also the month when concerns regarding the capitalization of domestic banksfirst arise, and the government creates a e4 bn recapitalization fund.5. This decline in the number of institutions does not seem to be explained by mergers. Inan unreported analysis, we study the number of institutions by functional classification, butexcluding subsidiaries. The number of independent MFI’s is relatively stable at around 59, witha small increase right before the beginning of the crisis (2008-2009) that is then reversed in thefollowing years. It is also clear that the majority of the money market fund sector consists ofsubsidiaries of other MFI’s. There are very few money market funds that are not subsidiaries ofother MFI’s in our sample (never more than 3 at any point in the sample).

480
2040
6080
Num
ber
of In
stitu
tions
2005m1 2009m5 2011m12 2014m5
Bank MMF Savings Agric.
(A) Institutions by type
3040
5060
7080
Num
ber
of In
stitu
tions
2005m1 2009m5 2011m12 2014m5
Domestic Foreign
(B) Institutions by nationality
FIGURE 1: Number of institutions in the MFS according to their functionalclassification (left panel) and nationality (right panel).
Size of the MFI’s
The left panel of Figure 2 attests to the dominance of banks in the Portuguesemonetary financial system. The total size of assets in the system peaks at583.3 bn euros in February 2012, and starts declining thereafter. Non-bankinstitutions have, on average, assets equal to 18 bn euros, or 3.8% of totalassets in the system. Most of these assets are owned by agricultural banks: thepresence of savings banks and money market funds is negligible (averaging0.06% and 0.14% of total assets throughout the sample, respectively). Theright panel repeats the analysis, but using the nationality criterion instead.The majority of the assets in the Portuguese monetary financial system arecontrolled by domestic banks, with their share growing slightly throughoutthe sample (75.2% of total assets in January 2005 vs. 79.2% in May 2014).
Even though our sample is short – spanning less than 10 years – itis characterized by a strong growth of the Portuguese monetary financialsystem. In January 2005, our first data point, total assets of MFI’s were 2.24times GDP. After peaking in February 2012 at 3.46 times, they were still equalto 3.04 times GDP in the beginning of 2014. These numbers, as well as thepredominance of banks, seem to be in line with average European values,following Pagano and ESRB Advisory Scientific Committee (2014).
Size Distribution
As with many industries, the monetary financial system tends to present adistribution of firm size that is highly skewed to the right, featuring manysmall firms and a few very large ones. There is a large literature on the sizedistribution of banks in several countries: Kashyap and Stein (2000), Ennis(2001) and Janicki and Prescott (2006) conduct this sort of analysis for theUnited States; Koetter (2013) for Germany; Wilson and Williams (2000) for

49
020
040
060
0bn
EU
R
2005m1 2009m5 2011m12 2014m5
Bank MMF Savings Agric.
(A) Total assets by institution type
100
200
300
400
500
600
bn E
UR
2005m1 2009m5 2011m12 2014m5
Domestic Foreign
(B) Total assets by institution nationality
FIGURE 2: Balance sheet size of the institutions in the MFS according to their functionalclassification (left panel) and nationality (right panel).
France, Germany, Italy and the UK, among many others. The banking industryseems to invariably display very high concentration, and secular trends in thelast few decades seem to point towards further increases in concentration andreduction in the number of smaller players.
We analyze the evolution of the size distribution of Portuguese MFI’susing two nonparametric methods.6 The first consists of estimating the kerneldensity for (the natural logarithm of) assets. The kernel density can beinterpreted as a smoothed histogram. Letting each entity be indexed by i ∈ N ,our sample of log (total) assets in a given month t can be expressed asthe collection {logAit}Ni=1. Then, the kernel density estimator of the densityf(logAit) is given by
f̂(x) =1
Nh
N∑i=1
K
(x− logAit
h
)(1)
where K(·) is a kernel (a non-negative function that has mean zero andintegrates to 1), and h > 0 is the bandwidth, a smoothing parameter.7 Wecompute the kernel densities for the starting and ending periods of oursample, January 2005 and May 2014, and plot the results in the left panel
6. We do not seek to explain the causes of changes in concentration. In this spirit, our analysisis purely statistical, not structural.7. We use the Epanechnikov kernel function, given by
K(z) =3
4(1− z2)1[|z| ≤ 1]
The bandwidth is chosen to minimize mean squared error. The bandwidth that we use is an“optimal” one, in the sense that it would minimize the mean (integrated) squared error assumingthat the data followed a Normal distribution. This is a conventional approach when the empiricaldistribution of the data is unimodal and the histogram is approximately bell-shaped, as in ourcase.

500
.05
.1.1
5.2
Den
sity
-5 0 5 10 15log Assets, M EUR
Jan2005 May2014
(A) Kernel density for MFI size
0.0
5.1
.15
.2D
ensi
ty
-5 0 5 10 15log Assets, M EUR
Jan2005 May2014
(B) Kernel density for MFI size, consoli-dated
FIGURE 3: Estimated kernel densities for the distribution of the log of assets; fullsample (left panel) and consolidated at the parent level (right panel).
of Figure 3. The distribution seems to be relatively stable between the twoperiods, and approximately Gaussian. This is consistent with the results in theliterature.8 In spite of its stability, there is some evidence of lower dispersionat the end of the sample. In the right panel, we consolidate all subsidiaries atthe parent level and show that the results are similar: the tails are flattened,but the stability and shape of the distributions remain mostly unchanged.9
The second nonparametric method we employ to study the sizedistribution is the Herfindahl-Hirschman (HH) index, which is better suitedto study the evolution of concentration in the banking sector over time. TheHH index can be computed for a given industry and a given point in time.Given a sequence of market shares {sit}Ni=1, it is computed as
Ht =N∑i=1
s2it (2)
That is, the index equals the sum of squared market shares at a given pointin time. We can apply the concept of market share to several variables andcompute this index over the sample period. Figure 4 plots the evolution of HHindices for three variables: total assets, lending to non-MFI’s10 and deposits.
8. Janicki and Prescott (2006) find, however, that the lognormal distribution is unable to capturethe thick right tail in the size distribution of banks for the United States. Instead, they fit a Paretodistribution, which has similar shape to a lognormal distribution but has a thicker right tail andis often used to characterize highly skewed data.9. It is worth noting that this process is likely to overstate the size of the consolidated bankssince we do not observe and therefore cannot control for intra-group cross exposures.10. We exclude lending to MFI’s since we cannot separate lending to the central bank - thecategory under which reserves appear - and it includes credit resulting from regular bankingactivities.

51
The solid line considers the universe of institutions, while the dashed lineconsolidates institutions at the parent level. The HH index is increasing inconcentration: a perfectly concentrated industry, with a single firm, has a HHequal to one. A perfectly competitive industry with N players of equal sizeshas a HH index equal to 1/N . As a benchmark, since the average numberof institutions over the sample is 76, the HH index for a perfectly competitivemarket would be roughly equal to 1/76' 0.013. The values in Figure 4 suggestthat the Portuguese banking market is relatively concentrated in terms ofthe three variables we analyze, with the HH indices one order of magnitudelarger than the perfectly competitive benchmark. Indeed, there are five largebanks that own an average of 67% of all the assets of the banking systemover the sample period.11 Lending concentration seems to be stable. Depositconcentration is initially declining, but then stabilizes during the crisis. Moreinterestingly, asset concentration seems to have increased during the crisis,and then stabilized after 2011.
11. These are: Caixa Geral de Depósitos, Banco Comercial Português, Banco Espírito Santo,Banco Santander Totta and Banco BPI.

52.1
.11
.12
.13
.14
Her
finda
hl In
dex
2005m1 2009m5 2011m12 2014m5
All Consol.
(A) Asset concentration
.1.1
1.1
2.1
3.1
4H
erfin
dahl
Inde
x
2005m1 2009m5 2011m12 2014m5
All Consol.
(B) Lending concentration
.1.1
1.1
2.1
3.1
4H
erfin
dahl
Inde
x
2005m1 2009m5 2011m12 2014m5
All Consol.
(C) Deposit concentration
FIGURE 4: Herfindahl-Hirschman indices for total assets, lending excluding MFI’s anddeposits. Solid line includes the entire sample, including subsidiaries; dashed lineconsolidates entities at the parent level.
Assets
We now turn to analyze the behavior of the main components of the asset sideof the balance sheet. We focus on the distinction between domestic and foreigninstitutions, and compare the respective evolution of the different componentsof the balance sheet. As shown in the previous section, this seems to be themost relevant dimension of heterogeneity, along with size. We opt not to focuson the functional classification due to the dominance of banks in the MFIsector. Because of this, we use the terms MFI and “bank” interchangeably.The evolution of total assets for domestic and foreign institutions has beenpresented in the right panel of Figure 2. The size of the system seems to followan inverse U-shaped pattern: it is strictly increasing until February 2012, whenit reaches 583.3 bn euros, and strictly decreasing thereafter.

53
050
100
150
200
250
300
bn E
UR
2005m1 2009m5 2011m12 2014m5
Domestic Foreign
(A) Total lending
050
100
150
200
250
300
bn E
UR
2005m1 2009m5 2011m12 2014m5
Domestic Foreign
(B) Lending to the non-financial privatesector
FIGURE 5: Total lending (left panel) and lending to the non-financial private sector(right panel). The latter is defined as lending to non-financial firms and households.Solid line are domestic institutions; dashed line are foreign MFI’s.
Lending
Figure 5 plots total lending in the left panel, and lending to the privatenon-financial sector in the right panel. The latter refers to lending whosecounterparties are either non-financial firms or households. Lending is byfar the largest component of assets, accounting, on average, for 70% of thebalance sheet, even though this share is decreasing over time for domesticbanks (starting at 79% and reaching 57% by the end of the sample). For thisreason, its behavior is very similar to that of total assets, displaying inverse U-shaped dynamics. For domestic banks, lending peaks on July 2010 (283.5 bn),while for foreign banks the peak is in June 2012 (95.3 bn). The share of lendingto private non-financial sector as a percentage of total lending is increasingover time for both domestic and foreign institutions, going from 72% and 54%,respectively, in the early sample, to 77% and 72%, respectively, in May 2014.
In Figure 6, we disaggregate lending by counterparty. Lending tohouseholds and non-financial firms is relatively similar in magnitudes, eachaccounting for slightly more than one third of total lending. Their dynamicsare also inverse U-shaped, even though lending to households seems to havedeclined by less than lending to firms. Lending to households by foreignbanks seems to have experienced a smaller and delayed decline. Lending tothe financial sector (MFI’s and other financial counterparties, such as pensionfunds and life insurers)12 is stable throughout the crisis, with a slight decline inthe latter part of the sample. Other counterparties for lending are less relevant.
12. We are not able to separate the central bank from other MFI’s on the asset side and so thiscategory may include bank reserves.

540
2040
6080
100
120
bn E
UR
2005m1 2009m5 2011m12 2014m5
Domestic Foreign
(A) Lending to households
020
4060
8010
012
0bn
EU
R
2005m1 2009m5 2011m12 2014m5
Domestic Foreign
(B) Lending to firms
020
4060
8010
012
0bn
EU
R
2005m1 2009m5 2011m12 2014m5
Domestic Foreign
(C) Lending to the financial sector
FIGURE 6: Lending to households (top left), non-financial firms (top right), andfinancial firms (bottom). Solid line are domestic institutions; dashed line are foreignMFI’s.
In particular, lending to the Portuguese government (central, regional andlocal) is relatively small.13
Security Holdings
The other large component of the asset side of balance sheets is holdings ofsecurities. We focus on securities whose counterparties are not governmententities (public securities will be analyzed separately). Figure 7 plots theevolution of non-public non-equity security holdings in the left panel and ofequity holdings in the right panel. The Figure illustrates the steady increasein importance of securitization for domestic institutions, with non-publicsecurity holdings displaying a clear positive trend in the pre-crisis period.They start at roughly the same level as holdings by foreign entities, inspite of significant differences in balance sheet sizes. Holdings of securities
13. Lending to non-financial firms may include lending to public firms. We do not adjust forreclassifications.

55
020
4060
8010
0bn
EU
R
2005m1 2009m5 2011m12 2014m5
Domestic Foreign
(A) Non-public security holdings
020
4060
8010
0bn
EU
R
2005m1 2009m5 2011m12 2014m5
Domestic Foreign
(B) Equity holdings
FIGURE 7: Non-equity, non-public security holdings (left panel) and equity holdings(right panel). Solid line are domestic institutions; dashed line are foreign MFI’s.
increase steadily throughout the crisis period, peaking in early 2012 rightafter the 3-year LTRO’s. From then onwards, the path follows the downwardtrend of assets and lending, reflecting the generalized deleveraging processexperienced by the Portuguese banking system.
Interestingly enough, equity holdings rise during this period, in spite ofmuch smaller magnitudes. Overall, these two panels illustrate a significantincrease in the importance of non-traditional banking activities by domesticinstitutions. The share of security and equity holdings on assets for domesticbanks rises from around 11% to 27% throughout the sample, while for foreigninstitutions it oscillates between 10% and 20%, with no clear trend.
Public Debt Holdings
Given that our sample includes the European sovereign debt crisis, we devotea separate section to analyzing the public debt holdings of MFI’s. It is wellknown that domestic public debt was subject to intense repatriation in theperiphery countries that were hit the hardest by the crisis.14
Figure 8 plots the evolution of total holdings of public debt in the leftpanel. Both domestic and foreign banks experience a very significant increaseof their holdings starting in early 2009. However, foreign banks peak at8.8 bn in April 2010, on the eve of the Greek bailout request, and reducetheir holdings thereafter. Domestic banks keep increasing their holdings ofgovernment debt throughout, even after they start deleveraging. The rightpanel plots the evolution of Portuguese government debt, and reveals that
14. There is a vast literature trying to explain the causes behind the sharp increase indomestic holdings of sovereign debt during the crisis. Several authors have proposed differentexplanations for this phenomenon, among them Acharya and Steffen (2015), Gennaioli et al.(2014), Brutti and Sauré (2014), Becker and Ivashina (2014) and Crosignani (2015).

560
1020
3040
bn E
UR
2005m1 2009m5 2011m12 2014m5
Domestic Foreign
(A) Total Government debt holdings
010
2030
40bn
EU
R
2005m1 2009m5 2011m12 2014m5
Domestic Foreign
(B) Portuguese Government debt holdings
FIGURE 8: Public debt holdings (left panel) and Portuguese public debt holdings (rightpanel). Solid line are domestic institutions; dashed line are foreign MFI’s.
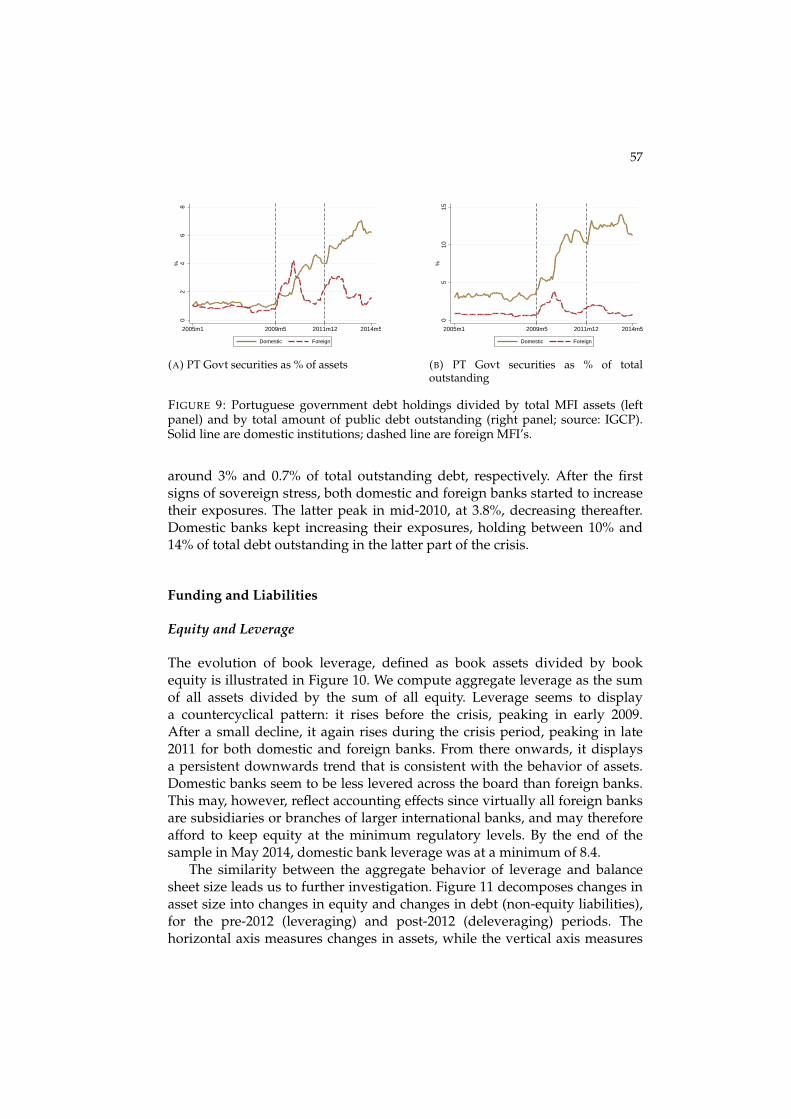
most of the increase in total holdings is related to domestic debt, consistentwith the repatriation phenomenon. In fact, in the early parts of the sample,domestic banks devote around 60% of their government debt portfolio todomestic debt. This share increases steadily during the crisis period, peakingat 91% in early 2012 and then stabilizing around 82%. Foreign banks holdmuch smaller portfolios of both total and Portuguese government debt. Thedifference in exposures is reported in the left panel of Figure 9, which plotstotal holdings of Portuguese government debt as a percentage of assets. Itpeaks in 2010 for foreign banks at around 4% of their balance sheets, while itsteadily increases to around 7% for domestic banks.15
To further illustrate the repatriation phenomenon, we also plot totaldomestic bond holdings as a percentage of total outstanding public debtissued by the Portuguese government in the right panel of Figure 9.16
This confirms that a substantial part of total outstanding public debt wasrepatriated during both the crisis and deleveraging periods. Before the crisis,the shares held by both domestic and foreign banks were very stable, at
15. In an unreported analysis, we analyze the evolution of exposures of domestic and foreigninstitutions to other euro area countries that experienced stress in sovereign debt markets:Italy, Ireland, Greece and Spain. We note that the magnitudes are extremely small, especiallycompared with those that correspond to holdings of Portuguese government debt. Whileholdings increase rapidly after the onset of the crisis, they actually decrease throughout mostof the crisis period, only to rapidly increase again in 2012, after most sovereign debt marketshad experienced some relative stabilization due to the ECB’s policy responses.16. This should be read as an underestimate of the total shares owned by the institutions in oursample, since we are comparing book values (numerator) to face values (denominator). As longas yields are positive – and particularly when yields are high as in the period under analysis– book values will underestimate total exposures of entities to the sovereign. While we couldhad applied some correction, such as adjusting outstanding face values by a weighted averageof contemporary yields across different maturities, this would nevertheless be an imperfectadjustment. For that reason we simply present this raw measure.
57
02
46
8%
2005m1 2009m5 2011m12 2014m5
Domestic Foreign
(A) PT Govt securities as % of assets
05
1015
%
2005m1 2009m5 2011m12 2014m5
Domestic Foreign
(B) PT Govt securities as % of totaloutstanding
FIGURE 9: Portuguese government debt holdings divided by total MFI assets (leftpanel) and by total amount of public debt outstanding (right panel; source: IGCP).Solid line are domestic institutions; dashed line are foreign MFI’s.
around 3% and 0.7% of total outstanding debt, respectively. After the firstsigns of sovereign stress, both domestic and foreign banks started to increasetheir exposures. The latter peak in mid-2010, at 3.8%, decreasing thereafter.Domestic banks kept increasing their exposures, holding between 10% and14% of total debt outstanding in the latter part of the crisis.
Funding and Liabilities
Equity and Leverage
The evolution of book leverage, defined as book assets divided by bookequity is illustrated in Figure 10. We compute aggregate leverage as the sumof all assets divided by the sum of all equity. Leverage seems to displaya countercyclical pattern: it rises before the crisis, peaking in early 2009.After a small decline, it again rises during the crisis period, peaking in late2011 for both domestic and foreign banks. From there onwards, it displaysa persistent downwards trend that is consistent with the behavior of assets.Domestic banks seem to be less levered across the board than foreign banks.This may, however, reflect accounting effects since virtually all foreign banksare subsidiaries or branches of larger international banks, and may thereforeafford to keep equity at the minimum regulatory levels. By the end of thesample in May 2014, domestic bank leverage was at a minimum of 8.4.
The similarity between the aggregate behavior of leverage and balancesheet size leads us to further investigation. Figure 11 decomposes changes inasset size into changes in equity and changes in debt (non-equity liabilities),for the pre-2012 (leveraging) and post-2012 (deleveraging) periods. Thehorizontal axis measures changes in assets, while the vertical axis measures

58
810
1214
1618
Ass
ets
/ Equ
ity
2005m1 2009m5 2011m12 2014m5
Domestic Foreign
FIGURE 10: Book leverage, defined as total assets divided by total equity. Solid line aredomestic institutions; dashed line are foreign MFI’s.
changes both in debt and in equity. Each bank is associated with two dots, onefor debt and one for equity. The left panel shows that: (i) most banks increasedtheir balance sheet size prior to 2012; (ii) most of this increase in size wasfinanced with debt. From the right panel, we observe that the deleveraging inthe post-LTRO period was also undertaken mostly through changes in debt,but we also see more equity movements in this stage. In fact, the fitted linefor changes in equity has a negative slope, illustrating the fact that banksdecided not only to decrease their levels of debt, but also increased their equitylevels. This behavior, as well as the broader trends in leverage that we observe,is intrinsically linked with the impositions of the Economic and FinancialAssistance Programme established by national authorities and internationalinstitutions, which we analyze further in the last section.
Deposits
As with any system based on commercial banks, the dominant source offunding for Portuguese MFI’s are deposits: on average, 72% of assets fordomestic and 78% of assets for foreign institutions. Figure 12 plots theevolution of total deposits. The path of leveraging and deleveraging is againevident, with deposits rising until attaining a peak of 308.7 bn for domesticbanks in early 2011, and 106.4 bn for foreign banks in late 2010. Interestingly,deposits seem to peak before the deleveraging process starts in early 2012.
Figure 13 decomposes the evolution of deposits by counterparty: MFI’s(excluding central banks), non-financial privates (non-financial firms andhouseholds), and domestic government entities. Deposits by MFI’s ondomestic banks start declining at the onset of the crisis, consistent with the

59
-25
-20
-15
-10
-50
510
15
-25 -20 -15 -10 -5 0 5 10 15Change in Assets (bn EUR)
Chg in Equity Chg in Debt
Cha
nge
in D
ebt a
nd E
quity
(bn
EU
R)
(A) Pre-vLTRO balance sheet evolution
-25
-20
-15
-10
-50
510
15
-25 -20 -15 -10 -5 0 5 10 15Change in Assets (bn EUR)
Chg in Equity Chg in Debt
Cha
nge
in D
ebt a
nd E
quity
(bn
EU
R)
(B) Post-vLTRO balance sheet evolution
FIGURE 11: Changes in asset size (horizontal axis) vs. changes in equity and non-equity liabilities (vertical axis) between July 2009 and December 2011 (left panel) andDecember 2011 and May 2014 (right panel). Circles are changes in equity, diamondsare changes in non-equity liabilities.
5010
015
020
025
030
0bn
EU
R
2005m1 2009m5 2011m12 2014m5
Domestic Foreign
FIGURE 12: Deposits, all maturities and counterparties (excluding ECB). Solid line aredomestic institutions; dashed line are foreign MFI’s.
claim that domestic institutions were shut from international money andfunding markets at the first signs of sovereign stress. They keep decliningeven after early 2012, at which stage it is not clear if the decline is driven bypersistence of exclusion from money markets, or by intentional deleveraging.Evidence for the exclusion hypothesis is strengthened by observing thatdeposits by private non-financial agents were increasing, and then stablethroughout the crisis and latter parts of the sample. If intentional deleveragingwere the explanation, we would expect to see declines in deposits by bothMFI’s and non-MFI’s after 2012, which is not the case.

600
5010
015
0bn
EU
R
2005m1 2009m5 2011m12 2014m5
Domestic Foreign
(A) Deposits by MFI’s
050
100
150
bn E
UR
2005m1 2009m5 2011m12 2014m5
Domestic Foreign
(B) Private deposits by non-financial pri-vates
05
1015
bn E
UR
2005m1 2009m5 2011m12 2014m5
Domestic Foreign
(C) Deposits by Government
FIGURE 13: Deposits (at all maturities) whose counterparties are MFI’s (excludingcentral banks, top left), private non-financial agents (non-financial firms andhouseholds, top right), and the Portuguese government (bottom). Solid line aredomestic institutions; dashed line are foreign MFI’s.
For foreign banks, deposits by MFI’s kept increasing and peaked in themidst of the crisis. This suggests that due to their subsidiary status of largeinternational banks, they were still able to access international money marketswhile domestic entities were excluded.
We further decompose private sector deposits by nationality of thecounterparty in Figure 14. The left panel plots deposits owned by the domesticprivate sector (including financials), and the path is very similar to thatof assets. The right panel shows deposits owned by foreign private agents(including financials), and illustrates the slow-moving capital flight thattook place starting in early 2009: in the early part of the sample, foreigncounterparties accounted for 43% of total deposits in domestic institutions, butthis figure was equal to 14% by the end of the sample. The decline was alsosubstantial for foreign entities, from 63% to 34%. This is consistent with thebroader trend of slow-moving capital flight dynamics that were experiencedby other countries under sovereign stress.

61
040
8012
016
020
0bn
EU
R
2005m1 2009m5 2011m12 2014m5
Domestic Foreign
(A) Deposits by domestic private sector
040
8012
016
020
0bn
EU
R
2005m1 2009m5 2011m12 2014m5
Domestic Foreign
(B) Deposits by foreign private sector
FIGURE 14: Deposits owned by the domestic private sector (left panel) and the foreignprivate sector (right panel). The private sector includes financial firms, non-financialfirms and households. Solid line are domestic institutions; dashed line are foreignMFI’s.
Securitized Funding
We also analyze other sources of funding, namely those that rely onsecurity and capital markets. Figure 15 plots securities issued and non-centralbank repurchase agreements,17 and presents further evidence of increasingsecuritization. Domestic banks started to increasingly rely on non-depositsources of funding starting in mid-2007: the share of funding obtained fromsecurity issuance goes from 6% in the early sample to a peak 24% aroundearly 2012 for domestic banks. It is visible that after rapid growth, issuanceof securities stabilizes during the financial crisis, and then declines during thedeleveraging period. Securitized funding oscillates between 6%-18% with noclear trend for foreign banks. These firms can finance themselves indirectlythrough their parent companies, but since they can either receive loans(deposits) or issue securities that are purchased by the parents, it is not clearif we should expect them to display higher or lower average shares of non-deposit funding.
17. Non-central bank repurchase agreements is a very minor component.

62
020
4060
8010
0bn
EU
R
2005m1 2009m5 2011m12 2014m5
Domestic Foreign
FIGURE 15: Total securities issued plus repurchase agreements whose counterparty isnot a central bank. Solid line are domestic institutions; dashed line are foreign MFI’s.
Domestic and Foreign Exposures
As mentioned, our dataset contains information on the nationality of thecounterparties for each asset category and each bank. In this section, westudy the evolution of exposures of domestic and foreign banks to differentgeographical areas. To maintain the analysis parsimonious, we focus on threecategories for counterparties’ nationalities: domestic (Portugal), non-domesticEconomic and Monetary Union (EMU) and non-EMU.
Assets
Total asset exposures are presented in Figure 16. The vast majority ofexposures are towards domestic counterparties, and this fact did not changemuch throughout the sample. On average, 81% of the total value of assetsof domestic banks consists of exposures to domestic counterparties, and thisshare experiences a slight upward trend towards the end of the sample (almost86% in May 2014). This pattern is even stronger for foreign banks: 62% of totalassets had domestic counterparties in the beginning of the sample, and thisshare had grown to 77% by the end.
For domestic banks, EMU (non-domestic) and non-EMU counterpartiespresent roughly equal shares. For foreign banks, there is virtually no exposureto non-EMU counterparties in the early stages of the sample, but theybecome progressively more important. Exposures to non-domestic EMUcounterparties are naturally high, since many of these banks are subsidiariesof large banks headquartered within the euro area.

63
200
250
300
350
400
450
bn E
UR
2005m1 2009m5 2011m12 2014m5
Non-EMU EMU Portugal
(A) Domestic banks
4060
8010
012
014
0bn
EU
R
2005m1 2009m5 2011m12 2014m5
Non-EMU EMU Portugal
(B) Foreign banks
FIGURE 16: Total asset exposures by geographical area for domestic banks (left panel)and foreign banks (right panel).
Figures 17 and 18 plot lending exposures to the private sector. Thefirst set of panels account for domestic and foreign exposures to the non-financial private sector (lending to firms and households), while Figure 18present lending to MFI’s. Lending to the non-financial private sector isoverwhelmingly domestic: on average 97% for domestic banks and 96% forforeign banks. Lending to the monetary financial sector is, as we wouldexpect, more diversified in terms of counterparty nationalities: for domesticbanks, the shares of lending to domestic, EMU and non-EMU are roughlyequal in the early sample. EMU lending gains some relevance which isthen lost for the latter parts of the sample, as domestic banks lose accessto European funding markets.18 Regarding foreign institutions, most of thelending is overwhelmingly undertaken towards EMU counterparties in theearly sample, but this changes substantially as non-EMU counterpartiesbecome large recipients of lending in the latter sample. The role of lending todomestic MFI’s is limited. Most of this lending seems to be directed towardsthe country of the parent bank. The overall trends and magnitudes seemto suggest that there is very little integration in terms of financial lendingbetween domestic and foreign institutions.
Finally, we look at securities and equity holdings in Figure 19. Whileexposures are again overwhelmingly domestic, EMU counterparties aresubstantially more relevant than non-EMU, unlike the previous assetcategories. Domestic banks’ exposure to EMU security and equity holdingsincreased both before and during the crisis period. Foreign banks decreasesubstantially their exposure to EMU counterparties, and increased theirexposures to domestic ones.
18. See Saldanha (2014) for a detailed analysis on the interbank money market for thePortuguese banking system.

6414
018
022
0
bn E
UR
2005m1 2009m5 2011m12 2014m5
Non-EMU EMU Portugal
(A) Domestic banks
3040
5060
70
bn E
UR
2005m1 2009m5 2011m12 2014m5
Non-EMU EMU Portugal
(B) Foreign banks
FIGURE 17: Lending to the non-financial private sector exposures by geographical areafor domestic banks (left panel) and foreign banks (right panel).
1020
3040
5060
bn E
UR
2005m1 2009m5 2011m12 2014m5
Non-EMU EMU Portugal
(A) Domestic banks
010
2030
bn E
UR
2005m1 2009m5 2011m12 2014m5
Non-EMU EMU Portugal
(B) Foreign banks
FIGURE 18: MFI lending exposures by geographical area for domestic banks (leftpanel) and foreign banks (right panel).
050
100
150
bn E
UR
2005m1 2009m5 2011m12 2014m5
Non-EMU EMU Portugal
(A) Domestic banks
510
1520
2530
bn E
UR
2005m1 2009m5 2011m12 2014m5
Non-EMU EMU Portugal
(B) Foreign banks
FIGURE 19: Securities and equities exposures by geographical area for domestic banks(left panel) and foreign banks (right panel).

65
100
200
300
400
500
bn E
UR
2005m1 2009m5 2011m12 2014m5
Non-EMU EMU Portugal
(A) Domestic banks
4060
8010
012
014
0
bn E
UR
2005m1 2009m5 2011m12 2014m5
Non-EMU EMU Portugal
(B) Foreign banks
FIGURE 20: Total liability (including capital) exposures by geographical area fordomestic banks (left panel) and foreign banks (right panel).
Liabilities
Figure 20 plots total exposures for MFI liabilities (including capital). Thegeneral patterns mirror those of assets: domestic banks have predominantlydomestic exposures, and there is a trend towards repatriation of their fundingin the latter part of the sample. Funding by foreign banks is also mostlydomestic but less so than their asset exposure, evidencing a “nationalitymismatch” in their balance sheet. This may reflect not only foreign ownership,but also easier access to international funding markets through their parents.
In Figures 21 and 22 we plot the exposure of banks to differentcounterparties in terms of their deposit liabilities. The first set of figures plotsnon-financial private deposits (non-financial firms and households), whilethe second set plots MFI deposits (excluding central bank). As with lending,non-MFI deposits exposure of domestic banks is predominantly domestic,and this does not change over the sample. The same is not true for foreignbanks, who have a substantial share of deposits by EMU private agents inthe early sample, but which collapses at the onset of the crisis. RegardingMFI deposits, as with lending, there is much more diversification. Consistentwith the evidence that domestic and foreign institutions do not seem toparticipate in the same interbank market, exposure to domestic counterpartiesis greater for domestic banks. The largest share of MFI funding for domesticbanks belongs, however, to non-EMU countries. This, as well as relianceon EMU MFI funding, drops significantly during the crisis, and does notrecover during the deleveraging period. Thus the funding base for MFIdeposits in domestic banks changes from being predominantly internationalto predominantly domestic. Foreign banks are primarily exposed to depositsfrom non-domestic EMU MFI’s. The importance of both domestic and non-EMU counterparties also increases throughout the sample period.

6690
115
140
bn E
UR
2005m1 2009m5 2011m12 2014m5
Non-EMU EMU Portugal
(A) Domestic banks
1520
2530
35
bn E
UR
2005m1 2009m5 2011m12 2014m5
Non-EMU EMU Portugal
(B) Foreign banks
FIGURE 21: Non-financial deposit exposures by geographical area for domestic banks(left panel) and foreign banks (right panel).
050
100
150
bn E
UR
2005m1 2009m5 2011m12 2014m5
Non-EMU EMU Portugal
(A) Domestic banks
020
4060
80
bn E
UR
2005m1 2009m5 2011m12 2014m5
Non-EMU EMU Portugal
(B) Foreign banks
FIGURE 22: MFI deposit exposures by geographical area for domestic banks (leftpanel) and foreign banks (right panel).
Finally, we look at other measures of wholesale funding in Figure 23:securities issued. For domestic banks, foreign exposures are negligible. Thismay suggest that the rise in securitization and financial sophistication offunding instruments was a structural process, and not driven by foreigndemand. For foreign banks, the exposure is also mostly domestic, and themagnitudes are relatively small. This is consistent with the notion that largerbanks tend to employ this sort of alternative non-deposit instruments forfunding purposes, and most foreign banks in our sample are relatively smalland have alternative funding sources.

67
2040
6080
100
bn E
UR
2005m1 2009m5 2011m12 2014m5
Non-EMU EMU Portugal
(A) Domestic banks
46
810
1214
bn E
UR
2005m1 2009m5 2011m12 2014m5
Non-EMU EMU Portugal
(B) Foreign banks
FIGURE 23: Funding security exposures by geographical area for domestic banks (leftpanel) and foreign banks (right panel).
Policy during the Crisis
In this section, we describe the main policy initiatives taken during thecrisis, and comment on their impact on the balance sheets of Portugueseintermediaries.
Monetary Policy
Description of Liquidity Providing Operations. The main instrument ofmonetary policy of the ECB are the main refinancing operations (MRO), whichconsist of collateralized lending to MFI’s, typically at a weekly maturity.The ECB supplements the MRO’s with longer-term refinancing operations(LTRO’s), which have a typical maturity of three months. In response to theglobal financial and European sovereign debt crises, the ECB adopted severalunconventional monetary policies which we will discuss briefly and which aredescribed in more detail in Banco de Portugal (2015b). We focus on liquidityproviding operations to banks and do not analyze the impact of the assetpurchase programmes, which involved direct participation in capital markets.
Evolution of Central Bank Funding. The importance of Eurosystem funding forthe Portuguese monetary financial system increased significantly during thesovereign debt crisis. Figure 24 plots total borrowing from the Eurosystem inthe left panel. In the beginning of the sample, borrowing from the Eurosystemwas virtually zero for domestic institutions. During the first half of 2007, thetotal banking system had a monthly average of 288 million euros borrowed atthe central bank. Borrowing then significantly increased upon the first signsof global financial stress in the summer of 2007.
In April 2008, the ECB launched LTRO’s at a 6-month maturity, and thesebecame monthly operations after November of that year. Additional LTRO’s

68
with 1-year maturities were announced in the following year. Intensificationof financial stress in the summer of 2008 led to another increase in borrowing.In October 2008, the ECB changed its approach towards liquidity provision inall of its operations, switching from a system based on variable rate tenders toa fixed rate full allotment procedure (FRFA). Under variable rate tenders, theECB would typically offer a certain amount of liquidity, and the combinationof central bank supply and bank demand (through a bidding process) woulddetermine the interest rate. Under a FRFA system, the ECB sets an interest ratebeforehand and offers to provide all liquidity demanded by banks as long asthey post sufficient collateral. Collateral eligibility rules were also expandedto encompass additional classes of assets.
The combination of these policy changes with the financial events led notonly to an increase in total borrowing, but also to a significant jump in thenumber of borrowers. Figure 26 plots the number of banks borrowing fromthe Eurosystem, classified according to the nationality criterion. Until mid-2008, no more than 10 institutions were borrowing. By late 2008, as fundingmarkets tightened, the number of borrowers increased significantly: from10 in September to 15 in October, as more banks were now able to accessfunding at a given price and the only effective constraint they faced wastheir own pool of collateral. Borrowing increased gradually until early 2010,when Portuguese institutions started facing serious difficulties in accessinginternational funding markets and Greece’s economic situation deteriorated.In April 2010, the Greek government formally requested internationalfinancial assistance, and the impact on the Portuguese financial sector wassubstantial. Portuguese MFI’s were essentially excluded from internationalfunding markets, and in just the three months between April and July 2010,total Eurosystem borrowing increased from about 17.7 bn to 49.2 bn euros. Forforeign institutions, this increase in borrowing was temporary. The right panelof Figure 24 plots Eurosystem borrowing as a percentage of total funding:during this short period of time, funding jumped from less 5% to around 10%of total funding for domestic banks.
In December 2011, the ECB announced that it would undertake twoallotments of LTRO’s at the unprecedented maturity of 3 years, the so-calledvery long-term refinancing operations (vLTRO).19 Both foreign and domesticbanks took advantage of this long-term Eurosystem funding. In Figure 25we plot short-term (less than 2 years, left panel) and long-term (more than2 years, right panel) borrowing from the Eurosystem. These 3-year LTRO’swere the only instances in our sample when the Eurosystem lent at maturitieslonger than 2 years.20 At the time of these interventions, short-term funding
19. The vLTRO interventions, as well as their impact on bank portfolio choice, are described indetail in Crosignani et al. (2015).20. After the end of our sample, the ECB launched Targeted LTRO’s with maturities up to 4years.

69
collapsed and was replaced with longer-term borrowing. Together with Figure24, this provides evidence that the December 2011 allotment was composedmostly of rollover of short-term funding, while the second allotment, inFebruary 2012 involved both rollover and some new net borrowing. Severalreasons can explain the increase in net borrowing at the second allotment,including the accumulation of more collateral in the form of marketable assetsduring the two allotments, and the introduction of the additional credit claims(ACC) framework. This consisted in a temporary expansion of the classes ofassets that were eligible as collateral for Eurosystem credit operations, andthe specific criteria were under the discretion of national central banks.21
These ACCs were initially announced at the same time as the vLTRO’sin December 2011, but the specific rules detailing their usage were onlypublished by the BdP on 9 February 2012 (Banco de Portugal 2012). Portfoliosof mortgage-backed loans and other loans to households, as well as of loans tonon-financial corporations became increasingly pledgeable as collateral. TheACCs consisted of a positive shock to the collateral pools of banks, helpingthem increase their total borrowing at the time of the second allotment.Additionally, foreign banks who might have previously borrowed indirectlythrough their EMU-based parent entities abroad were now endowed witha competitive advantage in terms of Eurosystem borrowing, as they couldpost collateral that was perhaps not eligible under the rules set by thenational central banks in their parents’ countries of origin. Indeed, whilethe number of domestic borrowers remains constant through the secondallotment, the number of foreign borrowers increases. After this period,Eurosystem borrowing remained relatively stable at around 10% of assets.
Who doesn’t borrow from the Eurosystem? Our sample of MFI’s includesthe universe of institutions subject to minimum reserve requirements bythe Eurosystem.22 Only institutions that are subject to these requirementsare eligible to become counterparties of the Eurosystem’s monetary policyoperations.23 Although every institution in our sample with the exceptionof money market funds is, in principle, eligible for borrowing from theEurosystem, not many entities actually access the liquidity providingoperations. Figure 26 shows that the number of borrowers at any momentin time is relatively small. Until mid-2008, no more than 10 institutions wereborrowing. As mentioned previously, the number of institutions borrowing
21. This framework allowed for riskier non-marketable assets to be posted as collateral,provided that the collateral risk was assumed by the national central banks. The BdP alsointroduced stricter risk control measures.22. It also includes money market funds, which are not subject to these requirements. Inaddition, the full list of MFI’s includes the central bank, whose balance sheet we do not analyzein this article.23. There are also other criteria that are mostly operational, as well as criteria that are relatedto the national supervisor’s assessment of the financial soundness of the MFI. See ECB (2011).

700
1020
3040
50bn
EU
R
2005m1 2009m5 2011m12 2014m5
Domestic Foreign
(A) Central Bank funding
05
1015
%
2005m1 2009m5 2011m12 2014m5
Domestic Foreign
(B) Central Bank funding as a % of totalfunding
FIGURE 24: Total Eurosystem funding (left panel) and as a percentage of total funding(excluding equity, right panel). Solid line are domestic institutions; dashed line areforeign MFI’s.
010
2030
4050
bn E
UR
2005m1 2009m5 2011m12 2014m5
Domestic Foreign
(A) Short-Term CB funding
010
2030
4050
bn E
UR
2005m1 2009m5 2011m12 2014m5
Domestic Foreign
(B) Long-Term CB funding
FIGURE 25: Eurosystem funding at short maturity (<2 years, left panel) and at longmaturity (>2 years, right panel). Solid line are domestic institutions; dashed line areforeign MFI’s.
first increases to 15 in October 2008 and then to 23 after the vLTROs. By theend of the sample, 25 out of 65 potentially eligible institutions access centralbank funding.
Central bank funding was unprecedentedly attractive during thesovereign debt crisis, yet dozens of entities did not access the operations.In addition to the other requirements, an institution has to be registered atthe BdP to actually be eligible as a counterparty. The number of registeredentities is larger than the number of institutions actually borrowing from theEurosystem, but smaller than the number of potentially eligible entities. Thismeans that there are three groups of institutions: (i) those registered at theBdP and borrowing from the Eurosystem; (ii) registered at the BdP but not

71
020
4060
80N
umbe
r of
Inst
itutio
ns
2005m1 2009m5 2011m12 2014m5
Foreign not borrowing Domestic not borrowingForeign borrowing Domestic borrowing
FIGURE 26: Number of MFI’s (except money market funds) with liabilities whosecounterparty is the Eurosystem.
accessing the operations; (iii) not registered at the BdP and thus not eligiblefor the operations.
The primary reason why an institution may find itself in group (ii), i.e.registered as an eligible counterparty but not accessing any operations, isrelated to the need of settling central bank reserve accounts at the end ofevery business day. If, at the end of the business day, bank A owes anymoney to bank B, it automatically borrows from the Eurosystem to settle thisaccount. For this to happen, bank A needs to be registered at the BdP andto hold a collateral pool that may be pledged for this borrowing. When aninstitution in group (iii), not registered as an eligible counterparty at the BdP,finds itself in such situation it must either set up an account at a paymentsystem that is never over-drafted or, alternatively, use the payment systemof a larger entity (possibly its parent) for settlement. Even if accessing theoperations involves relatively few direct pecuniary costs (such as fees), thereare possibly other fixed costs that are related to the know-how that is requiredto deal with Eurosystem operations (such as having to hire specialized staff,etc.). For smaller banks in categories (ii) and (iii), these costs may exceed thepenalties and premia that they pay for using other sources of funding or theinfrastructure and credit of larger banks. This may explain why they do notaccess the operations.
Another possibility is that banks with particularly specialized businessmodels may prefer to obtain funding from other sources due to the highopportunity cost of holding eligible collateral (such as marketable assets likegovernment bonds). However, the BdP greatly expanded the eligibility ofnon-marketable assets to be used as collateral with the introduction of theACCs in February 2012. From that date onwards, even banks with very

72
July 2010 March 2012 May 2014Borrows? Yes No Yes No Yes No
No. of banks 20 54 23 45 25 40Mean Assets 25.3 0.9 23.3 1.0 18.5 0.7Median Assets 9.2 0.3 3.8 0.4 3.3 0.4
Securities 0.27 0.11 0.31 0.22 0.32 0.20Equities 0.05 0.03 0.05 0.02 0.07 0.02Govt 0.05 0.01 0.06 0.01 0.07 0.05
Dom. Govt 0.03 0.01 0.05 0.01 0.05 0.05Lending 0.66 0.83 0.61 0.73 0.60 0.75
Individuals 0.26 0.23 0.25 0.17 0.27 0.21Firms 0.22 0.28 0.20 0.22 0.20 0.26MFI 0.12 0.25 0.12 0.23 0.11 0.23
Other Assets 0.07 0.06 0.08 0.05 0.08 0.05Deposits 0.60 0.83 0.59 0.82 0.58 0.77
MFI 0.27 0.58 0.25 0.53 0.20 0.46Private 0.30 0.19 0.30 0.21 0.35 0.24
Eurosystem 0.10 0.00 0.11 0.00 0.09 0.00Securities + Repo 0.19 0.02 0.19 0.04 0.18 0.04Other Liab. 0.04 0.04 0.05 0.02 0.05 0.05Equity 0.08 0.11 0.07 0.11 0.11 0.14
TABLE 1. Asset-weighted average balance sheet composition for MFI’s (excludingmoney market funds) according to whether they borrowed from the Eurosystem inthat period or not for July 2010, March 2012 and May 2014. Mean and median assetsare in billion euros, while all balance sheet categories are expressed as a fraction of totalassets. The additional levels of disaggregation of balance sheet categories (indented)are not exhaustive.
specialized business models could use assets such as specialized forms ofcredit to businesses and households as eligible collateral for Eurosystem creditoperations. Even in the presence of very high haircuts (exceeding 75% in somecases), this was still advantageous since this sort of non-marketable collateralwould most likely not be accepted by counterparties in financial markets.The costs associated with pledging these assets as collateral and complyingwith the risk requirements were low. Given the expansion of central bankfunding and collateral eligibility, banks that were not accessing central bankfunding were likely not in need of funds, or found it more advantageousto obtain funds through larger MFI’s. Table 1 shows the asset-weightedaverage balance sheets for Eurosystem borrowers and non-borrowers in threedifferent months: July 2010, right after the large large three-month increase inborrowing of mid-2010; March 2012, after the second allotment of the vLTRO;and May 2014, the last month of the sample. Non-borrowers are smaller, holdless securities, lend more to MFI’s and to firms, borrow more from MFI’s, holdless private sector deposits, issue less securities and have more equity.

73
Financial Assistance Policies
State Guarantees. In October 2008, in response to the international moneymarket freeze, the Portuguese government created a fund to provide creditguarantees to debt issuances by Portuguese depository institutions. This fundreceived 20 bn euros. Later, as part of the assistance programme, the value ofthe fund was raised to 35 bn euros.
Recapitalization Fund. In May 2009, the Portuguese government launcheda bank recapitalization scheme aimed at helping banks implement the BdP’srecommendation of establishing a Core Tier 1 ratio above 8%. Four billioneuros were initially allocated to this program. The international assistanceprogramme raised the value of the fund to 12 bn euros by April 2011; therequirement increased to 9% by the end of 2011 and to 10% by the of 2012.By mid-2012, two of the four largest banks were relying on this fund,24 whileCaixa Geral de Depósitos (which is state-owned) received 1.6 bn euros directlyfrom the government (European Commission 2014). The left panel of Figure 27plots non-deposit liabilities and capital whose counterparty is the Portuguesegovernment.25 Foreign banks never participated in the fund, while the bulk ofdomestic participation occurs precisely in June 2012. To give some perspective,the right panel plots funding (liabilities and capital) whose counterparty isthe government as a percentage of total funding. During the deleveragingperiod, government funding in domestic banks accounted for around 5% oftotal liabilities and equity.26
Economic and Financial Assistance Programme. In May 2011, the Portugueseauthorities along with the European Union and the International MonetaryFund agreed to a three-year Economic and Financial Assistance Programmeamidst restricted access to international financial markets for both thesovereign and the banking sector. One of the three pillars to the programmewas the stability of the financial system. There were three main concerns:liquidity risks, recapitalization needs and high bank leverage. Many policieswere adopted during the programme.27
Liquidity concerns decreased thanks to Eurosystem funding andimproved market sentiment, which also allowed bond issuance by banks.Bank solvency had also improved beyond the minimum levels required by theBdP that were described earlier. Solvency conditions later declined, however,
24. These were Banco Comercial Português and BPI. BANIF accessed this fund later, in 2013.25. A large part of the recapitalization fund was employed in hybrid instruments such asconvertible debt and preferred stock that could be counted as equity for regulatory purposes.This served the dual purposes of providing liquidity and allowing banks to more easily satisfyregulatory requirements such as capital ratios.26. This understates of the total impact of the government in the Portuguese banking sector,since it is the sole owner of Caixa Geral de Depósitos, Portugal’s largest bank.27. For a comprehensive list, see Banco de Portugal (2015a).

740
510
15bn
EU
R
2005m1 2009m5 2011m12 2014m5
Domestic Foreign
(A) Government funding
01
23
45
%
2005m1 2009m5 2011m12 2014m5
Domestic Foreign
(B) Government funding as a % of totalfunding
FIGURE 27: Non-deposit liabilities (incl. equity) whose counterparty is the Portuguesegovernment (left panel) and share of total liabilities (incl. deposits and equity) whosecounterparty is the Portuguese government as a fraction of assets (right panel).
due to provisioning undertaken ahead of the ECB stress tests in the late partof our sample. In addition, the eight largest banking groups were ordered todecrease their loan-to-deposits ratio from more than 160% to 120% by the endof 2014,28 as well as to devise medium-term funding plans to be evaluatedby the banking authorities. The evolution of the loans-to-deposits ratio forthe entire system can be seen in Figure 28. We exclude lending and depositswhose counterparties are other MFI’s. The loans-to-deposits ratio is alwayshigher for foreign banks than for domestic banks. That is not surprising,since domestic banks are more likely to be financed by private deposits whileforeign banks are often financed by their parent MFI abroad. Measured bythis ratio, deleveraging actually began in mid-2010 and continued steadilythroughout the duration of the programme. European Commission (2014)considered it successful, as the loans-to-deposits ratio for the largest groupsreached 117% and the key driver behind the lower credit volumes was lowdemand, even if “there ha[d] been evidence of supply constraints”.
28. See Banco de Portugal (2011).

75
100
150
200
250
300
%
2005m1 2009m5 2011m12 2014m5
Domestic Foreign
FIGURE 28: Ratio between total lending (excluding lending to MFI’s) and total deposits(excluding deposits by MFI’s). Solid line are domestic institutions; dashed line areforeign MFI’s.
Conclusion
In this article we employed detailed balance sheet data for Portuguese MFI’sto describe some aspects of the evolution of the domestic monetary financialsystem during one of its most challenging periods in recent history. The broadtrends point towards a rapid expansion of balance sheets and leverage in theperiod leading up to the crisis, after which institutions start to downsize anddeleverage, likely as a result of a combination of regulatory pressure and pooreconomic conditions. As the largest component of balance sheets, lending hasalso followed this pattern – even if lending to households has been more stablethan lending to firms.
One of the most striking trends that we observe is the rise of securitizationand non-traditional banking activities on both sides of the balance sheet.Not only domestic banks have significantly increased their exposure tosecurities and equities, they have also increasingly become reliant on sourcesof funding other than deposits. We also document increasing exposures toPortuguese sovereign debt, consistent with the repatriation phenomenon thatis described by the literature. Regarding deposits, the crisis has broughtabout some significant changes in composition as domestic banks wereincreasingly isolated from wholesale funding markets and started to rely moreon retail funding, supplied by the non-financial private sector. The stabilityof non-financial private deposits is likely to have come as a consequenceof precautionary savings triggered by the deep recession. Banks have alsobecome increasingly dependent on the liquidity offered by the centralbank, much due to their isolation from international funding markets. Also

76
the government, through its recapitalization programmes, has become animportant source of funding for banks.
We have also analyzed the composition of the Portuguese banking sectorin terms of the nationality of both its participants and counterparties. Ourresults point towards increasing isolation during the crisis and deleveragingperiods, both with foreign institutions abandoning the country and domesticones interacting less and less with foreign counterparties.
While this article has been mostly descriptive, we hope that it hascontributed to highlight some trends and patterns that have emerged inrecent years. We believe this dataset to provide researchers with an excellentlaboratory in which to study several open questions related to banking,namely those related to the impact of sovereign risk on the financial system,or the impact of unconventional policies, monetary and fiscal, that wereimplemented during this period.
References
Acharya, Viral and Sascha Steffen (2015). “The Greatest Carry Trade Ever?Understanding Eurozone Bank Risks.” Journal of Financial Economics, 115,215–236.
Banco de Portugal (2009). Estatísticas de Balanço das Instituições FinanceirasMonetárias - Documento Metodológico.
Banco de Portugal (2011). “Explanatory note by Banco de Portugal: loan-to-deposit ratio in the context of the Portuguese Financial AssistanceProgramme.” http://www.bportugal.pt/en-US/OBancoeoEurosistema/
ComunicadoseNotasdeInformacao/Pages/combp20110930.aspx.Banco de Portugal (2012). “Press release of Banco de Portugal on the eligibility
criteria for additional credit claims as collateral in Eurosystem creditoperations.” http://www.bportugal.pt/en-US/OBancoeoEurosistema/
ComunicadoseNotasdeInformacao/Pages/combp20120209.aspx.Banco de Portugal (2015a). “Banking System Measures.”http://www.bportugal.pt/en-US/EstabilidadeFinanceira/
AEstabilidadeFinanceiraPAEF/MedidasEstabilidadeFinanceira/
Documents/Medidas_impacto_sistemabanc_historico_EN.pdf. Accessed:July 1st, 2015.
Banco de Portugal (2015b). Economic Bulletin - June 2015, chap. ECB’sUnconventional monetary policy: what has been done and did it work?Banco de Portugal.
Becker, Bo and Victoria Ivashina (2014). “Financial Repression in the EuropeanSovereign Debt Crisis.” Mimeo, Stockholm School of Economics andHarvard University.
Brutti, Filippo and Philip Ulrich Sauré (2014). “Repatriation of Debt in theEuro Crisis: Evidence for the Secondary Market Theory.” Working Papers

77
2014-03, Swiss National Bank.Crosignani, Matteo (2015). “Why Are Banks Not Recapitalized During
Crises?” Mimeo, New York University.Crosignani, Matteo, Miguel Faria-e-Castro, and Luís Fonseca (2015). “Central
Bank Interventions, Demand for Collateral, and Sovereign BorrowingCosts.” Mimeo, New York University and Banco de Portugal.
ECB (2011). The Implementation of Monetary Policy in the Euro Area.General Documentation on Eurosystem Monetary Policy Instruments andProcedures.
Ennis, Huberto M. (2001). “On the size distribution of banks.” EconomicQuarterly, (Fall), 1–25.
European Commission (2014). “The Economic Adjustment Programme forPortugal 2011-2014.” European Economy - Occasional Papers 202, EuropeanCommission.
Gennaioli, Nicola, Alberto Martin, and Stefano Rossi (2014). “SovereignDefault, Domestic Banks, and Financial Institutions.” The Journal of Finance,69(2), 819–866.
Janicki, Hubert P. and Edward S. Prescott (2006). “Changes in the sizedistribution of U.S. banks: 1960-2005.” Economic Quarterly, (Fall), 291–316.
Kashyap, Anil K. and Jeremy C. Stein (2000). “What Do a Million Observationson Banks Say about the Transmission of Monetary Policy?” AmericanEconomic Review, 90(3), 407–428.
Koetter, Michael (2013). “Market structure and competition in Germanbanking: Modules I and IV.” Working Papers 06/2013, German Council ofEconomic Experts.
Pagano, Marco and ESRB Advisory Scientific Committee (2014). “Is EuropeOverbanked?” mBank - CASE Seminar Proceedings 132, CASE-Center forSocial and Economic Research.
Saldanha, Ana Sofia (2014). “The unsecured interbank money market:A description of the Portuguese case.” Mimeo, Universidade CatólicaPortuguesa.
Wilson, J.O.S. and J.M. Williams (2000). “The size and growth of banks:evidence from four European countries.” Applied Economics, 32(9), 1101–1109.

78
Appendix A: Data Transformations
• Mutual Agricultural Credit Banks that are part of SICAM (SistemaIntegrado de Crédito Agrícola Mútuo; Integrated System of MutualAgricultural Credit) report consolidated data as entity ’9000 - CaixaCentral Cred Agric Mutuo’. This explains the difference between thenumber of MFI’s in our dataset and that in the list of institutions that aresubject to minimum reserve requirements as published by the ECB. SeeBanco de Portugal (2009).
• We merge "0022 - BANCO DO BRASIL - SUC. UE" with "9989 - B.BRASIL", since this is a change of code for the same institution.
• We eliminate all observations of institutions with assets less than 0.1million euros.
Appendix B: List of Institutions
Code Entity Foreign Parent Start date End date Type
0003 SANPAOLO IMI BANK X 2005/01 2011/01 Bank0007 BANCO ESPIRITO SANTO 2005/01 2014/05 Bank0008 BANCO BAI EUROPA X 2005/01 2014/05 Bank0010 BANCO BPI 2005/01 2014/05 Bank0012 BANCO BANIF COMERCIAL AÇORES 0038 2005/01 2008/12 Bank0014 BANCO INVEST 2005/01 2014/05 Bank0016 CREDIFIN BANCO 2005/01 2009/12 Bank0018 BANCO SANTANDER TOTTA X 2005/01 2014/05 Bank0019 BANCO BILBAO VIZ. ARGENTARIA X 2005/01 2014/05 Bank0022 BANCO DO BRASIL - SUC. UE29 X 2005/01 2014/05 Bank0023 BANCO ACTIVOBANK 0033 2005/01 2014/05 Bank0025 CAIXA - BANCO DE INVESTIMENTO 0035 2005/01 2014/05 Bank0027 BANCO PORTUGUES INVESTIMENTO 0010 2005/01 2014/05 Bank0029 BNP PARIBAS FORTIS - SUC. UE X 0034 2005/01 2013/06 Bank0031 B.INTER.CRÉDITO30 0007 2005/01 2005/11 Bank0032 BARCLAYS BANK - SUC. UE X 2005/01 2014/05 Bank0033 BANCO COMERCIAL PORTUGUES 2005/01 2014/05 Bank0034 BNP PARIBAS - SUC. UE X 2005/01 2014/05 Bank0035 CAIXA GERAL DE DEPOSITOS 2005/01 2014/05 Bank0036 CAIXA ECONOMICA MONTEPIO GERAL 2005/01 2014/05 Bank0038 BANIF - BANCO INTERN FUNCHAL 2005/01 2014/05 Bank0040 ROYAL BANK OF SCOTLAND X 2005/01 2010/10 Bank0043 DEUTSCHE BANK AG - SUC. UE X 2005/01 2014/05 Bank0046 BANCO POPULAR PORTUGAL X 2005/01 2014/05 Bank0047 BANCO ESP. SANTO INVESTIMENTO 0007 2005/01 2014/05 Bank0048 BANCO FINANTIA 2005/01 2014/05 Bank0049 BANCO INVEST. IMOBILIARIO 0033 2005/01 2014/05 Bank0055 C.E.EMP.COM.LIS 2005/01 2012/11 SavB31
0057 CAIXA ECONOMICA DO PORTO 2005/01 2014/05 SavB
29. Merged with 9989 - B. BRASIL.30. Merged with Banco Espírito Santo in late 2005.31. Legend: SavB - Savings bank; MACB - Mutual Agricultural Credit Bank; MMF - MoneyMarket Fund.

79
Code Entity Foreign Parent Start date End date Type
0058 CAIXA ECONOMICA SOCIAL 2005/01 2014/05 SavB0059 CAIXA ECON.MIS.ANGRA HEROISMO 2005/01 2014/05 SavB0060 BANCO MADESANT X 0018 2005/01 2014/05 Bank0061 BANCO INVESTIMENTO GLOBAL 2005/01 2014/05 Bank0063 BANIF - INVESTIMENTO 0038 2005/01 2014/05 Bank0064 BANCO PORTUGUES GESTAO 2005/01 2014/05 Bank0065 BEST - BANCO ELECTRÓNICO 0007 2005/01 2014/05 Bank0066 CAJA DE BADAJOZ, SUCURSAL X 2005/01 2005/11 Bank0067 BANCO RURAL EUROPA X 2005/01 2014/05 Bank0069 BANCO BANIF MAIS 0038 2005/01 2014/05 Bank0070 BANQUE PSA - SUC. UE X 2005/01 2014/05 Bank0073 BANCO SANTANDER CONSUMER X 0018 2005/01 2014/05 Bank0076 MONTEPIO INVEST 0036 2005/01 2014/05 Bank0078 BANCO MILLENNIUM BCP INVEST 0033 2005/01 2009/08 Bank0079 BANCO BIC PORTUGUES32 2005/01 2014/05 Bank0081 B.SANTANDER NEGÓCIOS X 0018 2005/01 2010/04 Bank0082 FCE BANK - SUC. UE X 2005/01 2014/05 Bank0085 ITAU BBA INTERNATIONAL-SUC. UE X 2005/01 2014/05 Bank0086 BANCO EFISA 0079 2005/01 2014/05 Bank0089 BANCO PRIVADO 2005/01 2010/04 Bank0090 BANKBOSTON X 2005/01 2006/09 Bank0092 CAIXA VIGO, OURENSE PONTEVEDRA X 2005/01 2011/08 Bank0097 CCAM CHAMUSCA 2005/01 2014/05 MACB0098 CCAM BOMBARRAL 2005/01 2014/05 MACB0099 BANCO CAJA S SORIA - SUC. UE X 2005/01 2014/05 Bank0156 BANCO POPULAR ESPAÑOL X 0046 2005/01 2006/12 Bank0158 COMMERZBANK INT - SUC FIN EXT X 2005/01 2011/11 Bank0160 BANCO ESPÍRITO SANTO AÇORES 0007 2005/01 2014/05 Bank0161 GE CAPITAL BANK X 2005/01 2007/11 Bank0162 BANQUE ACCORD X 2005/01 2007/03 Bank0166 SANTANDER FINANCE X 0018 2005/01 2007/01 Bank0168 BANKIA X 2005/01 2013/11 Bank0169 CITIBANK - SUC. UE X 2005/01 2014/05 Bank0170 NCG BANCO - SUC. UE X 2005/01 2014/05 Bank0171 RCI BANQUE - SUC. UE X 2005/01 2014/05 Bank0172 BMW BANK - SUC. UE X 2005/01 2014/05 Bank0173 B. PRIVEE ROTHSCHILD - SUC. UE X 2005/01 2014/05 Bank0183 AS PRIVATBANK - SUC. UE X 2007/09 2014/05 Bank0184 ANGLO IRISH BANK, SUCURSAL X 2007/01 2008/05 Bank0185 DEXIA SABADELL - SUC. UE X 2007/09 2014/05 Bank0186 BANQUE PRIVÉE - SUCURSAL 0007 2008/01 2014/05 Bank0188 BANCO BIC PORTUGUÊS33 X 2008/05 2013/04 Bank0189 BANCO PRIVADO ATLANTICO EUROPA X 2009/08 2014/05 Bank0235 BANCO L.J. CARREGOSA 2008/11 2014/05 Bank0240 HYPOTHEKENBANK - SUC. UE X 2005/01 2014/05 Bank0242 BNP PARIBAS WEALTH MANAGEMENT X 0034 2005/01 2012/11 Bank0243 HYPO REAL ESTATE X 2005/01 2005/12 Bank0244 GRUPO CAJATRES - SUC. UE X 2005/01 2014/05 Bank0246 BANCO PRIMUS X 2006/02 2014/05 Bank0254 ROYAL BANK SCOTLAND-SUCURSAL X 0040 2007/05 2011/03 Bank0256 UBS BANK X 2008/02 2009/03 Bank0258 CAJA DE AHORROS DE VALÊNCIA X 2008/06 2011/08 Bank0260 S.GALLER KANTONALBANK SUCURSAL X 2008/06 2014/05 Bank0264 VOLKSWAGEN BANK - SUC. UE X 2013/03 2014/05 Bank0266 BANK CHINA LUXEMBOURG- SUC. UE X 2013/04 2014/05 Bank0500 ING BELGIUM - SUC. UE X 2005/01 2014/05 Bank0848 BANCO BNP PARIBAS PER. FINANCE X 0034 2005/01 2014/05 Bank0916 BANCO CREDIBOM X 2007/11 2014/05 Bank
32. Former Banco Português de Negócios (BPN). Domestic bank until acquisition by BancoBIC.33. Banco BIC before the acquisition of BPN; after acquisition, becomes 0079.

80
Code Entity Foreign Parent Start date End date Type
5180 CCAM LEIRIA 2005/01 2014/05 MACB5200 CCAM MAFRA 2005/01 2014/05 MACB5340 CCAM TORRES VEDRAS 2005/01 2014/05 MACB8194 FMM CA MONETÁRIO 9000 2008/11 2014/05 MMF8205 FMM CAIXAGEST LIQUIDEZ 0035 2010/02 2014/05 MMF8217 FEIA - CGD MONETÁRIO 0035 2012/01 2014/05 MMF8218 FEIA - MONTEPIO MONETÁRIO PLUS 0036 2012/01 2014/05 MMF8219 FEIA - BPI MONETÁRIO CP 0010 2012/01 2014/05 MMF8220 FEIA - BBVA MONETÁRIO CP X 0019 2012/01 2014/05 MMF8229 Eurobox FMM 2013/05 2014/05 MMF8231 FMM Caixagest Activos 0035 2013/08 2014/05 MMF8232 FMM Postal Tesouraria 0035 2013/08 2014/05 MMF9000 CAIXA CENTRAL CRED AGRIC MUTUO34 2005/01 2014/05 MACB9006 BARCLAYS CURTO PRAZO X 0032 2005/01 2007/12 MMF9393 IW BANK SPA X 2005/01 2014/05 MMF9628 AF TESOURARIA 0033 2005/01 2008/03 MMF9661 PEDRO ARROJA 2005/09 2009/06 MMF
34. Includes all the institutions part of SICAM (Integrated System of Mutual AgriculturalCredit).