the political economy of commodity export...
TRANSCRIPT

wpS 217 5o
POLICY RESEARCH WORKING PAPER 2750
The Political Economy of Trade liberalization programsoften fail because they
Commodity Export Policy neglect domestic political
realities. Wise policy reform
A Case Study of India helps interest groups focus on
efficient, productive activities
by transforming one group
Masanori Kondo into another and by
enhancing politically desirable
alliances among groups.
The World Bank
South Asia RegionRural Development Sector Unit HDecember 2001
Pub
lic D
iscl
osur
e A
utho
rized
Pub
lic D
iscl
osur
e A
utho
rized
Pub
lic D
iscl
osur
e A
utho
rized
Pub
lic D
iscl
osur
e A
utho
rized

I POLICY RESEARCH WORKING PAPER 2750
Summary findings
Many developing country governments discriminate or about 25 percent more than current government
against sectors that export primary commodities. [ndia, revenue in Indiais cotton sector.
for example, discriminates against cotton production. Such costly subsidy of handlooms is undesirable not
Exports of cotton have been restricted by quotas, and the only budgetarily but also politically, because it creates
mill industry has been subject to such regulations as the new vested interests.
obligation to supply hank yarn for Indian handlooms. Kondo proposes politically feasible programs for
These interventions have led to stagnating cotton managing the adverse impact of liberalization on the
yields, rent-seeking activities, manipulation of cotton handloom sector, including handloom conversion and
statistics, and low profitability in cotton mills' offsetting involvement of mills in cotton cultivation.
the short-run benefits of inexpensive cotton in Indiia. Governments tend to prefer an export quota to an
Kondo develops a numerical model to measure the export tax because it is easier to change a quota than a
impact of liberalizing cotton exports. This is the first tax rate if market conditions change. But flexible
simulation model of its type, and the first multimarket controls actually facilitate rent-seeking activities. As
model that computes price elasticities endogenously, quotas are changed more often than tax rates, more
based on the ratios between product prices and input interest groups get involved in lobbying and in padding
costs. The model distinguishes short-run from long-run crop estimates.
effects by drawing on the principle that the cost of In other words, the political and economic problems
capital varies only in the long run. that result from restrictions on commodity exports can
Results of the simulation under complete liberalization be more serious than those relating to resource
indicate heavy (16 percent) net losses in income in the misallocation. It is important to consider how policy
handloom sector. The government subsidies needed to changes will affect the political power structure and the
compensate for those losses amount to USS423 million, objectives of different interest groups.
This paper-a product of the Rural Development Sector Unit, South Asia Region-is part of a larger effort in the region
to enhance rural development in India. Copies of the paper are available free from the World Bank, 1818 H Street NW,
Washington, DC 20433. Please contact Dina Umali-Deininger, room MC1O-159, telephone 202-473-0419, fax 202-522-
2420, email address dumali(aworldbank.org(d•worldbank.org. Policy Research Working Papers are also posted on the Web
at http://econ.worldbank.org. The author may be contacted at [email protected]. December 200l. (62 pages)
The Policy Research Working Paper Series disseminates the findings of work in progress to encourage the exchange of ideas aboutdevelopment issues. An objective of the series is to get the findings out quickly, even if the presentations are less than fully polished. Thepapers carry the names of the authors and should be cited accordingly. The findings, interpretations, and conclusions expressed in this
paper are entirelv those of the authors. They do nor necessarily represent the view of the World Bank, its Executive Directors, or the
countries theP represent.
Produced by the Policy Research Dissemination Center

The Political Economy ofCommodity Export Policy- A Case Study of India -
Masanori Kondo
International Christian UniversityTokyo, Japan


CONTENTS1. Introduction 1
2. The Cotton Export Policy in India
2.1. Background of the Government Policy 4Government's Desire for Industrialization / Income Distribution / Compromise to CottonFarmers
2.2. Cotton Export Restriction Scheme 5Roles of the Textile Conumissioner and the Cotton Advisory Board / Methods of CropEstimation / Quota Allocation Performance / Incentives to Export Cotton
2.3. Interest Groups and Their Political Activities 8Various Interest Groups / Cotton Farmers / Public Cotton Traders / Private Cotton Traders /Mill Sector / Powerloom Sector / Cooperation and Competition Between Mills andPowerlooms / Handloom Sector / Bureaucrats
3. Problems of the Cotton Export Policy
3.1. Economic Problems 16Cotton Farmers' Income Loss / Slow Yield Growth / Inefficient Public Procurement ofCotton / Losing Exporting Opportunities / Mismatch of Cotton Varieties
3.2. Political Economy Problems 21Public and Private Rent-Seeking Activities / Padded Crop Estimation by Interest Groups /Ad hoc and Short-sighted Decision Making / Fluctuation of Cotton Prices and Speculation
3.3. Impacts on the Spinning and Weaving Industry 24Problems of the Regulations in the Mill Industry / Low Profitability, Low CapacityUtilization and Illegal Closure of Mills / Unexpected Competition Between Powerloomsand Handlooms
4. Simulation of the Liberalization
4.1. Simulation Model 29Choice of the Multi-Market Model / Short-run and Long-run Analysis / Structure of theModel / Initial Values / Assumption on Hank Yarn / Price Elasticities / Integrating Markets/ Production of Hank Yam
4.2. Simulation Results for the Liberalization Without Compensation 37Export Liberalization - Income Transfer to Farmers / Hank Yam Liberalization - IncomeTransfer from Handlooms to Spinning Mills
4.3. Simulation Results With Compensation 38Necessity of Compensatory Schemes / Financial Cost of the Compensatory Scheme /Changes in Export Values / Is the Compensation Scheme Realistic?
5. Politically Feasible Reform
5.1. Political Feasibility of Liberalization 43Removal or Relaxation of Cotton Export Quota? / Timing of Liberalization / Deregulationof Long-staple Cotton Exports
5.2. Mobilizing the Political Power Structure 46Spinning Mills' Involvement in Cotton Production / Deployment of Mill Workers to OtherSectors / Handloom Conversion Program / Diversifying Handloom Weavers' Activities /Promoting Hank Yarn Reeling Business
6. Conclusions 49
Appendix A: Technical Notes on the Elasticities for the Model 51Ratio Among Elasticities and Cost Share / Changes in the Elasticities Over Time
Appendix B: Sensitivity Analysis under Different Elasticities 58Different Sets of Elasticities / Similar Results from Different Elasticities
References 60
ii

LIST OF TABLES
Table 1: World Cotton Export Market 1Table 2: India's Share and Ranking in the World Cotton and Textile Markets 2Table 3: Average Daily Wage Comparison Among Sectors 5Table 4: Market Share of Cotton Traders by Ownership 7Table 5: Movement in Price Indices 16Table 6: Yield Growth of Cotton 17Table 7: Production and Average Yield of Cotton in the World 18Table 8: Staple-wise Cotton Consumption and Count-wise Yarn Production 20Table 9: Official and Trade Estimates of Cotton Production 22Table 10: Trends of Cotton Exports 23Table 11: Initial Values 33Table 12: Price Elasticities 34Table 13: Net Income Changes Without Compensation 37Table 14: Net Income Changes With Compensation (Tax Exemption for Weavers) 39Table 15: Net Income Changes With Compensation (No Tax / Producer Subsidies) 39Table 16: Changes in Export Values 40Table 17: Changes in Government Revenue - Tax Exemption for Weavers 41Table 18: Changes in Government Revenue -Producer Subsidy for Weavers 41Table 19: Gainers and Losers Under Different Liberalization Policies 44Table 20: Short-term and Long-term Elasticities 51Table 21: Different Set of Elasticities for Sensitivity Analysis 58Table 22: Results of the Sensitivity Analysis Under Different Sets of Elasticities 59

ACRONYMS AND ABBREVIATIONS
AICOTTON All-India Cotton Growers FederationATIRA Ahmedabad Textile Industry's Research AssociationATMA Ahmedabad Textile Mills AssociationCCI Cotton Corporation of IndiaEICA East India Cotton AssociationEOU Export-Oriented UnitEPCG Export Promotion Capital CGoods (Scheme)GOI Government of IndiaGUJCOT Gujarat State Co-operative Cotton Marketing FederationICAC International Cotton Advisory CommitteeICRA Investment Information and Credit Rating Agency of IndiaICMF Indian Cotton Mills FederationIIM Indian Institute of ManagementIRMA Institute of Rural Management, AhmedabadITMF International Textile Manufacturers FederationMFA Multi-Fibre ArrangementMAFED Maharashtra State Cotton Growers Co-operative Marketing FederationNCAER National Council for Applied Economic ResearchNTC National Textile CorporationRBI Reserve Bank of IndiaSICA South India Cotton AssociationSIMA Southern India Mills AssociationSITRA South India Textile Research AssociationTEXPROCIL Cotton Textiles Export Promotion Council of India

CHAPTER 1
INTRODUCTION
Sectors that export primary commodities have been discriminated against by the governments of many
developing countries. Even though economic theory teaches us that such trade intervention is generally not
the best solution even in the presence of domestic market distortion, the restriction of agricultural
commodity exports by quota tends to be preferred by the policymakers. In many cases, this is because of
domestic political economy considerations. The cotton production sector in India is a prime example. The
prime motivation of this case study is to investigate the crucial political factors behind the second-best trade
intervention in the context of the Indian cotton economy.
Cotton export has been restricted by the Indian government for many years. Despite the substantial
degree of economnic liberalization since 1991, the government has not considered changing the policy, and
as a result, India is far from being a major exporter in the world cotton market (Table 1). Considering one
fourth of the world's cotton-cultivated land acreage is in India and one eighth of the world's cotton is
produced in the country, the market share is extremely small.
Table 1: World Cotton Export Market (million tons)
Country Exports
United States 1,589 (26.8)
Uzbekistan 1,150 (19.4)
Tadzhikistan 360 (6.1)
Turkey 280 (4.7)
Greece 175 (3.0)
China 150 (2.5)
Egypt 94 (1.6)
Pakistan 20 (0.3)
India 18 (0.3)
World Total 5,927 (100.0)
( ): percentage shares in the world market
Sources: Office of the Textile Commissioner (1995), ICAC (1994)
I

The export restriction on cotton has resulted in a number of negative consequences. The yield
growth of cotton has stagnated as the price of cotton is suppressed, thus it is not an attractive crop for
farmers. Inefficient public traders have lost export opportunities and waste cotton while lobbying the
governrnent to allocate them higher export quotas. The spinning industry and weaving industry continually
ask the government to restrict the level of cotton exports. In addition, the nationwide cotton export quota is
decided in an unscientific way based upon crop estimates made by interest groups, who tend to pad the
estimations up in order to influence the level of nationwide cotton export quotas. The Indian spinning
industry, which was one of the most competitive in the world in the eighteenth century, has now become
one of the world's most inefficient. In fact, India has become one of the few countries where the production
of cotton yarn per spindle has declined since the 1960s. Moreover, the export restriction of cotton did not
contribute to an increase in cotton yarn and textile exports. Despite the abundant supply of cotton for the
domestic cotton textile industry, India's share in the cotton yarn and cloth markets in the world is also
limited (Table 2).
Table 2: India's Share and Ranking in the World Cotton and Textile Markets
Area, Capacity Production Exports
Cotton 24 % (1) 13 %O (3) 1 %
Cotton Yarn 17 %(2) 9 9/o (3) 2 %Cotton Cloth 19 % (3) 14 % (2) 3 %
I: ndia's ranking in the world
Sources: Office of the Textile Cormnissioner (1995), ICAC (1994)
In the past, there have been a nuimber of attempts to incorporate political issues into economic
theory.' More recently, several important empirical studies were conducted on the political economy of
agricultural trade policy in developing countries.2 In addition, a theoretical attempt was made to fill the gap
between international economics and domestic politics by modeling the mechanism whereby interest groups
1 Buchanan and Tullock (1962) and Olson (1971) are classic literature which incorporated politics intoeconomic theory. Krueger (1974)'s model of "rent-seeking activities" and Bhagwati (1982)'s work on "directlyunproductive profit-seeking (DUP) activities" illustrate how the regulation induces socially undesirable activities.2 Krueger, Schiff and Valdes(1995) studied the agricultural pricing policies in eighteen countries, andconcluded that discriminating against exporting agriculture causes a number of negative effects. The cross-countrystudy by Sachs and Warner (1995) revealed a negative relationship between resource abundance and economicgrowth. Bates (1981, 1983) studied several African countries, and concluded that the negative consequence of exportrestrictions of natural resources in Africa was largely a result of the governments' intention to use the economic rent notfor irrigation or infrastructure but for "divisible ilnputs" to some particular politically influential groups.
2

can buy policies by offering contributions contingent on the import protection policies formulated by the
government. 3 However, there have been no empirical studies to examine the export restriction policy from
a political-economic perspective in the Indian cotton sector.
The paper attempts to answer a number of questions, which can be organized into the following
three categories:
(i) The background and framework of cotton export policy - what is the background of the cotton export
policy in India; how is the cotton export quota for each exporter decided; what objectives do interest groups
have; and how do they influence the cotton export policy.
(ii) The consequence of export restriction policy - how scientifically and consistently has the export quota
been decided by the government; who has captured the economic rent; what are the impacts of the export
policy on the domestic market; and what is the reputation of India as a cotton exporter in the world market.
(iii) Political feasibility of reforms - who will gain and who will lose under liberalization; how politically
feasible is the liberalization; and what is a politically feasible compensation scheme for losing groups.
Based on the answers to all these questions, this paper will argue that if we take the exporting
country's domestic politics into account, an export restriction by quota may even be more harmful to the
country than it has generally been thought, because it can induce a vicious circle of political-economic
problems and an even more distorted future policy. Moreover, once the interest groups are formulated, it is
not easy to carry out future liberalization. The planners in India's other sectors and in other countries can
share the lessons learned from the Indian case if they apply similar logic - how do the interest groups
interact with each other to influence the export quota policy, and how does that distort the political decision
on export policy - to their own sectors. This will be the major contribution of this paper.
The rest of this paper is organized as follows: Chapter 2 discusses the background of cotton export
policy in India. The interest groups over cotton exports and their objectives are identified. Chapter 3
analyzes all the negative consequences of the cotton export restriction by quota. Chapter 4 measures the
expected level of the income gains and losses under economic liberalization on a computer simulation
model. Chapter 5 discusses the feasibility of implementing the liberalization policies, and identifies several
desirable policy options. Lastly, Chapter 6 draws generalized lessons and implications.
3 Grossman and Helpman (1994) is one of the pioneer works in the field. Helpman (1995) reviews severaltheoretical ways to incorporate political factors into international economics.
3

CHAPTER 2
THE COTTON EXPORT POLICY IN INDIA
2.1. BACKGROUND OF TiE, GOVERNMENT POLICY
Government's Desirefor Industrialization
The cotton textile industry has been one of the most important industries in India. When India became
independent in 1947, the cotton textile industry was the single most important industry in the country. As a
result of the partition of India and Pakistan, India lost its major cotton belt while retaining the country's
major textile centers. Since the early 1950s, an import substitution strategy has been implemented in line
with the Mahalanobis Model, in which plalners hoped that after a certain protection period, the protected
industry would become intemationally competitive.
As cotton production in India gradually increased, India became an exporter of cotton. Since more
than half of the production cost of cotton yam is cotton, Indian planners thought that providing inexpensive
cotton to the domestic spinning industry by restricting exports would eventually allow it to develop.
Similarly, it was thought that restricting cotton yarn exports would develop the downstream cotton weaving
industry in the long-run. Because of its intention to control the market in a more direct and flexible way, the
government chose the export quota scheme r ather than export taxation to increase the supply of inexpensive
cotton to domestic spinning mills, and, hence cotton yarn to weavers. Politically, the government's desire to
develop the textile industry at that time was strongly supported by influential business groups.
Income Distribution
The discrimination against the cotton production sector and cotton spinning sector as opposed to the
downstream handloom sector was justified by the government not only for their desire for self-independence
and industrial development but also for income distribution. The process of manufacturing cotton textiles is
broadly divided into three stages - cotton production, cotton spinning and weaving. Raw cotton, which
farmers grow, is ginned and processed, and sold to mills by traders. Mills spin yarn from cotton, and then
weavers manufacture cotton textiles. In the case of India, most cotton spinning mills are large-scale units in
public and private sectors, while the weaving industry consists of three major sectors - composite mills,
powerlooms and handlooms. While composite mills are large-scale and mostly run by the public sector,
4

both powerlooms and handlooms are small-scale private sector enterprises. Handloom weavers use the
most primitive technology. Cotton yarn is either sold to powerlooms and handlooms weavers or woven by
composite mills themselves. The handloom workers, who are the largest group in termns of employment in
the whole textile sector, are the poorest, even more impoverished than poor cotton farmers in India. In the
past, several surveys have revealed the remarkable income difference between mill workers and handloom
workers (Table 3).
Table 3: Average Daily Wage Comparison Among Sectors
Year Survey Composite Mill Powerloom Handloom
1988 Goswami Rs.75 Rs.40
1985 ATIRA Rs.50 Rs.10 - 25
1990 GOI Rs.50 Rs.25 Rs.10 - 15
1982 SITRA - Rs.12.5 Rs.9.5
Sources: Goswami (1990), Uchikawa (1998) etc.
Compromise to Cotton Farmers
While the cotton textile industry is the largest manufacturing sector in terms of employment in India, cotton
is the most important commercial crop in India's agriculture in tenns of cultivated area. Therefore, while
suppressing cotton prices by restricting exports, the government has also needed to satisfy farmers. In the
past, the government has provided them a number of benefits, such as income tax exemption, concessional
power rates, and fertilizer subsidies. Particularly, the fertilizer subsidization policy has been used as an
important tool to satisfy politically influential wealthy farmers, as they have had more access to these
subsidized fertilizers. Another way to keep cotton farmers content was to allocate most of the cotton export
quotas to the public cotton traders who rebate their economic rents to cotton farmers in various ways such as
by providing them high-quality cotton seeds.
2.2. COTTON EXPORT RESTRICTION SCHEME
Roles of the Textfile Commissioner and the Cotton Advisory Board
India's cotton exports are handled by their Ministry of Textiles. Every year, the Textile Commissioner
recommends an export quota to the Minister of Textiles, based on crop estimates made by the Cotton
Advisory Board which is a representative body of the government, cotton growers, traders, and spinning and
5

weaving industries. The Cotton Advisory B3oard's role is to estimate the supply, demand and opening stock
of cotton crops every year. The members include the Textile Commissioner as chairman, several joint
secretaries of the Ministry of Textiles ancl of the Ministry of Agriculture, state government officials in
charge of agriculture, and other organizations representing all the sectors that are involved in cotton trading
either directly or indirectly.
As far as cotton trading is concerned, the role of the Ministry of Agriculture is limited to suggesting
the minimum support price that cotton farmlers are guaranteed to receive. The Commission for Agriculture
Costs and Prices records the prices of basic cotton varieties every year. If the market price of cotton is
below the minimum support price, the Cotton Corporation of India (CCI) must enter the cotton market to
purchase cotton in the domestic cotton market. However, in practice, the minimum support price has been
set so low - usually less than 70 per cent of the quoted market price - that it has been touched only once in
the past twenty five years.
Methods of Crop Estimation
The members of the Cotton Advisory Board are called to a meeting by the Textile Commissioner several
times a year in order to estimate the situation of the current cotton crops. Each member has a different
estimation method. On the supply side, for example, state government officials visit the cotton fields of
their state; the Ministry of Agriculture (central government) makes the statistical assessment on nationwide
area and yield; the East India Cotton Association (EICA) observes how much cotton is ginned; and the CCI
looks at the arrival of cotton in the market. On the demand side, each member estimates how much cotton
will be consumed by domestic mills. Individual mills file statements every month to the Textile
Commissioner reporting how much cotton they are using. Cotton consumption by small-scale mills is
estimated based on the number of their spindles. Although the initial estimations by members differ from
each other, consensus is made for one final estimate in the meeting. The Textile Comrnissioner reports the
final estimate of surplus cotton to the Minister of Textiles. Based on his recommendation, the Minister of
Textiles declares the nationwide quota level, which is divided into sub-quotas for different varieties of
cotton.
Although the nationwide quota announcement is made once a year, the quota is allocated little by
little to each trader several times a. year, depending on the fluctuating cotton market situation. In other
words, the level of allocated export quota is subject to change throughout the year. Therefore, if the cotton
scenario becomes tight at some stage during the year, it is possible that not all the export quotas for all the
varieties of cotton announced in the beginning of the year are actually allocated by the end of that year. No
6

cotton export quota is auctioned, except for the low quality unspinnable deshi cotton, which is left in the
open bidding market. Any traders can export deshi cotton if they want.
Quota Allocation Performance
Public traders are allocated most of the cotton export quota every year. Usually, the CCI, a central
government agency, is allocated the largest portion of the cotton export quota, followed by the Maharashtra
State Cotton Growers Co-operative Marketing Federation (MAFED), the Gujarat State Co-operative Cotton
Marketing Federation (GUJCOT), and other state marketing federations (Table 4). Although cotton
situations change every year, the export quota for spinnable cotton is not allocated to private traders even
when cotton harvest is exceptionally good. As a result, private cotton exporters specialize in unspinnable
deshi cotton, which is not so profitable for exporters compared to other varieties of cotton. There are two
major reasons why the government prefers public traders to export cotton. First, the government believes
that it is good for farmers, because the export rents captured by public traders can be rebated to farmers by
supplying them with better cotton seeds and by R&D activities. Second, the government is afraid that some
private traders may manipulate the export transactions and cause capital outflows.
Table 4: Market Share of Cotton Traders by Ownership
Type of Trader Share in Domestic Typical Share inCotton Market Export Market
CCI (central government agency) 8 % 25 %
State marketing federations 17 -22 % 50 %
Private traders 70 - 75 % 25 %*
Total 100 % 100 %
* Mostly deshi cotton.
Sources: EICA (1995) and Lal & Panner (1995) etc.
Incentives to Export Cotton
There are a number of factors that make exporting spinnable cotton very attractive for traders. The most
obvious incentive is the difference in price between the Indian market and the world market. In the past few
years, the difference between nominal domestic cotton prices and export prices has been around 15 per cent
(Pursell and Gupta, 1996). Compared to this, the margin left for traders after deducting sales tax and
transportation costs is only about 0.5 per cent in the domestic cotton market. This difference between the
export market and domestic market is much narrower for unspinnable deshi cotton, which private traders
7

can export through open bidding.
In addition to the nominal price difference, there are several other advantages in exporting spinnable
cotton. The first important factor is credit risk. Due to the poor financial situation of many domestic cotton
spinning mills, credit-based sales to them are considered to be fairly risky in India. Compared to this high
risk in selling domestically, exporting cotton is considered much safer because payment is guaranteed by
banks in the importing countries. Another important factor that makes exporting cotton attractive is India's
tax structure. All profit made by exporting any commodity, including cotton, is exempted from income tax
in the country. Moreover, cotton exporters can earn foreign exchange, which was especially attractive
before the major depreciation of the Rupee in 1991. It has often been alleged that some private traders
(mostly small-scale ones) have tried to convert the foreign currencies that they illegally earn to Indian
Rupees by over-invoicing their cotton export transactions.
2.3. INTEREST GROUPS AND THEIR POLITICAL ACTIVITIES
Various Interest Groups
There are a number of interest groups that are competing with each other for cotton exports in India. Major
interest groups competing for the cotton and yarn export policy in India can be classified as: cotton farmers,
public cotton traders (the CCI and state marketing federations such as the MAFED and the GUJCOT),
private cotton traders, organized sector mills (owners of spinning mills, owners of composite mills, and mill
workers who have conflicting interests with each other), powerlooms, handlooms (master weavers and
dependent weavers), and bureaucrats. The khadi sector (hand spinning sector) and co-operative spinning
mills are excluded from the analysis, because their production shares (and political voices) are negligible.
Generally speaking, cotton growers and traders want cotton to be exported, while cotton spinning
mills, powerlooms and handlooms do not. Further, cotton spinning mills and weavers, who share interests
in cotton exports, have conflicting views regarding cotton yarn exports; the former want cotton yarn to be
exported, while the latter do not. As described below, all of them lobby the government in a different way,
and the role of the government has been to balance the different interest groups rather than to find the
economically appropriate level of cotton exports.
Cotton Farmers
The political power of cotton farmers is quite important in India. Behind their strong political presence,
8

there are a large number of very well-organized votes. As the number of households who cultivate cotton is
around 5 million, the total number of the cotton farmers' votes is estimated to be around 10 million, out of
the total estimated votes of 25 to 30 million in the whole cotton sector in India. The voices of the cotton
ginning and processing industry, which is reserved for small-scale mills, are also represented by influential
cotton growers and local traders.
Cotton farmers are politically even more influential in the states where the economies are more
dependent on cotton. In particular, politics in the states of Maharashtra and Gujarat are very sensitive to
cotton interests. For example, the Maharashtra Cotton Monopoly Procurement Scheme was approved in
1971 as a result of the strong political presence of cotton farmers in the state. Under the democratic federal
political system in India, one of the most important tasks of the Members of the Parliament elected in these
states is to negotiate cotton issues, including the export quota allocation, with the central government.
Public Cotton Traders
By and large, the political interest of public cotton traders over cotton exports is similar to that of cotton
farmers. Both of them want more cotton to be exported. Each state marketing federation represents the
interest of the farmers who belong to the federation, and pressure the central government for more quota
allocation. Thus, state marketing federations compete with each other over cotton export quotas on behalf
of their farmer members.
In order to increase the export quota allocated to them, state marketing federations write letters and
send delegations to the central government. For example, it is reported that the GUJCOT sends twenty to
thirty delegates to Delhi once every three to four months. In addition, upon its request, the Gujarat State
Minister lobbies the central government for more cotton exports. The MAFED has the extra objective of
ensuring the central government approves the continuation of the state cotton monopoly scheme in
Maharashtra. All the state marketing federations belong to one nationwide umbrella organization, the
AICOTTON, which pressures the government to increase the nationwide cotton export quota. The CCI also
lobbies the central government, the owner of the corporation, for more cotton export quota allocation.
Private Cotton Traders
Unlike the public cotton traders, the political presence of private cotton traders is negligible. Although there
are many private cotton traders, most of them are small in size, and politically they are not as organized as
public traders. Their lobbying activities are represented by cotton associations such as the East India Cotton
Association (EICA) and the South India Cotton Association (SICA). The EICA is the largest nationwide
9

association, whose members include private as well as public buyers, sellers, brokers, and exporters of
cotton. The SICA is a similar association in southern India. Although both private and public cotton traders
are members of the associations, the EICA and the SICA tend to represent more the interest of private
traders.
Between the public cotton traders and private traders, there are similarities and differences in terms
of political interest. Public and private traders share a common interest in relaxing the cotton export quota,
which will raise domestic cotton prices. Also, even though most of the quota for spinnable cotton is
allocated to public traders, there is room for private traders to earn commissions by acting as middlemen.
Therefore, relaxation of the cotton export quota means more profit for both public and private traders.
However, regarding the full liberalization of cotton exports and the total removal of the existing export
quota scheme, public traders and private traders have conflicting interests. Public traders prefer the existing
quota allocation scheme, because it enables them to easily capture the economic rents accrued from the price
difference between the domestic and world markets. Conversely, private traders want full export
liberalization by removing the export quota scheme because they could then export not only deshi cotton but
also much more spinnable cotton.
Mill Sector
Among all the interest groups in the cottoni sector, the cotton mill sector is one of the most well-organized.
The Indian Cotton Mills Federation (ICMF) is a powerful organization that represents the interests of the
owners of cotton spinning and weaving mills, and under the ICMF, there are eleven state-level cotton mill
associations, such as the Ahmedabad T'extile Mills Association (ATMA), the Bombay Millowners
Association, and the Southern India Mills Association (SIMA). Especially when cotton prices are going up,
these cotton mills' associations appeal to the central government not to export cotton. In order to justify
their objective to block cotton exports, they also publicize in newspapers and other journals official statements
that India should export not cotton but value-added textile products. In fact, many Indian newspapers and
joumals (such as the Economic Times, Tecoya, Express Textile) are full of these kinds of statements especially
when the price of cotton is increasing.
However, the lobbying power of the organized mill sector has been declining relative to other sectors.
There are three main reasons for this. First, the cotton textile business is no longer a flagship business for
most large private business groups. Although many Indian business groups originally started from the cotton
spinning and weaving business, most of them have diversified their business activities to other protected and
hence more profitable industries such as the chemical industry and man-made yarn industry. Consequently,
10

the cotton spinning industry has become relatively much less important for them, which has weakened the
lobbying power of the ICMF, as the federation is not backed up by these influential business groups as
strongly as before. Secondly, not only for business groups but also from the central government's point of
view, the cotton mill sector is becoming relatively less important, because many other manufacturing
industries such as automobiles and electronics are picking up as a result of economic liberalization. The
third factor is conflicts of interests between western mills and southern mills, which is analyzed later in this
section.
What is worse for mill owners is that they do not get political support from mill workers. Indian
mill workers are known for their very effective political activities. They belong to labor unions, which
lobby for their job security, higher wages, better working conditions, better pension and compensation
programs, by organizing labor strikes, sending delegations to Delhi, and asking local politicians to write
letters to the government on their behalf. Their attitude against the modernization of mill plants sharply
conflicts with that of mill owners. In the past, as a result of the workers' successful political activities, an
agreement was made at the Indian Labor Conference that prohibits retrenchment of existing workers as a
result of modernization. The workers have little interest in the level of cotton and cotton yarn exports.
Although mill workers would receive higher wages in the long-run if less cotton and more cotton yarn were
exported, this is too indirect and is not the workers' concern. Like cotton farmers, the mill workers tend to
be short-sighted.
Regulations in the Mill Sector
As the prime role of the domestic spinning mills is to provide inexpensive cotton yarn to the downstream
weavers, the Indian government has forced a number of regulations in the mill industry. First, the export
ceiling' is fixed such that cotton cone yarn exports of 1 to 40 counts, and exports of hank yarn up to 60
counts, which account for a quarter of the total cotton yarn production, is totally prohibited. Unlike cotton,
for which the quota allocation to each exporter is announced by the Minister of Textiles, the cotton yarn
export entitlements are distributed by the Cotton Textiles Export Promotion Council of India
(TEXPROCIL) after the total nationwide export ceiling is announced by the Minister of Textiles.
Second, the hank yarn obligation has been enforced, whereby spinning mills have to reel half of
their domestic cotton yarn supply as hank yarn, which is for handlooms. Only cotton yam for export is free
from the 50 per cent obligation. Although cone yarn and hank yarn are basically the same kind of cotton
4 In order to distinguish from the import quota enforced by trade partners, export quota for cotton yarn isreferred to as an export "ceiling", in contrast to a cotton export "quota".
11
yarn, hank yarn is wound more loosely in a shape suitable for handloom weaving. While the cost of
producing hank yarn exceeds that of cone yarn (Bhattacharya, 1995), the selling price of hank yarn tends to
be lower than that of the cone yarn from lower counts to higher counts. Hence, the hank yarn obligation has
forced spinning mills to lose profits.
Composite mills, which produce not only yarn but also cloth, have been forced to operate in an even
worse business environment than spinning rnills, because of government regulations to protect the handloom
industry from competition in the domestic cloth market. These regulations include restrictions on loomage
expansion, restrictions on processing man-rnade yarn, and higher rates of tax on mill-made cloth compared
to cloth woven by the small-scale weavers. As a result, the powerloom sector has emerged as the largest
cotton cloth supplier, while the regulations have put the composite sector at a serious disadvantage in
competition with powerlooms.
Lastly, the protection of the domestic textile machinery industry should be taken into account.
After independence, textile machinery imports were practically not allowed in India for many years, as part
of the Mahalanobis strategy, which promoted import substitution industrialization, not only in the consumer
goods industry but also in the intermediate goods industry and the capital goods industry. For a long period,
the import duty on textile machinery for non-export-oriented mills was high at 60 to 70 per cent. It is only
recently that the government started to apply concessional import duty rates for exporting mills in line with
economic liberalization. The rate of import duty for normal mills catering to the domestic market, which
account for the majority of the mill sector, is still as high as 37.5 per cent.
Powerloom Sector
The powerloom sector is informal, flexible, small-scale and labor intensive. Although a few powerloom
units are operated by household labor like most handloom weavers, most powerlooms are operated by hired
workers with the members of the owner's family occasionally participating in the weaving process.
Powerloom workers tend to shift from unit to unit in response to even slightly higher wages.5 Most of them
have no job security and no compensation packages, because their employment is not covered by the
Factory Law in India. The Hussain Comminttee has emphasized the need to improve their working conditions
(Ministry of Textiles, 1990).
Although powerlooms, like mills, are hit when cotton prices rise, their lobbying is not effective.
There are some associations that represent the interests of powerlooms, such as the nationwide All-India
5 According to the Labour Bureau, about two thirds of the Indian powerloom workers worked on a temporarybasis in 1988.
12

Powerloom Federation, which represents roughly 1.2 million powerloom units employing 6.6 million
workers all over the country, and the Maharashtra State Powerloom Association and the Tamil Nadu
Powerloom Federation. Although these federations announce their opposition to cotton exports and cotton
yam exports on account that their textile exports are based on the inexpensive supply of cotton yarn, they
are not nearly as well-organized as the associations of farmers or mills. Olson (1971)'s proposition - the
smaller the number of members, the more well-organized the group is -holds here.
However, despite its weak lobbying power, the powerloom sector has grown rapidly as the single
largest beneficiary of the government policy. This is largely because of the government policy that
mistakenly treated powerlooms and handlooms together as the decentralized sector. In order to enjoy the
special privileges that the government intended for handlooms, some larger-scale powerloom units have been
camouflaged to appear as small-scale decentralized sector units. It has also been reported that some
powerlooms have illegally received orders placed on products reserved for handlooms by camouflaging
themselves as handlooms and also by paying bribes. Because of the benefits they receive from the
government policy, one of the most important political interests of powerloom weavers is whether the
government keeps treating them equally to the handloom sector in terms of tax rates, subsidies, and
reservation of certain products. Although a new textile policy drawing a distinction between mills and
powerlooms was announced in 1985, the enforcement of the policy was not successful, and a large number of
powerlooms are still unregistered and hence do not pay duties (Misra, 1993).
Cooperation and Competition Between Mills and Powerlooms6
The political relationship between the mill sector and the powerloom sector in India is complex. Historically,
powerlooms were first set up by progressive handloom people in the early half of the century. In the 1950s
and 1960s, however, a number of newer powerlooms were started by installing old looms scrapped by the
composite mills in the western part of India. By the mid-1970s, many mill owners began to realize that they
needed to sell inexpensive cloth to increase their market share (Goswami, 1985), and some composite mill
owners not only sold off the looms, but also financed the growth of powerlooms in order to evade excise
duty. It is also well-known that the mills subcontracted weaving to the powerlooms, and then finished and
marketed the cloth by themselves during the eighteen-month mill Bombay strike in the early 1980s.
However, the powerlooms began to dominate the market of cotton cloth throughout the 1980s and
1990s. Now, the Mumbai (Bombay) mill owners, who once supported the powerlooms, are strongly against
their growing presence. Conversely, southern spinning mills, who used to be indifferent with respect to the
13

powerlooms, want the state government to promote the powerloom sector, because in southern India there
are not enough powerlooms and spinning mills have to sell more than half their spun yarn to powerlooms in
the western region. Interestingly, some powerlooms have formed a political alliance to pursue their
common interests with southern spinning mills. For example, in order to alter the 1985 Textile Policy,
which was against the interest of powerlooms, the western powerlooms led by the All-India Powerloom
Federation and the SIMA organized by the southern mills lobbied jointly in order to make the central
government alter the policy, although it was not very successful.
Handloom Sector
The handloom sector is one of the poorest groups in India. Product-wise, the Indian handlooms are basically
categorized into two groups - those that produce high value-added luxury fabric with unique traditional
designs, and those that weave low value-added standardized cotton fabric. The former type, which accounts
for roughly a quarter of all the handloom units, has their niche market where neither mills nor powerlooms
can compete. Some of them tend to be operated using very primitive technology. Conversely, the latter
type - handlooms that produce low-quality plain cloth - can barely survive with low wages and state
subsidies.
Scattered in the rural areas all over the country, handloom weavers are the least well-organized
group in the Indian cotton sector. Although handloom weavers tend to be hit harder than mills and
powerlooms when cotton prices go up, most of them are politically silent. There are of course some
organizations such as the Handloom and Handicrafts Association, but like the powerloom organizations,
they are far less efficient in terms of lobbying than the ICMF. Olson's proposition also holds here.
However, despite their disorganization and lack of money for political contribution, handlooms can
have an influence on policymakers when the cotton prices go up. This is partly because of the number of
their votes, and partly because of the nationwide sympathy for them. Although the number of handloom
weavers is roughly the same as powerloom weavers, the votes of handloom weavers are easier to control
than workers in mills and powerloom, because many handloom weavers belong to the low caste in rural
areas, where higher caste community leaders are often very influential. The nationwide psychological
sympathy for poor handlooms is another important factor in explaining the pro-handloom policy in India.
Often the handloom sector has been used as a political tool for politicians to attract popularity, votes and
raise money. There are many politicians who own handlooms and head handloom co-operative societies in
India.
6 The analysis in this section is based on Leadbeater (1993).14

Bureaucrats
The last, but not least important players in the political economy arena are bureaucrats.7 As in most other
countries, government officials are reluctant to change the existing scheme in India. The first reason for this
is that they are, after all, bureaucrats who prefer the status quo under the evaluation system of "deducting
marks".' Another factor that makes bureaucrats resistant to liberalization policies is corruption. It has been
often alleged that the existing regulatory scheme is attractive for some government officials, because they
secretly receive "rebates" from various interest groups. Naturally, these two factors - evaluation system and
corruption - will lead the Indian bureaucrats to resist the liberalization of cotton exports.
Compared to farmers, powerloom weavers and handloom weavers, the government sector is
particularly heterogeneous. At the central government level, cotton production is a matter for the Ministry
of Agriculture, while cotton trading and cotton yarn exports are handled by the Ministry of Textiles. At the
state government level, many state ministers tend to support the interests of farmers, although the extent
depends upon the state; if the state does not produce cotton but has spinning activities, the state government
tends to oppose looser cotton export quotas. There are political conflicts between the central government
and each state government over quota allocation, and between the Ministry of Textiles and the Ministry of
Agriculture within the central government. On top of this, there are some government officials who
allegedly take bribes, which often makes political decision-making biased. One can imagine how difficult it
is for the central government to satisfy all these conflicting interests.
7 Bardhan (1998) treats civil servants as one of the "dominant proprietary classes" in India.8 The promotion of elite civil servants, called the Indian Administrative Service (IAS), is guaranteed so thatmost of them do not want to take risks.
15

CHAPTER 3
PROBLEMS OF THE COTTON EXPORT POLICY
3.1. ECONOMIC PROBLEMS
Cotton Farmers'Income Loss
The cotton export policy has caused a nurnber of negative consequences. The largest cost imposed by the
policy has been borne by farmers. The cotton farmers' income was adversely affected by the cotton price
being kept low throughout the 1980s (Table 5). Also the suppressed cotton price caused adverse income
distribution effects within the cotton production sector; while wealthier cotton farmers who grew more than
one type of crop in irrigated areas were less, affected, poorer farmers could not promptly switch from cotton
to other new crops, such as castor seeds or sesame seeds when the price of cotton fell.
Table 5: Movement in Price Indices
Price Index 1981/2 - 1989/90
Wholesale Price Index (WPI) + 72 %
WPI for Manufacturers + 71 %
Consumer Price Index (CPI) + 93 %.
CPI for Industrial Workers (General Index) + 96 %
CPI for Urban Non-manual Employees (General Index) + 92 %
Cotton Lint Price + 55 %
Cotton Yarn Price +76%
Cotton Cloth Price + 40 %
Source: Chaurdhuri (1994)
While microeconomic trade inteivention in the cotton sector acted against cotton farmers,
macroeconomic intervention had also been against them until recently in India. As in many other countries,
the currency had been overvalued until macroeconomic liberalization began in 1991. This had kept the real
farm-gate prices of cotton (in US dollars) al a low level for many years in India. It is only recently that the
Rupee became convertible (in the current account) and the real exchange came close to the free market rate,
which corrected part of the discrimination against the cotton production sector.
16

Slow Yield Growth
It is the commercial profitability of a crop that acts as a spring in the modernization of the production
process, which in turn improves the yield growth rate (Krueger, Schiff and Valdes, 1992). Cotton is no
exception to this rule. Unfortunately, the unattractiveness of the domestic cotton market price has
contributed to stagnant yield growth of cotton in India. The problem is particularly serious in Maharashtra,
where cotton distribution is monopolized by the state trader (Table 6).
Table 6: Yield Growth of Cotton (kgs I ha)
State 1989/90 1990/91 1991/92 1992/93 1993/94 1994/95
Andhra Pradesh 458 485 494 506 610 650
Gujarat 229 277 212 308 351 339
Haryana 498 400 488 440 347 354
Maharashtra 135 93 79 141 87 99
Punjab 592 418 593 533 340 421
All India Average 300 269 266 311 278 300
Source: Office of the Textile Commissioner, GOI
The yield of cotton is still far lower than in many other countries, although agricultural
technological progress has made it possible for India to produce long-staple cotton. The average yield of
cotton per hectare of India is only half of the world average of 600 kgs per ha (Table 7). The cotton yields
of countries such as the US, China and Egypt are somewhere between 500 to 750 kgs per ha. The yield of
Pakistan is higher than that of Punjab in India, although both regions have sirnilar climate, soil and irrigation
conditions. Of course, the export restriction on cotton is not the only factor contributing to low yields.
Other factors, such as the low percentage of irrigated areas, the lack of availability of good seeds and
damage due to pest attacks, also led to stagnation of cotton yields in India. However, all these factors are in
some way related to the price incentive.
17

Table 7: Production and Average Yield of Cotton in the World
Country Production Area Yield(million ton) (thousand ha) (kg / ha)
Israel 27 16 1,697
Australia 329 260 1,266
Turkey 580 559 1,039
China 3,739 4,985 750
USA 3,515 5,173 679
Egypt 411 371 538
Pakistan 1,312 2,804 468
India 2,095 7,315 286
World Total 16,673 30,527 546
Source: ICAC (1994)
Many economists (for example, G(ulati and Sharma, 1994) argue that liberalizing cotton exports will
help Indian farmers improve agriculture raanagement, which will, in turn, solve part of these problems.
Some argue that if cotton yields do not improve, India may even face a shortage of cotton in the future.
India has by far the largest acreage of cotton cultivation in the world and is the only country to produce a
full range of varieties of nearly all staple: lengths. It is unfortunate that India is not maximizing their
comparative advantage of cotton production.
Inefficient Public Procurement of Cotton
WAhile cotton yields have been stagnant, the loss of cotton by public cotton traders, particularly state traders,
has further reduced the level of available cotton for domestic spinning mills in India. Often, public traders
fix their purchasing price when the market is at its peak, sell it in the lean period, and end up with losses.
Also, in seasons when the quality of cotton is poorer, they cannot find suitable buyers and build up large
unsold stocks, which are eventually wasted. For example, Bhala (1995) pointed out that a significant
amount of cotton was lost by the MAFED, which has monopolized cotton trading in Maharashtra for over
two decades.
The incompetence of the public traders is even more apparent in the export market than in the
domestic market. Finding the right quality and variety on time, keeping buyer connections, establishing a
reputation are all essential factors to successful trading. Many public traders are not professionally trained,
and cannot find suitable overseas buyers. Therefore, although most of the cotton export quota is allocated to
public traders, private traders often act as middlemen on behalf of the public exporters. While the public
18

traders can enjoy most of the economic rent, the private brokers receive 1 per cent commission. Without the
existence of private middlemen, India would not be able to sell as much cotton as it presently does, even if
the export restriction were phased out.
Losing Exporting Opportunities
The existing scheme has made Indian cotton unpopular among overseas buyers for several reasons. Like
industrial products, not only prices but also other factors such as timely shipment, reliable supply and high
quality are important in today's competitive world cotton market. The first factor is timing of contract and
shipment, which is particularly important for the cotton export business. Many private cotton brokers in
India complain that the quota restriction policy has made it difficult for them to capture a share of the
growing marketing opportunities in other countries. The ideal time for cotton exports in the world market is
December, January and February, when major exporters such as Pakistan and Egypt are also there to make
export contracts. Unfortunately, the Indian government announces its cotton export quota after January or
February (with an exception in 1996). Then even after the announcement of the nationwide quota is made,
it takes at least another month to complete the required procedures. Therefore, when the quota allocation is
finally completed and traders are ready to export cotton, it is often too late to make an attractive deal. As a
result, Indian cotton exporters appear in the world cotton market a few months after other countries'
exporters have already made contracts with overseas buyers.
The fluctuation of exports is another problem of lndian cotton for overseas buyers. As the export
quota level is decided in an ad hoc way due to continuous pressures from various interest groups as
discussed in the next section, the exports fluctuate year by year, depending on the scenario of domestic
cotton production and political situation. Since many overseas cotton buyers prefer a constant supply of
cotton, they tend to avoid Indian cotton, which is not shipped constantly and hence is not suited for a long
term contract.
The high levels of contamination and stickiness of cotton are also serious. In India, the cotton
ginning and processing activities are reserved for specialized small-scale ginning mills in accordance with
the Cotton Ginning and Processing Act in order to protect them. In most states, the ginning industry
receives ginning rates fixed by the government. The reservation policy also prevents export-oriented
spinning mills from setting up their own ginning and pressing facilities for export purposes. As a result, the
domestic ginning and processing industry has been accustomed to low quality standards in the domestic
market, paying little attention to quality improvement. Had the Indian government encouraged the exports
of cotton and liberalized the cotton ginning and processing industry at least for the export purposes, the
19

cotton ginning and processing quality would have increased towards international standards, and this would
have, in tum, benefited the domestic yarn and other textile production both in terms of quality and exports.
Mismatch of Cotton Varieties
Export restrictions on cotton have also caused the mismatch of cotton varieties in the domestic market in
India. The staple length of cotton determines the right count of yarn spun from that cotton; long-staple
cotton, medium-staple cotton, and short-staple cotton are most suited to the production of high-count (i.e.,
fine) yam, medium-count yam, and low-count (i.e., coarse) yarn, respectively.9 In India, out of the total
domestic consumption of cotton, 53 per cent was long-staple (including extra-long staple), 41 per cent was
medium-staple, and 6 per cent was short-staple, while 14 per cent of the cotton yarn produced by the
domestic mills was over 61 counts, 47 per cent was 21 to 40 counts, and 39 per cent was 1 to 20 counts in
1994/95 (Table 8).
Table 8: Staple-wise Cotton Consumption and Count-wise Yarn Production
Cotton Staple Staple-wise Share (A) 'Yam Count Count-wise Share (B) Ratio (A)/(B)
Long Staple 53 % Over 60 Counts 14 % 3.8
Medium Staple 41 % ' 2I to 60 Counts 47 % 0.9
Short Staple 6 % lJp to 20 Counts 39 % 0.2
Total Cotton 100% Total Yarn 100% 1.0
Sources: Office of the Textile Commissioner, GOI (1995) etc.
There are two domestic factors behind this gap. On the supply side, the proportion of long-staple
cotton has increased at a faster pace than shorter-staple cotton. Conversely, on the cotton demand side, the
majority of India's cotton yarn production is in medium- and lower-counts, and the production of higher-
count yarn is still limited. This is because of the shifting preference of high income people from fine quality
cotton textiles to man-made yarn textiles, technical constraints in the mill sector, and the high excise duty
levied on higher counts of cotton yarn, as pointed out by Misra (1993). Thus, as a result of the excess
supply of long-staple cotton in the domestic market, many spinning mills have overused higher-quality
cotton. Moreover, the strength of lower counts of yarn has been sacrificed because longer staple cotton is
not suitable for production.
The necessity to liberalize cotton exports is even more obvious if we consider the import of cotton,
20

which has been fully liberalized since 1994/95. Most of the cotton mills that import cotton need specific
cotton varieties. With cotton imports being liberalized, there is no reason to continue cotton export
restriction because India can export long-staple cotton freely and import short- and medium-staple cotton if
there is a domestic shortage for short-staple cotton.
3.2. POLITICAL ECONOMY PROBLEMS
Public and Private Rent-seeking Activities
The conflicting interests over cotton exports under the current scheme have caused a vicious circle of more
intense political activities by interest groups and less independent cotton export policy making by the
government. Rent-seeking activities are rampant in both private and public sectors. Both public and private
organizations send large delegations to Delhi frequently, presumably because they judge that the expected
income gain from lobbying will be larger than the costs of their socially wasteful trips. For instance, it is
reported that the GUJCOT sends a delegation of twenty to thirty members to Delhi every three months. The
MAFED lobbies more than most public and private sector agencies, because its survival depends upon the
central government's continuing approval of the cotton monopoly procurement scheme in Maharashtra,
which is now under question. Without the monopoly scheme, the MAFED's sales would shrink as more
efficient traders enter the market. Not surprisingly, the Chief Minister of Maharashtra has been busy
lobbying for the extension of the monopoly scheme into the future.
Padded Crop Estimation by Interest Groups
The socially unproductive activities by interest groups do not end with the direct rent-seeking activities.
Indirect rent-seeking activities - manipulation of the crop estimation at the meeting of the Cotton Advisory
Board, for example - also account for a significant part of their strategy. Since the government decision on
cotton export quota is based on the consensus made by the Cotton Advisory Board, which basically consists
of the representatives of all concerned interest groups, each board member tends to bias its estimate of
cotton supply or demand in order to influence the level of the quota. While the CCI and the EICA tend to
inflate their estimates of cotton production in order to relax the export quota, the ICMF tends to report
higher levels of domestic cotton requirements in order to block cotton exports. Pressured by different
9 Generally, cotton yarn spun from long-staple cotton looks more beautiful but is more easily torn than cottonyam spun from short-staple cotton.
21
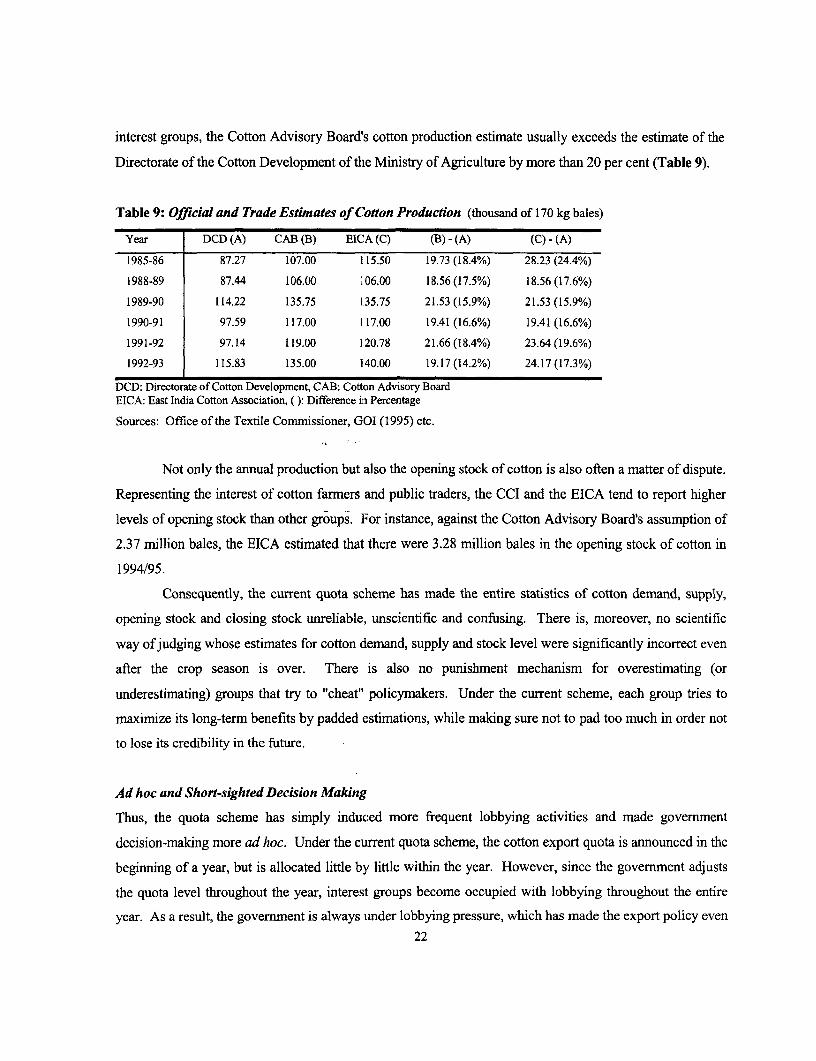
interest groups, the Cotton Advisory Board's cotton production estimate usually exceeds the estimate of the
Directorate of the Cotton Development of the Ministry of Agriculture by more than 20 per cent (Table 9).
Table 9: Official and Trade Estimates of Cotton Production (thousand of 170 kg bales)
Year DCD (A) CAB (B) EICA (C) (B) - (A) (C) - (A)
1985-86 87.27 107.00 i 15.50 19.73 (18.4%) 28.23 (24.4%)
1988-89 87.44 106.00 106.00 18.56(17.5%) 18.56(17.6%)
1989-90 114.22 135.75 135.75 21.53 (15.9%) 21.53 (15.9%)
1990-91 97.59 117.00 117.00 19.41 (16.6%) 19.41 (16.6%)
1991-92 97.14 119.00 120.78 21.66(18.4%) 23.64(19.6%)
1992-93 115.83 135.00 140.00 19.17(14.2%) 24.17(17.3%)
DCD: Directorate of Cotton Development, CAB: Cotton Advisory BoardEICA: East India Cotton Association, (): Difference in Percentage
Sources: Office of the Textile Comn-iissioner, GOI (1995) etc.
Not only the annual production but also the opening stock of cotton is also often a matter of dispute.
Representing the interest of cotton farmers and public traders, the CCI and the EICA tend to report higher
levels of opening stock than other groups. For instance, against the Cotton Advisory Board's assumption of
2.37 million bales, the EICA estimated that there were 3.28 million bales in the opening stock of cotton in
1994/95.
Consequently, the current quota scheme has made the entire statistics of cotton demand, supply,
opening stock and closing stock unreliable., unscientific and confusing. There is, moreover, no scientific
way of judging whose estimates for cotton demand, supply and stock level were significantly incorrect even
after the crop season is over. There is also no punishment mechanism for overestimating (or
underestimating) groups that try to "cheat" policymakers. Under the current scheme, each group tries to
maximize its long-term benefits by padded estimations, while making sure not to pad too much in order not
to lose its credibility in the future.
Ad hoc and Short-sighted Decision Making
Thus, the quota scheme has simply induced more frequent lobbying activities and made government
decision-making more ad hoc. Under the current quota scheme, the cotton export quota is announced in the
beginning of a year, but is allocated little by little within the year. However, since the government adjusts
the quota level throughout the year, intereslt groups become occupied with lobbying throughout the entire
year. As a result, the government is always umder lobbying pressure, which has made the export policy even22

more ad hoc and short-sighted. Even if a scientific estimation is made by the Cotton Advisory Board, the
export quota can be changed by politicians. Under the ongoing quota allocation scheme, the central
government's decision to allocate export quota has been influenced by whether the central government and
the cotton producing state government is headed by the same party or not. Also, the political background of
the incumbent prime minister and his cabinet members - whether they are pro-farmer or pro-handloom -
matters significantly for quota allocation.
Looking at the past trends, one may well wonder why so much cotton was exported under the quota
in the year 1986/87, when cotton production had dropped sharply from the year before (Table 10). It is also
difficult to explain why so little cotton export was allowed in 1991/92 compared to the year before, despite
the increase in cotton production. The more carefully one analyzes the trends of cotton exports from the
table, the more one is convinced that the export quota is decided erratically and inconsistently, with little
scientific basis.
Table 10: Trends of Cotton Exports (thousand of 170 kg bales)
Cotton Year Production Production Consumption by Import Export(as per DCD) (as per CAB) Mills
1980/81 7,010 7,800 7,678 -- 697
1981/82 7,884 8,400 7,123 50 400
1982/83 7,534 7,717 7,561 nil 665
1983/84 6,386 7,516 8,485 nil 353
1984/85 8,506 10,150 9,150 50 179
1985/86 8,727 10,700 9,167 nil 450
1986/87 6,905 9,500 9,520 nil 1,367
1987/88 6,432 9,000 9,491 300 44
1988/89 8,744 10,600 9,666 225 77
1989/90 11,422 13,575 10,236 nil 1,371
1990/91 9,759 11,700 10,757 - 1,190
1991/92 10,276 11,900 10,309 300 77
1992/93 12,067 13,500 11,281 115 1,376
1993/94 11,855 12,150 11,405 300 390
1994/95 11,756 13,850 11,937 589 108
Source: Office of the Textile Commissioner, GOI (1995)
Fluctuation of Cotton Prices and Speculation
Domestic political instability, the ad hoc decision for cotton exports by the government, and the fluctuation
23

of domestic cotton prices are all inter-related. Contrary to the belief of protectionists, restricting cotton
exports has worsened the cotton price fluctuation in India rather than suppressed it. Price fluctuation of
cotton is a serious problem not only for cotton farmers but also for mills, powerlooms and handlooms,
because a good part of the fluctuation is eventually passed from farmers to mills to weavers. For that
reason, even the weavers, who support the cotton export restriction, complain that the export quota should
not be announced by the government unless a comfortable price trend is established and correct position of
the crop is known.
The fact that government does not permit cotton futures trading demonstrates its determination to
control the cotton market and makes clear its distrust of private traders in India. This is unfortunate because
had cotton futures trading been allowed, as in many other countries, traders could have reduced price risks
and would have had greater incentive to buy up cotton during the harvest season, reducing the post harvest
price slump. Similarly, if there were a cotton futures market, mills could minimize the risk of lean season
price rises and disruption in cotton supply, enabling them to plan future production (Misra, 1993). The
limited access to the world market, ad hoc quota announcements by the government, and the lack of a cotton
futures market - all contribute to the sharp fluctuation of cotton prices in India.
Against the govemment expectation to prevent speculation by private cotton traders, the current ad
hoc quota announcement scheme has in fact enhanced the highly speculative nature of domestic cotton
trading. The speculative cotton traders sell more cotton when the narrower export quota is announced by
the central government, which causes further decreases in the cotton prices. A reliable and realistic
assessment of the crop, which India unfortunately lacks, would be a remedy to rampant speculation in cotton
and provide sound basis for taking decisions relating to domestic supply and prices.
3.3. IMPACTS ON THE SPINNING AND WEAVING INDUSTRY
Problems of the Hank Yarn Obligation in the Mill Sector
Among many regulations in the mill industry, the negative consequences of the hank yarn obligation, which
has forced spinning mills to unwillingly accept unprofitable business, are particularly serious. The current
obligation ratio of 50 per cent has no scientific basis, because the total production capacity of the handloom
sector accounts for some 30 per cent of the total textiles manufacturing capacity in India, which means
roughly 30 per cent of the yarn needs to be hank yarn in the domestic market. Consequently, the excessive
obligation rate for hank yarn production has caused an oversupply of hank yarn in the domestic market,
24

which, in turn, has further pushed the selling price of hank yarn for mills down.
The intention of the policy combination of the hank yarn obligation and excise duty exemption of
hank yarn was to subsidize inputs for handloom weavers. However, it is alleged that a significant amount of
hank yarn is rewound to cone yarn. Although no one knows how much hank yarn is converted to cone yam
illegally, the issue cannot be considered negligible. In fact, the government-appointed Hussain Committee
had to admit illegal rewinding of hank yarn to cone yarn exists (Ministry of the Textiles, 1990). While some
powerlooms purchase hank yarn, and convert it to cone yarn, some handloom weavers work as hank yarn
traders for powerloom weavers. Because hank yarn is less expensive and no excise duty is levied on it,
compared to 5.75 per cent excise dusty on cone yarn, the powerloom buyers can actually save money by this
informal business, and the handloom weavers also earn a trade commission. Obviously, this profit-seeking
activity is socially wasteful.
Poor enforcement of the hank yarn obligation is also a serious problem. One serious abuse resulting
from the hank yarn obligation policy is the false declaration made by some spinning mills that some of the
cone yarn made by them is actually hank yarn. This is done in collusion with the excise department officers.
The mills gain doubly: first the hank yarn obligation is met for the record without taking the trouble and
expense of making it; second, the excise duty on cone yarn (5.75 per cent) is saved since hank yarn is
exempted from excise duty. While private mills and state-owned mills have more or less satisfied the 50 per
cent hank yarn obligation, the National Textile Corporation (NTC) has recorded massive shortfalls of the
obligation fulfillment. This is partly because the central government enterprise has accumulated an
enormous amount of unrecoverable losses, and partly because the top management of the NTC has been
reserved for senior civil servants of the government, who have good connections with the secretaries and
joint secretaries of the Ministry of Textiles. Therefore, the Ministry of Textiles is a little reserved in
punishing and forcing their old colleagues to improve the percentage fulfillment of the obligation.
Naturally, the cost is eventually levied on private mills as an increased portion of the hank yarn obligation.
Recently the hank yarn obligation rule was modified to allow the transfer of the hank yarn quota
between mills. However, it is not easy for mills in, say, Tainil Nadu to find a partner in Assain, even if we
don't consider the transaction cost. Besides, the transfer permission of hank yarn obligation has also
hindered "healthy" competition in the Indian mill industry. It has not only caused the oversupply of hank
yam but also created a unique inefficient "niche business" for some uncompetitive mills. As it is officially
permitted to transfer hank yarn quota between mills, efficient mills that can make profits in the cone yarn
market have transferred part of their hank yarn obligations to inefficient ones, which have neither
competitiveness in cost nor quality in the cone yarn market. As a result, these inefficient mills lose all
25
managerial incentive to become efficient because they do not have to compete with efficient mills in the
cone market. Without considering efficiency, they can specialize in the hank yam market, and moreover,
the duty exemption of hank yarn with an intention to protect handlooms acts as a subsidy for them.
Low Profitability, Low Capacity Utilization and Illegal Closure of Mills
All these regulations have resulted in low profitability in the Indian mill industry. According to the Reserve
Bank of India (RBI), the gross profit as a percentage of sales was 7.3 per cent, and the net profit was
negative in 1992/93. These figures were significantly lower than the corresponding numbers for all the
Indian industries on average (11.0 per cent and 8.7 per cent, respectively) in the same year. The ICMF
claims that about a half of their member mills are "sick". The textile units accounted for about one fifth of
the total large number of large and medium "sick" units which had to receive credit of over Rs.10 million
(US$0.21 million) from banks in India. Many mills have been operating without making profits for years
because of the "exit" barrier, which restricts mill owners from closing their unprofitable mills.
Owner-wise, the problem is much more serious in the public sector. This is partly because public
mills are predominantly composite mills, which face severe competition from powerloom cloths, and partly
because the public sector has taken over a number of private mills that had became financially non-viable.
The production share of the public sector mill in the yarn market slipped from 19 per cent in 1988/89 to 11
per cent in 1994/95. Lack of modernization, low labor productivity, poor management and many other
undesirable business features are common to them. As a consequence, the losses of public sector mills
amounted to Rs.6 billion (US$125 million) in 1993/94, and the total losses of these mills between 1989/90 to
1993/94 accumulated to Rs.21.6 billion (US$450 million). Among the public sector textile companies, the
one in most serious trouble is the National Textile Corporation (NTC), which is the largest public cotton
spinning and weaving firm with annual sales of Rs.8 to 9 billion (US$167 to 188 million) and controls about
12 per cent of all the mills in the country. The NTC group has never made a profit since it was established
in 1968. Its losses have accumulated to Rs.40 billion (US$833 million), which equals the company's five-
year total sales. The reform of the NTC is one of the most difficult tasks for the government. Although the
NTC has stopped taking over financially non-viable private mills, some of the state textile corporations are
still taking them over.
The negative impact of the protection of the textile machinery industry is also serious in India.
Because of the high import duty, the CIF prices of imported textile machinery have been much higher than
the domestic machinery price. Besides, the foreign exchange required for the machinery imports has to be
re-covered from the open market. As a result of the prohibitively high cost of importing textile machinery,
26

mills often have to wait for six to eight years for the delivery of the new machinery produced by domestic
firms which had very limited production. Mill owners have complained about not only the slow delivery
but also the poor quality of domestic textile machinery, which has lowered the productivity of mills. On top
of this, high interest rates have contributed to the already high cost of capital for mills. Consequently, there
are many mills that have not invested in their obsolete textile machinery for decades in India.
In the normal business environment, a company that makes losses every year will sooner or later
disappear. However, because of the "exit" barrier - the restriction for mill owners to close their unprofitable
units - many mill owners have been unable to close loss-making mills that virtually stopped operating many
years ago. As a consequence, the Indian mill sector as a whole has recorded extremely low capacity
utilization rates. The problem of low capacity utilization is even more serious for composite mills (which
have both spinning and weaving capacities) than spinning mills. Half of the weaving capacity in the mill
sector is idle, while the spinning utilization rate was stagnating at around 70 to 80 per cent from 1980/81 to
1993/94. In addition, the loom utilization rate of the composite mills fell sharply from 78 per cent to 54 per
cent over the same period. The other social problem associated with the "exit" barrier is illegal closure. As
admitted by the Hussain Committee, a good number of the closures were illegal, although the exact numbers
will be never known (Ministry of the Textiles, 1990). This is primarily because mill owners wanted to avoid
lengthy legal and other procedures required by the government. Some of the mill owners are alleged to have
employed gangsters to make the illegal closure smooth and secret.
Unexpected Competition Between Powerlooms and Handlooms
Not only for efficiency but also for equity purposes, the government policy has not been successful in India.
Initially the government expected to protect the handloom sector, the poorest group, by enforcing the
regulations in the mill sector. However, it has turned out that it was the powerloom sector, rather than the
handloom sector, which largely benefited from the government policy. As a result of the excessive
regulations in the mill sector, the share of mill-made cloth in the cotton textile market has declined sharply
from 36 per cent in 1980/81 to 6 per cent in 1994/95. During the same period, while the share of handloom
cloth has been stagnant, the powerloom sector increased its share from 39 per cent to 72 per cent. In the
export market, mill-made fabric exports have remained stagnant, while fabric exports by powerlooms have
recorded a steady increase. These trends are expected to continue.
At the time of the independence, there were few powerlooms. In the past few decades, however,
the powerloom sector has emerged as the single largest cloth production subsector, which has not only cut
the share of composite mills but also adversely affected handlooms. As already mentioned, this is largely as
27

a result of the govemment policy, which treated powerlooms and handlooms equally as decentralized units
as opposed to organized sector units. The policy mix of the hank yarn obligation and the excise duty
exemption for hank yam, for example, induced rewinding of hank yam to cone, which helped powerlooms,
leaving less hank yam in the market.
It is ironic that the textile machinery industry and synthetic yam industry as "infant" industries,
which were supposed to develop under import substitution policy, never became intemationally competitive,
while the powerloom sector, which did not receive any "official" support from the govemment did benefit
unofficially from the government policies and grew rapidly. Powerlooms are now competing with
handlooms in the same market. While mills concentrate on the cloth woven from medium-count yam from
lOs to 30s, powerlooms and handlooms produce high share of cloth woven either by coarse yarn or fine yam
of over 40s count. This implies that powerlooms compete with handlooms more than they do with mills. In
fact, most states that have registered a marked decline in handlooms have become important powerloom
centers. As recognized by the Mehta Committee, while the growth of the powerloom sector did not have
such seriously adverse effects on handlooms in the western part of India, it adversely affected handlooms in
the southern part of the country, such as Tamil Nadu and Andhra Pradesh. In addition, handlooms that are
located near urban areas are facing even more intense competition from powerlooms because of smaller
transport costs from weavers to consumers.
28

CHAPTER 4
SIMULATION OF TILE LIBERALIZATION
4.1. SIMULATION MODEL
Choice of the Multi-Market Model
The problem of the cotton export policy is manifest from earlier chapters, and liberalization in the cotton
sector appears to be much needed in India. However, the policy analysis is not complete without assessing
how feasible the reform task is. This requires one to find the potential gainers and losers resulting from the
policy change. To date, no research has been conducted to quantify the impacts of liberalization policy in
the Indian cotton sector. Although it is easily predictable that weavers will be hit by the reform, it is not
easy to compute how seriously they will be affected and how much the government needs to spend to
compensate them.
The simulation attempted for this research is based on a multi-market model. The objective of the
modeling approach is to develop a tool that could be adopted in a wide variety of situations without
imposing undue data requirements, while capturing the pervasive linkages that characterize commodity
factors and product markets. In other words, the modeling approach is as an effective compromise between
overly simple, easily-implemented single-commodity approaches and more comprehensive but more
complex general equilibrium approaches for the analysis of policy issues."'
If we apply a single-commodity partial equilibrium model to the case of the Indian cotton sector,
income changes of suppliers and consumers in each market - cotton, yarn, and textiles - are measured
independently, assuming no linkages among the three markets. However, this assumption is highly
unrealistic, because all three markets are related with each other. Cotton spinning mills, for example, are
consumers in the cotton market and suppliers in the yarn market. Similarly, cotton textile weavers are
consumers in the yarn market while they are suppliers in the textile market, as depicted below. Therefore,
the result of the single-commodity partial equilibrium model for the Indian cotton yarn market is likely to
give misleading answers.
10 The multi-market model was first proposed by Braverman and Hammer at the World Bank. The technicalexplanation for the modeling approach is detailed in Sadoulet and de Janvry (1993).
29

Cotton Market (India) => Cotton Market (Rest of the World)Export
U Cotton U Cotton
Cotton Yarn Market (India) (Cotton Yarn Market (Rest of the World)Export
U Yam U Yam
Cotton Textiles Market (India) => C(otton Textiles Market (Rest of the World)Export
On the other hand, it is also possible to develop a more complex general equilibrium model. In the general
equilibrium-type simulation, one can estimate not only the income changes of farmers, spinning mills and
weavers but also the macroeconomic impacts of the cotton sector reform. However, this modeling approach
requires inordinate data requirements, and it makes sense to choose this approach only if the cotton sector is
large enough to influence the macroeconomic indicators. Although cotton is one of the major agricultural
commodities produced in India, the cotton sector does not account for more than 5 per cent of the country's
GDP. Cotton for India is not like diamonds for Botswana, cocoa for Ghana, oil for Nigeria, or copper for
Zambia. For that reason, a general equilibrium modeling approach was not chosen.
Innovation of the Model
One of the innovations that distinguish this model from other ordinary multi-market models is the
endogenous computation of price elasticities. Because of the vertical integration of the three markets - the
consumer in the cotton market is a supplier in the yarn market, and the consumer in the yarn market is a
supplier in the textile market - it is not appropriate to assume elasticities in each market independently. For
example, there should be a linkage between the demand elasticity of cotton in the cotton market and supply
elasticity of yarn in the yarn market, for example, because both of the elasticities depend on the behavior of
the mill industry. Therefore, among twenty elasticities in the three Indian markets, only four elasticities are
given exogenously, with the other sixteen computed endogenously based on the cost share.
Another innovation of this model is its ability to distinguish short-run and long-run simulation
results unlike ordinary multi-market models. In this model, it is assumed that the share of capital is a
fixed cost in the short-run (i.e., capital is treated as an exogenous value, which cannot be changed by the
manufacturers) and becomes a variable cost (i.e., capital becomes endogenous) in the long-run. These
two innovations are made possible by assuming the endogenous price relations among elasticities as
30

detailed in the subsequent section in this chapter.
Structure of the Model
The model consists of six interrelated markets - cotton markets, cotton yarn markets, and cotton textile
markets, all of which are in India and in the rest of the world. The exogenous policy factors in the
simulation are the removals of export quotas and the hank yarn obligation. Each market has a supply and
demand function, and the equilibrium flows depend on the changes in prices. For example, cotton yarn
supply is a function of cotton consumer price and yarn producer price, while cotton yarn demand is a
function of yam consumer price and textiles producer price in India, and the excess supply of yam in the
Indian market is exported to the rest of the world. The change in the cotton yarn supply in India is equal to
the sum of (i) the supply elasticity of cotton with respect to the cotton consumer price times the change in
the cotton consumer price and (ii) the supply elasticity with respect to the yarn producer price times the
change in the yam producer price.
The changes in prices in India are the results of new export policies, tax rates, and subsidy schemes.
For instance, the cotton consumer price goes up when the government removes the cotton export quota
and/or increases the cotton consumer tax rate. Market clearing conditions and identities are detailed below.
The model is based on the large country assumption; India's export increase (or decrease) of cotton or yarn
will affect the world price of that commodity.
Cotton MarketIndian Market World MarketSc (Ppc) = Dc (Pcc, Ppy) + Xc Swc (Pwc) + Xc = Dwc (Pwc, Pwy)s.t. Ppc = Pwc /txc x tpc
Pcc = Pwc / txc x tccPpy = Pwy / txy x tpy
Yarn MarketIndian Market World MarketSy (Pcc, Ppy) = Dy (Pcy, Ppt) + Xy Swy (Pwc, Pwy) + Xy = Dwy (Pwy, Pwt)s.t. Pcc = Pwc / txc x tcc
Ppy = Pwy / txy x tpyPcy = Pwy / txy x tcyPpt = Pwt / txt x tpt
Textiles MarketIndian Market World MarketSt (Pcy, Ppt) = Dt (Pct) + Xt Swt (Pwy, Pwt) + Xt = Dwt (Pwt)s.t. Pcy =Pwy / txy x tcy
31

Ppt = Pwt l txt x tptPct = Pwt / txt x tct
whereEndogenous VariablesSc = Supply of cotton, India Swt = Supply of textiles, Rest of the worldDc = Demand of cotton, India Dwt = Demand of textiles, Rest of the worldSwc = Supply of cotton, Rest of the world Ppc = Producer price of cotton, IndiaDwc = Demand of cotton, Rest of the world Pcc = Consumer price of cotton, IndiaXc = Export of cotton, India Pwy = World price of yarnSy = Supply of yarn, India Ppy = Producer price of yarn, IndiaDy = Demand of yarn, India Pcy = Consumer price of yarn, IndiaXy = Export of yarn, India Pwy = World price of yarnSwy = Supply of yarn, Rest of the world Ppt = Producer price of textiles, IndiaDwy Demand of yarn, Rest of the world Pct = Consumer price of textiles, IndiaSt = Supply of textiles, India Pwt = World price of textilesDt = Demand of textiles, IndiaXt = Export of textiles, India
Exogenous Variables (Policy Option Variables)txc = Cotton export tax rate (quota equivalent), Indiatpc = Cotton producer tax / subsidy rate, Indiatcc = Cotton consumer tax / subsidy rate, Indiatxy = Yarn export tax rate (quota equivalent), Indiatpy = Yarn producer tax / subsidy rate, India.tcy = Yarn consumer tax / subsidy rate, Indiatxt = Textiles export tax rate (quota equivalent), Indiatpt = Textiles producer tax / subsidy rate, indiatct = Textiles consumer tax / subsidy rate, India
Iniial Values
Data used to calibrate the simulation model are based on the official data in various sources (Office of the
Textiles Commissioner, 1994-2000, EICA, 1995-2000, and ICAC, 1994-2000). As for the cotton
production in India, the initial values are based on the data of the Cotton Advisory Board, rather than the
data of the Ministry of Agriculture in order to make them consistent with other values. Although there are
many varieties of cotton, the spinnable cotton market is not divided by variety in this model. This is partly
due to the lack of sufficient data and partly because both long-staple cotton and medium-staple cotton, and
medium-staple cotton and short-staple cotton are substituted for each other. In other words, cotton is treated
as homogeneous in this model so far as it is spinnable.
While spinnable cotton is treated in one category in the model, non-spinnable cotton (deshi cotton)
is excluded from the simulation. The two main reasons are that the market of non-spinnable cotton is
completely different from the market of spinnable cotton, and that non-spinnable cotton is freely exported32

by private traders in the open bidding market in India. On the supply side, farmers cannot very easily switch
from non-spinnable cotton to spinnable cotton, because of the different soil conditions. On the demand side,
deshi cotton is not consumed by downstream textile industries but used for other industrial purposes. All
the initial values used in the simulation are shown in Table 11.
Table 11: Initial Values
Supply Demand Export Supply Demand Producer Consumer WorldCommodity India India India World World Price Price Price
(rnkg) (mkg) (mkg) (mkg) (mkg) (Rs/kg) (Rskg) ts/kg)Cotton 1,900 1,800 100 16,500 16,600 53 55 61
Cotton Yam 1,500 1,300 200 16,600 16,800 91 97 106
Cone Yarn 1,050 850 93 1oo
Hank Yam 450 450 83 89
Cotton Textiles 1,400 1,000 400 9,600 10,000 217 221 221
Powerloom 960 600 360 216
Handloom 440 400 40 219
Sources: EICA (1995), ICAC (1994), Office of the Textile Conmmissioner (1995) etc.
Assumption on Hank Yarn
Another assumption is in regards to hank yarn. In the Indian yarn market, two kinds of cotton yarn - cone
yarn and hank yarn - are traded. Cone yarn is consumed by the powerlooms and composite mills while
hank yam is exclusively processed by handlooms. No hank yarn is exported from India as there is no world
market. It is assumed that so far as the current hank yarn obligation policy is not subject to change, spinning
mills will keep winding 30 per cent (i.e., current rate) of their domestic cotton yam supply in hank form.
If the hank yarn obligation is phased out, spinning mills will supply only cone yam. This
assumption is reasonable because the production process of hank yarn is exactly the same as cone yam
except for the final process - winding in either cone form or hank form, which is why it is easy for mills to
switch from hank yarn production to conce yarn production. With no hank yarn in the market, handloom
weavers will have to purchase cone yarn in the domestic market and rewind it to hank form by paying extra
rewinding costs.
Price Elasticities
This multi-market model computes some of the price elasticities endogenously. Although various empirical
studies attempted to measure price elasticities for cotton and textiles in the past (Goswami, 1990, Ministry
33

of Supply and Textiles, 1985, and Coleman and Thigpen, 1991), there have been no comprehensive studies
to cover all the twenty elasticities which are needed in the model. Most of the past studies focused on the
income and price elasticities of demand for cotton textiles by consumers (disaggregated by income levels),
and what we can learn from them is that price elasticities in the cotton sector are generally very small.
In the multi-market model, the consistency among different elasticities is important. Considering
that all the three markers are related with each other, it is not appropriate to mix the different elasticities
from different sources into one elasticity set in this simulation model. Therefore, rather than relying on the
results of past studies, this model computes most of the elasticities endogenously by assuming that the ratios
among the elasticities depend on the cost structure for producers. In other words, the absolute value of the
elasticity of demand of one input with respect to the price of that input divided by the supply elasticity of their
final product with respect to the price of that product is equal to the cost share of the particular input in the
long-run analysis (See Appendix A for proof). For example, the ratio between the supply elasticity of yarn
with respect to cotton price and the supply elasticity of yarn with respect to yam price is - 0.6 (-0.12/0.2)
because 60 per cent of the total cost of yarn production is considered to be cotton. In the short-nm,
however, elasticities tend to be smaller as capital costs are fixed. For example, assuming that the capital
cost for a spinning mill is 20 per cent, the elasticity of cotton demand with respect for the yarn price in the
short-run is 20 per cent smaller than in the long-run. All the elasticities for India are shown in Table 12.
Table 12: Price Elasticities
(A) Short-term Elasticities (India) (B) Long-term Elasticities (India)Elasticitv fer r I p; PY PT Elasticity for \ w.r.t. pC Py PT
Farmer Sc 0.200 l T Farmer Sc 0.200Spinning DC -0.072 0.096 l Spinning Dc -0.072 0.120Mill Sy -0.120 0.160 Mill Sy -0.120 0.200Textile Dy -0.032 0.072 Textile Dy -0.032 0.080
Weaver ST _ _-0.080 0.180 Weaver ST -0.080 0.200Consumer DT - - -0.100 Consumer DT -0.100
where S= Cotton Supply, DC = Cotton Demand, Sy = Yarn SupplyDy = Yarn Demand, ST Textile Supply, DT Textile DemandPc = Cotton Price, Py = Yarn Price, PT =Textile Price
bold (e.g. 0.02 for the supply elasticity of cotton with respect to cotton farmer in India) numbers are given exogenously, and theother numbers are computed endogenously.
The absolute values of the elasticities for the rest of the world are set to be two thirds of the
equivalent elasticities for India, because cotton, cotton yarn and textiles are produced not only in developing
countries but also in developed countries, vvhere elasticities are generally lower than developing countries.
34

Also, in order to avoid the dependence of the simulation results on the elasticity assumption, simulations are
attempted with four different sets of elasticities. The results are fairly similar with each other (See
Appendix B for details).
Integrating Markets
Given the market clearing conditions, identities, initial values for endogenous and exogenous variables, and
elasticities, the simulation model solves the simultaneous equations by using inverse matrices. Although
there are six equations for six markets, we can integrate them into three equations by plugging the variable
of export from India into the rest of the world market. The following shows the flows of computation in the
multi-market model.
Sc (Pwc, txc, tpc) + Swc (Pwc) = Dc (Pwc, txc, tcc, Pwy, txy, tpy) + Dwc (Pwc, Pwy)Sy (Pwc, txc, tcc, Pwy, txy, tpy) + Swy (Pwc, Pwy) = Dy (Pwy, txy, tcy, Pwt, txt, tpt) + Dwy (Pwy, Pwt)St (Pwy, txy, tcy, Pwt, txt, tpt) + Swt (Pwy, Pwt) = Dt (Pwt, txt, tct) + Dwt (Pwt)
wherePwc = Ppc x txc / tpc Pcc x txc / tccPwy = Ppy x txy /tpy =Pcy x txy / tcyPwt = Ppt x txt / tpt = Pct x txt / tct
Cotton Market (India and the Rest of the World){(dSc/dPc)/(Sc/Ppc) x (dPpc/dPwc)/(Ppc/Pwc) x Sc x (dPwc/Pwc)}
+ {(dSc/dPpc)/(Sc/Ppc) x (dPpc/dtxc)/(Ppc/txc) x Sc x (dtxc/txc)}+ {(dSc/dPpc)/(Sc/Ppc) x (dPpc/dtpc)/(Ppc/tpc) x Sc x (dtpc/tpc)}+ { (dSwc/dPwc)/(Swc/Pwc) x Swc x (dPwc/Pwc)}= {(dDc/dPcc)/(Dc/Pcc) x (dPcc/dPwc)/(Pcc/Pwc) x Dc x (dPwc/Pwc)}+ { (dDc/dPcc)/(Dc/Pcc) x (dPcc/dtxc)/(Pcc/txc) x Dc x (dtxc/txc)}+ {(dDc/dPcc)/(Dc/Pcc) x (dPcc/dtcc)/(Pcc/tcc) x Dc x (dtcc/tcc)}+ {(dDc/dPpy)/(Dc/Ppy) x (dPpy/dPwy)/(Ppy/Pwy)x Dc x (dPwy/Pwy)}+ {(dDc/dPpy)/(Dc/Ppy) x (dPpy/dtxy)/(Ppy/txy) x Dc x (dtxy/txy)}+ {(dDc/dPpy)/(Dc/Ppy) x (dPpy/dtpy)/(Ppy/tpy) x Dc x (dtpt/tpt)}+ {(dDwc/dPwc)/(Dwc/Pwc) x Dwc x (dPwc/Pwc)}+ {(dDwc/dPwy)/(Dwc/Pwy) x Dwc x (dPwy/Pwy)}
where(dSc/dPc)/(Sc/Ppc) = Supply elasticity of cotton with respect to cotton producer price, India(dDc/dPcc)/(Dc/Pcc) = Demand elasticity of cotton with respect to cotton consumer price, India(dDc/dPpy)/(Dc/Ppy) = Demand elasticity of cotton with respect to yam producer price, India(dSwc/dPwc)/(Swc/Pwc) = Supply elasticity of cotton with respect to cotton producer price, World(dDwc/dPwc)/(Dwc/Pwc) = Demand elasticity of cotton with respect to cotton consumer price,(dDwc/dPvwy)/(Dwc/Pwy) World
= Demand elasticity of cotton with respect to yam producer price, World35

Yarn Market (India and the Rest of the Wor:id){(dSy/dPcc)/(Sy/Pcc) x (dPcc/Pwc)/(Pcc/Pwc) x Sy x (dPwc/Pwc)}
+ {(dSy/dPcc)/(Sy/Pcc) x (dPcc/dtxc)l(Pcc/txc) x Sy x (dtxc/txc)}+ {(dSy/dPcc)/(Sy/Pcc) x (dPcc/tcc)/(Pcc/tcc) x Sy x (dtcc/tcc)}+ {(dSy/dPpy)/(Sy/Ppy) x (dPpy/dPwy)/(Ppy/Pwy) x Sy x (dPwy/Pwy)}+ {(dSy/dPpy)/(Sy/Ppy) x (dPpy/txy)/(Ppy/txy) x Sy x (dtxy/txy)}+ {(dSy/dPpy)/(Sy/Ppy) x (dPpy/dtpy)/(Ppyltpy) x Sy x (dtptltpt)}+ {(dSwy/dPwc)/(Swy/Pwc) x Swy x (dPwc[Pwc)}+ {(dSwy/dPwy)/(Sw+y/Pwy) x Swy x (dPwy/Pwy)}
= {(dDy/dPcy)/(Dy/Pcy) x (dPcy/dPwy)/(Pcy/Pwy) x Dy x (dPwy/Pwy)}+ {(dDy/dPcy)/(Dy/Pcy) x (dPcy/dtxy)/(Pcy/txy) x Dy x (dtxy/txy)}+ {(dDy/dPcy)/(Dy/Pcy) x (dPcy/dtcy)/(Pcyltcy) x Dy x (dtcy/tcy)}+ {(dDy/dPpt)/(Dy/Ppt) x (dPpt/dPwt)/(Ppt/Pwt) x Dy x (dPwt/Pwt)}+ {(dDy/dPpt)/(Dy/Ppt) x (dPpt/dtxt)/(Ppt/tKt) x Dy x (dtxt/txt)}+ {(dDy/dPpt)/(Dy/Ppt) x (dPpt/dtpt)/(Ppt/tpt) x Dy x (dtpt/tpt)}+ {(dDwy/dPwy)/(Dwy/Pwy) x Dwy x (dPw%y/Pwy)}+ {(dDwy/dPwt)/(Dwy/Pwt) x Dwy x (dPwl/ Pwt)}
where(dSy/dPcc)/(Sy/Pcc) = Supply elasticity of yarn with respect to cotton consumer price, India(dSy/dPpy)/(Sy/Ppy) = Supply elasticity of yarn with respect to yarn producer price, India(dDy/dPcy)/(Dy/Pcy) = Demand elasticity of yarn with respect to yarn consumer price, India(dDy/dPpt)/(Dy/Ppt) = Demand elasticity of yarn with respect to textiles producer price, India(dSy/dPwc)/(Swy/Pwc) = Supply elasticity of yarn with respect to cotton consumer price, World(dSwy/dPwy)/(Swy/P wy) = Supply elasticity of yarn with respect to yam producer price, World(dDwy/dPwy)/(Dwy/Pvwy) = Demnand elasticity of yarn with respect to yarn consumer price, World(dDwy/dPwt)/(Dwy/Pwt) = Demand elasticity of yarn with respect to textiles producer price, World
Textiles Market (India and the Rest of the World){(dSt/dPcy)/(St/Pcy) x (dPcy/dPwy)/(Pcy/Pwy) x St x (dPwy/Pwy)}
+ {(dSt/dPcy)/(St/Pcy) x (dPcy/dtxy)/(Pcy/txy) x St x (dtxy/txy)}+ {(dSt/dPcy)/(St/Pcy) x (dPcy/dtcy)/(Pcy/tcy) x St x (dtcy/tcy)}+ {(dSt/dPpt)/(St/Ppt) x (dPpt/dPwt)/(Ppt/Pwt) x St x (dPwt/Pwt)}+ {(dSt/dPpt)/(St/Ppt) x (dPpt/dtxt)/(Ppt/txt) x St x (dtxt/txt)}+ {(dSt/dPpt)/(St/Ppt) x (dPpt/dtpt)/(Ppt/tpt) x St x (dtpt/tpt)}+ {(dSwt/dPwy)/(Swt/Pwy) x Swt x (dPwy/Pwy)}+ {(dSwt/dPwt)/(Swt/Pwt) x Swt x (dPwt/Pwt)}= {(dDt/dPct)/(Dt/Pct) x (dPct/dPwt)/(Pct/Pwt) x Dt x (dPwtlPwt)}+ {(dDt/dPct)/(Dt/Pct) x (dPct/dtxt)/(Pct/txt) x Dt x (dtxt/txt)}+ {(dDt/dPct)/(Dt/Pct) x (dPct/dtct)/(Pct/tct, x Dt x (dtct/ tct)}+ {(dDwt/dPwt)/(Dwt/Pwt) x Dwt x (dPwt/Pwt)}
where(dSt/dPcy)/(St/Pcy) = Supply elasticity of textiles with respect to yarn consumer price, India(dSt/dPpt)/(St/Ppt) = Supply elasticity of textiles with respect to textiles producer price, India(dDt/dPct)/(Dt/Pct) = Demand elasticity of textiles with respect to textiles consuner price, India
36

(dSwt/dPwy)/(Swt/Pwy) = Supply elasticity of textiles with respect to yarn consumer price, World(dSwt/dPwt)/(Swt/Pwt) = Supply elasticity of textiles with respect to textiles producer price, World(dDwt/dPwt)/(Dwt/Pwt) = Demand elasticity of textiles with respect to textiles consumer price,
World
4.2. SIMULATION RESULTS WITHOUT COMPENSATION
Export Liberalization - Income Transfer to Farmers
Eight different cases where export quotas for cotton and yarn are phased out are simulated to measure the
net income" changes of various groups in the research. Among them, first, two cases with no compensation
schemes are simulated in this section. In Case 1, the exports of cotton and cotton yarn are liberalized, but
the hank yarn obligation policy is still kept. In Case 2, not only cotton and cotton yarn export restrictions
but also the hank yarn obligation are phased out. In neither of the cases are special subsidies provided to the
losing groups.
According to the simulation, the removal of cotton and yarn export quotas will result in the income
transfer from cotton farmers to textile weavers as a result of the domestic cotton price increase (Case 1).
While cotton farmers' net income will increase by 15 per cent, the averaged net income of the weaving
industry will decline by 6 per cent. Compared to powerloom weavers, handloom weavers are hit even more
seriously by free cotton exports - their net income will decrease by 12 per cent (Table 13). The net income
of the spinning industry will change significantly by the export liberalization, because both cotton (input for
spinning mnills) prices and cotton yarn (output) prices will go up.
Table 13: Net Income Changes Without Compensation
Present Case Case I Case 2Export Policy Cotton and yam No export quotas
Policy Changes export quotasHank Yam 50% 50% NoneObligationCotton Farmer 0% +15% +15%
Net Income Changes Spinning Mill 0% +1% +15%Textile Weaver 0% -6% -8%
Powerloom 0% -3% 4%Handloom 0% -12% -16%
Total 0% 2% +2%
By definition in this analysis, net income is gross margin (i.e., total revenue minus raw materials cost). It isnot the same as profit or welfare, but since the cost structure of each producer is not known and the measurement ofwelfare can be subjective, we have measured the margin as an indicator of welfare.
37

If not only the export quota but also the hank yarn obligation is phased out, handloom weavers will
be affected even more adversely. This income gain of the spinning industry (15 per cent) is as a result of the
hank yarn liberalization, which allows spinning mills to supply cone yarn as much as possible. On the
contrary, the income decline of handlooms will increase from 12 per cent (Case 1) to 16 per cent (Case 2),
because handloom weavers will have to purchase cone yarn in the domestic market and pay extra costs to
rewind it to hank yarn. Considering that most handloom weavers are already very poor, this level of income
loss will be intolerable for them. In short, if the government removes all the export restrictions and the hank
yarn obligation, many handloom weavers will not be able to survive.
4.3. SIMULATION RESULTS WITH COMPENSATION
Necessity of Compensatory Schemes
Considering the magnitude of the liberalization, it is necessary for the government to provide some sort of
compensation to textile weavers. In the following sections, six cases with different types of compensation
programs are simulated to assess each program from the viewpoint of effectiveness and financial cost.
While exports of cotton and yarn are fully liberalized in all the six cases, the hank yarn obligation is not
phased out in two cases (Cases 3 and 6). Textile weavers will receive several benefits from the government
to offset their losses due to the export liberalization. The yarn consumer tax (currently from 2 to 4 per cent)
and the textile producer tax are abolished in all the six cases. In three cases (Cases 6, 7, and 8), all the
weavers receive direct producer subsidies of 5 per cent. Moreover, the government provides handloom
weavers additional subsidies (5 per cent of the cone yarn purchase price) to convert cone yarn to hank in two
cases (Cases 5 and 8).
Although these compensation programs cost the government, cotton farmers are not taxed for their
extra income to balance the budget in any of the cases. This will make the analysis realistic, when we
consider the political strength of farmers in India. Also the cotton yarn producer tax is not changed from the
present levels of 5.75 per cent for cone yarn and from 0 to 3.45 per cent for hank yam in any cases. Both
the comparisons between Case 4 and Case 5 (Table 14) and between Case 7 and Case 8 (Table 15) suggest
if the hank yarn obligation is removed, extra subsidies will be needed to compensate the income losers.
Assuming that the government can efficiently distribute subsidies to them, both the powerloom and
handloom weavers will be rescued (Cases 5 and 8).
38

Table 14: Net Income Changes With Compensation (Tax Exemption for Weavers)
Case 3 Case 4 Case 5Export Policy No export quotas
Policy Changes Hank Yam 50% None NoneObligationCompensatory No tax (weaver) No tax (weaver) No tax (weaver)Policies and cone yam
consumer subsidy(handloom)
Cotton Farmer +15 % +15 % +15 %Net Income Spinning Mill +1 % +15 % +15 %Changes Textile Weaver -2 % -3 % -1%
Powerloom +1 % -0 % -0 %Handloom -7 % -11 % -3 %
Total +4% +5 % +6 %
Table 15: Net Income Changes With Compensation (Subsidies to Weacers)
Case 6 Case 7 Case 8Export Policy No export quotas
Policy Changes Hank Yam 50% None NoneObligation ICompensatory Producer subsidy Producer subsidy Producer subsidyPolicies (weaver) (weaver) (weaver) and yarn
consumer subsidy(handloom)
Cotton Farmer +15 % +15 % +15 %Net Income Spinning Mill +0 % +15 % +15 %Changes Textile Weaver +5 % +3 % +4 %
Powerloom +6 % +6 % +6 %Handloom +1 % -3 % +2%
Total +7% +8 % +9 %
Changes in Export Values
The simulation analysis has so far focused on the income changes of various groups, paying special
attention to handloom weavers. When we analyze the impacts of the policy reform, however, there are two
other important factors to be considered - changes in exports and government revenue. This section
analyzes how the reform will affect the exports of cotton, yarn, and textiles.
First, the export liberalization will undoubtedly increase the volume of cotton export, as the cotton
farmers respond to the increase in domestic cotton price. Not only in terms of volume but also in terms of
value cotton exports will increase by 37 to 44 per cent in value (Table 16). This is because India is not a
major exporter of cotton (even after the liberalization) in the world market, and hence the export increase
does not have major impacts on the world price. The hank yarn liberalization decreases cotton exports, as
the spinning mills consume more cotton (Cases 2 and 8).
Second, although cotton yarn exports will also increase, it will not be as much as cotton exports39

either in terms of volume or value. The relatively modest increase in cotton yarn exports is as a result of the
increase in cotton price, which discourages domestic mills from consuming cotton. Among the eight cases
simulated, the value cotton exports is the largest, when the hank yarn obligation is phased out while no
compensatory policies are introduced (Case 2). It is because the spinning industry has an incentive to
produce more cotton yarn while the weaving industry does not consume as much yarn without subsidies,
which results in more surplus yarn in the domestic market.
Third, while exports of cotton and yarn will increase, cotton textile export will slightly decrease
both in volume and value ternms, if the government does not subsidize the textile weavers (Cases 1 and 2).
This is because waevers will produce less textile when the yarn price increases. However, if the government
compensates the powerlooms and handlooms, the export of cotton textiles will slightly increase (Cases 4
and 8). As a result of the increase in cotton exports, the modest increase in cotton yarn exports and stable
cotton textile exports after the policy reform, the total value of exports of the entire cotton sector will
increase, though not to a large extent.
Table 16: Changes in Export Values
Case I | Case2 | Case4 | Case 8Export Policy No export quotas
Policy Hank Yam 50% None 50% NoneChanges Obligation
Compensatory None None No tax (weaver) Producer subsidyPolicies (weaver) and yam
consumer subsidy(handloom)
Export Cotton +44% +37 % +44% +37 %Value Yam +2 % +7% +2 % +3 %Changes Textile -1% -2 % +1 % +2 %
Total +2 % +2% +3 % +4%
Financial Cost of the Compensatory Scheme
Compared to its modest impacts on exports, the financial costs of the liberalization-cum-compensation will
be a matter of greater concern for the government. If direct subsidies are not provided to textile weavers,
the government can still run a budget surplus in the cotton sector without levying producer tax (Cases 3 and
4 in Table 17). However, as apparent from the previous analysis, handloom weavers will not be relieved by
such compensation schemes without direct subsidies, as their net income will decline by 7 to 11 per cent
(Table 14). In other words, this level of compensation is not enough for handloom weavers, even if the
hank yarn obligation is still enforced.
40

Table 17: Changes in Government Revenue - Tax Exemption for Weavers (Rs. million per year)
Case 3 Case 4 Case 5
Export Liberalization No export quotas
Hank Yarn Obligation 50% None
Cotton Consumer Tax on Mills 4,225 (+489) 4,242 (+506) 4,242 (+506)
Yarn Consumer Tax on Weavers 4,100 (-2,591) 4,224 (-2,467) 4,224 (-2,467)
Cone Yam Subsidy for Handlooms 0 (0) 0 (0) -4,496 (-4,496)
Textile Producer Tax on Weavers 0 (-4,229) 0 (-4,229) 0 (-4,229)
Textile Producer Subsidy for Weavers 0 (0) 0 (0) 0 (0)
Total Revenue 8,325 (-6,330) 8,467 (-6,189) 3,970 (-10,685)
(: Change from the present revenue. For example, in Case 3, yarn consumer tax will decrease from the present level of Rs.6,691million to Rs.4,100 million per year. The difference is Rs.2,591 million.
When both the export quotas and the hank yam obligation are removed, the level of the government
deficit needed to fully compensate the powerloom weavers' losses is Rs.2,989 million (US$62 million)
(Case 7 in Table 18). Further, in order to compensate the losses of handlooms, the governnent will have to
spend Rs.2,256 million (US$47 million) for handloom subsidies annually (Case 8 in Table 18). While the
textiles producers receive subsidies, cotton farmers will not be taxed to balance the budget, because taxing
the farmers, who are politically strong, is nearly impossible. As a result, in order to make no one worse off,
the total annual government deficit in the cotton sector will be Rs.5,246 million (US$109 million),
compared to the present annual revenue of Rs.15,050 million (US$313 million) with a difference of
R,s.20,296 million (US$423 million), an amount little over 25 per cent larger than the current government
revenue in the Indian cotton sector. If we take the administrative costs into account, this level of the
government expenditure will become even larger; the entire cost could be nearly US$500 million.
Table 18: Changes in Government Revenue - Producer Subsidy for Weavers (Rs. million per year)
Case 6 Case 7 Case 8
Export Liberalization No export quotas
Hank Yam Obligation 50% None
Cotton Consumer Tax on Mills 4,224 (+488) 4,241 (+505) 4,241 (+505)
Yarn Consumer Tax on Weavers 4,112 (-2,579) 4,238 (-2,453) 4,238 (-2,453)
Cone Yarn Subsidy for Handlooms 0 (0) 0 (0) -2,256 (-2,256)
Textile Producer Tax on Weavers 0 (-4,229) 0 (-4,229) 0 (-4,229)
Textile Producer Subsidy for Weavers -11,469 (-11,469) -11,469 (-11,469) -11,469 (-11,469)
Total Revenue -3,132 (-17,788) -2,989 (-17,645) -5,246 (-20,296)
41

How Realistic Is the Compensation Scheme?
The simulation is useful to quantify the impacts of the liberalization, especially the income losses of the
handloom weavers. It is also helpful to know the level of the government spending needed to compensate
them. What needs to be examined next is whether such a compensatory scheme is administratively feasible,
and whether such a costly scheme is politically desirable in the long-run. In answering these questions,
there are at least four factors to consider.
First, it is very difficult to reach all the 6 million handloom weavers, who are scattered all over the
country. In fact, there are many reports which reveal that the past handloom protection programs have been
far from successful in India for this reason. The survey conducted by the Institute of Rural Management,
Ahmedabad (IRMA, 1989), for example, revealed that only 29 per cent of the handlooms actually benefited
from the state intervention. Secondly, if we take the high level of administrative costs, which are not
included in the simulation analysis, into account, the financial cost of the government subsidies will become
even larger. Thirdly, the problem of camouflaged handlooms by powerloom weavers would become an
even more serious matter. Lastly, the more subsidies are provided, the more serious corruption will be.
Direct subsidy that was proposed in the pre vious analysis can create new vested interests, and this will, in
turn, make the future reform even more difficult. Are there any other politically desirable policy options,
rather than the direct subsidy program? The next chapter will examine the issue.
42

CHAPTER 5
POLITICALLY FEASIBLE REFORM
5.1. POLITICAL FEASIBILITY OF LIBERALIZATION
Removal or Relaxation of Cotton Export Quota?
Although they look similar, the political impacts of complete liberalization of cotton exports, relaxation of
the current export quota, and replacement of export quota by export tariffs are all different. The reason
behind this is apparent if we examine who captures the economic rents under each export policy. Under the
current system, the rents are captured by public cotton traders, who are supposed to rebate the profit to
farmers. That is one of the reasons why farmers have accepted the cotton export restriction scheme. This
benefit for farmers will be maintained by the relaxation of cotton export quotas, but not by the removal of
the quotas or replacement by taxation. The detailed examination on potential gains and losses of each
interest group under the different processes of cotton export liberalization will make the political economy
picture clearer. Based on the analysis, various ways of liberalization will be compared from the viewpoint of
political economy, and the most desirable reform policy will be proposed in this chapter.
There are five ways of cotton export liberalization. (A) The first way is to increase export quota
allocation to each trader proportionally. Here, the present decision-making scheme over cotton exports itself
remains the same. (B) Second, while export restrictions are still made by quota, it is not allocated by the
government but is auctioned in an open bidding market, where any public and private trader can participate.
There are two other gradual reform paths. (C) Export quota is removed only for long-staple cotton. (D) The
quota restriction for all the cotton exports is replaced by export taxation. (E) The last one is the most drastic
approach, where the entire cotton export restriction scheme is abolished so that any cotton can be exported
freely. Table 19 compares the impacts of these five different liberalization policies on each group.
43

Table 19: Gainers and Losers Under Different Liberalization Policies
(A) Relaxation of (B) Still Quota But (C) Free Exports of (D) Replace by (E) Completely FreeNationwide Quota A Open Bidding ng-Staple Cotton Export Taxation otton Exports
Cotton Farmers 0 El 0 X X
Public Traders 0 X 0 X X
Private Traders 0 C) 0 0 0
Spinning Mills X - - xPowerlooms X X
Handlooms X X
Bureaucrats X X
0: gain, X: loss, -: indifferent, 0: depends upon the situation
As nationwide quotas are relaxed, cotton farmers and traders will naturally benefit while mills and
weaving sectors will lose in (A). The impact differs in (B), where all the quotas are auctioned in the market,
rather than allocated by the government. Obviously private traders will be the major beneficiaries, while
most public exporters are most likely to lose. The impacts on farmers are ambiguous; many of them will
complain in the beginning as their state associations are no longer able to export. However, in the long-run,
more efficient private exporters, who replace the public exporters who have often failed to capture export
opportunities in the past, will benefit farmers, especially if the economic rent is captured and redistributed to
the society. One of the key issues for consideration in liberalizing cotton exports is public sector rent-
seeking. If the government liberalizes cotton exports by phasing out the export quota, public traders will
strongly appeal, because they will not be able to compete with efficient private traders for cotton exports in
the open market.
In contrast, the free export of long-staple cotton would be politically most acceptable, because it
would have smaller adverse impacts to losers, as shown in (C) in Table 19. Public traders would lose, but to
a much smaller extent than case (B), because the proportion of sales from long-staple cotton exports is
relatively small for them. The impacts on mills, powerlooms and handlooms would be much smaller than
other cases, because of the present misallocation of cotton varieties as analyzed in the previous chapter.
The replacement of export quota by taxation would also have little impacts on mills and weavers.
However, it would still act as a disincentive mechanism for cotton producers. Normally the replacement of
export quotas by export taxation is desirable, as the latter is more transparent, and more consistent.
However, in this case, the reform would be difficult to implement. As explained in the previous chapter,
44

cotton farmers are rebated economic rents captured by public exporters in India. If farmers are taxed for
cotton exports instead and no economic rent is rebated by public traders, exporting cotton farmers will
vehemently resist export taxation. Their resistance would be also harmonized by the public traders' political
activities. It would be very difficult for the government to pursuade them that the export tax revenue, which
is an economic rent captured not by public traders but by the government, will be eventually rebated to the
society through the government channel. Considering the strong political presence of farmers in India, this
policy would be difficult to implement.
Lastly, complete liberalization would lead to both farmers and private traders making profits. The
effects on public traders are ambigous, as in the case of policy (C). The impacts on mills, powerlooms, and
in particular handlooms are serious, as computed in the simulation model in the previous chapter. Hence,
this policy (E) is unable to be accepted as already argued.
Deregulating Long-Staple Cotton Exports
Hence, it seems that the most realistic policy option is to deregulate only long-staple cotton exports in the
first stage. On top of the political acceptability as analyzed above, the potential of long-staple cotton exports
is promising in the world market. While exporting more long-staple cotton to earn foreign exchange outside
the quota, India can even import short-staple cotton if it is needed. This will not only make the reform
process politically easier but also correct the prevailing resource misallocation of cotton varieties in India.
Over the period, the government can increase the staple varieties of cotton that are not subject to export
quotas. It is also worth considering a cotton export-oriented unit (EOU) scheme as a separate export track of
long-staple cotton.'2 It is expected that the exports from cotton EOUs will undermine the export quota
policy.
Timing of the Liberalization
The timing of export liberalization also matters. The right time to deregulate cotton exports depends upon
the movements of the international price and domestic price of cotton, which are not always linked with each
other. If the export quota is relaxed when the gap between the Indian price and the world price is small, the
impact is also limited. For example, although the central government announced a sizable cotton export
quota in 1995/96, it had little impact on the domestic cotton prices. In addition, if the extra quota is allocated
at the very end of the cotton year, even efficient private exporters will find it difficult to find overseas
12 As pointed out by Misra (1993), the law on ownership of agricultural land, which does not permit individual
land holdings exceed certain limits, should be modified to make large-scale cotton EOUs legally permitted in India.
45

buyers, so the domestic cotton price would not increase.
The effect of cotton export liberalization also depends on the domestic cotton demand, which is
determined by the situation of the domestic mills. In a year when the situation of mills is not as good as in
previous years, the domestic price of cotton tends to go down, as the demand for cotton is weak, even if the
export quota is relaxed. Thus, the ideal time to liberalize cotton exports is when the impact on the domestic
cotton price is limited and resistance from affected interest groups is small.
5.2. MOBILIZING THE POLITICAL POWER STRUCTURE
Spinning Mills'Involvement in Cotton Prodluction
While the right path and timing of reform is important, it is also desirable to promote supplementary policies
that can mobilize the political structure arnong interest groups. One such possible policy would be to
encourage the mill sector's involvement in the cotton production. Everyone agrees that had India produced
more cotton, the political conflicts over cotton exports would have been less serious. As it is difficult to
further increase the cultivated area for cotton, a common interest for farmers, mills, powerlooms, and
handlooms is growth in cotton yields. Considering that mill owners have more capital, it would be possible
for them to develop high-yield cotton seeds and enhance modem agricultural management in collaboration
with farmers. Already, some mill owners such as Arvind started to invest in cotton cultivation. The ICMF
also started to get involved in cotton production in collaboration with the CCI and the EICA.'3 The
Government can encourage more of this type of collaboration, which will reduce the political conflicts over
cotton export policy between different groups.
Not only the backward integration (mills' involvement in cotton production) but also the forward
integration (cotton trader's involvement in cotton spinning) will strengthen the cooperation between the
different interest groups. It is desirable that the government provides assistance to the spinning mills,
farmers, traders, and ginners who are willing to participate in the improvement of cotton yield by forward
and backward integration, which will lead to minimizing the political conflicts over cotton exports.
Handloom Conversion Program
13 ICMF's Cotton Development and Research Association as a joint venture for cotton development and sales isan example of the alliance among different interest groups -public traders, private traders and mills. Under the scheme,the CCI requests the EICA to extend its support while selling ready bales to their mill buyers on an assurance that theCCI will not approach such mills directly.
46

Considering the serious impacts of hank yarn liberalization on handloom weavers, efforts to convert them to
the powerloom sector are very important. Fortunately the number of weavers who have converted from
handloom to powerloom has increased in recent years. The switch has resulted in an overall increase in
income of weavers, because of the difference in productivity. Tamil Nadu is particularly successful in terms
of handloom conversion. It was the first state where co-operative societies for handlooms started to develop,
and handloom conversion programs were promoted under their initiatives. In order to encourage the
handloom weavers to join co-operative societies, the state government provided subsidized loans for co-
operative societies to finance their working capital and for handloom weavers to acquire the share capital of
co-operatives in their area.
It should be kept in mind, however, that not all the handloom conversion programs were successful
in India. For example, in the 1950s, the central government initiated a program to convert handlooms to
powerlooms. However, the premature conversion program did not work out because master weavers, who
were afraid of their contract handloom weavers, urged them not to convert (Uchikawa, 1998). Besides, many
individual handloom weavers themselves were hesitant to convert because of the fear that some of them might
lose their employment. Another unsuccessful case was reported by Das (1986), where a lack of many factors,
such as working capital, co-ordinated efforts in maintaining a regular flow of raw cotton and other inputs,
finishing and marketing facilities, as well as working knowledge and management in the society level, led to
the eventual failure of the government's handloom conversion program in Assam.
Politically, if powerloom machines are freely provided to handloom weavers who are willing to
convert to powerloom operators, the handloom conversion program will be supported by the textile
machinery industry, as their sales will increase. This is another type of desirable political alliance between
different interest groups towards a common productive objective. It should be noted that this is only when
new powerlooms are provided to handloom weavers; otherwise, the sales of machinery industry will not
increase because powerlooms are manufactured by small-scale engineering firms as copies of simple
available looms or simply purchased as second hand looms from closing composite mills.
Diversi fying Handloom Weavers'Activities
While promoting handloom conversion programs, diversifying inputs and outputs of handloom weavers
should also be encouraged. Although not very rapid, the diversification of handloom inputs from cotton yarn
to other types of yarn has been a nationwide phenomenon. Compared to the fact only I per cent of the
handloom cloth was 100 per cent non-cotton products in the beginning of nineties, the fraction increased to 7
per cent by 1994/95 (Office of the Textile Commissioner, 1995). In the future, programs to encourage more
47

handloom weavers to process larger amounts of man-made yarn, blended yam and silk yarn will make it
easier for the government to liberalize the cotton sector in India. Further, such programs will be supported by
the man-made yarn industry, as their sales wllI increase as a result.
Also important in diversification is the nature of output of the handloom industry. It would be
meaningful to help the industry to diversify from low-quality cotton fabric to such design items as luxurious
saris, shawls, and curtains. This will not only increase the income of handloom weavers but also make them
less affected by the flucutations of cotton and yarn prices. In order to increase their sales of the high-value
products, training programs in effective mark-eting should also be conducted.
Thirdly, it would be desirable to help handloom weavers take up more side jobs. It is estimated that
half of the handloom weavers are part-time workers in India (Office of Textile Commissioner, 1995). 14 There
is a need to promote training programs that help more handloom weavers shift their daily working activities
to other more productive jobs. Also, considering the comparatively high rate of female workers in the
handloom sector, the importance of educating handloom workers is even more apparent, as it inreases the
role of women in the Indian society.
Lastly, the importance of child education in the handloom sector should be mentioned. In
handlooms, it is family labor, including female adults and children, who are all involved in some capacity, as
pointed out by Chaudhuri (1994). Because: of the lack of education, poor nutrition and cramped working
conditions, children in the handloom sector are often not suited for other kinds of labor when they grow up.
They must be taken out of the vicious cycle, which can be done by providing free schooling and nutritious
meals at school. The successful combination of the programs proposed in this section - handloom
conversion programs, input and output diversification programs, part-time job training programs, and
children education programs - will be much healthier than simply providing direct subsidy coupons to
handloom weavers for years on end.
14 In particular, the majority of handloom weavers in Assam are non-commercial female workers who work on apart-time basis at home and produce cotton textiles primarily for their own domestic use (Das, 1986).
48

CHAPTER 6
CONCLUSION
The case study of the Indian cotton export policy has suggested that negative consequences of commodity
export restriction are more serious than generally thought. This paper first identified three economic
problems: lack of incentive for farmers, resource misallocation, and slow administration of the govemment
sector. As shown in the Indian case, the incentive problem, where a price disincentive factor for farmers can
reduce output, could cause an input availability problem for downstream industry in the long-run. The
resource misallocation can be serious not only between different sectors, such as the agricultural sector and
the manufacturing sector (as taught by basic economic theory), but also within the agricultural sector. Every
commodity has different varieties, such as long-staple cotton and short-staple cotton. Since the govemment
can hardly forecast changes in demand for and supply of each variety in a flexible way, a uniform export
quota tends to cause a mismatch of varieties in the domestic market. This problem can be called intra-
industry resource misallocation, in contrast to the more familiar inter-industry resource misallocation. The
slow and inefficient government administration is also serious. There is a season of harvest for each
commodity, and ideal timing to make export contracts with overseas buyers is very important in today's
competitive world commodity market. Since the procedure to decide export quotas tends to be time
consuming, traders often fail to capture exporting opportunities. Efficiency of public exporters is another
concem. Since export quotas are accompanied by economic rents, governments tend to assign public traders
to monopolize exports. However, exporting is easier said than done; some of the public exporters cannot
find suitable overseas buyers. Hence some quotas go unfilled, and the economic rent is not fully captured.
This paper then revealed that political problems of export quota can be even more serious than these
economic problems. One of the reasons that many governments tend to prefer export quotas to export
taxation is that a quota level is easier to change than export tax rates, should market conditions change.
However, the flexibility of the control actually facilitates rent-seeking activities. Since quota is more
frequently revised than tax rates, interest groups are more involved in lobbying activities. Assigning export
entitlements to public traders does not solve the rent-seeking problem. It was suggested from the Indian case
that public rent-seeking is sometimes even more difficult to resist for the government. Manipulation of crop
statistics is another serious problem. Since the levels of export quotas are usually based on an official
meeting of concerned groups, each interest group tries to influence the level of national export quota by
padding crop estimations. Consequently, the whole official crop statistics tend to be unreliable. In the end,
49
export quotas cannot be more than an outcome of a political arena; it is decided erratically and
inconsistently, and influenced by short-term political interests. There is a vicious circle; export quotas are
announced in an ad hoc way; price fluctuation follows, speculative commodity trading is induced, interest
groups become more involved in lobbying activities, and export policy becomes even more susceptible to
politics.
Thus, the need for future liberalization in the Indian cotton sector is apparent. However, in the past,
efforts to measure the effects of liberalization, in particular the potential income loss of handloom weavers
has not been made in India. In this paper, a multi-market model was constructed for simulation. The model
is the first multi-market model where price elasticities are computed endogenously, based upon the ratios
between product prices and input costs. Another innovation of the multi-market model constructed here is
its attempt to distinguish short-run effects from long-run effects, based on the economic principle that capital
cost is variable only in the long-run. Although this model was developed to analyze the Indian cotton sector,
it is easy to use the model to simulate other vertically integrated sectors, where a primary commodity is not
only exported but also supplied to the domestic manufacturing industry, without significant change of model
specification. Since the model requires neither intensive data collection nor cumbersome elasticity estimates
and simulation results are easy to interpret, it is convenient for policymakers to conduct quick simulations
when they attempt to initiate policy reforms.
Based on the results of the numerical simulation, this paper concluded that it is not politically
feasible to remove export restrictions of colton overnight. It was also suggested that replacement of export
quotas by export taxation is not a very feasible option. Instead, this paper suggested to remove export quotas
for long-staple cotton in the first stage of the reform, and gradually increase the varieties of cotton that are
not subject to export quota restriction. It was also proposed that in the meantime, a number of reforms, such
as the mill sector's involvement in cotton cultivation and handloom conversion programs, should be
promoted in India. In many countries, liberalization programs have been unsuccessful because of their
neglect of domestic political factors. Both political structure and government policy are endogenous to the
society in any country. It is crucial to consider how the policy change will affect the political power
structure and the objectives of each interest group. A wise policy reform aims at making interest groups
concentrate on efficient and productive activities by transforming one group to the other and enhancing
politically desirable alliances among different groups.
50

APPENDIX A
TECHNICAL NOTES ON THE ELASTICITIES FOR THE MODEL
This appendix shows the mathematical relations among the price elasticities used in the simulation model.
As shown in the two tables below, there are twenty elasticities for India in total. For example, 0 is the
short-term supply elasticity of yarn with respect to cotton price, and 0 is the long-term supply elasticity of
yarn with respect to cotton price.
Table 20: Short-term and Long-term Elasticities
(A) Short-term Elasticities India) (B) Long-term Elasticities (India)Elastcitv for \ w.r.t. I p p PT Elasticitv for \ w.r.t PC Py PTFarmer Sc (D Farmer Sc 0Spinning Dc C (3 Spinning Dc 8 0Mill Sy Q 0 Mill Sy 0 OTextile Dy O (2) Textile Dy 0 0Weaver ST __ Weaver IST 0Consumer DT ID Consumer DT 0
where Sc= Cotton Supply, D= Cotton Demand, Sy = Yarn SupplyDy = Yam Demand, ST Textile Supply, DT = Textile DemandP, = Cotton Price, Py = Yarn Price, PT = Textile Price
year t - year t+l
() short-term elasticity, 0 long-term elasticity
In the following, it is proven that if we know the value of 0, then it is possible to compute the values of
®,(X,®!),0,10 and 0. Similarly, if the value of (D is given, then it is possible to estimate the values of
®,0,0,0,0 and 0. Thus, all of the twenty elasticities can be grouped into four independent sets -
{(,0}, {(,),Ca),),0,0,0,0}, {©,,,(f),0,0,0,@} and {(1 ,O}. This means, for example, 0Z and
0 are dependent with each other, while (Z and (f are independent from each other.
51

(1) Ratio Among Elasticities and Cost Share
This section first shows that the ratio among the absolute values of price elasticities for a producer is the
same as the cost share. For example, if the cost share of cotton is 60 per cent for spinning mills, then the
absolute value of demand elasticity of cotton yarn with respect to cotton price for them is 60 per cent of
the supply elasticity of cotton yarn with respect to cotton yarn price. Similarly, suppose there are two
inputs - cotton (60 per cent of the total cost) and another input, say labor, (40 per cent of total cost) - for
spinning mills to produce cotton yarn, then the supply elasticity of cotton yarn with respect to cotton yam
price is 1.5 times (since 0.6 / (1 - 0.6) = 1.5) as much as the supply elasticity of cotton yarn with respect to
the price of another input both in absolute values.
Suppose a spinning mill's problem is:Max pf (c,x) - pcc - pxx
where p = output price (i.e., price of cotton yarn)f= production function (i.e., yarn production function)Y output (i.e., supply of yarn)c = input demand (i.e., demand of cotton)Pc = input price (i.e., price of cotton for spinning mill)x = another input demand (i.e., demand of non-cotton input)Px = another input price (i.e., price of non-cotton input)
Differentiating both by c and by x, we havePfC = Pc (1)
PA. = Px (2)
At the optimal level,Y* =ft (c*,x*).
Now we need to compare the supply elasticity of yarn with respect to yarn price and supply elasticity of
yarn with respect to cotton price for spinning mills. In the following, dY/dp and dY/dp, are computed,
and then it is shown that the ratio between the two elasticities - {(dY/dp)/Y/p3 / {(dY/dp,)/Y/p,} - equals
the cost share of cotton.
c. x; p for cotton yarn priceDifferentiate the equation (1) with respect to p.
fA + pf.cdc/dp + pfc.dx/dp = 0 (3)
Differentiate (2) with respect to Pc.fA + pf,,dc/dp + pfxxdx/dp = 0 (4)
52

From (3) and (4),dc/dp = (-f. - pf..dxIdp) / pf.. = (-fx - pf..dxfdp) / pf%. (5)
fx + Pf.. {(-fc -pf..dx/dp) / pf.1 + pf"xdx/dp = 0(pf. - pf1/fC)dx/dp =fxfr -fWxldp = (IcUfc/fc -fx) I {P(txx-fcx /fC) = (fc{cx -fcf fx) I P(fx) I -fc p) (6)
From (5) and (6),dc/dp = [-fx - {PA(Afx -fcS)} / {P(X.fc- 2)}] /Pfxc= -fx I Pfcx - [fAcfsxx I {Pfcx(fcfxx If {?fcx(fxx -fx )}]= {-fx(fxc _f 2) _fc,cx +fcJfxff}/ {Pfcx(tfxx -fcx )}
dc/dp = {-fxx(fcfx +ffc) +f(f2 +fcfxx)} I { f 2 )} (7)
From (5), (6) and (7),dY/dp =fdc/dp +fxdx/dp= [{-fc/~(fxxf,c +fcsfc) +fJx (fox +2 tfxx)} / Pfcx(fcJfxx. 2
)] + {(fff 2ff) / P(fxx 2f)}
= tfx(_f2cfxx +ffcAf +ff X -fcx )} /{Pfcx(fccxxfcx )}
dY/dp (-fc2.f% + 2 sfj _f 2)/ IP(fJx f2 )} (8)
C. X: p, for cotton priceDifferentiate (1) with respect to Pc.,pf,cdc + Pfcxdx = dpc (9)
Differentiate (2) with respect to pc,pf,,xdc + pfxxdx = 0 (10)
From (10),dc/dx = -fXx I/fcxfJcdc/dpr +f.cdx/dpr = I/p
dx/dp = (1/p -fccdc/dp.) If. (11)
(dc/dx) (dxIdp,) = dc/dpc- (fc.fx, /f cx) dc/dp. +f..dc/dp = -fx. / Pfcxdc/dpc (f. 2 -fcfxJ) = -fx. /IPfcxdc/dpc c2 f IP
dc/dp. =jf; I { p(fXj f 2 )} (12)
From (11) and (12),dx/dpc = [I /p -fic t{f I p(ffk -fc2)}] /fcx= {/x(l;fxx fcx ) fcSExx}I {Pfcx(fcfxx -f 2 2)}
dx/dpc = -fcx / {P(tccx -f~cx2)} (13)
From (12) and (13),
53

dY/dp, =fcdc/dp, +f,dxJdp,=ffxx / {P(fccfxf -f2 )} -fd. I {P(fxf -fcx ,}}
dY/dp. = (ff, -fcdf.)I {P(fcfxx -fc. 2)} (14)
Compare (dY/dp)/(Y/p) and (dY/dD,)/(Y/P,From (8) and (14),{(dY/dp)/(Y/p)} / {(dY/dp.)/(Y/p.)}= {(dY/dp,/(Y/p.)} / (p./p)= [P (-f 2fX. + 2 jlic,fx -fcA 2)/ {P(ftxx -f)}] / [P (ff fl/ l= (p (f/f. + 2fJf.,f - frf)} I [Pc {f(fcfxx -f. x)}]= (P (-fc2fxx~ + 2fst/xx -fccf2 )}/l [f,:tf{(ff.X f 4X)]
Thus, we have{(dY/dp)/(Y/p)} / {(dY/dp )/(Y/p.)} = (-f. . + 2f/fcf -fcfx2 ) 1 {h (fJ .-fx)} (15)
Long-term Elasticities with Variable Capital
Assume the production function of spinning mills to be a Cobb-Douglas type as follows."5
Y =f(c,x) = Acaxpwhere Y = output of cotton yarn
c = input of cottonx = another inputa < 1, , < 1
By differentiating the above production function, we haveAx Aaclxp (16)
f= A13caxI I (17)fcc = Ac(a-I)ca,2 xP (18)
f,, = AP3(13-l)caxO3-2 (19)f,, = Aol3ca'xY' (20)
From (15),(16),(17),(18),(19) and (20), we can compute{(dY/dp)/(Y/p)} / {(dY/dp,)/(Y/p.)}= [(- a 2 c 2cx 2 2 {(23(3-_l)coxP2 } + 2{( o x1)(Pc'xO l)(CCpCa-1X3-1)) - {a(a_1)c,- 2x 2 } (p32c2ax2 2 )]
/ [(a2 C2 2X2 ) X{13(13-_ )caxP-2} - (ac'-Ixt)(al3ca-lxis-)(13cax-')]
{(dY/dp)/(Y/p)} / {(dYIdpc)/(Y/pc)}- (_ a 2p3Y2 3 3 -2) + (a 23c3a-2x3 P-2) + (2a2o32c3a-2x313-2) - (a 2132c 3 2x3 2) + (al32C3c 2x 3' 2)}/ {(a2P2C3a-2X3P-2) - (a213C3a-2X3 -2) - (a2132c3 a-2X3 P 2)}
{(dY/dp)/(Y/p)} / {(dY/dpc)/(Y/pc))= {al3(- ao3 + a + 2a13 - c43 +P3)(c3a-2x3 P3-2)}/ {(c4P(cx3 - a - ap3)(C3 o-2X3P-2)}
15 Sastry (1984) also assumed the production function of the Indian spinning mill as a Cobb-Douglas typefunction.
54

{a(a + [(c 3a-2x30-2)} / {aj3(- a)(c3 ,x2x3 0-2)}
=(a + )' / (- a)
{(dY/dp.)/(Y/p,)} / {(dY/dp)/(Y/p)} = -a / (a + f3) (21){(dY/dp.)/(Y/p.)} / {(dY/dp)/(Y/p)} = - f3/ (a + 3) (22)
Since a / (a + 3) is the cost share of cotton for spinning mills to produce cotton yarn, it has been proven
that the ratio of demand elasticity of cotton yarn with respect to cotton yarn price is exactly the same as
the supply elasticity of cotton yarn with respect to cotton price (-1) over the cost share of cotton for
spinning mills. Similarly, we can assume the production function of mills with three inputs as:
Y =J(c,K,L) = AcaK5LXwhere Y = output of cotton yarn
c = input of cottonK = capital inputL = labor inputa < 1,0< 1, x< 1
It is easy to prove the following result in exactly the same way as the case of two inputs.
{(dY/dpC)/(YIp.)} l {(dY/dp)I(Y/p)} = - a I (x + [ + X) (23){(dY/dPK)/(Y/PK)1 / {(dY/dp)/(Y/p)} = - [3/ (a + p + X) (24){(dY/dpL)/(Y/pL)} / {(dY/dp)/(Y/p)} = - X/ (a + [ + X) (25)
The intuition here is that the larger the cost share of one particular input, the larger the absolute
value of the supply output elasticity with respect to that input will be. For example, if cotton and labor
consist of 60 per cent and 10 per cent of the production cost of cotton yarn respectively, then the supply
elasticity of cotton yarn with respect to cotton price is six times as large as the supply elasticity of cotton
yarn with respect to wage in the absolute value.
Finally, the relation between 0 and 0 in Table 20 depends on a, and the relation between 0 and
0 depends on a and [3 for the two-input case, and on a, , and X for the three-input case. Mathematically,
0 = ax0. Also 0 = axO (for the two-input case) or 0 = axO (for the three-input case). (As a special
case, if the production function of a spinning mill has constant returns to scale with respect to cotton
(which means a = 1), then 0 = 0. Also, if the production function of a weaver has constant returns to
scale with respect to yarn, then 0 = 0.
Short-term Elasticities with Fixed Capital
So far, capital cost was assumed to be variable. However, in reality, firms will not be able to adjust their
capital investment in the short-run, although they can do so in the long-run. In that sense, the above
55

computations on the relations among elasticities are for long-term analysis. In the short-run, a = 0 and
therefore the equations (23), (24) and (25) are rewritten as follows:
{(dY/dpC)/(Y/p.)} / {(dY/dp)/(Y/p)} = - a I (a + X) (26){(dY/dpK)/(Y/pK)} / {(dY/dp)/(Y/p)} = - K/ , (a + X) = 0 (27){(dY/dpL)/(Y/pL)} / {(dY/dp)/(Y/p)} = - XI (a + X) (28)
Thus, the difference between short-term elasticities and long-term elasticities are obvious.
(2) Changes in the Elasticities Over The Time
The next question is how the supply elasticity of a commodity with respect to the price of that commodity
will change over the years. Let us define the following three elasticities. The first one [t-l, t], and the
second one [t, t+l] are short-term elasticities, and the third one [t-1, t+ 1 is a long-term elasticity. The
first one and the third one correspond to C) and 0 respectively (or 'O and 0, () and 0, or ® and 0) in
Table 20, but the second one It, t+l] does not correspond to any in the table. For simplicity of our
discussion, we assume short-term elasticity is an elasticity over one year, and long-term elasticity is an
elasticity over two years, as illustrated in the following.
year t - year t + 1(dY/dp)/(Y/p) [t-1, t] - (dY/dp)/(Y/p) [t, t+l]
(dY/dp)/('Y/p) [t-1, t+1]
(dY/dp)/(Y/p) [t- 1, t], (dY/dp)/(Y/p) [t, t+ 1] short-term elasticities(dY/dp)/(Y/p) [t- l, t+ 1] long-term elasticity
where:(dY/dp)/(Y/p) [t-1, t] = elasticity of supply with respect to output price for year t(dY/dp)/(Y/p) [t, t+ 1] = elasticity of supply with respect to output price for year t+ 1(dY/dp)/(Y/p) [t- 1, t+ 1] = accumulative elasticity of supply with respect to output price from thebeginning of year t till the end of year t+ 1.
Y [t-l] = output for year t-l (e.g. last year's output)Y [t] = output for year t (e.g. output from the beginning of year t to the end of year t)Y [t+l] = output for year t+I (e.g. output from the beginning of year t+l to the end of year t+l)AY [t-1, t] = Y [t] - Y [t+l]AY [t, t+l] = Y [t+1] - Y [t]AY [t-1, t+l] = Y [t+l] -Y [t-1] = dY [t-l, t] + dY [t, t+l]p [t-l] = output price for year t-l (e.g. output price at the end the last year)p [t] = output price for year t (e.g. output price at the end of year t)p [t+l] = output price for year t+l (e.g. output price at the end of year t+1)Ap [t-1, t] = p [t] - p [t+1]
56
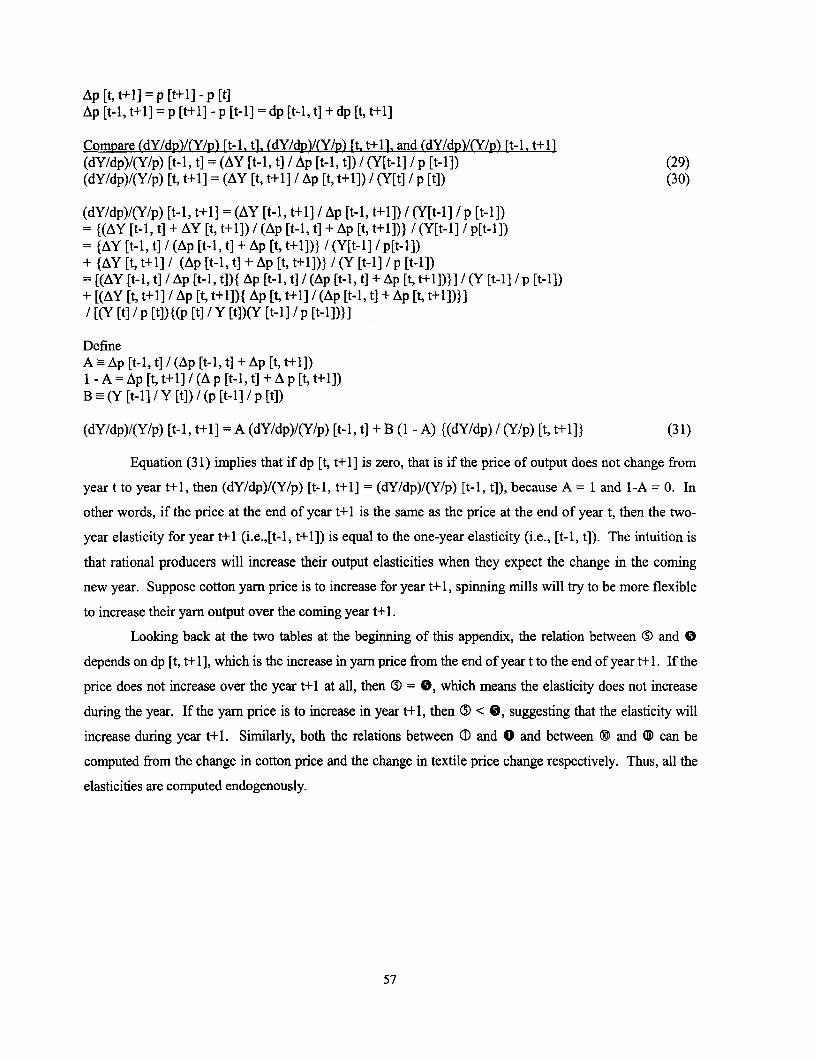
Ap [t, t+l] = p [t+'] - p [t]Ap [t-1, t+1] = p [t+1] - p [t-1] = dp [t-l, t] + dp [t, t+l]
Compare (dY/dp)/(Y/p) [t-l. ti, (dY/cdP)(Yp!) rt. t+1. and (dY/dp)/(Y/p) [t-l1 t+l](dY/dp)/(Y/p) [t-1, t] = (AY [t-1, t] I Ap [t-l, t]) / (Y[t-l] / p [t-l]) (29)(dY/dp)/(Y/p) It, t+l1] =(AY It, t+l] / Ap It, t+l]) / (Y[t] /p [t]) (30)
(dY/dp)/(Y/p) [t-1, t+l] = (AY [t-1, t+l] / Ap [t-1, t+l]) / (Y[t-_] I p [t-l])= {(AY [t-1, t] + AY [t, t+l]) / (Ap [t-l, t] + Ap [t, t+1])} / (Y[t-1l / p[t-l)D= {AY [t-1, t] / (Ap [t-1, t] + Ap [t, t+l])} / (Y[t-1] / p[t-l])+ {AY [t, t+l] / (Ap [t-1, t] + Ap [t, t+l])} / (Y [t-1] / p [t-l])= [(AY [t-l, t] / AP [t-l, t]){ AP [t-l, t] / (AP [t-l, t] + AP It, t+l])}] / (Y [t-l] /p [t-l])+ [(AY [t, t+l] / Ap [t, t+l]){ Ap [t, t+1] / (Ap [t-1, t] + Ap [t, t+1])}]/ [(Y [t] / p ItD){(p It] / Y [t])(Y [t-l] / p [t-l] )}]
DefineA _ Ap [t-1, t] / (Ap [t-l, t] + Ap [t, t+1])1 - A = Ap [t, t+l] / (A p [t-1, tj + A p [t, t+l])B -_(Y [t-11 /Y It]) /(p [t-1l]/p It])
(dY/dp)/(Y/p) [t- 1, t+ 1] = A (dY/dp)/(Y/p) [t- 1, t] + B (1 -A) {(dY/dp) / (Y/p) [t, t+ 1] } (31)
Equation (31) implies that if dp [t, t+ 1] is zero, that is if the price of output does not change from
year t to year t+1, then (dY/dp)/(Y/p) [t-1, t+l] = (dY/dp)/(Y/p) [t-1, t]), because A = 1 and 1-A = 0. In
other words, if the price at the end of year t+1 is the same as the price at the end of year t, then the two-
year elasticity for year t+1 (i.e.,[t-1, t+l]) is equal to the one-year elasticity (i.e., [t-1, t]). The intuition is
that rational producers will increase their output elasticities when they expect the change in the coming
new year. Suppose cotton yam price is to increase for year t+l, spinning mills will try to be more flexible
to increase their yarn output over the coming year t+ 1.
Looking back at the two tables at the beginning of this appendix, the relation between (0) and 0
depends on dp [t, t+l], which is the increase in yarn price from the end of year t to the end of year t+W. If the
price does not increase over the year t+I at all, then 0 = 0, which means the elasticity does not increase
during the year. If the yarn price is to increase in year t+l, then 0 < 0, suggesting that the elasticity will
increase during year t+l. Similarly, both the relations between (D and 0 and between 8 and 0 can be
computed from the change in cotton price and the change in textile price change respectively. Thus, all the
elasticities are computed endogenously.
57

APPENDIX B
SENSITIVITY ANALYSIS UNDER DIFFERENT ELASTICITIES
Different Sets of Elasticities
The simulation model was run under four different sets of price elasticities for sensitivity analysis.
Compared to the Base Set (which was used for the simulation in the main text), all the elasticities are halved
in the Elasticity Set 1. Conversely, in the Elasticity Set 2, all of them are doubled. In the Elasticity Set 3, all
the world elasticities are assumed to be equal to the equivalent Indian elasticities. All the elasticities in the
four sets are as follows.
Table 21: Different Set of Elasticitiesfor Sensitivity Analysis
Elasticities of With respect to B Base Set Set 1 Set 2 Set 3Cotton Supply Cotton Price 0.200 0.400 0.100 0.200Cotton Demand Cotton Price -0.072 -0.144 -0.036 -0.072Cotton Demand Yarn Price 0.120 0.240 0.060 0.120Yarn Supply Cotton Price India -0.120 -0.240 -0.060 -0.120Yarn Supply Yarn Price 0.200 0.400 0.100 0.200Yam Demand Yarn Price -0.032 -0.064 -0.016 -0.032Yarn Demand Textile Price 0.080 0.160 0.040 0.080Textile Supply Yarn Price -0.080 -0.160 -0.040 -0.080Textile Supply Textile Price 0.200 0.400 0.100 0.200Textile Demand Textile Price -o-0.100 -0.200 -0.050 -0.100Cotton Supply Cotton Price 0.133 0.267 0.067 0.200Cotton Demand Cotton Price -0.048 -0.096 -0.024 -0.072Cotton Demand Yarn Price 0.080 0.160 0.040 0.120Yarn Supply Cotton Price Rest -0.080 -0.160 -0.040 -0.120Yarn Supply Yarn Price of the 0.133 0.266 0.067 0.200Yarn Demand Yarn Price World -0.021 -0.043 -0.011 -0.032Yarn Demand Textile Price 0.053 0.107 0.027 0.080Textile Supply Yarn Price -0.053 -0.107 -0.027 -0.080Textile Supply Textile Price 0.133 0.267 0.067 0.200Textile Demand Textile Price -0.067 -0.133 -0.033 -0.100
bold numbers are assumed exogenously, and the other numbers are computed endogenously.
Similar Resultsfrom Diferent Elasticities
There is no remarkable difference among the simulations under different elasticity sets. In particular, the
income changes of handloom weavers and the government revenue, which are the most important factors to
examine in this policy study, are almost the same in the sensitivity analysis (Table 21). This suggests the
reliability of the simulation, because the results do not depend much upon the values of elasticities, which
are given exogenously as they are very difficult to estimate accurately.
58

Table 22: Results of the Sensitivity Analysis Under Different Sets of Elasticities
Base Set Elasticity Sensitivity Analsis___ ___ ___ __ ___ ___ ___ _ _ _Set I Set 2 Set 3
Cotton Farmer 15 18 13 16Spinning Mill I I 0 I
Case I Net Income Textile Weaver -6 -6 -6 -6Changes(%) Powerloom -3 -3 -3 -4
Handloom -12 -12 -12 -12Total 2 2 1 2
Govemment Rev nue (Rs. million) 15,439 15,419 15,449 15,497Cotton Farmer 15 18 13 16Spinning Mill 15 17 13 15
Case 2 Net Income Textile Weaver -8 -8 -7 -8Changes(%) Powerloom -4 -5 -3 -4
Handloom -16 -17 -16 -16Total 2 3 2 2
Govemment Revenue (Rs. million) 15,685 15,680 15,687 15,743
59

REFERENCES
Andersen, K and Y. Hayami. 1986. The Political Economy ofAgricultural Protection. Allen and Unwin.
Bardhan, P. 1998. The Political Economy of Development in India: Expanded Edition with an Epilogue onthe Political Economy of Reform in India. Oxford University Press.
Bates, R.H. 1981. Markets and States in Tropical Africa. University of California Press.
Bates, R.H. 198 -. Essa>s on the Political Economy of Rural Africa. Cambridge University Press.
Bhagwati, J.N. 19% 3. India in Transition - Freeing the Economy. Oxford University Press.
Bhagwati, J.N. 1982 "Directly-Unproductive Profit-Seeking (DUP) Activities". Journal of PoliticalEconomy. Chapter 17, 1982.
Bhala, R.B. 1995. "Cotton: A Vicious Circle of Corruption and Exploitation". The Economic Times(Ahmedabad), June 10, 1995.
Bhattacharya, H. 1995. "India Cotton Sector Study". Background Working Paper, World Bank.
Bharathan, K. 1983. "The Cotton Handloom Industry: Some Characteristics and Aspects of Change fromthe Post Independence Census Data". Madras Institute of Development Studies.
Bose, K. 1996. "Frayed at the Edges". Financial Times (London), November 19, 1996.
Buchanan, J.M. and G. Tullock. 1962. The Calculus of Consent - Logical Foundation of ConstitutionalDemocracy. University of Michigan Press.
Chaudhuri, S. 1994. Cotton Yarn Spinning Industry in India - The Competitive Advantages and Prospects.ICRA.
Coleman, J. and M.E. Thigpen. 1991. An Econometric Model of the World Cotton and Non-CellulosicFibers Markets. World Bank.
Corden, W.M. 1997. Trade Policy and Economic Welfare (2&d Edition). Oxford University Press.
Das, N.C. 1986. Development ofHandloom Industry - Organization, Production, Marketing. Deep andDeep Publications.
Desai, M. 1996. "Economic Reform: Stalled by Politics? ". In P. Oldenburg (ed.) India Briefing 1995-96.Asia Society.
Desai, M. 1992. "Is There Life after Mahalanobis? The Political Economy of India's New EconomicPolicy" An Essay in Memorial of Sukhamoy Chakravarty. Indian Economic Review 1992.
Dickerson, K.G. 1991. Textiles and Apparel in the International Economy. Macmillan Publishing Co.
60

EICA. 1995-2000. Indian Cotton Annual.
Goswami, 0. 1990. "Sickness and Growth of India's Textile Industry: Analysis and Policy Options".Economic Political Weekly, November, 1990.
Grossman, G. and E. Helpman. 1994. "Protection for Sale". American Economic Review, 84, 1994.
Gulati, A. and A. Sharma. 1994. "Time to Let the Bales Bail Out the Business". The Economic Times(New Delhi), March 7, 1994.
Haddad, M. 1996. "Can the Spinning Sector Compete If Cotton Export is Liberalized? ". BackgroundWorking Paper, World Bank.
Hamilton, C.B. (ed.) 1990. Textiles Trade and the Developing Countries: Eliminating the Multi-FibreArrangement in the 1990s. World Bank.
Hayami, Y. 1988. Japanese Agriculture Under Siege: The Political Economy of Agricultural Policies.Macmillan.
Helpman, E. 1995. "Politics and Trade Policy". CEPR Discussion Paper No. 1269.
ICAC. 1994-2000. Cotton World Statistics.
ICAC. 1994-2000. World Textile Demand.
ICMF. 1995-2000. Handbook of Statistics on Cotton Textile Industry.
ICMF. 1995-2000. Annual Report for the Year.
IRMA. 1989. "A Study of Interventions in the Handloom Industry".
ITMF. 1993. "International Production Cost Comparison Spinning / Weaving / Knitting 1993".
Kantilal, I. 1992. "A Determinants of Profitability in a Traditional Industry: The Case of the AhmedabadCotton Textile Industry". Ph.D. Dissertation, Gujarat University.
Kondo, M. 1998. "The Political Economy of Cotton and Textile Export Policy in India". PhD Dissertation,Stanford University.
Krueger, A.O. , M. Schiff and A. Valdes. 1992. The Political Economy of Agricultural Pricing Policy.Johns Hopkins University Press.
Krueger, A.O. 1974. "The Political Economy of the Rent-Seeking Society". American Economic Review,69, 1974.
Lal, M.B. and K.S. Parmar. 1995. Cotton Marketing. Tecoya..
61

Leadbeater, S.R.B. 1993. The Politics of Textiles - The Indian Cotton-Mill Industry and the Legacy ofSwadeshi 1900-1985. Sage Publications.
Mazumdar, D. 1991. "Inport-Substituting Industrialization and Protection of the Small-Scale: The IndianExperience in the Textile Industry". World Development 19(9), 1991.
Ministry of Supply and Textiles, GOI. 1985. "Report of the Expert Committee on the Textile Industry".
Ministry of Textiles, GOI. 1990. "The Textile Industry in the 1990s: Restructuring with a Human Face".
Ministry of Textiles, GOI. 1995-2000. Annual Report.
Misra, S. 1993. India's Textile Sector - A P'olicy Analysis. Sage Publications.
Office of the Textile Comnmnissioner, GOI. 1995-2000. Compendium of Textile Statistics.
Olson, M. 1971. The Logic of Collective Action - Public Goods and the Theory of Groups. HarvardUniversity Press.
Peel, Q. 1997. "Planting Seeds of Growth". Financial Times(London), June 24, 1997.
Pursell, G. and A. Gupta. 1996. "Protection. and Incentive Indicator, 1965-95". Background WorkingPaper, World Bank.
Sachs, J. and A. Warner. 1995. "Natural Resource Abundance and Economic Growth". NBER WorkingPaper No. 5398.
Sadoulet, E. and A. de Janvry. 1993. Quantitative Development Policy Analysis. University of CaliforniaPress.
Sastry, D.U. 1984. The Cotton Mill Industry in India. Oxford University Press.
Shah, S. 1996. "Save Our Bales: the Farmers Send Out Distress Signals". Economic Times (Ahmedabad),May 18, 1996.
Srinivasa-Raghavan, T.C.A. 1997. "Corrosion Spoils the Steel Frame". Financial Times (London),June 24, 1997.
TEXPROCIL, GOI. 1995-2000. Handbook of Export Statistics.
Uchikawa, S. 1998. India 's Foreign Trade: Growth of the Textile Industry. Manohar Publishers.
World Bank. 1999. India: Cotton and Textile Industries - Reforming to Compete, (Report No.18857-IN)
62
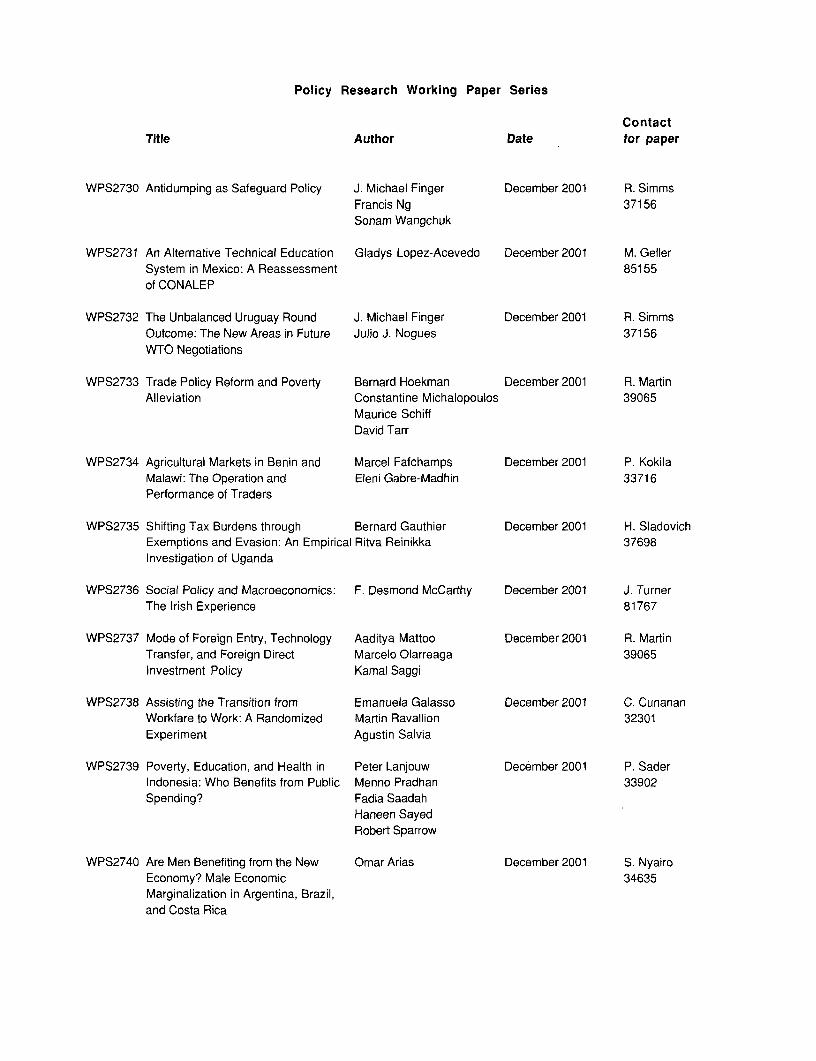
Policy Research Working Paper Series
ContactTitle Author Date for paper
WPS2730 Antidumping as Safeguard Policy J. Michael Finger December 2001 R. SimmsFrancis Ng 37156Sonam Wangchuk
WPS2731 An Alternative Technical Education Gladys Lopez-Acevedo December 2001 M. GellerSystem in Mexico: A Reassessment 85155of CONALEP
WPS2732 The Unbalanced Uruguay Round J. Michael Finger December 2001 R. SimmsOutcome: The New Areas in Future Julio J. Nogues 37156WTO Negotiations
WPS2733 Trade Policy Reform and Poverty Bernard Hoekman December 2001 R. MartinAlleviation Constantine Michalopoulos 39065
Maurice SchiffDavid Tarr
WPS2734 Agricultural Markets in Benin and Marcel Fafchamps December 2001 P. KokilaMalawi: The Operation and Eleni Gabre-Madhin 33716Performance of Traders
WPS2735 Shifting Tax Burdens through Bernard Gauthier December 2001 H. SladovichExemptions and Evasion: An Empirical Ritva Reinikka 37698Investigation of Uganda
WPS2736 Social Policy and Macroeconomics: F. Desmond McCarthy December 2001 J. TurnerThe Irish Experience 81767
WPS2737 Mode of Foreign Entry, Technology Aaditya Mattoo December 2001 R. MartinTransfer, and Foreign Direct Marcelo Olarreaga 39065Investment Policy Kamal Saggi
WPS2738 Assisting the Transition from Emanuela Galasso December 2001 C. CunananWorkfare to Work: A Randomized Martin Ravallion 32301Experiment Agustin Salvia
WPS2739 Poverty, Education, and Health in Peter Lanjouw December 2001 P. SaderIndonesia: Who Benefits from Public Menno Pradhan 33902Spending? Fadia Saadah
Haneen SayedRobert Sparrow
WPS2740 Are Men Benefiting from the New Omar Arias December 2001 S. NyairoEconomy? Male Economic 34635Marginalization in Argentina, Brazil,and Costa Rica
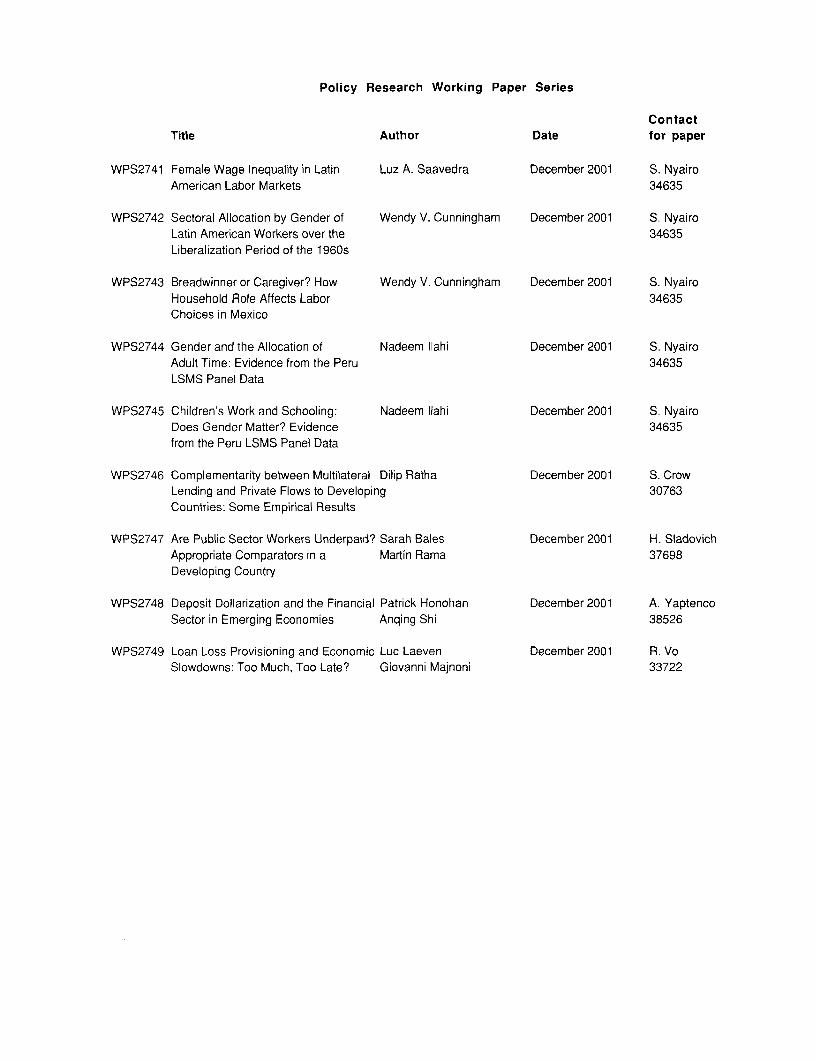
Policy Research Working Paper Series
ContactTitle Author Date for paper
WPS2741 Female Wage Inequality in Latin Luz A. Saavedra December 2001 S. NyairoAmerican Labor Markets 34635
WPS2742 Sectoral Allocation by Gender of Wendy V. Cunningham December 2001 S. NyairoLatin American Workers over the 34635Liberalization Period of the 1960s
WPS2743 Breadwinner or Caregiver? How Wendy V. Cunningham December 2001 S. NyairoHousehold Role Affects Labor 34635Choices in Mexico
WPS2744 Gender and the Allocation of Nadeem llahi December 2001 S. NyairoAdult Time: Evidence from the Peru 34635LSMS Panel Data
WPS2745 Children's Work and Schooling: Nadeem llahi December 2001 S. NyairoDoes Gender Matter? Evidence 34635from the Peru LSMS Panel Data
WPS2746 Complementarity between Multilateral Dilip Ratha December 2001 S. CrowLending and Private Flows to Developing 30763Countries: Some Empirical Results
WPS2747 Are Public Sector Workers Underpaid? Sarah Bales December 2001 H. SladovichAppropriate Comparators in a Martin Rama 37698Developing Country
WPS2748 Deposit Dollarization and the Financial Patrick Honohan December 2001 A. YaptencoSector in Emerging Economies Anqing Shi 38526
WPS2749 Loan Loss Provisioning and Economic Luc Laeven December 2001 R. VoSlowdowns: Too Much, Too Late? Giovanni Majnoni 33722