the pleasure people get from doing or consuming something
Post on 22-Dec-2015
222 views
TRANSCRIPT

the pleasure people get from doing or consuming something
“Why are you going out? Are your friends more important to you than me?”
Which is more valuable water or diamonds?
Some things have High Total Utility, but Smaller Marginal
Utility

Diminishing Marginal Utility
• As additional units are consumed, marginal utility decreases, but total utility continues to increase
• When total utility is at a maximum, marginal utility is zero
• After some point, the marginal utility received from each additional unit of a good decreases with each additional unit consumed
• Beyond this point, total utility decreases and marginal utility is negative

Utility
Q
The total utility curve is bowed
downward
10
60
40
50
70
Utility
Q1 2 3 4 5 6 7 8
Total Utility Curve Marginal Utility Curve
The marginal utility curve is downward
sloping and graphed at the halfway point
1 2 3 4 5 6 7 8
30
20
2
12
8
10
14
6
4
–2
0
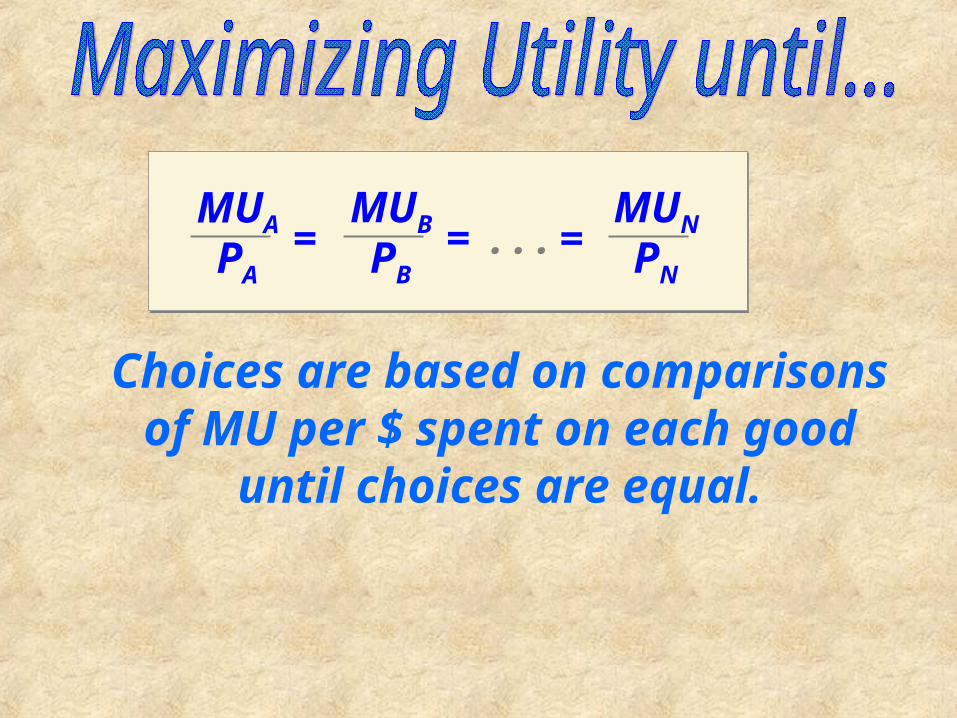
Choices are based on comparisons of MU per $ spent on each good until
choices are equal.
MUA
PA=
MUB
PB= . . . =
MUN
PN

Number
Bought
With Constraint
1
2
3
4
5
6
7
10
8
7
6
5
4
3
24
20
18
16
12
6
4
Domestic MU/$
____ ____
Domestic $1
MU
Marginal Utility per $Imported $2
MU
Without Income Constraint?
Imported MU/$
____ ____
____ ____
____ ____
____ ____
____ ____
____ ____
With $12?

At a lower price consumers can switch to
the cheaper good, substituting the cheaper for the more expensive.
Substitution Effect
Why the Demand Curve slopes downOne Reason:

A lower price of a good will increase purchasing power of the consumer. They can buy more than
before.
Income Effect
A Second Reason:
Why the Demand Curves slopes down

Diminishing Utility
Consumers get less satisfaction as they buy more of a good. For the
consumer to buy more the price must be reduced.
A Third Reason:
Why the Demand Curves slopes down

$2.50
$2.00
Price
Frozen pizzasper week
$3.00
$3.50
MB4 MB3 MB2 MB1<<<
MU4 MU3 MU2 MU1<<<because
d MB=
• The demand for frozen pizzas reflects the law of diminishing marginal utility.
• Because marginal utility (MU) falls with increased consumption, so does a consumer’s maximum willingness to pay -- marginal benefit (MB).• A consumer will purchase until
MB = Price . . . so at $2.50 they would purchase 3 frozen pizzas and receive a consumer surplus shown by the shaded area (above the price line and below the demand curve).
Price = $2.50
The Pizza Demand Curve
John’s demand curvefor frozen pizza
421 3
MB4
MB3
MB2
MB1

Wage Rates and Labor Supply
S
Wage
Hours per week
The higher the wage, the higher the marginal utility of the goods you
can get for the wage
This gives an upward sloping supply curve $8.00
20
$10.00
$8.50
21
26

Applying the Theory of Choice to the Real World
• Those assumptions are:
• The assumptions underlying the theory of rational decision making place limits on the use of the theory
1. Decision making is costless
2. Tastes are given
3. Individuals maximize utility
• Behavioral economists question all three
assumptions

• Most people may use bounded rationality which is rationality based on rules of thumb
• The costs of deciding among hundreds of possible choices may lead us to do some things that seem irrational
• “You get what you pay for” is the implication that high price equals high quality
• “Follow the leader” leads to focal point equilibria in which a set of goods is consumed because they have become focal points to which people have gravitated
Decision making is costless

• Tastes are often significantly influenced by society
• Implicit in the theory of rational choice is that utility functions are given, not shaped by society
• Conspicuous consumption is the consumption of goods not for one’s direct pleasure, but to show off to others
Tastes are given
• “Given tastes” is the assumption on which an economic analysis is conducted

Item Price Utility
Pants $60 125
Shirt $40 100
Wallet $20 50

If Mr. Smith thinks the last dollar spent on shirts yields less satisfaction than the last dollar spent on cola, and Smith is a utility-maximizing consumer, he should
a.decrease his spending on cola.b. decrease his spending on cola and increase his
spending on shirts.c.increase his spending on shirts.d. increase his spending on cola and decrease his
spending on shirts.“I like ice cream, but after eating homemade ice cream last night, I want to have something else for dessert today.” This statement most clearly reflects
a.the budget constraint.b.consumer irrationality.c. the second law of demand: Price elasticity increases with time.d.the law of diminishing marginal utility.
If the price of gasoline goes up, and Dan now buys fewer candy bars because he has to spend more on gas, this would best be explained by
a.the substitution effect.b.the income effect.c. the highly elastic demand for gasoline.d.weight watchers effect.