the physiology of the tambaqui (colossoma macropomum) at ph...
TRANSCRIPT

Vol.:(0123456789)1 3
Journal of Comparative Physiology B https://doi.org/10.1007/s00360-017-1137-y
ORIGINAL PAPER
The physiology of the Tambaqui (Colossoma macropomum) at pH 8.0
Chris M. Wood1,2,3,4 · R. J. Gonzalez5 · Márcio Soares Ferreira4 · Susana Braz‑Mota4 · Adalberto Luis Val4
Received: 14 August 2017 / Revised: 5 November 2017 / Accepted: 17 November 2017 © Springer-Verlag GmbH Germany, part of Springer Nature 2017
AbstractThe Tambaqui is a model neotropical teleost which is of great economic and cultural importance in artisanal fisheries and commercial aquaculture. It thrives in ion-poor, often acidic Amazonian waters and exhibits excellent regulation of physiology down to water pH 4.0. Curiously, however, it is reported to perform poorly in aquaculture at pH 8.0, an only slightly alkaline pH which would be benign for most freshwater fish. In initial experiments with Tambaqui of intermediate size (30–50 g), we found that ammonia excretion rate was unchanged at pH 4, 5, 6, and 7, but elevated after 20–24 h at pH 8, exactly opposite the pattern seen in most teleosts. Subsequent experiments with large Tambaqui (150–300 g) demonstrated that only ammonia, and not urea excretion was increased at pH 8.0, and that the elevation was proportional to a general increase in MO2. There was an accompanying elevation in net acidic equivalent excretion and/or basic equivalent uptake which occurred mainly at the gills. Net Na+ balance was little affected while Cl− balance became negative, implicating a disturbance of Cl− versus base exchange rather than Na+ versus acid exchange. Arterial blood pH increased by 0.2 units at pH 8.0, reflecting combined meta-bolic and respiratory alkaloses. Most parameters recovered to control levels by 18–24 h after return to pH 6.0. With respect to large Tambaqui, we conclude that a physiology adapted to acidic pH performs inappropriately at moderately alkaline pH. In small Tambaqui (4–15 g), the responses were very different, with an initial inhibition of ammonia excretion rate at pH 8.0 followed by a subsequent restoration of control levels. Elevated ammonia excretion rate occurred only after return to pH 6.0. Furthermore, MO2, plasma cortisol, and branchial vH+ATPase activities all declined during pH 8.0 exposure in small Tambaqui, in contrast to the responses in larger fish. Overall, small Tambaqui appear to cope better at pH 8.0, a difference that may correlate with their natural history in the wild.
Keywords Alkalinity · Ammonia · Urea · Oxygen consumption · Nitrogen quotient · Acid–base regulation · Ionoregulation
Introduction
The Tambaqui (Colossoma macropomum), a serrasalmid teleost which is native to the Orinoco and Amazon river watersheds, is now extensively exploited in both aquaculture and capture fisheries, and is quickly becoming a model neo-tropical species in physiology (reviewed by Goulding and Carvalho 1982; Araujo-Lima and Goulding 1997; Prado-Lima and Val 2016; Wood et al. 2017; Da Silva Nunes et al. 2017). The Tambaqui is renowned for its robust physiology, and is particularly resistant to the hypoxic and acidic condi-tions which are typical of these regions (Saint-Paul 1984; Val and Almeida-Val 1995; Gonzalez et al. 1998; Wood et al.
1998; Wilson et al. 1999; Chagas and Val 2006; Florindo et al. 2006; Robertson et al. 2015). With respect to acidity, earlier studies (Wood et al. 1998; Wilson et al. 1999) dem-onstrated that progressive reductions in water pH down to 4.0 caused negligible disturbances in ammonia excretion, acid–base fluxes, internal acid–base status, blood gases, and plasma stress indicators (cortisol, glucose, lactate). While Na+ and Cl− balance became negative initially, net losses were quickly attenuated and there was minimal disturbance of plasma ion levels. Indeed, Tambaqui appear to thrive at low pH, exhibiting higher growth rates under aquacultural conditions at pH 4.0 than at pH 6.0 (Aride et al. 2007).
It was surprising that in this same aquacultural study (Aride et al. 2007), Tambaqui exhibited negative growth rates at pH 8.0, and a host of internal physiological dis-turbances were evident at terminal sampling after 40 days of exposure. A pH of 8.0 is typical of many fresh waters throughout the world (Moss 2009), and is benign to most
Communicated by G. Heldmaier.
* Chris M. Wood [email protected]
Extended author information available on the last page of the article

Journal of Comparative Physiology B
1 3
teleost species. However, at higher water pH (> 9.0), physi-ological homeostasis starts to break down in most species, with the principal problem being a buildup of toxic ammonia in the body fluids associated with an inhibition of branchial ammonia excretion (Wilkie and Wood 1996; Wilkie 2002). It is now generally believed that this inhibition is due to the rise in pH at the external boundary layer of the gills which would reduce acid trapping of NH3 and/or inhibit the Rh protein-based “Na+/NH4
+ exchange complex” (Wright and Wood 2009, 2012; Weihrauch et al. 2009). These parameters were not assessed in the study of Aride et al. (2007). In gen-eral, mechanisms of branchial ammonia excretion are not well understood in acidophilic fishes of the Amazon (Wilson 1996; Gonzalez et al. 2005; Wood et al. 2014, 2017). Nev-ertheless, we suspected that in such fish, the threshold pH at which ammonia excretion became inhibited was simply shifted to a lower level relative to that in most fish. There-fore, our initial hypothesis was that the problems of the Tam-baqui at pH 8.0 would be due to internal ammonia buildup, and we started by surveying the effects of a range of pH (4.0–8.0) on the rate of ammonia excretion.
The results were unexpected and clearly did not support our hypothesis. Thus, the focus of the study changed to investigate why and how the rate of ammonia excretion actu-ally increases at pH 8.0 in the Tambaqui, and whether this is associated with disturbances in metabolic rate, acid–base balance, or net ion flux rates. In general, in most fish at extreme pH values, the normal functions of the gills tend to become inhibited, and the contributions of the kidney to ammonia excretion and acid–base balance become more important (e.g., McDonald and Wood 1981; Wood et al. 1999; Wright et al. 1993; Lawrence et al. 2015). Conse-quently, renal as well as branchial responses were assessed. Much of this work was performed on Tambaqui in the 30–50 and 150–300 g range, but during the course of the study, it became apparent that the responses to pH 8.0 exposure of very small Tambaqui (4–15 g) differed greatly from those of the larger animals. Possible reasons for this difference were therefore pursued.
Materials and methods
Experimental animals and water
Experiments were performed on juvenile Tambaqui [Colossoma macropomum (Cuvier 1816), Order Characi-formes, Family Serrasalmidae] in three size categories, designated as small (4–15 g), intermediate (30–50 g), and large (150–350 g) for the purposes of this study. All fish were obtained from a commercial aquaculture farm (Sítio dos Rodrigues, Km 35, Rod. AM-010, Brazil) and held at the Ecophysiology and Molecular Evolution Laboratory of
the Brazilian Institute for Research of the Amazon (Insti-tuto Nacional de Pesquisas da Amazônia, INPA) for at least 2 weeks prior to use. The holding and experimental water was typical Amazonian soft water obtained from wells on the INPA campus ([Na+] = 50 μM, [Cl−] = 25 μM, [Ca2+] = 5 μM, [Mg2+] = 4 μM, [K+] = 16 μM; [titratable alkalinity] = 140 μM; pH 5.8–6.5, temperature 27–30 °C). As this groundwater is very high in dissolved CO2, it was vigorously aerated prior to use, and all fish were held under recirculating conditions, with background total ammonia concentrations less than 20 μM. Fish were fed daily to satiation with commercial pellets (Nutripeixe Tr36, Purina Co., São Paulo, SP, Brazil 36% protein) and fasted for 48–72 h prior to experimentation. Fasting was done to standardize metabolic rate and prevent fecal con-tamination of the water which would confound flux meas-urements. Procedures conformed to national animal care regulations and were approved by the Ethics Committee on Animal Experiments of INPA under registration numbers 023/2012 and 026/2015.
Experimental series
Series 1—survey of ammonia excretion rates at a range of pH in Tambaqui of intermediate size
Tambaqui of intermediate size were placed in 8-L dark-ened chambers served with aeration and recirculating water flow at control pH (~ 6.0). After a 3-h settling period, water pH in the 500-L reservoir was adjusted to pH 4.0, 5.0, 6.0 (control), 7.0, or 8.0 with 1 M HNO3 or 1 M KOH as appropriate (N = 9 different fish at each pH). After 20 h at each pH, water flow to each chamber was suspended, volume was set to 6.0 L, and 10 mL of water samples for ammonia analysis were taken as 0, 1, 2, 3, and 4 h. Water pH was checked immediately after each sampling and adjusted as necessary. In practice, pH in this experiment and in all other series was held within ± 0.3 units of the target pH value.
KOH rather than NaOH was employed to set pH 8.0 in this and all subsequent experimental series as we wished to maintain Na+ concentrations constant to avoid possible Na+-linked changes in ammonia excretion (e.g., Wright and Wood 1985, 2009). In a preliminary experiment with small Tambaqui exposed acutely to 500 µmol L−1 KCl at pH 6.0, comparable to the highest K+ concentration measured in the pH 8.0 exposures, there was no significant change in ammo-nia excretion rate (MAmm, − 1201 ± 116 µmol kg−1 h−1 at pH 6.0 versus − 1305 ± 105 µmol kg−1 h−1 at pH 6.0 + 500 µmol L−1 KCl, N = 7).This is in agreement with earlier high pH experiments on large trout where comparable K+ concentra-tions proved benign (Wilkie et al. 1996).

Journal of Comparative Physiology B
1 3
Series 2—effects of pH 8.0 exposure and recovery on ammonia and urea excretion, net ion fluxes, and acid–base fluxes in large Tambaqui
Large Tambaqui were anesthetized in 0.1 g L−1 MS-222 (Syndel Laboratories, Vancouver, BC, Canada), pH cor-rected with KOH. The fish were fitted with indwelling uri-nary bladder catheters (Clay-Adams PE-50 tubing with a PE160 sleeve—Becton, Dickinson and Co., Franklin Lakes, NJ, USA), exactly as described by Wood and Pat-rick (1994) and Wood et al. (2017).The fish were allowed to recover overnight in darkened plastic chambers served with aeration and flow-through water (pH 6.0) from a 500-L external re-circulating system. Water in the reser-voir was renewed every 12 h. Urine was collected into 25-mL covered Erlenmeyer flasks using a siphon head of 3 cm. The patency of the urinary catheter was checked during the overnight recovery period; success rate was about 50%. Experiments were only started using fish with working urinary catheters, such that in each batch there were 4–7 fish. The protocol was repeated three times to yield N = 15 during the pH 6.0 control period (see below). The number of fish with working urinary catheters declined to N = 11 at pH 8.0 and N = 4 at pH 6.0 recovery. When catheters failed, they invariably pulled out of the urogenital papilla and started to siphon water at a high rate. Therefore, they were removed, so that whole ani-mal flux data (sum of branchial and urinary components) could still be collected for N = 15. All urine samples were analyzed for volume, ammonia, and urea, but only urine samples from the N = 4 completing the entire 3-day proto-col were analyzed for titratable acidity minus bicarbonate ([TA-HCO3
−]).At about noon on the day after catheterization, the 24-h
control period at pH 6.0 was started (0 h, Day 1). At approxi-mately 18 h on Day 1, a fresh urine collection (18–24 h) was started to yield the control urine collection. In the mid-dle (20–22 h) of this period, the water flow to the chamber was suspended while aeration continued, and the volume was set to 3.2 L. Initial and final water samples (2 × 20-mL) for ammonia, urea, Na+, Cl−, K+, and titratable alkalinity analyses were taken over this 2-h period. At 24 h, the pH in the reservoir was set to pH 8.0 (start of Day 2), and the urine collection and water sampling protocols were repeated identically at 42–48 h on Day 2. At 48 h, the water pH in the reservoir was reset to pH 6.0 for the recovery period (start of Day 3), and the urine collection and water sampling protocols were repeated identically at 66–72 h on Day 3. In consequence, the water measurements and urine measure-ments were contemporaneous, and occurred at 20–22 and 18–24 h exposure, respectively, in each water pH treatment. At each time, a parallel blank was run with a chamber from which the fish had been removed.
Series 3—effects of pH 8.0 exposure and recovery on oxygen consumption and ammonia and urea excretion in large Tambaqui
The protocol was comparable to that in Series 2 but as there was no surgery or anesthesia, the initial overnight recovery period was omitted, and the 3.2-L flux chambers were modi-fied so that they could be sealed with a port to accommodate an O2 probe. Large fish (N = 9) were added to the darkened chambers on flow-through at pH 6.0. Three 24-h treatments ensued at pH 6.0, pH 8.0, and pH 6.0 recovery. At 20–22 h (Day 1 at pH 6.0), 44–46 h (Day 2 at pH 8.0), and 68–70 h (Day 3 at pH 6.0 recovery), flow was suspended, and initial and final water samples (10 mL) were drawn for ammonia and urea analyses. In the middle of these periods, aeration was suspended for 30–45 min, the chamber was sealed, and initial and final measurements of water O2 concentration were taken. The fish’s ventilation during the trial, plus gentle manual rocking of the chamber prior to sampling, ensured mixing. At each time, a parallel blank chamber was run as in Series 2.
Series 4—initial time course of the responses of oxygen consumption and ammonia excretion rates to pH 8.0 exposure in large Tambaqui
As in Series 3, large Tambaqui (N = 8) were allowed to settle in the 3.2-L chambers on flow-through at pH 6.0. At about 22 h, both flow and aeration were suspended, the chamber was sealed, and initial and final water samples (10 mL) and O2 concentration measurements were taken over a 40-min period at pH 6.0. The pH in both the reservoir and the fish chambers was then reset to 8.0, and at both 1–2 and 6–7 h after the start of pH exposure, the O2 concentration and water sampling protocols were repeated. At each time, a par-allel blank chamber was run as in Series 2. Water samples were analyzed only for ammonia as the 40-min time period was too short for reliable urea flux measurements.
Series 5—effects of pH 8.0 exposure and recovery on blood acid–base status and plasma ammonia and glucose concentrations in large Tambaqui
As in Series 2, large Tambaqui were anesthetized with MS-222, and then fitted with indwelling blood-sampling catheters (Clay-Adams PE-50 tubing) in the caudal artery, largely as described by Wood et al. (1998). The vessel was exposed by surgically separating the hypaxial and epaxial muscle masses, and the tubing was advanced under a vertebral spine for several cm into the vessel. The catheter was filled with Cortland saline (Wolf 1963) heparinized at 100 i.u. ml−1 with lithium heparin (Sigma-Aldrich, St. Louis, MO, USA). The wound was dusted

Journal of Comparative Physiology B
1 3
with oxytetracycline (Sigma-Aldrich) and tightly closed with silk sutures and a drop of cyanoacrylate tissue glue (Vetbond™, 3M Co., Maplewood, MN, USA). The only substantial difference from the method of Wood et al. (1998) was the addition of a sleeve of PE-160 tubing, flanged at both ends, that was secured by Vetbond™ to the PE50 just as it exited posteriorly from the closed wound. Additional silk sutures next to the anterior and posterior flanges ensured minimal back-and-forth movement of the catheter. The fish were allowed to recover overnight in darkened plastic chambers served with aeration and flow-through water (pH 6.0) from a 500-L external re-circulat-ing system.
Thereafter, the protocol was parallel to that of Series 2, with an overnight recovery period, followed by Day 1 at pH 6.0, Day 2 at pH 8.0, and Day 3 at pH 6.0 recovery.
Blood samples (500 µL) were drawn anaerobically into a gas-tight Hamilton syringe at 20–22 h (Day 1 at pH 6.0), 44–46 h (Day 2 at pH 8.0), and 68–70 h (Day 3 at pH 6.0 recovery) for analyses of arterial pH (pHa), plasma total CO2, plasma total ammonia, and plasma glucose. At each sampling time, the red blood cells were resuspended in non-heparinized Cortland saline and then re-infused into the fish to maintain hematocrit.
Series 6—effects of pH 8.0 exposure and recovery on ammonia excretion rates in small Tambaqui
Small Tambaqui were weighed, placed into individual 150-mL chambers connected to a 100-L recirculating sys-tem filled with aerated INPA well water adjusted to pH 6.0, and allowed to recover overnight. To start the test, flow to the chambers was stopped and initial 6 mL of water samples were taken from each chamber. An hour later, final water samples were taken and flow was restored. This constituted the control flux measurement at pH 6.0. Dur-ing flow stoppage, the pH of the recirculating system was raised to pH 8.0 with the addition of concentrated KOH. With restoration of flow, the pH in the chambers rose to the target within 5–10 min. This was designated as the start of the pH 8.0 exposure period. Additional 1-h flux periods occurred at 1, 3, 6, 12, and 24 h of exposure. In preliminary tests, it was found that the pH of the water in individual chambers fell rapidly. Consequently, during measurement periods at pH 8.0, the pH values in indi-vidual chambers were adjusted every 10 min. As a result, pH in the chambers varied between 7.7 and 8.3. While flow was stopped during the final measurement period at pH 8.0, the pH of the system was returned to pH 6.0, and recovery measurements were made after 1 and 4 h. At each time, a parallel blank chamber was run as in Series 2.
Series 7—effects of pH 8.0 exposure on the rate of oxygen consumption in small Tambaqui
Small Tambaqui were weighed, placed into individual air-tight 2-L chambers connected to a 500-L recirculating sys-tem filled with aerated INPA well water adjusted to pH 6.0, and allowed to recover overnight. For measurements, flow was stopped, initial PO2 readings were made in each cham-ber, and chambers were sealed. 2 h later final PO2 readings were made and flow was restored. Measurements were made at pH 6.0 and after 1 and 24 h at pH 8.0.
Series 8—effects of pH 8.0 exposure on gill enzymes and plasma cortisol: a comparison of small versus large Tambaqui
Small (n = 6) and large Tambaqui (n = 6) were placed in individual 5-L darkened chambers, continuously aerated and connected to two 500-L recirculating system. The system was filled with aerated INPA well water, and the animals remained in this system for 24 h for recovery from handling. Then, one group was exposed to pH 6 that was adjusted with 1M HNO3, and the other group was exposed to pH 8, adjusted with 1M KOH. After 24 h of exposure, the animals were quickly terminally anesthetized with a high concen-tration (0.5 g L−1, pH—corrected with KOH) of MS-222 (Syndel Laboratories, Vancouver, BC, Canada) within the chambers to avoid any struggling or handling stress, and the blood sampled from the caudal vein using a heparinized syringe. Plasma was separated by centrifugation (5000 g for 1 min) for analyses of cortisol. After blood collection, the gills were removed and stored in liquid nitrogen for analyses of vH+ATPase and Na+, K+ATPase activities.
Analytical techniques and calculations
Water pH was monitored using an WD-35801-00 epoxy body pH probe (Oakton Instruments, Vernon Hills, IL, USA) and H160 portable meter (Hatch Co., Loveland, CO, USA), and water O2 concentration was measured with a YSI 550A-12 portable electrode probe and meter (YSI Inc., Yellow Springs, OH, USA). Water ammonia and urea con-centrations were assayed by the colorimetric methods of Verdouw et al. (1978) and Rahmatullah and Boyde (1980), respectively. Urea assays were read in 1-cm cuvettes rather than in microplates so as to increase precision. Water Na+ and K+ concentrations were measured using a 910 Digital Flame Photometer (Instrumentação Analítica São Paulo, Brazil), and water Cl− concentrations by the colorimetric assay of Zall et al. (1956). Water titratable alkalinity meas-urements were performed as described by McDonald and Wood (1981), by titrating 10 mL of water samples to an endpoint of pH 4.0 with 0.02 N HCl (Sigma-Aldrich) using a

Journal of Comparative Physiology B
1 3
microburette (Gilmont Instruments, Great Neck, NY, USA), while the sample was continually bubbled with CO2-free air. A sealed body 20020 electrode (Quimis Inc., Diadema, Bra-zil) coupled to a PG1800 pH meter (Gehaka Inc., Sao Paulo, Brazil) was used. An increase in the titratable alkalinity of the water represents a net uptake of titratable acid (TA) by the fish, and vice versa.
Oxygen consumption rates (MO2), as well as the net flux rates (µmol kg−1 h−1) of ammonia (MAmm−N), urea-N (MUrea−N, recognizing there are two Ns per urea mole-cule), Na+ (JNa), K+ (JK), Cl− (JCl), and TA (JTA) with the water were calculated in the standard fashion from changes in concentration (µmol L−1), factored by the known fish weight (kg), volume (L), and time (h). For MO2, MAmm−N, MUrea−N, and JTA, values were corrected for any changes in the simultaneous blank. Positive values indicate net uptake from the water by the fish, negative values indi-cate net losses by the fish. The net acidic equivalent flux (JH) was calculated as the sum of MAmm−N and JTA, signs considered, as explained by McDonald and Wood (1981). Total-N excretion rate (MN) was calculated as the sum of MAmm−N + MUrea−N, and the nitrogen quotient (NQ) was cal-culated as [MAmm−N + MUrea−N]/MO2. Based on standard met-abolic theory (cf. van den Thillart and Kesbeke 1978; Van Waarde 1983; Lauff and Wood 1996), if aerobic metabolism is due entirely to the oxidation of protein (i.e., amino acids) and no other fuels, then the NQ will be 0.27. Therefore, the actual percentage of aerobic metabolism fueled by protein was calculated as [NQ/0.27] × 100%.
Urine flow rate (UFR) was determined gravimetrically, and urine samples were analyzed for total ammonia and urea using the same assays as for water (Verdouw et al. 1978; Rahmatullah and Boyde 1980). Urine titratable acidity minus bicarbonate ([TA-HCO3
−]) was measured as a sin-gle value in the double endpoint titration procedure recom-mended by Hills (1973). As volumes were low, samples were diluted tenfold with 0.02 N NaCl prior to titration. Standard-ized acid (0.02 N HCl) and base (0.02 N NaOH), and the same microburettes, pH electrode, and meter were used as for water titratable alkalinity measurements. The final end-point was the mean blood pH (7.72) measured under control conditions (water pH 6.0) in Series 5. The net rate of urinary acid excretion (µmol kg−1 h−1) was calculated as the product of UFR × [Ammonia + TA-HCO3
−]. Additional explanation of the theory and methodology is given by McDonald and Wood (1981) and Wright et al. (2014).
Immediately after collection of blood from the caudal artery catheters, pHa was measured on a 200-µL subsample in a custom-made water-jacketed chamber that was ther-mostatted to the experimental temperature. The same pH electrode and meter were employed as for water titratable alkalinity and urine [TA-HCO3
−] measurements. The other 500 µL of blood was centrifuged (5000 g for 1 min), and an
aliquot of plasma assayed immediately for total CO2 with a Corning 965 Analyser (Ciba-Corning, Halstead, Essex, UK). The remaining plasma was immediately frozen in liquid nitrogen and stored at − 80 °C until analysis. Commercial enzymatic assays were used to measure total plasma ammo-nia (Raichem ammonia kit, Cliniqa Corporation, San Mar-cos, CA, USA) and glucose (Infinity™ glucose hexokinase liquid stable reagent, Thermo Fisher Scientific Inc., Burl-ington, ON, Canada). Arterial CO2 partial pressure (PaCO2), plasma [HCO3
−]a, and arterial ammonia partial pressure (PaNH3) were calculated using rearrangements of the Hen-derson–Hasselbach equation with constants (pK, solubility) for plasma CO2 taken from Severinghaus et al. (1956) as in Albers (1970), and for plasma ammonia from Cameron and Heisler (1983). The pK values of Severinghaus et al. (1956) for CO2 were utilized in preference to the commonly used values of Boutilier et al. (1984), because the former were determined over a temperature range (24–37.5 °C) brack-eting that (27–30 °C) of the present experiments, whereas the latter were determined only in the 5–15 °C tempera-ture range, and yielded unrealistically low pK values when extrapolated to high temperature. In contrast, the CO2 solu-bility values from the two sources at 27–30 °C do not differ.
Levels of plasma cortisol were measured by an enzyme-linked immunoassay commercial kit (Diagnostics Biochem Canada, London, ON, Canada). The activities of both gill Na+, K+ATPase and vH+-ATPase were determined by NADH oxidation in an enzymatic reaction coupled to the hydrolysis of ATP (Kültz and Somero 1995). The assay, which was performed at 25 °C, is based on the inhibi-tion of Na+, K+ATPase activity by ouabain (2 mM), and vH+-ATPase activity by N-ethylmaleimide (NEM, 2 mM). Gills were homogenized in imidazole buffer (150 mM sucrose, 50 mM imidazole, 10 mM EDTA, 2.5 mM deoxy-cholic acid, pH 7.5), 1:10, and centrifuged at 2000 g for 7 min at 4 °C. Supernatants were added to a reaction mixture containing (in mM): imidazole 30, NaCl 45, KCl 15, MgCl2 3.0, KCN 0.4, ATP 1.0, NADH 0.2, fructose-1,6-bisphos-phate 0.1, phosphoenolpyruvate 2.0, with 3 U mL−1 pyru-vate kinase and 2 U mL−1 lactate dehydrogenase. Samples were run with and without ouabain or NEM. Absorbance was followed over 10 min at 340 nm. The activities of Na+, K+ATPase and vH+-ATPase were calculated by the differ-ences between total activities and activities with ouabain and NEM inhibitors, respectively. Total protein concentration was measured according to Bradford (1976) using bovine serum albumin (BSA) as a standard at 595 nm.
Statistics
Data have been presented as means ± 1 SEM (N = number of fish). Prior to significance testing, data were checked for normality (Shapiro–Wilk test) and homogeneity of variance

Journal of Comparative Physiology B
1 3
(Levene test or F test), and appropriately transformed in the few cases where necessary. One-way ANOVA followed by Tukey’s test was used to compare means in Series 1. One-way ANOVA followed by Dunnett’s test was used to com-pare experimental means in Series 6 and 7 with the original control value at pH 6.0. As a repeated measures design was used in Series 2–5, data were analyzed by repeated meas-ures one-way ANOVA followed by Dunnett’s test to com-pare experimental values at pH 8.0 and pH 6.0 recovery in comparison to the original control values at pH 6.0. Two-way ANOVA (water pH, size) followed by Tukey’s test was employed to compare gill enzyme and cortisol data in small versus large Tambaqui at pH 6.0 and 8.0 in Series 8. Simple pairwise comparisons were performed with Student’s t test. One sample t tests were used to evaluate whether means were significantly different from zero. All tests were two-tailed and P ≤ 0.05 was taken as the limit of significance.
Results
Series 1—survey of ammonia excretion rates at a range of pH in Tambaqui of intermediate size
In Series 1, after 20–24 h at pH 4.0, 5.0, and 7.0, MAmm−N in Tambaqui of intermediate size was unchanged from the control rate at pH 6.0 (Fig. 1). However, contrary to expecta-tion, MAmm−N at pH 8.0 was approximately twice as high as at the other pH values.
Series 2—effects of pH 8.0 exposure and recovery on ammonia and urea excretion, net ion fluxes, and acid–base fluxes in large Tambaqui
In Series 2, measurements of whole animal MAmm−N (sum of branchial and urinary components) at 20–22 h of exposure
to pH 8.0 confirmed that the same substantial increase in ammonia excretion rate also occurred in large Tambaqui (Fig. 2a). Furthermore, the response was reversible, with re-establishment of control MAmm−N rates by 20–22 h of return to pH 6.0. Notably, the response was specific to MAmm−N; whole animal MUrea−N, which at pH 6.0 was only about 10% of MAmm−N, remained unchanged during pH 8.0 exposure and after return to pH 6.0 (Fig. 2b).
Table 1 reports data for only the four Tambaqui in which urine collections were complete for the whole experiment, but urinary ammonia and urea data for samples collected from the other fish were very similar. The rate of urinary ammonia excretion was very low (< 2% of whole body MAmm−N) and did not change significantly during exposure to pH 8.0 or restoration of pH 6.0. Urinary urea-N excretion was also very low (~ 30% of whole body MUrea−N) and did not change during the experimental treatments.
The titratable acidity flux (JTA) with the external water was positive and remained unchanged during exposure to pH 8.0 and recovery at pH 6.0 (Fig. 3). Positive JTA was approx-imately balanced by negative MAmm−N such that the mean net
pH
4 5 6 7 8
-3000
-2500
-2000
-1500
-1000
-500
0
A A A A
B
µmol
kg-1
h-1
MAmm-N
Fig. 1 Ammonia excretion rates (MAmm−N) in Tambaqui of intermedi-ate size in Series 1 after 20–24 h at pH 4.0, 5.0, 6.0 (control), 7.0, and 8.0. Means ± 1 SEM (N = 9 different fish at each pH). Means not shar-ing the same letter are significantly different (P < 0.05) as determined by one-way ANOVA followed by Tukey’s test
Fig. 2 Rates of a ammonia excretion (MAmm−N) and b urea-N excre-tion (MUrea−N) in large Tambaqui in Series 2 after 20–22 h at pH 6.0 on Day 1, after 20–22 h exposure to pH 8.0 on Day 2, and after 20–22 h recovery at pH 6.0 on Day 3. Note the different scales in panels a and b. Means ± 1 SEM, N = 15; the same 15 fish were fol-lowed throughout. Asterisk indicates significant difference (P < 0.05) at pH 8.0 (Day 2) relative to both pH 6.0 (control, Day 1) and pH 6.0 (recovery, Day 3), as determined by repeated measures one-way ANOVA followed by Dunnett’s test

Journal of Comparative Physiology B
1 3
acidic equivalent flux (JH) was only slightly negative and not significantly different from zero in both control and recov-ery periods at pH 6.0. However, during exposure to pH 8.0, the sum of JTA and MAmm−N became highly negative, such that JH (i.e., net acidic equivalent loss to the water, or basic equivalent uptake, which is the same in acid–base terms) occurred at a rate of about − 400 uequiv kg−1 h−1 (Fig. 3).
While Fig. 3 combines water flux data from fish with and without separate external urine collections, it is clear from Table 1 that the urinary contribution to net acid–base bal-ance during these treatments was negligible. The renal fluxes of TA-HCO3
− and net acidic equivalents did switch over to negative values during pH 8.0 exposure and recovery at pH 6.0, but these fluxes were only a few percent of the whole animal fluxes and the changes were not significant.
The net flux rates of sodium (JNa, Fig. 4a) and potas-sium (JK, Fig. 4b) with the external water were slightly negative (significantly different from zero) at pH 6.0, while that of chloride (JCl, Fig. 4c) was slightly positive, but not
significantly different from zero. After 20–22 h exposure to pH 8.0, JNa did not change (Fig. 4a), while JK switched to a slightly positive value, a small but significant change (Fig. 4b). However, the largest change was in JCl, which became highly negative (Fig. 4c). Interestingly, the net change in JCl was about 400 uequiv kg−1 h−1, which almost
Table 1 Net urinary fluxes of acid–base moieties, ammonia-N, and urea-N in large Tambaqui in Series 2 after 18–24 h at pH 6.0 on Day 1, after 18–24 h exposure to pH 8.0 on Day 2, and after 18–24 h recovery at pH 6.0 on Day 3
Means ± 1 SEM, N = 4; the same four fish were followed throughout. There were no significant differences (P > 0.05)
pH 6.0 pH 8.0 pH 6.0 recovery
TA-HCO3− (µequiv kg−1 h−1) 7.83 ± 6.26 − 10.91 ± 7.16 − 5.92 ± 4.11
Ammonia-N (µmol kg−1 h−1) − 6.15 ± 3.37 − 5.68 ± 1.78 − 7.74 ± 5.6Net acidic equivalents (µequiv kg−1 h−1) 1.68 ± 8.33 − 16.59 ± 8.63 − 13.66 ± 8.86Urea-N (µmol kg−1 h−1) − 9.05 ± 4.22 − 8.89 ± 3.89 − 10.43 ± 5.05
-1000
-800
-600
-400
-200
0
200
400 Titratable Acidity Flux
Net Acidic Equivalent Flux
pH = 6 pH = 8 pH = 6
Ammonia Flux
DAY 1 DAY 2 DAY 3
*
*
gkviuqeµ
-1h-1
Fig. 3 Rates of titratable acidity flux (JTA, positive upward bars), ammonia flux (MAmm−, downward negative bars), and net acidic equivalent flux (JH, cross-hatched bars) in large Tambaqui in Series 2 after 20–22 h at pH 6.0 on Day 1, after 20–22 h exposure to pH 8.0 on Day 2, and after 20–22 h recovery at pH 6.0 on Day 3. Means ± 1 SEM, N = 15; the same 15 fish were followed throughout. Asterisk indicates significant difference (P < 0.05) at pH 8.0 (Day 2) relative to both pH 6.0 (control, Day 1) and pH 6.0 (recovery, Day 3), as deter-mined by repeated measures one-way ANOVA followed by Dunnett’s test
Fig. 4 Net flux rates of a sodium (JNa), b potassium (JK), and c chlo-ride (JCl) in large Tambaqui in Series 2 after 20–22 h at pH 6.0 on Day 1, after 20–22 h exposure to pH 8.0 on Day 2, and after 20–22 h recovery at pH 6.0 on Day 3. Means ± 1 SEM, N = 15; the same 15 fish were followed throughout. Asterisk indicates significant differ-ence (P < 0.05) at pH 8.0 (Day 2) relative to both pH 6.0 (control, Day 1) and pH 6.0 (recovery, Day 3), as determined by repeated measures one-way ANOVA followed by Dunnett’s test.

Journal of Comparative Physiology B
1 3
exactly balanced the net change in JH (Fig. 3), thereby con-serving charge balance. All these changes in net ion flux rates were reversed in the recovery period at pH 6.0.
Series 3—effects of pH 8.0 exposure and recovery on oxygen consumption and ammonia and urea excretion in large Tambaqui
The previous results led to the hypothesis that the increase in MAmm−N at pH 8.0 might simply reflect a general increase in metabolic rate. In Series 3, the simultaneous measure-ment of MO2, MAmm−N, and MUrea−N provided support for this hypothesis. Note that all three parameters have been plotted on the same scale in Fig. 5a to facilitate comparison. Both MO2 and MN (the sum of MAmm−N and MUrea−N) increased significantly by about 40% after 20–22 h at pH 8.0, and this response was reversed upon return to pH 6.0. The increase
in MN was entirely due to a rise in MAmm−N; the small con-tribution from MUrea−N remained unchanged, as in Series 2.
The NQ (MN/MO2) was high in these fish, averaging about 0.18, and did not change during the experimental treatments (Fig. 5b). Thus, protein oxidation accounted for about 67% of aerobic metabolism, regardless of the increase in routine MO2 during pH 8.0 exposure.
Series 4—initial time course of the responses of oxygen consumption and ammonia excretion rates to pH 8.0 exposure in large Tambaqui
The goal of this experiment was to determine whether the increases in MAmm−N and MO2 seen at 20–22 h in large Tam-baqui of Series 2 and 3 occurred rapidly at the start of pH 8.0 exposure, because the standard pattern in most teleosts is an initial inhibition of MAmm−N at high pH (see “Introduction”). A significant 21% increase in MO2 occurred by 1–2 h, and by 6–7 h, this had risen to 35% (Fig. 6a). In contrast, there was no change in MAmm at 1–2 h, followed by a 60% increase at 6–7 h which was not significant (P = 0.085) in a two-tailed test (Fig. 6b). These data suggest that there may be a slight initial “back-up” of ammonia excretion, followed by a com-pensation, whereas metabolic rate increases gradually.
Fig. 5 a Simultaneous measurements of rates of routine oxygen con-sumption (MO2), ammonia-N excretion (MAmm−N), and urea-N excre-tion (MUrea−N) in large Tambaqui in Series 3 after 20–22 h at pH 6.0 on Day 1, after 20–22 h exposure to pH 8.0 on Day 2, and after 20–22 h recovery at pH 6.0 on Day 3. Note that all three parameters are plotted on the same scale, and that the sum of MAmm−N + MUrea−N yields MN, the total nitrogen excretion rate. In b, the nitrogen quo-tient (MN/MO2) and the percentage of aerobic metabolism fueled by protein calculated from these measurements are shown. Means ± 1 SEM, N = 9; the same nine fish were followed throughout. Asterisk indicates significant difference (P < 0.05) at pH 8.0 (Day 2) relative to both pH 6.0 (control, Day 1) and pH 6.0 (recovery, Day 3), as deter-mined by repeated measures one-way ANOVA followed by Dunnett’s test
Fig. 6 Initial time course of the responses of a routine oxygen con-sumption rate (MO2) and b ammonia excretion rate (MAmm) to pH 8.0 exposure in large Tambaqui in Series 4. Measurements were made at pH 6.0 (control) and then at 1–2 and 6–7 h of exposure to pH 8.0. Means ± 1 SEM, N = 8; the same eight fish were followed throughout. Asterisk indicates significant difference (P < 0.05) at pH 8.0 relative to pH 6.0 (control), as determined by repeated measures one-way ANOVA followed by Dunnett’s test
Journal of Comparative Physiology B
1 3
Series 5—effects of pH 8.0 exposure and recovery on blood acid–base status and plasma ammonia and glucose concentrations in large Tambaqui
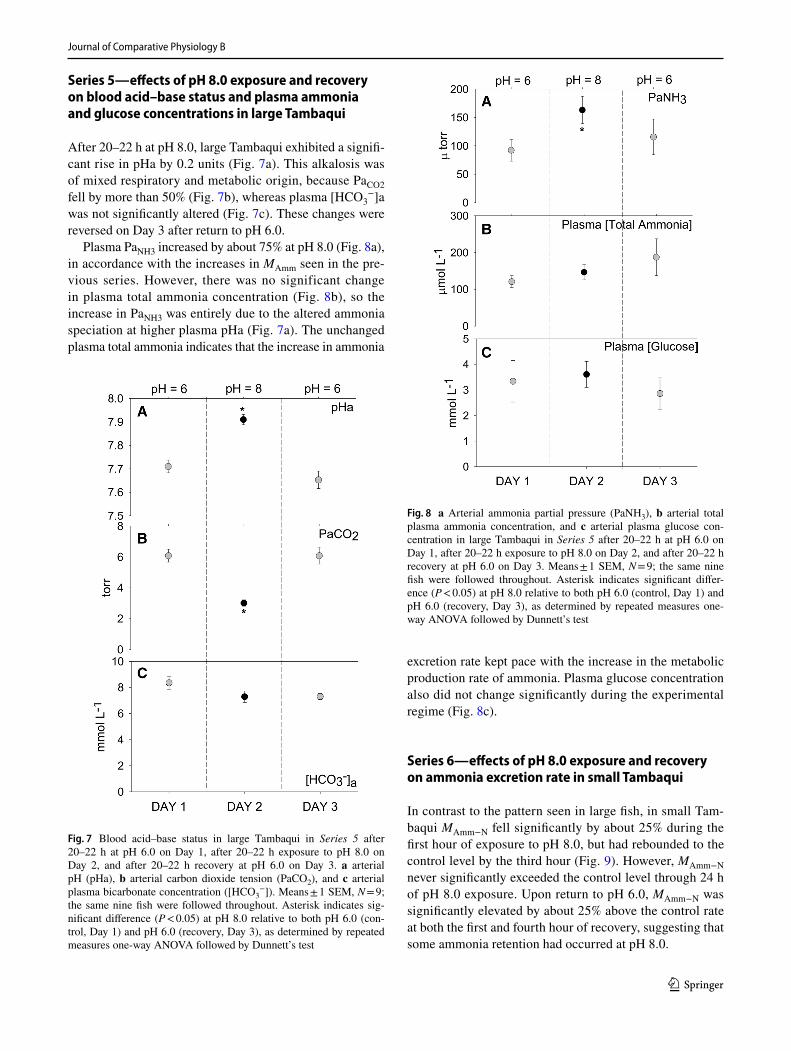
After 20–22 h at pH 8.0, large Tambaqui exhibited a signifi-cant rise in pHa by 0.2 units (Fig. 7a). This alkalosis was of mixed respiratory and metabolic origin, because PaCO2 fell by more than 50% (Fig. 7b), whereas plasma [HCO3
−]a was not significantly altered (Fig. 7c). These changes were reversed on Day 3 after return to pH 6.0.
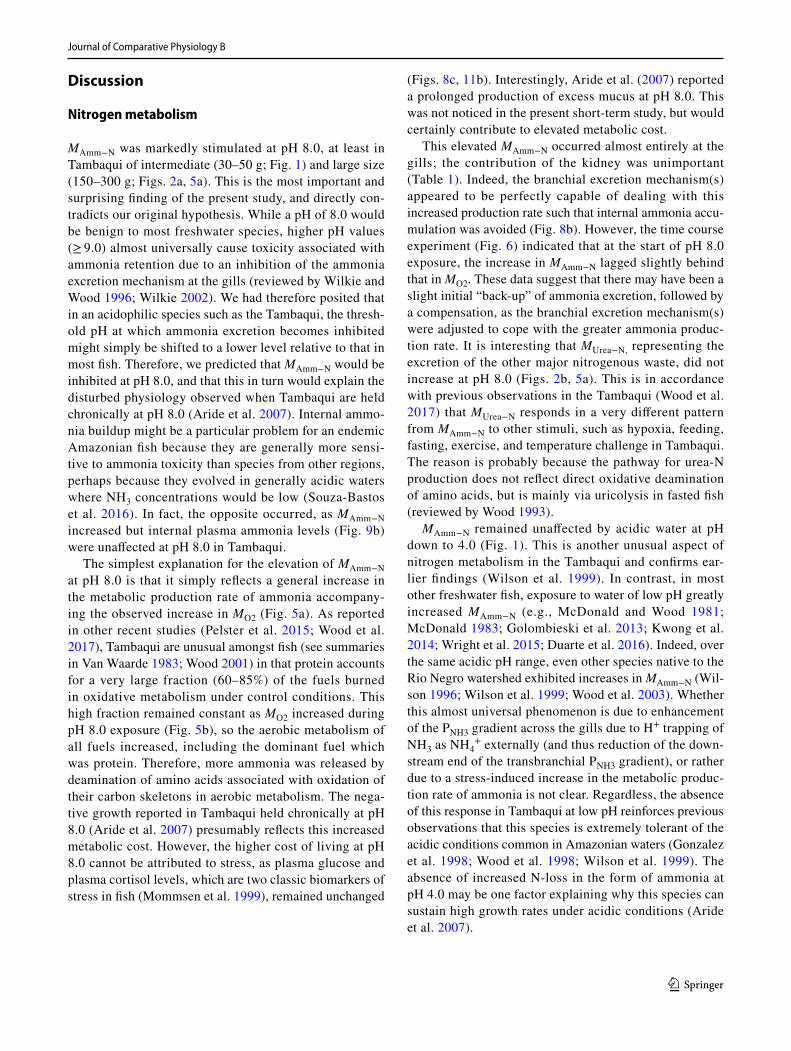
Plasma PaNH3 increased by about 75% at pH 8.0 (Fig. 8a), in accordance with the increases in MAmm seen in the pre-vious series. However, there was no significant change in plasma total ammonia concentration (Fig. 8b), so the increase in PaNH3 was entirely due to the altered ammonia speciation at higher plasma pHa (Fig. 7a). The unchanged plasma total ammonia indicates that the increase in ammonia
excretion rate kept pace with the increase in the metabolic production rate of ammonia. Plasma glucose concentration also did not change significantly during the experimental regime (Fig. 8c).
Series 6—effects of pH 8.0 exposure and recovery on ammonia excretion rate in small Tambaqui
In contrast to the pattern seen in large fish, in small Tam-baqui MAmm−N fell significantly by about 25% during the first hour of exposure to pH 8.0, but had rebounded to the control level by the third hour (Fig. 9). However, MAmm−N never significantly exceeded the control level through 24 h of pH 8.0 exposure. Upon return to pH 6.0, MAmm−N was significantly elevated by about 25% above the control rate at both the first and fourth hour of recovery, suggesting that some ammonia retention had occurred at pH 8.0.
Fig. 7 Blood acid–base status in large Tambaqui in Series 5 after 20–22 h at pH 6.0 on Day 1, after 20–22 h exposure to pH 8.0 on Day 2, and after 20–22 h recovery at pH 6.0 on Day 3. a arterial pH (pHa), b arterial carbon dioxide tension (PaCO2), and c arterial plasma bicarbonate concentration ([HCO3
−]). Means ± 1 SEM, N = 9; the same nine fish were followed throughout. Asterisk indicates sig-nificant difference (P < 0.05) at pH 8.0 relative to both pH 6.0 (con-trol, Day 1) and pH 6.0 (recovery, Day 3), as determined by repeated measures one-way ANOVA followed by Dunnett’s test
Fig. 8 a Arterial ammonia partial pressure (PaNH3), b arterial total plasma ammonia concentration, and c arterial plasma glucose con-centration in large Tambaqui in Series 5 after 20–22 h at pH 6.0 on Day 1, after 20–22 h exposure to pH 8.0 on Day 2, and after 20–22 h recovery at pH 6.0 on Day 3. Means ± 1 SEM, N = 9; the same nine fish were followed throughout. Asterisk indicates significant differ-ence (P < 0.05) at pH 8.0 relative to both pH 6.0 (control, Day 1) and pH 6.0 (recovery, Day 3), as determined by repeated measures one-way ANOVA followed by Dunnett’s test

Journal of Comparative Physiology B
1 3
Series 7—effects of pH 8.0 exposure on oxygen consumption in small Tambaqui
The pattern of MO2 response was another size-related dif-ference. Rather than increasing as in large fish, MO2 fell sig-nificantly by about 20% at both 1 and 24 h of exposure to pH 8.0 (Fig. 10).
Series 8—effects of pH 8.0 exposure on gill enzymes and plasma cortisol: a comparison of small versus large Tambaqui
The goal of these measurements was to elucidate possible physiological reasons for the different response patterns of large versus small Tambaqui at pH 8.0. There were no sig-nificant differences in gill Na+, K+ATPase activities either
as a function of fish size or pH exposure (data not shown). Values averaged about 0.5 μmol ATP mg protein−1 h−1. In contrast, branchial vH+ATPase activity at pH 6.0 was about 40% higher in small fish than in large fish, a signifi-cant difference (Fig. 11a). Furthermore, after 24 h expo-sure to pH 8.0, vH+ATPase activity fell significantly in small Tambaqui, whereas it remained unchanged in large Tambaqui, such that the values were similar in the two treatment groups at high pH. Plasma cortisol concentra-tions were 35% lower in small fish than in large fish at pH 6.0, a significant difference which became even greater (65% lower) after 24 h at pH 8.0 (Fig. 11b). This occurred because plasma cortisol concentration dropped signifi-cantly by about half in small fish yet remained unchanged in large fish at pH 8.0.
0h 1h 3h 6h 12h 24h 2 3-3000
-2500
-2000
-1500
-1000
-500
0
1H111h 4h
*
**
gklomµ
-1h-
1
MAmm-N
pH =6pH =8
Fig. 9 Ammonia excretion rates (MAmm−N) in Tambaqui of small size in Series 6 at pH 6.0 (control), at various times during 24 h exposure to pH 8.0, and at 1 and 4 h of recovery at pH 6.0 Means ± 1 SEM, N = 8; the same eight fish were followed throughout. Asterisk indi-cates significant difference (P < 0.05) relative to pH 6.0 (control, at 0 h), as determined by one-way ANOVA followed by Dunnett’s test
Fig. 10 Routine oxygen consumption rates (MO2) in Tambaqui of small size in Series 7 at pH 6.0 (control), and after 1 and 24 h expo-sure to pH 8.0. Means ± 1 SEM, N = 8; the same eight fish were fol-lowed throughout. Asterisk indicates significant difference (P < 0.05) relative to pH 6.0 (control), as determined by one-way ANOVA fol-lowed by Dunnett’s test
pH 6 pH 8
(lositroca
msalP
µLd
g1-)
0
5
10
15
20
25
H+
(esa
PTA-
µnietorp
gm
PTAlo
m1-
h1-)
0.0
0.5
1.0
1.5
2.0
2.5
3.0
3.5
Small-pH 6Small-pH 8
Large-pH 6Large-pH 8
A
B
Aa
B
b
A
Ba
a
b
b
BBb
Ab
A
Fig. 11 A comparison of a branchial vH+ATPase activities and b plasma cortisol concentrations after 24 h exposure to either pH 6.0 (control) or pH 8.0 in small versus large Tambaqui of Series 8. Means ± 1 SEM, N = 6 in each treatment group. Letters indicate sig-nificant differences. Statistical analysis by two-way ANOVA (water pH, size) followed by Tukey’s test. Means with different lower case letters are significantly different (P < 0.05) between sizes within a pH. Means with different upper case letters are significantly different (P < 0.05) between pH values within a size class
Journal of Comparative Physiology B
1 3
Discussion
Nitrogen metabolism
MAmm−N was markedly stimulated at pH 8.0, at least in Tambaqui of intermediate (30–50 g; Fig. 1) and large size (150–300 g; Figs. 2a, 5a). This is the most important and surprising finding of the present study, and directly con-tradicts our original hypothesis. While a pH of 8.0 would be benign to most freshwater species, higher pH values (≥ 9.0) almost universally cause toxicity associated with ammonia retention due to an inhibition of the ammonia excretion mechanism at the gills (reviewed by Wilkie and Wood 1996; Wilkie 2002). We had therefore posited that in an acidophilic species such as the Tambaqui, the thresh-old pH at which ammonia excretion becomes inhibited might simply be shifted to a lower level relative to that in most fish. Therefore, we predicted that MAmm−N would be inhibited at pH 8.0, and that this in turn would explain the disturbed physiology observed when Tambaqui are held chronically at pH 8.0 (Aride et al. 2007). Internal ammo-nia buildup might be a particular problem for an endemic Amazonian fish because they are generally more sensi-tive to ammonia toxicity than species from other regions, perhaps because they evolved in generally acidic waters where NH3 concentrations would be low (Souza-Bastos et al. 2016). In fact, the opposite occurred, as MAmm−N increased but internal plasma ammonia levels (Fig. 9b) were unaffected at pH 8.0 in Tambaqui.
The simplest explanation for the elevation of MAmm−N at pH 8.0 is that it simply reflects a general increase in the metabolic production rate of ammonia accompany-ing the observed increase in MO2 (Fig. 5a). As reported in other recent studies (Pelster et al. 2015; Wood et al. 2017), Tambaqui are unusual amongst fish (see summaries in Van Waarde 1983; Wood 2001) in that protein accounts for a very large fraction (60–85%) of the fuels burned in oxidative metabolism under control conditions. This high fraction remained constant as MO2 increased during pH 8.0 exposure (Fig. 5b), so the aerobic metabolism of all fuels increased, including the dominant fuel which was protein. Therefore, more ammonia was released by deamination of amino acids associated with oxidation of their carbon skeletons in aerobic metabolism. The nega-tive growth reported in Tambaqui held chronically at pH 8.0 (Aride et al. 2007) presumably reflects this increased metabolic cost. However, the higher cost of living at pH 8.0 cannot be attributed to stress, as plasma glucose and plasma cortisol levels, which are two classic biomarkers of stress in fish (Mommsen et al. 1999), remained unchanged
(Figs. 8c, 11b). Interestingly, Aride et al. (2007) reported a prolonged production of excess mucus at pH 8.0. This was not noticed in the present short-term study, but would certainly contribute to elevated metabolic cost.
This elevated MAmm−N occurred almost entirely at the gills; the contribution of the kidney was unimportant (Table 1). Indeed, the branchial excretion mechanism(s) appeared to be perfectly capable of dealing with this increased production rate such that internal ammonia accu-mulation was avoided (Fig. 8b). However, the time course experiment (Fig. 6) indicated that at the start of pH 8.0 exposure, the increase in MAmm−N lagged slightly behind that in MO2. These data suggest that there may have been a slight initial “back-up” of ammonia excretion, followed by a compensation, as the branchial excretion mechanism(s) were adjusted to cope with the greater ammonia produc-tion rate. It is interesting that MUrea−N, representing the excretion of the other major nitrogenous waste, did not increase at pH 8.0 (Figs. 2b, 5a). This is in accordance with previous observations in the Tambaqui (Wood et al. 2017) that MUrea−N responds in a very different pattern from MAmm−N to other stimuli, such as hypoxia, feeding, fasting, exercise, and temperature challenge in Tambaqui. The reason is probably because the pathway for urea-N production does not reflect direct oxidative deamination of amino acids, but is mainly via uricolysis in fasted fish (reviewed by Wood 1993).
MAmm−N remained unaffected by acidic water at pH down to 4.0 (Fig. 1). This is another unusual aspect of nitrogen metabolism in the Tambaqui and confirms ear-lier findings (Wilson et al. 1999). In contrast, in most other freshwater fish, exposure to water of low pH greatly increased MAmm−N (e.g., McDonald and Wood 1981; McDonald 1983; Golombieski et al. 2013; Kwong et al. 2014; Wright et al. 2015; Duarte et al. 2016). Indeed, over the same acidic pH range, even other species native to the Rio Negro watershed exhibited increases in MAmm−N (Wil-son 1996; Wilson et al. 1999; Wood et al. 2003). Whether this almost universal phenomenon is due to enhancement of the PNH3 gradient across the gills due to H+ trapping of NH3 as NH4
+ externally (and thus reduction of the down-stream end of the transbranchial PNH3 gradient), or rather due to a stress-induced increase in the metabolic produc-tion rate of ammonia is not clear. Regardless, the absence of this response in Tambaqui at low pH reinforces previous observations that this species is extremely tolerant of the acidic conditions common in Amazonian waters (Gonzalez et al. 1998; Wood et al. 1998; Wilson et al. 1999). The absence of increased N-loss in the form of ammonia at pH 4.0 may be one factor explaining why this species can sustain high growth rates under acidic conditions (Aride et al. 2007).

Journal of Comparative Physiology B
1 3
The mechanism of branchial ammonia excretion in Tambaqui
The paradoxical effects of water pH on ammonia excretion rate in Tambaqui (Fig. 1) reinforce the conclusion that the mechanism(s) of MAmm−N in acidophilic Amazonian fishes are both unusual and poorly understood (Wilson 1996; Wood et al. 1998, 2014, 2017; Gonzalez et al. 2005). Indeed, the mechanism(s) of Na+ uptake in these and other Amazonian species have been investigated in somewhat greater detail than ammonia excretion, and again the general conclusion has been that they also do not conform to standard models (e.g., Wilson 1996; Gonzalez et al. 1997, 2002, 2005; Gon-zalez and Preest 1999; Gonzalez and Wilson 2001; Preest et al. 2005; Matsuo et al. 2005; Matsuo and Val 2007; Duarte et al. 2013, 2016; Wood et al. 2014).
An Rh protein-based model, the “Na+/NH4+ exchange
complex” (Wright and Wood 2009; Tsui et al. 2009; Weihrauch et al. 2009; Ito et al. 2013) is now gaining gen-eral acceptance as a mechanism for loose coupling of Na+ uptake and ammonia excretion in most other freshwater fish. Indeed, this mechanism seems to become particularly promi-nent in several non-Amazonian species (Osorezan dace—Hirata et al. 2003; zebrafish—Kumai and Perry 2011; Shih et al. 2012; larval medaka—Lin et al. 2012) when exposed to water similar to the native waters of the Tambaqui, i.e., low in pH and/or in Na+ concentration. In brief, this concept comprises several apical membrane transporters (Rhcg, vH+-ATPase, Na+/H+ exchanger, Na+-permeable apical channel, carbonic anhydrase) working together as a metabolon. The theory (reviewed by Wright and Wood 2012; Kwong et al. 2014) envisages that H+ ions are removed from NH4
+ as NH3 enters the inner gates of the apical Rhcg chan-nels, and these drive Na+ uptake via Na+/H+ exchangers and/or Na+ channels/vH+-ATPase complexes while at the same time, the NH3 molecules leaving the outer gates of the Rh channels trap H+ ions externally and are converted to NH4
+ (“diffusion trapping”), thereby sustaining the gradi-ent for NH3 movement through the channels. Hydration of CO2 by carbonic anhydrase augments the supply of protons. Therefore, MAmm−N should depend on external H+ availabil-ity, being stimulated by low water pH and inhibited by high water pH, neither of which were seen in Tambaqui (Fig. 1). Furthermore, net Na+ fluxes (JNa; Fig. 4a) were also not in accordance with this model, as discussed in the subsequent section. Similarly, in the Amazonian cardinal tetra, patterns of MAmm−N and Na+ exchange did not fit the “Na+/NH4
+ exchange metabolon” model (Wood et al. 2014). The conclu-sion of that study was that while the apical mechanisms were unclear, ammonia excretion did not depend on Na+ uptake, and involved active basolateral NH4
+ transport which was responsive to substrate supply, with NH4
+ substituting for K+ on basolateral Na+, K+-ATPase. The latter had been
originally suggested by Randall et al. (1996) as a probable mechanism in acidophilic Amazonian fish; the “pumping” of NH4
+ into the branchial cells would supply H+ ions for apical acid excretion. If this were the case in Tambaqui, it might explain the absence of the expected stimulatory effect of low water pH and the observed stimulatory effect of high water pH on MAmm−N where metabolic ammonia produc-tion increased. In future studies on Tambaqui, it will be use-ful to test whether NH4
+ can substitute for K+ in activating branchial Na+, K+-ATPase activity, to measure unidirec-tional Na+ fluxes, MAmm−N, and net acidic equivalent flux (JH) simultaneously across a range of water pH values and Na+ concentrations, and to apply a variety of pharmacologi-cal inhibitors known to disrupt the Na+-ammonia coupling mechanisms in other species (e.g., Preest et al. 2005; Tsui et al. 2009).
Ion and acid–base fluxes
At pH 8.0, large Tambaqui increased the rates of both ammonia excretion (MAmm−N) and net acidic equivalent excretion (JH) (Fig. 3). Thus, they were excreting acid or taking up base from the water. If the “Na+/NH4
+ exchange metabolon” model (Wright and Wood 2009; Tsui et al. 2009; Weihrauch et al. 2009; Ito et al. 2013) described above were to apply, then an increase in Na+ uptake coupled to elevated excretion of ammonia and acidic equivalents would have been expected. However, contrary to this idea, the net flux of Na+ (JNa) did not change (Fig. 4a), and this was in accord-ance with unchanged activities of gill Na+, K+ATPase and vH+ATPase (Fig. 11a). In contrast, the net flux of Cl− (JCl) became highly negative (Fig. 4c). The net change in JCl almost exactly balanced the net change in JH, both being about − 400 uequiv kg−1 h−1, implicating a disturbance of Cl− versus base exchange rather than Na+ versus acid exchange. This pattern was very different from that observed in rainbow trout exposed to very high pH (9.5), where both JNa and JCl became highly negative but approximately equal (Wilkie et al. 1999).
Very little is known about Cl− uptake mechanisms in acidophilic Amazonian teleosts (Gonzalez et al. 2005). However, current models for other freshwater fish assume the presence of an apical Cl−/HCO3
− exchange mechanism (e.g., Kirschner 2004; Tresguerres et al. 2006; Evans 2011), and one study has indicated its presence in the Amazonian neon tetra (Preest et al. 2005). The present results therefore suggest that exposure to high pH was associated with an inhibition or reversal of apical Cl−/HCO3
− exchange in the Tambaqui. The measured titration alkalinity of the water increased from about 140 μM at pH 6.0 to 500–600 μM at pH 8.0, relative to water Cl− concentrations < 100 μM. Thus, at pH 8.0, the electrochemical gradients across the apical membranes of gill cells may have been reversed, leading to

Journal of Comparative Physiology B
1 3
negative JCl and JH. Similar to the situation for Na+ balance, measurements of unidirectional Cl− fluxes and pharmaco-logical intervention will be required to test this idea. Regard-less, elevated base uptake or acid excretion was clearly an inappropriate response at pH 8.0, and would explain the part of the observed blood acid–base disturbance attributed to metabolic alkalosis (Fig. 7). It remains unknown whether these disturbances would persist or be corrected during chronic exposure to pH 8.0. Aride et al. (2007) reported that plasma Na+ levels remained unchanged in Tambaqui chroni-cally exposed to pH 8.0, but unfortunately did not measure acid–base or Cl− status.
Blood acid–base status
PaCO2 was about 6 torr in Tambaqui under control conditions at pH 6.0 (Fig. 7b), approximately twofold greater than in most other freshwater fish (Dejours 1975; Cameron 1978). This high resting PaCO2 in Tambaqui was also reported in an earlier study, correlated with a very low PaO2; both were thought to be caused by a low gill diffusing capacity (Wood et al. 1998). The substantial rise in pHa (Fig. 7a) and asso-ciated fall in PaCO2 (Fig. 7b) seen at pH 8.0 in Tambaqui has been reported previously in trout exposed to higher water pH (e.g., Wilkie and Wood 1991; Wilkie et al. 1994, 1996; McGeer and Eddy 1998). The reason for this respira-tory alkalosis is that high pH water essentially serves as a “vacuum” for CO2, because of diffusion trapping of CO2 as HCO3
− by external hydroxyl ions, as first pointed out by Johansen et al. (1975). However, a difference in the Tam-baqui is that plasma HCO3
− concentration did not fall, but rather remained stable. This reflected an additional com-ponent of metabolic alkalosis, likely due to the negative JH observed at high pH (Fig. 3). It would be interesting to test whether blood acid–base disruption persisted indefinitely in Tambaqui; in trout, disturbances in blood acid–base sta-tus were not corrected during chronic high pH exposure (Wilkie et al. 1996; McGeer and Eddy 1998). Another topic for future exploration is whether bulk water PCO2 was tran-siently at disequilibrium after water pH was raised by KOH addition (which might lower PCO2 below atmospheric levels) or lowered by HNO3 addition (which might raise PCO2 above atmospheric levels), and the effects that these disequilibrium conditions might have on the physiology of the fish.
The different responses to pH 8.0 in small Tambaqui
Very small Tambaqui (4–15 g) appeared to respond to pH 8.0 exposure in a fundamentally different manner than their larger conspecifics. In essence, their metabolic costs actu-ally declined (Fig. 10) and there was no increase in MAmm−N (Fig. 9). Nevertheless, there was a transient inhibition of MAmm−N upon initial exposure, and an elevation after return
to pH 6.0, suggesting that modest ammonia retention may have occurred. Two other notable differences were signifi-cant declines in branchial vH+ATPase activities (Fig. 11a) and plasma cortisol (Fig. 11b) after 24-h exposure to pH 8.0, neither of which were seen in large Tambaqui. The former can be interpreted as an adaptive response as it could prevent inappropriate excretion of acidic equivalents, and the latter suggests that stress levels actually declined at pH 8.0.
In the wild, Tambaqui occupy different niches at differ-ent life stages (Goulding and Carvalho 1982; Araujo-Lima and Golding 1997). Very small individuals are mainly car-nivorous and prey mainly on micro-invertebrates, whereas larger individuals are omnivorous, incorporating more fruits and seeds into their diet. Larger internal “alkaline tides” (Cooper and Wilson 2008; Bucking and Wood 2008) would be expected in carnivores. Very small individuals are also restricted to flood plains of the less acidic “white water” rivers, being particularly concentrated under floating mac-rophytes and in flooded forests, whereas larger individuals are found in the main rivers and undertake migrations to the more acidic “black water” rivers. Environmental condi-tions are likely different at the two sites, with higher and more variable water pH in the floodplains, the latter due to greater day-time photosynthesis (alkalinizing) and greater night-time respiration (acidifying) by plant material. Poten-tially, the physiology of very small Tambaqui is better at coping with alkaline conditions, and with both internal and external pH variability.
Relevance of the results for aquaculture
In light of the growth in aquacultural production of Tam-baqui (see “Introduction”), it is clear that water pH manage-ment is a critical issue (Aride et al. 2004). Fertilization of ponds is a common practice, with the goal of increasing the production of plankton for food, but this may lead to photo-synthetically driven surges in water pH which will damage the health of larger Tambaqui. It would seem judicious to maintain water pH at < 7.0 for larger Tambaqui, and even lower pH may be beneficial. This may not be a concern for very small size classes.
Acknowledgements Supported in Brazil by FAPEAM and CNPq through the INCT-ADAPTA grant to ALV, and a Science Without Borders Program grant to ALV and CMW (CNPq Process Number: 401303/2014-4), and in Canada by a Discovery grant to CMW from the Natural Sciences and Engineering Research Council of Canada (NSERC). CMW was supported by the Canada Research Chairs pro-gram and a visiting fellowship from the Science Without Borders Program (CNPq-Brazil). RJG was supported by a Faculty Research Grant and an International Opportunities Grant from the University of San Diego. MSF is the recipient of a Post-Doctoral Fellowship from the Brazilian Centre for Improvement of Higher Education Personnel (CAPES). SBM is the recipient of an MSc Fellowship from CAPES. ALV received a Research Fellowship from CNPq. We thank Mike

Journal of Comparative Physiology B
1 3
Wilkie for advice, and Bernd Pelster, Ora Johannsson, Ellen Jung, and Sunita Nadella for assistance, and four anonymous reviewers whose constructive comments improved the manuscript.
References
Albers C (1970) Acid–base balance. In: Hoar WS, Randall DJ (eds) Fish physiology, vol 4. Academic Press, San Diego, pp 173–208
Araujo-Lima C, Goulding M (1997) So fruitful a fish: ecology, con-servation, and aquaculture of the Amazon’s Tambaqui. Columbia University Press, New York
Aride PHR, Roubach R, Val AL (2004) Water pH in central Amazon and its importance for Tambaqui (Colossoma macropomum) cul-ture. World Aquac 35:24–28
Aride PHR, Roubach R, Val AL (2007) Tolerance response of Tam-baqui Colossoma macropomum (Cuvier) to water pH. Aquac Res 38:588–594
Boutilier RG, Heming TA, Iwama GK (1984) Appendix: physico-chemical parameters for use in fish respiratory physiology. In: Hoar WS, Randall DJ (eds) Fish physiology, vol 10A. Academic Press, Orlando, pp 403–430
Bradford MM (1976) A rapid and sensitive method for the quantita-tion of microgram quantities of protein utilizing the principle of protein-dye binding. Anal Biochem 72:248–254
Bucking C, Wood CM (2008) The alkaline tide and ammonia excretion after voluntary feeding in freshwater rainbow trout. J Exp Biol 211:2533–2541
Cameron JN (1978) Regulation of blood pH in teleost fish. Respir Physiol 33:129–144
Cameron JN, Heisler N (1983) Studies of ammonia in the rainbow trout: physico-chemical parameters, acid–base behaviour and res-piratory clearance. J Exp Biol 105:107–125
Chagas EC, Val AL (2006) Ascorbic acid reduces the effects of hypoxia on the Amazon fish Tambaqui. J Fish Biol 69:608–612
Cooper CA, Wilson RW (2008) Post-prandial alkaline tide in fresh-water rainbow trout: effects of meal anticipation on recovery from acid–base and ion regulatory disturbances. J Exp Biol 211:2542–2550
Da Silva Nunes JDR, Liu S, Pértille F, Perazza CA, Villela PMS, de Almeida-Val VMF, Hilsdorf AWS, Liu Z, Coutinho LL (2017) Large-scale SNP discovery and construction of a high-density genetic map of Colossoma macropomum through genotyping-by-sequencing. Sci Rep 7:46112. https://doi.org/10.1038/srep46112
Dejours P (1975) Principles of comparative respiratory physiology. North-Holland Publishing Company, Amsterdam
Duarte RM, Ferreira MS, Wood CM, Val AL (2013) Effect of low pH exposure on Na+ regulation in two cichlid fish species of the Amazon. Comp Biochem Physiol A 166:441–448
Duarte RM, Smith DS, Val AL, Wood CM (2016) Dissolved organic carbon from the upper Rio Negro protects zebrafish (Danio rerio) against ionoregulatory disturbances caused by low pH exposure. Sci Rep 6:20377. https://doi.org/10.1038/srep20377
Evans DH (2011) Freshwater fish gill ion transport: August Krogh to morpholinos and microprobes. Acta Physiol 202:349–359
Florindo LH, Leite CA, Kalinin AL, Reid SG, Milsom WK, Rantin FT (2006) The role of branchial and orobranchial O2 chemoreceptors in the control of aquatic surface respiration in the neotropical fish Tambaqui (Colossoma macropomum): progressive responses to prolonged hypoxia. J Exp Biol 209:1709–1715
Golombieski JI, Koakoski G, Becker AJ, Almeida APG, Toni C, Finamor IA, Pavanato MA, de Almeida TM, Baldisserotto B (2013) Nitrogenous and phosphorus excretions in juvenile silver catfish (Rhamdia quelen) exposed to different water hardness, humic acid, and pH levels. Fish Physiol Biochem 39:837–849
Gonzalez RJ, Preest M (1999) Ionoregulatory specializations for exceptional tolerance of ion-poor,acidic waters in the neon tetra (Paracheirodon innesi). Physiol Biochem Zool 72:156–163
Gonzalez RJ, Wilson RW (2001) Patterns of ion regulation in aci-dophilic fish native to the ion-poor, acidic Rio Negro. J Fish Biol 58:1680–1690
Gonzalez RJ, Dalton VM, Patrick ML (1997) Ion regulation in ion-poor, acidic water by the blackskirt tetra (Gymnocorym-bus ternetzi), a fish native to the Amazon River. Physiol Zool 70:428–435
Gonzalez RJ, Wood CM, Wilson RW, Patrick ML, Bergman HL, Narahara A, Val AL (1998) Effects of water pH and Ca2+ con-centration on ion balance in fish of the Rio Negro. Physiol Zool 71:15–22
Gonzalez RJ, Wilson RW, Wood CM, Patrick ML, Val AL (2002) Diverse strategies for ion regulation in fish collected from the ion-poor, acidic Rio Negro. Physiol Biochem Zool 75:37–47
Gonzalez RJ, Wilson RW, Wood CM (2005) Ionoregulation in tropi-cal fish from ion-poor, acidic blackwaters. In: Val AL, Almeida-Val VMF, Randall DJ (eds) The physiology of tropical fish. Fish physiology, vol 22. Academic Press, San Diego, pp 397–437
Goulding M, Carvalho ML (1982) Life history and management of the Tambaqui (Colossoma macropomum, Characidae): an important Amazonian food fish. Rev Bras Zool 1:107–133
Hills AG (1973) Acid–base balance-chemistry, physiology, pathophysi-ology. Williams and Wilkins, Baltimore
Hirata T, Kaneko T, Ono T, Nakazato T, Furukawa N, Hasegawa S, Wakabayashi S, Shigekawa M, Chang MH, Romero MF, Hirose S (2003) Mechanism of acid adaptation of a fish living in a pH 3.5 lake. Am J Physiol 284:R1199–R1212
Ito Y, Kobayashi S, Nakamura N, Esaki M, Miyagi H, Hoshijima K, Hirose S (2013) Close association of carbonic anhydrase (CA2a & CA15a), Na+/H+ exchanger (Nhe3b), and ammonia transporter Rhcg1 in zebrafish ionocytes responsible for Na+ uptake. Front Physiol 4:59. https://doi.org/10.3389/fphys.2013.00059
Johansen K, Maloiy GMO, Lykkeboe G (1975) A fish in extreme alka-linity. Respir Physiol 24:159–162
Kirschner LB (2004) The mechanism of sodium chloride uptake in hyperregulating aquatic animals. J Exp Biol 207:1439–1452
Kültz D, Somero GN (1995) Osmotic and thermal effects on in situ ATPase activity in permeabilized gill epithelial cells of the fish Gillichthys mirabilis. J Exp Biol 198:1883–1894
Kumai Y, Perry SF (2011) Ammonia excretion via Rhcg1 facilitates Na+ uptake in larval zebrafish, Danio rerio, in acidic water. Am J Physiol 301:R1517–R1528
Kwong RWM, Kumai Y, Perry SF (2014) The physiology of fish at low pH: the zebrafish as a model system. J Exp Biol 217:651–662
Lauff RF, Wood CM (1996) Respiratory gas exchange, nitrogenous waste excretion and fuel usage during aerobic swimming in juve-nile rainbow trout. J Comp Physiol B 166:501–509
Lawrence MJ, Wright PA, Wood CM (2015) Physiological and molecu-lar responses of the goldfish kidney (Carassius auratus) to meta-bolic acidosis, and potential mechanisms of renal ammonia trans-port. J Exp Biol 218:2124–2135
Lin CC, Lin LY, Hsu HH, Thermes V, Prunet P, Horng JL, Hwang PP (2012) Acid secretion by mitochondrion-rich cells of medaka (Oryzias latipes) acclimated to acidic freshwater. Am J Physiol Regul Integr Comp Physiol 302:R283–R291
Matsuo AYO, Val AL (2007) Acclimation to humic substances prevents whole body sodium loss and stimulates branchial calcium uptake capacity in the cardinal tetras, Paracheirodon axelrodi (Schultz) subjected to extremely low pH. J Fish Biol 70:989–1000
Matsuo AYO, Wood CM, Val AL (2005) Effects of copper and cad-mium on ion transport and gill metal binding in the Amazonian teleost Tambaqui (Colossoma macropomum) in extremely soft water. Aquat Toxicol 74:351–364

Journal of Comparative Physiology B
1 3
McDonald DG (1983) The interaction of environmental calcium and low pH on the physiology of the rainbow trout, Salmo gaird-neri: I. Branchial and renal net ion and H+ fluxes. J Exp Biol 102:123–140
McDonald DG, Wood CM (1981) Branchial and renal acid and ion fluxes in the rainbow trout, Salmo gairdneri, at low environmental pH. J Exp Biol 93:101–118
McGeer JC, Eddy FB (1998) Ionic regulation and nitrogenous excretion in rainbow trout exposed to buffered and unbuffered freshwater of pH 10.5. Physiol Zool 71:179–190
Mommsen TP, Vijayan MM, Moon TW (1999) Cortisol in teleosts: dynamics, mechanisms of action, and metabolic regulation. Rev Fish Biol Fish 9:211–268
Moss BR (2009) Ecology of fresh waters: man and medium, past to future. Wiley, London
Pelster B, Wood CM, Speers-Roesch B, Driedzic WR, Almeida-Val V, Val AL (2015) Gut transport characteristics in herbivorous and carnivorous serrasalmid fish from ion poor Rio Negro water. J Comp Physiol B 185:225–241
Prado-Lima M, Val AL (2016) Transcriptomic characterization of Tam-baqui (Colossoma macropomum Cuvier, 1818) exposed to three climate change scenarios. PLoS One. https://doi.org/10.1371/journal.pone.0152366
Preest MR, Gonzalez RJ, Wilson RW (2005) A pharmacological exam-ination of Na+ and Cl– transport in two species of freshwater fish. Physiol Biochem Zool 78:259–272
Rahmatullah M, Boyde TR (1980) Improvements in the determina-tion of urea using diacetyl monoxime: methods with and without deproteinization. Clin Chem Acta 107:3–9
Randall DJ, Brauner C, Wilson J (1996) Acid excretion in Amazonian fish. In: Val AL, Almeida-Val VMF, Randall DJ (eds) Physiology and biochemistry of the fishes of the Amazon. INPA, Manaus, pp 91–100
Robertson LM, Val AL, Almeida-Val VF, Wood CM (2015) Ionoregu-latory aspects of the osmorespiratory compromise during acute environmental hypoxia in 12 tropical and temperate teleosts. Physiol Biochem Zool 88:357–370
Saint-Paul U (1984) Physiological adaptation to hypoxia of a neotropi-cal characoid fish Colossoma macropomum, Serrasalmidae. Envi-ron Biol Fish 11:53–62
Severinghaus JW, Stupfel M, Bradley AF (1956) Variations of serum carbonic acid pK1 with pH and temperature. J Appl Physiol 9:197–200
Shih T-H, Horng J-L, Liu ST, Hwang P-P, Lin Y-H (2012) Rhcg1 and NHE3b are involved in ammonium-dependent sodium uptake by zebrafish larvae acclimated to low-sodium water. Am J Physiol 302:R84–R93
Souza-Bastos LR, Val AL, Wood CM (2016) Are Amazonian fish more sensitive to ammonia? Toxicity of ammonia to eleven native spe-cies. Hydrobiologia. https://doi.org/10.1007/s10750-0pp1-13
Tresguerres M, Katoh F, Orr E, Parks SK, Goss GG (2006) Chloride uptake and base secretion in freshwater fish: a transepithelial ion-transport metabolon? Physiol Biochem Zool 79:981–996
Tsui TKN, Hung CYC, Nawata M, Wilson JM, Wright PA, Wood CM (2009) Ammonia transport in cultured gill epithelium of fresh-water rainbow trout: the importance of Rhesus glycoproteins and the presence of an apical Na+/NH4
+ exchange complex. J Exp Biol 212:878–898
Val AL, Almeida-Val VMF (1995) Fishes of the Amazon and their environment. Physiological and biochemical features. Springer, Berlin
Van Waarde A (1983) Aerobic and anaerobic ammonia production by fish. Comp Biochem Physiol 74B:675–684
Van den Thillart G, Kesbeke F (1978) Anaerobic production of carbon dioxide and ammonia by goldfish Carassius auratus (L.). Comp Biochem Physiol 59A:393–400
Verdouw H, van Echted CJA, Dekkers EMJ (1978) Ammonia deter-mination based on indophenol formation with sodium salicylate. Water Res 12:399–402
Weihrauch D, Wilkie MP, Walsh PJ (2009) Ammonia and urea transporters in gills of fish and aquatic crustaceans. J Exp Biol 212:1716–1730
Wilkie MP (2002) Ammonia excretion and urea handling by fish gills: present understanding and future research challenges. J Exp Zool 293:284–301
Wilkie MP, Wood CM (1991) Nitrogenous waste excretion, acid–base regulation, and ionoregulation in rainbow trout (Onchorhyn-chus mykiss) exposed to extremely alkaline water. Physiol Zool 64:1069–1086
Wilkie MP, Wood CM (1996) The adaptations of fish to extremely alkaline environments. Comp Biochem Physiol 113B:665–673
Wilkie MP, Wright PA, Iwama GK, Wood CM (1994) The physiologi-cal adaptations of the Lahontan cutthroat trout (Oncorhynchus clarki henshawi) following transfer from well water to the highly alkaline waters of Pyramid Lake, Nevada (pH 9.4). Physiol Zool 67:355–380
Wilkie MP, Simmons HE, Wood CM (1996) Physiological adapta-tions to chronically elevated water pH (pH = 9.5) in rainbow trout (Oncorhynchus mykiss). J Exp Zool 274:1–14
Wilkie MP, Laurent P, Wood CM (1999) The physiological basis for altered Na+ and Cl– movements across the gills of rainbow trout (Oncorhynchus mykiss) in alkaline (pH = 9.5) water. Physiol Bio-chem Zool 72:360–368
Wilson RW (1996) Ammonia excretion in fish adapted to an ion-poor environment. In: Val AL, Almeida-Val VMF, Randall DJ (eds) Physiology and biochemistry of the fishes of the Amazon. INPA, Manaus, pp 123–138
Wilson RW, Wood CM, Gonzalez RJ, Patrick M, Bergman HL, Nara-hara A, Val AL (1999) Net ion fluxes during gradual acidification of extremely softwater in three species of Amazonian fish. Physiol Biochem Zool 72:277–285
Wolf K (1963) Physiological salines for fresh-water teleosts. Progress Fish Cultur 25:135–140
Wood CM (1993) Ammonia and urea metabolism and excretion. In: Evans D (ed) The physiology of fishes. CRC Press, Boca Raton, pp 379–425
Wood CM (2001) The influence of feeding, exercise, and temperature on nitrogen metabolism and excretion. In: Anderson PA, Wright PA (eds) Fish physiology, vol 20. Academic Press, Orlando, pp 201–238
Wood CM, Patrick ML (1994) Methods for assessing kidney and uri-nary bladder function in fish. In: Hochachka PW, Mommsen TP (eds) Biochemistry and molecular biology of fishes, vol 3. Else-vier, New York, pp 127–143
Wood CM, Wilson RW, Gonzalez RJ, Patrick ML, Bergman HL, Nara-hara A, Val AL (1998) Responses of an Amazonian teleost, the Tambaqui (Colossoma macropomum) to low pH in extremely soft water. Physiol Zool 71:658–670
Wood CM, Milligan LM, Walsh PJ (1999) Renal responses of trout to chronic respiratory and metabolic acidosis and metabolic alkalo-sis. Am J Physiol 277:R482–R492
Wood CM, Matsuo AYO, Wilson RW, Gonzalez RJ, Patrick ML, Playle RC, Val AL (2003) Protection by blackwater against disturbances in ion fluxes caused by low pH exposure in freshwater stingrays endemic to the Rio Negro. Physiol Biochem Zool 76:12–27
Wood CM, Robertson LM, Johannsson OE, Val AL (2014) Mecha-nisms of Na+ uptake, ammonia excretion, and their potential linkage in native Rio Negro tetras (Paracheirodon axelrodi, Hemigrammus rhodostomus, and Moenkhausia diktyota). J Comp Physiol B 184:877–890
Wood CM, de Souza Netto JG, Wilson JM, Duarte, RM, Val AL (2017) Nitrogen metabolism in Tambaqui (Colossoma macropomum), a

Journal of Comparative Physiology B
1 3
neotropical model teleost: hypoxia, temperature, exercise, feed-ing, fasting, and high environmental ammonia. J Comp Physiol B 186:431–445
Wright PA, Wood CM (1985) An analysis of branchial ammonia excre-tion in the freshwater rainbow trout: effects of environmental pH change and sodium uptake blockade. J Exp Biol 114:329–353
Wright PA, Wood CM (2009) A new paradigm for ammonia excretion in aquatic animals: role of Rhesus (Rh) glycoproteins. J Exp Biol 212:2303–2312
Wright PA, Wood CM (2012) Seven things fish know about ammonia and we do not. Respir Physiol Neurobiol 184:231–240
Wright PA, Iwama GK, Wood CM (1993) Ammonia and urea excre-tion in Lahontan cutthroat trout (Oncorhynchus clarki henshawi)
adapted to highly alkaline Pyramid Lake (pH 9.4). J Exp Biol 175:153–172
Wright PA, Wood CM, Wilson JM (2014) Rh vs pH: the role of Rhe-sus glycoproteins in renal ammonia excretion during metabolic acidosis in a freshwater teleost fish. J Exp Biol 217:2855–2865
Wright PA, Wood CM, Hiroi J, Wilson JM (2015) (Uncommon) mecha-nisms of branchial ammonia excretion in the common carp, Cypri-nus carpio, in response to environmentally induced metabolic acidosis. Physiol Biochem Zool 89:26–40
Zall DM, Fisher D, Garner MQ (1956) Photometric determination of chloride in water. Anal Chem 28:1665–1668
Affiliations
Chris M. Wood1,2,3,4 · R. J. Gonzalez5 · Márcio Soares Ferreira4 · Susana Braz‑Mota4 · Adalberto Luis Val4
R. J. Gonzalez [email protected]
Márcio Soares Ferreira [email protected]
Susana Braz-Mota [email protected]
Adalberto Luis Val [email protected]
1 Department of Zoology, University of British Columbia, Vancouver, BC V6T 1Z4, Canada
2 Department of Biology, McMaster University, Hamilton, ON, Canada
3 Rosenstiel School of Marine and Atmospheric Science, University of Miami, Florida, USA
4 Laboratory of Ecophysiology and Molecular Evolution, Brazilian National Institute for Research of the Amazon (INPA), Manaus, Amazonas, Brazil
5 Department of Biology, University of San Diego, San Diego, CA, USA