the physics of tank spillage
TRANSCRIPT

The Physics of Tank Spillage
Jack Devanney
Sisyphus Beach
Tavernier, Florida
DRAFT: 2010-05-21
www.c4tx.org/ctx/pub/hbl.tex

Copyright c© 2006, 2007 Jack Devanney
Permission is granted to copy, distribute and/or modify this document underthe terms of the Gnu Free Documentation License (GFDL), Version 1.2or any later version published by the Free Software Foundation; with noInvarient Sections, no Front-Cover Texts, and no Back-Cover Texts. A copyof the GFDL is available at www.gnu.org.
2

Contents
1 Preamble 2
2 Hydrostatic Balance 4
3 Marpol versus Pre-Marpol 10
4 Live Bottom Seal 13
5 Side Damage and Exchange Flow 18
6 Ballasting Down: the Tamano Spill 22
6.1 Ballast Down . . . . . . . . . . . . . . . . . . . . . . . . . . . 226.2 Do not discharge non-damaged tanks . . . . . . . . . . . . . . 22
7 The Right Response 26
1

1 Preamble
The physics of how a breached tank spills oil is an interesting subject on atleast four grounds:1
1. The results can be counter-intuitive and quite surprising in certaincases.
2. A tanker crew who truly understands the process can in many damagesituations significantly reduce or even eliminate spillage by properlylisting and trimming the ship. Conversely, a crew or responders whodo not have this understanding can materially increase the spillageby improper cargo and ballast transfers. This has happened far moreoften than it should. An example is the Tamano spill discussed inSection 6
3. Tanker designers need to understand how tanks lose oil in order todevelop ships with attractive spillage characteristics and avoid designswith poor spillage characteristics.
4. Regulators need to understand these physics in order to draft leg-islation which promotes ships with good spillage characteristics anddiscourages ships with poor spillage characteristics. In the past, poorunderstanding of tanker spillage has resulted in legislation that in-advertently promoted designs with very poor spillage behavior. TheMarpol single hulls are an obvious example.
Having said this, it is essential to recognize that what happens after a tank isbreached can have only the most marginal impact on overall tanker spillage.Low to medium impact groundings in which the ship survives produce lessthan 9% of all the oil spilled by tankers.[?] And low and medium impact col-lisions are responsible for less than 3% of total tanker spillage. Differences intank arrangement (pre-Marpol, Marpol, double side, double bottom, doublehull, etc) and crew response can affect only a fraction of these small per-centages. In general, in past tanker regulation, there has been far too muchfocus on attempting to reduce spillage after a grounding or collision hasalready occurred and much too little emphasis on preventing the ground-ing or collision in the first place. For example, far more spillage would beprevented by mandating twin screw than could ever be obtained by varioustank arrangement alternatives.
Moreover, by far the single most importance cause of tanker spill volumeand crew deaths is structural failure. And the most important cause ofstructural failure is segregated ballast tank corrosion.[?] Tanker designers
1 This paper is a modified version of Appendix C of The Tankship Tromedy for useon-board, in conjunction with CTX Mate. Automatic links to the CTX Tanker CasualtyDatabase have been eliminated, as well as the photographs. Comments on the tankerregulatory system have been largely eliminated. Section 6 has been entirely re-written toreflect the current status of CTX Mate. The sections on vacuum have not been included.The original is available at www.c4tx.org.
2

and tanker regulators must be careful to avoid increasing the probabilityof structural failure in an attempt to make a small reduction in spillage incertain groundings and collisions.
Still more basically, the central problem in tankers is not how tanks arearranged but a regulatory system in which the key regulator, the Classifica-tion Society, is beholden to the regulatee for his existence.
In short, the contents of this CTX Technical Paper are not
central to the core issues in tanker design and regulation.
Despite this, an enormous amount of effort, and even more hot air, hasbeen expended on analyzing the pros and cons of a particular tank arrange-ment on the amount of oil spilled after a grounding or collision has oc-curred. Much of this discussion has been ridiculously politicized. In thishighly charged debate, the simple, if sometimes surprising, physics of tankoil spillage has become obscured. Worse, an understanding of this processhas not filtered down to either tanker operators or spill responders, despitethe fact that that knowledge would do more to reduce spillage than all thepaper studies of various tanker designs.
This Technical Paper is aimed primarily at those operators and respon-ders. But it may also prove useful to tanker designers and regulators.
3

2 Hydrostatic Balance
In order to understand how a damaged tank spills oil, we need to understandhydrostatic balance. The physics is quite simple, even if the results aresometimes a little counter-intuitive.2 Hydrostatic balance can be understoodby any one who has balanced a large block of wood on a balance scale witha much smaller iron disk. It’s not the volume that counts; it’s the weight.
Crude oil is almost always less dense than water. An extremely densecrude oil such as Tia Juana Heavy from Venezuela has a specific gravity of0.93; that is, a liter or gallon of this liquid weighs 93% as much as a liter orgallon of fresh water. A very light crude oil such as Zuetina from Algeriahas a specific gravity of 0.80. A liter/gallon/whatever of this stuff weighs80% as much as the same volume of water. The great majority of crudeshave specific gravities which are between 0.82 and 0.87. Sea water has aspecific gravity of about 1.02. It is about 2% denser than fresh water thanksto the dissolved salts it contains. More importantly, for present purposes,sea water is about 20% heavier than a typical crude oil.
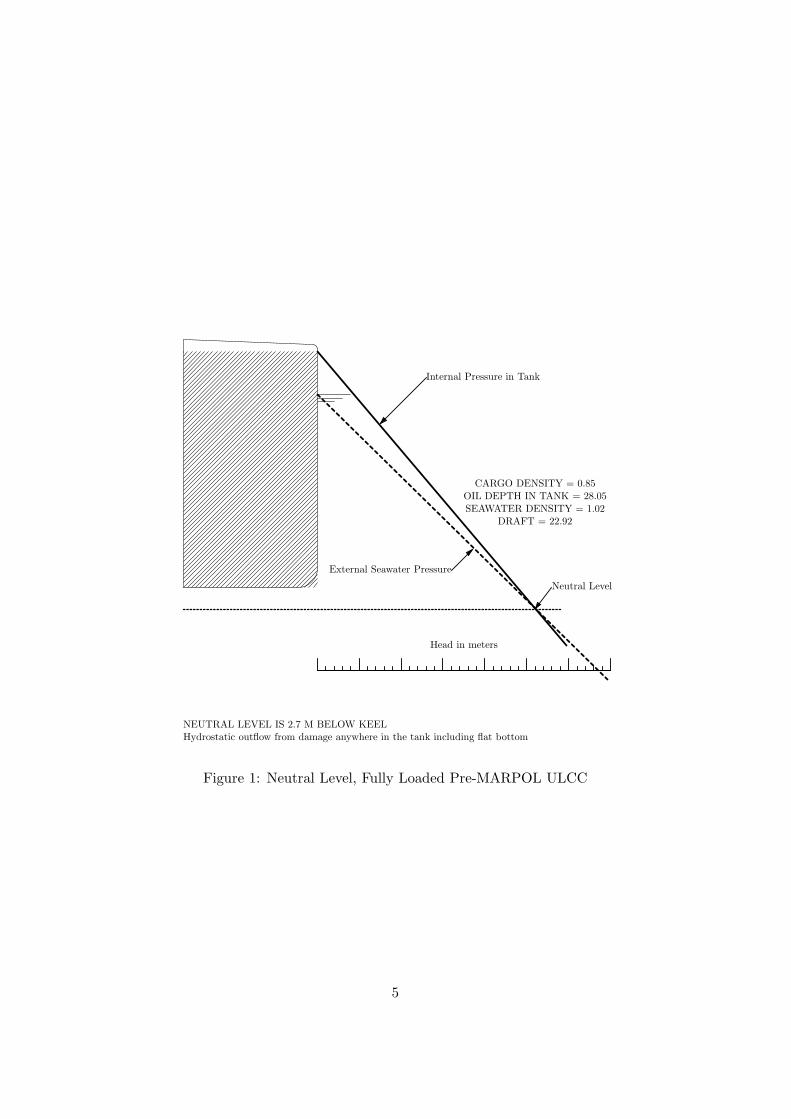
With this background, let’s start with the simplest situation: singlebottom with the damage confined to the bottom. Figure 1 is a sketch of anold style, pre-Marpol, single hull ULCC, fully loaded. The solid line slopingdownward and to the right shows the internal pressure in the tank as wemove vertically downward in the tank. In Figure 1, we have assumed thatthe cargo has a specific gravity of 0.85, a middling density for crude oil.That is, a cubic meter of this oil weighs 85% as much as a cubic meter offresh water. Inside the tank, the pressure head increases by 0.85 meters foreach meter we move down in the tank. Thus the slope of the solid line is0.85.
The dashed line shows the external pressure in the sea outside the tank.The seawater pressure head increases by 1.02 meters for each meter of depth.Seawater is heavier than oil; so as we move vertically downward the seawaterpressure outside the tank increases more rapidly than the internal pressurein the tank. However, the pressure inside the tank has a head start since thetop of the oil in a fully loaded tank is well above sea level. At some pointthe seawater pressure will catch up to the tank pressure.
The cross-over point is known as the Neutral Level. At any depth abovethe Neutral Level, the internal tank pressure is higher than the externalsea pressure. Damage above the Neutral Level will result in a hydrostaticoutflow of oil into the sea. At any depth below the Neutral Level the externalsea pressure is higher than the internal tank pressure. Damage below the
Neutral Level will result in a hydrostatic inflow of seawater into the tank.
In Figure 1, the Neutral Level is 2.7 meters below the keel. This means
2 Equations will be confined to footnotes. They are not really needed anyway. Whatis important is the sketches. All the sketches in this document are to scale. They areanatomically correct.
4
Internal Pressure in Tank
Neutral Level
External Seawater Pressure
Head in meters
CARGO DENSITY = 0.85OIL DEPTH IN TANK = 28.05SEAWATER DENSITY = 1.02
DRAFT = 22.92
NEUTRAL LEVEL IS 2.7 M BELOW KEELHydrostatic outflow from damage anywhere in the tank including flat bottom
Figure 1: Neutral Level, Fully Loaded Pre-MARPOL ULCC
5

that even at the very bottom of the tank the internal oil pressure is higherthan the external seawater pressure. Damage anywhere in the tank, even atthe very bottom, will result in a spill. Oil will flow out of the tank until theinternal and external pressures at the top of the damage have equalized.
Now suppose we draw down the initial level of cargo in this tank 2meters. Figure 2 shows the new situation, assuming the ship remains at thesame draft. The oil has lost a considerable portion of its head start; and the
Internal Pressure in Tank
Neutral Level
External Seawater Pressure
Head in meters
CARGO DENSITY = 0.85OIL DEPTH IN TANK = 26.05SEAWATER DENSITY = 1.02
DRAFT = 22.92
NEUTRAL LEVEL IS 7.3 M ABOVE KEELNo hydrostatic outflow from damage below Neutral Level
Figure 2: Neutral Level for same ULCC, Tank Drawn Down 2 M
Neutral Level, the depth at which the internal and external pressures areequal, is now 7.3 Meters above the keel. Drawing down the tank 2 metershas lifted the Neutral Level a surprising 10 meters.3
3 For the geeks, the equation for the Neutral Level is
HNL =ρseaD − ρoilHoil
ρsea − ρoil
where HNL is the height of the Neutral Level, ρsea is the sea water density, ρoil is thecargo density, D is the ship’s draft, and Hoil is the initial level in the tank. The fact thatthe denominator is generally less than 0.2 gives rise to the multiplier. Heavier cargoeshave higher multipliers and vice versa.
6

In this case, we have a multiplier of five, every meter change in the initialcargo depth changes the Neutral Level by five meters. This multiplier resultsfrom the fact that the solid and dotted lines in Figures 1 and 2 are nearlyparallel. So a slight shift upward or downward in either of these lines, makesa big difference in the cross-over point.
In Figure 2, if we have damage which is confined to the flat bottom, seawater will push into the tank lifting the oil in the tank until the internalpressure and the external pressure are equalized. When you do the calcula-tions, you find that this will occur when the oil-water interface is 1.2 metersabove the bottom. Figure 3 shows this final situation and compares it withthat which would have occured if the ship had initially been loaded as inFigure 1.
xxxxx
FULLY LOADEDOIL COLUMN BEFORE = 28.05OIL COLUMN AFTER = 27.32
LIVE BOTTOM = 0.0NEUTRAL LEVEL = -2.7
HYDROSTATIC LOSS/TANK = 2.6%EXCHANGE LOSS/TANK = 0.0%
xxxxx
TANK DRAWN DOWN 2 MOIL COLUMN BEFORE = 26.05OIL COLUMN AFTER = 26.05
LIVE BOTTOM = 1.2NEUTRAL LEVEL = 7.3
HYDROSTATIC LOSS/TANK = 0.0%EXCHANGE LOSS/TANK = 0.0%
Figure 3: Final situation, Full load vs Tank Drawn Down 2 M
7

The top half of Figure 3 tells us that as long as the damage is confined to
the bottom, a fully loaded pre-Marpol tanker will spill less than a few percentof the oil in each tank that was breached. Notice that the equilibrium levelof oil in the tank is still well above sea level after the oil has stopped flowingout. One of the clains for double bottoms is that they are much better thanthe crummy old Marpol single bottoms in bottom damage. Well, the fact isthat the old Marpol single hulls were pretty damn good at limiting outflowin bottom damage.
I need to make an extremely important qualification here. Figure 3assumes the ship is at the same draft before damage and after. As longas only one or two tanks are damaged, this will be nearly true. If a lot ofcargo tanks are damaged, the ship will rise in the water during the outflowand this can materially increase the outflow. The multiplier is a two-edgesword. Conversely, if some ballast tanks are damaged and flooded or a quickthinking crew ballasts the ship down, the leakage can be markedly reduced.4
The bottom half of Figure 3 says we only had to underload such shipsby about 7%, and they would have spilled nil oil if the damage is limited tothe bottom. (Once again I’m assuming the underloading was accompaniedby sufficient ballast to keep the ship at the same draft.)
The bottom half of Figure 3 also tells us we must be careful to distinguishthe Neutral Level from the equilibrium oil-water interface. In this situation,the Neutral Level is 7.3 meters above the bottom of the tank, but the oil-water interface after the sea water flows into the tank is only 1.2 m abovethe bottom of the tank. This equilibrium oil-water interface is called theLive Bottom.5
Most people have no problem accepting the fact that, if the level of oilin the tank is below that of the surrounding seawater, and we puncture thebottom of the tank, sea water will flow into the tank rather than oil flowing
4 Another less important, but still very significant qualification. All tanker cargo tanksare normally inerted. That is, they are pressurized with low O2 gas from the ship’sboilers. This prevents explosions. But it also increases the pressure in the top of thetank. Typically, this increase in pressure is equivalent to about a half-meter of sea water.The solid line in Figures 1 and 2 actually starts off about a half-meter higher than I haveshown.
It is even a little more complicated than this. If there is outflow, the pressure in theullage space will be drawn down, possibly as far as the P/V valves allow. If there is inflow,the pressure in the ullage space will be pushed up, possibly as far as the P/V valves allow.These effects can have a major impact on actual outflows. We will make the necessaryadjustments in Section ??.
5 Assuming that there is a Live Bottom, the equation for the Live Bottom is
HLB =ρseaD − ρoilHoil
ρsea
where HLB is the height of the Live Bottom. Notice there is no multiplier. In both theHNL and HLB equations, the seawater depth D at the damage is critical. It determinesthe external pressure. Change that depth and you change all the spillage numbers.
8

out.But there are two aspects of hydrostatic balance that are much harder
to swallow:(A) One is that the water will flow in rather than oil flowing out even if
the initial level of oil in the tank is above the surrounding seawater,as long as the weight of the column of oil is less than the weight of thecolumn of sea water.6 For a light crude and a pre-Marpol ULCC atdeep draft, the level in the tank could be 4 meters higher than the sealevel outside, and yet water would flow in from bottom damage ratherthan oil flowing out.7 Water is heavier than oil. Think of that balancebeam.
(B) The fact that a small change in the initial level of oil in the tank canmake a far larger change in the position of the Neutral Level. As wehave seen, thanks to the relatively small difference in density betweenseawater and oil, changing the initial level in the tank by 1 meter,typically changes the Neutral Level by 5 or 6 meters.
In our everyday life we don’t have a lot of experience with differentdensity liquids. If we fill up a U-tube with water, we know the level in thetwo ends of the tube will end up being the same. We sort of expect the samething to happen, even if the liquids are not the same. If you have a U-tube,fill up one side with olive oil and the other with vinegar. You will see thedifference. Anyway the physics couldn’t be simpler or more irrefutable; andpoints (A) and (B) have been experimentally verified many times. I have toask you to study Figures 1, 2 and 3 until they really make sense to you.
The term hydrostatic balance is used in two different contexts:1. To refer to the equilibrium situation after the the oil water-interface
has stabilized, as in “the tank had reached hydrostatic balance”.2. To refer to a tank in which the initial, undamaged cargo level is low
enough so that the Neutral Level is above the bottom of the tank, as in“the tank was hydrostaticly balanced loaded”. This horribly awkwardphrase is usually shortened to HBL. An HBL tank in calm water willnot spill oil if the damage is confined to the flat bottom.8
6 It is not just laymen that have a problem with this. Many spill responders don’tunderstand it. The report of the Diamond Grace spill in Tokyo Bay by the responsecommander has a sketch which shows he believes that the equilibrium level in a breachedtank is the seawater level.
7 A corollary of this fact is that hydrostatic pressure can push oil out of the tank thruP/V vents and the like if the damaged tank is low in the water and the oil column is tallenough.
8 In a similar fashion, we will sometimes used the phrases hydrostatically over/under-balanced to refer to a tank in which the cargo level is above/below the HBL level.
9

3 Marpol versus Pre-Marpol
For our first application of hydrostatic balance, let’s compare Marpol singlehulls with pre-Marpol single hulls. On the right side of Figure 4 is a 215,000ton Marpol VLCC which looks suspiciously like the Exxon Valdez. On theleft side is a standard 275,000 ton pre-Marpol VLCC which has been scaledto 215,000 ton deadweight. The Marpol VLCC is a slightly bigger ship,about 2 m taller, because none of the cargo tank volume can be re-used asballast tank volume.
Both ships are fully loaded with a 0.85 specific gravity crude. For thepre-Marpol ship loaded down to her marks, this means using up only about94% of the available cargo cubic.9 But for the Marpol tanker, we must useall the available cubic leaving 2 to 3% for cargo expansion. The result is thatthe initial oil column in the Marpol tanker is more than 2 meters taller thanthat for the pre-Marpol ship. But the initial drafts are almost the same.
The visual difference between the ships in Figure 4 is not all that striking.But when the tank on the right in the pre-Marpol ship is bottom damaged,a little less than 0.5 m of oil flows out before hydrostatic balance is reached.When the same tank in the Marpol tanker is bottom damaged over 2.5 mof oil flows out. In percentage terms, the Marpol tanker spills five
times as much oil. Applied to the Exxon Valdez which ruptured 8
of 11 cargo tanks, the extra 2 meters of outflow is about 10 million
liters.
This analysis is far from complete:1. We have not adjusted for differences in tank arrangement. The pre-
Marpol VLCC will typically have 24 tanks of which two are segregatedballast. The Marpol VLCC will have something like 15 tanks of whichfour are segregated ballast. Normally, the Marpol tank will be con-siderably bigger than the pre-Marpol tank. On the other hand, theMarpol ship has a higher probability of damaging a non-cargo tankthan the pre-Marpol ship.
2. We have not adjusted for change in draft, trim, and heel. As we shallsee, this adjustment is critically important. In the situation in Figure4 if the tank on the right is the only breached tank, then both ships willlist away from the damage which will exacerbate spillage. However,the Marpol ship will list more (and rise more) increasing spillage more.
3. We have not adjusted for tide (if stranded), IG pressure, nor the vac-uum that is created in the top of the tanks with outflow.
We will get into all these matters. However, it is obvious that the Marpol
9 A smart move in pre-Marpol days was to use up all the cubic in the center tanks inwhich case for most crudes the wing tanks are hydrostatically under-balanced when theship is loaded down to her marks. This is precisely how IMO Reg 13(G) was implementedon some old ships, usually with no loss in carrying capacity. In the left side of Figure 4,this was not done.
10

single hulls are hydrostatically challenged.
11

Figure 4: Marpol vs pre-Marpol Spillage
PRE-MARPOL 215,000 DWTDepth = 24.887
Waterline = 19.400Initial Innage = 23.735Final Innage = 23.280
Percent Loss = 1.917
MARPOL 215,000 DWTDepth = 26.820
Waterline = 19.660Initial Innage = 26.190Final Innage = 23.592
Percent Loss = 9.920
BOTTOM DAMAGE TO TANK ON THE RIGHT
12

4 Yeah, but Where’s the Seal
Another problem people have with hydrostatic balance is the efficacy of theseal. The Live Bottom is not really a bottom. In many situations, the oil-water interface will be quite close to the real bottom or equivalently the topof the damage. There’s no barrier there; no membrane or anything similarkeeping the oil in the tank. How good a seal can it be?
If the damage is confined to the ship’s bottom, the ship is floating, andnobody does anything stupid, it turns out that a Live Bottom is a prettyeffective seal. Almost all crude oils hate to mix with water. The moleculesrepel each other. This accounts for the spreading and persistence of oilslicks, even in fairly rough water. If you do manage to mix some of the oilinto the water, it will immediately tend to separate.10
For a floating ship, there are two natural phenomena that can generatespillage after a Live Bottom is established: current and waves. After theExxon Valdez, the US Coast Guard decided it would be politically unwiseto oppose double bottoms. This was a major change. In the 1979 post-Amoco Cadiz debate, the Coast Guard had argued for limits on tank sizeand against double bottoms. The main alternative to double bottoms washydrostatic balance.
The Coast Guard knew they could not attack the basic physics of hy-drostatic balance. They decided to go after the seal. In 1992, the USCGfunded a series of 1/30th and 1/15th scale experiments at the David TaylorResearch Center (DTRC).[?] These tests were an intriguing combination ofcrude but very interesting experimental science and blatant politics on thepart of the sponsor.[?] But the key result is summarized in Figure 5.11 Thisfigure shows the Live Bottom height required to effectively halt current en-trainment according to these model tests. If the Live Bottom is right atthe ship’s bottom, current under the ship produces a wave at the oil/waterinterface. When a trough in the wave reaches the down current end of thedamage, the oil in the trough is clipped off and lost into the sea. As theLive Bottom rises in the tank, the amplitude of the interface wave decreases;and, for a high enough Live Bottom, even the trough in the wave is abovethe ship bottom, at which point current loss effectively halts. As Figure5 indicates for a three knot current, the Live Bottom has to be about 0.7
10 All the witnesses to the Exxon Valdez were struck by how violently the oil emergedfrom the water.[?][p 45] The velocity that the oil had attained in its 15 to 20 m climbto the surface generated little geysers. USCG Warrant Officer Delozier, who reached theship three hours after she grounded testified
The oil was coming out of vessel at a very intense rate .... bubbling up intothe air, sometimes up to sixteen, eighteen, twenty inches high.
11 The DTRC experiments were actually a follow on to work done at the TsukubaInstitute in Japan which produced similar results.
13

meters above the real bottom.12 For a 5 knot current, we need about a 2.2m Live Bottom height. The required Live Bottom height goes as the squareof the current velocity as would be expected from Bernoulli’s Law.
0 1 2 3 4 5 6 7 80
1
2
3
4
5
ut
ut
ut
ut
bc
bc
bc
×
×
×
Current in knots
Req
uir
edLiv
eB
otto
mH
eigh
t(m
eter
s)
toP
reve
nt
Entr
ainm
ent
Dashed line is quadratic fit
to the ten data points
o 300 mm initial Live Bottom
△ 600 mm initial Live Bottom
x 900 mm initial Live Bottom
Figure 5: Required Live Bottom Height versus Current Speed
I would not make too much of Figure 5 for two reasons:1. There is good reason to doubt the accuracy of the extrapolation of
the model results to full scale. The difference between the DTRC re-sults at 1/30th scale and 1/15th scale showed that the straightforwardextrapolation used in the DTRC report and Figure 5 was of limitedaccuracy. DTRC was careful to point this out and call for more re-search; but this has never been done. The results in Figure 5 shouldbe taken as indicative only.
2. The test procedure was to place the model tank in a circulating watertunnel and then open a hole in the bottom of the tank. This is OKexperimental science but does not model a stranding.13 Most severegroundings are strandings. In a stranding, the area around the damage
12 Figure 5 is not in the DTRC report. It is my interpretation of the results in Figure9 of that report. It is the level of the Live Bottom in the tank 2 hours (ship time) afterthe start of the experiment at which point the oil loss rate is nil.
13 Nor does it model the initial grounding process. Some have argued that during impact
14

is partially blocked by the sea bottom. Moveover, even if the surfacecurrent is say 3 knots, the current next to the sea bottom will be muchsmaller.
In any event, currents much in excess of 3 knots are reasonably rare andFigure 5 gives us considerable comfort that, as long as the Live Bottom is ameter or more above the top of the damage, current will almost never be afactor. In extraordinarily high current environments, you may need as muchas a 2 m Live Bottom height.
A real world example of the power of hydrostatic balance in the face oflarge current was the Oceanic Grandeur spill. On March 3rd, 1970, theOceanic Grandeur hit an uncharted rock in the Torres Strait. The 61,000tonner was nearly fully loaded with 55,000 tons of crude. When she hitthe rock, 8 of 15 cargo tanks were breached. However, the ship flooded ina manner that resulted in her sinking 2 or 3 meters with a slight list toport, putting the port gunnel just underwater. This sinkage improved thehydrostatic balance considerably. The ship lost considerably less than 1%of her cargo as a result of the initial damage.
The weather was calm throughout but the currents in the Torres Straitcan be extremely strong. Despite this, the Australian investigation reportexplicitly says nil oil was lost during the subsequent three days despite tidal
currents of up to 6 knots [emphasis mine].[?] This was not a stranding; theship was at anchor during this period. Most of the 1100 kiloliters spilled waslost on the 7th day of lightering as the ship rose out of the water, reducingthe external hydrostatic pressure. If they had done a really careful job oflightering and ballasting, this latter spillage could have been prevented; butprobably, at the cost of a longer lightering, which would have entailed itsown risks. Even so the Oceanic Grandeur, with over half her cargo tanksbreached, lost just 2% of her cargo. And we can be sure that the damagewas not confined to just the flat bottom. In the real world, there is no suchthing as a flat bottom only grounding.14
the damaged tanks are momentarily exposed to the very high “current” produced by theship’s forward motion, and attempted to apply the DTRC results to this process. Butthey are forgetting that not only will the damage be largely blocked by the sea bottomduring that period, but sea bottom material will be penetrating into the tank volume.This was dramatically illustrated in the Exxon Valdez where the crew reported that theP/V valves of the damaged tanks vented violently as the ship rode onto the rocks. Thefirst thing that happens is the liquid in the tank is forced upward.
14 A critically important factor in this casualty was the strength of the ship. TheOceanic Grandeur was able to withstand the over-design sagging moment associated withflooding the midships segregated ballast tanks while loaded with her bottom all torn up.The fact that this 61,000 tonner was built in 1965 meant that she had more strength thanthe later 1970’s built pre-Marpol ships, not to mention far more strength than the tankersbuilt in the 1980’s and later. If the hull had failed — and a modern hull probably wouldhave — the Grandeur would have spilled the better part of 50,000 kiloliters on the GreatBarrier Reef, making this one of the most famous spills of all time. As it was, you almostcertainly have never heard of this ship.
15
A more effective way of breaking a Live Bottom seal is wave pumping.Waves can disturb the Live Bottom two ways:
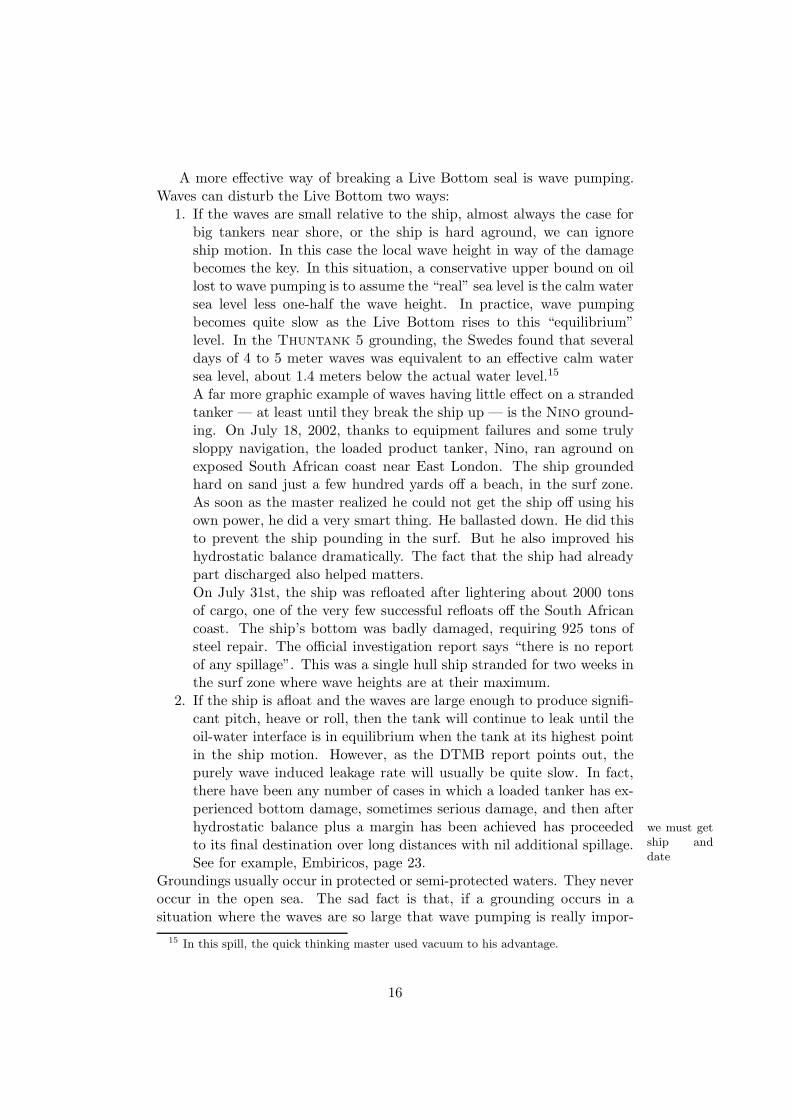
1. If the waves are small relative to the ship, almost always the case forbig tankers near shore, or the ship is hard aground, we can ignoreship motion. In this case the local wave height in way of the damagebecomes the key. In this situation, a conservative upper bound on oillost to wave pumping is to assume the “real” sea level is the calm watersea level less one-half the wave height. In practice, wave pumpingbecomes quite slow as the Live Bottom rises to this “equilibrium”level. In the Thuntank 5 grounding, the Swedes found that severaldays of 4 to 5 meter waves was equivalent to an effective calm watersea level, about 1.4 meters below the actual water level.15
A far more graphic example of waves having little effect on a strandedtanker — at least until they break the ship up — is the Nino ground-ing. On July 18, 2002, thanks to equipment failures and some trulysloppy navigation, the loaded product tanker, Nino, ran aground onexposed South African coast near East London. The ship groundedhard on sand just a few hundred yards off a beach, in the surf zone.As soon as the master realized he could not get the ship off using hisown power, he did a very smart thing. He ballasted down. He did thisto prevent the ship pounding in the surf. But he also improved hishydrostatic balance dramatically. The fact that the ship had alreadypart discharged also helped matters.On July 31st, the ship was refloated after lightering about 2000 tonsof cargo, one of the very few successful refloats off the South Africancoast. The ship’s bottom was badly damaged, requiring 925 tons ofsteel repair. The official investigation report says “there is no reportof any spillage”. This was a single hull ship stranded for two weeks inthe surf zone where wave heights are at their maximum.
2. If the ship is afloat and the waves are large enough to produce signifi-cant pitch, heave or roll, then the tank will continue to leak until theoil-water interface is in equilibrium when the tank at its highest pointin the ship motion. However, as the DTMB report points out, thepurely wave induced leakage rate will usually be quite slow. In fact,there have been any number of cases in which a loaded tanker has ex-perienced bottom damage, sometimes serious damage, and then afterhydrostatic balance plus a margin has been achieved has proceeded we must get
ship anddate
to its final destination over long distances with nil additional spillage.See for example, Embiricos, page 23.
Groundings usually occur in protected or semi-protected waters. They neveroccur in the open sea. The sad fact is that, if a grounding occurs in asituation where the waves are so large that wave pumping is really impor-
15 In this spill, the quick thinking master used vacuum to his advantage.
16

tant to spillage, the ship is unlikely to survive. Witness Torrey Canyon,Argo Merchant, Amoco Cadiz, (and just about all the other ground-ings on the coast of Brittany), Braer, Tasman Spirit and many others.
If current and wave pumping are not all that good at breaking the LiveBottom seal, there are two very effective ways of clobbering hydrostaticbalance.
1. Pumping out intact tanks before pumping out damaged tanks. Thislifts the ship out of the water and turns the multiplier against us.Since responders either don’t really understand hydrostatic balanceor are responding to other pressures, this is not that uncommon. Ithappened in the Oceanic Grandeur, and in at least two other majorspills, that I know about (the Tamano, and the Imperial Sarnia).In each case, more than doubling the size of the spill. More on thislater.
2. Put your ship aground at high tide, and then have the tide go out2 or 3 meters, dropping the Neutral Level by 10 to 15 meters. Thisis what happened to the Exxon Valdez, Tidal height is crucial togrounded spillage, and must be allowed for in any realistic analysis ofgroundings. But before we address this issue we need to worry aboutside damage.
17

5 Side Damage and Exchange Flow
So far we have talked only about bottom damage. If the damage extends upthe side of the tank and any real world damage will, the situation becomesa bit more complicated.
If we have side shell damage which is entirely below the waterline, twothings happen:
1. First, we will have a hydrostatic outflow of oil or inflow of sea waterdepending on whether or not the Neutral Level is below or above thetopmost point of the damage. This is the same as for the bottomdamage case and follows exactly the same rules. As long as the topof the damage is below the waterline, the key point is the verticalheight of the top of the damage. For damage that is entirely belowthe waterline, the topmost point of the damage plays almost exactlythe same role at the lowest point in damage that is entirely above thewaterline. You have to think upside down.
2. Second, if the resulting oil water interface after the hydrostatic flowshave taken place is below the top of the damage, the lighter density oilwill flow out the top of the damage while the heavier seawater flowsin thru the bottom of the damage. When you do this at lab scale,the outflowing oil looks almost like a snake or a rope, emanating fromthe top of the damage. This exchange flow will continue until the oilwater interface in the tank rises to the top of the damage.
Exchange flow is quite different from hydrostatic flow:1. It is an order of magnitude slower. Since the outgoing oil has to be
replaced by incoming water, the effective flow area is halved. Whenthe flow area is halved, the flow velocity is reduced by more thanhalf because of viscous effects around the perimeter of the flow. Moreimportantly, the forces driving exchange flow tend to be much weakerthan the forces driving hydrostatic flow. A typical hydrostatic flowwill start out with a net driving head of 2 or 3 meters of oil. If thelayer of oil below the top of the damage after hydrostatic flow is say3 meters deep, the driving head is about 0.15 (the difference in thedensities between oil and water) times this depth.16
The “fact” that exchange flow is much slower than hydrostatic flowis the reason we can assume that hydrostatic flow happens first, then
16 To my knowledge, there has been no real quantitative study of exchange flow, neitherexperimental nor theoretical. Playing around at lab scale, it is obvious that exchange flowis far slower than hydrostatic. Embiricos[?] talks about a grounding of an unidentified90,000 tonner in the Suez Canal, in which the master noted that after 42 minutes, thespillage rate was greatly reduced. The log data indicates the tank emptied at 0.40 ft/minprior to that time and 0.05 ft/min after that time. Embiricos associates the earlier periodwith hydrostatic flow and the latter with exchange flow. This is plausible but not proven.To say more, we would need the ship draft, the cargo density, the initial level in the tank,and the location of the top of the damage.
18

exchange flow. In reality, exchange flow begins before hydrostatic flowis finished. But, in most real world cases, the hydrostatic flow is somuch faster that this assumption is close enough.
2. The pressure drop across the hole is in your favor. Once you get intoexchange flow, below the very top of the hole, there is more pressureon the outside than on the inside. Therefore it is much easier to makesome sort of repair. If you can cover the hole with almost anythingfrom the outside, even some kind of canvas, it will tend to stay there.In hydrostatic flow, the flow pushes any attempt to plug the hole awayfrom the hole.
3. The tube of outflowing oil climbs upward immediately. In the case ofa double sided tanker, this means that all the oil will climb into thetop of the double sides; and, if the double sides are still intact down tobelow the waterline, at least some of this oil will be captured there byhydrostatic balance. Much the same thing happens with hydrostaticflow but in this case, the outflow velocity can be large enough so thata good bit of the oil is carried outside the outer shell, before it turnsvertically upward. You don’t want either; but if you are faced with achoice of 100 cubic meters of hydrostatic flow or a 100 cubic meters ofexchange flow, you would much prefer the latter.
This most definitely does not mean that side damage is preferred tobottom damage. Figure 6 makes the point that side damage is much worsethan bottom damage, and, if you must have underwater side damage, youwant it as low as possible.
In Figure 6, we start out with the same situation as in Figure 1, a fullyloaded pre-Marpol ULCC. We then damage the side shell with the highestpoint of damage 4 meters above the keel. Since the Live Bottom is wellbelow the keel, the first thing that happens is hydrostatic outflow. We lose5.3% of the tanks contents before hydrostatic flow stops.17 In the top half ofFigure 1, when the damage was confined to the bottom, we lost only 2.6%of the tank to hydrostatic flow.
And our troubles are not over. The situation after hydrostatic flow lookslike the middle sketch in Figure 6. The oil in the bottom 4 meters of the tankis below the top of the damage. This situation is unstable. The seawaterpressure at the bottom of the damage is higher than the pressure inside thetank at the bottom of the damage. Sea water will pushes its way into thebottom of the damage forcing oil out the top. Unless we do something, thisexchange flow will continue until we have lost all the oil in the bottom 4meters of the tank, over 14% of the original cargo, for a total loss of about20%.
17 The problem is that oil will flow out until the external pressure at the top of thedamage is the same as the internal pressure at this point. For every meter the damageextends up the side shell, the outside head drops by ρsea but the inside pressure dropsonly by ρoil.
19

xxx
INITIALLYOIL COLUMN = 28.05
WATER COLUMN = 0.0HYDROSTATIC LOSS= 0.0%EXCHANGE LOSS = 0.0%
xxxx
AFTER HYDROSTATIC FLOWOIL COLUMN = 26.55
WATER COLUMN = 0.0HYDROSTATIC LOSS = 5.3%
EXCHANGE LOSS = 0.0%
xx
AFTER EXCHANGE FLOWOIL COLUMN = 22.55
WATER COLUMN = 4.00HYDROSTATIC LOSS = 5.3%EXCHANGE LOSS = 14.3%
Figure 6: Fully Loaded, Pre-MARPOL, Side damage up 4 M
20

If we initially underload the tank, so that the Live Bottom is 4 m abovethe keel, — this requires an initial oil column of 26.7 m or about 5% under-loading, we will have no hydrostatic loss but we will still face a 14% loss inexchange flow.
In order to stop the exchange flow via hydrostatic balance, we would haveto underload the tank to the point where the incoming hydrostatic flow ofsea water will push all the oil in the tank above the top of the damage.This would require an initial oil column of 22.5 m or 20% underloading.The further up the tank the damage extends, the worse it gets. The real
problem with hydrostatic balance is that it is not very effective
against side damage. Of course, the same thing is true of double bottoms.In general, you want to keep side shell damage as far away from the
waterline as possible. If the damage is completely above the water line, youwould prefer the bottom of the damage to be as high as possible, for in thiscase the low point of the damage determines how much of the tanks contentswill drain out. But if the damage in entirely below the waterline, you wantthe highest point of the damage to be as low as possible, for in this case thehigh point of the damage determines how much outflow there will be. Worstof all is damage that straddles the waterline.18 Collisions usually result inthis kind of damage to the hittee. In this case, if we do nothing, we willeventually lose all the cargo in the tank.
18 Despite the fact, that the single most important number for damage below the water-line is the highest point of the damage, it is almost never recorded in the spill investigations.You will see something like “6 foot gash in forward starboard tank”. But unless we knowthe highest point of the gash (lowest if damage is all above the waterline), we can’t doanything with this information.
21

6 Ballasting Down: the Tamano Spill
Hydrostatic balance has a number of implications, some of which people findsurprising at first glance.
6.1 Ballast Down
If you have damage low in the ship, it almost always pays to sink the shiplower in the water. A little study of Figures 1 and 2 will reveal that, ifwe were in the full load situation, Figure 1, and we sank the ship 2 meterslower, it would have more or less the same effect as having drawn the tankdown 2 meters. In fact, it will have a bit more effect. For a medium densitycrude with a specific gravity of 0.85 and sea water with a density of 1.02,the equation for the height of the Neutral Level, HNL is
HNL =1.02D − 0.85Hoil
1.02 − 0.85
where Hoil is the height of the oil in the tank, and D is the ship’s draft inway of the damage. Pressing the ship down into the water an extra meteris worth more than removing a meter of oil from the tank because a meterof seawater weighs more than a meter of cargo.
Figure 7 shows the Figure 1 situation if we are able to get the ship 2meters deeper in the water. The Neutral Level has gone from 2.7 metersbelow the keel to 9.3 meters above. Generally, the most effective thing a crewcan do if the ship has bottom damage is to get the damaged tank(s) lower inthe water.19 That’s what the crew of the Nino did. One of the good thingsabout a double bottom is that, when it is damaged, it automatically ballaststhe ship down. The same thing is true of an HBL-loaded single hull, but,unless a segregated ballast tank is breached as in the Oceanic Grandeur, theamount of automatic ballasting down will be much less. Unfortunately, theway we build ships these days, it also automatically over-stresses the ship.
6.2 Do not discharge non-damaged tanks
Conversely, the dumbest thing you can do is to lighten the ship and bringit further out of the water.
I should know. The first spill I ever attended was the Tamano in Julyof 1970 in Casco Bay outside Portland, Maine. At that time, there was apipeline from Portland to Eastern Canada. The Tamano, a 100,000 ton,four year old, pre-Marpol single hull, fully loaded with heavy fuel oil, hit aledge in-bound to the pipeline at about 0120 in the morning. The weatherwas clear. She had just picked up a pilot. This was probably a navigation
19 In doing so, we must be careful not to exceed the ship’s structural limits. This is thesubject of Section 7.
22

Internal Pressure in Tank
Sea Water Pressure
Neutral Level
Head in meters
CARGO DENSITY = 0.85OIL DEPTH IN TANK = 28.05SEAWATER DENSITY = 1.02
DRAFT = 24.92
NEUTRAL LEVEL IS 9.3 M ABOVE KEEL
Figure 7: Full load but ballasted down 2 M
23

error, although the ship alleged that a buoy was out of position. The shipproceeded to the terminal, where it was discovered she was leaking.
I was a junior faculty member at MIT at the time, and had made a verymodest name for myself in New England by pontificating on the impact ofoil drilling on Georges Bank. But I had never actually seen a real world oilspill of any size. The locals invited me and some of my students to see forourselves. I jumped at the chance.
By the time we got there, the leakage had stopped. No one was quitesure why including me, although after the fact it was clear that the damagedtanks had gone to hydrostatic balance. (Later it was learned that only 1Swas damaged, a 20 foot gash 8” wide — but the all important highest pointof the damage was not reported — it was somewhere low in the tank).
The decision was made to off-load the cargo so that the ship could goto the yard for repairs. (Besides the Canadian charterers were desperate forthe oil.) But the damaged tank could not be pumped out with the ship’spumps since the oil-water interface in this tank was above the tank suctions.Pumping this tank out would merely pump out sea water which would bereplaced by more seawater. This is the normal situation when a tank isbreached. The suctions for the ship’s pumps are at the very bottom of eachtank. Otherwise, you would never be able to completely empty the tank.But this means that as soon as the oil water interface in a seriously damagedtank is above the bottom, the ship’s pumps can’t pump cargo out of thattank.
So they started pumping out the intact cargo tanks. Immediately theship began leaking again. Before we stopped we had more than doubled thesize of the overall spill. At the time, neither I nor apparently anyone else hadthought through the hydrostatic balance thing. In retrospect the situationcould not have been handled any worse. By pumping out the intact cargotanks, we lifted the ship out of the water and destroyed the hydrostaticbalance. The damaged tank probably had a plan area of about 300 m2. Theheavy fuel oil cargo had a density of around 0.95. For every centimeter weraised that tank, we spilled roughly an extra 3,200 liters. The final spillvolume was put at 378,000 liters. It took only a half meter reduction indraft to double the spill.
As soon as the spill was discovered, the ship should have been movedinto deeper water and ballasted down as far as possible, listing and trimmingthe ship in the direction of the damage. At that point, we should have putsubmersible salvage pumps on-board and pumped out the damaged tankfrom the top down.20 Only after we had removed the oil from the damagedtank should we even have thought about discharging the other cargo tanks.Preposterously stupid.21
20 These pumps can be lowered into the tank to a point above the oil water interface.21 I have not found any reference to the hydrostatic screw up nor the secondary spill
24

Many years later, a Coast Guard veteran told me that the same thinghad happened at the Imperial Sarnia spill in the St.Lawrence Seaway in1974 but I was never able to get any details. The Tamano is the only majorspill at which I have been physically present. One wonders how often thissilly mistake is made.
The power of Hydrostatic Balance is a two-edged sword. Here are twoobvious things NOT to do to avoid lowering the Neutral Level.
1. Don’t discharge intact tanks which will raise the ship in the watermassively increasing hydrostatic flow from the breached tanks.
2. Similarly, Don’t deballast the ship.
The only exception to these two rules is: you have grounded at high tide andby deballasting/discharging/jettisoning you may be able to get the ship offbefore the tide goes out with horrible effect on hydrostatic balance — thisis what happened to the Exxon Valdez — and/or the ship’s structuralintegrity — see the Sea Empress spill below.22 Conversely, if you havegrounded on soft, flat bottom at low tide and the situation is safe andstable, ballast down, stay put, and let the rising tide improve your NeutralLevel markedly.
As soon as you get in trouble, call for submersible pumps.23
in any of the official Tamano documentation. It shows up only obliquely as a sudden“failure” of the containment equipment well after the initial leak had stopped. I don’tknow whether this omission was intentional, or simply due to complete ignorance of whatwas happening.
22 The common salvage process of overpressuring, “blowing a tank”, is an obviousexample of Hydrostatic Balance in reverse. It should be employed only if the benefitsoutweigh the additional oil outflow and there is no feasible alternative.
23 One can make a strong argument that all tankers should be required to carry asubmersible pump and a means for driving it. Further the successful use of the systemshould be periodically demonstrated to port state inspectors.
25

7 The Right Response
Hopefully by now you are convinced that the right response in terms ofballasting and cargo transfers can be crucial in determining the final amountspilled. The question on the table is: how do you get the right response,and how do you get it quickly enough?
This is where CTX Mate comes in. Every tanker has software on-boardwhich takes as input an actual or potential tank loading pattern, and com-putes the corresponding draft and trim, estimates the stresses imposed onthe ship by this loading pattern, and checks that these stresses are withinlegally allowable values. This program is called the Loading Instrument.
It is not difficult to endow the Loading Instrument with the capabilitiesof handling damage and spillage. The Center for Tanker Excellence hasdeveloped such a program. It’s called CTX Mate (Mate). The Center forTanker Excellence has made this program available under the Gnu PublicLicense, which means that anyone can download the program without cost.More importantly, the program is Open Source, which means any one canexamine the inner working of the program.
CTX Mate serves at least three purposes:1. It’s a normal loading program in every day use. This is crucial. It
means that the program has been thoroughly tested on this particularship for a wide range of loading conditions. It means the crew isintimately familiar with the program’s operation and facile in its use.Turning to basically untested, rarely used, unfamiliar software in themiddle of a crisis is a prescription for disaster. Finally, it means thatthe tank loading pattern at the time of the casualty is already in theprogram. With Mate, if a ship experiences damage, the crew canflip the program to Damage Mode with a single click, and type insix numbers for each damaged tank. (The six numbers tell Mate thelocation of the damage in that tank.) Click again and all the damagecalculations are done. No multi-hour delay in getting up and running.
2. It’s a salvage program capable of computing flooding, damage stabil-ity, and strength for any given loading pattern. The crew will imme-diately know if the ship is in danger of sinking, capsizing, or beingover-stressed. In most middle sized spills, this will not be the case;but, if they are in danger of losing the ship, the crew needs to knowright away.
3. It’s a spill reduction tool. In order to properly compute the equilibriumdraft, trim and heel for a damaged tanker, you must compute howmuch cargo is lost from the damaged tanks, and the extent of seawaterflooding in all the damaged compartments. In other words, do allthe hydrostatic balance calculations for each damaged tank, both thehydrostatic outflow/inflow and the exchange flow, properly accountingfor the change in draft, trim, and heel as a result of the outflow and
26

flooding.And this bring us to the neat part. As soon as the crew determines that
they are not in danger of losing the ship, they can start trying out possibleways to minimize spillage. If the damage is low on the hull, as is often thecase, you want to get the damaged area as deep into the water as possible,in other words you want to trim and heel the ship toward the damage.
Figure 8 is a simplified screen shot of Mate for a typical full load depar-ture condition for a double hull ULCC. Mate is in Normal mode and thescreen is full with the usual mostly commercially oriented information, onerow per tank. The cargo consists of a single parcel whose density is 0.8502.All cargo tanks are loaded to 98% full. The ship has a midship draft ofabout 24.4 m, about 1 meter trim aft, and a very slight heel to port. Figure9 shows a transverse section in way of the number 1 tanks, looking aft. Thelocal draft at this section is about 24 m. Life is good.
Then disaster. The empty forward port ballast tank, 1B P, is damagedfrom the baseline up the side 10 meters, and the damage extends well into thefully loaded 1P cargo tank. The internal damage is such that 1B P and theadjoining 1P cargo tank are effectively a single tank. The Chief Officer flipsto Damage mode with a single click, and enters the location of the damagein 1B P. He “groups” 1P with 1B P. And rebalances the ship. Figure 10shows the CTX Mate Mainscreen at this point. Many of the commerciallyimportant columns are gone, replaced by columns dealing with the damageand spillage.24 The damage extent in 1B P is in the six rightmost columnsin the 1B P row. The combination of 1P with 1B P was done by putting1B P into 1P’s GROUP column.
Already Mate has told us a great deal. With this damage, if the crew doesnothing, the ship will end up with a draft at the FP of 25.5 m, a trim of 1.4 mby the bow and a heel of 2.7 degrees to port. The maximum bending momentand shear force are only 50% of the allowables. So structural strength isprobably OK. The metacentric height after flooding is a robust 8.6 m, sostability is not a problem. The ship’s low point will be 26.6 m below sealevel, so as long as we have 30 m or more water depth, we can concentrateon reducing spillage.25
Figure 11 shows the equilibrium situation in way of the damage in 1B Pif the crew does nothing. The red box shows the extent of the damage asentered by the crew. The flooding will trim the ship by the bow and listher to port, pushing the top of the damage 3 meters deeper into the waterthan it was in the intact situation. This will reduce the spillage markedlyfrom what would have occured if the ship has somehow remained at the
24 Cargo volumes in barrels (the reprehensible commercial practice) are now displayedin cubic meters.
25 Mate is careful to distinguish between draft and depth. Draft is measured in adirection parallel to the ship’s aft perpendicular. Depth is measured in the direction ofgravity. If the ship has large trim and heel, draft can be much larger than depth.
27

pre-damage numbers. Of course, we need to get the ship into deep enoughwater quickly, so that it can flood without re-grounding.
Despite the favorable trim and list and the fact that the wing ballasttank has captured some 7,000 cubic meters of oil, if the crew does nothing,the ship will still lose 1,500 cubic meters of oil to the sea, all by Exchangeloss. After flooding, the top of the damage in 1B P will be 16.7 m belowsea level. There will be a column of oil in the combined 1P/1B P almost 20m high above the top of the damage. But the volume of this column is lessthan the 40,316 cubic meters that was originally in the tank, so we lose amillion and a half liters of oil, a major oil spill.
However, our CTX Mate equipped crew is on the ball. They realizethe need to trim and heel the ship further in the direction of the damage.One obvious possibility is to ballast 2B P. So the Chief Officer asks Matewhat will happen if they do that, which takes a total of about 5 keystrokes.Figure 12 shows the Mate results. Filling 2B P increases the trim by about3 meters and the heel by about 5 degrees. Bending moment and shear forceare still fairly low, despite the fact that the deadweight is well above normallimits. Stability has actually improved. New hull low point is 30.6 m belowsea level, fine if we have enough water.
Figure 13 is a better view of the equilibrium with 2B P 98% full. Thenew top of the damage is 21.5 m below sea level, the total height of theliquid column in 1P/1B P above the top of the damage is nearly 25 meters,enough to not only hold all the oil that was in 1P but to put the Live Bottom4 meters above the top of the damage. The crew can turn a 1500 cubic
meter spill into no spill, provided they can trim and heel the ship
quickly enough.26
How much of this reduction they will actually achieve will be determinedby how rapidly they can ballast the ship relative to the outflow rate. Butif the size of the hole(s) is not too large and they react quickly, they willget most of this reduction. In this case, the fact that they only have to dealwith exchange flow will be a big help. 27
I repeat all the crew had to do to get all this information is to enter
26 Figure 13 makes another point. Hydrostatic balance has almost completely filled1B P. If the crew were to list the ship further, or the oil column were taller, oil would beforced out the ballast tank vents. You can go too far.
27 If you are really with me, you are asking yourself how can ballasting down affectexchange flow. There are two ways. First, remember that hydrostatic flow takes placebefore exchange flow (more or less). Ballasting down can increase the hydrostatic inflowpushing a portion of the oil in the tank that was below the top of the damage above thetop of the damage where it is no longer subject to exchange flow. Second, trim and heelcan lower the volume of the tank that is below the top of the damage. You can see bytaking the bottom picture in Figure 3 and rotating it clockwise. Put a ruler across thesketch at the top point of the damage, but keep the ruler level (un-rotated). Note thatthe area below the ruler is a triangle (or at least a trapezoid) which is smaller than theoriginal rectangle. In Figure 13, this is happening in both the transverse and longitudinaldirections.
28

the six numbers in the rightmost columns in Figure 12 (the location of thedamage), enter a new group code for 1P, and click on REDO. And thenenter one number (%FULL for 2B P) and click on REDO.28
This little vignette hints at the fourth role of a program like CTX Mate:a training tool. Most crews, owners, and responders are unaware of thepower of properly trimming and listing the ship. The calculations are fartoo tedious to do by hand, so nobody does them. Whenever I show some-thing like Figures 10 and 12 to even experienced tankermen or governmentalauthorities, I invariably get a “Wow!” or at least an “I don’t believe it!”.By running through a series of drills with a program like CTX Mate, every-body learns about the true power of hydrostatic balance in a very concretecontext. For the first time, they really understand that in many cases bysimply trimming and listing the ship, they can cut the spillage in half ormore, or in some cases eliminate it entirely.29
28 In the real world, the Chief Officer should also look at flooding FP and maybe 3B P.Speed is of the essence and, if he can use gravity to flood three tanks, he will get to thezero spill drafts and heel sooner. But as noted in the second last footnote, he may notwant to ballast all these tanks fully. Go the point where the Live Bottom is comfortablyabove the top of the damage, and then stop.
29 The column labeled HBL shows how far each tank would have to be drawn downin order to become hydrostatically balanced. A negative number means that the tank isalready under-balanced. These tanks cannot be leaking from a bottom pit. This can bevery useful information when a ship has a bottom leak but doesn’t know which tank it is.
29

Figure 8: Pre-damage, full load departure condition
CTX MATE 0.48.0-BASE. Ship is DEMO ULCC. Load pattern is lf_al98dep. Last modified at 2006-12-16T15-43-42
USING API/SG .01/.0001, F/C .1/.01, VCF_4, O_INN/WEDGE, AT SEA ALLOWABLES,
all tanks 98 pct full arab lite
based on /tfs/u/NLOAD/1.92/LF.al98dep. but NLOAD did not have 5 ton crew wt
TANK |O|PT|CGO| API | TEMP| SG |ULLAGE|INNAGE|%FULL | VOLUME | WEIGHT |FREEWTR|NONLIQ| GSV | LCG | TCG_xs | VCG_xs | MOI_m4 | WL_ze | GROUP |
1C |P|UL|AL| 34.56| 60.0|0.8502| 1.404|31.440| 98.00| 253583| 34276.8| 0.0| 0.0| 253583| 135.185| 0.004| 19.004| 60247| 10.617|1C |
2C |P|UL|AL| 34.56| 60.0|0.8502| 1.404|31.445| 98.00| 299519| 40485.9| 0.0| 0.0| 299519| 80.077| 0.004| 18.995| 85977| 10.462|2C |
3C |P|UL|AL| 34.56| 60.0|0.8502| 1.397|31.445| 98.00| 299518| 40485.9| 0.0| 0.0| 299518| 21.377| 0.004| 18.995| 85977| 10.316|3C |
4C |P|UL|AL| 34.56| 60.0|0.8502| 1.411|31.445| 98.00| 299518| 40485.9| 0.0| 0.0| 299518| -37.323| 0.004| 18.995| 85977| 10.170|4C |
5C |P|UL|AL| 34.56| 60.0|0.8502| 1.405|31.450| 98.00| 271983| 36764.0| 0.0| 0.0| 271983| -93.821| 0.004| 19.001| 68842| 10.043|5C |
1P |P|UL|AL| 34.56| 60.0|0.8502| 1.447|30.953| 98.00| 137464| 18581.0| 0.0| 0.0| 137464| 134.669| 18.053| 19.294| 19428| 10.081|1P |
1S |P|UL|AL| 34.56| 60.0|0.8502| 1.436|30.957| 98.00| 137464| 18581.0| 0.0| 0.0| 137464| 134.678| -18.048| 19.294| 20653| 10.168|1S |
2F_P |P|UL|AL| 34.56| 60.0|0.8502| 1.652|30.745| 98.00| 93801| 12679.1| 0.0| 0.0| 93801| 94.769| 21.348| 19.058| 12230| 9.795|2F_P |
2F_S |P|UL|AL| 34.56| 60.0|0.8502| 1.537|30.766| 98.00| 93801| 12679.1| 0.0| 0.0| 93801| 94.769| -21.344| 19.058| 12230| 9.899|2F_S |
2A_P |P|UL|AL| 34.56| 60.0|0.8502| 1.710|30.740| 98.00| 93801| 12679.1| 0.0| 0.0| 93801| 65.419| 21.348| 19.058| 12230| 9.722|2A_P |
2A_S |P|UL|AL| 34.56| 60.0|0.8502| 1.620|30.768| 98.00| 93801| 12679.1| 0.0| 0.0| 93801| 65.419| -21.344| 19.058| 12230| 9.827|2A_S |
3P |P|UL|AL| 34.56| 60.0|0.8502| 1.627|30.763| 98.00| 187601| 25358.0| 0.0| 0.0| 187601| 21.376| 21.348| 19.058| 24460| 9.613|3P |
3S |P|UL|AL| 34.56| 60.0|0.8502| 1.615|30.788| 98.00| 187601| 25358.0| 0.0| 0.0| 187601| 21.376| -21.344| 19.058| 24460| 9.717|3S |
4F_P |P|UL|AL| 34.56| 60.0|0.8502| 1.644|30.745| 98.00| 93801| 12679.1| 0.0| 0.0| 93801| -22.631| 21.348| 19.058| 12230| 9.503|4F_P |
4F_S |P|UL|AL| 34.56| 60.0|0.8502| 1.618|30.770| 98.00| 93801| 12679.1| 0.0| 0.0| 93801| -22.631| -21.344| 19.058| 12230| 9.608|4F_S |
4A_P |P|UL|AL| 34.56| 60.0|0.8502| 1.646|30.741| 98.00| 93801| 12679.1| 0.0| 0.0| 93801| -51.981| 21.348| 19.058| 12230| 9.430|4A_P |
4A_S |P|UL|AL| 34.56| 60.0|0.8502| 1.627|30.766| 98.00| 93801| 12679.1| 0.0| 0.0| 93801| -51.981| -21.344| 19.058| 12230| 9.535|4A_S |
5P |P|UL|AL| 34.56| 60.0|0.8502| 1.620|30.827| 98.00| 130263| 17607.6| 0.0| 0.0| 130263| -88.858| 20.428| 20.704| 20813| 9.437|5P |
5S |P|UL|AL| 34.56| 60.0|0.8502| 1.582|30.856| 98.00| 130263| 17607.6| 0.0| 0.0| 130263| -88.859| -20.423| 20.704| 20813| 9.540|5S |
SLOP_P |P|UL|AL| 34.56| 60.0|0.8502| 1.526|31.097| 98.00| 41112| 5557.1| 0.0| 0.0| 41112|-121.718| 16.248| 23.315| 8581| 9.655|SLOP_P |
SLOP_S |P|UL|AL| 34.56| 60.0|0.8502| 1.483|31.144| 98.00| 40061| 5415.0| 0.0| 0.0| 40061|-121.550| -16.279| 23.362| 9580| 9.750|SLOP_S |
FP |E|UL|sw|1.0250| | |35.689|-0.063| 0.00| 0.0| 0.0| 0.0| 0.0| | | | | | -24.015|FP |
1B_P |E|UL|sw|1.0250| | |35.496| 0.005| 0.00| 0.0| 0.0| 0.0| 0.0| | | | | | -24.218|1B_P |
1B_S |E|UL|sw|1.0250| | |35.583|-0.082| 0.00| 0.0| 0.0| 0.0| 0.0| | | | | | -24.155|1B_S |
2B_P |E|UL|sw|1.0250| | |35.514|-0.014| 0.00| 0.0| 0.0| 0.0| 0.0| | | | | | -24.377|2B_P |
2B_S |E|UL|sw|1.0250| | |35.588|-0.088| 0.00| 0.0| 0.0| 0.0| 0.0| | | | | | -24.301|2B_S |
1FO_P |P|UL|f1|0.9876|15.00|0.9876| 2.473|23.649| 90.92| 3458.2| 3415.4| 0.0| 0.0| 3458.2|-137.992| 21.577| 24.982| 5944| 8.544|1FO_P |
1FO_S |P|UL|f1|0.9876|15.00|0.9876| 2.689|23.342| 90.92| 4150.8| 4099.3| 0.0| 0.0| 4150.8|-137.804| -20.718| 24.292| 5944| 8.301|1FO_S |
...... more bfo, do, etc tanks, point loads .....
FW_S |E|UL|sw|1.0250| | |10.438|-0.038| 0.00| 0.0| 0.0| 0.0| 0.0| | | | | | 0.761|FW_S |
CREW | | | | | | | | | | | 5.0| | | |-148.000| 0.000| 40.000| |
DWT 439411 2150 LT Sdwt DRAFTMID 24.427 AL 3166356 TOV 3166356 GSV 427996 MT BLINDZONE 196 Pitch RG 86.5 LOWxs-163.150 Draftmarks
CARGO 427996 TPC 230.3 DRAFT AP 24.882 MANI_HT_S 11.204 Roll RG 19.3 LOWys 0.000 Aft-P 24.890
BLLST 0 MTC 5959 DRAFT FP 23.972 MANI_HT_P 11.062 LCB 10.950 LCG 10.966 Aft-S 24.799
BFO 11409 WETTED 37238 TRIM -0.910 DISPLCMENT 507333 TCB 0.038 TCG 0.022 Mid-P 24.531
OTHER 5 SEA_SG 1.0250 HEEL -0.139 MAX SHEAR -10917 VCB 12.765 VCG 19.155 Mid-S 24.366
MAX %SHEAR -47.8% at FR040 PROP IMM 13.114 MAX BEND -830654 LOW PT -24.84 DEPTH 100.00 Fwd-P 24.054
MAX %BEND -76.2% at FR087 GM corr 8.168 MAX HOG -0.233 MIN FLOOD 7.11@ 3FOP_VENT Fwd-S 23.970

Figure 9: Section in way of 1S/1C/1P, pre-damage
-35-34-33-32-31-30-29-28-27-26-25-24-23-22-21-20-19-18-17-16-15-14-13-12-11-10-9 -8 -7 -6 -5 -4 -3 -2 -1 0 1 2 3 4 5 6 7 8 9 1011121314151617181920212223242526272829303132333435-30-29-28-27-26-25-24-23-22-21-20-19-18-17-16-15-14-13-12-11-10-9-8-7-6-5-4-3-2-10123456789
101112131415
DEMO ULCCSection at 327.669 looking aft
Draft FP=23.972
Draft AP=24.882Heel(degrees)=-0.14

Figure 10: Damage 1B P/1P up 10 m. Crew does nothing
CTX MATE 0.48.0-BASE. Ship is DEMO ULCC. Load pattern is lf_al98_dam1P. Last modified at 2006-12-16T16-58-11
USING API/SG .01/.0001, F/C .1/.01, VCF_4, O_INN/WEDGE, AT SEA ALLOWABLES,
lf_al98dep with 1B_P damaged from 0 to 10 m, 1P grouped with 1B_P
19 m col of oil in 1B_P/1P abv damage, still lose 1500 m3 exchange loss
TANK |O|PT|CGO| API | TEMP| SG |ULLAGE|INNAGE|%FULL | VOLUME | WEIGHT |IGS_mm| HBL_m |TANK_WL|OIL/SW |HYDROOUT|EXCHGOUT|KEY_ze | GROUP |high_xs|high_ys|high_zs|low_xs |low_ys |low_zs |
1C |P|UL|AL| 34.56|15.56|0.8502| 1.103|31.776| 98.00| 40316.4| 34276.8| 510| 4.698| 9.353| | | | |1C | | | | | | |
2C |P|UL|AL| 34.56|15.56|0.8502| 1.158|31.727| 98.00| 47619.7| 40485.9| 510| 4.915| 9.547| | | | |2C | | | | | | |
3C |P|UL|AL| 34.56|15.56|0.8502| 1.150|31.728| 98.00| 47619.6| 40485.9| 510| 5.182| 9.768| | | | |3C | | | | | | |
4C |P|UL|AL| 34.56|15.56|0.8502| 1.165|31.727| 98.00| 47619.6| 40485.9| 510| 5.448| 9.989| | | | |4C | | | | | | |
5C |P|UL|AL| 34.56|15.56|0.8502| 1.135|31.755| 98.00| 43241.9| 36764.0| 510| 5.719| 10.215| | | | |5C | | | | | | |
1P |G|UL|AL| 34.56|15.56| | | | 98.00| | | | | | | | | |1B_P | | | | | | |
1S |P|UL|AL| 34.56|15.56|0.8502| 1.540|30.888| 98.00| 21855.0| 18581.0| 510| 5.194| 9.700| | | | |1S | | | | | | |
2F_P |P|UL|AL| 34.56|15.56|0.8502| 1.908|30.524| 98.00| 14913.1| 12679.1| 510| 3.104| 7.854| | | | |2F_P | | | | | | |
2F_S |P|UL|AL| 34.56|15.56|0.8502| 1.436|30.901| 98.00| 14913.1| 12679.1| 510| 5.445| 9.830| | | | |2F_S | | | | | | |
2A_P |P|UL|AL| 34.56|15.56|0.8502| 2.001|30.484| 98.00| 14913.1| 12679.1| 510| 3.238| 7.965| | | | |2A_P | | | | | | |
2A_S |P|UL|AL| 34.56|15.56|0.8502| 1.429|30.993| 98.00| 14913.1| 12679.1| 510| 5.578| 9.940| | | | |2A_S | | | | | | |
3P |P|UL|AL| 34.56|15.56|0.8502| 1.926|30.498| 98.00| 29826.2| 25358.0| 510| 3.427| 8.132| | | | |3P | | | | | | |
3S |P|UL|AL| 34.56|15.56|0.8502| 1.476|30.962| 98.00| 29826.2| 25358.0| 510| 5.766| 10.106| | | | |3S | | | | | | |
4F_P |P|UL|AL| 34.56|15.56|0.8502| 1.900|30.524| 98.00| 14913.1| 12679.1| 510| 3.637| 8.296| | | | |4F_P | | | | | | |
4F_S |P|UL|AL| 34.56|15.56|0.8502| 1.434|30.989| 98.00| 14913.1| 12679.1| 510| 5.978| 10.272| | | | |4F_S | | | | | | |
4A_P |P|UL|AL| 34.56|15.56|0.8502| 1.892|30.530| 98.00| 14913.1| 12679.1| 510| 3.771| 8.407| | | | |4A_P | | | | | | |
4A_S |P|UL|AL| 34.56|15.56|0.8502| 1.433|30.995| 98.00| 14913.1| 12679.1| 510| 6.111| 10.382| | | | |4A_S | | | | | | |
5P |P|UL|AL| 34.56|15.56|0.8502| 1.837|30.645| 98.00| 20710.1| 17607.6| 510| 4.076| 8.689| | | | |5P | | | | | | |
5S |P|UL|AL| 34.56|15.56|0.8502| 1.323|31.150| 98.00| 20710.1| 17607.6| 510| 6.368| 10.617| | | | |5S | | | | | | |
SLOP_P |P|UL|AL| 34.56|15.56|0.8502| 1.730|30.927| 98.00| 6536.3| 5557.1| 510| 4.846| 9.298| | | | |SLOP_P | | | | | | |
SLOP_S |P|UL|AL| 34.56|15.56|0.8502| 1.100|31.562| 98.00| 6369.1| 5415.0| 510| 6.635| 10.896| | | | |SLOP_S | | | | | | |
FP |E|UL|sw|1.0250| | |35.822|-0.157| 0.00| 0.0| 0.0| 510|-25.564|-25.564| | | | |FP | | | | | | |
1B_P |D|UL|sw|1.0250| |0.9090| 5.953|29.585| 0.00| 30664.9| 27874.6| 510| 0.000| 2.833|-16.698| 0.0| 1507.0|-16.698|1B_P |300.000| 31.000| 10.000|330.000| 20.000| 0.000|
1B_S |E|UL|sw|1.0250| | |37.110|-1.572| 0.00| 0.0| 0.0| 510|-25.446|-25.446| | | | |1B_S | | | | | | |
2B_P |E|UL|sw|1.0250| | |35.562|-0.024| 0.00| 0.0| 0.0| 510|-26.561|-26.561| | | | |2B_P | | | | | | |
2B_S |E|UL|sw|1.0250| | |37.104|-1.565| 0.00| 0.0| 0.0| 510|-25.225|-25.225| | | | |2B_S | | | | | | |
1FO_P |P|UL|f1|0.9876|15.00|0.9876| 2.708|23.443| 90.92| 3458.2| 3415.4| 0| 7.447| 8.036| | | | |1FO_P | | | | | | |
...... more BFO, DO, etc tanks, point loads .......
FW_S |E|UL|sw|1.0250| | |10.996|-0.585| 0.00| 0.0| 0.0| 0| 1.718| 1.718| | | | |FW_S | | | | | | |
CREW | | | | | | | | | | | 5.0| | | | | | | | | 35.000| 0.000| 40.000| | | |
DWT 448705 7144 MT Sdwt DRAFTMID 24.839 AL 481555.4 TOV 481555.4 GSV 409415 MT HYDROLOSS 0 GRNDxs 0.000 LOWxs 80.100
CARGO 409415 TPC 230.2 DRAFT AP 24.150 EXCHGLOSS 1507 GRNDys 0.000 LOWys 31.300
BLLST 27875 MTC 5942 DRAFT FP 25.529 GRND FORCE -0 LCB 13.347 LCG 13.321
BFO 11409 WETTED 37537 TRIM 1.380 DISPLCMENT 516627 TCB 0.710 TCG 0.439
OTHER 5 SEA_SG 1.0250 HEEL -2.652 MAX SHEAR -9415 VCB 12.996 VCG 18.859
MAX %SHEAR 47.0% at FR115 PROP IMM 12.412 MAX BEND -564802 LOW_PT -26.57 DEPTH 100.00
MAX %BEND -57.2% at FR110 GM corr 8.614 MAX HOG -0.165 MIN FLOOD 7.00@ 2FOP_VENT

Figure 11: Damage 1B P/1P up 10m. Crew does nothing
-35-34-33-32-31-30-29-28-27-26-25-24-23-22-21-20-19-18-17-16-15-14-13-12-11-10-9 -8 -7 -6 -5 -4 -3 -2 -1 0 1 2 3 4 5 6 7 8 9 1011121314151617181920212223242526272829303132333435-30-29-28-27-26-25-24-23-22-21-20-19-18-17-16-15-14-13-12-11-10-9-8-7-6-5-4-3-2-10123456789
101112131415
DEMO ULCCSection at 327.669 looking aft
Draft FP=25.529
Draft AP=24.150Heel(degrees)=-2.65
Top of oil 1B P = 2.833
Live Bottom 1B P = -16.698Damage top 1B P= -16.698
Hydrostatic loss (m3)= 0.0
Exchange loss (m3)= 1507.0

Figure 12: Damage 1B P/1P up 10 m. Crew ballasts 2B P 98%.
CTX MATE 0.48.0-BASE. Ship is DEMO ULCC. Load pattern is lf_al98_dam1P_fl2B_P. Last modified at 2006-12-07T15-58-23
USING API/SG .01/.0001, F/C .1/.01, VCF_4, O_INN/WEDGE, AT SEA ALLOWABLES,
lf_al98dep with 1B_P damaged from 0 to 10 m, 1P grouped with 1B_P, fill 2B_P
19 m col of oil in 1B_P/1P abv damage, zero spill, 4 m seal
TANK |O|PT|CGO| API | TEMP| SG |ULLAGE|INNAGE|%FULL | VOLUME | WEIGHT |IGS_mm| HBL_m |TANK_WL|OIL/SW |HYDROOUT|EXCHGOUT|KEY_ze | GROUP |high_xs|high_ys|high_zs|low_xs |low_ys |low_zs |
1C |P|UL|AL| 34.56|15.56|0.8502| 0.259|32.888| 98.00| 40316.4| 34276.8| 510| 2.282| 7.543| | | | |1C | | | | | | |
2C |P|UL|AL| 34.56|15.56|0.8502| 0.322|32.831| 98.00| 47619.7| 40485.9| 510| 3.089| 8.277| | | | |2C | | | | | | |
3C |P|UL|AL| 34.56|15.56|0.8502| 0.311|32.835| 98.00| 47619.6| 40485.9| 510| 3.956| 8.997| | | | |3C | | | | | | |
4C |P|UL|AL| 34.56|15.56|0.8502| 0.328|32.832| 98.00| 47619.6| 40485.9| 510| 4.823| 9.715| | | | |4C | | | | | | |
5C |P|UL|AL| 34.56|15.56|0.8502| 0.305|32.854| 98.00| 43241.9| 36764.0| 510| 5.634| 10.379| | | | |5C | | | | | | |
1P |G|UL|AL| 34.56|15.56| | | | 98.00| | | | | | | | | |1B_P | | | | | | |
1S |P|UL|AL| 34.56|15.56|0.8502| 1.598|31.094| 98.00| 21855.0| 18581.0| 510| 4.523| 9.360| | | | |1S | | | | | | |
2F_P |P|UL|AL| 34.56|15.56|0.8502| 2.201|30.495| 98.00| 14913.1| 12679.1| 510| -1.039| 4.491| | | | |2F_P | | | | | | |
2F_S |P|UL|AL| 34.56|15.56|0.8502| 1.186|31.415| 98.00| 14913.1| 12679.1| 510| 5.593| 10.062| | | | |2F_S | | | | | | |
2A_P |P|UL|AL| 34.56|15.56|0.8502| 2.369|30.382| 98.00| 14913.1| 12679.1| 510| -0.605| 4.851| | | | |2A_P | | | | | | |
2A_S |P|UL|AL| 34.56|15.56|0.8502| 1.001|31.685| 98.00| 14913.1| 12679.1| 510| 6.027| 10.422| | | | |2A_S | | | | | | |
3P |P|UL|AL| 34.56|15.56|0.8502| 2.273|30.416| 98.00| 29826.2| 25358.0| 510| 0.016| 5.398| | | | |3P | | | | | | |
3S |P|UL|AL| 34.56|15.56|0.8502| 1.108|31.595| 98.00| 29826.2| 25358.0| 510| 6.650| 10.971| | | | |3S | | | | | | |
4F_P |P|UL|AL| 34.56|15.56|0.8502| 2.194|30.495| 98.00| 14913.1| 12679.1| 510| 0.695| 5.929| | | | |4F_P | | | | | | |
4F_S |P|UL|AL| 34.56|15.56|0.8502| 1.015|31.673| 98.00| 14913.1| 12679.1| 510| 7.327| 11.500| | | | |4F_S | | | | | | |
4A_P |P|UL|AL| 34.56|15.56|0.8502| 2.172|30.515| 98.00| 14913.1| 12679.1| 510| 1.128| 6.288| | | | |4A_P | | | | | | |
4A_S |P|UL|AL| 34.56|15.56|0.8502| 1.000|31.693| 98.00| 14913.1| 12679.1| 510| 7.760| 11.859| | | | |4A_S | | | | | | |
5P |P|UL|AL| 34.56|15.56|0.8502| 2.072|30.675| 98.00| 20710.1| 17607.6| 510| 1.892| 6.978| | | | |5P | | | | | | |
5S |P|UL|AL| 34.56|15.56|0.8502| 0.767|31.971| 98.00| 20710.1| 17607.6| 510| 8.387| 12.412| | | | |5S | | | | | | |
SLOP_P |P|UL|AL| 34.56|15.56|0.8502| 1.948|30.976| 98.00| 6536.3| 5557.1| 510| 3.653| 8.257| | | | |SLOP_P | | | | | | |
SLOP_S |P|UL|AL| 34.56|15.56|0.8502| 0.235|32.694| 98.00| 6369.1| 5415.0| 510| 8.734| 12.777| | | | |SLOP_S | | | | | | |
FP |E|UL|sw|1.0250| | |36.031|-0.076| 0.00| 0.0| 0.0| 510|-27.968|-27.968| | | | |FP | | | | | | |
1B_P |D|UL|sw|1.0250| |0.9172| 0.664|35.164| 0.00| 35454.0| 32519.9| 510| 0.000| 3.536|-17.198| 0.0| 0.0|-21.472|1B_P |300.000| 33.700| 10.000|300.000| 33.700| 0.000|
1B_S |E|UL|sw|1.0250| | |40.042|-4.213| 0.00| 0.0| 0.0| 510|-27.471|-27.471| | | | |1B_S | | | | | | |
2B_P |P|UL|sw|1.0250| |1.0250| 3.083|32.746| 98.00| 13809.8| 14155.0| 510| 1.813| 1.813| | | | |2B_P | | | | | | |
2B_S |E|UL|sw|1.0250| | |40.018|-4.189| 0.00| 0.0| 0.0| 510|-26.752|-26.752| | | | |2B_S | | | | | | |
3B_P |E|UL|sw|1.0250| | |35.614|-0.088| 0.00| 0.0| 0.0| 510|-30.273|-30.273| | | | |3B_P | | | | | | |
3B_S |E|UL|sw|1.0250| | |39.745|-4.219| 0.00| 0.0| 0.0| 510|-26.034|-26.034| | | | |3B_S | | | | | | |
4B_P |E|UL|sw|1.0250| | |34.644| 0.882| 0.00| 0.0| 0.0| 510|-29.554|-29.554| | | | |4B_P | | | | | | |
4B_S |E|UL|sw|1.0250| | |39.475|-3.949| 0.00| 0.0| 0.0| 510|-25.315|-25.315| | | | |4B_S | | | | | | |
5B_P |E|UL|sw|1.0250| | |38.486|-2.607| 0.00| 0.0| 0.0| 510|-27.451|-27.451| | | | |5B_P | | | | | | |
5B_S |E|UL|sw|1.0250| | |36.525|-0.627| 0.00| 0.0| 0.0| 510|-24.596|-24.596| | | | |5B_S | | | | | | |
AP |E|UL|sw|1.0250| | |18.210| 0.151| 0.00| 0.0| 0.0| 510|-10.108|-10.108| | | | |AP | | | | | | |
1FO_P |P|UL|f1|0.9876|15.00|0.9876| 3.171|23.193| 90.92| 3458.2| 3415.4| 0| 5.814| 6.445| | | | |1FO_P | | | | | | |
...................more BFO, DO, etc tanks, point loads ...........
FW_P |E|UL|sw|1.0250| | |10.231| 0.266| 0.00| 0.0| 0.0| 0| -0.583| -0.583| | | | |FW_P | | | | | | |
FW_S |E|UL|sw|1.0250| | |12.072|-1.576| 0.00| 0.0| 0.0| 0| 2.959| 2.959| | | | |FW_S | | | | | | |
CREW | | | | | | | | | | | 5.0| | | | | | | | | 35.000| 0.000| 40.000| | | |
DWT 467505 25944 MT Sdwt DRAFTMID 25.647 AL 481555.4 TOV 481555.4 GSV 409415 MT HYDROLOSS 0 GRNDxs 0.000 LOWxs 80.100
CARGO 409415 TPC 231.6 DRAFT AP 23.386 EXCHGLOSS 0 GRNDys 0.000 LOWys 31.300
BLLST 46675 MTC 5974 DRAFT FP 27.909 GRND FORCE -0 LCB 16.248 LCG 16.188
BFO 11409 WETTED 38155 TRIM 4.524 DISPLCMENT 535427 TCB 2.006 TCG 1.308
OTHER 5 SEA_SG 1.0250 HEEL -7.734 MAX SHEAR -8183 VCB 13.574 VCG 18.711
MAX %SHEAR 51.9% at FR115 PROP IMM 11.614 MAX BEND -577322 LOW_PT -30.61 DEPTH 100.00
MAX %BEND -67.8% at FR108 GM corr 9.537 MAX HOG -0.154 MIN FLOOD 3.75@ 1B_P_VENT

Figure 13: Damage 1P up 10 m. Crew ballasts 2B P
-35-34-33-32-31-30-29-28-27-26-25-24-23-22-21-20-19-18-17-16-15-14-13-12-11-10-9 -8 -7 -6 -5 -4 -3 -2 -1 0 1 2 3 4 5 6 7 8 9 1011121314151617181920212223242526272829303132333435-30-29-28-27-26-25-24-23-22-21-20-19-18-17-16-15-14-13-12-11-10-9-8-7-6-5-4-3-2-10123456789
101112131415
DEMO ULCCSection at 327.669 looking aft
Draft FP=27.909
Draft AP=23.386Heel(degrees)=-7.73
Top of oil 1B P = 3.536
Live Bottom 1B P = -17.198Damage top 1B P= -21.108
Hydrostatic loss (m3)= 0.0
Exchange loss (m3)= 0.0