the phenomenon of dividend announcement on stock abnormal
TRANSCRIPT
Jurnal Manajemen Bisnis Vol. 12 No. 1 (2021)
Article Type: Research Paper
The Phenomenon of Dividend Announcement on Stock Abnormal Return (Case in ASEAN Countries) Ikka Tiaraintan Hariyanto1* and Werner Ria Murhadi2
Abstract Research aims: to examine the existence of stock’s abnormal return after dividend announcement activity. Design/methodology/approach: event study with 1.330 samples of dividend announcement in ASEAN countries during 2018. The research period was 21 days around the dividend announcement’s date. Research findings: this analysis's results agreed with the dividend signaling theory hypotheses, where the increase, decrease, or constant dividends could be an informative aspect for investors. Theoritical contribution/originality: it was shown by the presence of a positive abnormal return between an increase and a constant dividend, while a negative abnormal return between decrease dividends. Practitioner/policy implication: in the ASEAN capital market, it could be concluded that the change of dividend nominal would signal the firm’s prospect. Research limitation/implication: this research used the earliest dividend announcement before revision. Suggestions for further research are to pay attention to announcements of changes in dividend distribution dates and nominal revision, whether they contain information for investors, which will affect stock price movements. Keywords: Abnormal Return; Dividend Announcement; Dividend Signaling Theory
Introduction In capital markets, investors buy shares of a company by expecting maximum profit from these activities. For companies, selling shares to investors can be additional capital in carrying out their business operations by promising rewards to investors in the future. Widoatmodjo (2009: 2) states that the addition of capital through bank credit is limited and can burden corporate finance. It makes the company try to get additional capital through the sale of shares to the public. Investors' character is divided into two, those who avoid risk and those who dare to take the risk (risk-taker). The risk-takers will expect capital gains from stock price movements over a certain period, daily and annually.
AFFILIATION: 1,2 Master of Management, Faculty of Business and Economics, Universitas Surabaya, East Java, Indonesia *CORRESPONDENCE: [email protected] THIS ARTICLE IS AVAILABLE IN: http://journal.umy.ac.id/index.php/mb
DOI: 10.18196/mabis.v12i1.9001 CITATION: Hariyanto, I.K., & Murhadi, W.R. (2021). The phenomenon of dividend announcement on stock abnormal return (Case in ASEAN countries). Jurnal Manajemen Bisnis, 12(1), 1-18. ARTICLE HISTORY Received: 11 June 2020 Revised: 21 Aug 2020 02 Sep 2020 Accepted: 05 Sep 2020
Hariyanto & Murhadi The Phenomenon of Dividend Announcement on Stock Abnormal Return …
Jurnal Manajemen Bisnis, 2021 | 2
These capital gain speculators try to get specific information on company activities that might increase or decrease stock prices. Thus, investors can decide the right time to sell shares to obtain a maximum stock return. The investor’s decision to buy, hold, and sell a stock depends on the consideration of information from outside and inside the company. Dividend announcement is one of the indicators considered in decision making. Dasilas and Leventis (2011) revealed that company managers have more information about the company's financial position than investors, so investors will use dividend announcements as signaling information on the company's future income. Based on Weng, Chin, Yee, Ann, and Leng (2010) research in Malaysia and Singapore, the results showed that abnormal returns were significant to the dividend announcement. The same results were also revealed by Suwanna (2012) in Thailand, Laabs and Bacon (2013) in America, Kadioglu, Telceken, and Ocal (2015) in Turkey, Ngoc and Cuong (2016) in Vietnam, and Damayanti and Pratama (2018) in Indonesia. Meanwhile, research conducted by Md. Lazan, Abidin, and Hassan (2011) in Malaysia and Sari and Lestari (2015) in Indonesia showed different results that dividend announcements did not contain certain information that could trigger changes in stock prices. This study aims to re-examine the dividend signaling theory and how it relates to changes in stock prices. Therefore, the results will answer the problem formulation: (1) whether the dividend announcement during the 2018 period in ASEAN member countries has information content for investors, and (2) how the impact of increasing, decreasing, and constant dividend announcements on abnormal returns during the 21-day observation period. This study differs from previous studies, which tested stock prices' reaction to dividend announcements using Abnormal Return (AR) in several ASEAN member countries, including Indonesia, Thailand, Singapore, Malaysia, Philippine, and Vietnam.
Literature Review and Hypotheses Development A dividend is part of the company's profits distributed to shareholders as a right for them. According to Jogiyanto (2003: 74), not all profits are distributed because some profits will be reinvested in the company. Retained earnings are a source of internal company funds, while the others will be distributed in the form of a dividend. Based on a stock valuation model with constant growth, if dividend payments increase, the allocation of funds available for reinvestment decreases. It will cause a decline in the expected growth rate and then tends to reduce share prices. According to Jogiyanto (2009: 500), an efficient market in terms of information is called information market efficiency, while an efficient market in terms of the way in making decisions based on available information is known as market efficiency by decision. The concern in efficient market measurement is the relationship between the price of a security and the available information.

Hariyanto & Murhadi The Phenomenon of Dividend Announcement on Stock Abnormal Return …
Jurnal Manajemen Bisnis, 2021 | 3
Fama (1970) in Jogiyanto (2009: 500) presents three primary forms of market efficiency: (1) Market efficiency in a weak form, where the price of a security is fully reflected by past information, and this value cannot be used to predict current prices. (2) Market efficiency in a semi-strong form, where all published information fully reflects a security price. Thus, in this market, no investor will get an abnormal return in the long term. (3) Strong market efficiency is where a security price is fully reflected in all available information, including private information. In this case, no investor will get an abnormal return. Dividends can be an essentialsignal for the market by considering the dividend policy adopted by a company (Amin, Dutta, Saadi, & Vora, 2015). Weston and Copeland (1997: 145) stated that managers, as insiders who have monopolistic information aboutthe company's cash flow, will choose to create clear signals about the company's prospects if they have the right incentives. Ross (1977) in Weston and Copeland (1997: 145) proved that the increase in dividend paymentcouldlead to being unbeatable signals on the market that the company's prospects have progressed. If the dividend announcement provides positive information, it is possible that shareholders will get a positive abnormal return, and vice versa (Kurniasih, Siregar, Sembel, & Achsani, 2011). There are market conditions where certain parties are allowed to know the company's internal information before reaching other investors. It proves the asymmetrical distribution of information. Not symmetrical information or asymmetric information is private information only owned by investors who get that information (Jogiyanto, 2009: 516). Meanwhile, Kadioglu et al. (2015), supported by several previous research results, had different arguments that company managers might have more information about the company's prospects, creating asymmetrical information between managers and shareholders. Sari and Lestari (2015) revealed that in the phenomenon of asymmetric information, investors and managers are considered to have different information about the company's real condition. The clientele effect is a condition illustrating that there are groups of shareholders who have different preferences for dividend policies that have been determined by a company. Investors will be divided into several groups depending on their preferred investment management based on the company's dividend distribution ratio (Kawano, 2014). Some shareholders prefer sharing company profits in the form of dividends compared to using profits for the strategic interests of the company's future (Kadioglu et al., 2015). According to Samsul (2006: 276), abnormal returns occur every day on each stock type, which is the difference between the actual return and expected return calculated daily. Thus, observations of these abnormal returns can be seen at the highest and lowest abnormal returns values that occur during the observation period (window period) to determine the stock price reaction trend due to an event. Average abnormal return results from calculating the average of several abnormal returns of several types of shares on the same day. Samsul (2006: 276) revealed that AAR could

Hariyanto & Murhadi The Phenomenon of Dividend Announcement on Stock Abnormal Return …
Jurnal Manajemen Bisnis, 2021 | 4
show the strongest reaction, both positive and negative, of all types of shares on specific days during the window period. Cumulative average abnormal return is the cumulative calculation result of AAR within a period according to the number of days needed in the observation. From the daily CAAR chart, the tendency to increase or decrease during the window period can be known so that the positive or negative impact of an event on the overall stock can be examined (Samsul, 2006: 277). Based on the problems discussed above, the hypotheses that can be formulated by researchers are as follows: H1: It is estimated that there is an average abnormal return around the dividend announcement date. H2: It is estimated that there is a cumulative average abnormal return around the dividend announcement date. H3: It is estimated that there is a difference in the average abnormal return before and after the dividend announcements. H4: It is estimated that there is a difference in cumulative average abnormal returns before and after dividend announcements.
Research Methods
This research type is quantitative positivism, which is testing the causal relationship of observations made. This research is descriptive to determine the impact of dividend payment announcements on stock prices and how the reaction compared between before and after the announcement. Besides, this research is included in the event study that observed stock prices' movement around the dividend payment announcements. Variables and Operational Definitions Abnormal Return (AR) Abnormal Return (AR) is the difference between the actual return and the expected return. Brown and Warner (1985) in Felimban, Floros, and Nguyen (2018) calculated the AR with the estimated market-adjusted model as follows:
: abnormal return on share i in day t
: actual return on share i in day t
: market return in day t
Hariyanto & Murhadi The Phenomenon of Dividend Announcement on Stock Abnormal Return …
Jurnal Manajemen Bisnis, 2021 | 5
Average Abnormal Return (AAR) The average daily abnormal returns for all company sectors in various countries were as the research object. Felimban et al. (2018) used the formula for AAR as follows:
: average abnormal return in day t, p (DI) for dividend-increasing firms, p (DD)
for dividend-decreasing firms, and p (DC) for constant dividend firms.
: total dividend announcement
: day around the announcement
: company which is issuing the dividend announcement
Cumulative Average Abnormal Return (CAAR) Felimban et al. (2018) described CAAR as the total sum of the company's average abnormal returns (AAR) during the observation period, which is ten days before and ten days after dividend announcement, for all sectors in each classification of dividend (increase, decrease, and constant). The formula used by Felimban et al. (2018) is as follows:
: the total sum of average abnormal return on share i
: window period started at day t and ended at day k
: average abnormal return in day t
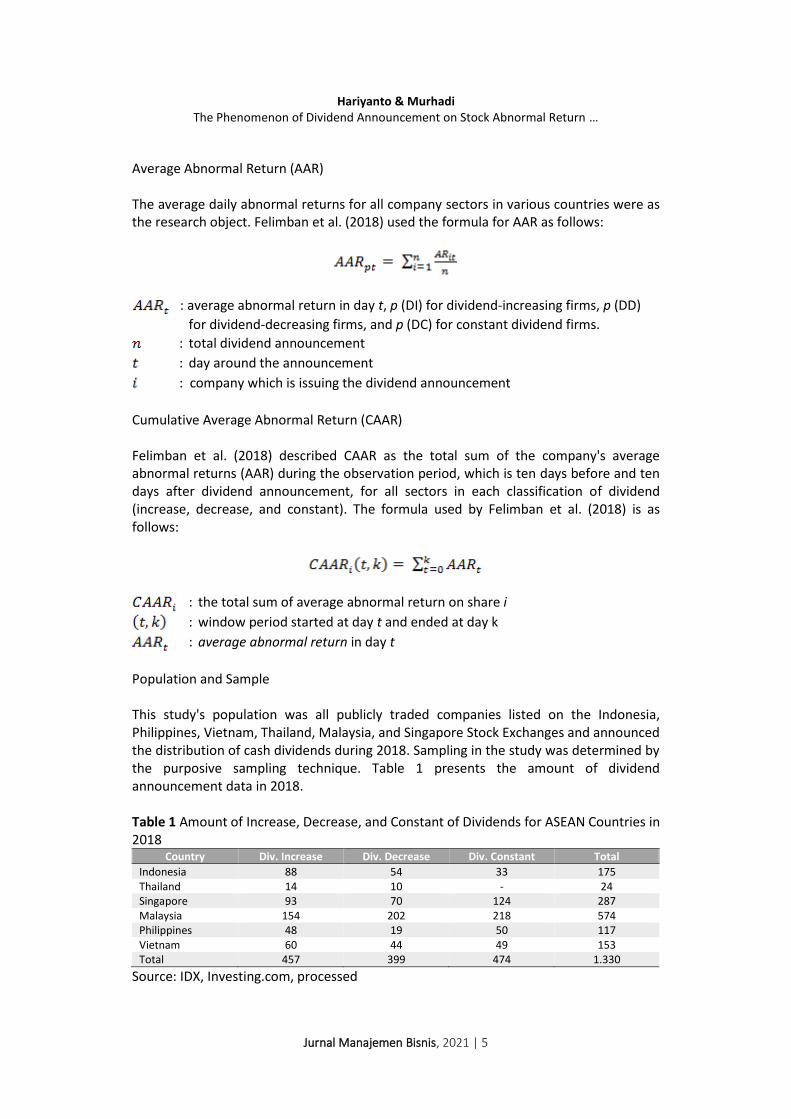
Population and Sample This study's population was all publicly traded companies listed on the Indonesia, Philippines, Vietnam, Thailand, Malaysia, and Singapore Stock Exchanges and announced the distribution of cash dividends during 2018. Sampling in the study was determined by the purposive sampling technique. Table 1 presents the amount of dividend announcement data in 2018. Table 1 Amount of Increase, Decrease, and Constant of Dividends for ASEAN Countries in 2018
Country Div. Increase Div. Decrease Div. Constant Total
Indonesia 88 54 33 175 Thailand 14 10 - 24 Singapore 93 70 124 287 Malaysia 154 202 218 574 Philippines 48 19 50 117 Vietnam 60 44 49 153 Total 457 399 474 1.330
Source: IDX, Investing.com, processed
Hariyanto & Murhadi The Phenomenon of Dividend Announcement on Stock Abnormal Return …
Jurnal Manajemen Bisnis, 2021 | 6
Data Analysis Techniques This study employed a one-sample t-test parametric statistical test to examine whether a specific value was significantly different from the average sample. Thus, researchers could find out from the test results whether there were significant average abnormal returns and cumulative average abnormal returns on days in and around the event window when there was a dividend announcement. This study also used paired-sample t-test parametric statistical testing to compare the average of two variables in one group. With this test, researchers could determine whether there were significant differences in average abnormal return and cumulative abnormal return on days in and around the event window when there was a dividend announcement. Besides, the normality test was carried out to determine the data distribution in the variable used in the study. This study utilized the Kolmogorov-Smirnov test to obtain a result of significance above 5% so that it could be said that the data from the variable used in the study had a normal distribution. The designs of the statistical hypothesis used by researchers in conducting the test are as follows: Abnormal return testing H0: AAR = 0 H1: AAR ≠ 0 If H1 is accepted and H0 is rejected, it can be interpreted that an average abnormal return occurs. H0: CAAR = 0 H2: CAAR ≠ 0 If H2 is accepted and H0 is rejected, it can be interpreted that a cumulative average abnormal return occurs. Different abnormal return testing H0: AAR1 = AAR2
H3: AAR1 ≠ AAR2
If H3 is accepted and H0 is rejected, it can be interpreted that there is a difference in abnormal return before and after the dividend announcement. H0: CAAR1 = CAAR2
H4: CAAR1 ≠ CAAR2
If H4 is accepted and H0 is rejected, it can be interpreted that there is a difference in cumulative abnormal return before and after the dividend announcement.

Hariyanto & Murhadi The Phenomenon of Dividend Announcement on Stock Abnormal Return …
Jurnal Manajemen Bisnis, 2021 | 7
Results and Discussion
Table 2 and 3 shows the results of the statistical descriptions of abnormal return and cumulative abnormal return variables. Table 2 Descriptive Statistic of Abnormal Return
Variables Mean Standard Deviation Maximum Minimum
Div. Increase 0,00077 0,02717 0,50272 -0,29809 Div. Decrease 0,00004 0,02987 0,48161 -0,32971 Div. Constant 0,00059 0,02883 0,67737 -0,48865
Source: Secondary data, processed (2018) Table 3 Descriptive Statistic of Cumulative Abnormal Return
Variables Mean Standard Deviation Maximum Minimum
Div. Increase 0,01079 0,07469 0,61116 -0,76004 Div. Decrease 0,00179 0,08418 0,78671 -0,50999 Div. Constant 0,00784 0,07309 0,89925 -0,56869
Source: Secondary data, processed (2018) Based on Table 2, the largest average abnormal return in 2018 was obtained when the dividend increased, which was 0,00077 or as much as 0.077%. While the lowest average abnormal return in 2018 was obtained when the dividend decreased, which was 0.00004 or 0.004%. The maximum value of the abnormal return was found at the time of the dividend constant announcement, which was 0.67737 or 67.737%. Meanwhile, the minimum abnormal return value was found at the time of dividend increase announcement, which was -0.29809 or -29.809%. Based on Table 3, the largest cumulative abnormal return in 2018 was obtained when the dividend increased, which was 0.01079 or 1.079%. While the lowest average abnormal return in 2018 was obtained when the dividend decreased, which was 0.00179 or 0.179%. The maximum value of the abnormal return was found at the time of the constant dividend announcement, which was 0.89925 or 89.925%. Meanwhile, the minimum abnormal return value was found when the dividend decrease announcement in the amount of -0.56869 or -56.869%. The Normality Test The normality test in this study used the Kolmogorov-Smirnov. The Kolmogorov-Smirnov test was carried out using the SPSS program to obtain a result of significance above 5%. If the significance obtained is more than 5%, it can be said that the data from the variable used in the study have a normal distribution. Based on Table 4 and 5, the results of testing abnormal returns and cumulative abnormal returns around the dividend distributions increase, decrease, and constant announcements had a significance of > 0.05. In other words, the population in the data population was not normally distributed. It was because there were positive and negative extreme values in the population. Widhiarso (2012) revealed that if a study on a large number of samples is not normally distributed, the t-

Hariyanto & Murhadi The Phenomenon of Dividend Announcement on Stock Abnormal Return …
Jurnal Manajemen Bisnis, 2021 | 8
test results are still quite strong. Thus, this study still employed the one-sample t-test and paired sample t-test. Table 4 The Normality Test of Average Abnormal Return
Div. Increase Div. Decrease Div. Constant Kolmogorov-
Smirnov Z Asymp. Sig.
(2-tailed) Kolmogorov-
Smirnov Z Asymp. Sig.
(2-tailed) Kolmogorov-
Smirnov Z Asymp. Sig.
(2-tailed)
t_min_10 2.419 .000 2.474 .000 2.567 .000 t_min_9 1.919 .001 2.690 .000 2.142 .000 t_min_8 2.877 .000 2.145 .000 2.428 .000 t_min_7 2.702 .000 2.472 .000 2.667 .000 t_min_6 2.603 .000 3.182 .000 2.829 .000 t_min_5 3.712 .000 2.678 .000 2.676 .000 t_min_4 2.781 .000 2.248 .000 2.286 .000 t_min_3 2.755 .000 2.323 .000 2.915 .000 t_min_2 1.609 .011 2.117 .000 2.147 .000 t_min_1 2.688 .000 2.516 .000 2.099 .000 t_0 2.568 .000 2.656 .000 3.865 .000 t_plus_1 3.016 .000 2.298 .000 2.784 .000 t_plus_2 3.078 .000 2.706 .000 2.537 .000 t_plus_3 2.633 .000 3.109 .000 2.359 .000 t_plus_4 2.827 .000 2.649 .000 2.771 .000 t_plus_5 1.991 .001 2.482 .000 2.927 .000 t_plus_6 2.298 .000 2.158 .000 4.693 .000 t_plus_7 2.106 .000 2.636 .000 2.775 .000 t_plus_8 1.876 .002 3.504 .000 5.336 .000 t_plus_9 2.446 .000 2.692 .000 2.596 .000 t_plus_10 2.901 .000 2.563 .000 1.999 .001
Source: Secondary data, processed (2018) Table 5 The Normality Test of Cumulative Average Abnormal Return
Div. Increase Div. Decrease Div. Constant Kolmogorov-
Smirnov Z Asymp. Sig.
(2-tailed) Kolmogorov-
Smirnov Z Asymp. Sig.
(2-tailed) Kolmogorov-
Smirnov Z Asymp. Sig.
(2-tailed)
t_min_10 2.419 .000 2.474 .000 2.567 .000 t_min_9 1.646 .009 2.973 .000 2.461 .000 t_min_8 2.244 .000 2.097 .000 2.219 .000 t_min_7 1.680 .007 2.716 .000 2.679 .000 t_min_6 1.662 .008 2.082 .000 2.520 .000 t_min_5 2.138 .000 1.952 .001 1.854 .002 t_min_4 2.200 .000 1.672 .007 2.046 .000 t_min_3 2.192 .000 2.016 .001 2.151 .000 t_min_2 2.007 .001 2.014 .001 1.688 .007 t_min_1 2.257 .000 1.936 .001 2.071 .000 t_0 1.642 .009 2.033 .001 1.911 .001 t_plus_1 1.700 .006 1.994 .001 2.359 .000 t_plus_2 2.047 .000 2.000 .001 1.916 .001 t_plus_3 1.621 .010 1.621 .010 1.862 .002 t_plus_4 1.985 .001 1.761 .004 1.715 .006 t_plus_5 2.131 .000 1.879 .002 1.670 .008 t_plus_6 1.903 .001 1.773 .004 1.939 .001 t_plus_7 2.039 .000 1.954 .001 1.794 .003 t_plus_8 1.870 .002 2.171 .000 2.656 .000 t_plus_9 2.105 .000 1.988 .001 2.397 .000 t_plus_10 2.046 .000 1.875 .002 2.236 .000
Source: Secondary data, processed (2018)

Hariyanto & Murhadi The Phenomenon of Dividend Announcement on Stock Abnormal Return …
Jurnal Manajemen Bisnis, 2021 | 9
Analysis of One-Sample T-Test for AAR and CAAR From all dividend announcement datas in the six ASEAN countries listed in Table 6 and Table 7, the number of dividend increases was 457 announcements (34.36%), dividend decreases were 399 announcements (3.00%), and dividend constants were 474 announcements (35.64%). In addition to the 5% significance level used in testing the hypothesis, the table presented also included the calculated t-value and critical t-value to strengthen the hypothesis testing results. In this study, the calculated t-value higher than the critical t-value indicated that the hypothesis testing results rejected H0 and accepted Ha. Around the announcement date of the dividend increases on Table 6, there was a t-value of average abnormal return, which was significantly positive on D-2 before the announcement that took place at 2.063 and on D+1 and D+2 after the announcement that took place at 2.572 and 2.038. Around the announcement date of dividend decreases, a significant positive t-value was found on D+7 and D+10 after the announcement at 2.178 and 2.087. While D+9 after the dividend announcement date decreased, the t-value was significantly negative at -2.032. For conditions around the announcement of a dividend constant, a significant positive t-value only occurred in the D-10 before the announcement, which was at 2.314. Table 6 AAR One-Sample T-Test Results
Div. Increase, N = 457 Div. Decrease, N = 399 Div. Constant, N = 474 (34,36 %) (30,00 %) (35,64 %) Day- Calc. t
Value Sig. 2-tailed
Critic. t Value
Calc. t Value
Sig. 2-tailed
Critic. t Value
Calc. t Value
Sig. 2-tailed
Critic. t Value
– 10 0,663 0,508 1,96518 0,734 0,463 1,96594 2,314* 0,021* 1,96499 – 9 0,020 0,984 1,96518 1,157 0,248 1,96594 0,786 0,432 1,96499 – 8 -0,208 0,836 1,96518 0,374 0,709 1,96594 1,339 0,181 1,96499 – 7 1,797 0,073 1,96518 -1,486 0,138 1,96594 1,570 0,117 1,96499 – 6 0,999 0,318 1,96518 1,197 0,232 1,96594 -0,061 0,951 1,96499 – 5 -0,026 0,979 1,96518 1,606 0,109 1,96594 0,277 0,782 1,96499 – 4 1,341 0,181 1,96518 0,892 0,373 1,96594 -1,812 0,071 1,96499 – 3 0,457 0,648 1,96518 0,043 0,965 1,96594 0,192 0,848 1,96499 – 2 2,063* 0,040* 1,96518 -0,566 0,572 1,96594 0,273 0,785 1,96499 – 1 0,321 0,748 1,96518 -0,731 0,465 1,96594 1,056 0,291 1,96499
0 0,726 0,468 1,96518 0,068 0,946 1,96594 -0,040 0,968 1,96499 + 1 2,572* 0,010* 1,96518 -1,850 0,065 1,96594 -0,241 0,809 1,96499 + 2 2,038* 0,042* 1,96518 -1,769 0,078 1,96594 1,513 0,131 1,96499 + 3 1,209 0,227 1,96518 0,694 0,488 1,96594 0,683 0,495 1,96499 + 4 0,413 0,680 1,96518 -0,500 0,618 1,96594 0,623 0,534 1,96499 + 5 -0,135 0,892 1,96518 0,602 0,548 1,96594 -0,327 0,744 1,96499 + 6 1,272 0,204 1,96518 -0,762 0,446 1,96594 1,409 0,160 1,96499 + 7 0,011 0,991 1,96518 2,178* 0,030* 1,96594 0,254 0,800 1,96499 + 8 -1,109 0,268 1,96518 -0,382 0,703 1,96594 1,139 0,255 1,96499 + 9 -0,579 0,563 1,96518 -
2,032* 0,043* 1,96594 -1,489 0,137 1,96499
+ 10 -1,301 0,194 1,96518 2,087* 0,038* 1,96594 -0,283 0,777 1,96499
Notes: Secondary data, processed (2018); *significantat 5%. Table 7 shows the cumulative average abnormal return test results during the research period of 21 days. After calculating the cumulative average abnormal returns, there was a significant positive t-value from D-3 until D+10 of dividend increase announcements.
Hariyanto & Murhadi The Phenomenon of Dividend Announcement on Stock Abnormal Return …
Jurnal Manajemen Bisnis, 2021 | 10
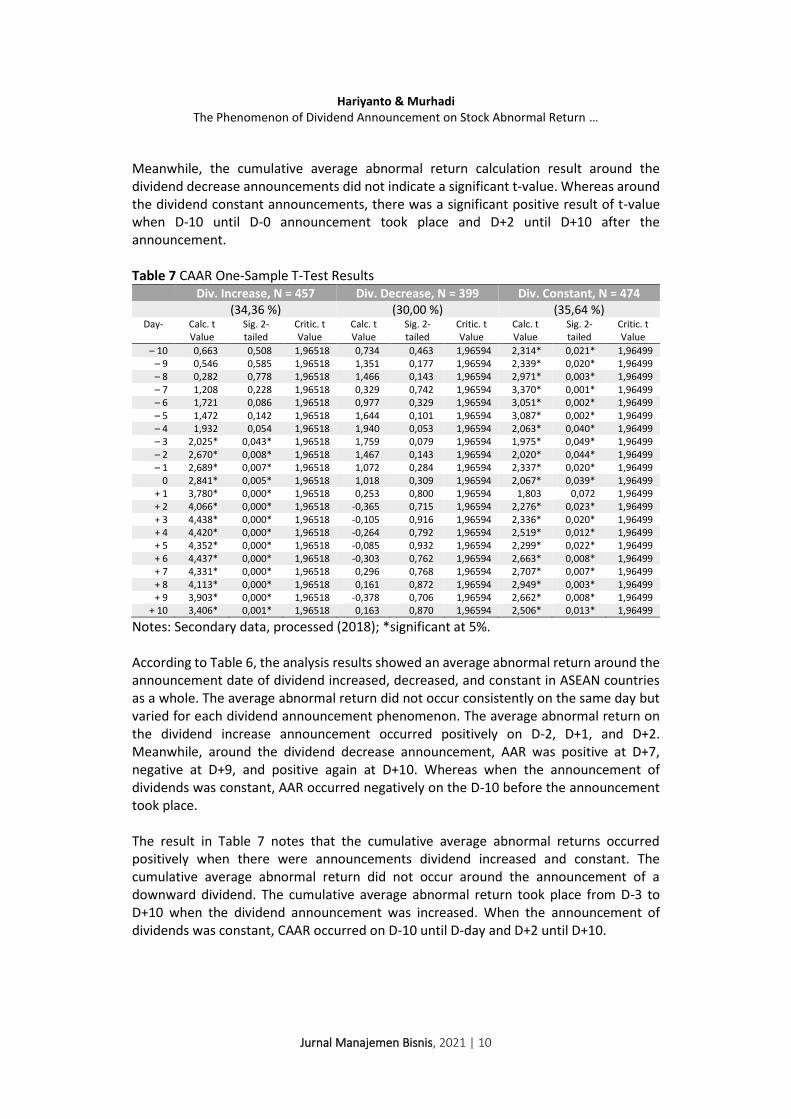
Meanwhile, the cumulative average abnormal return calculation result around the dividend decrease announcements did not indicate a significant t-value. Whereas around the dividend constant announcements, there was a significant positive result of t-value when D-10 until D-0 announcement took place and D+2 until D+10 after the announcement. Table 7 CAAR One-Sample T-Test Results
Div. Increase, N = 457 Div. Decrease, N = 399 Div. Constant, N = 474 (34,36 %) (30,00 %) (35,64 %) Day- Calc. t
Value Sig. 2-tailed
Critic. t Value
Calc. t Value
Sig. 2-tailed
Critic. t Value
Calc. t Value
Sig. 2-tailed
Critic. t Value
– 10 0,663 0,508 1,96518 0,734 0,463 1,96594 2,314* 0,021* 1,96499 – 9 0,546 0,585 1,96518 1,351 0,177 1,96594 2,339* 0,020* 1,96499 – 8 0,282 0,778 1,96518 1,466 0,143 1,96594 2,971* 0,003* 1,96499 – 7 1,208 0,228 1,96518 0,329 0,742 1,96594 3,370* 0,001* 1,96499 – 6 1,721 0,086 1,96518 0,977 0,329 1,96594 3,051* 0,002* 1,96499 – 5 1,472 0,142 1,96518 1,644 0,101 1,96594 3,087* 0,002* 1,96499 – 4 1,932 0,054 1,96518 1,940 0,053 1,96594 2,063* 0,040* 1,96499 – 3 2,025* 0,043* 1,96518 1,759 0,079 1,96594 1,975* 0,049* 1,96499 – 2 2,670* 0,008* 1,96518 1,467 0,143 1,96594 2,020* 0,044* 1,96499 – 1 2,689* 0,007* 1,96518 1,072 0,284 1,96594 2,337* 0,020* 1,96499
0 2,841* 0,005* 1,96518 1,018 0,309 1,96594 2,067* 0,039* 1,96499 + 1 3,780* 0,000* 1,96518 0,253 0,800 1,96594 1,803 0,072 1,96499 + 2 4,066* 0,000* 1,96518 -0,365 0,715 1,96594 2,276* 0,023* 1,96499 + 3 4,438* 0,000* 1,96518 -0,105 0,916 1,96594 2,336* 0,020* 1,96499 + 4 4,420* 0,000* 1,96518 -0,264 0,792 1,96594 2,519* 0,012* 1,96499 + 5 4,352* 0,000* 1,96518 -0,085 0,932 1,96594 2,299* 0,022* 1,96499 + 6 4,437* 0,000* 1,96518 -0,303 0,762 1,96594 2,663* 0,008* 1,96499 + 7 4,331* 0,000* 1,96518 0,296 0,768 1,96594 2,707* 0,007* 1,96499 + 8 4,113* 0,000* 1,96518 0,161 0,872 1,96594 2,949* 0,003* 1,96499 + 9 3,903* 0,000* 1,96518 -0,378 0,706 1,96594 2,662* 0,008* 1,96499
+ 10 3,406* 0,001* 1,96518 0,163 0,870 1,96594 2,506* 0,013* 1,96499
Notes: Secondary data, processed (2018); *significant at 5%. According to Table 6, the analysis results showed an average abnormal return around the announcement date of dividend increased, decreased, and constant in ASEAN countries as a whole. The average abnormal return did not occur consistently on the same day but varied for each dividend announcement phenomenon. The average abnormal return on the dividend increase announcement occurred positively on D-2, D+1, and D+2. Meanwhile, around the dividend decrease announcement, AAR was positive at D+7, negative at D+9, and positive again at D+10. Whereas when the announcement of dividends was constant, AAR occurred negatively on the D-10 before the announcement took place. The result in Table 7 notes that the cumulative average abnormal returns occurred positively when there were announcements dividend increased and constant. The cumulative average abnormal return did not occur around the announcement of a downward dividend. The cumulative average abnormal return took place from D-3 to D+10 when the dividend announcement was increased. When the announcement of dividends was constant, CAAR occurred on D-10 until D-day and D+2 until D+10.

Hariyanto & Murhadi The Phenomenon of Dividend Announcement on Stock Abnormal Return …
Jurnal Manajemen Bisnis, 2021 | 11
Analysis of Paired Sample T-Test for AAR and CAAR Based on the results from Table 8, there was no t-value of the average abnormal return that was significant between before and after the dividend increase and constant announcement. Meanwhile, around the date of the dividend decrease announcement, there was a significant negative t-value in the amount of -2.437 between D-7 before the announcement and D+7 after the announcement, and there was a significant positive t-value in the amount of 2.240 between D-9 before the announcement with D+9 after the announcement of dividend decrease. Table 8 AAR Paired Sample T-Test Results
Div. Increase, N = 457 Div. Decrease, N = 399 Div. Constant, N = 474 (34,36 %) (30,00 %) (35,64 %)
Pair Calc. t Value
Sig. 2-tailed
Critic. t Value
Calc. t Value
Sig. 2-tailed
Critic. t Value
Calc. t Value
Sig. 2-tailed
Critic. t Value
-1 + 1 -1,876 0,061 1,96518 0,914 0,361 1,96594 0,778 0,437 1,96499 -2 + 2 -0,459 0,646 1,96518 1,071 0,285 1,96594 -0,936 0,350 1,96499 -3 + 3 -0,571 0,569 1,96518 -0,548 0,584 1,96594 -0,358 0,720 1,96499 -4 + 4 0,618 0,537 1,96518 0,928 0,354 1,96594 -1,664 0,097 1,96499 -5 + 5 0,050 0,960 1,96518 0,613 0,540 1,96594 0,444 0,657 1,96499 -6 + 6 -0,094 0,925 1,96518 1,252 0,211 1,96594 -1,232 0,219 1,96499 -7 + 7 1,204 0,229 1,96518 -
2,437* 0,015* 1,96594 0,813 0,417 1,96499
-8 + 8 0,595 0,552 1,96518 0,519 0,604 1,96594 -0,382 0,702 1,96499 -9 + 9 0,427 0,670 1,96518 2,240* 0,026* 1,96594 1,632 0,103 1,96499
-10+10
1,451 0,148 1,96518 -1,078 0,282 1,96594 1,861 0,063 1,96499
Notes: Secondary data, processed (2018); *significant at 5%. Table 9 CAAR Paired Sample T-Test Results
Div. Increase, N = 457 Div. Decrease, N = 399 Div. Constant, N = 474 (34,36 %) (30,00 %) (35,64 %)
Pair Calc. t Value
Sig. 2-tailed
Critic. t Value
Calc. t Value
Sig. 2-tailed
Critic. t Value
Calc. t Value
Sig. 2-tailed
Critic. t Value
-1 + 1 -2,368*
0,018* 1,96518 1,354 0,176 1,96594 0,196 0,845 1,96499
-2 + 2 -2,819*
0,005* 1,96518 2,276* 0,023* 1,96594 -1,064 0,288 1,96499
-3 + 3 -3,915*
0,000* 1,96518 1,992* 0,047* 1,96594 -1,248 0,213 1,96499
-4 + 4 -3,941*
0,000* 1,96518 1,951 0,052 1,96594 -1,398 0,163 1,96499
-5 + 5 -4,057*
0,000* 1,96518 1,281 0,201 1,96594 -0,608 0,543 1,96499
-6 + 6 -3,915*
0,000* 1,96518 0,964 0,336 1,96594 -1,234 0,218 1,96499
-7 + 7 -4,159*
0,000* 1,96518 -0,160 0,873 1,96594 -1,269 0,205 1,96499
-8 + 8 -4,310*
0,000* 1,96518 0,389 0,697 1,96594 -1,983*
0,048* 1,96499
-9 + 9 -3,902*
0,000* 1,96518 0,853 0,394 1,96594 -1,953 0,051 1,96499
-10+10
-3,257*
0,001* 1,96518 0,004 0,997 1,96594 -2,018*
0,044* 1,96499
Notes: Secondary data, processed (2018); *significant at 5%.

Hariyanto & Murhadi The Phenomenon of Dividend Announcement on Stock Abnormal Return …
Jurnal Manajemen Bisnis, 2021 | 12
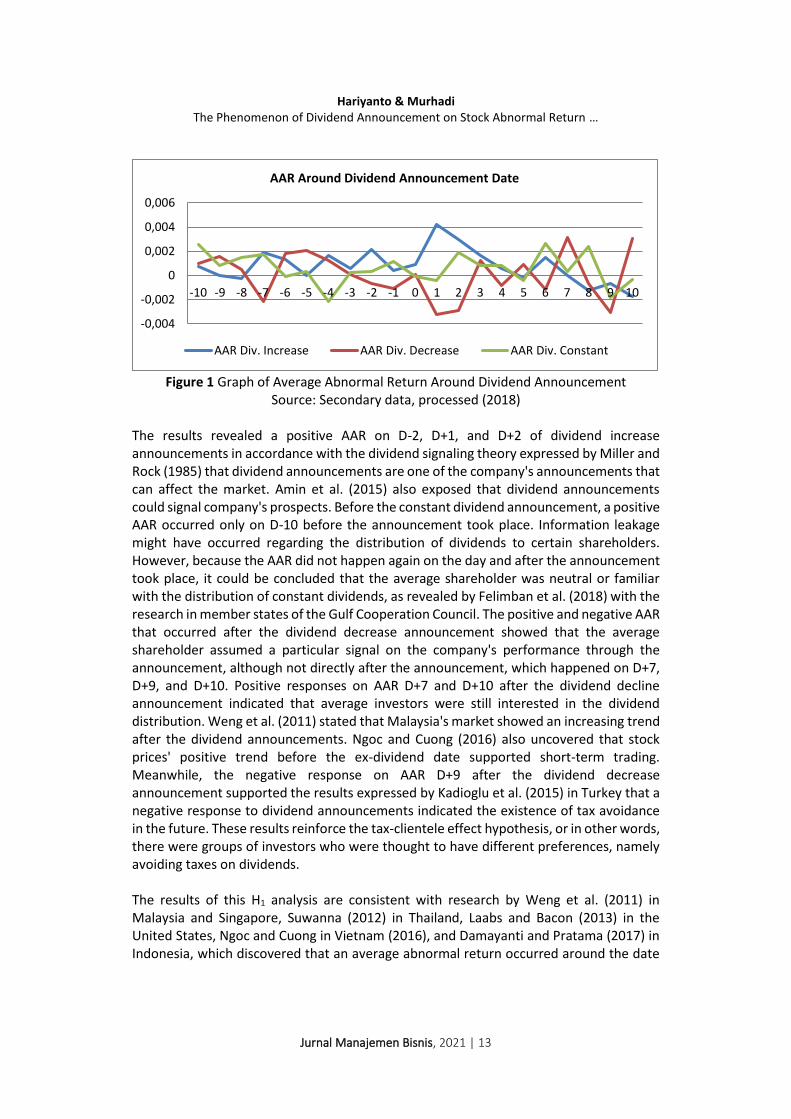
The result of Table 9 notes that there was a cumulative average abnormal return of stocks that was negative and significantly different between before and after the announcement of dividend increased from D-10 until D+10. There was a cumulative average abnormal return of positive and significantly different shares between D-2 and D+2 and between D-3 and D+3 around the dividend decrease announcement. Meanwhile, when constant dividend announcement, a cumulative average abnormal return was different negatively and significantly between D-8 and D+8, also between D-10 and D+10 after the announcement. Based on the result from Table 8 by comparing the average value of abnormal returns between the day before and the day after the dividend announcement, it appears that there were no average abnormal returns of shares that differed between before and after the announcement of an increasing and constant dividend. For the dividend decrease announcement, there was a negative average return of shares that was negatively different between D-7 and D+7. It indicated that the AAR value of D+7 was smaller than D-7. Besides, there was also a positive result between D-9 and D+9, meaning that AAR's value on D+9 was greater than D-9. The result of Table 9 notes that cumulatively, there was an average abnormal return that was significantly different between before and after the announcement of a dividend increase from D-10 until D+10 of the announcements. A cumulative average abnormal return for dividend decrease announcement was positively different between D-2 and D+2 and between D-3 with D+3. Meanwhile, there was a cumulative average abnormal return for constant dividend announcement that was negatively different between D-8 and D+8, also D-10 and D+10 of the announcements. Average Abnormal Return around Dividend Announcement The analysis uncovered that abnormal returns occurred on average around the date of increasing, decreasing, and constant dividend announcements. H1, determined by the researchers, estimated that there was an average abnormal return around the date of dividend announcement was accepted. Figure 1 displays the average abnormal returns movement that occurred from 10 days before the announcement up to 10 days after the dividend increase, decrease, and constant announcement. Reaction to stock prices that moved significantly immediately after the announcement was when there was an increase in dividends, and the average abnormal return occurred positively on the D-2, D+1, and D+2 of announcements. Even though the dividend decrease and constant announcement did not occur a price reaction near or right on the day of the announcement, there were still positive and negative AAR results on the day before and after the announcement.
Hariyanto & Murhadi The Phenomenon of Dividend Announcement on Stock Abnormal Return …
Jurnal Manajemen Bisnis, 2021 | 13
Figure 1 Graph of Average Abnormal Return Around Dividend Announcement
Source: Secondary data, processed (2018) The results revealed a positive AAR on D-2, D+1, and D+2 of dividend increase announcements in accordance with the dividend signaling theory expressed by Miller and Rock (1985) that dividend announcements are one of the company's announcements that can affect the market. Amin et al. (2015) also exposed that dividend announcements could signal company's prospects. Before the constant dividend announcement, a positive AAR occurred only on D-10 before the announcement took place. Information leakage might have occurred regarding the distribution of dividends to certain shareholders. However, because the AAR did not happen again on the day and after the announcement took place, it could be concluded that the average shareholder was neutral or familiar with the distribution of constant dividends, as revealed by Felimban et al. (2018) with the research in member states of the Gulf Cooperation Council. The positive and negative AAR that occurred after the dividend decrease announcement showed that the average shareholder assumed a particular signal on the company's performance through the announcement, although not directly after the announcement, which happened on D+7, D+9, and D+10. Positive responses on AAR D+7 and D+10 after the dividend decline announcement indicated that average investors were still interested in the dividend distribution. Weng et al. (2011) stated that Malaysia's market showed an increasing trend after the dividend announcements. Ngoc and Cuong (2016) also uncovered that stock prices' positive trend before the ex-dividend date supported short-term trading. Meanwhile, the negative response on AAR D+9 after the dividend decrease announcement supported the results expressed by Kadioglu et al. (2015) in Turkey that a negative response to dividend announcements indicated the existence of tax avoidance in the future. These results reinforce the tax-clientele effect hypothesis, or in other words, there were groups of investors who were thought to have different preferences, namely avoiding taxes on dividends. The results of this H1 analysis are consistent with research by Weng et al. (2011) in Malaysia and Singapore, Suwanna (2012) in Thailand, Laabs and Bacon (2013) in the United States, Ngoc and Cuong in Vietnam (2016), and Damayanti and Pratama (2017) in Indonesia, which discovered that an average abnormal return occurred around the date
-0,004
-0,002
0
0,002
0,004
0,006
-10 -9 -8 -7 -6 -5 -4 -3 -2 -1 0 1 2 3 4 5 6 7 8 9 10
AAR Around Dividend Announcement Date
AAR Div. Increase AAR Div. Decrease AAR Div. Constant
Hariyanto & Murhadi The Phenomenon of Dividend Announcement on Stock Abnormal Return …
Jurnal Manajemen Bisnis, 2021 | 14
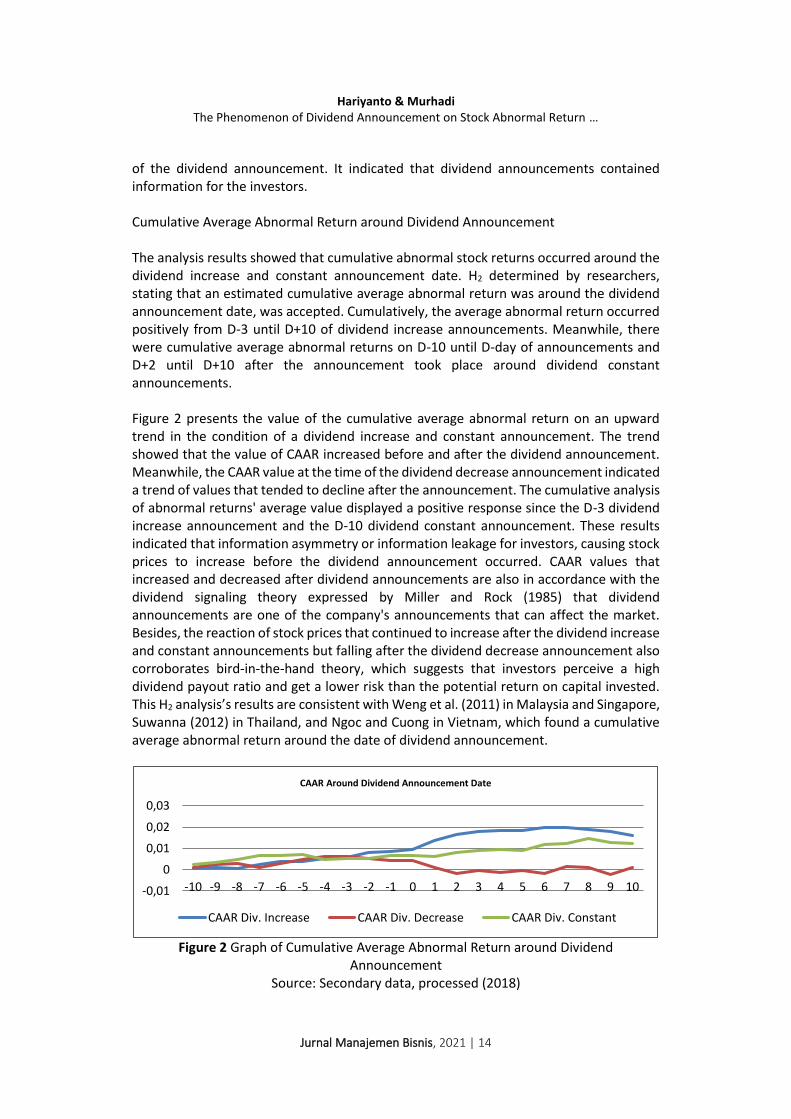
of the dividend announcement. It indicated that dividend announcements contained information for the investors. Cumulative Average Abnormal Return around Dividend Announcement The analysis results showed that cumulative abnormal stock returns occurred around the dividend increase and constant announcement date. H2 determined by researchers, stating that an estimated cumulative average abnormal return was around the dividend announcement date, was accepted. Cumulatively, the average abnormal return occurred positively from D-3 until D+10 of dividend increase announcements. Meanwhile, there were cumulative average abnormal returns on D-10 until D-day of announcements and D+2 until D+10 after the announcement took place around dividend constant announcements. Figure 2 presents the value of the cumulative average abnormal return on an upward trend in the condition of a dividend increase and constant announcement. The trend showed that the value of CAAR increased before and after the dividend announcement. Meanwhile, the CAAR value at the time of the dividend decrease announcement indicated a trend of values that tended to decline after the announcement. The cumulative analysis of abnormal returns' average value displayed a positive response since the D-3 dividend increase announcement and the D-10 dividend constant announcement. These results indicated that information asymmetry or information leakage for investors, causing stock prices to increase before the dividend announcement occurred. CAAR values that increased and decreased after dividend announcements are also in accordance with the dividend signaling theory expressed by Miller and Rock (1985) that dividend announcements are one of the company's announcements that can affect the market. Besides, the reaction of stock prices that continued to increase after the dividend increase and constant announcements but falling after the dividend decrease announcement also corroborates bird-in-the-hand theory, which suggests that investors perceive a high dividend payout ratio and get a lower risk than the potential return on capital invested. This H2 analysis’s results are consistent with Weng et al. (2011) in Malaysia and Singapore, Suwanna (2012) in Thailand, and Ngoc and Cuong in Vietnam, which found a cumulative average abnormal return around the date of dividend announcement.
Figure 2 Graph of Cumulative Average Abnormal Return around Dividend Announcement
Source: Secondary data, processed (2018)
-0,01
0
0,01
0,02
0,03
-10 -9 -8 -7 -6 -5 -4 -3 -2 -1 0 1 2 3 4 5 6 7 8 9 10
CAAR Around Dividend Announcement Date
CAAR Div. Increase CAAR Div. Decrease CAAR Div. Constant
Hariyanto & Murhadi The Phenomenon of Dividend Announcement on Stock Abnormal Return …
Jurnal Manajemen Bisnis, 2021 | 15
Comparison of Average Abnormal Return Before and After Dividend Announcement The analysis exposed differences in abnormal returns on average between before and after the dividend decrease announcement. H3 was determined by researchers estimating that there was an average abnormal return between before and after the dividend announcement was accepted. The AAR difference significantly occurred negatively on D-7 with D+7 and positively on D-9 with D+9. The negative result indicated the AAR value before the announcement was smaller than the AAR value after the announcement. Conversely, if there was a positive difference, the AAR value before the announcement was higher than the value after the announcement. Looking at the analysis results, it could be concluded that the effect of dividend decrease announcements did not entirely cause the average abnormal return, indicating decreases. It was evidenced by the average value of abnormal returns, which increased at D+7 after the announcement compared to the D-7 before the announcement. The study results support the dividend signaling theory revealed by Miller and Rock (1985) that dividend announcements are one of the company's announcements that can affect the market. This H3 analysis’s results are consistent with research by Ngoc and Cuong (2016) in Vietnam that dividend announcements significantly affected AAR between before and after the announcement. Comparison of Cumulative Average Abnormal Return Before and After Dividend Announcement The analysis revealed that cumulatively, there were differences in the average abnormal returns between before and after the dividend increase, decrease, and constant announcements. H4 determined by researchers that there was an estimated cumulative average abnormal return between before and after the dividend announcements were accepted. The CAAR difference significantly occurred negatively on D-10 until D+10 of dividend increase announcements, positively on D-2 until D-3 with D+2 until D+3 of dividend decrease announcements, and negatively on D-8 and D-10 with D+8 and D+10 of constant dividend announcements. The meaning of the negative difference was the CAAR value before the announcement was smaller than the CAAR value after the announcement. Conversely, if there was a positive difference, the CAAR value before the announcement was higher than the value after the announcement. Looking at the analysis results, it could be deduced that the effect of a dividend increase and constant announcements caused the average value of abnormal returns cumulatively continued to keep rising after the announcement. Meanwhile, the effect of dividend decrease announcements led to abnormal returns' cumulative average value to decrease after the announcement. The study results confirm the dividend signaling theory revealed by Miller and Rock (1985) that dividend announcements are one of the company's announcements that can affect the market. This H4 analysis’s results are consistent with research by Ngoc and Cuong (2016) in Vietnam that dividend announcements had a significant effect on CAAR between before and after the announcement.
Hariyanto & Murhadi The Phenomenon of Dividend Announcement on Stock Abnormal Return …
Jurnal Manajemen Bisnis, 2021 | 16
Conclusion
After testing the research hypotheses, the results showed that abnormal returns occurred both on average and cumulatively ten days before and ten days after the dividend increase, decrease, and constant announcements. AAR and CAAR values occurred more positively and significantly around the dividend increase and constant announcement than the dividend decrease announcement. Even so, the dividend decrease announcement still created a significant positive and negative AAR value after the dividend announcement. The existence of a significant abnormal return from before the announcement until the day after the announcement answered the researchers' problem formulations that the dividend announcements during the 2018 period in ASEAN countries were informative for shareholders. Following the dividend signaling theory expressed by Miller and Rock (1985), dividend announcements are one of the company's announcements that can affect the market. Thus, investors tended to position dividend announcements into an informative aspect to know the company's performance and prospects in the future. This study's results are in agreement with the study results revealed by Felimban et al. (2018) that there was a price reaction in the direction of the dividend increase, decrease, and constant announcement. Thus, the impact of dividend announcements on stock prices showed a positive abnormal return after the dividend increase and constant announcement and a negative abnormal return after the dividend decrease announcement. It was indicated by the significant value differences between the AAR and CAAR before and after the dividend announcement. For ASEAN member countries, such as Indonesia, Thailand, Singapore, Malaysia, Philippines, and Vietnam, dividend announcements were informative for shareholders and could trigger abnormal returns around the dividend announcements. It could also be concluded that ASEAN countries' investor preferences supported bird-in-the-hand theory, where they preferred to invest their funds in companies with high cash dividends. If observed from the market reaction to the public information, the price of securities in ASEAN countries was reflected by the publication of information, one of which was the dividend distribution announcement. Thus, in this case, the ASEAN countries' market efficiency condition was included in the semi-strong form efficiency. Suggestions for further research are to pay attention to announcements of changes in dividend distribution dates and nominal revision, whether they contain information for investors, which will affect stock price movements. Besides, the stock price movement from the date of the dividend announcement until the ex-dividend date can also be a concern to ensure the abnormal return after the dividend announcement.
References
Amin, A. S., Dutta, S., Saadi, S., & Vora, P. P. (2015). Institutional shareholding and information content of dividend surprises: Re-examining the dynamics in dividend-

Hariyanto & Murhadi The Phenomenon of Dividend Announcement on Stock Abnormal Return …
Jurnal Manajemen Bisnis, 2021 | 17
reappearance era. Journal of Corporate Finance, 31, 152–170. https://doi.org/10.1016/j.jcorpfin.2015.02.002
Damayanti, I., & Pratama, R.A. (2018). Reaksi Pengumuman Deviden. Seminar Nasional Teknologi dan Bisnis, IIB Darmajaya Bandar Lampung. Retrieved from https://jurnal.darmajaya.ac.id/index.php/PSND/article/view/1302
Dasilas, A., & Leventis, S. (2011). Stock market reaction to dividend announcements: Evidence from the Greek stock market. International Review of Economics & Finance, 20(2), 302–311. https://doi.org/10.1016/j.iref.2010.06.003
Felimban, R., Floros, C., & Nguyen, A.-N. (2018). The impact of dividend announcements on share price and trading volume. Journal of Economic Studies, 45(2), 210–230. https://doi.org/10.1108/jes-03-2017-0069
Jogiyanto. (2003). Teori Portofolio dan Analisis Investasi: Edisi 3. Yogyakarta: BPFE-Yogyakarta. Jogiyanto. (2009). Teori Portofolio dan Analisis Investasi: Edisi 4. Yogyakarta: BPFE-Yogyakarta. Kadioglu, E., Telceken, N., & Ocal, N. (2015). Market reaction to dividend announcement:
evidence from turkish stock market. International Business Research, 8(9), 83-94. https://doi.org/10.5539/ibr.v8n9p83
Kawano, L. (2014). The dividend clientele hypothesis: Evidence from the 2003 tax Act. American Economic Journal: Economic Policy, 6(1), 114–136. http://dx.doi.org/10.1257/pol.6.1.114
Kurniasih, A., Siregar, H., Sembel, R., Achsani, N.A. (2011). Market reaction to the cash dividend announcement: An empirical study from the Indonesia Stock Exchange 2004-2009. European Journal of Economics, Finance and Administrative Sciences, 40, 92-100. Retrieved from https://www.researchgate.net/publication/286737651_Market_reaction_to_the_cash_dividend_announcement_An_empirical_study_from_the_Indonesia_stock_exchange_2004_-_2009
Laabs, D.S. & Bacon, F.W. (2013). The impact of increased dividend announcements on stock price: A test of market efficiency. USA: Digital Commons Longwood University.
Md. Lazan, R., Abidin, R. A. Z., & Hassan, S. (2014). Share prices’ reaction to dividend announcement: A study on the listed local commercial banks in bursa Malaysia. Proceedings of the Colloquium on Administrative Science and Technology, 245–254. https://doi.org/10.1007/978-981-4585-45-3_25
Miller, M., & Rock, K. (1985). Dividend policy under asymmetric information. The Journal of Finance, 40(4), 1031-1051. https://doi.org/10.2307/2328393
Ngoc, D.B., & Cuong, N.C. (2016). Dividend announcement and ex-dividend effects on stock return. International Journal of Economics and Finance, 8(7), 217-2015. http://dx.doi.org/10.5539/ijef.v8n7p207
Samsul, M. (2006). Pasar modal dan manajemen portofolio. Jakarta: Penerbit Erlangga. Sari, S.P., & Lestari, W.R. (2015). Analisis dampak pengumuman deviden terhadap reaksi
pasar: studi pada perusahaan indeks LQ 45. Jurnal Magister Manajemen, 1(2), 168-185. Retrieved from https://jurnal.darmajaya.ac.id/index.php/jmmd/article/view/670
Suwanna, T. (2012). Impacts of dividend announcement on stock return. Procedia–Social and Behavioral Sciences, 40, 721-725. https://doi.org/10.1016/j.sbspro.2012.03.255
Weng, C.H., Chin, L.D., Yee, P.W., Ann, T.S., & Leng, Y.K. (2011). The Dividend and Earnings Announcement Effects: The Case of Malaysia and Singapore. Malaysia: Department of Economics Universiti Tunku Abdul Rahman. Retrieved from http://eprints.utar.edu.my/id/eprint/25
Weston, J. F., & Copeland, T.E. (1997). Manajemen keuangan: Edisi kesembilan, jilid 2. Jakarta: Binarupa Aksara.
Widhiarso, W. (2012). Tanya Jawab tentang Uji Normalitas.. Retrieved from

Hariyanto & Murhadi The Phenomenon of Dividend Announcement on Stock Abnormal Return …
Jurnal Manajemen Bisnis, 2021 | 18
http://widhiarso.staff.ugm.ac.id/wp/tanya-jawab-tentang-uji-normalitas/ Widoatmodjo, S. (2009). Pasar modal indonesia: pengantar dan studi kasus. Jakarta: Penerbit
Ghalia Indonesia.