the performance of socially responsible investment and
TRANSCRIPT
The Performance of Socially Responsible Investment and Sustainable Development in France: An Update after the Financial Crisis
September 2010
Institute
EDHEC-Risk Institute
393-400 promenade des Anglais06202 Nice Cedex 3Tel.: +33 (0)4 93 18 78 24Fax: +33 (0)4 93 18 78 41E-mail: [email protected]: www.edhec-risk.com
Noël AmencProfessor of Finance, EDHEC Business SchoolDirector, EDHEC-Risk Institute
Véronique Le SourdSenior Research Engineer, EDHEC-Risk Institute

2
In an initial study done in 2008, EDHEC-Risk Institute established that socially responsible (SRI) funds—those funds made by selecting securities that meet ESG (environmental, social, governance) criteria—distributed in France did not produce both positive and statistically significant alpha. That study, which relied on the Fama-French three-factor model, covered a six-year period ending in December 2007, thus not including the recent financial crisis. The purpose of the present study was to update these results by extending the analysis to the years 2008 and 2009. In addition, in view of changes in the SRI fund population, it also appears useful to us to compare the results from two sub-populations, namely, best-in-class funds and green funds, the latter being more specifically focused on the “E”, for environment, from the ESG criteria. The results we obtain confirm those of our initial study, that is, in most cases alpha is negative and not statistically significant. In addition, the focus on the financial crisis reveals that SRI funds provided no protection from market downturns during this period, as illustrated by the considerable increase of extreme risks borne by these funds. Finally, the comparison of best-in-class funds and green funds, reveals, over the long term, higher alpha for green funds, with higher risks, including higher extreme risks.
Abstract
The work presented herein is a detailed summary of academic research conducted by EDHEC-Risk Institute. The opinions expressed are those of the authors. EDHEC-Risk Institute declines all reponsibility for any errors or omissions.

Noël Amenc is professor of finance and director of EDHEC-Risk Institute. He has a masters in economics and a PhD in finance and has conducted active research in the fields of quantitative equity management, portfolio performance analysis, and active asset allocation, resulting in numerous academic and practitioner articles and books. He is a member of the editorial board of the Journal of Portfolio Management, associate editor of the Journal of Alternative Investments and a member of the scientific advisory council of the AMF (French financial regulatory authority).
Véronique Le Sourd has a Master’s Degree in applied mathematics from the Pierre and Marie Curie University in Paris. From 1992 to 1996, she worked as a research assistant in the finance and economics department of the French business school HEC and then joined the research department of Misys Asset Management Systems in Sophia Antipolis. She is currently a senior research engineer at EDHEC-Risk Institute.
About the Authors
3

Table of Contents
4
Introduction ............................................................................................................................................ 5
1. A Short Description of the SRI Fund Population ..................................................................... 7
2. Data and Methodology .................................................................................................................... 8
3. Empirical Results .............................................................................................................................13
Appendix ................................................................................................................................................24
References .............................................................................................................................................28
EDHEC-Risk Institute Position Papers and Publications (2007-2010) ....................................29

5
In the context of the recent financial crisis and unstable financial markets, socially responsible investment (SRI) has carried on expanding, seeking to offer investors the image of a reliable investment that can withstand extreme volatility better than conventional investment can. Although socially responsible investment accounts as yet for only a limited share of the total number of funds and amounts invested, it now enjoys great visibility. Indeed, rare are the asset management firms that do not offer at least one fund defined as socially responsible, making SRI available to a wide audience.
The concept of socially responsible investment has evolved over the years and attracted a broader ranger of investors. From the original ethical exclusion funds, based purely on moral principles, socially responsible investment was first extended to best-in-class selection based on environmental, social, and governance (ESG) criteria in each investment sector; very few sectors are completely excluded. The emergence of funds founded purely on environmental concepts is a more recent trend. These funds, known as sustainable or green funds, select the companies in which they invest first of all on their investment sectors—all having to do with preservation of the environment (ensuring water quality, exploitation of renewable energy, prevention of climate change caused by human activity, and so on)—though many of these funds also use ESG filters. In the last three years, the creation of green funds, sparked by the omnipresent trend toward sustainability, has outpaced that of best-in-class funds.
SRI performance evaluation is still a challenge, especially since SRI brings together several kinds of funds and is thus not a homogeneous asset class. In 2008, EDHEC-Risk Institute analysed the
performance of a sample of sixty-two SRI funds distributed in France, covering a six year-period from January 2002 to December 2007 (Amenc and Le Sourd 2008; Le Sourd 2010). This study concluded that none of the sixty-two funds of the sample produced both positive and statistically significant alpha—computed with the Fama-French three-factor model. In fact, for most SRI funds, we obtained negative but not statistically significant alpha, indicating that SRI security selection in itself does not lead to outperformance. As this initial study does not include the period of the financial crisis, all assumptions could be made whether or not these conclusions could be extended to the recent period. We thus decided to do a new analysis, extending the period to include 2008 and 2009, to assess how SRI funds behaved during the financial crisis.
We present here the results we obtained for SRI funds over both a fairly long period, with eight years of data, ending in December 2009, and, to highlight the period of the financial crisis, a shorter period of three years, including data from January 2007 to December 2009. In addition, we split our sample into two categories: traditional SRI funds and green funds. The traditional SRI group is made up largely of best-in-class funds, as there are very few negative screening funds in continental Europe. The green group includes all funds related to the environment. Our earlier study did not analyse the two groups of funds separately, as green funds accounted for only a small share of our initial sample. This segregation has also led us to look into whether the performance of green funds was exposed to a specific risk factor and whether these funds could serve as a diversification tool, or to hedge against swings in commodity prices. So we also analyse these funds
Introduction

6
with a modified factor model obtained by adding to our initial three-factor model a factor measuring fluctuations in the price of crude oil.
The remainder of this document is organised as follows. In the first part, we analyse in brief recent changes in the characteristics of the SRI fund population. In the second part, we describe both our data sample and the method we used to complete the analysis. The third part presents the empirical results. Finally, we draw a conclusion from these results.
Introduction

7
1. A Short Description of the SRI Fund Population
The SRI fund population is currently made up of a wide variety of funds that can be put in one of two main categories. The first category includes funds made up of companies selected for the degree to which they meet ESG criteria; specific sectors are neither eliminated nor selected. These funds are also known as best-in-class funds. In this document, we will refer to these funds as traditional SRI funds. The second category includes funds that focus specifically on environment themes such as renewable energy, water preservation, and climate change. These funds are usually referred to as sustainable funds or green funds. The main concern of these funds is their investment sector; ESG criteria are used only to a lesser extent. These funds are younger on average than those referred to as traditional SRI funds, as concern for the environment is a more recent feature of the socially responsible landscape than are other moral and social imperatives. As it happens, Novethic, the French organisation that specialises in socially responsible investment and corporate social responsibility, awards the SRI label only to those funds that systematically meet the ESG criteria. At the same time, asset management firms present all green funds as part of their SRI, or, more generally, their sustainable offerings. It is for that reason that it seems to us important not to keep them apart.
Graph 1 shows changes in the SRI fund population in France from 1995 to 2009.1 For each year we show the total number of funds available, the shares of traditional SRI and green investment, and the shares by investment zone. As the graph shows, the number of funds began to increase significantly in 2001. From 2003 to 2006, growth slowed slightly, only to take off again as of 2007. Initially, green funds accounted for only a small share of the total number of funds. From 2007, the creation of green funds, especially of green funds invested in World assets, spiked. Indeed, over the last three years, more funds were created in the green group than in the traditional SRI group.
The creation of green funds may have outpaced that of traditional SRI because, as more and more companies seek to earn an SRI label, the gap between traditional SRI and conventional investment narrows. In this context, creating thematic funds related to the environment may appear to be the best way to offer an investment that stands out, as it were, from the crowd.
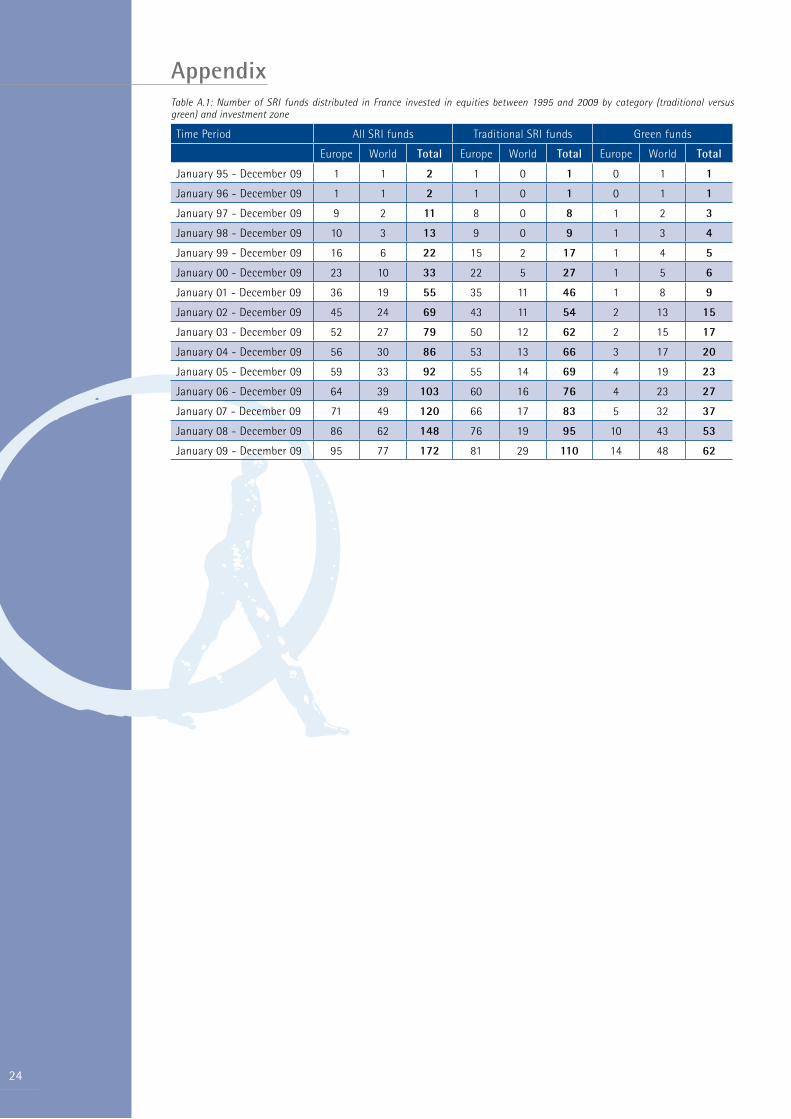
1 - A detailed table of the number of funds by category and geographic zone can be found in the appendix at the end of the document (see table A.1).
Graph 1: Change in the number of SRI funds distributed in France invested in equities between 1995 and 2009 by category (traditional versus green) and geographic zone.

8
2.1 DataThe data sample we use for this study was obtained by the same rules as those used in our first study. All equity funds distributed in France, whether they were registered in France, Belgium, or Luxembourg, boasting a socially responsible certification, and still available on December 31, 2009, were screened.
Extending the study period results in a fund database slightly different from that of the initial study, even over the longest period. Indeed, some funds must be removed for one reason or another, including closures of funds, mergers of funds with other SRI funds, mergers of funds with non-SRI funds, or the loss of the SRI orientation. Likewise, some funds, Belgium- or Luxembourg-registered funds only recently authorised for distribution in France, were added to our sample. Finally, we extended our study to green funds, made up of companies that do not necessarily meet all ESG criteria, but whose business had to do with preservation of the environment. Of course, for shorter periods we also added all newly created funds.
We referred to the lists of funds published by Novethic to create our sample, both for traditional SRI funds and for funds with an environmental orientation (green funds). We nonetheless added to our sample the few environmental funds not systematically using ESG criteria. These funds account for only a small share of our sample, since the majority of funds with an environmental orientation also apply an ESG filter. In the detailed presentation of our results, we always keep in mind the category the fund belongs to (traditional SRI funds, purely environmental funds with an SRI orientation, environmental funds without a systematic SRI filter).
Funds fall into one of two broad geographic zones, Europe and World, in keeping with
the investment zone mentioned in the prospectus. In the present study, the three geographic zones, France, the Euro-zone, and Europe, are in the same group, whereas they were three separate groups in our initial study. This grouping was done for several reasons. First, our earlier study provided evidence for similarity of behaviour in each of these three zones. Second, it was sometimes difficult to assign a fund to a zone (the difference between the Euro-zone and Europe was particularly blurry), as some funds change from one zone to another over time. In addition, hardly any funds are classified as investing only in France. This clustering is used to present the results of performance computation and to compute the average means of the funds. In each geographic zone, funds were placed in one of two broad categories: traditional SRI funds and green funds. Environmental funds, which are usually more recent creations, accounted for only a small share in our earlier study.
In the end, 172 funds (ninety-five in the Europe group and seventy-seven in the World group) have a data history of at least one year on December 31, 2009, including sixty-two green funds (fourteen in the Europe group and forty-eight in the World group). The two oldest funds in our sample, one in the Europe group and the other in the World group, were created in 1994. Sixty-nine of these funds (forty-five in the Europe group and twenty-four in the World group) have a data history of at least eight years, including thirteen green funds (two in the Europe group and eleven in the World group). Of the thirteen green funds, only three, all in the World group, do not systematically use the ESG criteria.
In our study we also include ten SRI market indices and four conventional market indices covering the main geographic zones.
2. Data and Methodology

9
2. Data and Methodology
Fund and index data were provided by EuroPerformance and Datastream. We used weekly data and computed total returns (dividend included) on Friday, as the few funds in our sample evaluated only once a week were evaluated on Friday.
In addition, for each investment zone, we compute an equal-weighted average mean of all SRI funds in existence during the study period, including those funds that do not survive to the end of the period and funds available over a period too short for individual analysis. These average means include 113 funds for the France-Euro-zone-Europe zone and ninety-seven funds for the World zone, resulting in a total of 210 SRI funds.
To compare the behaviour of green funds and that of traditional SRI funds, we also computed two sub-indices for each of these geographic zones. Such segregation was not done in the initial study. The Europe green index is made up of fifteen funds, six of which do not systematically use ESG criteria. The World green index is made up of fifty-one funds, thirteen of which do not systematically use ESG criteria. We observe that green funds account for a marginal proportion of the Europe SRI group, whereas they account for more than half of funds in the World group.
2.2 MethodologyThe purpose of the present study was to test the robustness of our earlier results. Thus, to make sure that the results are comparable, we used the same methodology as before, this time for our revised database with two additional years of data history.
As in the first study, we ran several computations for all funds and indices over periods of various lengths, the maximum period covering twelve years. We computed descriptive statistics and risk indicators
(average mean return, standard deviation, skewness, excess kurtosis, correlation of SRI funds and SRI indices, correlation of SRI funds and conventional indices, Cornish-Fisher VaR). We also computed a risk-adjusted absolute performance measure (with the Sharpe ratio) and relative performance measures (we used factor models, including the capital asset pricing model and the Fama-French three-factor model to evaluate fund alpha). In addition, we looked into whether swings in the price of oil influenced fund performance, especially that of green funds. To do so, we analysed fund performance with an additional four-factor model including the three Fama-French factors and a fourth factor measuring variation in oil prices. We also compared results obtained for the two categories of funds, traditional SRI and green funds, in order to sort possible differences in their risk and performance.
We do not describe here all the calculations we ran; the interested reader is referred to the first study (Le Sourd 2010). We describe only the new analyses done in this study, that is, a four-factor model and the Fama decomposition of alpha produced by a one-factor model.
2.2.1 Four-factor modelSince Sharpe (1964) devised his one-factor model, the search for the model that best describes the risks borne by a portfolio has been a challenge. These models make it possible to evaluate the risk premia corresponding to each source of risk, and thus allow us to describe in detail the sources of portfolio performance. Many studies have led to models that do not necessarily have theoretical foundations. The main objective of these studies was to prove by empirical validation that the models suit the asset (or fund) population they seek to analyse.

10
The earliest work is that of Ross (1976), who posits the arbitrage pricing theory (APT). This model uses five macro-economic factors, in addition to the market factor, including variation in oil prices. More recently, Fama and French (1993) have derived a three-factor model that, in addition to the market factor, takes into account style management (growth/value), as well as market capitalisation. Some years later, Carhart (1997) added a factor, momentum, to this model, thus devising a four-factor model. Earlier, Elton et al. (1993) proposed an index model, also validated empirically, with three factors.
The model we proposed to use draws on the Fama-French and the index models. It had no theoretical foundations. However, if we refer to the literature, any empirical multi-factor model can be justified as soon as it produces informative results. This model has four factors, including the Fama-French factors and a factor that measures variations in the price of oil. It was designed specifically to analyse the influence of this additional factor on the performance of funds in the green group. This model is written as follows:
RPt − RFt = αP + bP1(RMt − RFt ) + bP 2(SMBt )
+bP 3(HMLt ) + bP 4RCr _Oil ,t + εPt
where: RPt is the return of portfolio P at time t
RFt is the rate of return of the risk-free asset at time t
RMt is the return of the market portfolio at time t
SMBt (small minus big) is the difference at time t between returns on two portfolios: a small-capitalisation portfolio and a large-capitalisation portfolio
HMLt (high minus low) is the difference at time t between returns on two portfolios: a portfolio with a high book-to-market ratio and a portfolio with a low book-to-market ratio
RCr _Oil ,t is the change in the price of oil
bPk , k = 1 to 4, are the factor loadings
εPt is the portfolio residual return not explained by the model.
The choice of the set of analysis factors is essential for sound implementation of factor models. As explained in the data section, funds were assigned to one of two main groups by their geographical investment zone (Europe and World), such that funds invested in France, the Euro-zone, and Europe make up a single group. However, the set of analysis factors (France, Euro-zone, and Europe) that best suits each fund was used to do the individual fund study, whereas the Euro-zone factors were
2. Data and Methodology
France Euro-zone Europe International
Market index SBF 250 DJ Euro Stoxx DJ Stoxx MSCI World
Value index DJ Euro Stoxx TM Large Value
DJ Euro Stoxx TM Large Value
DJ Stoxx TM Large Value
MSCI World Value
Growth index DJ Euro Stoxx TM Large Growth
DJ Euro Stoxx TM Large Growth
DJ Stoxx TM Large Growth
MSCI World Growth
Small-cap index France CAC Small 902 DJ Euro Stoxx Small DJ Stoxx Small MSCI World Small Cap
Large-cap index France CAC 403 DJ Euro Stoxx 50 DJ Stoxx 50 MSCI World
Risk-free rate Euribor 3-month offered rate (Pibor 3-
month for 1998)
Euribor 3-month offered rate (Pibor 3-
month for 1998)
Euribor 3-month offered rate (Pibor 3-month for 1998)
Euribor 3-month offered rate (Pibor 3-month for 1998)
SRI index DJSI France4 DJ Euro Stoxx Sustainability
DJ Stoxx Sustainability DJSI World
Crude oil HWWI Crude oil Eurozone (Euro)5
Table 1: List of style indices used in the factor models for each investment zone
2 - For funds with a data history beginning after January 1999. For older funds, we use the DJ Euro Stoxx Small index.3 - For funds with a data history beginning after January 1999. For older funds, we use the DJ Euro Stoxx 50.4 - The DJSI France index is not provided by Dow Jones, but computed by Datastream as a subset of the DJSI World Composite index, including only French assets. This index has only twenty components.5 - Published by the Hamburg Institute of International Economics.
11
2. Data and Methodology
used to analyse the mean average of all these funds. In the detailed presentation of the results, we indicate for each fund the category specified in the prospectus at the present time. At the same time, some Euro-zone sub-section funds were analysed with the Europe set of indices, whereas some Europe sub-section funds were analysed with the Euro-zone set of indices, as it appears more suitable. Table 1 shows the list of indices used in the factor model for each geographic zone.
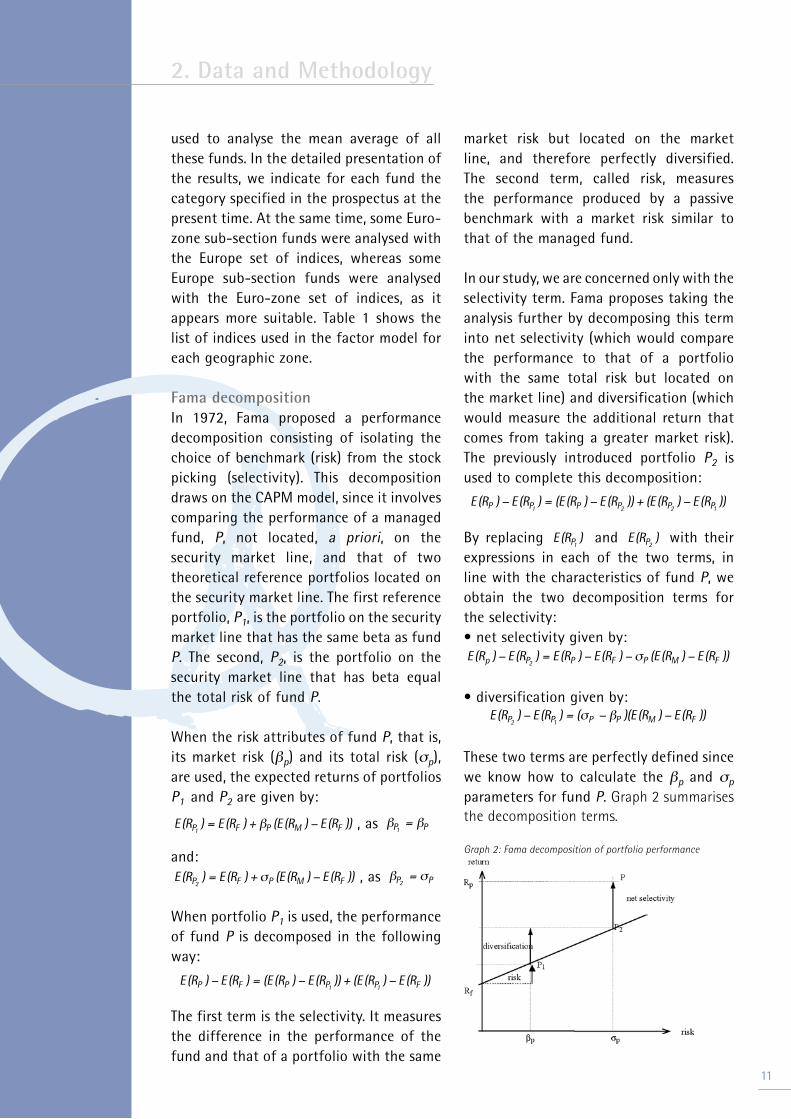
Fama decomposition In 1972, Fama proposed a performance decomposition consisting of isolating the choice of benchmark (risk) from the stock picking (selectivity). This decomposition draws on the CAPM model, since it involves comparing the performance of a managed fund, P, not located, a priori, on the security market line, and that of two theoretical reference portfolios located on the security market line. The first reference portfolio, P1, is the portfolio on the security market line that has the same beta as fund P. The second, P2, is the portfolio on the security market line that has beta equal the total risk of fund P.
When the risk attributes of fund P, that is, its market risk (βp) and its total risk (σp), are used, the expected returns of portfolios P1 and P2 are given by:
E (RP1
) = E (RF ) + βP (E (RM ) − E (RF )) , as βP1= βP
and:
E (RP2
) = E (RF ) + σP (E (RM ) − E (RF )) , as βP2= σP
When portfolio P1 is used, the performance of fund P is decomposed in the following way:
E (RP ) − E (RF ) = (E (RP ) − E (RP1
)) + (E (RP1) − E (RF ))
The first term is the selectivity. It measures the difference in the performance of the fund and that of a portfolio with the same
market risk but located on the market line, and therefore perfectly diversified. The second term, called risk, measures the performance produced by a passive benchmark with a market risk similar to that of the managed fund.
In our study, we are concerned only with the selectivity term. Fama proposes taking the analysis further by decomposing this term into net selectivity (which would compare the performance to that of a portfolio with the same total risk but located on the market line) and diversification (which would measure the additional return that comes from taking a greater market risk). The previously introduced portfolio P2 is used to complete this decomposition:
E (RP ) − E (RP1
) = (E (RP ) − E (RP2)) + (E (RP2
) − E (RP1))
By replacing E (RP1
) and E (RP2
) with their expressions in each of the two terms, in line with the characteristics of fund P, we obtain the two decomposition terms for the selectivity: • net selectivity given by:
E (Rp ) − E (RP2
) = E (RP ) − E (RF ) − σP (E (RM ) − E (RF ))
• diversification given by:
E (RP2
) − E (RP1) = (σP − βP )(E (RM ) − E (RF ))
These two terms are perfectly defined since we know how to calculate the βp and σp parameters for fund P. Graph 2 summarises the decomposition terms.
Graph 2: Fama decomposition of portfolio performance

12
2. Data and Methodology
This graph assumes that the return on fund P is higher than that on portfolio P2, producing positive net selectivity. Of course, this term can also be negative. Concerning the diversification term, we should expect a positive term, as the total risk is greater than the market risk, and as the return on the risky market portfolio should be greater than the risk-free rate. All the same, the market excess return can become negative in periods of falling markets, resulting in a negative diversification term.
Using Fama (1972), we decomposed the alpha produced by the CAPM model into net selectivity and diversification. This decomposition allows us to separate the contribution to alpha that comes from the choice of the fund’s risk from that resulting from stock picking alone.

We present here a selection of results focusing on two periods. The first is an eight-year period, beginning in January 2002 and ending in December 2009. As in our previous study, we choose to begin our main analysis in 2002, as it was in this year that the number of funds available became considerable. As a result, we can reconcile a sufficient number of funds with a fairly long period. During this period, we have available sixty-nine funds, including forty-five in the Europe group and twenty-four in the World group. Thirteen of them, two in Europe and eleven in World, are classified as green funds.
The second period we select is a three-year period beginning in January 2007 and ending in December 2009. Considering this shorter period allows us to increase the size of our fund sample—as well as the share of green funds—substantially and to focus on the period of the financial crisis. During this period, 120 funds are available, including seventy-one in the Europe group and forty-nine in the World group. Thirty-six funds, five in Europe and thirty-one in World, are green funds. There are nearly twice as many funds—and nearly three times as many green funds—as in the eight-year period.
We choose not to present results for periods shorter than three years, as a minimum of three years appears to be necessary to have enough data for the regression analysis to be considered informative.
3.1 Long Time Period Analysis: 2002-2009For the period from 2002 to 2009, we analysed sixty-nine individual funds. At the same time, as many as 210 funds participate in the indices representing the fund mean average, as they include all funds available, whether their data history covers the entire period or not.
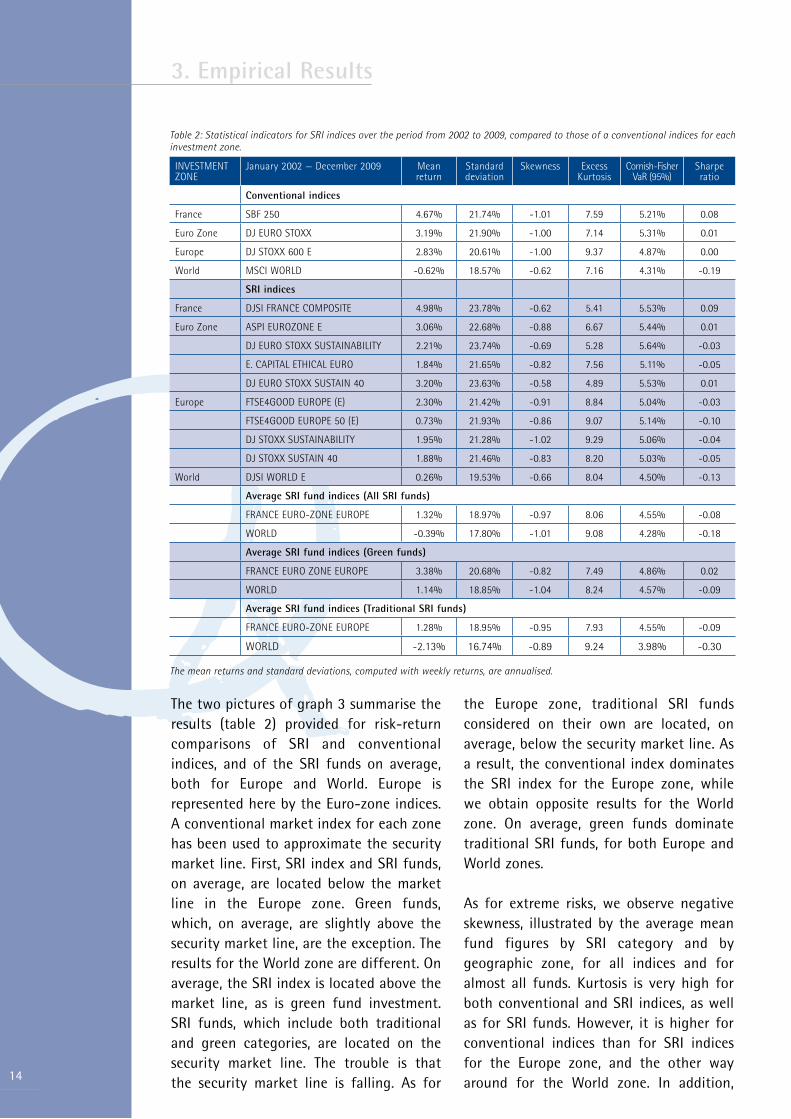
3.1.1 Statistical indicatorsTable 2 shows the mean return, standard deviation, skewness, and kurtosis for indices, including conventional indices, SRI market indices, and the average SRI fund indices, for Europe and World zones. Market indices for the Europe group are segmented, in keeping with the segmentation of the market, into France, the Euro-zone, and Europe. Extreme risk indicators (Cornish-Fisher VaR) and absolute risk-adjusted performance measures (Sharpe ratio) are also shown.
It turns out that SRI indices exhibit higher risk, measured by both standard deviation and Cornish-Fisher VaR, than conventional indices. We observe that France and World SRI indices posted higher risk-adjusted returns than their conventional counterparts, while we observe the opposite results for the Euro-zone and Europe indices. Green funds, on average, posted higher returns than traditional SRI funds, with a slightly higher risk, leading to higher Sharpe ratios, both for Europe and World zones, though still negative for the World zone. These results can be plotted graphically.
Graph 3: Risk/return comparison of SRI and conventional investment, and of green and traditional SRI, for Europe and World investment zones
3. Empirical Results
13
14
The two pictures of graph 3 summarise the results (table 2) provided for risk-return comparisons of SRI and conventional indices, and of the SRI funds on average, both for Europe and World. Europe is represented here by the Euro-zone indices. A conventional market index for each zone has been used to approximate the security market line. First, SRI index and SRI funds, on average, are located below the market line in the Europe zone. Green funds, which, on average, are slightly above the security market line, are the exception. The results for the World zone are different. On average, the SRI index is located above the market line, as is green fund investment. SRI funds, which include both traditional and green categories, are located on the security market line. The trouble is that the security market line is falling. As for
the Europe zone, traditional SRI funds considered on their own are located, on average, below the security market line. As a result, the conventional index dominates the SRI index for the Europe zone, while we obtain opposite results for the World zone. On average, green funds dominate traditional SRI funds, for both Europe and World zones.
As for extreme risks, we observe negative skewness, illustrated by the average mean fund figures by SRI category and by geographic zone, for all indices and for almost all funds. Kurtosis is very high for both conventional and SRI indices, as well as for SRI funds. However, it is higher for conventional indices than for SRI indices for the Europe zone, and the other way around for the World zone. In addition,
3. Empirical Results
Table 2: Statistical indicators for SRI indices over the period from 2002 to 2009, compared to those of a conventional indices for each investment zone.
INVESTMENT ZONE
January 2002 — December 2009 Mean return
Standard deviation
Skewness Excess Kurtosis
Cornish-Fisher VaR (95%)
Sharpe ratio
Conventional indices
France SBF 250 4.67% 21.74% -1.01 7.59 5.21% 0.08
Euro Zone DJ EURO STOXX 3.19% 21.90% -1.00 7.14 5.31% 0.01
Europe DJ STOXX 600 E 2.83% 20.61% -1.00 9.37 4.87% 0.00
World MSCI WORLD -0.62% 18.57% -0.62 7.16 4.31% -0.19
SRI indices
France DJSI FRANCE COMPOSITE 4.98% 23.78% -0.62 5.41 5.53% 0.09
Euro Zone ASPI EUROZONE E 3.06% 22.68% -0.88 6.67 5.44% 0.01
DJ EURO STOXX SUSTAINABILITY 2.21% 23.74% -0.69 5.28 5.64% -0.03
E. CAPITAL ETHICAL EURO 1.84% 21.65% -0.82 7.56 5.11% -0.05
DJ EURO STOXX SUSTAIN 40 3.20% 23.63% -0.58 4.89 5.53% 0.01
Europe FTSE4GOOD EUROPE (E) 2.30% 21.42% -0.91 8.84 5.04% -0.03
FTSE4GOOD EUROPE 50 (E) 0.73% 21.93% -0.86 9.07 5.14% -0.10
DJ STOXX SUSTAINABILITY 1.95% 21.28% -1.02 9.29 5.06% -0.04
DJ STOXX SUSTAIN 40 1.88% 21.46% -0.83 8.20 5.03% -0.05
World DJSI WORLD E 0.26% 19.53% -0.66 8.04 4.50% -0.13
Average SRI fund indices (All SRI funds)
FRANCE EURO-ZONE EUROPE 1.32% 18.97% -0.97 8.06 4.55% -0.08
WORLD -0.39% 17.80% -1.01 9.08 4.28% -0.18
Average SRI fund indices (Green funds)
FRANCE EURO ZONE EUROPE 3.38% 20.68% -0.82 7.49 4.86% 0.02
WORLD 1.14% 18.85% -1.04 8.24 4.57% -0.09
Average SRI fund indices (Traditional SRI funds)
FRANCE EURO-ZONE EUROPE 1.28% 18.95% -0.95 7.93 4.55% -0.09
WORLD -2.13% 16.74% -0.89 9.24 3.98% -0.30
The mean returns and standard deviations, computed with weekly returns, are annualised.

green funds exhibit lower kurtosis than traditional SRI funds. Moreover, kurtosis is considerably greater than in our initial study, which does not include the financial crisis, as the data period ended in December 2007. Our present analysis shows kurtosis figures ranging from five to nine for both conventional and SRI indices, whereas these values ranged from one to two during the period that does not include the financial crisis. In the same way, SRI funds exhibit, on average, kurtosis ranging from 7.5 to nine in the present analysis, whereas it was from 1.5 to 5.5 before the financial crisis. These results show that both indices and SRI funds produced returns far from their means during the financial crisis and that these extreme returns were more often negative than positive, as skewness is negative.
Value-at-Risk (VaR) computations also reveal interesting results. VaR measures the percentage of portfolio value that can be lost in one week. The VaR of SRI indices is slightly higher than that of conventional indices for each investment zone. In addition, the VaR of green funds is slightly higher than that of traditional SRI funds.
The general conclusion is that SRI funds were not spared the increase of extreme risks during the financial crisis.
To complete the description of the sample, we looked at the correlations of indices and analysis factors as well as the correlations of funds and analysis factors. The results are summarised in table 3.
3. Empirical Results
15
Table 3: Conventional and SRI indices correlations with the various analysis factors
Correlations with
INVESTMENT ZONE
January 2002 — December 2009 Market SRI Index
Value Growth Small Cap
Large Cap
Crude Oil Price
Conventional indices
France SBF 250 1.00 0.97 0.97 0.95 0.91 0.97 0.16
Euro-Zone DJ EURO STOXX 1.00 0.99 0.98 0.97 0.92 0.99 0.16
Europe DJ STOXX 600 E 1.00 0.99 0.98 0.98 0.92 0.99 0.16
World MSCI WORLD 1.00 0.98 0.99 0.99 0.94 1.00 0.17
SRI indices
France DJSI FRANCE COMPOSITE 0.97 1.00 0.95 0.91 0.86 0.95 0.14
Euro-Zone ASPI EUROZONE E 1.00 0.99 0.98 0.97 0.89 1.00 0.14
DJ EURO STOXX SUSTAINABILITY 0.99 1.00 0.98 0.97 0.88 0.99 0.15
E. CAPITAL ETHICAL EURO 0.98 0.97 0.96 0.95 0.90 0.97 0.15
DJ EURO STOXX SUSTAIN 40 0.98 0.99 0.97 0.96 0.89 0.98 0.14
Europe FTSE4GOOD EUROPE (E) 1.00 1.00 0.98 0.97 0.90 0.99 0.15
FTSE4GOOD EUROPE 50 (E) 0.98 0.99 0.98 0.97 0.85 0.99 0.15
DJ STOXX SUSTAINABILITY 0.99 1.00 0.98 0.97 0.89 0.99 0.15
DJ STOXX SUSTAIN 40 0.98 0.99 0.96 0.97 0.86 0.98 0.15
World DJSI WORLD E 0.98 1.00 0.97 0.97 0.91 0.98 0.16
Average SRI fund indices (All SRI funds)
FRANCE EURO-ZONE EUROPE 0.96 0.95 0.94 0.93 0.92 0.94 0.15
WORLD 0.94 0.94 0.92 0.94 0.94 0.94 0.19
Average SRI fund indices (Green funds)
FRANCE EURO-ZONE EUROPE 0.90 0.89 0.87 0.88 0.87 0.88 0.16
WORLD 0.92 0.92 0.90 0.92 0.93 0.92 0.21
Average SRI fund indices (Traditional SRI funds)
FRANCE EURO-ZONE EUROPE 0.97 0.95 0.95 0.93 0.92 0.95 0.15
WORLD 0.96 0.96 0.95 0.94 0.94 0.96 0.17
16
This table shows that green funds are slightly less correlated with market and style indices than traditional SRI funds, and slightly more correlated with the index measuring the variation of crude oil prices. In addition, funds from the World group are, on average, more highly correlated with the variation of crude oil price than those from the Europe group.
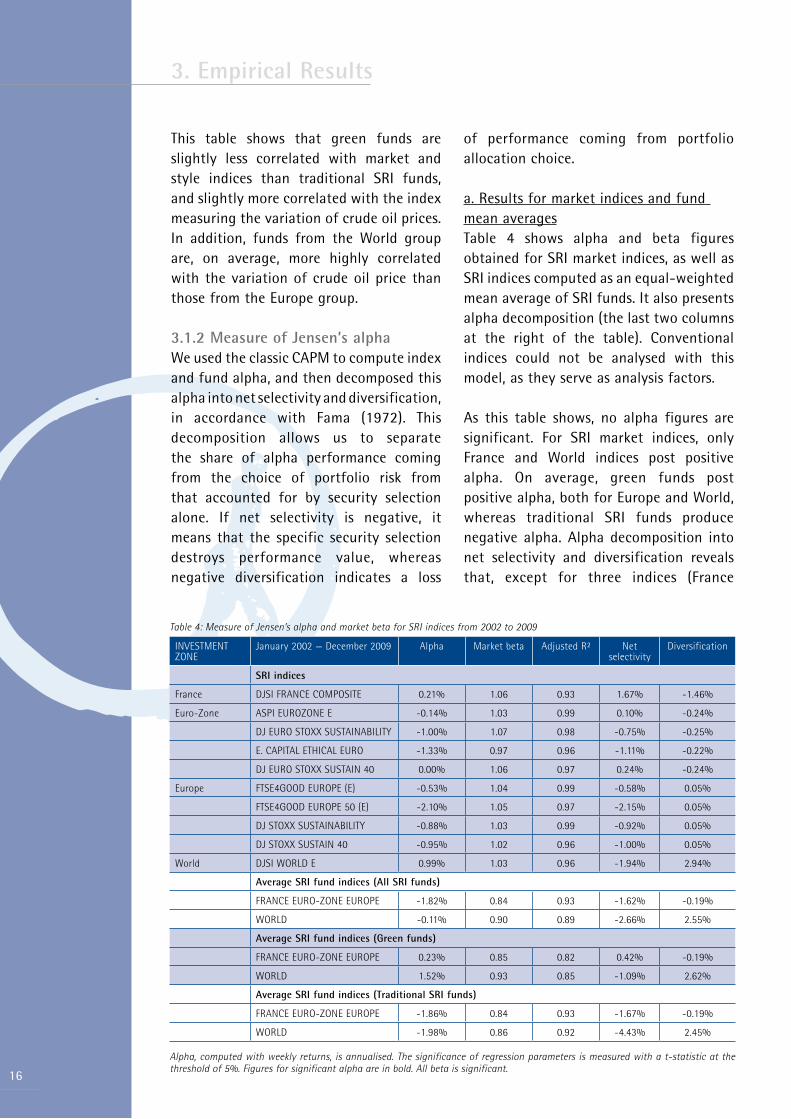
3.1.2 Measure of Jensen’s alphaWe used the classic CAPM to compute index and fund alpha, and then decomposed this alpha into net selectivity and diversification, in accordance with Fama (1972). This decomposition allows us to separate the share of alpha performance coming from the choice of portfolio risk from that accounted for by security selection alone. If net selectivity is negative, it means that the specific security selection destroys performance value, whereas negative diversification indicates a loss
of performance coming from portfolio allocation choice.
a. Results for market indices and fund mean averagesTable 4 shows alpha and beta figures obtained for SRI market indices, as well as SRI indices computed as an equal-weighted mean average of SRI funds. It also presents alpha decomposition (the last two columns at the right of the table). Conventional indices could not be analysed with this model, as they serve as analysis factors.
As this table shows, no alpha figures are significant. For SRI market indices, only France and World indices post positive alpha. On average, green funds post positive alpha, both for Europe and World, whereas traditional SRI funds produce negative alpha. Alpha decomposition into net selectivity and diversification reveals that, except for three indices (France
3. Empirical Results
Table 4: Measure of Jensen’s alpha and market beta for SRI indices from 2002 to 2009
INVESTMENT ZONE
January 2002 — December 2009 Alpha Market beta Adjusted R² Net selectivity
Diversification
SRI indices
France DJSI FRANCE COMPOSITE 0.21% 1.06 0.93 1.67% -1.46%
Euro-Zone ASPI EUROZONE E -0.14% 1.03 0.99 0.10% -0.24%
DJ EURO STOXX SUSTAINABILITY -1.00% 1.07 0.98 -0.75% -0.25%
E. CAPITAL ETHICAL EURO -1.33% 0.97 0.96 -1.11% -0.22%
DJ EURO STOXX SUSTAIN 40 0.00% 1.06 0.97 0.24% -0.24%
Europe FTSE4GOOD EUROPE (E) -0.53% 1.04 0.99 -0.58% 0.05%
FTSE4GOOD EUROPE 50 (E) -2.10% 1.05 0.97 -2.15% 0.05%
DJ STOXX SUSTAINABILITY -0.88% 1.03 0.99 -0.92% 0.05%
DJ STOXX SUSTAIN 40 -0.95% 1.02 0.96 -1.00% 0.05%
World DJSI WORLD E 0.99% 1.03 0.96 -1.94% 2.94%
Average SRI fund indices (All SRI funds)
FRANCE EURO-ZONE EUROPE -1.82% 0.84 0.93 -1.62% -0.19%
WORLD -0.11% 0.90 0.89 -2.66% 2.55%
Average SRI fund indices (Green funds)
FRANCE EURO-ZONE EUROPE 0.23% 0.85 0.82 0.42% -0.19%
WORLD 1.52% 0.93 0.85 -1.09% 2.62%
Average SRI fund indices (Traditional SRI funds)
FRANCE EURO-ZONE EUROPE -1.86% 0.84 0.93 -1.67% -0.19%
WORLD -1.98% 0.86 0.92 -4.43% 2.45%
Alpha, computed with weekly returns, is annualised. The significance of regression parameters is measured with a t-statistic at the threshold of 5%. Figures for significant alpha are in bold. All beta is significant.

and two of four Euro-zone indices) and for Europe green funds, on average,6 the greater negative contribution comes from net selectivity. Even the net selectivity of World green funds is, on average, negative, though alpha is globally positive. Diversification is positive for Europe and World indices, as well as for all World mean averages. For World SRI funds, on average, security selection makes a negative contribution to alpha, whereas portfolio allocation makes a positive contribution. For Europe SRI funds, on average, both
stock selection and portfolio allocation make negative contributions.
b. Results for individual SRI fundsTable 5 shows only average and extreme alpha and beta values for SRI funds, as well as the number of funds with positive, negative, and significant alpha (for more detailed results, see table A.2 in the appendix).
The detailed results show that most figures for alpha are negative. The World
3. Empirical Results
17
Table 5: Measure of Jensen’s alpha and market beta for SRI funds from 2002 to 2009
Alpha Market Beta
January 2002 — December 2009 Mean Min Max Nb of alpha>O
(significant)
Nb of alpha<O
(significant)
Mean Min Max Nb of significant
beta
All SRI funds
FRANCE EURO-ZONE EUROPE (45 funds)
-1.69% -5.92% 3.35% 7 38 0.89 0.65 1.02 45
(0) (4)
WORLD (24 funds) 0.25% -5.28% 8.04% 12 12 0.93 0.66 1.09 24
(0) (0)
Green Funds
FRANCE EURO-ZONE EUROPE (2 funds)
-2.49% -3.47% -1.50% 0 2 0.90 0.82 0.99 2
(0) (0)
WORLD (13 funds) 1.76% -1.24% 8.04% 4 9 0.96 0.72 1.09 13
(0) (0)
Traditional SRI funds
FRANCE EURO-ZONE EUROPE (43 funds)
-1.65% -5.92% 3.35% 7 36 0.89 0.65 1.02 43
(0) (4)
WORLD (11 funds) -1.53% -5.28% 0.86% 8 3 0.90 0.66 1.00 11
(0) (0)
Alpha, computed with weekly returns, is annualised. The significance of regression parameters is measured with a t-statistic at the threshold of 5%.
6 - This average was computed with very few funds for most of the data history.
Table 6: Decomposition of Jensen’s alpha over the period from 2002 to 2009
Net Selectivity Diversification
January 2002 — December 2009 >0 <0 >0 <0
All SRI funds
FRANCE EURO-ZONE EUROPE (45 funds) 9 36 9 36
WORLD (24 funds) 5 19 24 0
Green Funds
FRANCE EURO-ZONE EUROPE (2 funds) 0 2 0 2
WORLD (13 funds) 5 8 13 0
Traditional SRI funds
FRANCE EURO-ZONE EUROPE (43 funds) 9 34 9 34
WORLD (11 funds) 0 11 11 0

18
group, however, posts as many negative as positive figures; there are more instances of positive alpha in the green group than in the traditional SRI group. Only four funds in the Europe traditional SRI group produce significant alpha; it is negative, however.
Table 6 sums up the results for breakdown of Jensen’s alpha into net selectivity and diversification We observe that, for a vast majority of funds, net selectivity makes the larger negative contribution to alpha. Only fourteen of sixty-nine funds exhibit positive net selectivity. The five World funds with positive net selectivity are all green funds. Diversification is positive for all funds in the World group but negative for a majority of the funds from the Europe group.
3.1.3 Measure of alpha obtained with the Fama-French three-factor model
a. Results for market indices and fund mean averagesTable 7 presents results obtained with the three-factor model for SRI indices and the SRI fund averages. It turns out that six (France, three in the Euro-zone, one each in Europe and World) of ten SRI market indices produce positive but not significant alpha. All SRI fund mean averages produce negative alpha, but only traditional SRI fund figures are significant. On average, green funds produce less negative alpha than traditional SRI funds. SRI market indices exhibit a large-cap bias, whereas SRI funds, on average, exhibit a small-cap bias. All these biases are significant. Comparing traditional SRI funds and green funds, we observe a significant growth bias for green funds, on average, whereas traditional SRI funds have a value bias, significant only for the Europe group.
3. Empirical Results
Table 7: Measure of alpha obtained with the Fama-French three-factor model and of the style-factor exposures for SRI indices from 2002 to 2009
INVESTMENT ZONE
January 2002 — December 2009 Alpha Market beta V-G beta SC-LC beta Adjusted R²
SRI indices
France DJSI FRANCE COMPOSITE 0.47% 1.02 0.10 -0.13 0.94
Euro- Zone ASPI EUROZONE E 0.78% 1.01 -0.01 -0.13 1.00
DJ EURO STOXX SUSTAINABILITY 0.41% 1.05 -0.05 -0.16 0.99
E. CAPITAL ETHICAL EURO -1.12% 0.97 -0.02 -0.01 0.96
DJ EURO STOXX SUSTAIN 40 0.63% 1.05 -0.03 -0.06 0.97
Europe FTSE4GOOD EUROPE (E) -0.06% 1.03 0.00 -0.07 0.99
FTSE4GOOD EUROPE 50 (E) -0.32% 1.02 -0.01 -0.27 0.99
DJ STOXX SUSTAINABILITY -0.27% 1.01 0.03 -0.11 0.99
DJ STOXX SUSTAIN 40 0.55% 1.01 -0.10 -0.18 0.97
World DJSI WORLD E 1.33% 1.03 0.02 -0.09 0.96
Average SRI fund indices (All SRI funds)
FRANCE EURO-ZONE EUROPE -3.23% 0.87 0.03 0.18 0.94
WORLD -1.75% 0.92 -0.11 0.43 0.91
Average SRI fund indices (Green funds)
FRANCE EURO-ZONE EUROPE -0.35% 0.91 -0.13 0.23 0.83
WORLD -0.35% 0.96 -0.20 0.53 0.89
Average SRI fund indices (Traditional SRI funds)
FRANCE EURO-ZONE EUROPE -3.32% 0.86 0.05 0.17 0.94
WORLD -3.32% 0.87 0.03 0.30 0.93
Alpha, computed with weekly returns, is annualised. The significance of regression parameters is measured with a t-statistic at the threshold of 5%. Figures for significant alpha are in bold; beta that is not statistically significant is in italics.

b. Results for individual SRI fundsTable 8 displays only average and extreme values, as well as the number of funds with positive, negative, and significant alpha for individual SRI funds. It also provides a summary of the style biases identified (for more detailed results, see table A.3 in the appendix).
The results show that negative alpha predominates; it is significant in only five instances, all in the traditional SRI group (four in World and one in Europe). None of the positive alpha is significant. Biases identified for individual funds confirm the results for the fund averages. Small-cap bias prevails in SRI funds. A large majority of green funds exhibit a growth bias, whereas value bias is slightly greater in the traditional SRI group.
3.1.4 Measure of alpha obtained with the four-factor model
a. Results for market indices and fund mean averagesTable 9 presents the results obtained with the four-factor model, made of the Fama-French factors and a factor measuring the variation of crude oil prices, for SRI indices and SRI funds on average.
The results are very similar to those obtained with the Fama-French three-factor model, for both SRI market indices and SRI funds on average. Again, traditional SRI funds produce the only significant—though negative—alpha. On average, SRI funds are only slightly exposed to swings in the price of oil, with a statistically significant but very small (0.02) value for World green funds.
b. Results for individual SRI fundsTable 10 displays only average and extreme values, as well as the number of funds with positive, negative, and significant alpha
3. Empirical Results
19
Table 8: Measure of alpha obtained with the Fama-French three-factor model and of the style-factor exposures for SRI funds from 2002 to 2009
Alpha Biases measured by beta
January 2002 — December 2009
Mean Min Max Nb of alpha>O (signif.)
Nb of alpha<O (signif.)
Value (signif.)
Growth (signif.)
Small Cap (signif.)
Large Cap (signif.)
All SRI funds
FRANCE EURO-ZONE EUROPE (45 funds)
-2.68% -6.74% 1.12% 2 43 26 19 34 11
(0) (4) (11) (8) (27) (7)
WORLD (24 funds) -1.27% -6.87% 7.64% 6 18 8 16 20 4
(0) (1) (6) (9) (18) (2)
Green Funds
FRANCE EURO-ZONE EUROPE (2 funds)
-3.30% -5.65% -0.95% 0 2 1 1 2 0
(0) (0) (0) (1) (2) (0)
WORLD (13 funds) -0.07% -4.60% 7.64% 6 7 2 11 12 1
(0) (0) (2) (6) (12) (1)
Traditional SRI funds
FRANCE EURO-ZONE EUROPE (43 funds)
-2.65% -6.74% 1.12% 2 41 25 18 32 11
(0) (4) (11) (7) (25) (7)
WORLD (11 funds) -2.69% -6.87% -0.99% 0 11 6 5 8 3
(0) (1) (4) (3) (6) (1)
Alpha, computed with weekly returns is annualised. The significance of regression parameters is measured with a t-statistic at the threshold of 5%.

20
for individual SRI funds. It also provides a summary of the style biases identified
(for more detailed results see table A.4 in appendix).
3. Empirical Results
Table 9: Measure of alpha obtained with the four-factor model and of the style-factor exposures for SRI indices from 2002 to 2009
INVESTMENT ZONE
January 2002 — December 2009 alpha Market beta V-G beta SC-LC beta
Crude oil price beta
Adjusted R²
SRI indices
France DJSI FRANCE COMPOSITE 0.61% 1.02 0.10 -0.13 -0.01 0.94
Euro-Zone ASPI EUROZONE E 0.88% 1.01 -0.01 -0.13 -0.01 1.00
DJ EURO STOXX SUSTAINABILITY 0.46% 1.05 -0.05 -0.16 0.00 0.99
E. CAPITAL ETHICAL EURO -1.12% 0.97 -0.02 -0.01 0.00 0.96
DJ EURO STOXX SUSTAIN 40 0.79% 1.06 -0.03 -0.06 -0.01 0.97
Europe FTSE4GOOD EUROPE (E) -0.01% 1.03 0.00 -0.07 0.00 0.99
FTSE4GOOD EUROPE 50 (E) -0.37% 1.02 -0.01 -0.27 0.00 0.99
DJ STOXX SUSTAINABILITY -0.25% 1.01 0.03 -0.11 0.00 0.99
DJ STOXX SUSTAIN 40 0.53% 1.01 -0.10 -0.18 0.00 0.97
World DJSI WORLD E 1.35% 1.03 0.02 -0.09 0.00 0.96
Average SRI fund indices (All SRI funds)
FRANCE EURO-ZONE EUROPE -3.20% 0.87 0.03 0.18 0.00 0.94
WORLD -1.90% 0.92 -0.11 0.43 0.01 0.91
Average SRI fund indices (Green funds)
FRANCE EURO-ZONE EUROPE -0.47% 0.91 -0.14 0.22 0.01 0.83
WORLD -0.62% 0.96 -0.21 0.51 0.02 0.89
Average SRI fund indices (Traditional SRI funds)
FRANCE EURO-ZONE EUROPE -3.28% 0.86 0.05 0.17 0.00 0.94
WORLD -3.29% 0.87 0.03 0.30 0.00 0.93
Alpha, computed with weekly returns, is annualised. The significance of regression parameters is measured with a t-statistic at the threshold of 5%. Figures for significant alpha are in bold; beta that is not statistically significant is in italics.
Table 10: Measure of alpha obtained with the four-factor model and of the style-factor exposures for SRI funds from 2002 to 2009
Alpha Biases measured by beta Crude oil beta
January 2002 — December 2009
Mean Min Max Nb of alpha>O (signif.)
Nb of alpha<O (signif.)
Value (signif.)
Growth (signif.)
Small Cap
(signif.)
Large Cap
(signif.)
Nb signif.
All SRI funds
FRANCE EURO-ZONE EUROPE (45 funds)
-2.64% -6.77% 1.05% 2 43 26 19 34 11 5
(0) (3) (10) (8) (27) (7)
WORLD (24 funds) -1.39% -6.72% 5.57% 6 18 8 16 20 4 6
(0) (1) (6) (9) (17) (2)
Green Funds
FRANCE EURO-ZONE EUROPE (2 funds)
-3.23% -5.21% -1.24% 0 2 1 1 2 0 2
(0) (0) (0) (1) (2) (0)
WORLD (13 funds) -0.27% -4.94% 5.57% 6 7 2 11 12 1 4
(0) (0) (2) (6) (11) (1)
Traditional SRI funds
FRANCE EURO-ZONE EUROPE (43 funds)
-2.62% -6.77% 1.05% 2 41 25 18 32 11 3
(0) (3) (10) (7) (25) (7)
WORLD (11 funds) -2.72% -6.72% -0.90% 0 11 6 5 8 3 2
(0) (1) (4) (3) (6) (1)
Alpha, computed with weekly returns is annualised. The significance of regression parameters is measured with a t-statistic at the threshold of 5%.

As for SRI indices and SRI fund mean averages, the results are again very similar to those obtained with the three-factor model, for both alpha and style biases. The same four funds produce significant negative alpha. Small-cap bias is dominant; green funds, for the most part, have a growth bias, whereas traditional SRI funds tend to have a value bias. Only eleven funds, proportionally more numerous in the World group and among green funds (four of thirteen World funds and both Europe green funds) are significantly exposed to changes in the price of oil.
3.2 Financial crisis: 2007-2009During this period, we analysed 120 individual funds (seventy-one Europe, forty-nine World), thirty-six of which are classified as green funds (five Europe and thirty-one World). In the World group, Green funds predominate, whereas there are few of them in the Europe group. We present here the results we obtained with the four-factor model, very similar
to those obtained with the Fama-French three-factor model in terms of alpha and style biases.
a. Results for market indices and fund mean averagesTable 11 presents the results obtained with the four-factor model for SRI indices and the SRI fund averages. The results obtained for this period show that no alpha is significant for either indices or the fund averages. Eight of ten SRI indices generate positive alpha, but none of it is significant. World green funds also exhibit, on average, positive, but, again, not significant alpha. Other indices and mean averages produce negative but not statistically significant alpha.
SRI indices still exhibit a large-cap bias, whereas SRI funds, on average, exhibit a small-cap bias. These biases are significant. These results are similar to those obtained over the period from 2002 to 2009. Green funds, on average, have a growth bias,
3. Empirical Results
21
Table 11: Measure of alpha obtained with the four-factor model and of the style-factor exposures for SRI indices from 2007 to 2009
INVESTMENT ZONE
January 2007 — December 2009 Alpha Market beta
V-G beta SC-LC beta Crude oil price beta
Adjusted R²
SRI indices
France DJSI FRANCE COMPOSITE -0.64% 1.03 0.07 -0.15 -0.01 0.97
Euro-Zone ASPI EUROZONE E 1.54% 1.00 0.01 -0.14 -0.01 1.00
DJ EURO STOXX SUSTAINABILITY 1.03% 1.02 -0.04 -0.17 0.00 0.99
E. CAPITAL ETHICAL EURO -1.04% 1.01 -0.04 0.01 -0.01 0.97
DJ EURO STOXX SUSTAIN 40 0.76% 1.03 -0.11 -0.10 -0.01 0.98
Europe FTSE4GOOD EUROPE (E) 0.82% 1.03 0.00 -0.07 -0.01 0.99
FTSE4GOOD EUROPE 50 (E) 0.10% 1.03 -0.03 -0.29 0.00 0.99
DJ STOXX SUSTAINABILITY 0.07% 1.01 0.05 -0.08 0.00 0.99
DJ STOXX SUSTAIN 40 1.19% 0.96 -0.12 -0.20 0.01 0.97
World DJSI WORLD E 2.02% 1.06 0.00 -0.09 0.01 0.96
Average SRI fund indices (All SRI funds)
FRANCE EURO-ZONE EUROPE -2.65% 0.83 0.04 0.14 0.00 0.98
WORLD -0.60% 0.98 -0.30 0.35 0.02 0.92
Average SRI fund indices (Green funds)
FRANCE EURO-ZONE EUROPE -3.64% 0.84 -0.09 0.33 0.01 0.90
WORLD 0.61% 1.02 -0.39 0.45 0.03 0.89
Average SRI fund indices (Traditional SRI funds)
FRANCE EURO-ZONE EUROPE -2.44% 0.83 0.06 0.12 0.00 0.98
WORLD -2.42% 0.91 -0.11 0.18 0.00 0.96
Alpha, computed with weekly returns, is annualised. The significance of regression parameters is measured with a t-statistic at the threshold of 5%. Figures for significant alpha are in bold; beta that is not statistically significant is in italics.

22
as they did from 2002 to 2009. World traditional SRI funds also have a significant growth bias now, whereas they had a value bias over the period from 2002 to 2009. On average, SRI funds are not highly exposed to fluctuations in the price of oil.
b. Results for individual SRI fundsTable 12 summarises the results obtained for individual SRI funds.
Only three of 120 funds exhibit significant alpha (it is negative). These three funds are in the Europe group (one green fund, created in 2003, two traditional SRI funds, created in 2005 and 2006 respectively). For the most part, the funds have a small-cap bias, regardless of their geographic zone or SRI category. Europe funds, in the main, have a value bias, whereas World funds have a tilt toward growth. The number of World funds with a growth bias is greater in the green sub-section than in the traditional SRI sub-section. Thirty funds, a quarter of the sample, now have
statistically significant exposure to swings in the price of oil, but, except for two World green funds, with respective figures of 0.18 and 0.24, exposure is still slight; the World green fund group has proportionally more funds with statistically significant exposure to oil prices than does any other group.
3. Empirical Results
Table 12: Measure of alpha obtained with the four-factor model and of the style-factor exposures for SRI funds from 2007 to 2009.
Alpha Biases measured by beta Crude oil beta
January 2007 — December 2009
Mean Min Max Nb of alpha>O (signif.)
Nb of alpha<O (signif.)
Value (signif.)
Growth (signif.)
Small Cap
(signif.)
Large Cap
(signif.)
Nb (signif.)
All SRI funds
FRANCE EURO-ZONE EUROPE (71 funds)
-2.31% -18.31% 2.95% 19 52 51 20 48 23 20
(0) (3) (20) (3) (31) (12)
WORLD (49 funds) -0.51% -7.51% 22.56% 22 27 9 40 42 7 10
(0) (0) (3) (29) (27) (3)
Green Funds
FRANCE EURO-ZONE EUROPE (5 funds)
-6.45% -18.31% 1.65% 1 4 2 3 5 0 2
(0) (1) (1) (2) (4) (0)
WORLD (31 funds) 0.81% -7.51% 22.56% 18 13 3 28 28 3 7
(0) (0) (2) (22) (23) (1)
Traditional SRI funds
FRANCE EURO-ZONE EUROPE (66 funds)
-1.99% -17.73% 2.95% 18 48 49 17 43 23 18
(0) (2) (19) (1) (27) (12)
WORLD (18 funds) -2.77% -7.30% 2.23% 4 14 6 12 14 4 3
(0) (0) (4) (7) (4) (2)
Alpha, computed with weekly returns is annualised. The significance of regression parameters is measured with a t-statistic at the threshold of 5%.

The results obtained over the long period confirm the results of the study ending in 2007, that is, a majority of negative and non-significant alpha. Only five funds of a sample of sixty-nine obtain significant—though negative—alpha with the Fama-French three-factor model. As previously, we identified a small-cap bias for the vast majority of funds; results for value and growth biases are less clear-cut, as they depend on the period of evaluation and on the category of fund. The World green funds group, however, was consistently biased toward growth. Results over a shorter period—three years, for instance—confirm the few instances of significant alpha, still negative.
Including the period of the financial crisis increases the extreme risks borne by SRI funds considerably; it is clear that, on average, these funds provide no protection from market downturns.
Dividing the sample into traditional SRI funds and green funds showed that the creation of green funds far outpaced that of traditional SRI funds, especially for those funds invested in World assets, as international diversification offsets sector concentration. In addition, we also identified alpha values higher, on average, for green funds than for traditional SRI funds over the longer period, but not systematically so over shorter periods. On average, over the long period, risks, including extreme risks, are higher for green funds than for traditional SRI funds. Over the long period, World green funds have a growth bias, whereas Europe green funds, for the most part, have a value bias.
The present study deals only with the financial performance of socially responsible investment, which is only one feature of
SRI performance, as SRI subscribers are presumed to have concerns other than financial performance alone. As underlined by Pictet (Buiz and Pictet 2008), to provide investors with exhaustive information about the full returns on SRI, extra-financial indicators such as environmental return and social return must complement purely financial performance figures.
Conclusion
23
24
Table A.1: Number of SRI funds distributed in France invested in equities between 1995 and 2009 by category (traditional versus green) and investment zone
Time Period All SRI funds Traditional SRI funds Green funds
Europe World Total Europe World Total Europe World Total
January 95 - December 09 1 1 2 1 0 1 0 1 1
January 96 - December 09 1 1 2 1 0 1 0 1 1
January 97 - December 09 9 2 11 8 0 8 1 2 3
January 98 - December 09 10 3 13 9 0 9 1 3 4
January 99 - December 09 16 6 22 15 2 17 1 4 5
January 00 - December 09 23 10 33 22 5 27 1 5 6
January 01 - December 09 36 19 55 35 11 46 1 8 9
January 02 - December 09 45 24 69 43 11 54 2 13 15
January 03 - December 09 52 27 79 50 12 62 2 15 17
January 04 - December 09 56 30 86 53 13 66 3 17 20
January 05 - December 09 59 33 92 55 14 69 4 19 23
January 06 - December 09 64 39 103 60 16 76 4 23 27
January 07 - December 09 71 49 120 66 17 83 5 32 37
January 08 - December 09 86 62 148 76 19 95 10 43 53
January 09 - December 09 95 77 172 81 29 110 14 48 62
Appendix

Table A.2: Measure of Jensen’s alpha and market beta, as well as alpha decomposition, for SRI funds from 2002 to 2009 (tables 5 and 6 detailed)INVESTMENT ZONE January 2002 -
December 2009alpha Market beta Adjusted R² Net Selectivity Diversification
SRI fundsFrance Fund F_1 -2.99% 0.98 0.82 -1.67% -1.32%
Fund F_2 -3.75% 0.74 0.74 -2.77% -0.98%Fund F_3 -2.71% 0.98 0.89 -1.37% -1.34%Fund F_4 -0.76% 0.84 0.71 0.34% -1.11%Fund F_5 -1.57% 0.84 0.71 -0.46% -1.11%
Euro-Zone Fund EZ_1 -1.77% 0.97 0.94 -1.55% -0.22%Fund EZ_2 -0.46% 0.89 0.89 -0.25% -0.20%Fund EZ_3 -0.63% 0.99 0.97 -0.40% -0.23%Fund EZ_4 -0.06% 0.92 0.93 0.15% -0.21%Fund EZ_5 -4.31% 0.88 0.72 -4.12% -0.19%Fund EZ_6 -1.65% 1.00 0.97 -1.42% -0.23%Fund EZ_7 0.61% 0.86 0.82 0.81% -0.19%Fund EZ_8 -1.33% 1.00 0.95 -1.10% -0.23%Fund EZ_9 0.04% 0.78 0.77 0.21% -0.17%Fund EZ_10 -1.76% 0.91 0.81 -1.55% -0.20%Fund EZ_11 -2.34% 0.77 0.72 -2.17% -0.17%Fund EZ_12 -2.16% 0.90 0.91 -1.96% -0.20%Fund EZ_13 -2.73% 0.96 0.88 -2.51% -0.22%Fund EZ_14 -0.28% 0.99 0.88 -0.05% -0.22%Fund EZ_15 -2.08% 0.87 0.78 -1.89% -0.19%Fund EZ_16 -3.61% 0.90 0.83 -3.41% -0.20%Fund EZ_17 3.35% 0.67 0.62 3.49% -0.14%Fund EZ_18 -2.65% 0.98 0.97 -2.43% -0.23%Fund EZ_19 -0.50% 0.94 0.81 -0.29% -0.21%Fund EZ_20 0.70% 0.85 0.89 0.89% -0.19%Fund EZ_21 -1.88% 0.75 0.72 -1.71% -0.17%Fund EZ_22 2.01% 0.77 0.79 2.18% -0.17%Fund EZ_23 -3.47% 0.82 0.71 -3.29% -0.18%Fund EZ_24 -0.89% 0.84 0.74 -0.70% -0.18%Fund EZ_25 0.86% 0.90 0.81 1.06% -0.20%Fund EZ_26 -0.98% 0.82 0.80 -0.79% -0.18%
Europe Fund E_1 -2.43% 0.93 0.88 -2.48% 0.04% Fund E_2 -1.50% 0.99 0.86 -1.27% -0.22% Fund E_3 -3.34% 1.02 0.95 -3.39% 0.05% Fund E_4 2.30% 0.65 0.57 2.44% -0.14% Fund E_5 -3.88% 0.96 0.96 -3.92% 0.05% Fund E_6 -2.48% 1.01 0.94 -2.60% 0.12% Fund E_7 -2.75% 0.81 0.76 -2.79% 0.04% Fund E_8 -3.61% 0.94 0.84 -3.66% 0.04% Fund E_9 -2.47% 0.85 0.81 -2.51% 0.04% Fund E_10 -3.25% 1.02 0.88 -3.30% 0.05% Fund E_11 -2.10% 1.00 0.96 -2.15% 0.05% Fund E_12 -5.92% 0.86 0.90 -5.73% -0.19% Fund E_13 -3.63% 0.98 0.96 -3.41% -0.22% Fund E_14 -1.09% 0.65 0.76 -0.95% -0.15%World Fund W_1 -0.87% 1.00 0.91 -3.71% 2.84% Fund W_2 -0.37% 0.72 0.72 -2.34% 1.98% Fund W_3 -1.05% 1.04 0.96 -4.00% 2.95% Fund W_4 -1.18% 0.91 0.86 -3.74% 2.57% Fund W_5 0.86% 0.76 0.67 -1.21% 2.07% Fund W_6 8.04% 1.05 0.65 5.19% 2.84% Fund W_7 -2.51% 0.94 0.92 -5.18% 2.67% Fund W_8 -1.08% 1.00 0.98 -3.95% 2.86% Fund W_9 0.79% 0.91 0.64 -1.67% 2.46% Fund W_10 2.24% 0.81 0.78 0.01% 2.24% Fund W_11 -3.34% 0.94 0.81 -5.97% 2.63% Fund W_12 -5.28% 0.89 0.78 -7.75% 2.47% Fund W_13 -1.60% 0.96 0.96 -4.34% 2.75% Fund W_14 -1.45% 0.95 0.90 -4.15% 2.70% Fund W_15 0.11% 0.66 0.34 -1.49% 1.59% Fund W_16 -2.17% 0.94 0.89 -4.84% 2.67% Fund W_17 2.74% 1.09 0.61 -0.17% 2.91% Fund W_18 -1.24% 0.79 0.77 -3.42% 2.18% Fund W_19 3.98% 0.90 0.76 1.48% 2.50% Fund W_20 0.81% 1.07 0.52 -1.97% 2.78% Fund W_21 1.31% 1.04 0.70 -1.54% 2.86% Fund W_22 0.29% 1.06 0.51 -2.48% 2.77% Fund W_23 3.86% 0.84 0.78 1.53% 2.33% Fund W_24 3.18% 1.08 0.75 0.20% 2.99%
Alpha, computed with weekly returns, is annualised. The significance of regression parameters is measured with a t-statistic at the threshold of 5%. Figures for significant alpha are in bold. All beta is significant. The funds highlighted in blue are those green funds acknowledged SRI by Novethic, while funds highlighted in green are green funds not systematically using ESG criteria.
Appendix
25

26
Table A.3: Measure of alpha obtained with the Fama-French three-factor model and of style-factor exposures for SRI funds from 2002 to 2009 (table 8 detailed)
INVESTMENT ZONE January 2002 - December 2009
Alpha Market beta V-G beta SC-LC beta Adjusted R²
SRI fundsFrance Fund F_1 -4.66% 1.01 0.04 0.20 0.82
Fund F_2 -5.93% 0.77 0.06 0.26 0.77Fund F_3 -2.64% 0.94 0.10 -0.11 0.89Fund F_4 -2.52% 0.92 0.05 0.29 0.72Fund F_5 -4.09% 1.02 -0.03 0.55 0.77
Euro-Zone Fund EZ_1 -2.07% 0.96 0.04 0.01 0.94Fund EZ_2 -0.15% 0.91 -0.09 0.04 0.90Fund EZ_3 -0.09% 0.98 -0.02 -0.06 0.97Fund EZ_4 -1.17% 0.95 0.02 0.15 0.93Fund EZ_5 -3.60% 0.92 -0.20 0.10 0.72Fund EZ_6 -0.35% 0.96 0.00 -0.20 0.98Fund EZ_7 1.12% 0.83 0.07 -0.15 0.83Fund EZ_8 -0.49% 1.00 -0.06 -0.06 0.95Fund EZ_9 -2.67% 0.83 0.09 0.31 0.80Fund EZ_10 -4.53% 0.94 0.17 0.25 0.83Fund EZ_11 -5.78% 0.87 -0.02 0.53 0.80Fund EZ_12 -2.26% 0.92 -0.06 0.07 0.91Fund EZ_13 -4.55% 0.99 0.08 0.19 0.88Fund EZ_14 -1.16% 1.00 0.05 0.08 0.88Fund EZ_15 -5.68% 0.90 0.23 0.31 0.81Fund EZ_16 -2.48% 0.92 -0.17 0.01 0.83Fund EZ_17 -0.56% 0.80 -0.04 0.63 0.75Fund EZ_18 -3.37% 0.98 0.06 0.05 0.97Fund EZ_19 -1.98% 0.94 0.13 0.09 0.82Fund EZ_20 -0.54% 0.86 0.08 0.11 0.90Fund EZ_21 -3.91% 0.77 0.11 0.19 0.74Fund EZ_22 1.04% 0.82 -0.09 0.24 0.80Fund EZ_23 -5.65% 0.86 0.06 0.26 0.73Fund EZ_24 -2.75% 0.88 0.02 0.25 0.75Fund EZ_25 -2.07% 0.91 0.24 0.20 0.83Fund EZ_26 -1.22% 0.82 0.00 0.04 0.80
Europe Fund E_1 -3.42% 0.92 0.16 0.08 0.88 Fund E_2 -0.95% 1.05 -0.26 0.18 0.88 Fund E_3 -3.01% 1.02 -0.06 -0.02 0.95 Fund E_4 -1.19% 0.74 0.03 0.50 0.65 Fund E_5 -3.35% 0.96 -0.05 -0.06 0.96 Fund E_6 -2.08% 1.01 -0.06 -0.03 0.94 Fund E_7 -3.91% 0.81 0.12 0.12 0.76 Fund E_8 -5.60% 0.95 0.16 0.23 0.86 Fund E_9 -2.55% 0.86 -0.09 0.05 0.81 Fund E_10 -3.07% 1.03 -0.05 -0.01 0.88 Fund E_11 -2.02% 1.00 -0.01 -0.01 0.96 Fund E_12 -6.74% 0.89 -0.04 0.17 0.90 Fund E_13 -2.09% 0.96 -0.08 -0.16 0.96 Fund E_14 -3.68% 0.72 0.03 0.36 0.82World Fund W_1 -1.79% 0.98 0.20 0.13 0.91 Fund W_2 1.25% 0.75 -0.30 -0.25 0.74 Fund W_3 -1.56% 1.02 0.12 0.07 0.96 Fund W_4 -1.46% 0.92 -0.04 0.09 0.86 Fund W_5 -1.89% 0.78 -0.05 0.67 0.73 Fund W_6 7.64% 1.10 -0.40 0.26 0.67 Fund W_7 -3.09% 0.96 -0.11 0.18 0.93 Fund W_8 -0.99% 1.00 0.02 -0.03 0.98 Fund W_9 -1.73% 0.88 0.38 0.43 0.66 Fund W_10 1.20% 0.82 -0.04 0.26 0.79 Fund W_11 -2.95% 0.96 -0.17 -0.02 0.81 Fund W_12 -6.87% 0.88 0.16 0.30 0.79 Fund W_13 -1.23% 0.97 -0.07 -0.06 0.97 Fund W_14 -1.69% 0.94 0.12 0.01 0.90 Fund W_15 -3.83% 0.67 0.03 0.91 0.42 Fund W_16 -3.85% 0.94 0.14 0.34 0.91 Fund W_17 -0.48% 1.13 -0.23 0.85 0.66 Fund W_18 -1.87% 0.81 -0.23 0.25 0.79 Fund W_19 2.11% 0.93 -0.20 0.52 0.80 Fund W_20 -4.10% 1.11 -0.20 1.24 0.61 Fund W_21 -2.26% 1.07 -0.11 0.89 0.77 Fund W_22 -4.60% 1.10 -0.20 1.24 0.60 Fund W_23 2.16% 0.88 -0.31 0.53 0.83 Fund W_24 1.44% 1.14 -0.43 0.59 0.79
Alpha, computed with weekly returns, is annualised. The significance of regression parameters is measured with a t-statistic at the threshold of 5%. Figures for significant alpha are in bold; beta that is not statistically significant is in italics. The funds highlighted in blue are those green funds acknowledged SRI by Novethic, while funds highlighted in green are green funds not systematically using ESG criteria.
Appendix

Table A.4: Measure of alpha obtained with the four-factor model and of style-factor exposures for SRI funds from 2002 to 2009 (table 10 detailed)
INVESTMENT ZONE January 2002 - December 2009
Alpha Market beta V-G beta SC-LC beta Crude oil price beta
Adjusted R²
SRI fundsFrance Fund F_1 -4.52% 1.01 0.04 0.20 -0.01 0.82
Fund F_2 -5.88% 0.78 0.06 0.26 0.00 0.77Fund F_3 -2.49% 0.95 0.11 -0.11 -0.01 0.89Fund F_4 -2.20% 0.93 0.06 0.29 -0.03 0.73Fund F_5 -3.71% 1.03 -0.02 0.56 -0.03 0.78
Euro-Zone Fund EZ_1 -2.08% 0.96 0.04 0.01 0.00 0.94Fund EZ_2 -0.03% 0.92 -0.08 0.04 -0.01 0.90Fund EZ_3 -0.01% 0.98 -0.02 -0.06 -0.01 0.97Fund EZ_4 -1.31% 0.94 0.01 0.15 0.01 0.93Fund EZ_5 -3.69% 0.92 -0.20 0.10 0.01 0.72Fund EZ_6 -0.44% 0.96 0.00 -0.20 0.01 0.98Fund EZ_7 1.05% 0.83 0.07 -0.15 0.01 0.83Fund EZ_8 -0.52% 1.00 -0.06 -0.06 0.00 0.95Fund EZ_9 -2.50% 0.83 0.10 0.31 -0.01 0.80Fund EZ_10 -4.63% 0.94 0.16 0.25 0.01 0.83Fund EZ_11 -6.03% 0.87 -0.02 0.53 0.02 0.80Fund EZ_12 -2.44% 0.91 -0.06 0.07 0.01 0.91Fund EZ_13 -4.36% 0.99 0.08 0.19 -0.02 0.88Fund EZ_14 -1.03% 1.00 0.05 0.08 -0.01 0.88Fund EZ_15 -5.78% 0.90 0.23 0.31 0.01 0.81Fund EZ_16 -2.48% 0.92 -0.17 0.01 0.00 0.83Fund EZ_17 -0.47% 0.80 -0.04 0.63 -0.01 0.75Fund EZ_18 -3.31% 0.98 0.06 0.05 -0.01 0.97Fund EZ_19 -2.02% 0.94 0.13 0.09 0.00 0.82Fund EZ_20 -0.34% 0.86 0.08 0.11 -0.02 0.90Fund EZ_21 -3.74% 0.78 0.12 0.19 -0.01 0.73Fund EZ_22 0.86% 0.82 -0.09 0.23 0.02 0.80Fund EZ_23 -5.21% 0.87 0.07 0.27 -0.04 0.73Fund EZ_24 -2.31% 0.89 0.03 0.26 -0.04 0.76Fund EZ_25 -2.11% 0.91 0.24 0.20 0.00 0.83Fund EZ_26 -1.24% 0.82 0.00 0.04 0.00 0.80
Europe Fund E_1 -3.27% 0.93 0.16 0.08 -0.01 0.88 Fund E_2 -1.24% 1.05 -0.26 0.18 0.02 0.88 Fund E_3 -3.17% 1.02 -0.06 -0.02 0.01 0.95 Fund E_4 -1.42% 0.74 0.02 0.49 0.02 0.65 Fund E_5 -3.35% 0.96 -0.05 -0.06 0.00 0.96 Fund E_6 -2.12% 1.01 -0.06 -0.03 0.00 0.94 Fund E_7 -4.17% 0.80 0.11 0.12 0.02 0.76 Fund E_8 -5.26% 0.95 0.17 0.23 -0.03 0.86 Fund E_9 -2.37% 0.87 -0.08 0.06 -0.02 0.81 Fund E_10 -3.18% 1.03 -0.05 -0.01 0.01 0.88 Fund E_11 -1.94% 1.00 -0.01 -0.01 -0.01 0.96 Fund E_12 -6.77% 0.89 -0.04 0.17 0.00 0.90 Fund E_13 -2.13% 0.96 -0.08 -0.16 0.00 0.96 Fund E_14 -3.57% 0.72 0.03 0.36 -0.01 0.82World Fund W_1 -1.62% 0.99 0.21 0.14 -0.01 0.91 Fund W_2 1.89% 0.76 -0.29 -0.23 -0.05 0.75 Fund W_3 -1.21% 1.03 0.12 0.08 -0.03 0.97 Fund W_4 -1.38% 0.92 -0.04 0.09 -0.01 0.86 Fund W_5 -1.92% 0.78 -0.05 0.67 0.00 0.73 Fund W_6 5.57% 1.05 -0.42 0.18 0.16 0.71 Fund W_7 -3.19% 0.95 -0.11 0.18 0.01 0.93 Fund W_8 -0.90% 1.00 0.02 -0.03 -0.01 0.98 Fund W_9 -1.66% 0.88 0.38 0.43 -0.01 0.66 Fund W_10 1.33% 0.82 -0.04 0.27 -0.01 0.79 Fund W_11 -3.03% 0.96 -0.17 -0.02 0.01 0.81 Fund W_12 -6.72% 0.88 0.16 0.31 -0.01 0.79 Fund W_13 -1.34% 0.97 -0.07 -0.06 0.01 0.97 Fund W_14 -1.37% 0.95 0.12 0.02 -0.02 0.90 Fund W_15 -4.65% 0.66 0.02 0.88 0.06 0.43 Fund W_16 -3.74% 0.94 0.14 0.34 -0.01 0.91 Fund W_17 -0.90% 1.12 -0.24 0.84 0.03 0.66 Fund W_18 -1.81% 0.82 -0.23 0.25 0.00 0.79 Fund W_19 2.02% 0.93 -0.20 0.52 0.01 0.80 Fund W_20 -4.41% 1.10 -0.20 1.22 0.02 0.61 Fund W_21 -2.17% 1.07 -0.11 0.89 -0.01 0.77 Fund W_22 -4.94% 1.10 -0.21 1.22 0.03 0.60 Fund W_23 2.11% 0.88 -0.31 0.53 0.00 0.83 Fund W_24 0.59% 1.12 -0.44 0.56 0.07 0.80
Alpha, computed with weekly returns, is annualised. The significance of regression parameters is measured with a t-statistic at the threshold of 5%. Figures for significant alpha are in bold; beta that is not statistically significant is in italics. The funds highlighted in blue are those green funds acknowledged SRI by Novethic, while funds highlighted in green are green funds not systematically using ESG criteria.
Appendix
27

28
• Amenc, N., and V. Le Sourd. 2008. Socially responsible investment performance in France. EDHEC-Risk (December).
• Buiz, C., and O. Pictet. 2008. Le paradoxe de la performance ISR. Pictet.
• Carhart, M. M. 1997. On persistence in mutual fund performance. Journal of Finance 52 (1): 57-82.
• Elton, E. J., M. J. Gruber, S. Das, and M. Hlavka. 1993. Efficiency with costly information: A reinterpretation of evidence from managed portfolios. Review of Financial Studies 6 (1): 1-22.
• Fama, E. 1972. Components of investment performance. Journal of Finance 17 (3): 551-67.
• Fama, E., and E. French. 1993. Common risk factors in the returns on stocks and bonds. Journal of Financial Economics 33 (1): 3-56.
• Le Sourd, V. 2010. The performance of socially responsible investment: A study of the French market. Bankers, Markets & Investors 106 (May-June): 15-40.
• Ross, S. A. 1976. The arbitrage theory of capital asset pricing. Journal of Economic Theory 13 (3): 341-60.
• Sharpe, W. F. 1964. Capital asset prices: A theory of market equilibrium under condi-tions of risk. Journal of Finance 19 (3): 425-42.
References

2010 Position Papers• Lioui, A. Spillover effects of counter-cyclical market regulation: Evidence from the 2008 ban on short sales (March).
• Amenc, N., P. Schoeffler, and P. Lasserre. Organisation optimale de la liquidité des fonds d’investissement (March).
2010 Publications• Sender, S. EDHEC survey of the asset and liability management practices of european pension funds (June).
• Martellini, L., and V. Milhau. Asset-liability management decisions for sSovereign wealth funds (August).
• Goltz, F., A. Grigoriu and L.Tang. The EDHEC European ETF survey 2010 (May).
• Amenc, N., F. Goltz, and A. Grigoriu. Risk control through dynamic core-satellite portfolios of ETFs: Applications to absolute return funds and tactical asset allocation (January).
• Amenc, N., F. Goltz, and P. Retkowsky. Efficient indexation: An alternative to cap-weighted indices (January).
• Goltz, F., and V. Le Sourd. Does finance theory make the case for capitalisation-weighted indexing? (January).
2009 Position Papers• Amenc, N., and S. Sender. A welcome european commission consultation on the UCITS depositary function, a hastily considered proposal (September).
• Sender, S. IAS 19: Penalising changes ahead (September).
• Amenc, N. Quelques réflexions sur la régulation de la gestion d'actifs (June).
• Giraud, J.-R. MiFID: One Year On (May).
• Lioui, A. The undesirable effects of banning short sales (April).
• Gregoriou, G., and F.-S. Lhabitant. Madoff: A riot of red flags (January).
2009 Publications• Sender, S. Reactions to an EDHEC study on the impact of regulatory constraints on the ALM of pension funds (October).
• Amenc, N., L. Martellini, V. Milhau and V. Ziemann. Asset-liability management in private wealth management (September).
• Amenc, N., F. Goltz, A. Grigoriu, and D. Schroeder. The EDHEC European ETF survey (May).
• Sender, S. The European pension fund industry again beset by deficits (May).
• Martellini, L., and V. Milhau. Measuring the benefits of dynamic asset allocation strategies in the presence of liability constraints (March).
• Le Sourd, V. Hedge fund performance in 2008 (February).
EDHEC-Risk Institute Position Papers and Publications (2007-2010)
29

30
• La gestion indicielle dans l'immobilier et l'indice EDHEC IEIF Immobilier d'Entreprise France (February).
• Real estate indexing and the EDHEC IEIF Commercial Property (France) Index (February).
• Amenc, N., L. Martellini, and S. Sender. Impact of regulations on the ALM of European pension funds (January).
• Goltz, F. A long road ahead for portfolio construction: Practitioners' views of an EDHEC survey. (January).2008 Position Papers • Amenc, N., and S. Sender. Assessing the European banking sector bailout plans (December).
• Amenc, N., and S. Sender. Les mesures de recapitalisation et de soutien à la liquidité du secteur bancaire européen (December).
• Amenc, N., F. Ducoulombier, and P. Foulquier. Reactions to an EDHEC study on the fair value controversy (December). With the EDHEC Financial Analysis and Accounting Research Centre.
• Amenc, N., F. Ducoulombier, and P. Foulquier. Réactions après l’étude. Juste valeur ou non : un débat mal posé (December). With the EDHEC Financial Analysis and Accounting Research Centre.
• Amenc, N., and V. Le Sourd. Les performances de l’investissement socialement responsable en France (December).
• Amenc, N., and V. Le Sourd. Socially responsible investment performance in France (December).
• Amenc, N., B. Maffei, and H. Till. Les causes structurelles du troisième choc pétrolier (November).
• Amenc, N., B. Maffei, and H. Till. Oil prices: The true role of speculation (November).
• Sender, S. Banking: Why does regulation alone not suffice? Why must governments intervene? (November).
• Till, H. The oil markets: Let the data speak for itself (October).
• Amenc, N., F. Goltz, and V. Le Sourd. A comparison of fundamentally weighted indices: Overview and performance analysis (March).
• Sender, S. QIS4: Significant improvements, but the main risk for life insurance is not taken into account in the standard formula (February). With the EDHEC Financial Analysis and Accounting Research Centre.
2008 Publications• Amenc, N., L. Martellini, and V. Ziemann. Alternative investments for institutional investors: Risk budgeting techniques in asset management and asset-liability management (December).
• Goltz, F., and D. Schröder. Hedge fund reporting survey (November).
EDHEC-Risk Institute Position Papers and Publications (2007-2010)
• D’Hondt, C., and J.-R. Giraud. Transaction cost analysis A-Z: A step towards best execution in the post-MiFID landscape (November).
• Amenc, N., and D. Schröder. The pros and cons of passive hedge fund replication (October).
• Amenc, N., F. Goltz, and D. Schröder. Reactions to an EDHEC study on asset-liability management decisions in wealth management (September).
• Amenc, N., F. Goltz, A. Grigoriu, V. Le Sourd, and L. Martellini. The EDHEC European ETF survey 2008 (June).
• Amenc, N., F. Goltz, and V. Le Sourd. Fundamental differences? Comparing alternative index weighting mechanisms (April).
• Le Sourd, V. Hedge fund performance in 2007 (February).
• Amenc, N., F. Goltz, V. Le Sourd, and L. Martellini. The EDHEC European investment practices survey 2008 (January).
2007 Position Papers • Amenc, N. Trois premières leçons de la crise des crédits « subprime » (August).
• Amenc, N. Three early lessons from the subprime lending crisis (August).
• Amenc, N., W. Géhin, L. Martellini, and J.-C. Meyfredi. The myths and limits of passive hedge fund replication (June).
• Sender, S., and P. Foulquier. QIS3: Meaningful progress towards the implementation of Solvency II, but ground remains to be covered (June). With the EDHEC Financial Analysis and Accounting Research Centre.
• D’Hondt, C., and J.-R. Giraud. MiFID: The (in)famous European directive (February).
• Hedge fund indices for the purpose of UCITS: Answers to the CESR issues paper (January).
• Foulquier, P., and S. Sender. CP 20: Significant improvements in the Solvency II framework but grave incoherencies remain. EDHEC response to consultation paper n° 20 (January).
• Géhin, W. The Challenge of hedge fund measurement: A toolbox rather than a Pandora's box (January).
• Christory, C., S. Daul, and J.-R. Giraud. Quantification of hedge fund default risk (January).
2007 Publications• Ducoulombier, F. Etude EDHEC sur l'investissement et la gestion du risque immobiliers en Europe (November/December).
• Ducoulombier, F. EDHEC European real estate investment and risk management survey (November).
• Goltz, F., and G. Feng. Reactions to the EDHEC study "Assessing the quality of stock market indices" (September).
EDHEC-Risk Institute Position Papers and Publications (2007-2010)
31

32
• Le Sourd, V. Hedge fund performance in 2006: A vintage year for hedge funds? (March).
• Amenc, N., L. Martellini, and V. Ziemann. Asset-liability management decisions in private banking (February).
• Le Sourd, V. Performance measurement for traditional investment (literature survey) (January).
EDHEC-Risk Institute Position Papers and Publications (2007-2010)

Notes
………………………………………………………………………………………………………………………………………………………………………………………………………………………………………………………………………
………………………………………………………………………………………………………………………………………………………………………………………………………………………………………………………………………
………………………………………………………………………………………………………………………………………………………………………………………………………………………………………………………………………
………………………………………………………………………………………………………………………………………………………………………………………………………………………………………………………………………
………………………………………………………………………………………………………………………………………………………………………………………………………………………………………………………………………
………………………………………………………………………………………………………………………………………………………………………………………………………………………………………………………………………
………………………………………………………………………………………………………………………………………………………………………………………………………………………………………………………………………
………………………………………………………………………………………………………………………………………………………………………………………………………………………………………………………………………
………………………………………………………………………………………………………………………………………………………………………………………………………………………………………………………………………
………………………………………………………………………………………………………………………………………………………………………………………………………………………………………………………………………
………………………………………………………………………………………………………………………………………………………………………………………………………………………………………………………………………
………………………………………………………………………………………………………………………………………………………………………………………………………………………………………………………………………
………………………………………………………………………………………………………………………………………………………………………………………………………………………………………………………………………
………………………………………………………………………………………………………………………………………………………………………………………………………………………………………………………………………
………………………………………………………………………………………………………………………………………………………………………………………………………………………………………………………………………
………………………………………………………………………………………………………………………………………………………………………………………………………………………………………………………………………
………………………………………………………………………………………………………………………………………………………………………………………………………………………………………………………………………
………………………………………………………………………………………………………………………………………………………………………………………………………………………………………………………………………
33

34
………………………………………………………………………………………………………………………………………………………………………………………………………………………………………………………………………
………………………………………………………………………………………………………………………………………………………………………………………………………………………………………………………………………
………………………………………………………………………………………………………………………………………………………………………………………………………………………………………………………………………
………………………………………………………………………………………………………………………………………………………………………………………………………………………………………………………………………
………………………………………………………………………………………………………………………………………………………………………………………………………………………………………………………………………
………………………………………………………………………………………………………………………………………………………………………………………………………………………………………………………………………
………………………………………………………………………………………………………………………………………………………………………………………………………………………………………………………………………
………………………………………………………………………………………………………………………………………………………………………………………………………………………………………………………………………
………………………………………………………………………………………………………………………………………………………………………………………………………………………………………………………………………
………………………………………………………………………………………………………………………………………………………………………………………………………………………………………………………………………
………………………………………………………………………………………………………………………………………………………………………………………………………………………………………………………………………
………………………………………………………………………………………………………………………………………………………………………………………………………………………………………………………………………
………………………………………………………………………………………………………………………………………………………………………………………………………………………………………………………………………
………………………………………………………………………………………………………………………………………………………………………………………………………………………………………………………………………
………………………………………………………………………………………………………………………………………………………………………………………………………………………………………………………………………
………………………………………………………………………………………………………………………………………………………………………………………………………………………………………………………………………
………………………………………………………………………………………………………………………………………………………………………………………………………………………………………………………………………
………………………………………………………………………………………………………………………………………………………………………………………………………………………………………………………………………
Notes

EDHEC-Risk Institute is part of EDHEC Business School, one of Europe’s leading business schools and a member of the select group of academic institutions worldwide to have earned the triple crown of international accreditations (AACSB, EQUIS, Association of MBAs). Established in 2001, EDHEC-Risk Institute has become the premier European centre for applied financial research.
In partnership with large financial institutions, its team of 47 permanent professors, engineers and support staff implements six research programmes and ten research chairs focusing on asset allocation and risk management in the traditional and alternative investment universes. The results of the research programmes and chairs are disseminated through the three EDHEC-Risk Institute locations in London, Nice, and Singapore.
EDHEC-Risk Institute validates the academic quality of its output through publications in leading scholarly journals, implements a multifaceted communications policy to inform investors and asset managers on state-of-the-art concepts and techniques, and forms business partnerships to launch innovative products. Its executive education arm helps professionals to upgrade their skills with advanced risk and investment management seminars and degree courses, including the EDHEC-Risk Institute PhD in Finance and the EDHEC-Risk Institute Executive MSc in Risk and Investment Management.
Copyright © 2010 EDHEC-Risk Institute
For more information, please contact: Carolyn Essid on +33 493 187 824 or by e-mail to: [email protected]
EDHEC Risk Institute393-400 promenade des AnglaisBP 311606202 Nice Cedex 3 - France
EDHEC Risk Institute—EuropeNew Broad Street House - 35 New Broad StreetLondon EC2M 1NHUnited Kingdom
EDHEC Risk Institute—Asia1 George Street#07-02Singapore 049145
www.edhec-risk.com
Institute