the performance of options-based investment strategies
TRANSCRIPT

The Performance of Options-Based Investment Strategies:
Evidence for Individual Stocks During 2003–2013
Michael L. Hemler and Thomas W. Miller, Jr.∗
First Draft: December 23, 2013
Current Draft: April 26, 2015
∗ Mendoza College of Business, University of Notre Dame, Notre Dame, IN 46556,USA, Tel: (574) 631-6766, E-Mail: [email protected], and College of Business, Mis-sissippi State University, Mississippi State, MS 39762, USA, Tel: (662) 325-1997, E-Mail: [email protected], respectively. We thank the Options Industry Council(OIC) for generously funding the OptionMetrics data used in this research. We also thankMary Savoie and Alan Grigoletto of the OIC for helpful discussions. We are grateful to DonChance, Kevin Duggan, Dominick Paoloni, and finance seminar participants at LouisianaState University and the University of Notre Dame for useful comments. In addition, wethank Nick Rossy for research assistance.


The Performance of Options-Based Investment Strategies:
Evidence for Individual Stocks During 2003–2013
Abstract
Using data from January, 2003, through August, 2013, we examine the relative per-formance of options-based investment strategies versus a buy-and-hold strategy in theunderlying stock. Specifically, using ten stocks widely held in 401(k) plans, we examinemonthly returns from five strategies that include a long stock position as one component:long stock, covered call, protective put, collar, and covered combination. To compareperformance we use four standard performance measures: Sharpe ratio, Jensen’s alpha,Treynor ratio, and Sortino ratio. Ignoring early exercise for simplicity, we find that thecovered combination and covered call strategies generally outperform the long stock strat-egy, which in turn generally outperforms the collar and protective put strategies regardlessof the performance measure considered. These results hold for the entire period 2003–2013and both subperiods 2003–2007 and 2008–2013. The findings suggest that options-basedstrategies can be useful in improving the risk-return characteristics of a long equity portfo-lio. Inferences regarding superior or inferior performance are problematic, however, as thefindings reflect the Leland (1999) critique of standard CAPM-based performance measuresapplied to option strategies.


The Performance of Options-Based Investment Strategies:
Evidence for Individual Stocks During 2003–2012
1. Introduction
Options-based investment strategies are popular and valuable tools in portfolio man-
agement. A portfolio manager holding a long stock position might want to change the
risk-return profile of his portfolio without liquidating that stock position. Adding options
to the portfolio can be a convenient and effective way for the manager to tailor his equity
position, augment income, or limit risk as market conditions change.
Numerous studies have analyzed options-based strategies in portfolio management.
One popular strategy is the covered call, or buy-write, strategy. In this strategy one com-
bines a long equity position with a short position in an out-of-the-money call option having
the same underlying equity. Whaley (2002) examines the CBOE Buy Write Index (ticker
symbol BXM) during 1988–2001. He concludes that the “BXM outperformed the S&P
500 portfolio by approximately 0.2% a month on a risk-adjusted basis.” Hill, Balasub-
ramanian, Gregory, and Tierens (2006) analyze the strategy underlying the BXM, along
with other short-term S&P 500-overwriting strategies with both fixed and dynamic strike
prices. They conclude that such strategies “have very favorable performance characteris-
tics at a range of risk levels.” Kapadia and Szado (2007) examined the buy-write strategy
on the Russell 2000 Index. Using returns over the period 1996–2006, they conclude that
“the buy-write strategy can outperform the index.”
Similarly, several papers have analyzed the collar strategy. In this strategy one com-
bines a long equity position with a short call option position and a long put position,
where the options are out-of-the-money and have the same underlying equity. For in-
stance, Szado and Schneeweis (2012) provide a recent and comprehensive analysis of collar
strategies across a wide range of asset classes, including equity, currency, commodity, fixed
income, and real estate. They conclude that “for most of the asset classes considered, an
option-based collar strategy, using six-month put purchases and consecutive one-month
1

call writes, provides improved risk-adjusted performance and significant risk reduction.”
For instance, they examine collars based on the SPDR S&P 500 (SPY) ETF over a 55-
month sample period. They find that a 2% out-of-the-money collar position gained over
22% while a long SPY position lost 9%. Moreover, not only did the collar have a superior
return, but it also had less than half the risk, where risk is measured as standard deviation
of return. These findings echo earlier results of Szado and Schneeweis (2010), in which they
find that a protective collar strategy using 6-month put purchases and consecutive 1-month
call writes earned superior returns, and reduced risk by almost 65%, when compared to
the corresponding buy-and-hold strategy where the underlying asset is the PowerShares
QQQ exchange-traded fund.
As do the aforementioned studies, our paper investigates the performance of options-
based investment strategies. We extend the literature in two respects, however. First,
we compare the performance of several strategies rather than concentrating on a single
strategy such as a covered call or collar. Second, unlike prior studies that have primarily
focused on the S&P 500 index which has European options, we examine individual stocks
which have American options. American options raise the complicating factor of early
exercise.
Specifically, we examine five strategies (long stock, covered call, protective put, collar,
and covered combination) for ten stocks commonly used in 401(k)s. We analyze their
performance in 2003–2013, both over the entire period and over the first and second halves
separately, using four widely used measures, i.e., Sharpe ratio, Jensen’s alpha, Treynor
ratio, and Sortino ratio. In general, the covered combination and covered call strategies
outperform the long stock strategy, and the long stock strategy outperforms the collar
and protective put strategies. Inferences regarding superior or inferior performance are
problematic, however. The relative performance rankings reflect the Leland (1999) critique
of standard CAPM-based performance measures applied in settings where returns are
nonsymmetrical, which is clearly the case with options-based investment strategies.
The paper proceeds as follows. Section 2 describes the data and methodology.
Section 3 gives empirical results. Section 4 provides concluding remarks.
2

2. Data and Methodology
In deciding which stocks to use, we wanted a small, representative sample that would
be of interest to all investors, but especially to large institutional investors such as pension
funds and endowments. We also wanted a “third party” to choose the stocks so that we did
not cherry-pick firms and bias the sample. Consequently, we searched popular press articles
and found a CNBC story published September 12, 2012, entitled “Widely Held Stocks in
401(k)s.” (See www.cnbc.com/id/48939384.) CNBC first asked Brightscope (which rates
401(k) plans for more than 45,000 employers) to identify the top five equity mutual funds
in most 401(k) plans. CNBC then asked researchers at Morningstar to determine the ten
most widely held stocks in those funds.
In decreasing order, the top ten firms were as follows: ExxonMobil, Comcast, Berk-
shire Hathaway (Class A), Oracle, Microsoft, Coca-Cola, Amazon, Wells Fargo, Google,
and Apple. Listed options trade for all of these firms except Berkshire Hathaway (Class
A). Listed options do trade, however, for Berkshire Hathaway (Class B). Rather than
drop Berkshire Hathaway completely from our sample of firms, we decided to substitute
Berkshire Hathaway (Class B) for Berkshire Hathaway (Class A). Therefore, given this
substitution we have ten stocks with listed options in our sample. For simplicity, we shall
refer to these stocks as the ten most widely held stocks in 401(k) plans.
In deciding which options-based strategies to investigate, we wanted all strategies to
include a long equity position. We wanted to explore how investors might utilize options
to improve the risk-return profiles of their equity positions. We did not, therefore, analyze
naked option positions. The long equity restriction led us to choose five strategies for
any given stock. The first strategy is simply to hold the stock. The other four strategies
combine holding the stock with one or more options which have that stock as the underlying
stock. The four options-based strategies are: covered call (long stock plus short call),
protective put (long stock plus long put), collar (long stock plus short call plus long put),
and covered combination (long stock plus short call plus short put).
In deciding what sample period to use, we originally chose the last ten calendar years
for which we had data, i.e., 2003–2012. This period seemed especially interesting due
3

to the Financial Crisis of 2007–2008 that occurred approximately halfway through the
sample period. Besides examining relative performance over the entire period, we wanted to
examine performance over the first and second halves to see whether it differed significantly.
During our preliminary work, option data became available through August, 2013. Thus,
our updated sample period covers the period from January, 2003, through August, 2013.
There are 128 monthly observations for all but two stocks, Google and Berkshire Hathaway.
These two stocks have only 108 and 50 observations because their listed options began
trading in 2004 and 2009, respectively.
Our data comes from various sources. Our options data comes from OptionMetrics
via Wharton Research Data Services (WRDS). We calculate options returns based on bid-
ask midpoints. Our stock and T-bill data comes from the Center for Research in Security
Prices (CRSP) via WRDS. Individual stock returns are from the Stock Return File. S&P
500 returns are from the S&P 500 Indexes File. These returns are value-weighted returns
including distributions. Treasury bill returns are from the Treasury and Inflation Index
File. These returns are based on a thirty day target maturity using representative Treasury
bills having at least thirty days to their maturity date.
One critical issue is how to implement the strategies. All options-based strategies
involve the choice of one or more options. We choose options based on their moneyness
and time to expiration. In particular, we choose call and put options that are at least 5%
out of the money, but have strike prices as close as possible to the opening stock price on
the day in which an option strategy is initiated. There are a handful of instances with
Amazon and Comcast where no option is at least 5% out of the money, in which case we
use whichever option is closest to being 5% out of the money. In addition, because we are
rolling over our positions monthly, each month we choose standard equity options, i.e., not
Weeklys or LEAPS, that expire the month following the holding month.
We illustrate our process using Amazon on December 31, 2002. The closing price for
Amazon that day is $18.89. Consider implementing a covered call strategy that day using
a call that has a moneyness of at least 5%, but whose strike price is as small as possible.
Hence, the strike price must exceed $19.83 (= 1.05 × $18.89). We shall be closing the
4

position on January 31, 2003; thus, we examine all call options that expire on February
22, 2003. From OptionMetrics, there is data on six options that expire on that date and
have strike prices exceeding $19.83. These options have strike prices of 20.00, 22.50, 25.00,
27.50, 30.00, and 32.50. We then choose the option with strike price of 20.00 because that
is the call with the lowest possible strike price that has moneyness of 5% or more.
By way of contrast, if we want the analogous call option with a moneyness of 10%
rather than 5%, then we would get a different option. In this case the xoption must have
a strike price that exceeds $20.78 (= 1.10× $18.89). The lowest possible strike price that
satisfies this new criterion is 22.50, not 20.00. Hence, for moneyness of 10% or more, we
would choose the call option with strike price 22.50.
3. Empirical Results
3.1. Descriptive Statistics for Returns from the Five Strategies
We begin with descriptive evidence regarding the behavior of the underlying stocks
and benchmark indices over the sample period. Table 1 presents summary statistics for
the monthly returns of the ten stocks considered, the value-weighted S&P 500 portfolio
(including distributions), and a representative thirty day Treasury bill. The statistics are
for three periods: the full sample (January, 2003–August, 2013), the first half (January,
2003–December, 207), and the second half (January, 2008–August, 2013). The statistics
include the mean, standard deviation, skewness, excess kurtosis, the Jarque-Bera statistic
for testing the hypothesis that the return distribution is normal along with the corre-
sponding p-value. The first two statistics are important for determining the risk-return
tradeoff for these assets. The last four statistics are important for assessing the normality
of returns, which impacts the validity of typical portfolio performance measures.
What does Table 1 tell us? The average monthly Treasury bill return is 0.127% over
the full sample, and it decreases significantly from 0.240% in the first half to 0.027% in the
second half. The average monthly return on the S&P 500 is 0.574% over the full sample,
and it also decreases significantly from 0.887% in the first half to 0.297% in the second
half. For the individual stocks, average monthly returns range from 0.651% for Microsoft
to 3.935% for Apple over the entire sample. In the first half, they range from 0.445% for
5

Comcast to 6.201% for Apple. In the second half, they range from 0.217% for ExxonMobil
to 1.935% for Apple. Only two stocks, Comcast and Wells Fargo, have average returns
increase from the first half to the second half. Perhaps surprisingly, no stock has a negative
average return in any of the three periods.
In regard to skewness, returns on the S&P 500 exhibits negative skewness over the
entire sample and the second half. Returns on three stocks exhibit negative skewness over
the entire sample. Two exhibit negative skewness in the first half, and six exhibit negative
skewness in the second half. Skewness decreases from the first half to the second half for all
but two stocks. In regard to excess kurtosis, over the full sample excess kurtosis exceeds
2.00 for the S&P 500 and for four of the ten stocks. Indeed, for Wells Fargo it equals
7.083. From the first half to the second half, excess kurtosis increases for the S&P 500,
but decreases for six of the ten stocks. As for the Treasury bill returns, both skewness and
excess kurtosis increase markedly from the first half to the second half.
Overall, the skewness and excess kurtosis statistics suggest that assuming normality
of returns is problematic, and the Jarque-Bera statistics and p-values reinforce that con-
clusion. For instance, consider the ten individual stocks over the entire period. In six out
of ten cases, the p-values for testing normality are less than 0.01. The p-values for the two
subperiods are somewhat larger, but that is expected given the smaller sample sizes.
We now consider the four options-based strategies, which are the covered call (long
stock plus short call), protective put (long stock plus long put), collar (long stock plus
short call plus long put), and covered combination (long stock plus short call plus short
put) strategies. For each of these strategies, we calculate the monthly return observable
at time t as follows:
(Covered Call)S(t) + D(t)− S(t− 1)− (C(t)− C(t− 1))
S(t− 1)− C(t− 1),
(Protective Put)S(t) + D(t)− S(t− 1) + (P (t)− P (t− 1))
S(t− 1) + P (t− 1),
(Collar)S(t) + D(t)− S(t− 1)− (C(t)− C(t− 1)) + (P (t)− P (t− 1))
S(t− 1)− C(t− 1) + P (t− 1),
(Covered Combination)S(t) + D(t)− S(t− 1)− (C(t)− C(t− 1))− (P (t)− P (t− 1))
S(t− 1)− C(t− 1)− P (t− 1).
6

Here we let S(t), C(t), and P (t) denote the stock, call, and put prices, respectively, at
time t. D(t) denotes the value at time t of dividends paid and reinvested over the interval
from t− 1 to t.
These returns are approximate in the sense that they assume that no options are
exercised early. The possibility of early exercise is an important difference between our
study and earlier studies that examined, for example, covered calls on the S&P 500 index.
Such covered calls use SPX options that have European-style exercise. Options on indi-
vidual equities have American-style exercise. It could be optimal to exercise an American
call option early if the underlying equity pays dividends. It could be optimal to exercise
an American put early even if the underlying equity does not pay dividends. Hence, be-
cause early exercise is ignored for the moment, the formulae above potentially overstate
returns (and associated performance measures) for the covered call and covered combina-
tion strategies. On the other hand, the formula above potentially understates returns (and
associated performance measures) for the protective put strategy. Returns for the collar
strategy could be overstated or understated. For the moment we ignore this early exercise
issue and compute returns as formulated above. After we have preliminary results using
these simplified returns, we shall investigate early exercise and how it impacts our results.
We give descriptive statistics for these four strategies, respectively, in Tables 2–5. The
results are for each of the ten individual stocks, both over the entire period 2003–2013 and
over each of the subperiods 2003–2007 and 2008–2013. We provide the same statistics
that we gave in Table 1 to facilitate comparison of these options-based strategies versus
the corresponding long equity strategy documented in Table 1. The main goal is to see
how the risk-return tradeoff has changed in going from the long equity strategy to the
corresponding options-based strategy.
Table 2 gives the covered call results. What do we expect to find? Compared to the
long equity strategy, we expect the covered call to yield smaller standard deviations, and
it does for all stocks and all periods. Perhaps more surprising is that the covered call often
gives higher mean returns. For instance, five stocks (Coca Cola, Microsoft, Oracle, Wells
Fargo, and ExxonMobil) all have higher mean returns over the entire period and over each
7

subperiod. In each of these cases, performance measures such as Sharpe ratios are higher
for the covered call strategy than for the corresponding long equity strategy. Indeed, when
we present Sharpe ratios later in Exhibit 6, it is clear that for a majority of these stocks,
covered calls yield larger Sharpe ratios than the corresponding long equity strategies.
Table 3 gives the protective put results. What do we expect to find? Compared to the
long equity strategy, we expect the protective put to yield smaller standard deviations, and
it does for all stocks in all periods. On the other hand, the mean returns for the protective
put are lower than the mean returns for the corresponding long equity strategies for all
stocks and all periods. Hence, unlike the case of the covered call, it is not clear that the
protective put generally yields a more favorable risk-return tradeoff than the corresponding
equity position.
Table 4 gives the collar results. What do we expect to find? Compared to the long
equity strategy, we expect the collar to yield smaller standard deviations, and it does for all
stocks and all periods. Indeed, the collar typically yields standard deviations that are lower
than the ones for the corresponding covered calls and protective puts. Like the protective
put, in all cases the collar yields mean returns that are lower than the mean returns for
the corresponding long equity strategies. Hence, as was the case with the protected put, it
is not clear that the collar generally yields a more favorable risk-return tradeoff than the
corresponding equity position.
Table 5 gives the covered combination results. Our expectations here differ consid-
erably from our expectations for the three other options-based strategies. The covered
combination strategy is more aggressive than the other three in terms of how it seeks more
income at initiation by selling two options. Hence, we expect the covered combination to
have both a higher mean return and a higher standard deviation of return than the corre-
sponding long equity strategy. This expectation generally occurs. Recall that the previous
three option strategies gave lower standard deviations than the long equity strategy for
all stocks in all time periods. In the 29 cases examined in Table 5, however, the covered
combination gives lower standard deviations in only eight cases. On the other hand, in
the 29 cases considered, the covered combination gives higher mean returns in all 29 cases.
8
The covered call considered in Table 2 gives higher mean returns in 17 cases, which is
impressive but still less than what the covered combination gives.
3.2. Comparing Risk Versus Return for Option Strategies Relative to Long Equity
To get a better picture of how the means and standard deviations for these option
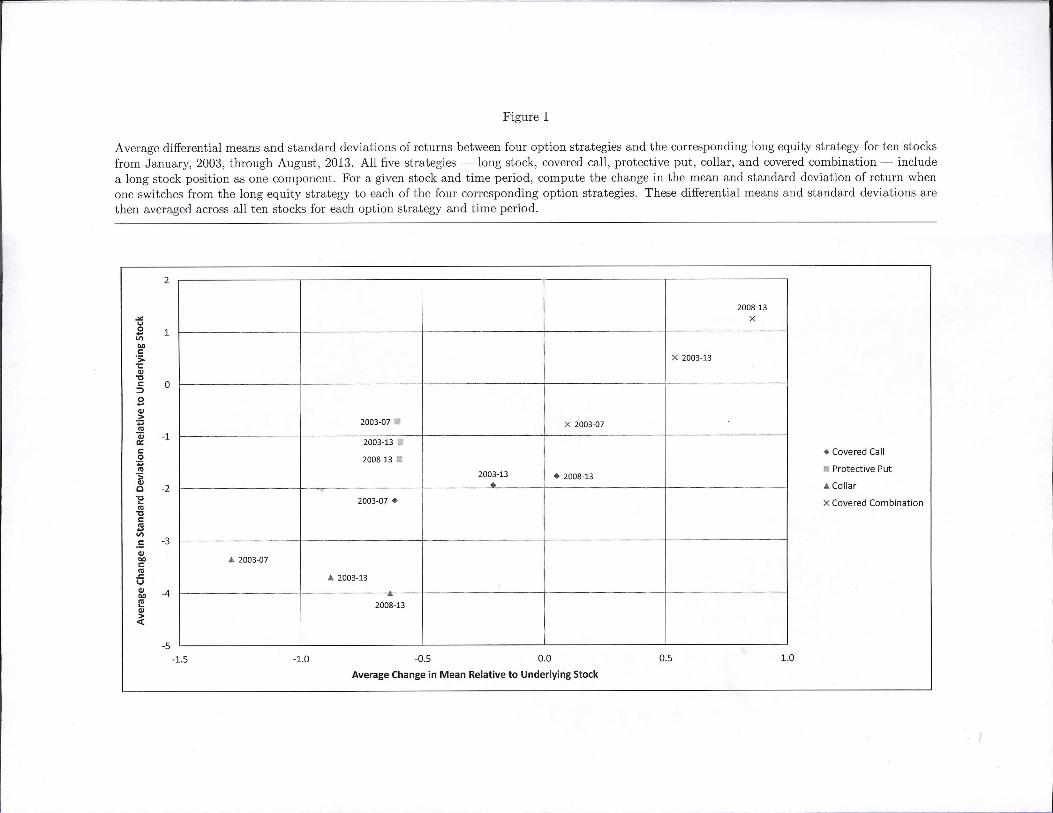
strategies compare to their counterparts for the long equity strategy, consider Figure 1.
Figure 1 presents average differential means and standard deviations of returns between
the four option strategies and the corresponding long equity strategy. Specifically, for a
given stock and time period, we compute the change in the mean and standard deviation of
return when one switches from the long equity strategy to each of the four option strategies.
After calculating those mean and standard deviation differentials, we average them across
all ten stocks for each of the three time periods.
What do we find? Not surprisingly, the twelve data points cluster into four groups,
one for each of the four strategies. Three of the strategies — the covered call, protective
put, and collar — yield smaller average standard deviation of return than the long equity
strategy. All three option strategies also yield a smaller average mean return. Of those
three strategies, the covered call does best in terms of decreasing standard deviation while
sacrificing as little expected return as possible. Most striking, however, is the performance
of the covered combination. For all three time periods, the covered combination raises
the average mean return. While standard deviation increases for the full sample and the
second half, for the first half standard deviation actually decreases on average. Overall,
the covered combination seems the most attractive strategy while the protective put seems
the least attractive strategy.
One troubling theme throughout Tables 2–5 is the pronounced non-normality of the
returns. It does not matter which of the four options-based strategies one considers. It
does not matter which time period one considers. Regardless of the strategy and period,
one usually rejects the hypothesis of normality for more than half of the ten stocks at the
5% confidence level. The fact that these distributions are non-normal is an important issue
— it weakens the inferences one can make with respect to the risk-return relationship and
standard portfolio performance measures such as the Sharpe ratio and Jensen’s alpha. In
9

a classic critique of using performance measures based on the Capital Asset Pricing Model
(CAPM) to gauge option performance, Leland (1999) stresses the unsatisfactory nature of
the underlying CAPM assumptions: (i) all asset returns are normally (and thus symmet-
rically) distributed, and (ii) all investors have mean-variance preferences (and thus ignore
skewness). These assumptions lead to mismeasurement of risk, misestimation of alpha,
and flawed performance measurement by the Sharpe ratio and Jensen’s alpha. Moreover,
non-normality is not the only statistical property that can lead to flawed performance mea-
surement. Lo (2002) examines estimation error associated with Sharpe ratios and finds
that serial correlation in returns can lead to grossly overstated Sharpe ratios. The bottom
line is that the statistical properties of these option strategy returns cannot be ignored;
they must be considered when interpreting the performance measure results upcoming in
Tables 6–9.
Although statistical properties of these returns can lead to faulty inference regard-
ing performance, they are not the only such factor. Managers can manipulate or “game”
performance measures so that their risk-adjusted returns are upwardly biased. Represen-
tative studies such as Spurgin (2001) and Ingersoll et al. (2007) examine how managers
can improve their measured Sharpe ratios by lengthening measurement intervals, using dy-
namic trading strategies or options, and other methods. (For an interesting non-technical
discussion see Lux (2002).)
Indeed, Leland (1999) examines both the covered call and the protective put strategies,
noting how the first strategy can be considered a “rebalancing” strategy and the second
strategy can be considered a “momentum” strategy. Using a simple numerical example,
he demonstrates: “When skewness is positively valued, mean-variance-based performance
measures will overrate the rebalancing strategies, which reduce skewness, and will under-
rate the momentum strategies, which buy skewness.” (See pp. 29–30 and Table 1 of Leland
(1999).) This demonstration foreshadows our performance results exactly. Specifically, we
find that the covered call strategy outperforms the long equity strategy, which in turn
outperforms the protective put strategy.
10

3.3. Judging Performance of Option Strategies Relative to Long Equity
Despite their imperfections, performance measures like the Sharpe ratio and Jensen’s
alpha are standard benchmarks for assessing managerial performance. Therefore, we cal-
culate and report four popular performance measures for each of the five strategies under
consideration. Three measures are well-known and date back to the 1960s — Sharpe ratio,
Jensen’s alpha, and Treynor ratio. The other measures, the Sortino ratio, is a more recent
construct that addresses various criticisms of the first three measures. The Sortino ratio
is an analogue of the Sharpe ratio in which one replaces the standard risk measure with a
measure of downside risk. More precisely, one replaces standard deviation of return with
a downside deviation, which is the standard deviation of realized returns when the asset
underperforms relative to its benchmark return. For details on these measures see Sharpe
(1966), Jensen (1968), Treynor (1965), and Sortino and Price (1994).
Tables 6–9 give our performance measure results. Specifically, Tables 6–9 present the
Sharpe ratio, Jensen’s alpha, Treynor ratio, Sortino ratio, respectively, for each of the
five strategies using the ten individual stocks, both over the entire period 2003–2013 and
over each of the subperiods 2003–2007 and 2008–2013. Overall, these tables all paint the
same picture. It matters little which measure or time period one considers. The covered
combination strategy tends to perform best. The covered call strategy also does well, and
both of these strategies outperform the long stock strategy. On the other hand, not all
of the options-based strategies perform well when compared to holding the stock by itself.
Both the collar and protective put perform worse than simply holding stock. Given the
results in Leland (1999), however, these findings are not surprising. Indeed, one would
reasonably expect such results.
The results of Tables 6–9 can be consolidated and summarized as follows. For any
given stock, measure, and period, we rank the strategies from 1 to 5 where 1 corresponds
to the best-performing strategy and 5 corresponds to the worst performing strategy. We
then average the rankings across all ten stocks for each performance measure and time
period. Table 10 displays these average rankings. Clearly, the covered combination does
best. If one averages these (already averaged across the ten stocks) rankings across all four
11

performance measures, the covered combination has the best average ranking regardless of
the time period considered. The covered call has the second best average ranking regardless
of the time period. The long equity strategy has the third best average ranking. The collar
and protective put rank fourth and fifth, respectively. For a chart of these average rankings
across both stocks and performance measures, see Figure 2.
3.4. Early Exercise
The preceding results must be tempered by the fact that the early exercise feature of
American options has not been incorporated. It is worth noting, however, that portfolio
managers who wish to avoid the complication of early exercise can do so. For example, a
manager can restrict attention to stocks that do not pay dividends. Doing so eliminates
worry over the early exercise of American call options. Moreover, although American
put options might be exercised early even in the absence of dividends, managers can use
European-style FLEX options (offered by the CBOE, for example) rather than their more
familiar American-style counterparts.
Although we have not adjusted strategy returns to incorporate the possibility of early
exercise, we do have some indirect evidence concerning the magnitude of this issue. This
evidence consists of descriptive statistics on the exercise activity for the stock options and
time period considered in our study. The Options Clearing Corporation records exercise
data for listed options, and it makes this data available to interested researchers. (See
Barraclough and Whaley (2012) for a detailed description of this data.)
We use this data to investigate the frequency with which options are exercised. Specif-
ically, for the stocks and time period in our study, we first consider options that were
actually used in calculating our option strategy returns. For any such option we compute
the number of times an “exercise event” occurs over the life of that option. By “exercise
event” we mean a date on which one of three types of market participants (customer, mar-
ket maker, and proprietary firm) exercises that option. (Hence, one date might correspond
to one, two, or three exercise events.) We also compute the total number of contracts
exercised for such options. We then calculate the analogous statistics, not just for options
used in our strategies, but for all options listed on each underlying stock. Finally, for each
12

underlying stock we calculate the percentage of exercised contracts for options actually
used in our strategies relative to all exercised options listed on that stock. The results
appear in Tables 11–13. Table 11 provides results for the entire period 2003–2013. Tables
12–13 provide results for the first subperiod 2003–2007 and second subperiod 2008–2013,
respectively.
What general patterns do we see in Tables 11–13? Consider the full sample examined
in Table 11. For the call options used in our strategies, exercise occurs a relatively low
percentage of the time. For call options in our study the percentage never exceeds 0.43%.
The story is different for puts. The relative exercise percentages for Amazon and Apple
are 15.52% and 3.00%, respectively. During the first subperiod, the only cases where the
percentage exceeds 1.00% are for Microsoft calls, when it equals 1.87%, and for Ama-
zon puts, when it equals 16.28%. As for the second subperiod, the only case where the
percentage exceeds 1.00% is for Apple puts, when it equals 4.73%. Clearly, of the ten
underlying stocks, Amazon is the one that raises the most concern regarding the impact
of early exercise. For that reason we investigate Amazon in more detail.
Table 14 explores exercise activity for Amazon puts from July 20, 2006, through
August 19, 2006. During 2003–2007 the vast majority of exercised puts occur during this
month-long interval and involve August 2006 puts with a strike price of 35. From July 20
through July 25, Amazon’s closing ask price stayed above $33.19. On July 26, however,
the closing ask price fell to $26.18, and it stayed below $27.17 for the rest of July. Indeed,
the closing ask price stayed below $30.00 for the remaining life of the contract. The fact
that it stayed much lower than the strike price during August is, however, irrelevant for
our study — our option strategies using these August 35 put options would have closed
the option positions on July 31. Any put options exercised during August would not affect
our return calculations. As an aside, note that exercise events occurring that August and
contracts exercised during August would be included in the statistics involving contracts
actually used for Amazon, yet they would not affect the option strategy return calculations
for Amazon. Thus, the statistics involving contracts actually used for Amazon are biased
upward. They make potential exercise appear to be a bigger issue than it actually is.
13

Consider the dates July 20 through July 31 in more detail. For the first four dates,
the put deltas range from -0.5115 to -0.5806. When the closing ask price falls to $26.18
on July 26, OptionMetrics does not report the delta and implied volatility for the put.
Evidently the put delta got so close to -1 that OptionMetrics had difficulty calculating the
delta and did not report it. As for the option bid-ask midpoint and the lower boundary
X−Sask, they are virtually identical. Their difference is -0.07. Similar results hold for the
rest of July. The put deltas are close to -1. The bid-ask midpoints and values of X −Sask
are nearly the same. Hence, from July 27 through July 31, one would expect to see these
put options exercised, and that is indeed the case. Of course, one might wonder why all
the options are not exercised on the first possible date, July 27. Given the evidence on
non-optimal exercise of put options reported in Barraclough and Whaley (2012), the fact
that option exercise is spread out over several days is not particularly surprising.
4. Concluding Remarks
In this paper we investigate the performance of options-based strategies versus long
equity strategies for individual stocks. In particular, we examine ten stocks widely held
in 401(k) plans over the period 2003–2013. The results suggest that options-based strate-
gies can be useful in improving the risk-return characteristics of a long equity portfolio.
Specifically, the covered combination and covered call strategies consistently outperform
the corresponding long stock strategy. This result holds regardless of the measure used to
gauge performance or whether one uses the first half, second half, or entire time period.
Although the evidence presented here is suggestive, it still is not compelling. If one
mechanically judges relative performance via standard measures such as those proposed
by Sharpe, Jensen, Treynor, and Sortino, then one might conclude that the covered com-
bination and covered call strategies are attractive alternatives to the standard long stock
position. Performance evaluation is not that simplistic, however. One cannot ignore the
growing literature documenting problems associated with the application of such measures
to option strategies. Moreover, early exercise is another issue that must be considered
more closely to judge performance more accurately.
14

Therefore, we believe that at least two issues are worth pursuing in future research.
The first issue is performance measurement. Do the results given here simply reflect
weaknesses in the performance measures used? Should we perhaps use an alternative
measure, e.g., the manipulation-proof measure proposed in Ingersoll et al. (2007)? We
might also use the Leland (1999) variant of CAPM developed for nonsymmetrical returns.
The second issue is early exercise. We must incorporate the early exercise feature into our
return calculations to assess its impact. If these options are rarely exercised early, then
the impact would be relatively small and the performance rankings would rarely change.
Ideally, we should recalculate the returns adjusted for early exercise, using methodology
such as that used by Pool, Stoll, and Whaley (2008) and Barraclough and Whaley (2012)
in their respective analyses on the early exercise of stock options.
References
Barraclough, Kathryn, and Robert E. Whaley, “Early Exercise of Put Options on Stocks,”
Journal of Finance, August 2012, pp. 1423–1456.
Eling, Martin, “Does the Measure Matter in the Mutual Fund Industry?” Financial Ana-
lysts Journal, May/June 2008, pp. 54-66.
Hill, Joanne M., Venkatesh Balasubramanian, Krag (Buzz) Gregory, and Ingrid Tierens,
“Finding Alpha via Covered Call Writing,” Financial Analysts Journal, Septem-
ber/October 2006, pp. 27–46.
Ingersoll, Jonathan, Matthew Spiegel, William Goetzmann, and Ivo Welch, “Portfolio
Performance Manipulation and Manipulation-Proof Performance Measures,” Review
of Financial Studies, September 2007, pp. 1503–1546.
Jensen, Michael C., “The Performance of Mutual Funds in the Period 1945–1964,” Journal
of Finance, May 1968, pp. 389–416.
Kapadia, Nikunj and Edward Szado, “The Risk Return Characteristics of the Buy-Write
Strategy on the Russell 2000 Index,” Journal of Alternative Investments, Spring 2007,
pp. 39–56.
15

Leland, Hayne E., “Beyond Mean-Variance: Performance Measurement in a Nonsymmet-
rical World,” Financial Analysts Journal, January/February 1999, pp. 27–36.
Lo, Andrew W., “The Statistics of Sharpe Ratios,” Financial Analysts Journal,
July/August 2002, pp. 27–46.
Lux, Hal, “Risk gets riskier,” Institutional Investor, October 2002, pp. 56–62.
Pool, Veronika K., Hans R. Stoll, and Robert E. Whaley, “Failure to exercise call options:
An anomaly and a trading game,” Journal of Financial Markets, February 2008,
pp. 1-35.
Sharpe, W.F., “Mutual Fund Performance,” Journal of Business, January 1966, pp. 119–
138.
Sortino, F.A. and L.N. Price, “Performance Measurement in a Downside Risk Framework,”
Journal of Investing, Fall 1994, pp. 59–65.
Spurgin, Richard, “How to Game Your Sharpe Ratio,” Journal of Alternative Investments,
Winter 2001, pp. 38–46.
Szado, Edward and Thomas Schneeweis, “Loosening Your Collar — Alternative Imple-
mentations of QQQ Collars,” Journal of Trading, Spring 2010, pp. 35–56.
Szado, Edward and Thomas Schneeweis, “Option-Based Risk Management in a Multi-
Asset World,” Unpublished Manuscript, April 2012, Isenberg School of Management,
University of Massachusetts, Amherst, MA 01003
Treynor, J.L., “How to Rate Management of Investment Funds,” Harvard Business Review,
January/February 1965, pp. 63–75.
Whaley, Robert E., “Return and Risk of CBOE Buy Write Monthly Index,” Journal of
Derivatives, Winter 2002, pp. 35–42.
16

Table 1
Summary statistics for monthly returns on T-Bills, the S&P 500, and ten stocks from January, 2003, through August, 2013. All stock and T-bill dataare from CRSP via WRDS. The T-bill returns are based on a thirty day target maturity using representative T-bills having at least thirty days totheir maturity date. The S&P 500 returns are value-weighted returns including distributions; the stock returns also include dividends. The stocks areApple (AAPL), Amazon (AMZN), Berkshire Hathaway (BRK), Comcast (CMCSA), Google (GOOG), Coca Cola (KO), Microsoft (MSFT), Oracle(ORCL), Wells Fargo (WFC), and Exxon Mobil (XOM). The missing observations for Berkshire Hathaway and Google correspond to months priorto the introduction of exchange-traded options for these companies.
T-Bill S&P 500 AAPL AMZN BRK CMCSA GOOG KO MSFT ORCL WFC XOM
2003–2013
Number of Months 128 128 128 128 50 128 108 128 128 128 128 128
Mean (%) 0.127 0.574 3.935 2.830 1.421 1.116 2.502 0.767 0.651 1.147 1.082 1.034
Standard Deviation (%) 0.071 4.199 10.626 12.028 4.775 7.300 10.642 4.703 6.603 7.366 8.868 5.069
Skewness 0.937 -0.808 -0.284 0.383 0.828 -0.196 0.887 -0.254 0.137 0.048 0.100 0.500
Excess Kurtosis -0.618 2.213 1.316 2.511 1.208 -0.106 2.359 1.594 0.994 -0.270 7.083 2.398
Jarque-Bera Statistic 20.747 40.033 10.956 36.768 8.753 0.878 39.213 14.928 5.668 0.439 267.799 35.995
Probability of Normal 0.000 0.000 0.004 0.000 0.013 0.645 0.000 0.001 0.059 0.803 0.000 0.000
2003–2007
Number of Months 60 60 60 60 0 60 40 60 60 60 60 60
Mean (%) 0.240 0.887 6.201 3.586 — 0.445 5.515 0.860 0.962 1.458 0.746 1.959
Standard Deviation (%) 0.138 2.481 10.555 13.845 — 6.317 12.012 4.362 5.762 6.724 3.428 5.122
Skewness 0.039 0.197 0.255 0.563 — 0.193 1.221 -0.291 0.918 -0.125 0.557 1.162
Excess Kurtosis -1.666 0.185 0.006 2.695 — 0.465 2.605 1.956 3.808 -0.779 0.282 4.625
Jarque-Bera Statistic 6.956 0.476 0.648 21.329 — 0.913 21.245 10.408 44.688 1.671 3.297 66.964
Probability of Normal 0.031 0.788 0.723 0.000 — 0.634 0.000 0.005 0.000 0.434 0.192 0.000
2008–2013
Number of Months 68 68 68 68 50 68 68 68 68 68 68 68
Mean (%) 0.027 0.297 1.935 2.163 1.421 1.708 0.729 0.684 0.376 0.872 1.378 0.217
Standard Deviation (%) 0.052 5.275 10.356 10.221 4.775 8.069 9.395 5.015 7.297 7.929 11.770 4.916
Skewness 2.528 -0.675 -0.850 -0.195 0.828 -0.448 0.255 -0.222 -0.158 0.172 -0.001 -0.143
Excess Kurtosis 5.684 0.735 2.054 0.366 1.208 -0.286 0.472 1.444 -0.217 -0.061 3.308 -0.314
Jarque-Bera Statistic 163.989 6.688 20.138 0.812 8.753 2.504 1.369 6.464 0.416 0.344 31.007 0.509
Probability of Normal 0.000 0.035 0.000 0.666 0.013 0.286 0.504 0.039 0.812 0.842 0.000 0.775

Table 2
Summary statistics for monthly covered call returns on ten stocks from January, 2003, through August, 2013. All stock data are from CRSP viaWRDS. All option data are from OptionMetrics via WRDS. The stock returns include distributions; the option returns assume no early exercise.The stocks are Apple (AAPL), Amazon (AMZN), Berkshire Hathaway (BRK), Comcast (CMCSA), Google (GOOG), Coca Cola (KO), Microsoft(MSFT), Oracle (ORCL), Wells Fargo (WFC), and Exxon Mobil (XOM). The missing observations for Berkshire Hathaway and Google correspondto months prior to the introduction of exchange-traded options for these companies.
AAPL AMZN BRK CMCSA GOOG KO MSFT ORCL WFC XOM
2003–2013
Number of Months 128 128 50 128 108 128 128 128 128 128
Mean (%) 3.152 1.911 1.497 1.104 1.582 0.827 0.851 1.217 1.165 1.091
Standard Deviation (%) 7.266 8.425 4.148 5.971 6.258 4.171 5.406 6.046 6.656 4.137
Skewness -1.652 -1.297 0.784 -0.738 -0.762 -0.779 -0.623 -0.382 -0.858 -0.554
Excess Kurtosis 4.863 2.035 2.411 0.360 -0.117 1.908 0.146 -0.578 6.751 0.357
Jarque-Bera Statistic 184.383 57.943 17.227 12.307 10.508 32.359 8.382 4.901 258.753 7.237
Probability of Normal 0.000 0.000 0.000 0.002 0.005 0.000 0.015 0.086 0.000 0.027
2003–2007
Number of Months 60 60 0 60 40 60 60 60 60 60
Mean (%) 4.739 1.550 — 0.526 3.375 0.836 1.087 1.567 0.814 1.725
Standard Deviation (%) 6.456 9.563 — 5.161 5.392 3.876 4.668 6.019 3.183 3.680
Skewness -0.788 -1.420 — -0.549 -0.845 -0.954 -0.390 -0.335 0.399 -0.626
Excess Kurtosis -0.101 2.098 — 0.343 0.530 2.359 -0.397 -0.758 0.196 1.513
Jarque-Bera Statistic 6.237 31.180 — 3.313 5.226 23.016 1.915 2.562 1.691 9.645
Probability of Normal 0.044 0.000 — 0.191 0.073 0.000 0.384 0.278 0.429 0.008
2008–2013
Number of Months 68 68 50 68 68 68 68 68 68 68
Mean (%) 1.751 2.230 1.497 1.615 0.528 0.819 0.644 0.908 1.475 0.532
Standard Deviation (%) 7.689 7.336 4.148 6.599 6.525 4.445 6.009 6.097 8.652 4.454
Skewness -2.106 -0.923 0.784 -0.913 -0.660 -0.682 -0.669 -0.429 -0.864 -0.421
Excess Kurtosis 6.387 0.785 2.411 0.417 -0.460 1.725 0.068 -0.414 3.737 -0.208
Jarque-Bera Statistic 165.861 11.411 17.227 9.937 5.538 13.701 5.078 2.573 48.039 2.134
Probability of Normal 0.000 0.003 0.000 0.007 0.063 0.001 0.079 0.276 0.000 0.344

Table 3
Summary statistics for monthly protective put returns on ten stocks from January, 2003, through August, 2013. All stock data are from CRSP viaWRDS. All option data are from OptionMetrics via WRDS. The stock returns include distributions; the option returns assume no early exercise.The stocks are Apple (AAPL), Amazon (AMZN), Berkshire Hathaway (BRK), Comcast (CMCSA), Google (GOOG), Coca Cola (KO), Microsoft(MSFT), Oracle (ORCL), Wells Fargo (WFC), and Exxon Mobil (XOM). The missing observations for Berkshire Hathaway and Google correspondto months prior to the introduction of exchange-traded options for these companies.
AAPL AMZN BRK CMCSA GOOG KO MSFT ORCL WFC XOM
2003–2013
Number of Months 128 128 50 128 108 128 128 128 128 128
Mean (%) 3.003 1.826 0.757 0.499 1.876 0.518 0.294 0.555 0.721 0.539
Standard Deviation (%) 8.831 9.918 4.420 6.226 9.149 4.107 5.677 6.303 7.631 4.595
Skewness 0.665 1.511 1.083 0.177 1.625 0.355 0.713 0.386 2.268 1.086
Excess Kurtosis 0.341 5.260 1.657 -0.304 4.438 0.216 1.452 -0.158 11.033 3.796
Jarque-Bera Statistic 10.048 196.270 15.503 1.160 136.186 2.936 22.088 3.314 758.960 102.016
Probability of Normal 0.007 0.000 0.000 0.600 0.000 0.230 0.000 0.191 0.000 0.000
2003–2007
Number of Months 60 60 0 60 40 60 60 60 60 60
Mean (%) 4.896 2.994 — -0.137 4.198 0.729 0.626 0.930 0.519 1.558
Standard Deviation (%) 9.702 11.559 — 5.649 11.327 3.927 5.450 5.990 3.148 4.864
Skewness 0.625 1.771 — 0.510 1.559 0.290 1.220 0.095 0.755 1.730
Excess Kurtosis 0.245 5.199 — 0.845 3.295 0.798 4.313 -0.868 0.219 5.641
Jarque-Bera Statistic 4.062 98.916 — 4.388 34.295 2.432 61.392 1.975 5.821 109.463
Probability of Normal 0.131 0.000 — 0.111 0.000 0.296 0.000 0.372 0.054 0.000
2008–2013
Number of Months 68 68 50 68 68 68 68 68 68 68
Mean (%) 1.332 0.794 0.757 1.061 0.510 0.333 0.002 0.224 0.899 -0.361
Standard Deviation (%) 7.673 8.154 4.420 6.684 7.341 4.280 5.894 6.593 10.079 4.175
Skewness 0.435 0.408 1.083 -0.070 1.026 0.428 0.401 0.613 1.823 0.145
Excess Kurtosis -0.508 0.746 1.657 -0.747 1.894 -0.051 -0.343 0.399 5.861 -0.455
Jarque-Bera Statistic 2.880 3.461 15.503 1.635 22.083 2.081 2.157 4.714 134.993 0.823
Probability of Normal 0.237 0.177 0.000 0.441 0.000 0.353 0.340 0.095 0.000 0.663

Table 4
Summary statistics for monthly collar returns on ten stocks from January, 2003, through August, 2013. All stock data are from CRSP via WRDS. Alloption data are from OptionMetrics via WRDS. The stock returns include distributions; the option returns assume no early exercise. The stocks areApple (AAPL), Amazon (AMZN), Berkshire Hathaway (BRK), Comcast (CMCSA), Google (GOOG), Coca Cola (KO), Microsoft (MSFT), Oracle(ORCL), Wells Fargo (WFC), and Exxon Mobil (XOM). The missing observations for Berkshire Hathaway and Google correspond to months priorto the introduction of exchange-traded options for these companies.
AAPL AMZN BRK CMCSA GOOG KO MSFT ORCL WFC XOM
2003–2013
Number of Months 128 128 50 128 108 128 128 128 128 128
Mean (%) 2.092 0.787 0.806 0.457 0.883 0.571 0.493 0.592 0.458 0.585
Standard Deviation (%) 4.503 5.295 3.705 4.530 3.836 3.436 4.172 4.664 3.407 3.428
Skewness -0.100 -1.405 1.267 -0.450 -0.220 -0.085 -0.089 -0.126 -0.040 -0.111
Excess Kurtosis -0.723 5.603 4.118 -0.472 -1.051 -0.357 -0.991 -1.056 -0.233 -0.267
Jarque-Bera Statistic 2.998 209.583 48.710 5.501 5.844 0.836 5.410 6.289 0.324 0.641
Probability of Normal 0.223 0.000 0.000 0.064 0.054 0.658 0.067 0.043 0.850 0.726
2003–2007
Number of Months 60 60 0 60 40 60 60 60 60 60
Mean (%) 3.207 0.824 — -0.082 1.878 0.701 0.738 1.002 0.587 1.309
Standard Deviation (%) 4.974 6.286 — 4.222 3.802 3.357 4.199 5.047 2.834 3.241
Skewness -0.351 -1.618 — -0.497 -0.260 -0.273 -0.116 -0.182 0.676 0.086
Excess Kurtosis -0.666 6.107 — -0.333 -0.873 0.376 -0.821 -1.040 -0.005 -0.117
Jarque-Bera Statistic 2.345 119.431 — 2.743 1.723 1.096 1.820 3.034 4.569 0.108
Probability of Normal 0.310 0.000 — 0.254 0.422 0.578 0.403 0.219 0.102 0.947
2008–2013
Number of Months 68 68 50 68 68 68 68 68 68 68
Mean (%) 1.108 0.754 0.806 0.933 0.297 0.457 0.277 0.230 0.345 -0.053
Standard Deviation (%) 3.814 4.282 3.705 4.766 3.762 3.526 4.167 4.304 3.860 3.485
Skewness -0.194 -0.644 1.267 -0.506 -0.236 0.064 -0.070 -0.148 -0.245 -0.188
Excess Kurtosis -1.040 -0.345 4.118 -0.510 -1.276 -0.795 -1.129 -1.194 -0.603 -0.562
Jarque-Bera Statistic 3.487 5.037 48.710 3.643 5.243 1.839 3.668 4.287 1.712 1.295
Probability of Normal 0.175 0.081 0.000 0.162 0.073 0.399 0.160 0.117 0.425 0.523

Table 5
Summary statistics for monthly covered combination returns on ten stocks from January, 2003, through August, 2013. All stock data are from CRSPvia WRDS. All option data are from OptionMetrics via WRDS. The stock returns include distributions; the option returns assume no early exercise.The stocks are Apple (AAPL), Amazon (AMZN), Berkshire Hathaway (BRK), Comcast (CMCSA), Google (GOOG), Coca Cola (KO), Microsoft(MSFT), Oracle (ORCL), Wells Fargo (WFC), and Exxon Mobil (XOM). The missing observations for Berkshire Hathaway and Google correspondto months prior to the introduction of exchange-traded options for these companies.
AAPL AMZN BRK CMCSA GOOG KO MSFT ORCL WFC XOM
2003–2013
Number of Months 128 128 50 128 108 128 128 128 128 128
Mean (%) 4.278 3.140 2.211 1.790 2.327 1.090 1.227 1.879 2.304 1.620
Standard Deviation (%) 10.939 12.468 4.711 7.724 9.151 5.164 6.971 7.731 13.016 5.053
Skewness -2.801 -1.532 0.412 -0.907 -1.036 -1.669 -1.088 -0.561 0.406 -0.755
Excess Kurtosis 12.388 3.579 1.431 1.460 0.821 6.933 2.105 0.462 14.634 1.669
Jarque-Bera Statistic 979.249 118.370 5.680 28.903 22.337 315.788 48.901 7.858 1145.653 27.035
Probability of Normal 0.000 0.000 0.058 0.000 0.000 0.000 0.000 0.020 0.000 0.000
2003–2007
Number of Months 60 60 0 60 40 60 60 60 60 60
Mean (%) 6.367 2.337 — 1.169 4.968 0.975 1.452 2.160 1.018 2.149
Standard Deviation (%) 8.263 13.929 — 6.319 7.438 4.570 5.285 7.197 3.831 4.271
Skewness -1.054 -1.833 — -0.461 -1.274 -1.813 -0.610 -0.456 -0.587 -1.476
Excess Kurtosis 0.675 3.955 — 1.389 2.139 6.736 0.336 -0.107 3.654 5.402
Jarque-Bera Statistic 12.245 72.721 — 6.948 18.452 146.296 3.999 2.108 36.825 94.741
Probability of Normal 0.002 0.000 — 0.031 0.000 0.000 0.135 0.348 0.000 0.000
2008–2013
Number of Months 68 68 50 68 68 68 68 68 68 68
Mean (%) 2.434 3.848 2.211 2.337 0.774 1.192 1.029 1.631 3.439 1.154
Standard Deviation (%) 12.622 11.078 4.711 8.791 9.742 5.670 8.211 8.219 17.477 5.645
Skewness -2.987 -0.888 0.412 -1.125 -0.862 -1.612 -1.094 -0.608 0.137 -0.372
Excess Kurtosis 11.556 1.677 1.431 1.359 0.338 6.896 1.555 0.721 7.552 0.459
Jarque-Bera Statistic 479.484 16.915 5.680 19.580 8.749 164.194 20.410 5.658 161.802 2.163
Probability of Normal 0.000 0.000 0.058 0.000 0.013 0.000 0.000 0.059 0.000 0.339

Table 6
Sharpe ratios for monthly returns from five strategies on ten stocks from January, 2003, through August, 2013. All five strategies — long stock,covered call, protective put, collar, and covered combination — include a long stock position as one component. All stock data are from CRSP viaWRDS. All option data are from OptionMetrics via WRDS. The stock returns include distributions; the option returns assume no early exercise.The stocks are Apple (AAPL), Amazon (AMZN), Berkshire Hathaway (BRK), Comcast (CMCSA), Google (GOOG), Coca Cola (KO), Microsoft(MSFT), Oracle (ORCL), Wells Fargo (WFC), and Exxon Mobil (XOM).
AAPL AMZN BRK CMCSA GOOG KO MSFT ORCL WFC XOM
2003–2013
Long Stock 0.3584 0.2247 0.2965 0.1356 0.2224 0.1361 0.0795 0.1385 0.1077 0.1790
Covered Call 0.4164 0.2118 0.3596 0.1638 0.2313 0.1679 0.1341 0.1804 0.1561 0.2332
Protective Put 0.3257 0.1713 0.1700 0.0599 0.1903 0.0954 0.0295 0.0680 0.0779 0.0897
Collar 0.4365 0.1247 0.2160 0.0730 0.1950 0.1295 0.0879 0.0997 0.0973 0.1338
Covered Combination 0.3795 0.2417 0.4682 0.2153 0.2396 0.1866 0.1579 0.2267 0.1673 0.2596
2003–2007
Long Stock 0.5648 0.2417 — 0.0325 0.4326 0.1423 0.1254 0.1811 0.1477 0.3357
Covered Call 0.6970 0.1370 — 0.0555 0.5669 0.1539 0.1815 0.2206 0.1804 0.4036
Protective Put 0.4799 0.2382 — -0.0668 0.3425 0.1246 0.0708 0.1153 0.0886 0.2709
Collar 0.5966 0.0929 — -0.0762 0.4102 0.1374 0.1187 0.1509 0.1224 0.3299
Covered Combination 0.7416 0.1506 — 0.1470 0.6251 0.1609 0.2293 0.2667 0.2030 0.4469
2008–2013
Long Stock 0.1843 0.2090 0.2965 0.2084 0.0747 0.1311 0.0480 0.1067 0.1148 0.0388
Covered Call 0.2244 0.3004 0.3596 0.2407 0.0769 0.1782 0.1027 0.1446 0.1674 0.1136
Protective Put 0.1701 0.0942 0.1700 0.1548 0.0658 0.0715 -0.0042 0.0300 0.0866 -0.0927
Collar 0.2836 0.1699 0.2160 0.1901 0.0720 0.1221 0.0601 0.0472 0.0825 -0.0229
Covered Combination 0.1908 0.3449 0.4682 0.2629 0.0767 0.2055 0.1221 0.1952 0.1953 0.1997

Table 7
Jensen’s alphas for monthly returns from five strategies on ten stocks from January, 2003, through August, 2013. All five strategies — long stock,covered call, protective put, collar, and covered combination — include a long stock position as one component. All stock data are from CRSP viaWRDS. All option data are from OptionMetrics via WRDS. The stock returns include distributions; the option returns assume no early exercise.The stocks are Apple (AAPL), Amazon (AMZN), Berkshire Hathaway (BRK), Comcast (CMCSA), Google (GOOG), Coca Cola (KO), Microsoft(MSFT), Oracle (ORCL), Wells Fargo (WFC), and Exxon Mobil (XOM).
AAPL AMZN BRK CMCSA GOOG KO MSFT ORCL WFC XOM
2003–2013
Long Stock 0.0325 0.0218 0.0093 0.0055 0.0201 0.0039 0.0011 0.0052 0.0043 0.0065
Covered Call 0.0267 0.0141 0.0106 0.0060 0.0120 0.0048 0.0037 0.0070 0.0059 0.0074
Protective Put 0.0244 0.0131 0.0037 0.0004 0.0148 0.0021 -0.0014 0.0001 0.0020 0.0020
Collar 0.0174 0.0045 0.0048 0.0008 0.0061 0.0029 0.0013 0.0018 0.0013 0.0028
Covered Combination 0.0365 0.0247 0.0165 0.0116 0.0182 0.0068 0.0062 0.0125 0.0136 0.0122
2003–2007
Long Stock 0.0492 0.0182 — -0.0019 0.0466 0.0009 0.0018 0.0036 0.0011 0.0120
Covered Call 0.0385 0.0046 — -0.0006 0.0269 0.0017 0.0036 0.0052 0.0023 0.0106
Protective Put 0.0371 0.0142 — -0.0069 0.0346 0.0004 -0.0010 -0.0003 -0.0006 0.0085
Collar 0.0243 -0.0003 — -0.0059 0.0134 0.0012 0.0008 0.0011 0.0007 0.0070
Covered Combination 0.0536 0.0100 — 0.0049 0.0414 0.0023 0.0066 0.0095 0.0037 0.0142
2008–2013
Long Stock 0.0160 0.0189 0.0093 0.0139 0.0041 0.0052 0.0010 0.0055 0.0100 0.0005
Covered Call 0.0152 0.0200 0.0106 0.0134 0.0030 0.0067 0.0040 0.0066 0.0115 0.0038
Protective Put 0.0107 0.0060 0.0037 0.0081 0.0027 0.0021 -0.0021 -0.0004 0.0062 -0.0050
Collar 0.0097 0.0062 0.0048 0.0074 0.0016 0.0035 0.0012 0.0005 0.0020 -0.0018
Covered Combination 0.0211 0.0352 0.0165 0.0198 0.0045 0.0100 0.0070 0.0132 0.0285 0.0097

Table 8
Treynor ratios for monthly returns from five strategies on ten stocks from January, 2003, through August, 2013. All five strategies — long stock,covered call, protective put, collar, and covered combination — include a long stock position as one component. All stock data are from CRSP viaWRDS. All option data are from OptionMetrics via WRDS. The stock returns include distributions; the option returns assume no early exercise.The stocks are Apple (AAPL), Amazon (AMZN), Berkshire Hathaway (BRK), Comcast (CMCSA), Google (GOOG), Coca Cola (KO), Microsoft(MSFT), Oracle (ORCL), Wells Fargo (WFC), and Exxon Mobil (XOM).
AAPL AMZN BRK CMCSA GOOG KO MSFT ORCL WFC XOM
2003–2013
Long Stock 0.0308 0.0232 0.0359 0.0100 0.0215 0.0115 0.0057 0.0091 0.0081 0.0157
Covered Call 0.0376 0.0215 0.0422 0.0117 0.0190 0.0143 0.0092 0.0123 0.0104 0.0189
Protective Put 0.0292 0.0195 0.0242 0.0050 0.0217 0.0094 0.0025 0.0046 0.0068 0.0086
Collar 0.0393 0.0139 0.0308 0.0058 0.0179 0.0130 0.0070 0.0072 0.0074 0.0114
Covered Combination 0.0369 0.0248 0.0490 0.0148 0.0194 0.0150 0.0102 0.0154 0.0119 0.0241
2003–2007
Long Stock 0.0371 0.0142 — 0.0034 0.0404 0.0076 0.0086 0.0092 0.0083 0.0214
Covered Call 0.0446 0.0100 — 0.0053 0.0355 0.0091 0.0114 0.0106 0.0109 0.0224
Protective Put 0.0318 0.0133 — -0.0078 0.0394 0.0071 0.0052 0.0062 0.0054 0.0183
Collar 0.0358 0.0062 — -0.0078 0.0294 0.0088 0.0077 0.0075 0.0080 0.0186
Covered Combination 0.0514 0.0124 — 0.0138 0.0381 0.0094 0.0142 0.0128 0.0122 0.0254
2008–2013
Long Stock 0.0167 0.0231 0.0359 0.0156 0.0065 0.0129 0.0037 0.0078 0.0104 0.0036
Covered Call 0.0231 0.0298 0.0422 0.0175 0.0067 0.0173 0.0077 0.0109 0.0132 0.0107
Protective Put 0.0150 0.0123 0.0242 0.0127 0.0062 0.0084 -0.0004 0.0022 0.0092 -0.0092
Collar 0.0255 0.0189 0.0308 0.0150 0.0067 0.0141 0.0051 0.0035 0.0071 -0.0022
Covered Combination 0.0221 0.0338 0.0490 0.0189 0.0067 0.0189 0.0090 0.0151 0.0163 0.0192

Table 9
Sortino ratios for monthly returns from five strategies on ten stocks from January, 2003, through August, 2013. All five strategies — long stock,covered call, protective put, collar, and covered combination — include a long stock position as one component. All stock data are from CRSP viaWRDS. All option data are from OptionMetrics via WRDS. The stock returns include distributions; the option returns assume no early exercise.The stocks are Apple (AAPL), Amazon (AMZN), Berkshire Hathaway (BRK), Comcast (CMCSA), Google (GOOG), Coca Cola (KO), Microsoft(MSFT), Oracle (ORCL), Wells Fargo (WFC), and Exxon Mobil (XOM).
AAPL AMZN BRK CMCSA GOOG KO MSFT ORCL WFC XOM
2003–2013
Long Stock 0.6789 0.3949 0.6844 0.2103 0.4326 0.2155 0.1220 0.2262 0.1677 0.3151
Covered Call 0.6638 0.2933 0.8264 0.2376 0.3458 0.2540 0.1955 0.2843 0.2265 0.3727
Protective Put 0.7551 0.3536 0.3621 0.0925 0.4290 0.1593 0.0472 0.1103 0.1553 0.1590
Collar 0.9362 0.1714 0.4641 0.1032 0.3148 0.2093 0.1338 0.1533 0.1517 0.2134
Covered Combination 0.5326 0.3306 1.1107 0.3156 0.3450 0.2631 0.2218 0.3593 0.2656 0.4717
2003–2007
Long Stock 1.4342 0.4494 — 0.0487 1.2429 0.2208 0.2133 0.2955 0.2626 0.7587
Covered Call 1.4951 0.1791 — 0.0761 1.0642 0.2216 0.2783 0.3561 0.3206 0.7171
Protective Put 1.2847 0.5996 — -0.0955 1.0163 0.2096 0.1210 0.1850 0.1553 0.6644
Collar 1.3416 0.1237 — -0.0960 0.7989 0.2142 0.1812 0.2374 0.2179 0.6320
Covered Combination 1.5288 0.1903 — 0.2164 1.1046 0.2162 0.3543 0.4353 0.3218 0.7263
2008–2013
Long Stock 0.2878 0.3408 0.6844 0.3299 0.1150 0.2118 0.0705 0.1752 0.1777 0.0572
Covered Call 0.3092 0.4646 0.8264 0.3605 0.1046 0.2815 0.1467 0.2244 0.2389 0.1702
Protective Put 0.3293 0.1541 0.3621 0.2526 0.1152 0.1192 -0.0064 0.0492 0.1755 -0.1278
Collar 0.5422 0.2528 0.4641 0.2956 0.1044 0.2049 0.0916 0.0708 0.1224 -0.0321
Covered Combination 0.2406 0.5449 1.1107 0.3850 0.1020 0.3003 0.1671 0.3057 0.3098 0.3154

Table 10
Average rankings of the relative performance of five strategies for ten stocks from January, 2003, through August, 2013. All five strategies — longstock, covered call, protective put, collar, and covered combination — include a long stock position as one component. Relative performance is basedon four performance measures — Sharpe ratio, Jensen’s alpha, Treynor ratio, and Sortino ratio. For a given performance measure and time period,each of the five strategies receives an integer ranking from 1 to 5, with 1 representing the best performance and 5 representing the worst. Rankingsare then averaged across all ten stocks for each performance measure and time period. Rankings are also averaged across all ten stocks and all fourperformance measures for each time period.
Average Across
Sharpe Jensen Treynor Sortino Four Measures
2003–2013
Long Stock 3.10 2.70 3.10 2.70 2.90
Covered Call 2.10 2.40 2.30 2.50 2.33
Protective Put 4.90 4.50 4.50 4.00 4.48
Collar 3.70 4.30 3.70 3.90 3.90
Covered Combination 1.20 1.10 1.40 1.90 1.40
2003–2007
Long Stock 2.89 2.44 2.67 2.33 2.58
Covered Call 2.22 2.67 2.44 2.33 2.42
Protective Put 4.56 4.22 4.22 4.22 4.31
Collar 4.11 4.33 4.22 4.44 4.28
Covered Combination 1.22 1.33 1.44 1.67 1.42
2008–2013
Long Stock 3.20 2.80 3.40 3.10 3.13
Covered Call 1.90 2.30 1.90 2.20 2.08
Protective Put 4.90 4.60 4.90 4.20 4.65
Collar 3.70 4.30 3.40 3.70 3.78
Covered Combination 1.30 1.00 1.40 1.80 1.38

Table 11
Summary statistics for exercise activity of options on ten stocks from January, 2003, through August, 2013. The stocks are Apple (AAPL), Amazon(AMZN), Berkshire Hathaway (BRK), Comcast (CMCSA), Google (GOOG), Coca Cola (KO), Microsoft (MSFT), Oracle (ORCL), Wells Fargo(WFC), and Exxon Mobil (XOM). The exercise data are from the Options Clearing Corporation. For a given stock “contracts used” are contractsused in at least one option strategy for that stock, and “all options” are all options listed on that stock. An “exercise event” is a date on which oneof three types of market participant (customer, market maker, and proprietary firm) exercises an option. Thus, one date might correspond to 1–3exercise events.
Calls (2003–2013)
Number of Number of Number of Number of Percentage ofNumber of Exercise Events Contracts Exercised Exercise Events Contracts Exercised Exercised Contracts
Ticker Expirations For Contracts Used For Contracts Used For All Contracts For All Contracts Used in StrategiesAAPL 128 13 56 3,442 238,730 0.02AMZN 128 4 19 419 14,470 0.13BRKB 50 0 0 111 4,032 0.00
CMCSA 128 16 1,879 1,780 3,396,324 0.06GOOG 108 5 20 553 6,248 0.32
KO 128 0 0 617 229,680 0.00MSFT 128 7 857 1,998 1,627,425 0.05ORCL 128 5 25 629 172,507 0.01WFC 128 6 3,627 1,512 849,946 0.43XOM 128 4 47 1,050 361,829 0.01
Puts (2003–2013)
Number of Number of Number of Number of Percentage ofNumber of Exercise Events Contracts Exercised Exercise Events Contracts Exercised Exercised Contracts
Ticker Expirations For Contracts Used For Contracts Used For All Contracts For All Contracts Used in StrategiesAAPL 128 26 33,609 9,901 1,119,366 3.00AMZN 128 41 179,421 3,332 1,156,043 15.52BRKB 50 0 0 165 6,381 0.00
CMCSA 128 0 0 541 341,079 0.00GOOG 108 8 735 10,609 875,275 0.08
KO 128 1 9 1,118 320,173 0.00MSFT 128 1 500 2,683 1,151,320 0.04ORCL 128 2 125 1,212 228,410 0.05WFC 128 12 1,507 1,294 273,819 0.55XOM 128 6 21 1,725 510,981 0.00

Table 12
Summary statistics for exercise activity of options on ten stocks from January, 2003, through December, 2007. The stocks are Apple (AAPL),Amazon (AMZN), Berkshire Hathaway (BRK), Comcast (CMCSA), Google (GOOG), Coca Cola (KO), Microsoft (MSFT), Oracle (ORCL), WellsFargo (WFC), and Exxon Mobil (XOM). The exercise data are from the Options Clearing Corporation. For a given stock “contracts used” arecontracts used in at least one option strategy for that stock, and “all options” are all options listed on that stock. An “exercise event” is a date onwhich one of three types of market participant (customer, market maker, and proprietary firm) exercises an option. Thus, one date might correspondto 1–3 exercise events.
Calls (2003–2007)
Number of Number of Number of Number of Percentage ofNumber of Exercise Events Contracts Exercised Exercise Events Contracts Exercised Exercised Contracts
Ticker Expirations For Contracts Used For Contracts Used For All Contracts For All Contracts Used in StrategiesAAPL 60 4 27 203 10,549 0.26AMZN 60 0 0 77 1,575 0.00CMCSA 60 0 0 36 9,220 0.00GOOG 40 5 20 196 3,152 0.63
KO 60 0 0 118 48,364 0.00MSFT 60 5 747 303 39,955 1.87ORCL 60 3 10 87 4,264 0.23WFC 60 2 121 185 255,770 0.05XOM 60 1 3 154 23,016 0.01
Puts (2003–2007)
Number of Number of Number of Number of Percentage ofNumber of Exercise Events Contracts Exercised Exercise Events Contracts Exercised Exercised Contracts
Ticker Expirations For Contracts Used For Contracts Used For All Contracts For All Contracts Used in StrategiesAAPL 60 0 0 2,821 408,739 0.00AMZN 60 38 179,221 1,737 1,100,602 16.28CMCSA 60 0 0 441 337,133 0.00GOOG 40 0 0 5,732 439,254 0.00
KO 60 1 9 552 240,649 0.00MSFT 60 1 500 1,533 628,938 0.08ORCL 60 1 25 721 127,253 0.02WFC 60 6 55 364 43,996 0.13XOM 60 0 0 779 409,267 0.00

Table 13
Summary statistics for exercise activity of options on ten stocks from January, 2008, through August, 2013. The stocks are Apple (AAPL), Amazon(AMZN), Berkshire Hathaway (BRK), Comcast (CMCSA), Google (GOOG), Coca Cola (KO), Microsoft (MSFT), Oracle (ORCL), Wells Fargo(WFC), and Exxon Mobil (XOM). The exercise data are from the Options Clearing Corporation. For a given stock “contracts used” are contractsused in at least one option strategy for that stock, and “all options” are all options listed on that stock. An “exercise event” is a date on which oneof three types of market participant (customer, market maker, and proprietary firm) exercises an option. Thus, one date might correspond to 1–3exercise events.
Calls (2008–2013)
Number of Number of Number of Number of Percentage ofNumber of Exercise Events Contracts Exercised Exercise Events Contracts Exercised Exercised Contracts
Ticker Expirations For Contracts Used For Contracts Used For All Contracts For All Contracts Used in StrategiesAAPL 68 9 29 3,239 228,181 0.01AMZN 68 4 19 342 12,895 0.15BRKB 50 0 0 111 4,032 0.00
CMCSA 68 16 1,879 1,744 3,387,104 0.06GOOG 68 0 0 357 3,096 0.00
KO 68 0 0 499 181,316 0.00MSFT 68 2 110 1,695 1,587,470 0.01ORCL 68 2 15 542 168,243 0.01WFC 68 4 3,506 1,327 594,176 0.59XOM 68 3 44 896 338,813 0.01
Puts (2008–2013)
Number of Number of Number of Number of Percentage ofNumber of Exercise Events Contracts Exercised Exercise Events Contracts Exercised Exercised Contracts
Ticker Expirations For Contracts Used For Contracts Used For All Contracts For All Contracts Used in StrategiesAAPL 68 26 33,609 7,080 710,627 4.73AMZN 68 3 200 1,595 55,441 0.36BRKB 50 0 0 165 6,381 0.00
CMCSA 68 0 0 100 3,946 0.00GOOG 68 8 735 4,877 436,021 0.17
KO 68 0 0 566 79,524 0.00MSFT 68 0 0 1,150 522,382 0.00ORCL 68 1 100 491 101,157 0.10WFC 68 6 1,452 930 229,823 0.63XOM 68 6 21 946 101,714 0.02

Table 14
Exercise activity for Amazon put options from July 20, 2006 through August 19, 2006. All stock data are from CRSP via WRDS. The option exercisedata are from the Options Clearing Corporation. All other option data are from OptionMetrics via WRDS.
Number Implied Amazon Lower Bid-Ask
of Volatility Delta Closing Option Boundary Midpoint
Option Open Options of the of the Strike Ask Price Bid-Ask for Put Boundary
Date Volume Interest Exercised Option Option Price Sask Midpoint X − Sask Check
7/20/2006 3,022 12,385 0 0.5706 -0.5195 35 34.19 2.58 0.81 1.77
7/21/2006 4,308 14,007 0 0.6287 -0.5806 35 33.19 3.30 1.81 1.49
7/24/2006 4,499 15,073 0 0.6095 -0.5115 35 34.31 2.50 0.69 1.81
7/25/2006 6,877 17,027 0 0.6323 -0.5629 35 33.58 2.93 1.42 1.51
7/26/2006 65,554 20,482 62,720 35 26.18 8.75 8.82 -0.07
7/27/2006 43,326 11,693 45,722 35 26.53 8.45 8.47 -0.02
7/28/2006 8,039 6,914 8,150 35 27.17 7.80 7.83 -0.03
7/31/2006 53 6,759 1,387 0.6938 -0.9575 35 26.86 8.15 8.14 0.01
8/01/2006 39,855 6,622 40,860 0.8118 -0.9443 35 26.30 8.75 8.70 0.05
8/02/2006 6,004 3,653 6,164 35 26.09 8.90 8.91 -0.01
8/03/2006 3 3,493 0 35 26.64 8.35 8.36 -0.01
8/04/2006 12 3,496 7 35 27.26 7.70 7.74 -0.04
8/07/2006 0 3,487 4 35 26.79 8.20 8.21 -0.01
8/08/2006 6,968 3,483 7,571 35 26.35 8.60 8.65 -0.05
8/09/2006 5,808 2,880 5,804 35 26.22 8.80 8.78 0.02
8/10/2006 0 2,884 0 35 26.47 8.55 8.53 0.02
8/11/2006 2 2,884 1 35 26.02 9.00 8.98 0.02
8/14/2006 10 2,883 7 35 26.54 8.40 8.46 -0.06
8/15/2006 401 2,876 299 35 27.75 7.25 7.25 0.00
8/16/2006 0 2,565 1 35 27.92 7.10 7.08 0.02
8/17/2006 60 2,576 0 35 29.16 5.90 5.84 0.06
8/18/2006 25 2,581 0 35 29.11 5.90 5.89 0.01
8/19/2006 2,581