the performance bottleneck application, computer, or network
DESCRIPTION
The Performance Bottleneck Application, Computer, or Network. Richard Carlson Internet2 Part 3. Outline. Why there is a problem What can be done to find/fix problems Tools you can use Ramblings on what’s next. Active Measurement Tools. - PowerPoint PPT PresentationTRANSCRIPT

The Performance BottleneckApplication, Computer, or NetworkThe Performance BottleneckApplication, Computer, or Network
Richard Carlson
Internet2
Part 3
Richard Carlson
Internet2
Part 3
OutlineOutline
• Why there is a problem
• What can be done to find/fix problems
• Tools you can use
• Ramblings on what’s next

Active Measurement ToolsActive Measurement Tools
• Tools that inject packets into the network to measure some value• Available Bandwidth• Delay/Jitter• Loss
• Requires bi-directional traffic or synchronized hosts

Passive Measurement ToolsPassive Measurement Tools
• Tools that monitor existing traffic on the network and extract some information• Bandwidth used• Jitter• Loss rate
• May generate some privacy and/or security concerns

Tools, Tools, ToolsTools, Tools, Tools
• Ping• Traceroute• Iperf• Tcpdump• Tcptrace• BWCTL• NDT• OWAMP
• AMP• Advisor• Thrulay• Web100• MonaLisa• pathchar• NPAD• Pathdiag
• Surveyor• Ethereal• CoralReef• MRTG• Skitter• Cflowd• Cricket• Net100

Network Diagnostic Tool (NDT)Network Diagnostic Tool (NDT)
•Measure performance to users desktop
•Identify real problems for real users•Network infrastructure is the problem•Host tuning issues are the problem
•Make tool simple to use and understand
•Make tool useful for users and network administrators

• 10 Mbps NIC• Throughput 6.8/6.7 mbps send/receive • RTT 20 ms• Retransmission/Timeouts 25/3
• 100 Mbps NIC• Throughput 84/86 mbps send/receive• RTT 10 ms • Retransmission/Timeouts 0/0
Different Host, same switch port

Web100 ProjectWeb100 Project
•Joint PSC/NCAR project funded by NSF• ‘First step’ to gather TCP data•Kernel Instrument Set (KIS)
•Developed patches Linux kernel•Geared toward wide area network performance
•Future steps will automate tuning to improve application performance
NDT’s Web100 Based ApproachNDT’s Web100 Based Approach
•Simple bi-directional test to gather E2E data•Gather multiple data variables (a breadth of measurements)
•Compare measured performance to analytical values
•Translate network values into plain text messages
•Geared toward campus area network

SC’04 Real Life ExampleSC’04 Real Life Example
•Booth having trouble getting application to run from Amsterdam to Pittsburgh
•Tests between remote SGI and local PC showed throughput limited to < 20 Mbps
•Assumption is: PC buffers too small
•Question: How do we set WinXP send/receive buffer

SC’04 Determine WinXP infoSC’04 Determine WinXP info
http://www.dslreports.com/drtcp

SC’04 Confirm PC settingsSC’04 Confirm PC settings
•DrTCP reported 16 MB buffers, but test program still slow, Q: How to confirm?
•Run test to SC NDT server (PC has Fast Ethernet Connection)•Client-to-Server: 90 Mbps•Server-to-Client: 95 Mbps•PC Send/Recv Buffer size: 16 Mbytes (wscale 8)•NDT Send/Recv Buffer Size: 8 Mbytes (wscale 7)•Reported TCP RTT: 46.2 msec
• approximately 600 Kbytes of data in TCP buffer
•Min buffer size / RTT: 1.3 Gbps

SC’04 Local PC Configured OKSC’04 Local PC Configured OK
•No problem found
•Able to run at line rate
•Confirmed that PC’s TCP buffers were set correctly
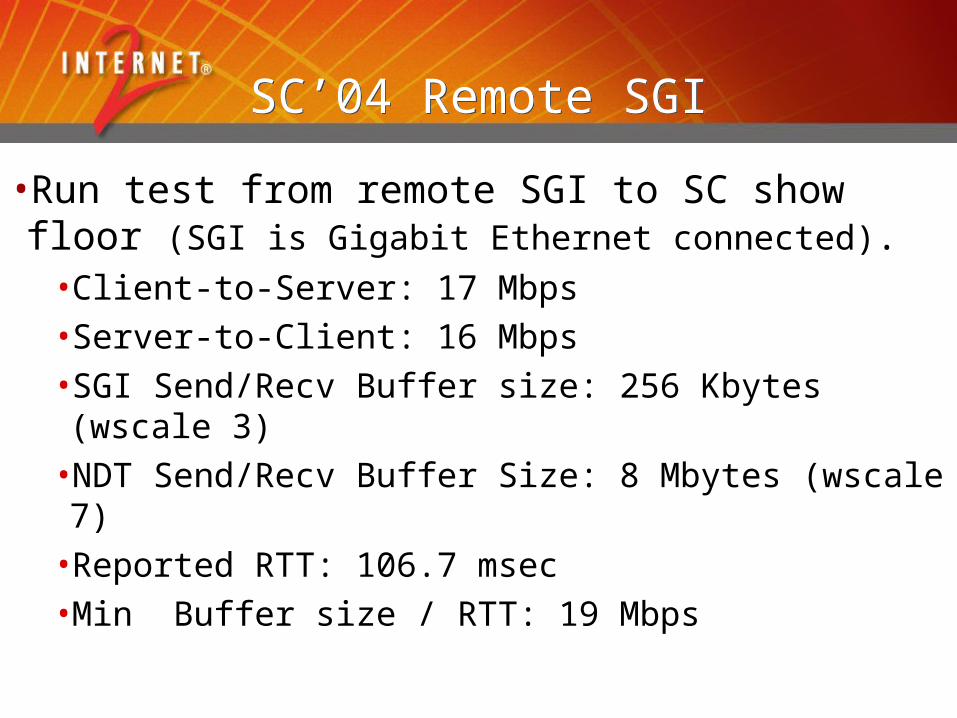
SC’04 Remote SGISC’04 Remote SGI
•Run test from remote SGI to SC show floor (SGI is Gigabit Ethernet connected).•Client-to-Server: 17 Mbps•Server-to-Client: 16 Mbps•SGI Send/Recv Buffer size: 256 Kbytes (wscale 3)•NDT Send/Recv Buffer Size: 8 Mbytes (wscale 7)•Reported RTT: 106.7 msec•Min Buffer size / RTT: 19 Mbps
SC’04 Remote SGI ResultsSC’04 Remote SGI Results
•Needed to download and compile command line client
•SGI TCP buffer is too small to fill transatlantic pipe (19 Mbps max)
•User reluctant to make changes to SGI network interface from SC show floor
•NDT client tool allows application to change buffer (setsockopt() function call)

SC’04 Remote SGI (tuned)SC’04 Remote SGI (tuned)
•Re-run test from remote SGI to SC show floor.•Client-to-Server: 107 Mbps•Server-to-Client: 109 Mbps•SGI Send/Recv Buffer size: 2 Mbytes (wscale 5)•NDT Send/Recv Buffer Size: 8 Mbytes (wscale 7)•Reported RTT: 104 msec•Min Buffer size / RTT: 153.8 Mbps

SC’04 Debugging ResultsSC’04 Debugging Results
•Team spent over 1 hour looking at Win XP config, trying to verify Buffer size
•Single NDT test verified this in under 30 seconds
•10 minutes to download and install NDT client on SGI
•15 minutes to discuss options and run client test with set buffer option
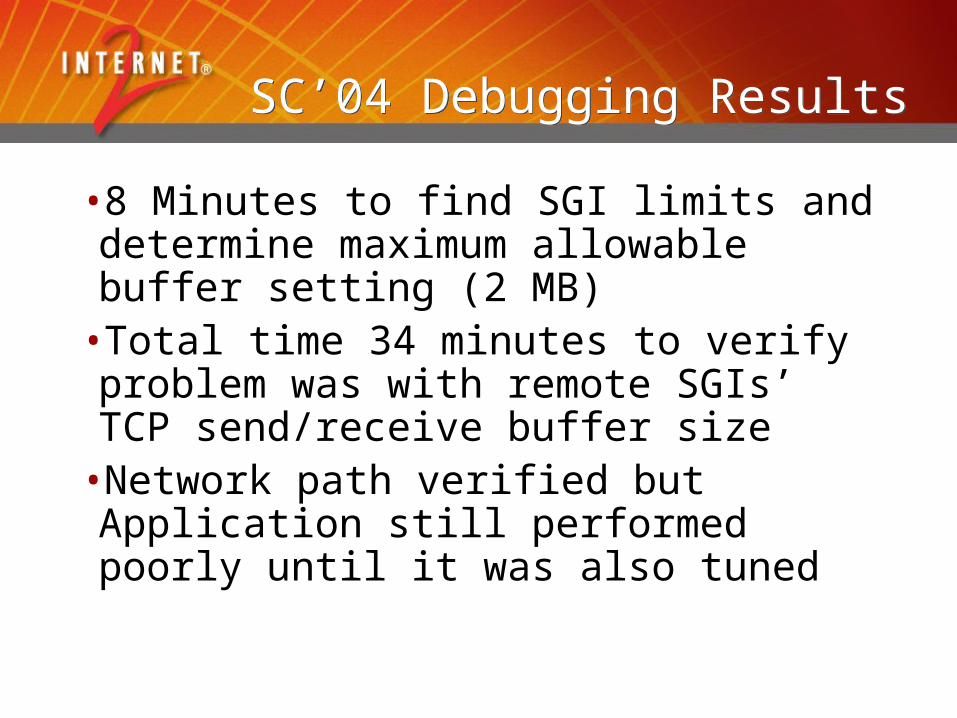
SC’04 Debugging ResultsSC’04 Debugging Results
•8 Minutes to find SGI limits and determine maximum allowable buffer setting (2 MB)
•Total time 34 minutes to verify problem was with remote SGIs’ TCP send/receive buffer size
•Network path verified but Application still performed poorly until it was also tuned

NDT BenefitsNDT Benefits
•End-user based view of network
•Can be used to identify performance bottlenecks (could be host problem)
•Provides some ‘hard evidence’ to users and network administrators to reduce finger pointing
•Doesn’t rely on historical data

Web Based Performance toolWeb Based Performance tool
•Operates on Any client with a Java enabled Web browser
•What it can do•Positively state if Sender, Receiver, or Network is operating properly•Provide accurate application tuning info•Suggest changes to improve performance

Web base Performance toolWeb base Performance tool
•What it can’t do•Tell you where in the network the problem is•Tell you how other servers perform•Tell you how other clients will perform

NDT methodologyNDT methodology
•Identify specific problem(s) that affect end users
•Analyze problem to determine ‘Network Signature’ for this problem
•Provide testing tool to automate detection process

Duplex Mismatch DetectionDuplex Mismatch Detection
•Developing analytical model to describe how network operates (no prior art?)
•Expanding model to describe UDP and TCP flows
•Test models in LAN, MAN, and WAN environments
NIH/NLM grant funding

Test environmentTest environment
•Receiver is put is various states•Switch = full & Host = full or half•Switch = half & Host = full or half
Switch
NDT
Srv
Source
100 Mbps
Full Duplex
NDT
Clt
Receiver
100 MbpsMismatch
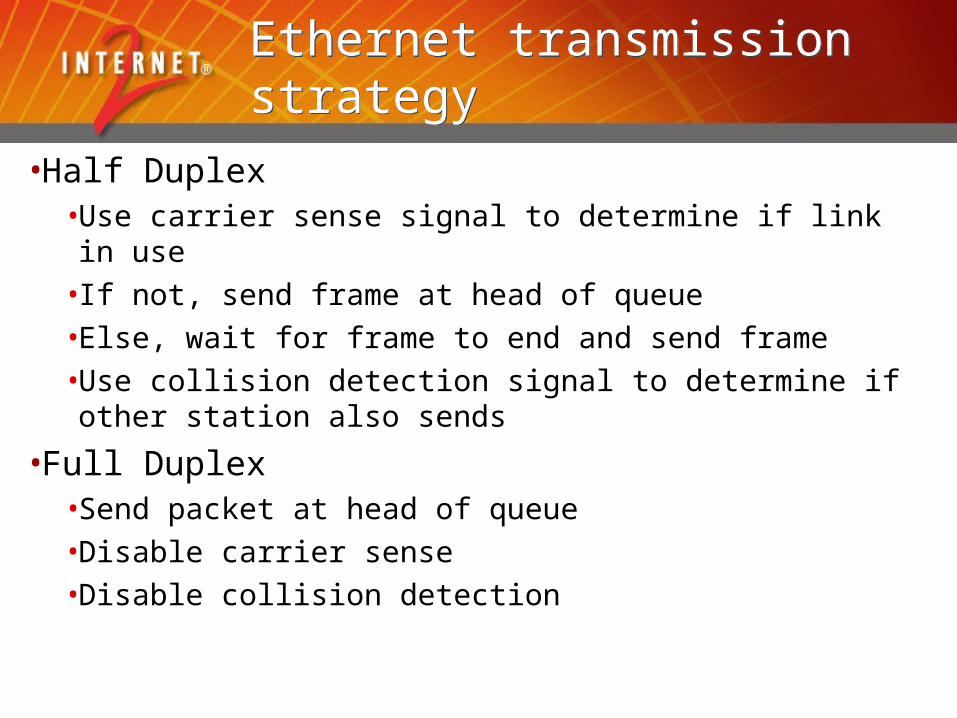
Ethernet transmission strategyEthernet transmission strategy
•Half Duplex•Use carrier sense signal to determine if link in use• If not, send frame at head of queue•Else, wait for frame to end and send frame•Use collision detection signal to determine if other station also sends
•Full Duplex•Send packet at head of queue•Disable carrier sense •Disable collision detection

Analytical Loss-ModelLoss vs Transmission rateAnalytical Loss-ModelLoss vs Transmission rate

Analytical Loss-ModelLow speed loss vs send rateAnalytical Loss-ModelLow speed loss vs send rate

UDP Loss-ModelSender view – normal operationUDP Loss-ModelSender view – normal operation

UDP Loss-ModelSender view – lost data pktsUDP Loss-ModelSender view – lost data pkts

UDP Loss-ModelSender view – lost acksUDP Loss-ModelSender view – lost acks

TCP Operation on LANTCP Operation on LAN
• Observed behavior depends on direction of TCP flow and direction of mismatch• Data and ACK packets delivered• Data packets lost and ACKs delayed• ACKs packets lost and Data delayed
• Losing ACKs has bigger effect than losing Data packets
• Web100 details are only available when NDT server is source and client is sink

Four Cases of Duplex SettingFour Cases of Duplex Setting
FD-FD FD-HD
HD-FD HD-HD

Duplex MismatchSwitch is Full & Host is HalfDuplex MismatchSwitch is Full & Host is Half

Tentative Mismatch DetectionTentative Mismatch Detection
• Full to Half mismatch detection• Large percentage of duplicate ACKs• Connection spends majority of the time in
CwndLimited state• Asymmetric throughput • opposite direction is less

Duplex MismatchSwitch is Half & Host is FullDuplex MismatchSwitch is Half & Host is Full

Tentative Mismatch DetectionTentative Mismatch Detection
• Half to Full mismatch detection• Large number of timeouts causes long idle
time (RTO x timeout value) • Connection spends majority of the time in
CwndLimited state• Asymmetric throughput • opposite direction is greater

Bottleneck Link DetectionBottleneck Link Detection
•What is the slowest link in the end-2-end path?•Monitors packet arrival times using libpacp routine•Use TCP dynamics to create packet pairs•Quantize results into link type bins (no fractional or bonded links)
Cisco URP grant work

Normal congestion detectionNormal congestion detection
•Shared network infrastructures will cause periodic congestion episodes•Detect/report when TCP throughput is limited by cross traffic•Detect/report when TCP throughput is limited by own traffic

Faulty Hardware/Link DetectionFaulty Hardware/Link Detection
•Detect non-congestive loss due to•Faulty NIC/switch interface•Bad Cat-5 cable•Dirty optical connector
•Preliminary works shows that it is possible to distinguish between congestive and non-congestive loss

Full/Half Link Duplex settingFull/Half Link Duplex setting
•Detect half-duplex link in E2E path• Identify when throughput is limited by half-duplex operations
•Preliminary work shows detection possible when link transitions between blocking states

Additional Functions and FeaturesAdditional Functions and Features
•Provide basic tuning information
•Basic Features •Basic configuration file •FIFO scheduling of tests•Simple server discovery protocol•Federation mode support•Command line client support
•Created sourceforge.net project page

Internet2 piPEs ProjectInternet2 piPEs Project
•Develop E2E measurement infrastructure capable of finding network problems
•Tools include•BWCTL: Bandwidth Control wrapper for NLANR Iperf•OWAMP: One-Way Active Measurement•NDT: Network Diagnostic Tool

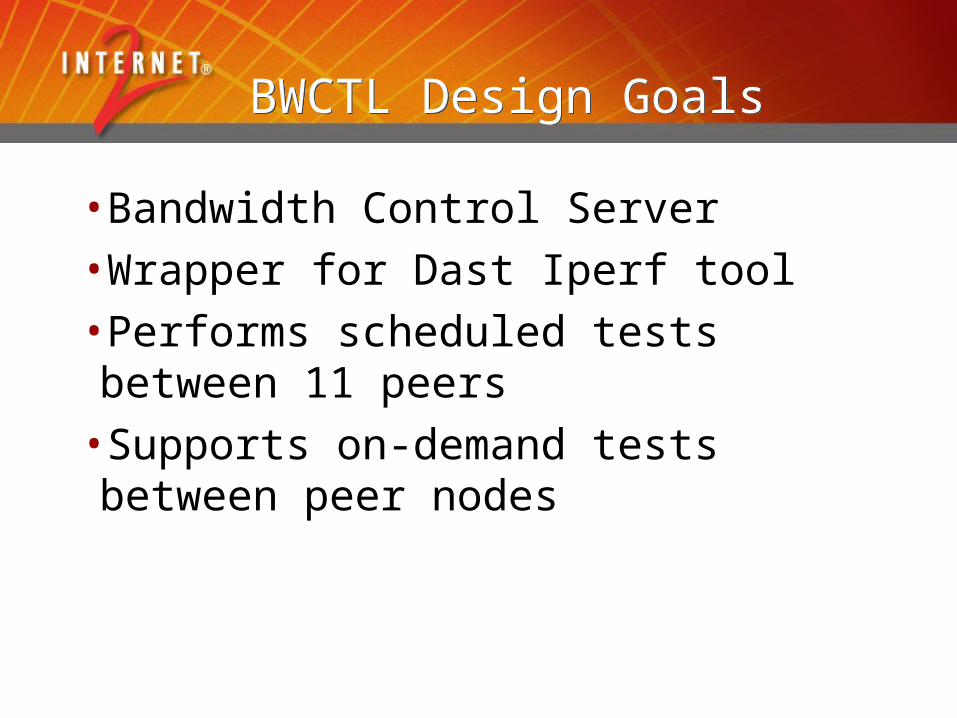
BWCTL Design GoalsBWCTL Design Goals
•Bandwidth Control Server
•Wrapper for Dast Iperf tool
•Performs scheduled tests between 11 peers
•Supports on-demand tests between peer nodes

ArchitectureArchitecture
bwctlclient
Verify Time/Return Results
TestStream
bwctldResource
Broker
bwctldResource
Broker
bwctld
bwctld
iperf
bwctld
bwctld
iperf
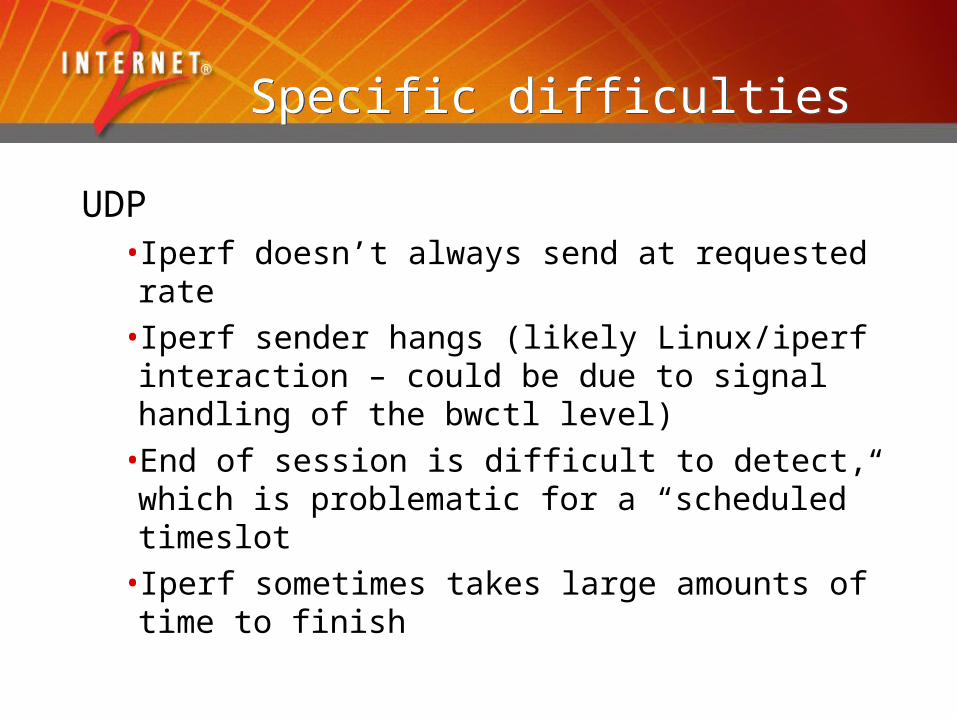
Specific difficultiesSpecific difficulties
UDP• Iperf doesn’t always send at requested rate• Iperf sender hangs (likely Linux/iperf interaction – could be due to signal handling of the bwctl level)
•End of session is difficult to detect, which is problematic for a “scheduled” timeslot
• Iperf sometimes takes large amounts of time to finish

Specific difficultiesSpecific difficulties
TCP•Large pipe to small pipe
• Launch a large window
• Test waits until completion
• Terminate test to remain within scheduleSets of incomplete tests to interpret
•Full mesh presents difficulties for window size selection (and other path specific characteristics)
• bwctl uses the peer to peer server connection to deduce a “reasonable” window
• If at all possible path specific parameters need to be dynamically configured

Future PossibilitiesFuture Possibilities
•Server-less client side for end hosts•Closer integration with test engine (iperf API?)
•Better error detection•Better timing control (begin and end of test is currently a problem)
•3-party tests (client not on one of the endpoints)
•Open source development

AvailabilityAvailability
•Beta version currently available
www.internet2.edu/bwctl/Mail lists:
•bwctl-users
•bwctl-announcehttps://mail.internet2.edu/wws/lists/engineering

OWAMP Design GoalsOWAMP Design Goals
•One-Way-Active-Measurement-Protocol•Possible due to growing availability of good time sources•Wide deployment of “open” servers would allow measurement of one-way delay to become as commonplace as measurement of RTT using ICMP tools such as ping.•Current Draft: draft-ietf-ippm-owdp-07.txt•Shalunov,Teitelbaum,Karp,Boote,Zekauskas•RFC just released
•Sample implementation under developmentAlpha code currently available

Abilene OWAMP deploymentAbilene OWAMP deployment
•2 overlapping full meshes (IPv4 & IPv6)•11 measurement nodes = 220 ongoing tests•UDP singletons•Rate: 10 packets/second*•Packetsize: (32 byte payload)*•Results are continuously streamed back to “Measurement Portal” for long-term archive and data dissemination (Near real-time)

OWAMP ErrorsOWAMP Errors
•Preliminary Findings:•Min error estimates look to be in the 55-60 usec range.•Serialization Delay: ~5usec x 2•Get Timestamp: ~15usec x 2•Additional error is:• Time from userland “send” to 1st byte hits the wire• Time from kernel has packet to userland “recv” returns•Potentially recv process data processing before calling “recv”

OWAMP implementation statusOWAMP implementation status
•Sample implementation
•http://e2epi.internet2.edu/owamp/
•Alpha Release ver 1.6c:•No “policy”•No authentication/encryption• Tested on FreeBSD & Linux

Sample Traceroute Tree mapSample Traceroute Tree map
R6 R7
R5
R4R3
R2R1S2 S3
S7 S8
S1
S6
S5S4

Sample Traceroute from S1 to ClientSample Traceroute from S1 to Client
R5
R4
R1
S1
Rc
Rb
Ra
Client
Traceroute to Client

Sample Traceroute Tree mapSample Traceroute Tree map
R6 R7
R5
R4R3
R2R1S2 S3
S7
S8
S1
S6
S5S4 R5
R4
R1
S1
Rc
Rb
Ra
Client
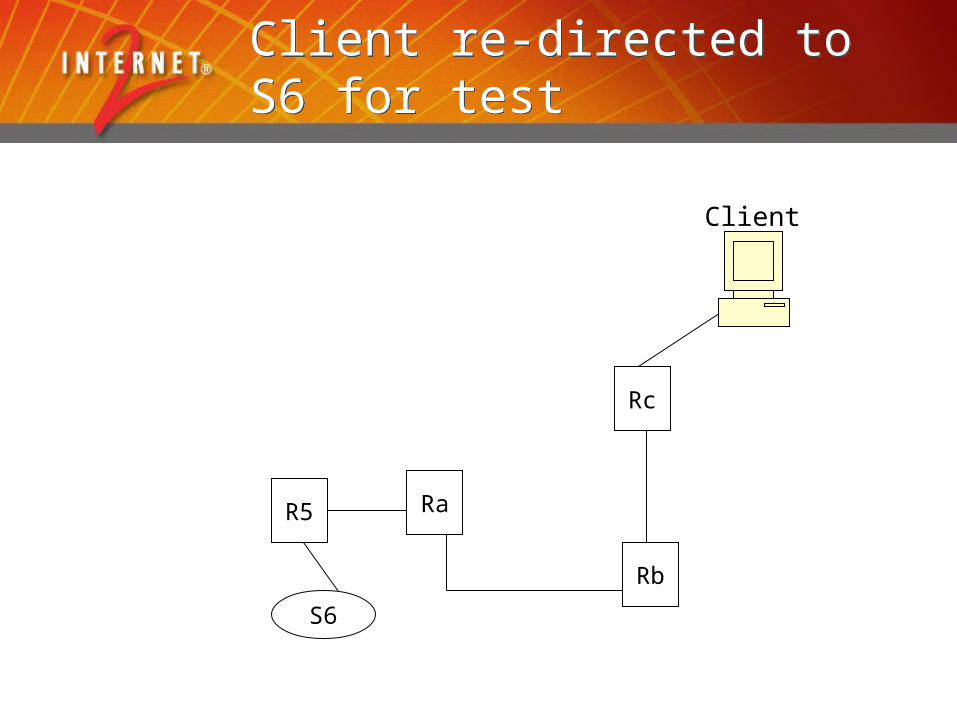
Client re-directed to S6 for testClient re-directed to S6 for test
Rc
Rb
Ra
Client
R5
S6