the performance and risk of apollo food holdings berhad · the performance and risk of apollo food...
TRANSCRIPT
MPRAMunich Personal RePEc Archive
The Performance and Risk of ApolloFood Holdings Berhad
Hwee Yin Wong
University Utara Malaysia
16 April 2017
Online at https://mpra.ub.uni-muenchen.de/78338/MPRA Paper No. 78338, posted 19 April 2017 11:02 UTC
The Performance And Risk Of Apollo Food Holdings Berhad
Wong Hwee Yin
Abstract
The aim of the study is to examine the overall performance of Apollo Food Holdings
Berhad with specific risk factors and macroeconomic factor on profitability
performance. The study uses Statistical Package for the Social Sciences (SPSS) to
develop the ordinary least square relationship between profit and risk. The data is
obtained from the annual report of Apollo Food Holdings Berhad from 2011 to 2015.
The liquidity ratio and operating ratio are used to measure the overall performance of
Apollo Food Holdings Berhad in 5 years. To see the relationship of risks factors to the
profitability, this paper is utilizing liquidity, GDP and operating ratio. Data was
analysed by utilizing regression and bivariate correlation. The regression analysis and
bivariate correlation shows only one factor of profitability is significant to operating
ratio which is ROA with the highest impact to the profitability. However, the liquidity
and GDP is not significant to profitability with low impact to the profitability.
Keywords: Liquidity Risk, Operational Risk, Profitability, GDP
1
1.0 Introduction
Malaysia has an increases number of middle upper income population and has a
strong GDP forecasts with food and beverage sales expected to grow. Malaysia has
ambitions to be the main halal hub in the world. Therefore, Government of Malaysia
is planning to build up its food processing industry, especifically halal food products,
which have the potential to expand into international markets. According to the New
Zealand Trade and Enterprise, Malaysia has a packaged food industry worth USD$5.5
billion in 2011 which is led by dried processed food, dairy and bakery and grow to
USD $5.9 billion by 2016. The high volume of Malaysia’s import are food ingredients
rather than the packed product as Malaysia has its own processed foods and drinks
industry for the local and international market. Retail market of Malaysia food and
beverage is expected to grow by 10 percent per annum with Malaysian household
spending almost a quarter on food and beverage of their income.
1.1 Company Background
Apollo Food Holdings Berhad is a holding company, which is engaged in the
management services provision to subsidiaries. It operates in two segments:
Investment holding, and manufacturing, marketing and distribution, which is engaged
in manufacturing, marketing and distributing in compound chocolates, products of
chocolate confectionery and cakes. It offers products in two categories: Chocolate
Wafer products, and Layer cake, Chocolate Layer Cake and Swiss roll products. It
distributes its products in Malaysia and other overseas market. Its subsidiaries include
Apollo Food Industries (M) Sdn. Bhd., which is engaged in manufacture and trading
in compound chocolates, chocolate confectionery products and cakes, and Hap Huat
Food Industries Sdn. Bhd., which is an investment holding company.
2
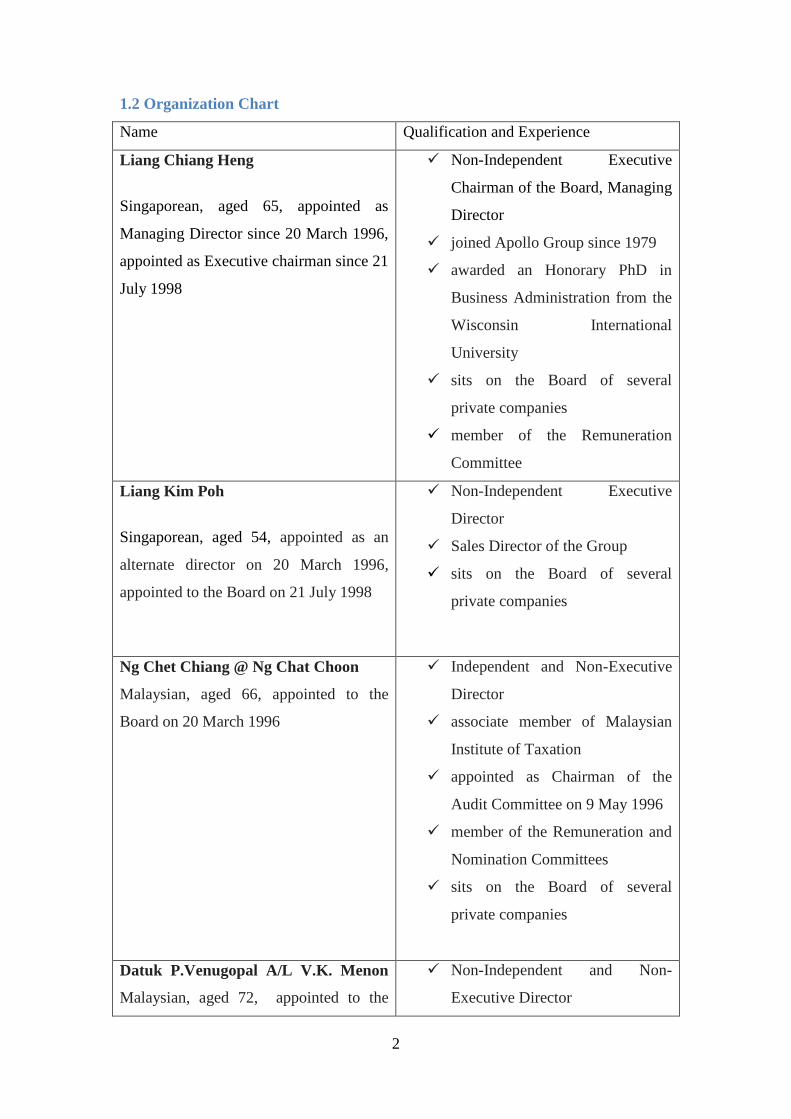
1.2 Organization Chart
Name Qualification and Experience
Liang Chiang Heng
Singaporean, aged 65, appointed as
Managing Director since 20 March 1996,
appointed as Executive chairman since 21
July 1998
Non-Independent Executive
Chairman of the Board, Managing
Director
joined Apollo Group since 1979
awarded an Honorary PhD in
Business Administration from the
Wisconsin International
University
sits on the Board of several
private companies
member of the Remuneration
Committee
Liang Kim Poh
Singaporean, aged 54, appointed as an
alternate director on 20 March 1996,
appointed to the Board on 21 July 1998
Non-Independent Executive
Director
Sales Director of the Group
sits on the Board of several
private companies
Ng Chet Chiang @ Ng Chat Choon
Malaysian, aged 66, appointed to the
Board on 20 March 1996
Independent and Non-Executive
Director
associate member of Malaysian
Institute of Taxation
appointed as Chairman of the
Audit Committee on 9 May 1996
member of the Remuneration and
Nomination Committees
sits on the Board of several
private companies
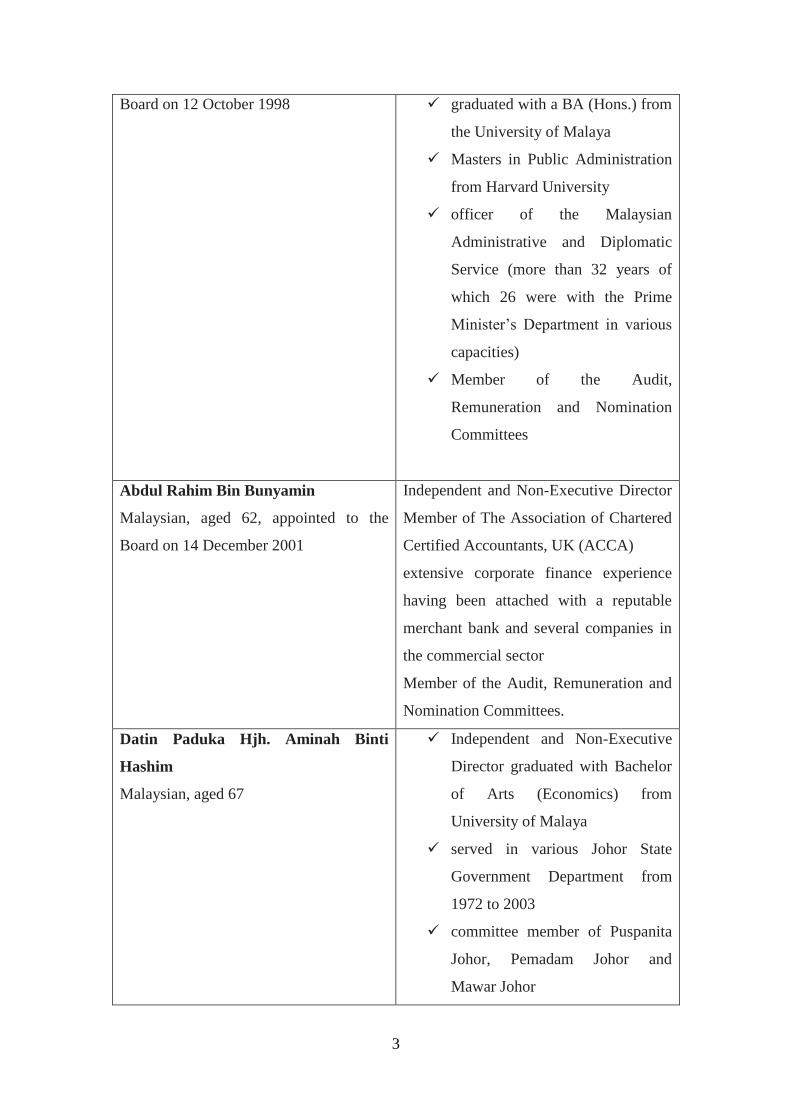
Datuk P.Venugopal A/L V.K. Menon
Malaysian, aged 72, appointed to the
Non-Independent and Non-
Executive Director
3
Board on 12 October 1998
graduated with a BA (Hons.) from
the University of Malaya
Masters in Public Administration
from Harvard University
officer of the Malaysian
Administrative and Diplomatic
Service (more than 32 years of
which 26 were with the Prime
Minister’s Department in various
capacities)
Member of the Audit,
Remuneration and Nomination
Committees
Abdul Rahim Bin Bunyamin
Malaysian, aged 62, appointed to the
Board on 14 December 2001
Independent and Non-Executive Director
Member of The Association of Chartered
Certified Accountants, UK (ACCA)
extensive corporate finance experience
having been attached with a reputable
merchant bank and several companies in
the commercial sector
Member of the Audit, Remuneration and
Nomination Committees.
Datin Paduka Hjh. Aminah Binti
Hashim
Malaysian, aged 67
Independent and Non-Executive
Director graduated with Bachelor
of Arts (Economics) from
University of Malaya
served in various Johor State
Government Department from
1972 to 2003
committee member of Puspanita
Johor, Pemadam Johor and
Mawar Johor
4
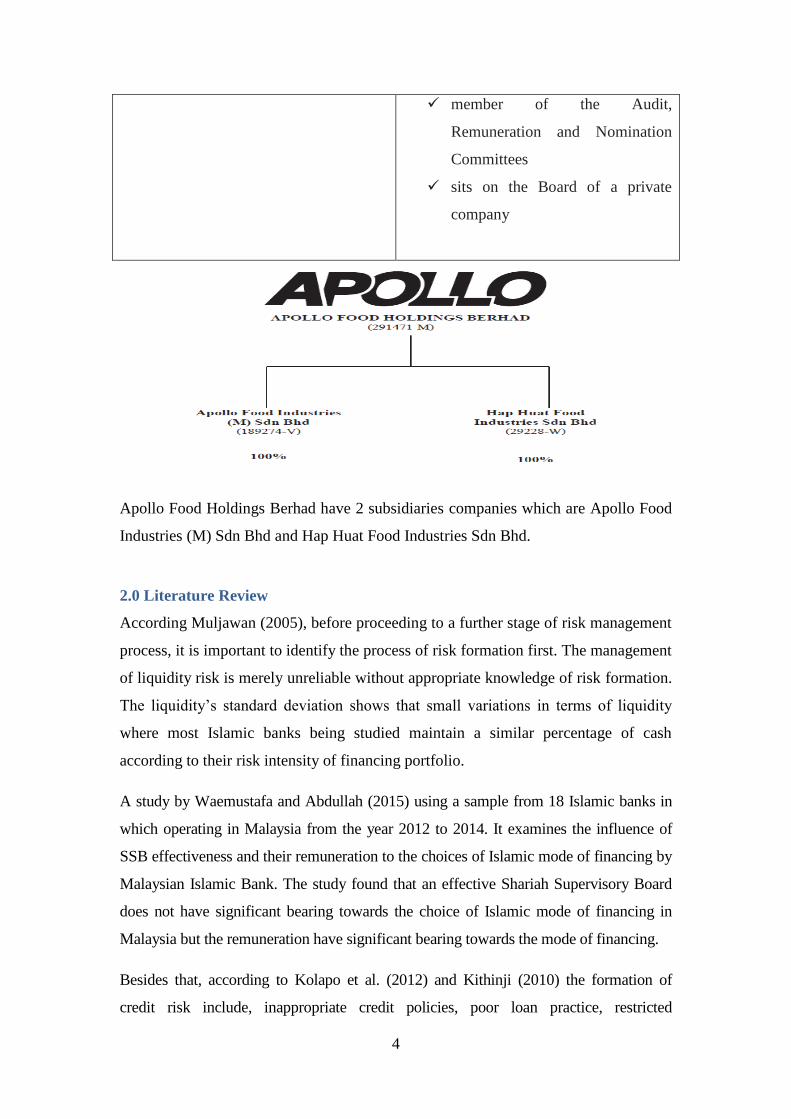
member of the Audit,
Remuneration and Nomination
Committees
sits on the Board of a private
company
Apollo Food Holdings Berhad have 2 subsidiaries companies which are Apollo Food
Industries (M) Sdn Bhd and Hap Huat Food Industries Sdn Bhd.
2.0 Literature Review
According Muljawan (2005), before proceeding to a further stage of risk management
process, it is important to identify the process of risk formation first. The management
of liquidity risk is merely unreliable without appropriate knowledge of risk formation.
The liquidity’s standard deviation shows that small variations in terms of liquidity
where most Islamic banks being studied maintain a similar percentage of cash
according to their risk intensity of financing portfolio.
A study by Waemustafa and Abdullah (2015) using a sample from 18 Islamic banks in
which operating in Malaysia from the year 2012 to 2014. It examines the influence of
SSB effectiveness and their remuneration to the choices of Islamic mode of financing by
Malaysian Islamic Bank. The study found that an effective Shariah Supervisory Board
does not have significant bearing towards the choice of Islamic mode of financing in
Malaysia but the remuneration have significant bearing towards the mode of financing.
Besides that, according to Kolapo et al. (2012) and Kithinji (2010) the formation of
credit risk include, inappropriate credit policies, poor loan practice, restricted
5
institutional capacity, unstable interest rate, poor management, inappropriate laws, direct
lending, massive licensing of banks, low capital and liquidity risk, laxity in credit
assessment, poor loan underwriting, poor lending practice, insufficient supervision by
central banks, government interference and insufficient knowledge about borrowers.
Ali (2004) found that liquidity contributes to number of failure in banks in spite of
having entry to external liquidity. In this way, understanding the nature of liquidity
and its impact on credit risk is important to derive for empirical proof of interaction
between liquidity and credit risk. Different studies of Demirguc-Kunt and Huizinga
(2010) found that the high fee income is related with high inflation that influence
banks’ assets allocation decision into interest generating activities, fee generating and
profitability by considering macroeconomic impacts.
Castro (2013) opined that by reducing the real value of outstanding loans, high
inflation can make debt servicing easier. Yet, in the meantime, it can deliberate
borrowers’ capacity to service debt by reducing real income. The finding of this study
backs Shu (2002) who think that acceleration in credit expansion will bring down
default rate as higher inflation prevail due to the fact that inflation enable borrowers to
service their loan from the availability of funds. The finding of this study shows that
conventional risk taking behavior is negatively influenced by level of liquidity, the
higher the liquidity the lower credit risk exposure.
According to Solomon (2012), risk and return are two interdependent aspects in the
company’s activity. Return can only be assessed but on the basis of supported risk.
Consequently, profitability is subject to the general condition of risk where the
organization operates. Impact of various factors (market, competition, time factor,
inflation, exchange rates, interest, commissions, human factors and not least the
company culture) often makes financial decision become a decision under risk.
Besides that, between economic profitability and financial return there is a tight
correlation.
According to Arditti (1967) the risk variables can be divided into two categories: (a)
those that are directly associated with the probability distribution of returns of a
company's stock, such as the second and third moments of the distribution and the
coefficient of correlation between the returns from a single stock and all other
6
available stocks; and (b) those variables which are intertwined with the company's
financial policies-the dividend-earnings and the debt-equity ratios. Under the
assumption that the stock market received what it expected over the 1946-1963 period,
the actual return for each stock in the Standard & Poor's Composite Index (industrials,
railroads, and utilities) is used as a measure of the required return and regressed on
the afore- mentioned risk variables. The regressions involving the dividend-earnings
ratio show that it is negatively and significantly related to the required return.
Investors like high dividend-payouts. A negative sign of the debt/equity coefficient
is that some other risk variables which are positively correlated with the required
return but negatively correlated with the debt- equity ratio have been omitted.
3.0 Descriptive Analysis
3.1 Trend Analysis
3.1.1 Liquidity Performance
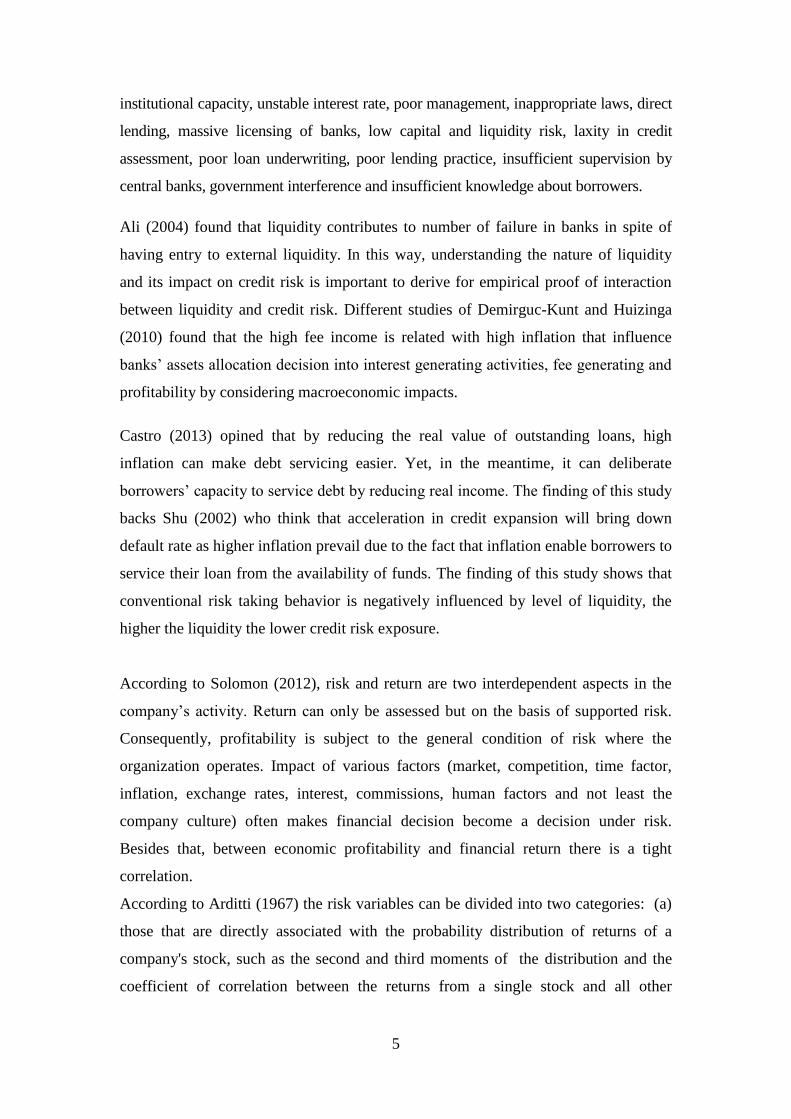
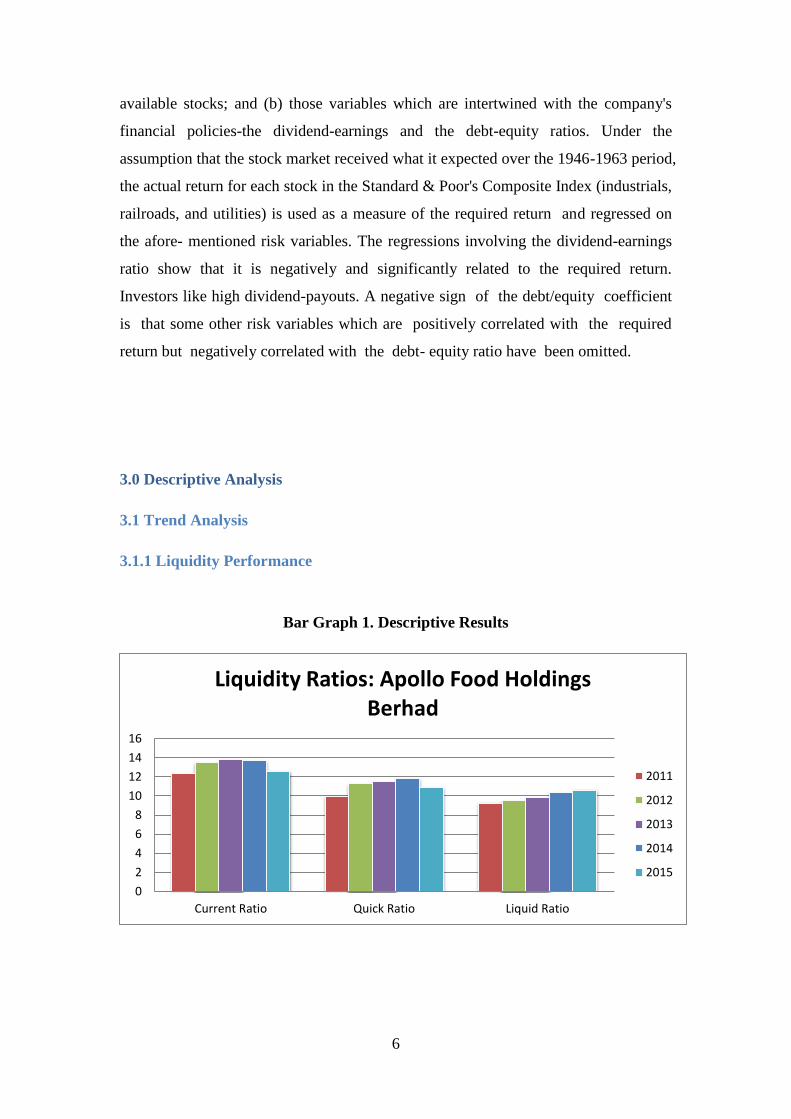
Bar Graph 1. Descriptive Results
0
2
4
6
8
10
12
14
16
Current Ratio Quick Ratio Liquid Ratio
Liquidity Ratios: Apollo Food Holdings Berhad
2011
2012
2013
2014
2015
7
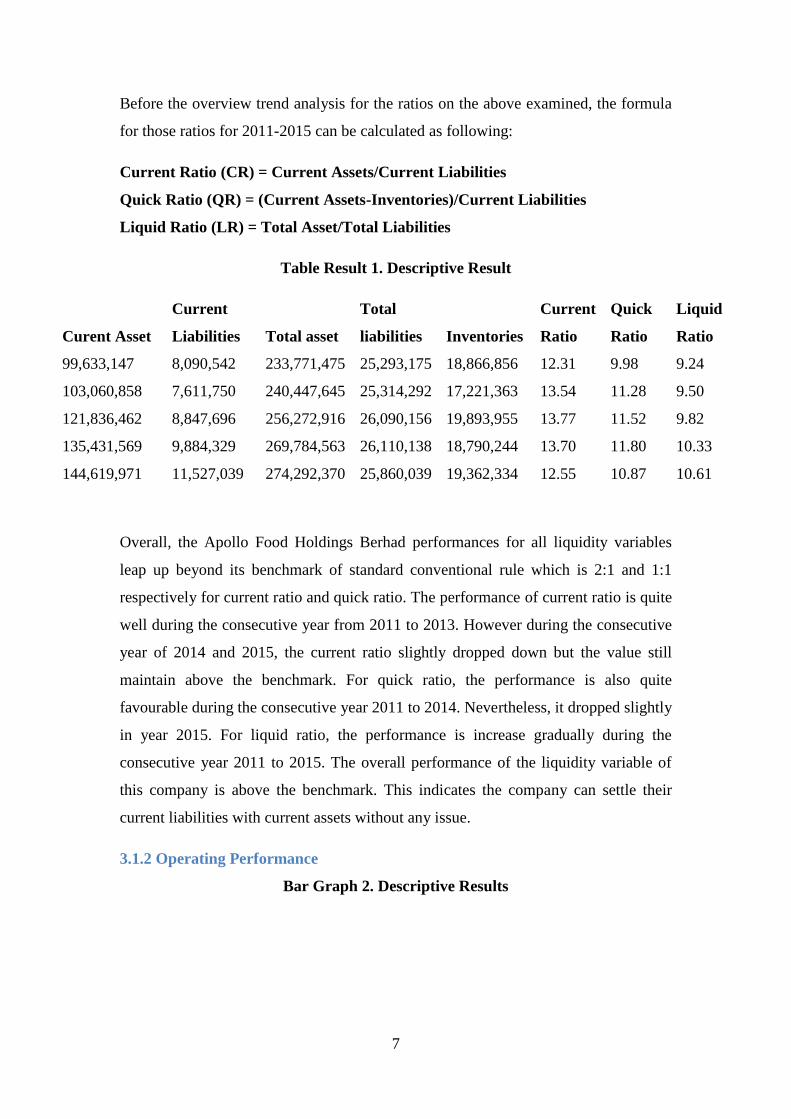
Before the overview trend analysis for the ratios on the above examined, the formula
for those ratios for 2011-2015 can be calculated as following:
Current Ratio (CR) = Current Assets/Current Liabilities
Quick Ratio (QR) = (Current Assets-Inventories)/Current Liabilities
Liquid Ratio (LR) = Total Asset/Total Liabilities
Table Result 1. Descriptive Result
Curent Asset
Current
Liabilities Total asset
Total
liabilities Inventories
Current
Ratio
Quick
Ratio
Liquid
Ratio
99,633,147 8,090,542 233,771,475 25,293,175 18,866,856 12.31 9.98 9.24
103,060,858 7,611,750 240,447,645 25,314,292 17,221,363 13.54 11.28 9.50
121,836,462 8,847,696 256,272,916 26,090,156 19,893,955 13.77 11.52 9.82
135,431,569 9,884,329 269,784,563 26,110,138 18,790,244 13.70 11.80 10.33
144,619,971 11,527,039 274,292,370 25,860,039 19,362,334 12.55 10.87 10.61
Overall, the Apollo Food Holdings Berhad performances for all liquidity variables
leap up beyond its benchmark of standard conventional rule which is 2:1 and 1:1
respectively for current ratio and quick ratio. The performance of current ratio is quite
well during the consecutive year from 2011 to 2013. However during the consecutive
year of 2014 and 2015, the current ratio slightly dropped down but the value still
maintain above the benchmark. For quick ratio, the performance is also quite
favourable during the consecutive year 2011 to 2014. Nevertheless, it dropped slightly
in year 2015. For liquid ratio, the performance is increase gradually during the
consecutive year 2011 to 2015. The overall performance of the liquidity variable of
this company is above the benchmark. This indicates the company can settle their
current liabilities with current assets without any issue.
3.1.2 Operating Performance
Bar Graph 2. Descriptive Results
8
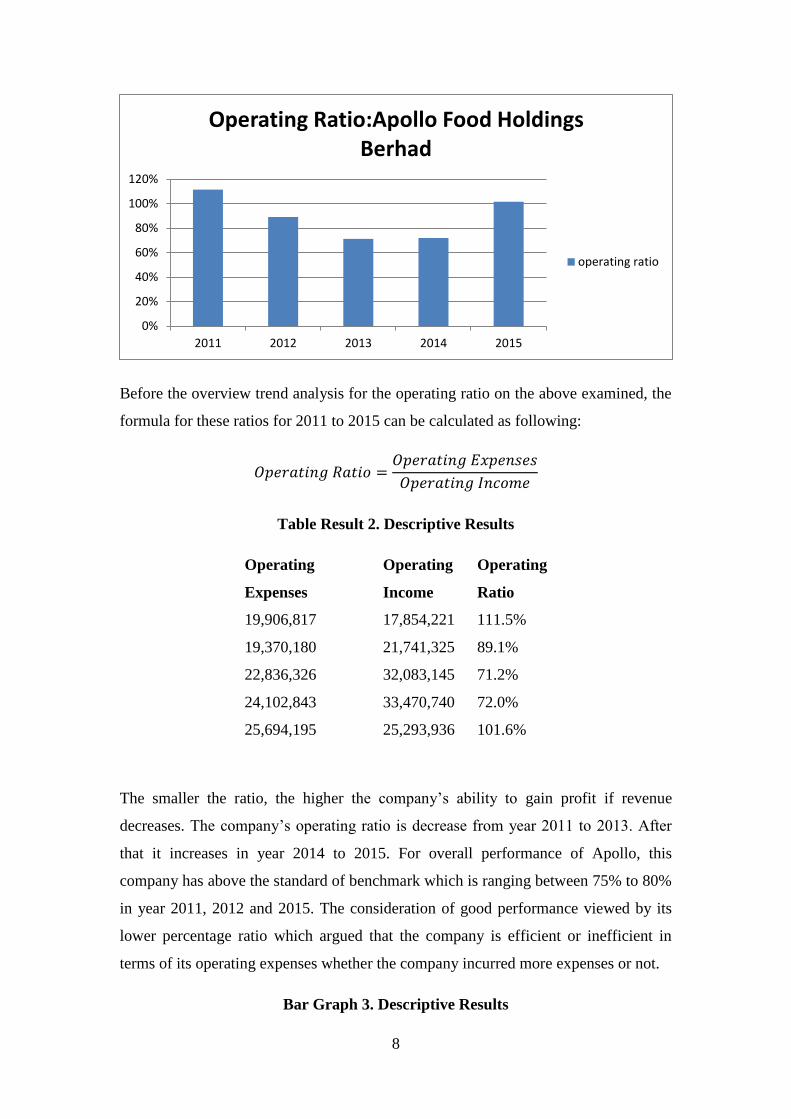
Before the overview trend analysis for the operating ratio on the above examined, the
formula for these ratios for 2011 to 2015 can be calculated as following:
Table Result 2. Descriptive Results
Operating
Expenses
Operating
Income
Operating
Ratio
19,906,817 17,854,221 111.5%
19,370,180 21,741,325 89.1%
22,836,326 32,083,145 71.2%
24,102,843 33,470,740 72.0%
25,694,195 25,293,936 101.6%
The smaller the ratio, the higher the company’s ability to gain profit if revenue
decreases. The company’s operating ratio is decrease from year 2011 to 2013. After
that it increases in year 2014 to 2015. For overall performance of Apollo, this
company has above the standard of benchmark which is ranging between 75% to 80%
in year 2011, 2012 and 2015. The consideration of good performance viewed by its
lower percentage ratio which argued that the company is efficient or inefficient in
terms of its operating expenses whether the company incurred more expenses or not.
Bar Graph 3. Descriptive Results
0%
20%
40%
60%
80%
100%
120%
2011 2012 2013 2014 2015
Operating Ratio:Apollo Food Holdings Berhad
operating ratio
9
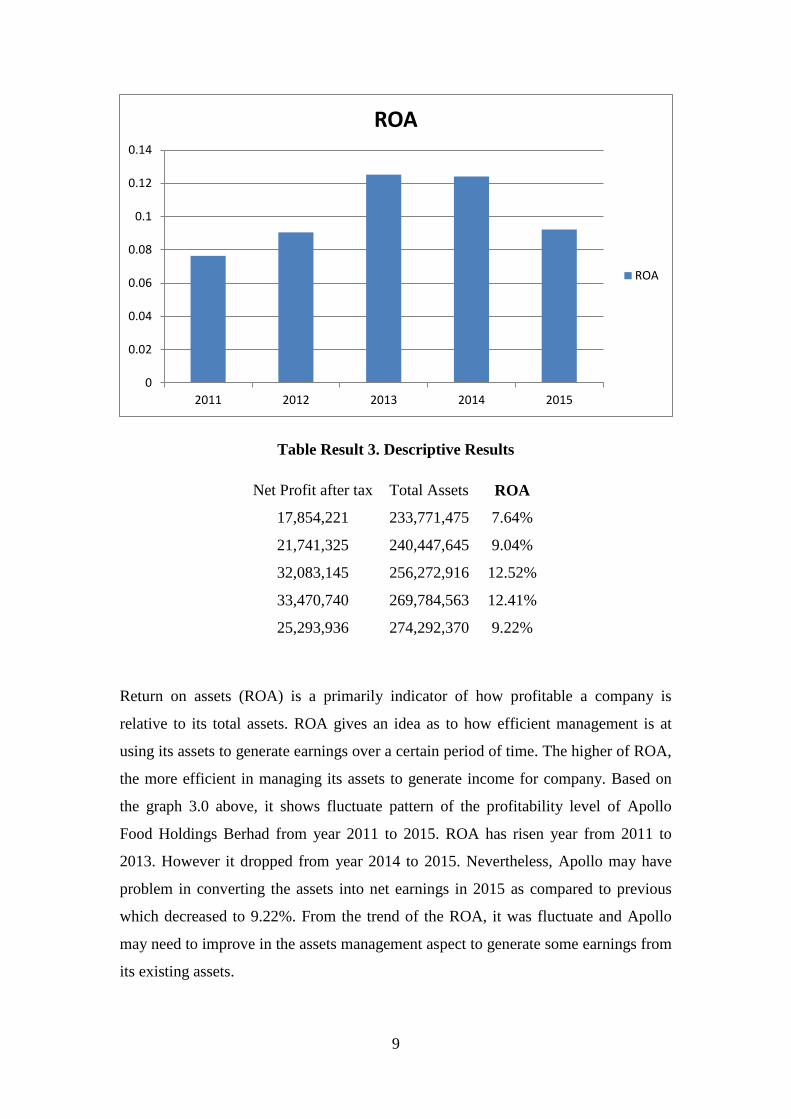
Table Result 3. Descriptive Results
Net Profit after tax Total Assets ROA
17,854,221 233,771,475 7.64%
21,741,325 240,447,645 9.04%
32,083,145 256,272,916 12.52%
33,470,740 269,784,563 12.41%
25,293,936 274,292,370 9.22%
Return on assets (ROA) is a primarily indicator of how profitable a company is
relative to its total assets. ROA gives an idea as to how efficient management is at
using its assets to generate earnings over a certain period of time. The higher of ROA,
the more efficient in managing its assets to generate income for company. Based on
the graph 3.0 above, it shows fluctuate pattern of the profitability level of Apollo
Food Holdings Berhad from year 2011 to 2015. ROA has risen year from 2011 to
2013. However it dropped from year 2014 to 2015. Nevertheless, Apollo may have
problem in converting the assets into net earnings in 2015 as compared to previous
which decreased to 9.22%. From the trend of the ROA, it was fluctuate and Apollo
may need to improve in the assets management aspect to generate some earnings from
its existing assets.
0
0.02
0.04
0.06
0.08
0.1
0.12
0.14
2011 2012 2013 2014 2015
ROA
ROA
10
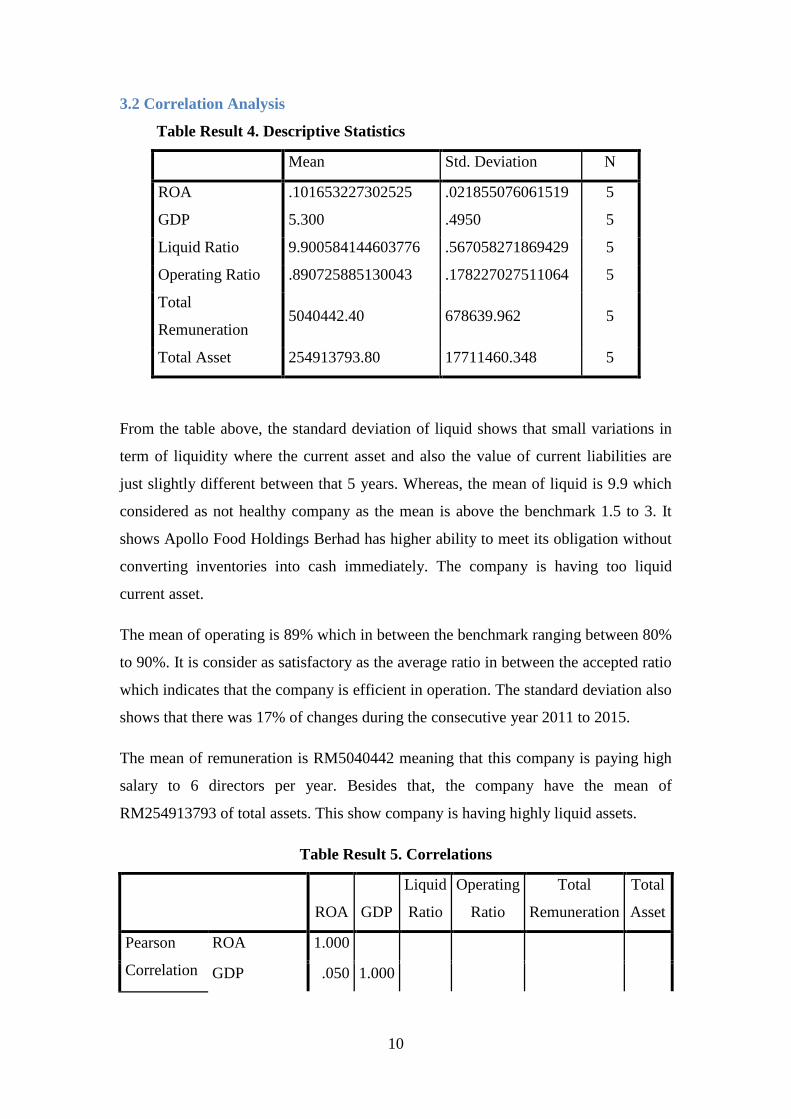
3.2 Correlation Analysis
Table Result 4. Descriptive Statistics
Mean Std. Deviation N
ROA .101653227302525 .021855076061519 5
GDP 5.300 .4950 5
Liquid Ratio 9.900584144603776 .567058271869429 5
Operating Ratio .890725885130043 .178227027511064 5
Total
Remuneration 5040442.40 678639.962 5
Total Asset 254913793.80 17711460.348 5
From the table above, the standard deviation of liquid shows that small variations in
term of liquidity where the current asset and also the value of current liabilities are
just slightly different between that 5 years. Whereas, the mean of liquid is 9.9 which
considered as not healthy company as the mean is above the benchmark 1.5 to 3. It
shows Apollo Food Holdings Berhad has higher ability to meet its obligation without
converting inventories into cash immediately. The company is having too liquid
current asset.
The mean of operating is 89% which in between the benchmark ranging between 80%
to 90%. It is consider as satisfactory as the average ratio in between the accepted ratio
which indicates that the company is efficient in operation. The standard deviation also
shows that there was 17% of changes during the consecutive year 2011 to 2015.
The mean of remuneration is RM5040442 meaning that this company is paying high
salary to 6 directors per year. Besides that, the company have the mean of
RM254913793 of total assets. This show company is having highly liquid assets.
Table Result 5. Correlations
ROA GDP
Liquid
Ratio
Operating
Ratio
Total
Remuneration
Total
Asset
Pearson
Correlation
ROA 1.000
GDP .050 1.000
11
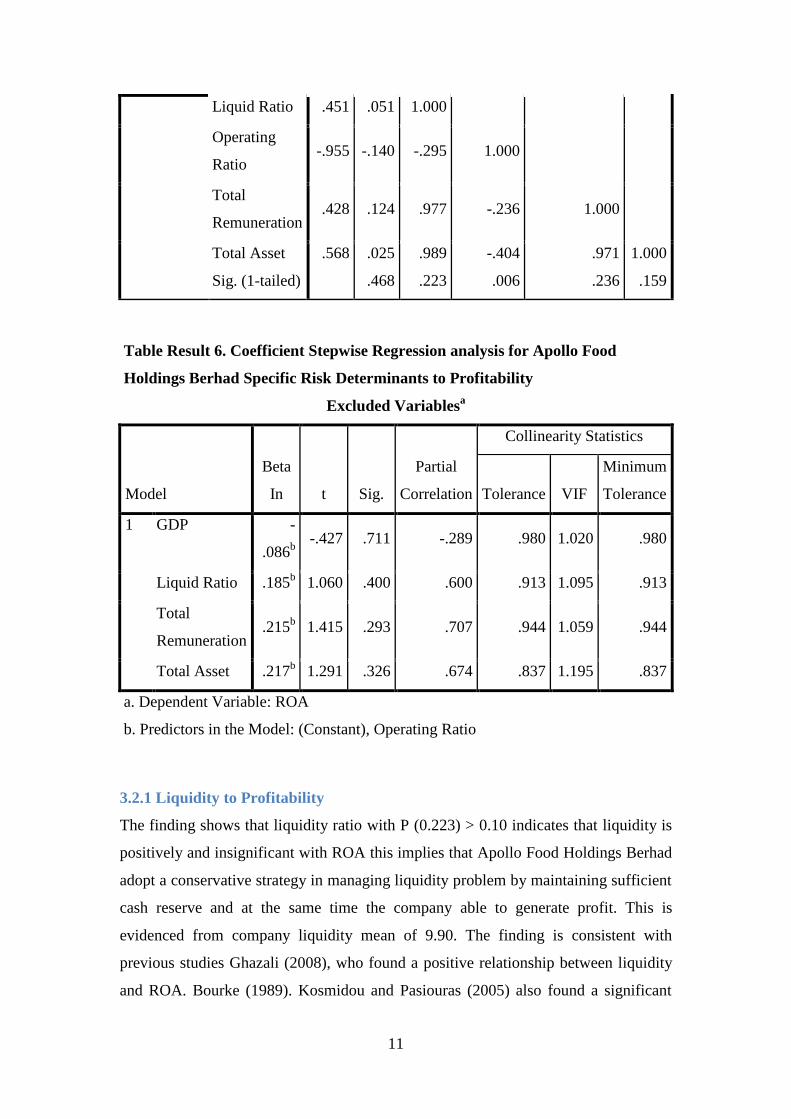
Liquid Ratio .451 .051 1.000
Operating
Ratio -.955 -.140 -.295 1.000
Total
Remuneration .428 .124 .977 -.236 1.000
Total Asset
Sig. (1-tailed)
.568
.025
.468
.989
.223
-.404
.006
.971
.236
1.000
.159
Table Result 6. Coefficient Stepwise Regression analysis for Apollo Food
Holdings Berhad Specific Risk Determinants to Profitability
Excluded Variablesa
Model
Beta
In t Sig.
Partial
Correlation
Collinearity Statistics
Tolerance VIF
Minimum
Tolerance
1 GDP -
.086b
-.427 .711 -.289 .980 1.020 .980
Liquid Ratio .185b 1.060 .400 .600 .913 1.095 .913
Total
Remuneration .215
b 1.415 .293 .707 .944 1.059 .944
Total Asset .217b 1.291 .326 .674 .837 1.195 .837
a. Dependent Variable: ROA
b. Predictors in the Model: (Constant), Operating Ratio
3.2.1 Liquidity to Profitability
The finding shows that liquidity ratio with P (0.223) > 0.10 indicates that liquidity is
positively and insignificant with ROA this implies that Apollo Food Holdings Berhad
adopt a conservative strategy in managing liquidity problem by maintaining sufficient
cash reserve and at the same time the company able to generate profit. This is
evidenced from company liquidity mean of 9.90. The finding is consistent with
previous studies Ghazali (2008), who found a positive relationship between liquidity
and ROA. Bourke (1989). Kosmidou and Pasiouras (2005) also found a significant
12
positive relationship between Liquidity and ROA. The higher liquidity ratio of
company can also be due to the fact that higher equity and trade financing to maintain
a greater amount of cash to maintain their liquidity position. The increase in inflation
has negative relationship with the profitability.
3.2.2 Firm Size to Profitability
Firm size is measured by total assets with P (0.159) > alpha (0.10) indicates that firm
assets have insignificant relation to profitability in all respective variables of the
measurement. Positive insignificant implies that even though the firm are less
productive but can lead to a firm on more profitability which depends on the firm
entity.
3.2.3 GDP to Profitability
As a part of macroeconomic factor, the GDP variable tested with P (0.468) > alpha
(0.10) indicates insignificant relation to profitability. Profitability shows positive
insignificant relation that indicates the grow in GDP will accelerate the overall
profitability. This implies that the economic growth will increase the demand for
Apollo food products. This could generate more income received which eventually it
boosts profitability. Although, the GDP grow boost profitability with more demand,
the competition from the competitor in the same industry frustrate the food and
beverage profitability since there is lacking of competitive advantage of this company.
Moreover, the impact of GDP to profitability is relatively high with the t value -0.427
compared to liquidity.
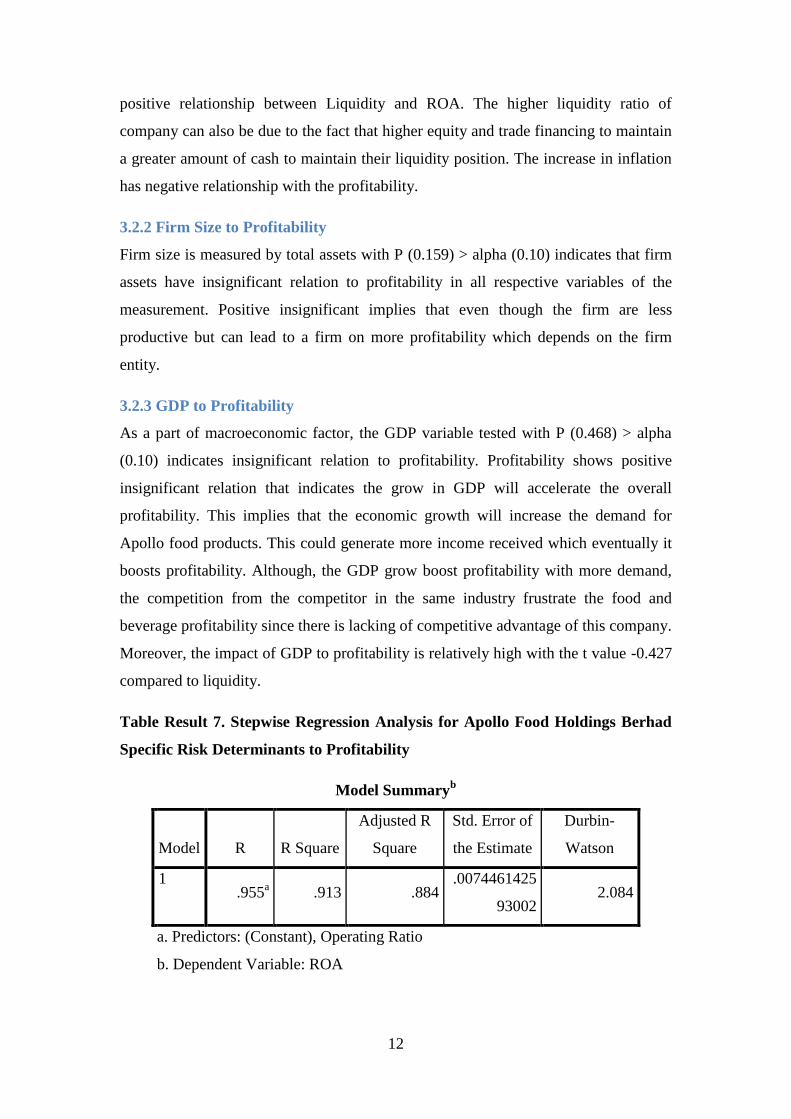
Table Result 7. Stepwise Regression Analysis for Apollo Food Holdings Berhad
Specific Risk Determinants to Profitability
Model Summaryb
Model R R Square
Adjusted R
Square
Std. Error of
the Estimate
Durbin-
Watson
1 .955
a .913 .884
.0074461425
93002 2.084
a. Predictors: (Constant), Operating Ratio
b. Dependent Variable: ROA
13
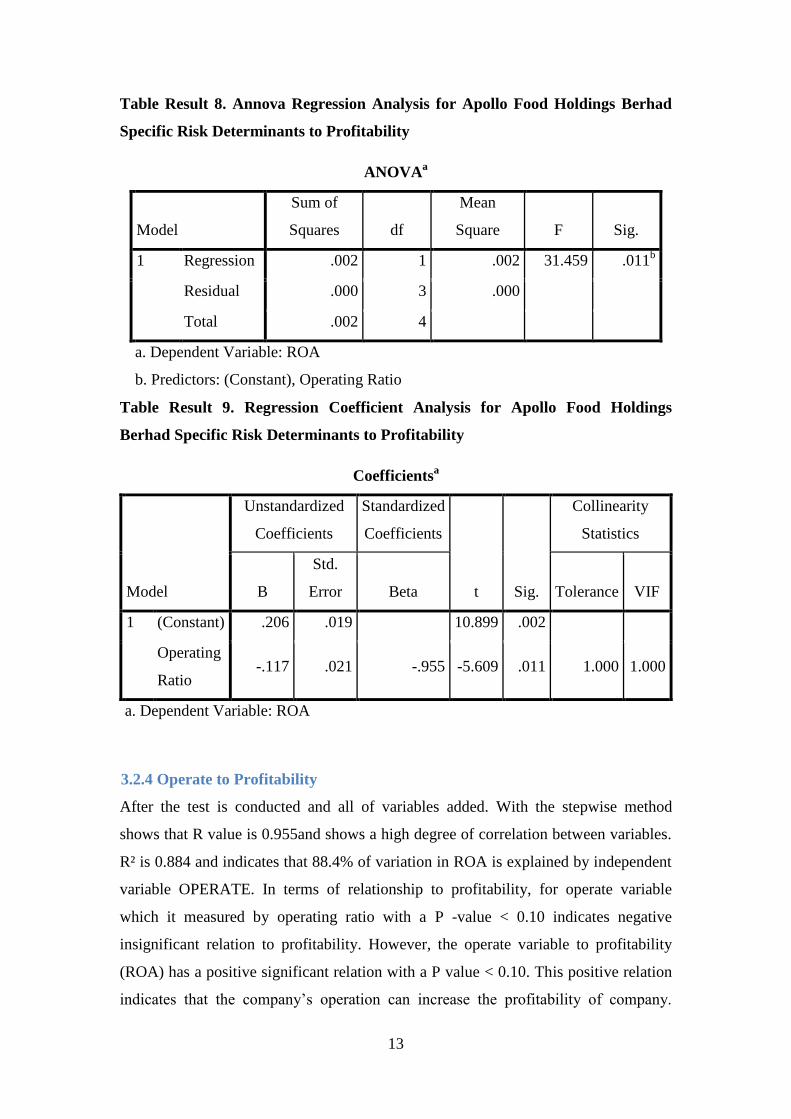
Table Result 8. Annova Regression Analysis for Apollo Food Holdings Berhad
Specific Risk Determinants to Profitability
ANOVAa
Model
Sum of
Squares df
Mean
Square F Sig.
1 Regression .002 1 .002 31.459 .011b
Residual .000 3 .000
Total .002 4
a. Dependent Variable: ROA
b. Predictors: (Constant), Operating Ratio
Table Result 9. Regression Coefficient Analysis for Apollo Food Holdings
Berhad Specific Risk Determinants to Profitability
Coefficientsa
Model
Unstandardized
Coefficients
Standardized
Coefficients
t Sig.
Collinearity
Statistics
B
Std.
Error Beta Tolerance VIF
1 (Constant) .206 .019 10.899 .002
Operating
Ratio -.117 .021 -.955 -5.609 .011 1.000 1.000
a. Dependent Variable: ROA
3.2.4 Operate to Profitability
After the test is conducted and all of variables added. With the stepwise method
shows that R value is 0.955and shows a high degree of correlation between variables.
R² is 0.884 and indicates that 88.4% of variation in ROA is explained by independent
variable OPERATE. In terms of relationship to profitability, for operate variable
which it measured by operating ratio with a P -value < 0.10 indicates negative
insignificant relation to profitability. However, the operate variable to profitability
(ROA) has a positive significant relation with a P value < 0.10. This positive relation
indicates that the company’s operation can increase the profitability of company.
14
Apollo company is generating more operating income while reducing the operating
expenses where this company achieve positive amount of profitability with more
production as an income factor without incurred more expenses during the operation
process. Instead of having profit, the negative relation indicates the increases of
expenses effect the income of this company that cannot maximize the profit. This
model is also significant with the significant of anova regression P < 0.11. In addition,
operate variable has the highest impact with the t value -5.609 to the profitability
compared to the liquid and GDP.
4.0 Discussion and Findings
Apollo’s financial performance was out of the expectation of the shareholders with
unhealthy alert which profit margin, ROA and current ratio was decrease in 2015. The
only profitability measurement has a significant relationship which is ROA to operate
variable. With this high impact of operate to profitability and one of profitability
measurement is significant relationship to operate. Therefore, the attention of the
company into the operational factor should become priority on 2015 onwards beside
the GDP and liquidity to enhance the profitability.
The company can improve the company liquidity management as the company have a
highly liquid current assets. The optimum liquidity management can avoid a firm
from the too high or too low liquidity ratio which the firm is powerless to the creditors
pressure where if the liquidity is too low the firm is unable to meet their obligation on
specified time. So, there should be an improvement in terms of liquidity performance
with the measurement of liquidity management using current, quick and liquid ratio to
see the asset availability. One of benefit liquidity management, company will having
enough liquidity. It means that the company is holding enough cash to purchase from
suppliers with better pricing during purchasing process and thus the company may
increase its profit.
15
5.0 Conclusion
In a nutshell, we can know that all the companies faced liquidity risk and operational
risk especially in the study of the food and beverage company. Apollo Food Holdings
Berhad need to overcome the liquidity risk and operational risk more effectively and
efficiently with the mean ratio is above the benchmark standard. The liquidity and
operational performance annually shows this company is not having problem to settle
the obligation and operates efficiently that could gain more profit. In addition, to
maintain the performance in 2015 onwards, from the findings, one of variable is
significant (ROA) as a profitability variable to the operation with the highest impact
compared to all of variables. Besides that, although the findings shows liquid as well
as GDP is not significant to profitability, the implementation of liquidity management
and inventory control with following the trend or cycle of market should put into the
consideration as a part of profitability contribution to maintain and improve
continuous profitability of this company.
16
References
Arditti, F. D. (1967). Risk and The Required Return on Equity. The Journal of
Finance, 22:19-36.
ApolloFood. (2009). Retrieved 20 March, 2017, from Apollofood.com:
http://www.apollofood.com.my/index.php
Food and beverage market in Malaysia. (23 April, 2013). Retrieved 29 March, 2017,
from New Zealand Trade and Enterprise:
https://www.nzte.govt.nz/en/export/market-research/food-and-beverage-
market-in-malaysia/
Solomon, D. C., & Muntean, M. (2012). Economy Transdisciplinarity Cognition.
Assessment of Financial Risk in Firm's Probability Analysis, 15:58-67.
Waemustafa, W., & Abdullah, A. (2015). Mode of Islamic Bank Financing: Does
Effectiveness of Shariah Supervisory Board Matter?. Australian Journal of
Basic and Applied Sciences 9 (37), 458-463
Waemustafa, W., & Sukri, S. (2015). Bank specific and macroeconomics dynamic
determinants of credit risk in Islamic banks and conventional banks.
International Journal of Economics and Financial Issues, 5(2).
Waemustafa, W., & Sukri, S. (2016). Systematic and Unsystematic Risk Determinants
of Liquidity Risk Between Islamic and Conventional Banks. International
Journal of Economics and Financial Issues, 6(4).