the peoples gas light and coke company annual report for the
TRANSCRIPT

THE PEOPLES GAS LIGHT AND COKE COMPANY
ANNUAL REPORT FOR THE YEAR ENDED DECEMBER 31, 2011

i
THE PEOPLES GAS LIGHT AND COKE COMPANY
ANNUAL REPORT
For the Year Ended December 31, 2011
TABLE OF CONTENTS Page Forward‐Looking Statements ............................................................................................. 1 BUSINESS ................................................................................................................... 3 A. GENERAL.................................................................................................... 3 B. NATURAL GAS UTILITY OPERATIONS ......................................................... 3 C. ENVIRONMENTAL MATTERS ..................................................................... 7 D. CAPITAL REQUIREMENTS .......................................................................... 7 E. EMPLOYEES ............................................................................................... 7 RISK FACTORS ..................................................................................................................... 8 PROPERTIES ........................................................................................................................ 12 SELECTED FINANCIAL DATA ............................................................................................... 13 MANAGEMENT’S DISCUSSION AND ANALYSIS OF FINANCIAL CONDITION AND RESULTS OF OPERATIONS .................................................................................................................
14
QUANTITATIVE AND QUALITATIVE DISCLOSURES ABOUT MARKET RISK .......................... 30 FINANCIAL STATEMENTS A. Consolidated Statements of Income ....................................................................... 31 B. Consolidated Balance Sheets................................................................................... 32 C. Consolidated Statements of Capitalization ............................................................. 33 D. Consolidated Statements of Common Shareholder’s Equity .................................. 34 E. Consolidated Statements of Cash Flows ................................................................. 35 F. Notes to Consolidated Financial Statements .......................................................... 36‐69 Note 1 Summary of Significant Accounting Policies .......................................... 36 Note 2 Risk Management Activities .................................................................. 41 Note 3 Restructuring Expense ........................................................................... 44 Note 4 Property, Plant, and Equipment ............................................................ 44 Note 5 Regulatory Assets And Liabilities ........................................................... 44 Note 6 Short‐Term Debt and Lines of Credit ..................................................... 46 Note 7 Long‐Term Debt ..................................................................................... 46 Note 8 Asset Retirement Obligations ................................................................ 47 Note 9 Income Taxes ......................................................................................... 49

ii
Note 10 Commitments and Contingencies ......................................................... 51 Note 11 Employee Benefit Plans ......................................................................... 52 Note 12 Preferred Stock ...................................................................................... 59 Note 13 Common Equity ..................................................................................... 60 Note 14 Stock‐Based Compensation ................................................................... 60 Note 15 Fair Value ............................................................................................... 64 Note 16 Miscellaneous Income ........................................................................... 66 Note 17 Regulatory Environment ........................................................................ 66 Note 18 Segments of Business ............................................................................ 67 Note 19 Related Party Transactions .................................................................... 68 G. Independent Auditors’ Report ................................................................................ 70 RATIO OF EARNINGS TO FIXED CHARGES (Unaudited) ...................................................... 71
iii
Acronyms Used in this Annual Report
AMRP Accelerated Natural Gas Main Replacement Program ASC Accounting Standards Codification ASU Accounting Standards Update EPA United States Environmental Protection Agency FASB Financial Accounting Standards Board FERC Federal Energy Regulatory Commission GAAP United States Generally Accepted Accounting Principles IBS Integrys Business Support, LLC ICC Illinois Commerce Commission ICR Infrastructure Cost Recovery IRS United States Internal Revenue Service LIFO Last‐in, First‐out N/A Not Applicable NSG North Shore Gas Company NYMEX New York Mercantile Exchange OCI Other Comprehensive Income PELLC Peoples Energy, LLC (formerly known as Peoples Energy Corporation) PGL The Peoples Gas Light and Coke Company SEC United States Securities and Exchange Commission

‐ 1 ‐
Forward‐Looking Statements
In this report, we make statements concerning our expectations, beliefs, plans, objectives, goals, strategies, and future events or performance. These statements are "forward‐looking statements." Forward‐looking statements are not guarantees of future results and conditions, but rather are subject to numerous management assumptions, risks, and uncertainties. Therefore, actual results may differ materially from those expressed or implied by these statements. Although we believe that these forward‐looking statements and the underlying assumptions are reasonable, we cannot provide assurance that such statements will prove correct. Forward‐looking statements involve a number of risks and uncertainties. Some risks that could cause actual results to differ materially from those expressed or implied in forward‐looking statements include those described in this Annual Report for the year ended December 31, 2011 and those identified below: ● The timing and resolution of rate cases and related negotiations, including recovery of deferred and
current costs and the ability to earn a reasonable return on investment, and other regulatory decisions impacting us;
● Federal and state legislative and regulatory changes relating to the environment, including climate change;
● Other federal and state legislative and regulatory changes, including deregulation and restructuring of the natural gas utility industry, financial reform, health care reform, energy efficiency mandates, pipeline integrity and safety standards, and changes in tax and other laws and regulations to which we are subject;
● Costs and effects of litigation and administrative proceedings, settlements, investigations, and claims, including manufactured gas plant site cleanup, third‐party intervention in permitting and licensing projects, and prudence and reconciliation of costs recovered in revenues through automatic gas cost recovery mechanisms;
● Changes in credit ratings and interest rates caused by volatility in the financial markets and actions of rating agencies and their impact on our liquidity and financing efforts;
● The risks associated with changing commodity prices, particularly natural gas, and the available sources of natural gas, including their impact on margins, working capital, and liquidity requirements;
● The timing and outcome of any audits, disputes, and other proceedings related to taxes; ● The effects, extent, and timing of additional competition or regulation in the markets in which we
operate; ● The investment performance of employee benefit plan assets and related actuarial assumptions,
which impact future funding requirements; ● The effects of political developments, as well as changes in economic conditions and the related
impact on customer use, customer growth, and our ability to adequately forecast natural gas use for our customers;
● Potential business strategies, including acquisitions and construction or disposition of assets or businesses, which cannot be assured to be completed timely or within budgets;
● The risk of terrorism or cyber security attacks, including the associated costs to protect our assets and respond to such events;
● The risk of failure to maintain the security of personally identifiable information, including the associated costs to notify affected persons and to mitigate their information security concerns;
● The effectiveness of risk management strategies, the use of financial and derivative instruments, and the related recovery of these costs from customers in rates;
● The risk of financial loss associated with the inability of our counterparties and affiliates to meet their obligations;

‐ 2 ‐
● Unusual weather and other natural phenomena, including related economic, operational, and/or other ancillary effects of any such events;
● The effect of accounting pronouncements issued periodically by standard‐setting bodies; and ● Other factors discussed elsewhere herein and in other reports Integrys Energy Group files with the
SEC. Except to the extent required by applicable laws, we undertake no obligation to publicly update or revise any forward‐looking statements, whether as a result of new information, future events, or otherwise.

‐ 3 ‐
BUSINESS A. GENERAL
In this report, when we refer to "us," "we," "our," or "ours," we are referring to The Peoples Gas Light and Coke Company. References to "Notes" are to the Notes to the Consolidated Financial Statements included in this report. We are a regulated natural gas utility company that began operations in 1855. We are an Illinois corporation and are wholly owned by PELLC. PELLC is a wholly owned subsidiary of Integrys Energy Group, Inc. For more financial information about our natural gas utility operations, see Note 18, "Segments of Business" and "Management's Discussion and Analysis of Financial Condition and Results of Operations – Results of Operations." Prior to our deregistration in January of 2008, our annual report on Form 10‐K, quarterly reports on Form 10‐Q, current reports on Form 8‐K, and any amendments to these documents were filed with or furnished to the SEC. Integrys Energy Group’s reports, as well as our previously filed reports, are made available, free of charge, on Integrys Energy Group's website, www.integrysgroup.com. We and Integrys Energy Group are not including the information on or available through Integrys Energy Group's website as part of, or incorporating such information for reference into, this Annual Report. Integrys Energy Group's Code of Conduct, which applies to us, may also be accessed on Integrys Energy Group's website. Any amendments to or waivers from the Code of Conduct will be timely disclosed on Integrys Energy Group's website. You may obtain materials we previously filed with or furnished to the SEC, and materials filed by Integrys Energy Group, at the SEC Public Reference Room at 100 F Street, NE, Washington, DC 20549. To obtain information on the operation of the Public Reference Room, you may call the SEC at 1‐800‐SEC‐0330. You may also view our reports and other information (prior to our deregistration) and Integrys Energy Group’s reports, proxy statements, and other information (including exhibits) filed electronically with the SEC, at the SEC's website at www.sec.gov.
B. NATURAL GAS UTILITY OPERATIONS We provide natural gas utility service to approximately 826,000 residential, commercial and industrial, and transportation customers in Chicago. The regulated natural gas utility segment accounted for 100% of our revenues.
Facilities For information regarding our natural gas facilities, see, "Properties." For our utility plant asset book value, see Note 4, "Property, Plant, and Equipment."
Natural Gas Supply We manage a portfolio of natural gas supply contracts, storage services, and pipeline transportation services designed to meet varying customer usage patterns at the lowest reasonable cost.

‐ 4 ‐
Our natural gas supply requirements are met through a combination of fixed price purchases, index price purchases, contracted and owned storage, peak‐shaving facilities, and natural gas supply call options. We contract for fixed‐term firm natural gas supply each year to meet the demand of firm system sales customers. To supplement natural gas supply and manage risk, we purchase additional natural gas supply on the monthly and daily spot markets. For more information on our natural gas utility supply and transportation contracts, see Note 10, "Commitments and Contingencies." We own a storage field and contract with various underground storage service providers for additional storage services. Storage allows us to manage significant changes in daily natural gas demand and to purchase steady levels of natural gas on a year‐round basis, thus providing a hedge against supply cost volatility. We contract with interstate pipelines to purchase firm transportation services. Eight interstate pipelines and one local distribution company’s pipeline interconnect with our utility system. We believe that having multiple pipelines that serve our service territory benefits our customers by improving reliability, providing access to a diverse supply of natural gas, and fostering competition among these service providers which can lead to favorable conditions when negotiating new agreements for transportation and storage services. In addition, we use financial instruments such as commodity swaps and options as part of our hedging program to further reduce supply cost volatility. We own and operate an underground natural gas storage reservoir in central Illinois (Manlove Field) and a natural gas pipeline system that connects Manlove Field to Chicago with eight major interstate pipelines. These assets are directed primarily to serving rate‐regulated retail customers and are included in our regulatory rate base. We also use a portion of these company‐owned storage and pipeline assets as a natural gas hub, which consists of providing transportation and storage services in interstate commerce to our wholesale customers. Customers deliver natural gas to us through an injection, and then we later return the natural gas to the customers when needed through a withdrawal. Title to the natural gas does not transfer to us; therefore, all natural gas related only to the hub remains customer‐owned. We recognize service fees associated with the natural gas hub services provided to wholesale customers. These service fees reduce the cost of natural gas and services charged to retail customers in rates. Set forth below is a rollforward of natural gas in storage balances related to the natural gas hub as well as natural gas hub service fees collected from wholesale customers: Thousands of Dekatherms (MDth) 2011 2010 2009 Beginning balance, January 1 5,156 5,187 4,541 Injections 7,000 7,010 6,978 Withdrawals (6,895) (7,041) (6,332) Ending balance, December 31 5,261 5,156 5,187 (Millions) 2011 2010 2009 Natural gas hub service fees $5.4 $10.3 $5.8

‐ 5 ‐
We had adequate capacity to meet all firm natural gas demand obligations during 2011 and expect to have adequate capacity to meet all firm obligations during 2012. Our forecasted design peak‐day throughput is 2,089 MDth for the 2011 through 2012 heating season. The sources of our deliveries to customers (including transportation customers) in MDth for natural gas utility operations were as follows: (MDth) 2011 2010 2009 Natural gas purchases 108,634 103,500 110,210 Customer‐owned natural gas received 73,232 69,816 74,732 Underground storage, net (1,416) 2,562 1,515 Hub fuel in kind * 180 176 141 Owned storage cushion injection (1,098) (1,094) (1,272) Contracted pipeline and storage compressor fuel, franchise requirements, and unaccounted‐for natural gas
(7,401)
(7,305) (8,074)
Total 172,131 167,655 177,252
* This delivered natural gas was originally provided by hub customers whose contract requires them to provide additional natural gas to compensate for unaccounted‐for natural gas in future deliveries.
Regulatory Matters Our natural gas retail rates are regulated by the ICC, which has general supervisory and regulatory powers over public utilities in Illinois. Our sales are made and services are rendered pursuant to rate schedules on file with the ICC. These rate schedules contain various service classifications, which largely reflect customers’ different uses and levels of consumption. We bill customers for the distribution of natural gas as well as for a natural gas charge representing third‐party costs for purchasing, transporting, and storing natural gas. This charge also includes gains, losses, and costs incurred under our hedging program, the amount of which is also subject to ICC authority. Prudently incurred natural gas costs are passed directly through to customers in rates (sometimes referred to as the "natural gas charge") and, therefore, have no impact on margins. The ICC conducts annual proceedings regarding the reconciliation of revenues from the natural gas charge and related natural gas costs. Almost all of the natural gas we distribute is transported to our distribution systems by interstate pipelines. The pipelines’ transportation and storage services, including our natural gas hub, are regulated by the FERC under the Natural Gas Act and the Natural Gas Policy Act of 1978. Under United States Department of Transportation regulations, the ICC is responsible for monitoring our safety compliance program for our pipelines under 49 Code of Federal Regulations (CFR) Part 192 (Transportation of Natural and Other Gas by Pipeline: Minimum Federal Safety Standards) and 49 CFR Part 195 (Transportation of Hazardous Liquids by Pipeline). We are required to provide service and grant credit (with applicable deposit requirements) to customers in Chicago. ICC Administrative Code restrictions generally do not allow us to discontinue service during winter moratorium months to residential customers who do not pay their bills. The Federal and Illinois governments have legislation that provides for a limited amount of funding for assistance to our low‐income customers.

‐ 6 ‐
See Note 17, "Regulatory Environment," for information regarding our rate cases, decoupling mechanisms, and bad debt recovery mechanisms.
Other Matters Seasonality Our natural gas throughput is generally higher during the winter months because the heating requirements of customers are temperature driven. During 2011, we recorded approximately 62% of our revenues in January, February, March, November, and December. Competition Although our rates are regulated by the ICC, competition in varying degrees exists between natural gas and other forms of energy available to consumers in the Midwest and our service territory, such as electricity and heating oil. Absent extraordinary circumstances, potential competitors are not allowed to construct competing natural gas distribution systems in our service territory due to a judicial doctrine known as the "first in the field." In addition, it would be impractical to construct competing duplicate distribution facilities due to the high cost of installation. Since 2002, our customers have had the opportunity to choose a natural gas supplier other than us. As a result, we offer natural gas transportation service to enable customers to better manage their energy costs. Such transportation customers purchase natural gas directly from third‐party natural gas suppliers and use our distribution system to transport the natural gas to their facilities. We still earn a distribution charge for transporting the natural gas for these customers at margins similar to those applicable to conventional natural gas sales. As such, the loss of revenue associated with the cost of natural gas our transportation customers now purchase from the third‐party suppliers has no impact on our net income, as it is offset by an equal reduction to natural gas costs. An interstate pipeline may seek to provide transportation service directly to end users, which would bypass our natural gas transportation service. However, we have a bypass rate approved by the ICC, which allows us to negotiate rates with customers that are potential bypass candidates, to help ensure that such customers use our transportation service. To date, none of our customers have been lost to bypass service.

‐ 7 ‐
Working Capital Requirements The working capital needs of our natural gas utility operations vary significantly over time due to volatility in levels of natural gas inventories and the price of natural gas. Our working capital needs are met by cash generated from operations, equity infusions, and short‐term debt. The seasonality of natural gas revenues causes the timing of cash collections to be concentrated from January through June. A portion of the winter natural gas supply needs is typically purchased and stored from April through November. Also, planned capital spending on our natural gas distribution facilities is concentrated in April through November. Because of these timing differences, the cash flow from customers is typically supplemented with temporary increases in short‐term borrowings (from affiliates and external sources) during the late summer and fall. Short‐term debt is typically reduced over the January through June period.
C. ENVIRONMENTAL MATTERS For information on our environmental matters, see Note 10, "Commitments and Contingencies."
D. CAPITAL REQUIREMENTS For information on our capital requirements, see "Management's Discussion and Analysis of Financial Condition and Results of Operations – Liquidity and Capital Resources."
E. EMPLOYEES At December 31, 2011, we had 1,077 employees, of which approximately 79% were union employees represented by Local 18007 of the Utility Workers Union of America. The current Local 18007 collective bargaining agreement expires on April 30, 2013.

‐ 8 ‐
RISK FACTORS You should carefully consider the following risk factors when reading this Annual Report. We are subject to government regulation, which may have a negative impact on our business, financial position, and results of operations. We are subject to comprehensive regulation by several federal and state regulatory agencies and local governmental bodies. This regulation significantly influences our operating environment and may affect our ability to recover costs from utility customers. Many aspects of our operations are regulated, including, but not limited to, construction and operation of facilities, conditions of service, the issuance of securities, and the rates that we can charge customers. We are required to have numerous permits, approvals, and certificates from these agencies to operate our business. Failure to comply with any applicable rules or regulations may lead to penalties or customer refunds, which could have a material adverse impact on our financial results. Existing statutes and regulations may be revised or reinterpreted by federal and state regulatory agencies, or these agencies may adopt new laws and regulations that apply to us. We are unable to predict the impact on our business and operating results of any such actions by these agencies. However, changes in regulations or the imposition of additional regulations may require us to incur additional expenses or change business operations, which may have an adverse impact on results of operations. The rates, including adjustments determined under riders, which we are allowed to charge for retail services are the most important factors influencing our business, financial position, results of operations, and liquidity. Rate regulation is premised on providing an opportunity to recover prudently incurred costs and earn a reasonable rate of return on invested capital. However, there is no assurance that regulatory commissions will consider all of our regulated costs to have been prudently incurred. In addition, the regulatory process will not always result in rates that will produce full recovery of such costs or provide for a reasonable return on equity. Certain expense and revenue items are deferred as regulatory assets and liabilities for future recovery or refund to customers, as authorized by regulators. Future recovery of regulatory assets is not assured, and is generally subject to review by regulators in rate proceedings for prudence and reasonableness. If recovery of costs is not approved or is no longer deemed probable, regulatory assets would be recognized in current period expense and could have a material adverse impact on our financial results. We are subject to environmental laws and regulations, compliance with which could be difficult and costly. We are subject to numerous federal and state environmental laws and regulations that affect many aspects of our operations, including future operations. These laws and regulations require us to obtain and comply with a wide variety of environmental registrations, licenses, permits, inspections, and other approvals. Environmental laws and regulations can cause us to incur expenditures for cleanup costs, damages arising from contaminated properties, and monitoring obligations. In addition, there is uncertainty in quantifying liabilities under environmental laws that impose joint and several liability on all potentially responsible parties. Compliance with current and future environmental laws and regulations may result in increased capital, operating, and other costs, and non‐compliance could result in fines, penalties, and injunctive measures affecting our facilities.

‐ 9 ‐
We are accruing liabilities and deferring costs (recorded as regulatory assets) incurred in connection with our former manufactured gas plant sites. These costs include all recoverable costs incurred to date, management's best estimates of future costs for investigation and remediation, and legal expenses, and are net of amounts recovered by or that may be recovered from insurance or other entities. The ultimate costs to remediate these sites could also vary from the amounts currently accrued. Citizen groups that feel environmental regulations are not being sufficiently enforced by environmental regulatory agencies may also bring citizen enforcement actions against us. Such actions could seek penalties, injunctive relief, and costs of litigation. There is also a risk that private citizens may bring lawsuits to recover environmental damages they believe they have incurred. We may face significant costs if laws or regulations are adopted to address climate change. Political interest in climate change and the effect of greenhouse gas emissions, most notably carbon dioxide, are a concern for the energy industry. Although no legislation is currently pending that would affect us, state or federal legislation could be passed in the future to regulate greenhouse gas emissions. Until legislation is passed at the federal or state level, it remains unclear as to (1) which industry sectors will be impacted, (2) when compliance will be required, (3) the magnitude of the greenhouse gas emissions reductions that will be required, and (4) the costs and opportunities associated with compliance.
Our natural gas delivery systems may generate fugitive gas as a result of normal operations and as a result of excavation, construction, and repair of natural gas delivery systems. Fugitive gas typically vents to the atmosphere and consists primarily of methane, a greenhouse gas. Carbon dioxide is also a byproduct of natural gas consumption. As a result, future legislation to regulate greenhouse gas emissions could increase the price of natural gas, restrict the use of natural gas, adversely affect our ability to operate our natural gas facilities, and/or reduce natural gas demand, which could have a material adverse impact on our results of operations and financial condition.
Our operations are subject to various conditions, which can result in fluctuations in the number of customers and their usage. Our operations are affected by the demand for natural gas, which can vary greatly based upon: • Fluctuations in general economic conditions and growth in the service areas in which we
operate; • Weather conditions and seasonality; • The amount of energy available from current or new competitors; and • Our customers' continued focus on energy efficiency.

‐ 10 ‐
Our operations are subject to risks beyond our control, including but not limited to, cyber security attacks, terrorist attacks, acts of war, or loss of personally identifiable information. Any future terrorist attack, cyber security attack, and/or act of war affecting our facilities and operations could have an adverse impact on our results of operations, financial condition, and cash flows. The energy industry uses sophisticated information technology systems and network infrastructure, which control an interconnected system of distribution and transmission systems with other third parties. A cyber security attack may occur despite our security measures or those that we require our vendors to take, including compliance with critical infrastructure protection standards. Cyber security attacks, including those targeting information systems and electronic control systems used at natural gas transmission, distribution, and storage systems, could severely disrupt our operations and result in loss of service to customers. The risk of such attacks may also increase our capital and operating costs as a result of having to implement increased security measures for protection of our information technology and infrastructure. The cost of repairing damage to our facilities or for legal claims caused by these attacks may not be recoverable in rates or may exceed the insurance limits on our insurance policies or, in some cases, may not be covered by insurance. The high cost or potential unavailability of insurance to cover terrorist activity may also adversely impact our results of operations and financial conditions. Our business requires the collection and retention of personally identifiable information of our customers, shareholders, and employees, who expect that we will adequately protect such information. A significant theft, loss, or fraudulent use of personally identifiable information may cause our business reputation to be adversely impacted, may lead to potentially large costs to notify and protect the impacted persons, and/or may cause us to become subject to legal claims, fines, or penalties, any of which could adversely impact our results of operations. Counterparties may not meet their obligations. We are exposed to the risk that counterparties to various arrangements who owe us money, natural gas, or other commodities or services will not be able to perform their obligations. Should the counterparties to these arrangements fail to perform, we may be forced to replace the underlying commitment at then‐current market prices or we may be unable to meet all of our customers' natural gas requirements unless or until alternative supply arrangements are put in place. In such event, we may incur losses, or our results of operations, financial position, or liquidity could otherwise be adversely affected. Poor investment performance of retirement plan investments and other factors impacting retirement plan costs could unfavorably impact our liquidity and results of operations. We participate in employee benefit plans that cover substantially all of our employees and retirees. Our cost of providing these benefit plans is dependent upon actual plan experience and assumptions concerning the future. These assumptions include earnings on and/or valuations of plan assets, discount rates, the level of interest rates used to measure the required minimum funding levels of the plans, future government regulation, estimated withdrawals by retirees, and required or voluntary contributions to the plans. Depending on the investment performance over time and other factors impacting our costs, we could be required to make larger contributions in the future to fund these plans. These additional funding obligations could have a material adverse impact on our cash flows, financial condition, and/or results of operations. Changes made to the plans may also impact current and future pension and other postretirement benefit costs.

‐ 11 ‐
Adverse capital and credit market conditions could negatively affect our ability to meet liquidity needs, access capital, and/or grow or sustain our current business. Cost of capital and disruptions, uncertainty, and/or volatility in the financial markets could adversely impact our results of operations and financial condition. Having access to the credit and capital markets, at a reasonable cost, is necessary for us to fund our operations and capital requirements. The capital and credit markets provide us with liquidity to operate and grow our business that is not otherwise provided from operating cash flows. Disruptions, uncertainty, and/or volatility in those markets could increase our cost of capital or limit the availability of capital. If we or Integrys Energy Group are unable to access the credit and capital markets on terms that are reasonable, we may have to delay raising capital, issue shorter‐term securities, and/or bear an increased cost of capital. This, in turn, could impact our ability to grow or sustain our current business, cause a reduction in earnings, and/or result in a credit rating downgrade. A reduction in our credit ratings could materially and adversely affect our business, financial position, results of operations, and liquidity. We cannot be sure that any of our credit ratings will remain in effect for any given period of time or that a credit rating will not be lowered by a rating agency if, in the rating agency’s judgment, circumstances in the future so warrant. Any downgrade could: • Require the payment of higher interest rates in future financings and possibly reduce the
potential pool of creditors; • Increase borrowing costs under certain existing credit facilities; • Limit access to the commercial paper market; • Require provision of additional credit assurance, including cash margin calls, to contract
counterparties. Fluctuating commodity prices may affect the operating costs and competitive position of our business, thereby adversely impacting our liquidity and results of operations. Our natural gas business is sensitive to changes in natural gas commodity prices. Any changes could affect the prices we charge, our operating costs, and the competitive position of our products and services. Prudently incurred costs for purchased natural gas and pipeline transportation and storage services are fully recoverable through the natural gas charge to customers. However, increases in natural gas costs affect total retail prices and, therefore, the competitive position of our natural gas business relative to other forms of energy. In addition, the timing and extent of higher natural gas prices can adversely affect interest expense. We are also subject to margin requirements in connection with our use of forward contracts, and these requirements could escalate if prices move adversely relative to these positions.

‐ 12 ‐
PROPERTIES Natural Gas Facilities At December 31, 2011, our natural gas properties were located in Illinois and consisted of the following: ● Approximately 4,200 miles of natural gas distribution mains, ● Approximately 260 miles of natural gas transmission mains, ● 11 natural gas distribution and transmission gate stations, ● Approximately 509,000 natural gas lateral services, and ● A 38.2 billion‐cubic‐foot underground natural gas storage reservoir,* and ● A 2 billion‐cubic‐foot liquefied natural gas plant.* * We own and operate this reservoir and liquefied natural gas plant in central Illinois (Manlove
Field). We also own a natural gas pipeline system that connects Manlove Field to Chicago with eight major interstate pipelines. The underground storage reservoir also serves NSG under a contractual arrangement. We use our natural gas storage and pipeline supply assets as a natural gas hub in the Chicago area.
General Most of our principal plants and properties, other than mains, services, meters, regulators, and cushion gas in underground storage are located on property owned in fee. Substantially all natural gas mains are located under public streets, alleys, and highways, or under property owned by others under grants of easements. Meters and house regulators in use and a portion of services are located on premises being served. Certain portions of the transmission system are located on land held pursuant to leases, easements, or permits. Substantially all of our utility plant is subject to a first mortgage lien.
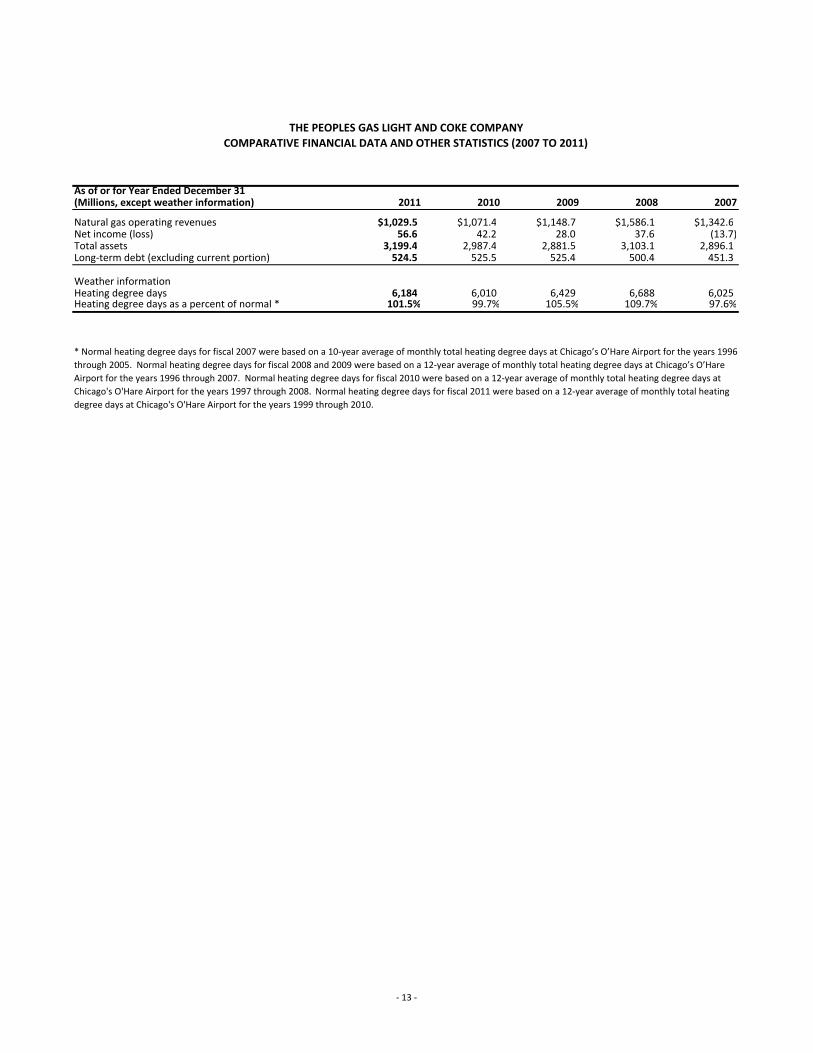
As of or for Year Ended December 31 (Millions, except weather information) 2011 2010 2009 2008 2007
Natural gas operating revenues $1,029.5 $1,071.4 $1,148.7 $1,586.1 $1,342.6Net income (loss) 56.6 42.2 28.0 37.6 (13.7) Total assets 3,199.4 2,987.4 2,881.5 3,103.1 2,896.1 Long‐term debt (excluding current portion) 524.5 525.5 525.4 500.4 451.3
Weather informationHeating degree days 6,184 6,010 6,429 6,688 6,025 Heating degree days as a percent of normal * 101.5% 99.7% 105.5% 109.7% 97.6%
* Normal heating degree days for fiscal 2007 were based on a 10‐year average of monthly total heating degree days at Chicago’s O’Hare Airport for the years 1996 through 2005. Normal heating degree days for fiscal 2008 and 2009 were based on a 12‐year average of monthly total heating degree days at Chicago’s O’Hare Airport for the years 1996 through 2007. Normal heating degree days for fiscal 2010 were based on a 12‐year average of monthly total heating degree days at Chicago's O'Hare Airport for the years 1997 through 2008. Normal heating degree days for fiscal 2011 were based on a 12‐year average of monthly total heating degree days at Chicago's O'Hare Airport for the years 1999 through 2010.
THE PEOPLES GAS LIGHT AND COKE COMPANYCOMPARATIVE FINANCIAL DATA AND OTHER STATISTICS (2007 TO 2011)
‐ 13 ‐
‐ 14 ‐
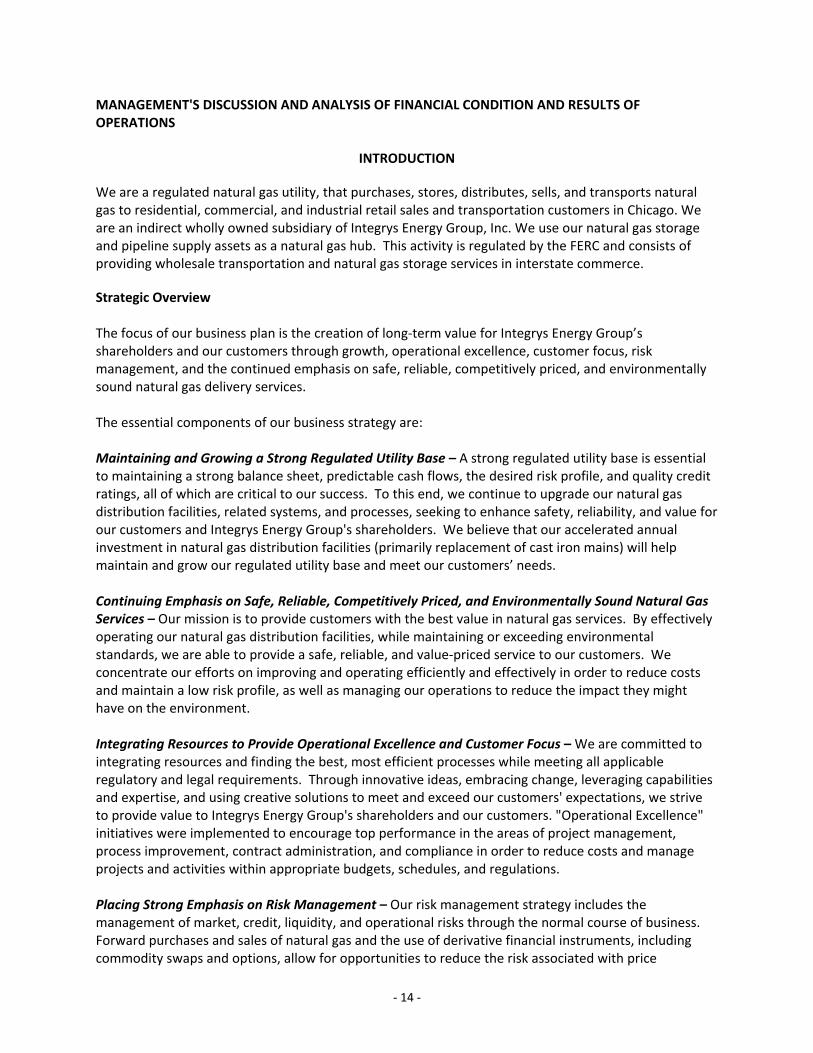
MANAGEMENT'S DISCUSSION AND ANALYSIS OF FINANCIAL CONDITION AND RESULTS OF OPERATIONS
INTRODUCTION We are a regulated natural gas utility, that purchases, stores, distributes, sells, and transports natural gas to residential, commercial, and industrial retail sales and transportation customers in Chicago. We are an indirect wholly owned subsidiary of Integrys Energy Group, Inc. We use our natural gas storage and pipeline supply assets as a natural gas hub. This activity is regulated by the FERC and consists of providing wholesale transportation and natural gas storage services in interstate commerce. Strategic Overview The focus of our business plan is the creation of long‐term value for Integrys Energy Group’s shareholders and our customers through growth, operational excellence, customer focus, risk management, and the continued emphasis on safe, reliable, competitively priced, and environmentally sound natural gas delivery services. The essential components of our business strategy are: Maintaining and Growing a Strong Regulated Utility Base – A strong regulated utility base is essential to maintaining a strong balance sheet, predictable cash flows, the desired risk profile, and quality credit ratings, all of which are critical to our success. To this end, we continue to upgrade our natural gas distribution facilities, related systems, and processes, seeking to enhance safety, reliability, and value for our customers and Integrys Energy Group's shareholders. We believe that our accelerated annual investment in natural gas distribution facilities (primarily replacement of cast iron mains) will help maintain and grow our regulated utility base and meet our customers’ needs. Continuing Emphasis on Safe, Reliable, Competitively Priced, and Environmentally Sound Natural Gas Services – Our mission is to provide customers with the best value in natural gas services. By effectively operating our natural gas distribution facilities, while maintaining or exceeding environmental standards, we are able to provide a safe, reliable, and value‐priced service to our customers. We concentrate our efforts on improving and operating efficiently and effectively in order to reduce costs and maintain a low risk profile, as well as managing our operations to reduce the impact they might have on the environment. Integrating Resources to Provide Operational Excellence and Customer Focus – We are committed to integrating resources and finding the best, most efficient processes while meeting all applicable regulatory and legal requirements. Through innovative ideas, embracing change, leveraging capabilities and expertise, and using creative solutions to meet and exceed our customers' expectations, we strive to provide value to Integrys Energy Group's shareholders and our customers. "Operational Excellence" initiatives were implemented to encourage top performance in the areas of project management, process improvement, contract administration, and compliance in order to reduce costs and manage projects and activities within appropriate budgets, schedules, and regulations. Placing Strong Emphasis on Risk Management – Our risk management strategy includes the management of market, credit, liquidity, and operational risks through the normal course of business. Forward purchases and sales of natural gas and the use of derivative financial instruments, including commodity swaps and options, allow for opportunities to reduce the risk associated with price
‐ 15 ‐
movement in a volatile energy market. The risk profile related to these instruments is managed in a manner consistent with Integrys Energy Group's risk management policy for regulated affiliates, which is approved by the Integrys Energy Group Board of Directors. The Integrys Energy Group Corporate Risk Management Group, which reports through Integrys Energy Group's Chief Financial Officer, provides oversight for us.
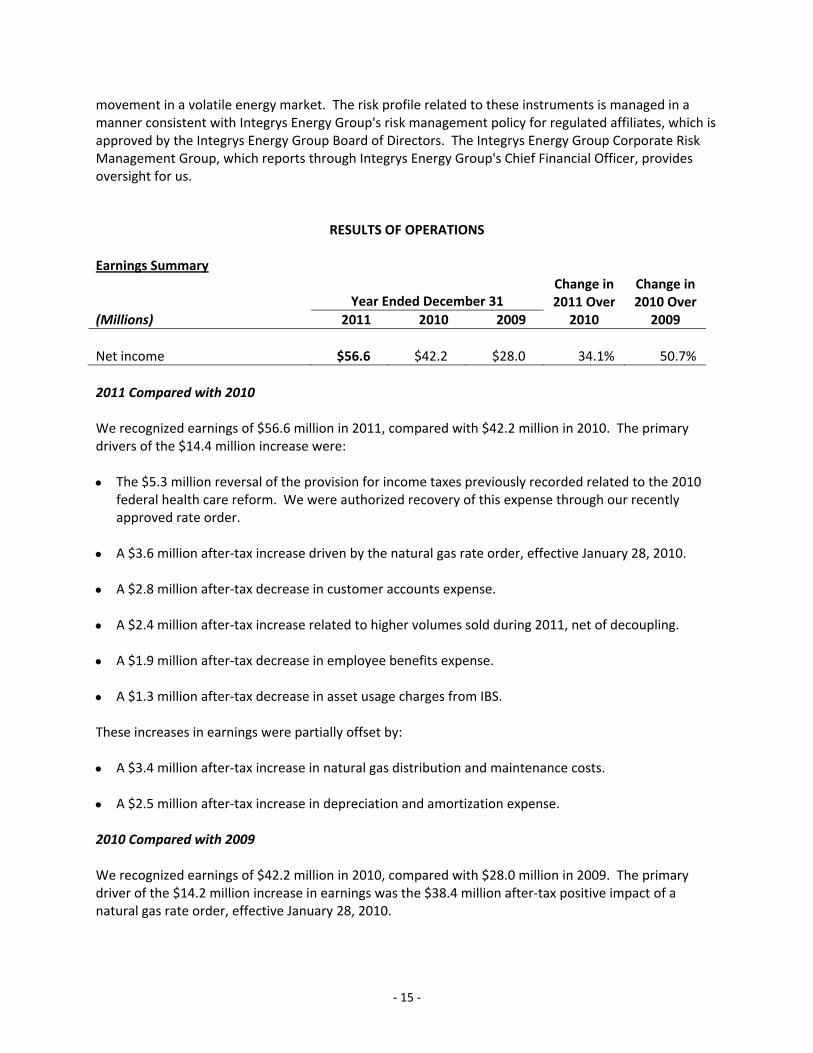
RESULTS OF OPERATIONS Earnings Summary
(Millions)
Year Ended December 31
Change in 2011 Over
2010
Change in2010 Over
2009 2011 2010 2009 Net income $56.6 $42.2 $28.0 34.1% 50.7% 2011 Compared with 2010 We recognized earnings of $56.6 million in 2011, compared with $42.2 million in 2010. The primary drivers of the $14.4 million increase were: • The $5.3 million reversal of the provision for income taxes previously recorded related to the 2010
federal health care reform. We were authorized recovery of this expense through our recently approved rate order.
• A $3.6 million after‐tax increase driven by the natural gas rate order, effective January 28, 2010. • A $2.8 million after‐tax decrease in customer accounts expense. • A $2.4 million after‐tax increase related to higher volumes sold during 2011, net of decoupling. • A $1.9 million after‐tax decrease in employee benefits expense. • A $1.3 million after‐tax decrease in asset usage charges from IBS. These increases in earnings were partially offset by: • A $3.4 million after‐tax increase in natural gas distribution and maintenance costs. • A $2.5 million after‐tax increase in depreciation and amortization expense. 2010 Compared with 2009 We recognized earnings of $42.2 million in 2010, compared with $28.0 million in 2009. The primary driver of the $14.2 million increase in earnings was the $38.4 million after‐tax positive impact of a natural gas rate order, effective January 28, 2010.

‐ 16 ‐
This increase was partially offset by: • A $9.1 million after‐tax increase in depreciation and amortization expense related to a change in
recovery method for net dismantling costs under the rate order. • A $5.3 million increase in the provision for income taxes related to the 2010 federal health care
reform. • A $4.8 million after‐tax increase in employee benefits expense. • A $4.2 million after‐tax decrease in margins related to a decrease in volumes sold in 2010, net of the
positive impact of decoupling. PGL Operations
(Millions, except heating degree days)
Change in Change inYear Ended December 31 2011 over 2010 over
2011 2010 2009 2010 2009 Natural gas operating revenues $1,029.5 $1,071.4 $1,148.7 (3.9)% (6.7)%Natural gas purchased for resale 508.4 543.1 656.0 (6.4)% (17.2)%Margins 521.1 528.3 492.7 (1.4) % 7.2 % Operating and maintenance expense 309.6 329.6 338.5 (6.1)% (2.6)%Restructuring expense ‐ (0.1) 2.8 (100.0)% N/ADepreciation and amortization expense 83.9 79.7 64.6 5.3 % 23.4 %Taxes other than income taxes 16.7 16.6 16.0 0.6 % 3.8 %Operating income 110.9 102.5 70.8 8.2 % 44.8 % Miscellaneous income 1.8 0.8 1.9 125.0 % (57.9)%Interest expense (24.0) (25.3) (26.5) (5.1)% (4.5)%Other expense (22.2) (24.5) (24.6) (9.4)% (0.4)% Income before taxes 88.7 78.0 46.2 13.7 % 68.8 %Provision for income taxes 32.1 35.8 18.2 (10.3)% 96.7 %Net income $ 56.6 $ 42.2 $ 28.0 34.1 % 50.7 % Retail throughput in therms Residential 842.0 813.5 871.7 3.5 % (6.7)%Commercial and industrial 167.9 163.6 174.9 2.6 % (6.5)%Total retail throughput in therms 1,009.9 977.1 1,046.6 3.4 % (6.6)% Transport throughput in therms Residential 200.7 200.9 218.3 (0.1)% (8.0)%Commercial and industrial 510.7 498.6 507.6 2.4 % (1.8)%Total transport throughput in therms 711.4 699.5 725.9 1.7 % (3.6)% Total throughput in therms 1,721.3 1,676.6 1,772.5 2.7 % (5.4)% Weather Heating degree days 6,184 6,010 6,429 2.9 % (6.5)%

‐ 17 ‐
2011 Compared with 2010 Margins Natural gas margins are defined as natural gas operating revenues less the cost of natural gas purchased for resale. Management believes that natural gas margins provide a more meaningful basis for evaluating natural gas utility operations than natural gas revenues since we pass through prudently incurred natural gas commodity costs to our customers in current rates. There was an approximate 10% decrease in the average per‐unit cost of natural gas sold during 2011, which had no impact on margins. Margins decreased $7.2 million. The decrease in margins was driven by the approximate $16 million negative year‐over‐year impact of higher regulatory refunds and lower regulatory recoveries that are offset by equal decreases in operating and maintenance expense, resulting in no impact on earnings. We refunded approximately $12 million more to customers under our bad debt rider in 2011. We also recovered approximately $4 million less for environmental cleanup costs at our former manufactured gas plant sites in 2011. See Note 17, "Regulatory Environment," for more information on our bad debt rider and Note 10, "Commitments and Contingencies," for more information on our manufactured gas plant sites. The decrease in margins was partially offset by: • An approximate $6 million increase in margins related to the positive impact of the rate order,
effective January 28, 2010, and other impacts of rate design. See Note 17, "Regulatory Environment," for more information on this rate order.
• An approximate $4 million net increase in margins as a result of a 2.7% increase in volumes sold. ‐ Higher sales volumes excluding the impact of weather resulted in approximately $9 million of
increased margins. We attribute this increase to a combination of higher use per customer, higher average customer counts, and improved economic conditions for certain customers.
‐ Colder weather during 2011, as shown by the 2.9% increase in heating degree days, drove an
approximate $1 million increase in margins. ‐ Partially offsetting these increases was an approximate $6 million decrease in 2011 from our
decoupling mechanism. Although decoupling was implemented to minimize the impact of changes in sales volumes, it does not cover all customer classes. During 2011, decoupling lessened the positive impact from certain of the increased sales volumes through higher future customer refunds.
Operating Income Operating income increased $8.4 million. This increase was primarily driven by a $15.6 million decrease in operating expenses, partially offset by the $7.2 million decrease in margins discussed above.

‐ 18 ‐
The decrease in operating expenses primarily related to: • An approximate $16 million decrease due to higher amortization of regulatory liabilities related to our
bad debt rider and lower amortization of regulatory assets related to environmental cleanup costs for manufactured gas plant sites. Margins decreased by an equal amount, resulting in no impact on earnings.
• A $4.6 million decrease in customer accounts expense resulting from lower customer call volumes and
a decrease in labor associated with fewer disconnections. • A $3.2 million decrease in employee benefits expense. • A $2.1 million decrease in asset usage charges from IBS related to retirement of certain computer
hardware. • These decreases were partially offset by: ‐ A $5.7 million increase in natural gas distribution costs. The increase was partially due to
additional labor related to distribution operations activities and additional consulting costs associated with a work asset management system and the AMRP. Transportation costs, building maintenance, and other miscellaneous distribution costs also contributed to the increase.
‐ A $4.2 million increase in depreciation and amortization expense, primarily due to higher property
and equipment balances driven primarily by AMRP and various natural gas supply projects at Manlove Field.
Other expense Other expense decreased $2.3 million, primarily driven by a decrease in interest expense on long‐term debt. We refinanced some of our long‐term debt at lower interest rates in the second half of 2010. 2010 Compared with 2009 Margins Natural gas margins are defined as natural gas operating revenues less the cost of natural gas purchased for resale. Management believes that natural gas margins provide a more meaningful basis for evaluating natural gas utility operations than natural gas revenues since we pass through prudently incurred natural gas commodity costs to our customers in current rates. There was an approximate 11% decrease in the average per‐unit cost of natural gas sold during 2010, which had no impact on margins. Margins increased $35.6 million, driven by an approximate $64 million positive impact of a rate order. This rate order was necessary, in part, to recover higher operating expenses. See Note 17, "Regulatory Environment," for more information on this rate order.

‐ 19 ‐
The increase in margins was partially offset by: • An approximate $21 million net decrease in margins driven by lower recovery of approximately
$28 million of environmental cleanup expenditures related to former manufactured gas plant sites, partially offset by an approximate $7 million increase related to recoveries received in 2010 under the bad debt rider. These amounts were offset by an equal net decrease in operating and maintenance expense resulting from lower amortization of the related regulatory assets and, therefore, had no impact on earnings. Recovery under the bad debt rider represents net billings to customers of the excess or deficiency of actual 2008 and 2009 bad debt expense over bad debt expense reflected in utility rates during those same periods. See Note 17, "Regulatory Environment," for more information on the bad debt rider.
• An approximate $7 million decrease in margins resulting from the 5.4% decrease in volumes sold ,
related to: ‐ An approximate $8 million decrease related to lower sales volumes excluding the impact of
weather. Residential customer volumes decreased, which we attribute to energy conservation, efficiency efforts, and general economic conditions. Commercial and industrial customers' sales volumes also decreased, which we attribute to reduced demand related to changes in customers' business operations, conservation and efficiency efforts, and general economic conditions.
‐ An approximate $6 million decrease as a result of warmer weather during 2010, evidenced by the
6.5% decrease in heating degree days. ‐ Partially offsetting these decreases was an approximate $7 million positive impact in 2010 due to a
decoupling mechanism for our residential, small commercial and industrial, and transportation customers. Under decoupling, we are allowed to adjust future rates in accordance with ICC rules to recover or refund the differences between the actual and authorized margin per customer impact of variations in volumes. The decoupling mechanism does not, however, adjust for variations in volumes resulting from changes in customer counts compared to projected rate case levels, nor does it cover all customer classes.
Operating Income Operating income increased $31.7 million, primarily driven by the $35.6 million increase in margins, partially offset by a $3.9 million increase in operating expenses. The increase in operating expenses primarily related to: • A $15.1 million increase in depreciation and amortization expense, primarily due to the rate order,
effective January 28, 2010, which allows earlier recovery in rates for net dismantling costs by including them as a component of depreciation rates applied to natural gas distribution assets.
• An $8.0 million increase in employee benefit costs, partially related to an increase in other
post‐retirement benefit costs.
‐ 20 ‐
• A $3.7 million increase in asset usage charges from IBS related to implementation of both a work
asset management system for natural gas operations and an update to an enterprise resource planning system for finance and supply chain services.
• These increases were partially offset by: ‐ An approximate $21 million net decrease due to approximately $28 million of lower amortization
of the regulatory asset related to environmental cleanup expenditures for manufactured gas plant sites, partially offset by approximately $7 million of amortization related to the regulatory asset recorded as a result of the bad debt rider. This net decrease was passed through to customers in rates and, therefore, had no impact on earnings.
‐ A $2.9 million decrease in restructuring expenses recorded in 2009 related to a reduction in
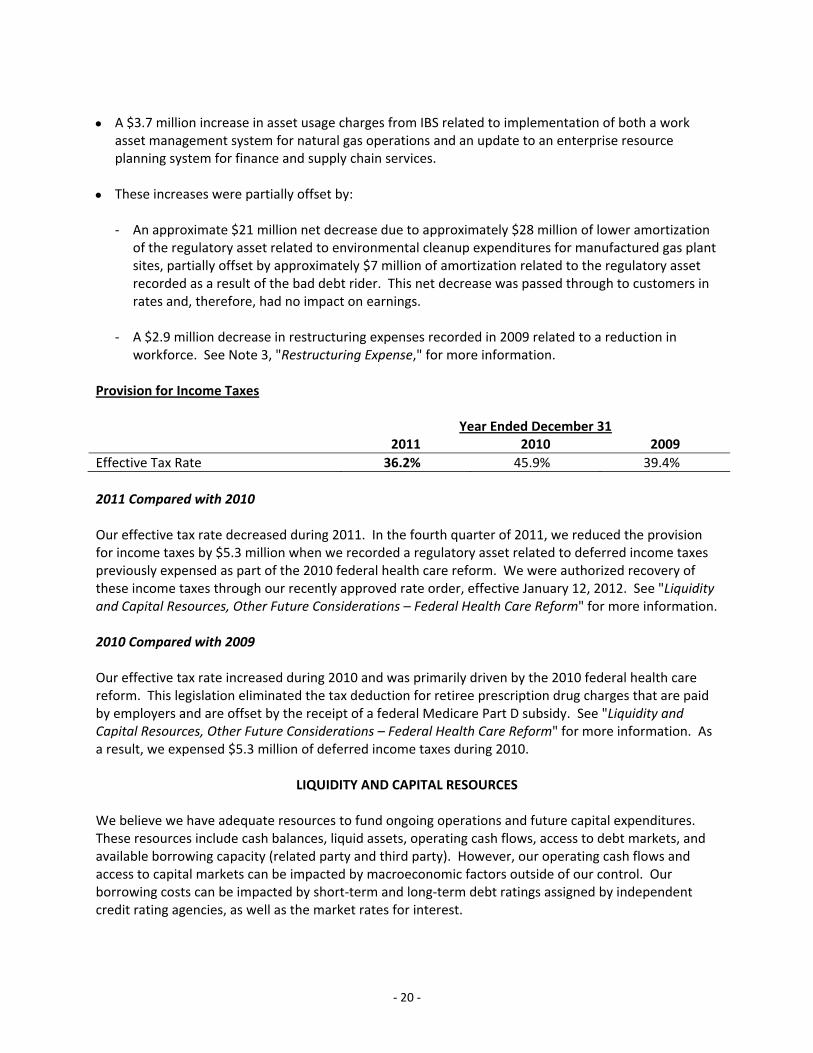
workforce. See Note 3, "Restructuring Expense," for more information. Provision for Income Taxes
Year Ended December 31 2011 2010 2009 Effective Tax Rate 36.2% 45.9% 39.4% 2011 Compared with 2010 Our effective tax rate decreased during 2011. In the fourth quarter of 2011, we reduced the provision for income taxes by $5.3 million when we recorded a regulatory asset related to deferred income taxes previously expensed as part of the 2010 federal health care reform. We were authorized recovery of these income taxes through our recently approved rate order, effective January 12, 2012. See "Liquidity and Capital Resources, Other Future Considerations – Federal Health Care Reform" for more information. 2010 Compared with 2009 Our effective tax rate increased during 2010 and was primarily driven by the 2010 federal health care reform. This legislation eliminated the tax deduction for retiree prescription drug charges that are paid by employers and are offset by the receipt of a federal Medicare Part D subsidy. See "Liquidity and Capital Resources, Other Future Considerations – Federal Health Care Reform" for more information. As a result, we expensed $5.3 million of deferred income taxes during 2010.
LIQUIDITY AND CAPITAL RESOURCES We believe we have adequate resources to fund ongoing operations and future capital expenditures. These resources include cash balances, liquid assets, operating cash flows, access to debt markets, and available borrowing capacity (related party and third party). However, our operating cash flows and access to capital markets can be impacted by macroeconomic factors outside of our control. Our borrowing costs can be impacted by short‐term and long‐term debt ratings assigned by independent credit rating agencies, as well as the market rates for interest.

‐ 21 ‐
Operating Cash Flows 2011 Compared with 2010 During 2011, net cash provided by operating activities was $159.9 million, compared with $178.8 million during 2010. The $18.9 million decrease in net cash provided by operating activities was primarily due to: • A $42.4 million net increase in cash used for working capital, driven by: ‐ Accounts payable decreased $49.4 million in 2011, compared to a $2.3 million decrease in 2010.
Natural gas in storage increased $6.4 million in 2011, compared to a decrease of $18.7 million in 2010. These changes were partially offset by a $23.1 million decrease in accounts receivable and accrued unbilled revenues in 2011, compared with a $23.5 million increase in 2010. These year‐over‐year working capital changes were largely driven by the impact of warmer weather at the end of 2011 compared to 2010.
‐ A $12.7 million year‐over‐year increase in cash used related to other current liabilities, primarily
the result of amounts accrued for decoupling at the end of 2010 that were refunded to customers during 2011, as well as activity related to other rate adjustment mechanisms.
• A $4.4 million increase in contributions to other postretirement benefit plans. • Partially offsetting these decreases was an increase in net income, adjusted for non‐cash items.
2010 Compared with 2009 During 2010, net cash provided by operating activities was $178.8 million compared with $274.1 million during 2009. The $95.3 million year‐over‐year decrease in net cash provided by operating activities was largely driven by a decrease in cash provided by working capital of $111.3 million. The decrease was primarily driven by a $23.5 million increase in accounts receivable and accrued unbilled revenues during 2010, compared with a $117.5 million decrease in accounts receivable and accrued unbilled revenues during 2009, partially offset by a $55.3 million year‐over‐year decrease in cash used to pay accounts payable balances, all mainly due to changes in natural gas prices. Investing Cash Flows 2011 Compared with 2010 Net cash used for investing activities increased $73.0 million, from $67.7 million during 2010, to $140.7 million during 2011. The increase was primarily due to: • A $57.8 million increase in cash used to fund capital expenditures primarily due to our AMRP. • Net related party loans to NSG of $8.9 million in 2011, compared with net payments received from
NSG of $7.6 million in 2010.

‐ 22 ‐
2010 Compared with 2009 Net cash used for investing activities decreased $16.0 million, from $83.7 million during 2009, to $67.7 million during 2010, primarily due to a related party loan of $7.6 million to NSG in 2009 that was repaid to us in 2010. Financing Cash Flows 2011 Compared with 2010 Net cash used for financing activities was $15.2 million during 2011, compared with $114.0 million during 2010. The $98.8 million decrease in net cash used for financing activities was driven by: • A $49.0 million decrease driven by $1.0 million of net repayments of long‐term debt in 2011,
compared with $50.0 million of net repayments of long‐term debt in 2010. • A $53.2 million decrease due to $37.0 million of net borrowings of short‐term debt in 2011,
compared with $16.2 million of net repayments of short‐term debt in 2010. 2010 Compared with 2009 Net cash used for financing activities decreased $73.5 million, from $187.5 million during 2009, to $114.0 million during 2010, primarily driven by the repayment of $250.0 million of commercial paper borrowings in 2009. This decrease in net cash used was partially offset by: • The issuance of $75.0 million of long‐term debt in 2009. • The repayment of $50.0 million of long‐term debt that matured in March 2010. • A $44.4 million increase in dividends paid to our parent in 2010.
Significant Financing Activities For information on the issuance and redemption of our long‐term debt, see Note 7, "Long‐Term Debt." Credit Ratings We periodically issue long‐term debt in order to reduce short‐term debt, refinance maturing securities, maintain desired capitalization ratios, and fund future growth. The specific forms of long‐term financing, amounts, and timing depend on business needs, market conditions, and other factors. In addition, we have our own commercial paper borrowing program.

‐ 23 ‐
The following table lists our current credit ratings: Standard & Poor's Moody's Issuer credit rating A‐ A3 Senior secured debt A‐ A1 Commercial paper A‐2 P‐2
Credit ratings are not recommendations to buy or sell securities. They are subject to change, and each rating should be evaluated independently of any other rating. On January 24, 2012, Standard & Poor’s raised our issuer credit rating to "A‐" from "BBB+" and revised the outlook for us to "stable" from "positive." According to Standard & Poor's, the revised rating reflects their view that we have an excellent business risk profile and a significant financial risk profile. On May 27, 2010, Moody’s revised the outlook for Integrys Energy Group and all of its subsidiaries to "stable" from "negative." According to Moody’s, the revised outlook reflected a reduced business risk profile driven by the recently completed restructuring of Integrys Energy Group’s nonregulated operations into a smaller segment with significantly reduced collateral requirements. Moody’s also raised our senior secured debt rating from "A2" to "A1." According to Moody’s, the upgrade follows the August 2009 upgrade of the senior secured ratings of the majority of its investment grade regulated utilities (issuers with negative outlooks were excluded from the August 2009 upgrade). Future Capital Requirements and Resources Contractual Obligations The following table shows our contractual obligations as of December 31, 2011, including those of our subsidiary. Payments Due By Period
(Millions) Total Amounts Committed 2012
2013 to 2014
2015 to 2016
2017 and Thereafter
Long‐term debt principal and interest payments (1) $ 818.2 $ 22.3 $155.1 $ 81.1 $559.7 Commodity purchase obligations (2) 195.5 56.7 67.4 49.1 22.3 Purchase orders (3) 114.8 114.8 ‐ ‐ ‐ Pension and other postretirement funding obligations (4) 377.0 86.7 20.3 27.0 243.0
Total contractual cash obligations $1,505.5 $280.5 $242.8 $157.2 $825.0 (1) Represents bonds issued. We record all principal obligations on the balance sheet. (2) The costs of commodity purchase obligations are expected to be recovered in future customer rates. (3) Includes obligations related to normal business operations and large construction obligations. (4) Obligations for pension and other postretirement benefit plans, other than the Integrys Energy Group
Retirement Plan, cannot reasonably be estimated beyond 2014.

‐ 24 ‐
The table above does not reflect payments related to the manufactured gas plant remediation liability of $445.0 million at December 31, 2011, as the amount and timing of payments are uncertain. We expect to incur costs annually to remediate these sites. See Note 10, "Commitments and Contingencies," for more information about environmental liabilities. Capital Requirements As of December 31, 2011, our capital expenditures for the three‐year period 2012 through 2014 were expected to be $699.9 million. The largest of these expenditures relates to the AMRP. The AMRP is a 20‐year project that began in 2011 under which we are accelerating the replacement of our cast iron and ductile iron pipes with steel and polyethylene pipes. All projected capital and investment expenditures are subject to periodic review and may vary significantly from the estimates, depending on a number of factors. These factors include, but are not limited to, industry restructuring, regulatory constraints and requirements, changes in tax laws and regulations, market volatility, and economic trends. Capital Resources Management prioritizes the use of capital and debt capacity, determines cash management policies, uses risk management policies to hedge the impact of volatile commodity prices, and makes decisions regarding capital requirements in order to manage the liquidity and capital resource needs of the business segments. We plan to meet our capital requirements for the period 2012 through 2014 primarily through internally generated funds (net of forecasted dividend payments), debt financings, and equity infusions. We plan to keep debt to equity ratios at levels that can support current credit ratings and corporate growth. The recent ICC final order reduced the allowed common equity ratio from 56% to 49%. We intend to adjust our common equity ratio to be more closely aligned with the ratio allowed in the ICC final order. See Note 17, “Regulatory Environment”, for more information. We believe we have adequate financial flexibility and resources to meet our future needs. We have the ability to borrow up to $150.0 million from PELLC and up to $50.0 million from NSG. At December 31, 2011, PGL had no borrowings outstanding with PELLC or NSG. At December 31, 2011, we were in compliance with all covenants related to outstanding short‐term and long‐term debt. We expect to be in compliance with all such debt covenants for the foreseeable future. See Note 6, "Short‐Term Debt and Lines of Credit," for more information on credit facilities and other short‐term credit agreements, including short‐term debt covenants. See Note 7, "Long‐Term Debt," for more information on long‐term debt and related covenants. Other Future Considerations Decoupling Decoupling for residential and small commercial and industrial sales was approved by the ICC on a four‐year trial basis for us, effective March 1, 2008. Decoupling allows us to adjust future rates to recover or refund the differences between the actual and authorized margin per customer impact of variations in

‐ 25 ‐
volumes. The pilot mechanism did not adjust for variations in volumes resulting from changes in customer count compared to rate case levels, nor did it cover all customer classes. Interveners, including the Illinois Attorney General, oppose decoupling and have appealed the ICC's approval. We actively support the ICC's decision to approve decoupling. In our rate order approved on January 10, 2012, the ICC made the decoupling mechanism (based on total margin) permanent. The appeal of the original decoupling order is pending and, depending on the outcome, could impact the current rate order provision for decoupling. See Note 17, "Regulatory Environment," for more information. Federal Health Care Reform In March 2010, the Patient Protection and Affordable Care Act and the Health Care and Education Reconciliation Act of 2010 (HCR) were signed into law. HCR contains various provisions that will affect the cost of providing health care coverage to our active and retired employees and their dependents. Although these provisions become effective at various times over the next 10 years, some provisions that affect the cost of providing benefits to retirees were reflected in our financial statements in 2010 and 2011.
Beginning in 2013, a provision of HCR will eliminate the tax deduction for employer‐paid postretirement prescription drug charges to the extent those charges will be offset by the receipt of a federal Medicare Part D subsidy. As a result, we eliminated $5.3 million of our deferred tax asset related to postretirement benefits in 2010, all of which flowed through to net income as a component of income tax expense in 2010. In the fourth quarter of 2011, we recorded a regulatory asset of $5.3 million, reversing the amount previously expensed in 2010, as we were authorized recovery of this amount in the rate order approved on January 10, 2012. Other provisions of HCR include the elimination of certain annual and lifetime maximum benefits and the broadening of plan eligibility requirements. It also includes the elimination of pre‐existing condition restrictions, an excise tax on high‐cost health plans, changes to the Medicare Part D prescription drug program, and numerous other changes. We participate in the Early Retiree Reinsurance Program that became effective on June 1, 2010. We continue to assess the extent to which the provisions of the new law will affect our future health care and related employee benefit plan costs. Dodd‐Frank Wall Street Reform and Consumer Protection Act (Dodd‐Frank Act) The Dodd‐Frank Act was signed into law in July 2010. However, significant rulings essential to its framework still remain outstanding. Depending on the final rules, certain provisions of the Dodd‐Frank Act relating to derivatives could increase capital and/or collateral requirements. Final rules for these provisions are expected in the second quarter of 2012. We are monitoring developments related to this act and their impacts on our future financial results. Recent Tax Law Changes Federal In December 2010, President Obama signed into law The Tax Relief, Unemployment Insurance Reauthorization, and Job Creation Act of 2010. This act includes tax incentives, such as an extension and increase of bonus depreciation, the extension of the research and experimentation credit, and the extension of treasury grants in lieu of claiming the investment tax credit for certain renewable energy

‐ 26 ‐
investments. In September 2010, President Obama signed into law the Small Business Jobs Act of 2010. This act includes tax incentives, such as an extension to bonus depreciation and changes to listed property, that affect us. We anticipate that these tax law changes will likely result in $70.0 million to $90.0 million of reduced cash payments for taxes during 2012. These tax incentives may also reduce utility rate base and, thus, future earnings relative to prior expectations. We have primarily used the proceeds from these incentives to make incremental contributions to our various employee benefit plans. In addition, these tax incentives have helped reduce our financing needs. Illinois In January 2011, Governor Quinn signed into law the Taxpayer Accountability and Budget Stabilization Act. This act increased the corporate combined income tax rate from 7.3% to 9.5% retroactive to January 1, 2011. The rate decreases to 7.75% after 2014 and returns to 7.3% after 2024. We adjusted deferred taxes to reflect the changes in the tax rate in the first quarter of 2011. Due to the effects of regulation, and the timing of the January 10, 2012 rate order, we do not expect a material impact on income from this legislation.
CRITICAL ACCOUNTING POLICIES The following accounting policies have been determined to be critical to the understanding of our financial statements because their application requires significant judgment and reliance on estimations of matters that are inherently uncertain. Our management has discussed these critical accounting policies with the Audit Committee of the Board of Directors of Integrys Energy Group. Accrued Unbilled Revenues We accrue estimated amounts of revenues for services provided or energy delivered but not yet billed to customers. Estimated unbilled revenues are calculated using a variety of judgments and assumptions related to customer class or contracted rates. Significant changes in these judgments and assumptions could have a material impact on our results of operations. At December 31, 2011 and 2010, our unbilled revenues were $84.4 million and $110.0 million, respectively. The amount of unbilled revenues can vary significantly from period to period as a result of numerous factors, including seasonality, weather, customer usage patterns, commodity prices, and customer mix. Pension and Other Postretirement Benefits The costs of providing non‐contributory defined benefit pension benefits and other postretirement benefits, described in Note 11, "Employee Benefit Plans," are dependent upon numerous factors resulting from actual plan experience and assumptions regarding future experience.
Pension and other postretirement benefit costs are impacted by actual employee demographics (including age, compensation levels, and employment periods), the level of contributions made to the plans, and earnings on plan assets. Pension and other postretirement benefit costs may be significantly affected by changes in key actuarial assumptions, including anticipated rates of return on plan assets, discount rates, and expected health care cost trends. Changes made to the plan provisions may also impact current and future pension and other postretirement benefit costs.

‐ 27 ‐
Pension and other postretirement benefit plan assets are primarily made up of equity and fixed income investments. Fluctuations in actual equity and fixed income market returns, as well as changes in general interest rates, may result in increased or decreased benefit costs in future periods. Management believes that such changes in costs would be recovered through the ratemaking process. The following table shows how a given change in certain actuarial assumptions would impact the projected benefit obligation and the reported net periodic pension cost. Each factor below reflects an evaluation of the change based on a change in that assumption only.
Actuarial Assumption (Millions, except percentages)
Percentage‐Point Change in Assumption
Impact on Projected Benefit
Obligation Impact on 2011 Pension Cost
Discount rate (0.5) $37.3 $3.3 Discount rate 0.5 (33.9) (3.1) Rate of return on plan assets (0.5) N/A 1.8 Rate of return on plan assets 0.5 N/A (1.8)
The following table shows how a given change in certain actuarial assumptions would impact the accumulated other postretirement benefit obligation and the reported net periodic other postretirement benefit cost. Each factor below reflects an evaluation of the change based on a change in that assumption only.
Actuarial Assumption (Millions, except percentages)
Percentage‐Point Change in Assumption
Impact on Postretirement
Benefit Obligation
Impact on 2011 Postretirement Benefit Cost
Discount rate (0.5) $ 9.1 $0.3 Discount rate 0.5 (8.6) (0.3) Health care cost trend rate (1.0) (15.1) (1.8) Health care cost trend rate 1.0 17.4 2.6 Rate of return on plan assets (0.5) N/A 0.2 Rate of return on plan assets 0.5 N/A (0.2)
The discount rates are selected based on hypothetical bond portfolios consisting of non‐callable (or callable with make‐whole provisions), non‐collateralized, high‐quality corporate bonds with maturities between 0 and 30 years. The bonds are generally rated "Aa" with a minimum amount outstanding of $50 million. From the hypothetical bond portfolios, a single rate is determined that equates the market value of the bonds purchased to the discounted value of the plans' expected future benefit payments. The expected return on asset assumption is based on consideration of historical and projected asset class returns, as well as the target allocations of the benefit trust portfolios. The assumed long‐term rate of return was 8.25% in 2011 and 8.50% in 2010 and 2009. For 2010, 2009, and 2008, the actual rates of return on pension plan assets, net of fees, were 1.7%, 12.9%, and 22.0%, respectively. The determination of expected return on qualified plan assets is based on a market‐related valuation of assets, which reduces year‐to‐year volatility. Cumulative gains and losses in excess of 10% of the greater of the pension or other postretirement benefit obligation or market‐related value are amortized over the average remaining future service to expected retirement ages. The difference between the expected return and the actual return on pension plan assets is recognized over a five‐year period for

‐ 28 ‐
purposes of calculating benefit cost. In addition, the expected return on plan assets, which is a component of cost, is applied to the market‐related value of plan assets. Because of this method, the future value of assets used in the cost calculations will be impacted as previously deferred gains or losses are included in market‐related value. In selecting assumed health care cost trend rates, past performance and forecasts of health care costs are considered. For more information on health care cost trend rates and a table showing future payments that we expect to make for pension and other postretirement benefits, see Note 11, "Employee Benefit Plans ." Regulatory Accounting We follow the guidance under the Regulated Operations Topic of the FASB ASC. Our financial statements reflect the effects of the ratemaking principles followed by the ICC. Certain items that would otherwise be immediately recognized as revenues and expenses are deferred as regulatory assets and regulatory liabilities for future recovery or refund to customers, as authorized by the ICC. Future recovery of regulatory assets is not assured, and is generally subject to review by the ICC in rate proceedings for matters such as prudence and reasonableness. Management regularly assesses whether these regulatory assets and liabilities are probable of future recovery or refund by considering factors such as changes in the regulatory environment, our earnings, and the status of any pending or potential deregulation legislation. Once approved, the regulatory assets and liabilities are amortized into earnings over the rate recovery period. If recovery or refund of costs is not approved or is no longer deemed probable, these regulatory assets or liabilities are recognized in current period earnings. The application of the Regulated Operations Topic of the FASB ASC would be discontinued if all or a separable portion of our natural gas utility operations no longer meet the criteria for application. Assets and liabilities recognized as a result of rate regulation would be written off as extraordinary items in income for the period in which the discontinuation occurred. A write‐off of all of our regulatory assets and regulatory liabilities at December 31, 2011, would result in a 29.1% decrease in total assets and a 2.3% decrease in total liabilities. The two largest regulatory assets at December 31, 2011, related to environmental remediation costs and unrecognized pension and other postretirement benefit related costs. A write‐off of the regulatory asset related to environmental remediation costs at December 31, 2011, would result in a 14.0% decrease in total assets. A write‐off of the unrecognized pension and other postretirement benefit related regulatory asset at December 31, 2011, would result in an 8.4% decrease in total assets. See Note 5, "Regulatory Assets and Liabilities," for more information. Income Tax Provision We are required to estimate income taxes for each of the jurisdictions in which we operate as part of the process of preparing consolidated financial statements. This process involves estimating current income tax liabilities together with assessing temporary differences resulting from differing treatment of items, such as depreciation, for income tax and accounting purposes. These differences result in deferred income tax assets and liabilities, which are included within our balance sheets. We also assess the likelihood that our deferred income tax assets will be recovered through future taxable income. To the extent we believe that realization is not likely, we establish a valuation allowance, which is offset by an adjustment to the provision for income taxes in the income statements.
‐ 29 ‐
Uncertainty associated with the application of tax statutes and regulations and the outcomes of tax audits and appeals requires that judgments and estimates be made in the accrual process and in the calculation of effective tax rates. Only income tax benefits that meet the "more likely than not" recognition threshold may be recognized or continue to be recognized. Unrecognized tax benefits are re‐evaluated quarterly and changes are recorded based on new information, including the issuance of relevant guidance by the courts or tax authorities and developments occurring in the examinations of our tax returns. Significant management judgment is required in determining our provision for income taxes, deferred income tax assets and liabilities, the liability for unrecognized tax benefits, and any valuation allowance recorded against deferred income tax assets. The assumptions involved are supported by historical data, reasonable projections, and interpretations of applicable tax laws and regulations across multiple taxing jurisdictions. Significant changes in these assumptions could have a material impact on our financial condition and results of operations. See Note 1(m), "Summary of Significant Accounting Policies – Income Taxes," and Note 9, "Income Taxes," for a discussion of accounting for income taxes.
IMPACT OF INFLATION
Our financial statements are prepared in accordance with GAAP. The statements provide a reasonable, objective, and quantifiable statement of financial results, but generally do not evaluate the impact of inflation. To the extent we are not recovering the effects of inflation, we will file rate cases as necessary.

‐ 30 ‐
QUANTITATIVE AND QUALITATIVE DISCLOSURES ABOUT MARKET RISK Market Risks and Other Significant Risks We have potential market risk exposure related to commodity price risk and equity return and principal preservation risk. We have risk management policies in place to monitor and assist in controlling these risks and use derivative instruments to manage some of these exposures. Commodity Price Risk Exposure to commodity price risk results from the impact of market fluctuations on the price of natural gas used by our operations. The following table summarizes the changes in valuation of all outstanding derivative contracts (natural gas swaps) used to manage the commodity price risk associated with the purchase of natural gas for use in our operations during 2011. Valuations are based on the closing prices for the respective NYMEX Henry Hub futures contracts, and on the closing prices published in various commodity pricing publications for the geographical differential between a specific location price and the NYMEX Henry Hub futures contract closing price, where applicable. (Millions) Value of contracts at December 31, 2010 $(1.0) Less: Loss on contracts realized or otherwise settled during the period (1.2) Plus: Unrealized loss on new contracts entered into during the period and outstanding at December 31, 2011 (1.1) Plus: Other unrealized loss, primarily changes in market prices for contracts outstanding at December 31, 2010 (0.2) Value of contracts at December 31, 2011 $(1.1)
Generally, these cash flow hedge contracts are held to maturity, which coincides with recognition of the transactions being hedged (anticipated cost of purchases), thereby achieving the realization of prices contemplated by the underlying risk management strategies. The following table shows outstanding derivative contracts at December 31, 2011: Maturity
Volumes (Millions of therms)
Fair Value (Millions)
Less than 1 Year 5.2 $(0.9) 1 to 3 Years 2.9 (0.2) Total 8.1 $(1.1) Equity Return and Principal Preservation Risk We currently fund liabilities related to employee benefits through various external trust funds. The trust funds are managed by numerous investment managers and hold investments in debt and equity securities. Changes in the market value of these investments can have an impact on the future expenses related to these liabilities. Declines in the equity markets or declines in interest rates may result in increased future costs for the plans and require additional contributions into the plans. We monitor the trust funds' portfolios by benchmarking the performance of the investments against certain security indices. The employee benefit costs are recovered in customers' rates, reducing the equity return and principal preservation risk on these exposures. Also, the likelihood of an increase in the employee benefit obligations, which the investments must fund, has been partially mitigated as a result of certain employee groups no longer being eligible to participate in, or accumulate benefits in, certain pension and other postretirement benefit plans. Our defined pension benefit plans are closed to all new hires.
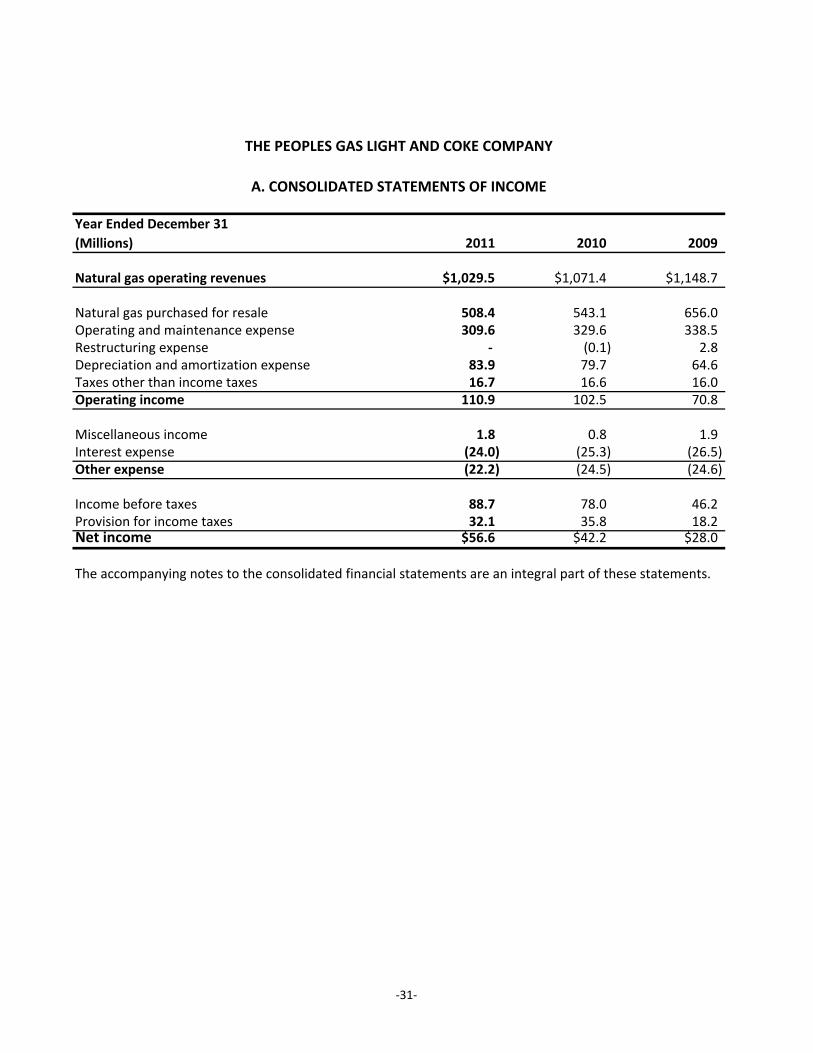
Year Ended December 31(Millions) 2011 2010 2009
Natural gas operating revenues $1,029.5 $1,071.4 $1,148.7
Natural gas purchased for resale 508.4 543.1 656.0 Operating and maintenance expense 309.6 329.6 338.5 Restructuring expense ‐ (0.1) 2.8 Depreciation and amortization expense 83.9 79.7 64.6 Taxes other than income taxes 16.7 16.6 16.0 Operating income 110.9 102.5 70.8
Miscellaneous income 1.8 0.8 1.9 Interest expense (24.0) (25.3) (26.5) Other expense (22.2) (24.5) (24.6)
Income before taxes 88.7 78.0 46.2 Provision for income taxes 32.1 35.8 18.2 Net income $56.6 $42.2 $28.0
The accompanying notes to the consolidated financial statements are an integral part of these statements.
THE PEOPLES GAS LIGHT AND COKE COMPANY
A. CONSOLIDATED STATEMENTS OF INCOME
‐31‐

At December 31(Millions) 2011 2010
AssetsCash and cash equivalents $4.5 $0.5Accounts receivable and accrued unbilled revenues, net of reserves of $34.7 and $24.8, respectively 199.9 239.4Receivables from related parties 0.6 2.5Notes receivable from related parties 8.9 ‐Natural gas in storage, at LIFO 83.2 76.8Regulatory assets 44.7 31.9Prepaid taxes 2.5 29.1Other current assets 42.1 22.7Current assets 386.4 402.9
Property, plant, and equipment, net of accumulated depreciation of $1,098.1 and $1,073.8, respectively 1,920.5 1,745.1Regulatory assets 886.1 822.5Other long‐term assets 6.4 16.9Total assets $3,199.4 $2,987.4
Liabilities and Shareholder's EquityShort‐term debt $37.0 $ ‐Accounts payable 114.6 116.0Payables to related parties 16.9 32.0Liabilities from risk management activities 25.6 17.2Accrued taxes 44.8 58.4Customer deposits 26.7 28.2Customer credit balances 33.1 37.7Regulatory liabilities 39.6 47.7Other current liabilities 19.7 21.8Current liabilities 358.0 359.0
Long‐term debt 524.5 525.5Long‐term payables to related parties ‐ 0.5Deferred income taxes 449.3 386.5Deferred investment tax credits 22.0 22.1Environmental remediation liabilities 445.0 450.5Pension and other postretirement benefit obligations 303.3 244.7Asset retirement obligations 356.5 278.1Other long‐term liabilities 41.8 27.9Long‐term liabilities 2,142.4 1,935.8
Commitments and contingencies
Common stock ‐ without par value, 40,000,000 shares authorized; 25,357,566 shares issued and outstanding 219.7 219.1Retained earnings 480.0 474.1Accumulated other comprehensive loss (0.7) (0.6)Total liabilities and shareholder's equity $3,199.4 $2,987.4
The accompanying notes to the consolidated financial statements are an integral part of these statements.
THE PEOPLES GAS LIGHT AND COKE COMPANY
B. CONSOLIDATED BALANCE SHEETS
‐32‐

At December 31(Millions, except share amounts) 2011 2010
Common stock equityCommon stock, without par value, 40,000,000 shares authorized,25,357,566 shares outstanding $219.7 $219.1
Retained earnings 480.0 474.1Accumulated other comprehensive loss (0.7) (0.6)Total common stock equity 699.0 692.6
Long‐term debtFixed First and Refunding Mortgage Bonds
Series Year DueKK 5.00% 2033 $50.0 $50.0NN‐2 4.625% 2013 75.0 75.0QQ 4.875% 2038 Adjustable after November 1, 2018 75.0 75.0RR 4.30% 2035 Adjustable after June 1, 2016 50.0 50.0SS 7.00% 2013 45.0 45.0TT 8.00% 2018 5.0 5.0UU 4.63% 2019 75.0 75.0VV 2.125% 2030 Mandatory interest reset date on July 1, 2014 50.0 50.0WW 2.625% 2033 Mandatory interest reset date on August 1, 2015 50.0 50.0XX 2.21% 2016 50.0 ‐
Adjustable First and Refunding Mortgage BondsOO 2037 ‐ 51.0
Total 525.0 526.0Unamortized discount on long‐term debt, net (0.5) (0.5)Total long‐term debt 524.5 525.5Total capitalization $1,223.5 $1,218.1
The accompanying notes to the consolidated financial statements are an integral part of these statements.
THE PEOPLES GAS LIGHT AND COKE COMPANY
C. CONSOLIDATED STATEMENTS OF CAPITALIZATION
‐33‐

Accumulated OtherComprehensive
LossComprehensive Common Retained Cash Flow
(Millions) Income (Loss) Total Stock Earnings Hedges
Balance at December 31, 2008 $666.4 $219.2 $448.3 $(1.1)Net income $28.0 28.0 ‐ 28.0 ‐ Other comprehensive income ‐ unrealized hedge gain (net of tax of $0.5) 0.8 0.8 ‐ ‐ 0.8 Comprehensive income 28.8
Balance at December 31, 2009 $695.2 $219.2 $476.3 $(0.3)Net income $42.2 42.2 ‐ 42.2 ‐ Other comprehensive loss ‐ unrealized hedge loss (net of tax of $0.2) (0.3) (0.3) ‐ ‐ (0.3) Comprehensive income 41.9 Dividends on common stock (44.4) ‐ (44.4) ‐ Other (0.1) (0.1) ‐ ‐
Balance at December 31, 2010 $692.6 $219.1 $474.1 $(0.6)Net income $56.6 56.6 ‐ 56.6 ‐ Other comprehensive income ‐ unrealized hedge gain (0.1) (0.1) ‐ ‐ (0.1) Comprehensive income 56.5 Dividends on common stock (50.6) ‐ (50.6) ‐ Other 0.5 0.6 (0.1) ‐
Balance at December 31, 2011 $699.0 $219.7 $480.0 $(0.7)
The accompanying notes to the consolidated financial statements are an integral part of these statements.
THE PEOPLES GAS LIGHT AND COKE COMPANY
D. CONSOLIDATED STATEMENTS OF COMMON SHAREHOLDER'S EQUITY
‐34‐

Year Ended December 31(Millions) 2011 2010 2009Operating ActivitiesNet income $56.6 $42.2 $28.0Adjustments to reconcile net income to cash provided by operating activities
Depreciation and amortization expense 83.9 79.7 64.6 Bad debt expense 24.7 37.8 30.5 Pension and other postretirement expense 17.7 17.8 30.1 Pension and other postretirement contributions (23.2) (18.8) (17.9) Deferred income taxes and investment tax credits 46.1 17.4 20.2 Recoveries and refunds of other regulatory assets and liabilities 10.7 13.4 26.3 Other (2.3) 1.2 (7.1)
Changes in working capital Collateral on deposit ‐ ‐ 25.3 Accounts receivable and accrued unbilled revenues 23.1 (23.5) 117.5
Natural gas in storage, at LIFO (6.4) 18.7 12.1 Prepaid taxes 23.3 7.5 (7.7) Other current assets (6.4) (3.6) (0.6) Accounts payable (49.4) (2.3) (57.6) Accrued taxes (12.3) 2.9 (3.0) Customer credit balances (4.6) (2.7) 2.7 Other current liabilities (21.6) (8.9) 10.7
Net cash provided by operating activities $159.9 $178.8 $274.1
Investing ActivitiesCapital expenditures (134.0) (76.2) (76.8) Proceeds from the sale or disposal of assets 1.0 0.5 0.7 Note receivable from related party (8.9) 7.6 (7.6) Other 1.2 0.4 ‐ Net cash used for investing activities $(140.7) $(67.7) $(83.7)
Financing ActivitiesShort‐term debt, net 37.0 ‐ (250.0) Related party short‐term debt, net ‐ (16.2) (12.3) Issuance of long‐term debt 50.0 ‐ 75.0 Repayment of long‐term debt (51.0) (50.0) ‐ Dividends to parent (50.6) (44.4) ‐ Other (0.6) (3.4) (0.2) Net cash used for financing activities (15.2) (114.0) (187.5)
Net change in cash and cash equivalents 4.0 (2.9) 2.9 Cash and cash equivalents at beginning of year 0.5 3.4 0.5 Cash and cash equivalents at end of year $4.5 $0.5 $3.4
The accompanying notes to the consolidated financial statements are an integral part of these statements.
THE PEOPLES GAS LIGHT AND COKE COMPANY
E. CONSOLIDATED STATEMENTS OF CASH FLOWS
‐35‐
‐ 36 ‐
F. NOTES TO CONSOLIDATED FINANCIAL STATEMENTS NOTE 1—SUMMARY OF SIGNIFICANT ACCOUNTING POLICIES (a) Nature of Operations—We are a regulated natural gas utility company that purchases, stores, distributes, sells, and transports natural gas to customers in Chicago. We are subject to the jurisdiction of, and regulation by, the ICC, which has general supervisory and regulatory powers over public utilities in Illinois, and the FERC, which regulates the interstate services we provide. At December 31, 2011, we had one wholly owned subsidiary, Peoples Gas Neighborhood Development Corporation. As used in these notes, the term “financial statements” refers to the consolidated financial statements. This includes the consolidated statements of income, consolidated balance sheets, consolidated statements of capitalization, consolidated statements of common shareholder’s equity, and consolidated statements of cash flows, unless otherwise noted. The term "utility" refers to our regulated activities, while the term "nonutility" refers to our activities that are not regulated, as well as the activities of our subsidiary. (b) Consolidated Basis of Presentation—The financial statements include our accounts and the accounts of our wholly owned subsidiary, after eliminating intercompany transactions and balances. (c) Reclassifications—We reclassified $4.7 million reported in other current assets at December 31, 2010, to prepaid taxes to match the current year presentation on the balance sheet. (d) Use of Estimates—We prepare our financial statements in conformity with accounting principles generally accepted in the United States of America. We make estimates and assumptions that affect assets, liabilities, the disclosure of contingent assets and liabilities at the date of the financial statements, and the reported amounts of revenues and expenses during the reporting period. Actual results may differ from these estimates. (e) Cash and Cash Equivalents—Short‐term investments with an original maturity of three months or less are reported as cash equivalents. The following is supplemental disclosure to our statements of cash flows:
(Millions) 2011 2010 2009 Cash paid for interest $21.7 $24.7 $24.9 Cash (received) paid for income taxes (27.7) 11.7 3.3
Construction costs funded through accounts payable and treated as noncash investing activities totaled $38.2 million, $5.3 million, and $2.7 million at December 31, 2011, 2010, and 2009, respectively. In 2010, $100.0 million of First Mortgage Bonds were issued to redeem $100.0 million of First and Refunding Mortgage Bonds. This transaction was treated as noncash financing activities.

‐ 37 ‐
(f) Revenues and Customer Receivables—Revenues related to the sale of natural gas are recognized when service is provided or natural gas is delivered to customers and include estimated amounts for services provided but not billed. At December 31, 2011 and 2010, our unbilled revenues were $84.4 million and $110.0 million, respectively. At December 31, 2011, there were no customers or industries that accounted for more than 10% of our revenues. We present revenues net of pass‐through taxes on the income statements. We have various rate‐adjustment mechanisms in place that currently provide for the recovery of prudently incurred natural gas costs, which allow subsequent adjustments to rates for changes in commodity costs. Other mechanisms also allow recovery for environmental costs, bad debts, and energy conservation and management programs. A summary of significant rate‐adjustment mechanisms follows:
• Our rates include a one‐for‐one recovery mechanism for natural gas commodity costs. • Our rates include riders for cost recovery of both environmental cleanup and energy
conservation and management program costs. • Our rates include a rider for cost recovery or refund of bad debts based on the difference
between actual bad debt expense and the amount recovered in rates. • Our rates include a decoupling mechanism, which allows us to adjust our rates going forward to
recover or refund the differences between the actual and authorized margin. Revenues are also impacted by other accounting policies related to our natural gas hub. Amounts collected from wholesale customers that use our natural gas hub are credited to natural gas costs, resulting in a reduction to retail customers’ charges for natural gas and services. (g) Natural Gas in Storage—We price storage injections at the calendar year average of the costs of natural gas supply purchased. Withdrawals from storage are priced on the LIFO cost method. The estimated replacement cost of our natural gas in inventory at December 31, 2011, and December 31, 2010, exceeded the LIFO cost by approximately $53.8 million and $114.8 million, respectively. In calculating these replacement amounts, we used a Chicago city‐gate natural gas price per dekatherm of $3.06 at December 31, 2011, and $4.42 at December 31, 2010. (h) Risk Management Activities—As part of our regular operations, we enter into contracts, including options, forwards, and swaps, to manage changes in commodity prices, which are described more fully in Note 2, "Risk Management Activities." All derivatives are recognized on the balance sheets at their fair value unless they are designated as and qualify for the normal purchases and sales exception. We continually assess our contracts designated as normal and will discontinue the treatment of these contracts as normal if the required criteria are no longer met. Our tariffs allow for full recovery from our customers of prudently incurred natural gas supply costs, including gains or losses on these derivative instruments. These derivatives are marked to fair value; the resulting risk management assets are offset with regulatory liabilities or decreases to regulatory assets, and risk management liabilities are offset with regulatory assets or decreases to regulatory liabilities. Management believes any gains or losses resulting from the eventual settlement of these derivative instruments will be refunded to or collected from customers in rates. We also have derivative contracts to manage the risk associated with the purchase of natural gas used in our own operations. These contracts are designated as cash flow hedges. To the extent they are

‐ 38 ‐
effective, the changes in the values of contracts designated as cash flow hedges are included in other comprehensive income, net of taxes. Cash flow hedge ineffectiveness is recorded in operating and maintenance expense on the statements of income. Derivative accounting rules provide the option to present certain asset and liability derivative positions net on the balance sheets and to net the related cash collateral against these net derivative positions. During 2011, we changed our policy to conform with our parent and elected not to net these items. On the balance sheets, cash collateral provided to others is reflected in other current assets. We have risk management contracts with various counterparties. We monitor credit exposure levels and the financial condition of our counterparties on a continuous basis to minimize credit risk. At December 31, 2011, we did not have risk management contracts with any one counterparty or industry that accounted for more than 10% of our total credit risk exposure. (i) Property, Plant, and Equipment—Utility plant is stated at cost, including any associated allowance for funds used during construction and asset retirement costs. The costs of renewals and betterments of units of property (as distinguished from minor items of property) are capitalized as additions to the utility plant accounts. Except for land, no gains or losses are recognized in connection with ordinary retirements of utility property units. We charge the cost of units of property retired, sold, or otherwise disposed of, less salvage value, to accumulated depreciation. In addition, we record a regulatory liability for cost of removal accruals, which are included in rates. Actual removal costs are charged against the regulatory liability as incurred. Maintenance, repair, replacement, and renewal costs associated with items not qualifying as units of property are considered operating expenses. We record straight‐line depreciation expense over the estimated useful life of utility property, using depreciation rates as approved by the ICC. Our annual utility composite depreciation rates were 3.2%, 3.1%, and 2.3% for 2011, 2010, and 2009, respectively. We capitalize certain costs related to software developed or obtained for internal use and amortize those costs to operating expense over the estimated useful life of the related software, which ranges from 3 to 15 years. If software is retired prior to being fully amortized, the difference is recorded as a loss on the income statements. See Note 4, "Property, Plant, and Equipment," for details regarding our property, plant, and equipment balances. (j) Regulatory Assets and Liabilities—Regulatory assets represent probable future revenue associated with certain costs or liabilities that have been deferred and are expected to be recovered from customers through the ratemaking process. Regulatory liabilities represent amounts that are expected to be refunded to customers in future rates or amounts collected in rates for future costs. If at any reporting date a previously recorded regulatory asset is no longer probable of recovery, the regulatory asset is reduced to the amount considered probable of recovery with the reduction charged to expense in the year the determination is made. See Note 5, "Regulatory Assets and Liabilities," for more information. (k) Retirement of Debt—Any call premiums or unamortized expenses associated with refinancing utility debt obligations are amortized consistent with regulatory treatment of those items. Any gains or

‐ 39 ‐
losses resulting from the retirement of utility debt that is not refinanced are amortized over the remaining life of the original debt. (l) Asset Retirement Obligations—We recognize at fair value legal obligations associated with the retirement of tangible long‐lived assets that result from the acquisition, construction or development, and/or normal operation of the assets. A liability is recorded for these obligations as long as the fair value can be reasonably estimated, even if the timing or method of settling the obligation is unknown. The asset retirement obligations are accreted using a credit‐adjusted risk‐free interest rate commensurate with the expected settlement dates of the asset retirement obligations; this rate is determined at the date the obligation is incurred. The associated retirement costs are capitalized as part of the related long‐lived assets and are depreciated over the useful lives of the assets. Subsequent changes resulting from revisions to the timing or the amount of the original estimate of undiscounted cash flows are recognized as an increase or a decrease in the carrying amount of the liability and the associated retirement cost. See Note 8, "Asset Retirement Obligations," for more information. (m) Income Taxes—We and our subsidiary are included in the consolidated United States income tax return filed by Integrys Energy Group. We and our subsidiary are parties to a federal and state tax allocation arrangement with Integrys Energy Group and its subsidiaries under which each entity determines its provision for income taxes on a stand‐alone basis. We settle the intercompany liabilities at the time that payments are made to the applicable taxing authority. At December 31, 2011, there were no significant intercompany payables or receivables for income taxes. Deferred income taxes have been recorded to recognize the expected future tax consequences of events that have been included in the financial statements by using currently enacted tax rates for the differences between the income tax basis of assets and liabilities and the basis reported in the financial statements. We record valuation allowances for deferred income tax assets when it is uncertain if the benefit will be realized in the future. We defer certain adjustments made to income taxes that will impact future rates and record regulatory assets or liabilities related to these adjustments. We use the deferral method of accounting for investment tax credits (ITCs). Under this method, we record the ITCs as deferred credits and amortize such credits as a reduction to the provision for income taxes over the life of the asset that generated the ITCs. Investment tax credits that do not reduce income taxes payable for the current year are eligible for carryover and recognized as a deferred income tax asset. A valuation allowance is established unless it is more likely than not that the credits will be realized during the carryforward period. We report interest and penalties accrued related to income taxes as a component of provision for income taxes in the income statements. For more information regarding our accounting for income taxes, see Note 9, "Income Taxes." (n) Employee Benefits—The costs of pension and other postretirement benefits are expensed over the period during which employees render service. Effective with new rates implemented in 2010, we reflect pension and other postretirement benefit costs in rates using Integrys Energy Group’s basis in the related plan assets and obligations and method of determining these costs, which Integrys Energy Group established at the time of the February 2007 PELLC merger. In addition, the cumulative difference between our accounting basis and the accounting basis of Integrys Energy Group in our pension and postretirement benefit obligations is amortized as a component of our rates over the average remaining

‐ 40 ‐
service lives of the participating employees. In computing the expected return on pension plan assets, a market‐related value of plan assets is used that recognizes differences between actual investment returns and the expected return on plan assets over the subsequent five years. Our regulators allow recovery in rates for the net periodic benefit cost calculated under GAAP. We recognize the funded status of defined benefit postretirement plans on the balance sheet, and recognize changes in the plans' funded status in the year in which the changes occur. We record changes in the funded status to regulatory asset or liability accounts, pursuant to the Regulated Operations Topic of the FASB ASC. We account for our participation in benefit plans sponsored by IBS and PELLC as multiple employer plans. Under affiliate agreements, we are responsible for our share of plan costs and obligations and are entitled to our share of plan assets; accordingly, we account for our pro rata share of the IBS and PELLC plans as our own plans. For more information on our employee benefits, see Note 11, "Employee Benefit Plans." (o) Fair Value—A fair value measurement is required to reflect the assumptions market participants would use in pricing an asset or liability based on the best available information. These assumptions include the risks inherent in a particular valuation technique (such as a pricing model) and the risks inherent in the inputs to the model. Transaction costs should not be considered in the determination of fair value. Fair value is the price that would be received to sell an asset or paid to transfer a liability in an orderly transaction between market participants at the measurement date (exit price). We use a mid‐market pricing convention (the mid‐point price between bid and ask prices) as a practical measure for valuing the majority of our derivative assets and liabilities. Fair value accounting rules provide a hierarchy that prioritizes the inputs used to measure fair value. The hierarchy gives the highest priority to unadjusted quoted prices in active markets for identical assets or liabilities (Level 1 measurement) and the lowest priority to unobservable inputs (Level 3 measurement). The three levels of the fair value hierarchy are defined as follows: Level 1 – Quoted prices are available in active markets for identical assets or liabilities as of the reporting date. Active markets are those in which transactions for the asset or liability occur in sufficient frequency and volume to provide pricing information on an ongoing basis. Level 2 – Pricing inputs are observable, either directly or indirectly, but are not quoted prices included within Level 1. Level 2 includes those financial instruments that are valued using external inputs within models or other valuation methodologies. Level 3 – Pricing inputs include significant inputs that are generally less observable from objective sources. These inputs may be used with internally developed methodologies that result in management's best estimate of fair value. Financial assets and liabilities are classified in their entirety based on the lowest level of input that is significant to the fair value measurement.

‐ 41 ‐
We determine fair value using a market‐based approach that uses observable market inputs where available, and internally developed inputs where observable market data is not readily available. For the unobservable inputs, consideration is given to the assumptions that market participants would use in valuing the asset or liability. These factors include not only the credit standing of the counterparties involved, but also the impact of our nonperformance risk on our liabilities. See Note 15, "Fair Value," for more information. (p) Subsequent Events—Subsequent events were evaluated for potential recognition or disclosure through March 5, 2012, which is the date the financial statements were available to be issued. (q) New Accounting Pronouncements—ASU 2011‐04, "Amendments to Achieve Common Fair Value Measurement and Disclosure Requirements in U.S. GAAP and International Financial Reporting Standards (IFRS)," was issued in May 2011. The amendments change the wording used to describe the requirements for measuring fair value and for disclosing information about fair value measurements. The amendments also clarify the intent concerning the application of existing fair value measurement requirements. This guidance is effective for our reporting period ending December 31, 2012. Management is currently evaluating the impact that the adoption of this standard will have on our financial statements. ASU 2011‐05, "Presentation of Comprehensive Income," was issued in June 2011. The guidance requires that the total of comprehensive income, the components of net income, and the components of OCI be presented either in a single continuous statement of comprehensive income or in two separate but consecutive statements. The FASB has deferred the requirement regarding the presentation of reclassification adjustments between OCI and net income on the face of the financial statements. This guidance is effective for our reporting period ending December 31, 2012, and is expected to change the format of our financial statements. ASU 2011‐11, Disclosures about Offsetting Assets and Liabilities," was issued in December 2011. The guidance requires enhanced disclosures about offsetting and related arrangements. This guidance is effective for our reporting period ending December 31, 2013. Management is currently evaluating the impact that the adoption of this standard will have on our financial statements. NOTE 2—RISK MANAGEMENT ACTIVITIES We use derivative instruments to manage commodity costs. The derivatives include natural gas purchase contracts as well as financial derivative contracts (commodity swaps and options) used to manage the risks associated with the market price volatility of natural gas supply costs and the costs of gasoline and diesel fuel used by our utility vehicles.

‐ 42 ‐
The following tables show our assets and liabilities from risk management activities: Balance Sheet December 31, 2011 (Millions) Presentation (1) Assets Liabilities Non‐hedge derivatives Natural gas contracts Current $8.4 $24.7 Natural gas contracts Other Long‐term ‐ 6.6 Cash flow hedges Natural gas contracts Other Current ‐ 0.9 Natural gas contracts Other Long‐term ‐ 0.2 Total commodity contracts Current $8.4 (2) $25.6 Total commodity contracts Other Long‐term $ ‐ $ 6.8
(1) All derivatives are recognized on the balance sheets at their fair value unless they qualify for the normal purchases and sales exception. We continually assess our contracts designated as normal and will discontinue the treatment of these contracts as normal if the required criteria are no longer met. We classify assets and liabilities from risk management activities as current or long‐term based on the maturities of the underlying contracts.
(2) This amount is reflected in other current assets on the balance sheets. December 31, 2010 Assets Liabilities (Millions)
Classification
Gross Derivative Position
Netting
Balance Sheet Presentation (1)
Gross Derivative Position
Netting
Balance Sheet Presentation (1)
Non‐hedge derivatives Natural gas contracts Current $1.3 $0.2 $1.1 $16.4 $0.2 $16.2 Natural gas contracts Other Long‐term 1.3 ‐ 1.3 1.1 ‐ 1.1Petroleum product contracts Current 0.1 ‐ 0.1 ‐ ‐ ‐Cash flow hedges Natural gas contracts Current ‐ ‐ ‐ 1.0 ‐ 1.0Total commodity contracts Current $1.4 $0.2 $1.2 (2) $17.4 $0.2 $17.2Total commodity contracts Other Long‐term $1.3 $ ‐ $1.3 $ 1.1 $ ‐ $ 1.1
(1) All derivatives are recognized on the balance sheets at their fair value unless they qualify for the normal purchases and
sales exception. We continually assess our contracts designated as normal and will discontinue the treatment of these contracts as normal if the required criteria are no longer met. We classify assets and liabilities from risk management activities as current or long‐term based on the maturities of the underlying contracts.
(2) This amount is reflected in other current assets on the balance sheets. Certain of our derivative and nonderivative commodity instruments contain provisions that could require "adequate assurance" in the event of a material change in our creditworthiness, or the posting of additional collateral for instruments in net liability positions, if triggered by a decrease in credit ratings. The aggregate fair value of all derivative instruments with credit risk related contingent features that were in a liability position at December 31, 2011, and December 31, 2010, was $32.3 million, and $18.4 million, respectively. At December 31, 2011, and December 31, 2010, we had not posted any cash collateral related to the credit risk related contingent features of these commodity instruments. If all of the credit risk related contingent features contained in commodity derivative instruments had been triggered at December 31, 2011, and December 31, 2010, we would have been required to post collateral of $23.8 million, and $11.8 million, respectively.
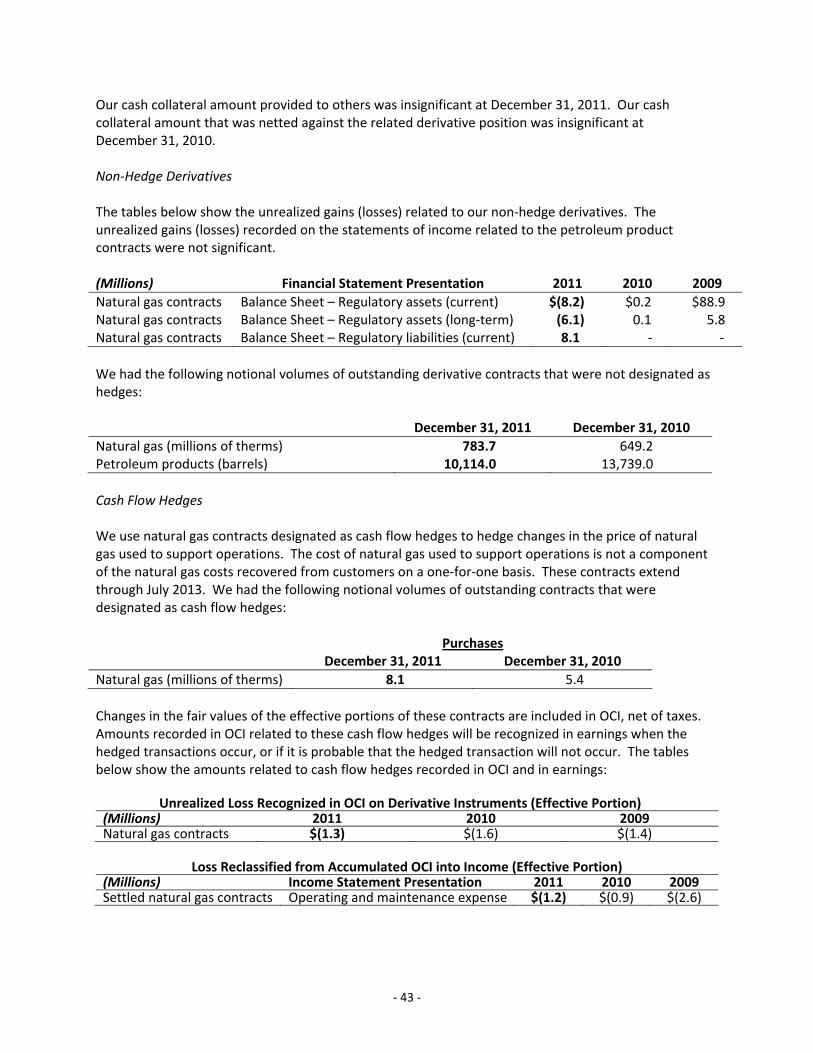
‐ 43 ‐
Our cash collateral amount provided to others was insignificant at December 31, 2011. Our cash collateral amount that was netted against the related derivative position was insignificant at December 31, 2010. Non‐Hedge Derivatives The tables below show the unrealized gains (losses) related to our non‐hedge derivatives. The unrealized gains (losses) recorded on the statements of income related to the petroleum product contracts were not significant. (Millions) Financial Statement Presentation 2011 2010 2009 Natural gas contracts Balance Sheet – Regulatory assets (current) $(8.2) $0.2 $88.9 Natural gas contracts Balance Sheet – Regulatory assets (long‐term) (6.1) 0.1 5.8 Natural gas contracts Balance Sheet – Regulatory liabilities (current) 8.1 ‐ ‐ We had the following notional volumes of outstanding derivative contracts that were not designated as hedges: December 31, 2011 December 31, 2010 Natural gas (millions of therms) 783.7 649.2 Petroleum products (barrels) 10,114.0 13,739.0 Cash Flow Hedges We use natural gas contracts designated as cash flow hedges to hedge changes in the price of natural gas used to support operations. The cost of natural gas used to support operations is not a component of the natural gas costs recovered from customers on a one‐for‐one basis. These contracts extend through July 2013. We had the following notional volumes of outstanding contracts that were designated as cash flow hedges: Purchases December 31, 2011 December 31, 2010 Natural gas (millions of therms) 8.1 5.4 Changes in the fair values of the effective portions of these contracts are included in OCI, net of taxes. Amounts recorded in OCI related to these cash flow hedges will be recognized in earnings when the hedged transactions occur, or if it is probable that the hedged transaction will not occur. The tables below show the amounts related to cash flow hedges recorded in OCI and in earnings:
Unrealized Loss Recognized in OCI on Derivative Instruments (Effective Portion) (Millions) 2011 2010 2009 Natural gas contracts $(1.3) $(1.6) $(1.4)
Loss Reclassified from Accumulated OCI into Income (Effective Portion)
(Millions) Income Statement Presentation 2011 2010 2009Settled natural gas contracts Operating and maintenance expense $(1.2) $(0.9) $(2.6)

‐ 44 ‐
No amounts were reclassified from accumulated OCI into earnings as a result of the discontinuance of cash flow hedge accounting related to these natural gas contracts during 2011, 2010 and 2009. Cash flow hedge ineffectiveness related to these natural gas contracts was not significant during 2011, 2010 and 2009. When testing for effectiveness, no portion of these derivative instruments was excluded. In the next 12 months, an insignificant loss is expected to be recognized in earnings as the hedged transactions occur. NOTE 3—RESTRUCTURING EXPENSE In an effort to permanently remove costs from its operations, Integrys Energy Group developed a plan at the end of 2009 that included reductions in the IBS workforce that supports us. The following table summarizes the activity related to restructuring costs incurred in connection with this plan: (Millions) 2010 2009 Accrued restructuring costs at beginning of period $2.8 $ ‐ Add: Adjustments to accrual during the period (0.1) 2.8 Deduct: Cash payments 0.4 ‐ Deduct: Payments to IBS for allocated restructuring costs 2.3 ‐ Accrued restructuring costs at end of period $ ‐ $2.8 We do not expect to recognize any additional restructuring costs associated with this plan. NOTE 4—PROPERTY, PLANT, AND EQUIPMENT Property, plant, and equipment consisted of the following utility and nonutility assets at December 31:
(Millions) 2011 2010 Total utility plant $3,000.9 $2,804.0 Less: Accumulated depreciation 1,098.1 1,073.8 Net 1,902.8 1,730.2 Construction work in progress 17.6 14.8 Net utility plant 1,920.4 1,745.0 Nonutility plant 0.1 0.1 Total property, plant, and equipment $1,920.5 $1,745.1
NOTE 5—REGULATORY ASSETS AND LIABILITIES We expect to recover our regulatory assets and incur future costs or refund our regulatory liabilities through rates charged to customers. These rates are based on specific ratemaking decisions over periods determined by the regulators or over the normal operating period of the assets and liabilities to which they relate. Based on prior and current rate treatment for such costs, we believe it is probable that we will continue to recover from customers the regulatory assets described below.

‐ 45 ‐
Most of our regulatory assets are earning a return, except for costs associated with the unamortized loss on reacquired debt; the carrying costs related to this regulatory asset are borne by Integrys Energy Group's shareholders. The following regulatory assets and liabilities were reflected in our balance sheets as of December 31: (Millions) 2011 2010 See Note Regulatory assets Environmental remediation costs (net of insurance recoveries) (1) $448.5 $454.3 10 Unrecognized pension and other postretirement benefit costs 269.3 213.5 11 Merger‐related pension and other postretirement benefit adjustment 79.2 87.5 11 Asset retirement obligations 44.3 35.0 8 Derivatives 36.2 21.9 1(h) Income tax related items 23.9 17.4 9 Unamortized loss on reacquired debt (2) 13.7 12.5 Decoupling 7.9 2.8 17 Other 7.8 9.5 Total $930.8 $854.4 Balance Sheet Presentation Current $ 44.7 $ 31.9 Long‐term 886.1 822.5 Total $930.8 $854.4 Regulatory liabilities Natural gas costs refundable through rate adjustments (3) $19.8 $28.4 Removal costs (4) 15.7 8.5 Uncollectible expense 10.1 7.9 17 Derivatives 8.1 ‐ 1(h) Other 4.8 14.2 Total $58.5 $59.0 Balance Sheet Presentation Current $39.6 $47.7 Long‐term (5) 18.9 11.3 Total $58.5 $59.0 (1) As of December 31, 2011, we had not yet made cash expenditures for $445.0 million of these environmental
remediation costs.
(2) Recovered over the term of the replacement debt as authorized by the ICC. (3) Represents the over collection of natural gas costs from customers that will be refunded in the future. (4) Represents amounts collected from customers to cover the costs of future removal of property, plant, and
equipment. (5) Included in other long‐term liabilities on our balance sheets.

‐ 46 ‐
NOTE 6—SHORT‐TERM DEBT AND LINES OF CREDIT Our outstanding short‐term borrowings were as follows as of December 31: (Millions, except for percentages) 2011 2010 2009 Commercial paper outstanding Average discount rate on outstanding commercial paper Short‐term notes payable to related parties outstanding
$37.0 0.34% ‐
‐ ‐ ‐
‐ ‐ $16.2
Average interest rate on short‐term notes payable to related parties outstanding
‐
‐
0.20%
The commercial paper outstanding at December 31, 2011, had a maturity date of January 3, 2012. The table below presents our average amount of short‐term borrowings outstanding based on daily outstanding balances during the years ended December 31: (Millions) 2011 2010 2009 Average amount of commercial paper outstanding $2.3 $0.1 $40.7 Average amount of short‐term notes payable to related parties outstanding
0.1
0.4
12.7
We manage our liquidity by maintaining adequate external financing commitments and short‐term notes to related parties. The information in the table below relates to our short‐term debt, lines of credit, and remaining available capacity as of December 31: (Millions) Maturity 2011 2010 Revolving credit facility * 04/23/13 $250.0 $250.0 Revolving short‐term notes payable to related parties 200.0 200.0 Total short‐term credit capacity 450.0 450.0 Less: Commercial paper outstanding 37.0 ‐ Available capacity under existing agreements $413.0 $450.0 * Support for our commercial paper borrowing program. At December 31, 2011, we were in compliance with all financial covenants related to outstanding short‐term debt. Our revolving credit agreement contains financial and other covenants, including but not limited to, a requirement to maintain a debt to total capitalization ratio not to exceed 65%, excluding non‐recourse debt. Failure to comply with these covenants could result in an event of default, which could result in the acceleration of outstanding debt obligations. NOTE 7—LONG‐TERM DEBT See our statements of capitalization for more information on our long‐term debt.
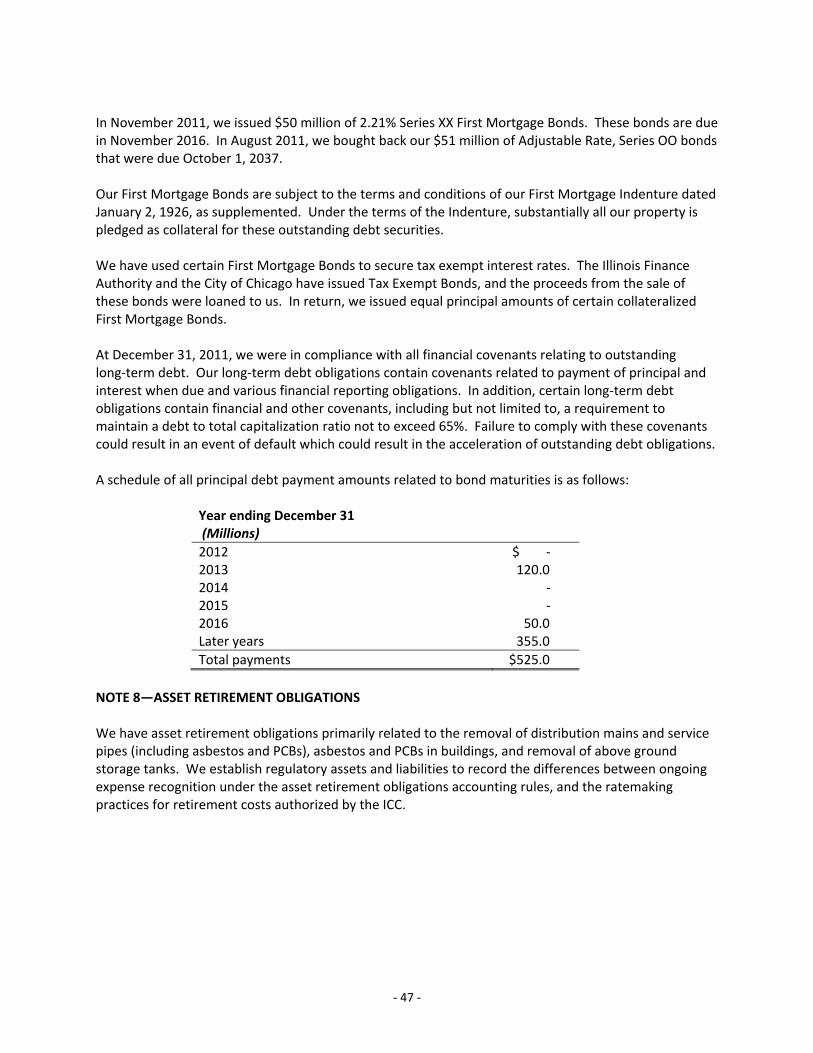
‐ 47 ‐
In November 2011, we issued $50 million of 2.21% Series XX First Mortgage Bonds. These bonds are due in November 2016. In August 2011, we bought back our $51 million of Adjustable Rate, Series OO bonds that were due October 1, 2037. Our First Mortgage Bonds are subject to the terms and conditions of our First Mortgage Indenture dated January 2, 1926, as supplemented. Under the terms of the Indenture, substantially all our property is pledged as collateral for these outstanding debt securities. We have used certain First Mortgage Bonds to secure tax exempt interest rates. The Illinois Finance Authority and the City of Chicago have issued Tax Exempt Bonds, and the proceeds from the sale of these bonds were loaned to us. In return, we issued equal principal amounts of certain collateralized First Mortgage Bonds. At December 31, 2011, we were in compliance with all financial covenants relating to outstanding long‐term debt. Our long‐term debt obligations contain covenants related to payment of principal and interest when due and various financial reporting obligations. In addition, certain long‐term debt obligations contain financial and other covenants, including but not limited to, a requirement to maintain a debt to total capitalization ratio not to exceed 65%. Failure to comply with these covenants could result in an event of default which could result in the acceleration of outstanding debt obligations. A schedule of all principal debt payment amounts related to bond maturities is as follows:
Year ending December 31 (Millions)
2012 $ ‐ 2013 120.0 2014 ‐ 2015 ‐ 2016 50.0 Later years 355.0 Total payments $525.0
NOTE 8—ASSET RETIREMENT OBLIGATIONS We have asset retirement obligations primarily related to the removal of distribution mains and service pipes (including asbestos and PCBs), asbestos and PCBs in buildings, and removal of above ground storage tanks. We establish regulatory assets and liabilities to record the differences between ongoing expense recognition under the asset retirement obligations accounting rules, and the ratemaking practices for retirement costs authorized by the ICC.
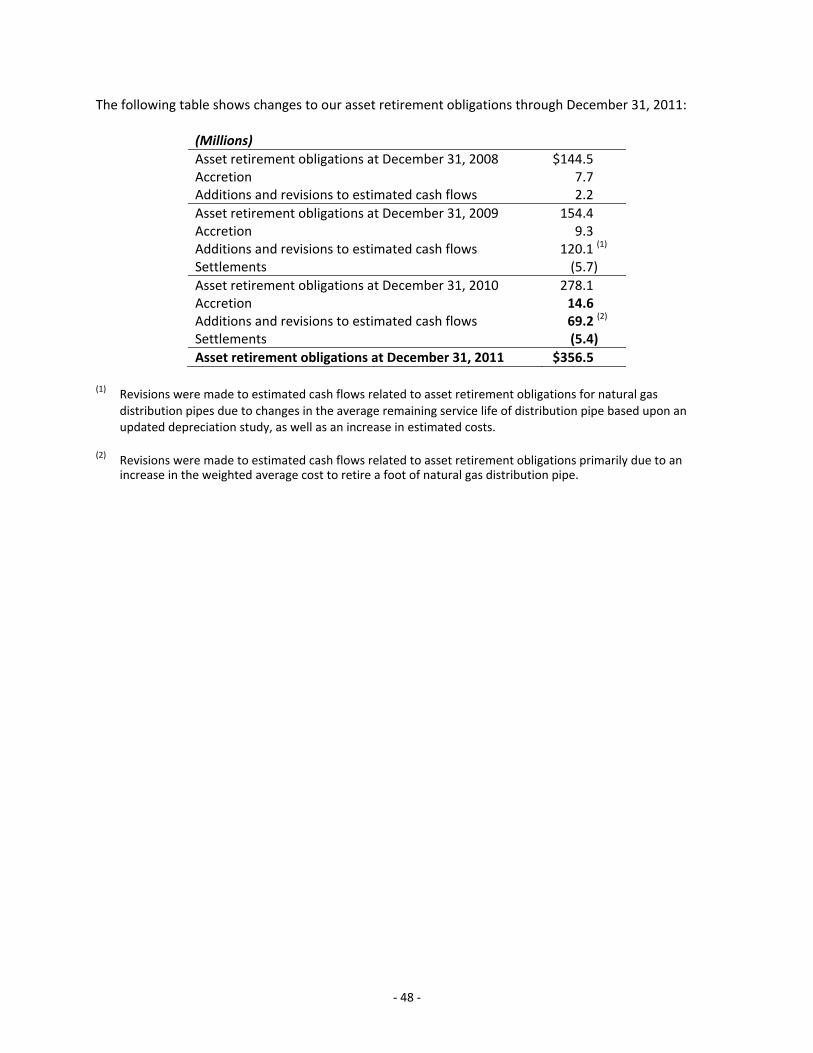
‐ 48 ‐
The following table shows changes to our asset retirement obligations through December 31, 2011:
(Millions) Asset retirement obligations at December 31, 2008 $144.5 Accretion 7.7 Additions and revisions to estimated cash flows 2.2 Asset retirement obligations at December 31, 2009 154.4 Accretion 9.3 Additions and revisions to estimated cash flows 120.1 (1) Settlements (5.7) Asset retirement obligations at December 31, 2010 278.1 Accretion 14.6 Additions and revisions to estimated cash flows 69.2 (2) Settlements (5.4) Asset retirement obligations at December 31, 2011 $356.5
(1) Revisions were made to estimated cash flows related to asset retirement obligations for natural gas
distribution pipes due to changes in the average remaining service life of distribution pipe based upon an updated depreciation study, as well as an increase in estimated costs.
(2) Revisions were made to estimated cash flows related to asset retirement obligations primarily due to an
increase in the weighted average cost to retire a foot of natural gas distribution pipe.

‐ 49 ‐
NOTE 9—INCOME TAXES Deferred Income Tax Assets and Liabilities The principal components of deferred income tax assets and liabilities recognized on the balance sheets as of December 31 are included in the table below. Certain temporary differences are netted in the table when the offsetting amount is recorded as a regulatory asset or liability. This is consistent with regulatory treatment. (Millions) 2011 2010 Deferred income tax assets Bad debts $ 14.5 $ 9.9 Other 8.2 21.2 Total deferred income tax assets $ 22.7 $ 31.1 Deferred income tax liabilities Plant‐related $442.0 $386.0 Employee benefits 13.7 22.6 Other ‐ 2.2 Total deferred income tax liabilities $455.7 $410.8 Total net deferred income tax liabilities $433.0 $379.7 Balance sheet presentation Current deferred income tax assets – included in other current assets $ 16.3 $ 6.8Long‐term deferred income tax liabilities 449.3 386.5 Net deferred income tax liabilities $433.0 $379.7
During 2011, Illinois enacted legislation that impacted the recognition of our deferred income tax assets and liabilities. Illinois made changes to its corporate combined income tax rate, which are effective for the years 2011 through 2024. The change in the state income tax rate increased net deferred income tax liabilities by $4.1 million and was deferred as a regulatory asset.
Deferred tax credit carryforwards at December 31, 2011, included $0.8 million of alternative minimum tax credits, which can be carried forward indefinitely. Other deferred tax credit carryforwards included $0.9 million of state tax credits, which have a carryforward period of 5 years, with the majority of the state tax credits to expire after 2016. At December 31, 2011, we had deferred income tax assets of $0.1 million reflecting state operating loss carryforwards, which will expire after 2025. Regulated utilities record certain adjustments related to deferred income taxes to regulatory assets and liabilities. As the related temporary differences reverse, we are prospectively refunding taxes to or collecting taxes from customers for which deferred taxes were recorded in prior years at rates potentially different than current rates or upon enactment of changes in tax law. The net regulatory assets for these recoveries and other regulatory tax effects totaled $23.9 million at December 31, 2011, and $17.4 million at December 31, 2010.

‐ 50 ‐
Provision for Income Taxes The components of the provision for income taxes were as follows: (Millions) 2011 2010 2009 Current provision Federal $ (8.1) $14.3 $(3.4)State (3.0) 4.7 (0.1)Total current provision (11.1) 19.0 (3.5) Deferred provision Federal 38.8 17.3 19.2 State 7.6 1.3 2.1 Total deferred provision 46.4 18.6 21.3 Investment tax credits, net (0.1) (0.4) (0.3)Interest (1.0) 0.2 0.9 Unrecognized tax benefits (2.1) (1.6) (0.2)Total provision for income taxes $32.1 $35.8 $18.2
Statutory Rate Reconciliation The following table presents a reconciliation of the difference between the effective tax rate and the amount computed by applying the statutory federal tax rate to income before taxes. 2011 2010 2009 (Millions, except for percentages) Rate Amount Rate Amount Rate Amount Statutory federal income tax 35.0% $31.0 35.0% $27.3 35.0% $16.2 State income taxes, net 6.8 6.0 5.8 4.5 4.5 2.1 Unrecognized tax benefits and interest (1.1) (1.0) (1.8) (1.4) 1.7 0.8 Benefits and compensation (5.5) (4.9) 5.6 4.4 (2.6) (1.2) Other differences, net 1.0 1.0 1.3 1.0 0.8 0.3 Effective income tax 36.2% $32.1 45.9% $35.8 39.4% $18.2
Unrecognized Tax Benefits A reconciliation of the beginning and ending amount of unrecognized tax benefits is as follows: (Millions) 2011 2010 2009Balance at January 1 $ 2.8 $4.2 $3.3 Increase related to tax positions taken in prior years ‐ 0.8 0.9 Decrease related to tax positions taken in prior years (0.1) (2.2) ‐ Decrease related to settlements (2.7) ‐ ‐Balance at December 31 $ ‐ $2.8 $4.2 We had no accrued interest expense or accrued penalties related to unrecognized tax benefits at December 31, 2011. We had accrued interest expense of $0.3 million and no accrued penalties related to unrecognized tax benefits at December 31, 2010. As of December 31, 2011, we do not expect any unrecognized tax benefits to affect our effective tax rate in subsequent periods.

‐ 51 ‐
We file income tax returns in the United States federal jurisdiction and in various state and local jurisdictions on a stand‐alone basis or as part of Integrys Energy Group filings. With a few exceptions, we are no longer subject to federal income tax examinations by the IRS for years prior to 2009. During 2011, we effectively settled the majority of our IRS audits for the 2004 through 2008 tax years, which decreased our liability for unrecognized tax benefits by $2.7 million. In 2011, the IRS commenced examinations of tax years 2009 and 2010. We file state tax returns based on income in Illinois, our major operating jurisdiction. With a few exceptions, we are no longer subject to state and local tax examinations by tax authorities for years prior to 2007. As of December 31, 2011, we were subject to examination by state or local tax authorities for the 2007 through 2010 tax years. During 2011, the Illinois taxing authority continued its examination of the 2007 tax year, which began in 2010. In the next 12 months, we do not expect to significantly change the amount of unrecognized tax benefits related to tax years prior to 2011. NOTE 10—COMMITMENTS AND CONTINGENCIES Commodity and Purchase Order Commitments We routinely enter into long‐term purchase and sale commitments for various quantities and lengths of time. We have obligations to distribute and sell natural gas to our customers, and expect to recover costs related to these obligations in future customer rates. As of December 31, 2011, we had obligations of $195.5 million related to natural gas supply and transportation contracts that extend through 2021. We also had commitments of $114.8 million in the form of purchase orders issued to various vendors at December 31, 2011. Manufactured Gas Plant Remediation We, our predecessors, and certain former affiliates operated facilities in the past at multiple sites for the purpose of manufacturing and storing manufactured gas. In connection with these activities, waste materials were produced that may have resulted in soil and groundwater contamination at these sites. Under certain laws and regulations relating to the protection of the environment, we are required to undertake remedial action with respect to some of these materials. We are coordinating the investigation and cleanup of the sites subject to EPA jurisdiction under what is called a "multi‐site" program. This program involves prioritizing the work to be done at the sites, preparation and approval of documents common to all of the sites, and use of a consistent approach in selecting remedies. We are responsible for the environmental remediation of 28 sites, of which 11 have been transferred to the EPA Superfund Alternative Sites Program. Under the EPA’s program, the remedy decisions at these sites will be made using risk‐based criteria typically used at Superfund sites. As of December 31, 2011, we estimated and accrued for $445.0 million of future undiscounted investigation and cleanup costs for all sites. We may adjust these estimates in the future due to remedial technology, regulatory requirements, remedy determinations, and any claims of natural resource damages. As of

‐ 52 ‐
December 31, 2011, cash expenditures for environmental remediation not yet recovered in rates were $3.5 million. We recorded a regulatory asset of $448.5 million at December 31, 2011, which is net of insurance recoveries received of $24.2 million, related to the expected recovery of both cash expenditures and estimated future expenditures through rates. Management believes that any costs incurred for environmental activities relating to former manufactured gas plant operations that are not recoverable through contributions from other entities or from insurance carriers have been prudently incurred and are, therefore, recoverable through rates. Accordingly, we do not expect these costs to have a material impact on our financial statements. However, any changes in the approved rate mechanisms for recovery of these costs, or any adverse conclusions by the ICC with respect to the prudence of costs actually incurred, could materially affect rate recovery of such costs. NOTE 11—EMPLOYEE BENEFIT PLANS Defined Benefit Plans We participate in the Integrys Energy Group Retirement Plan, a non‐contributory, qualified defined benefit pension plan, sponsored by IBS, as well as an unfunded, nonqualified retirement plan, sponsored by PELLC. We are responsible for our share of the plan assets and obligations of these plans, and our balance sheets reflect only the liabilities associated with our past and current employees and our share of the plan assets. In addition, we offer multiple other postretirement benefits to employees. Integrys Energy Group also currently offers medical, dental, and life insurance benefits to our active employees and their dependents. We expense the costs of these benefits as incurred. Retiring employees have the option of receiving retirement benefits in the form of an annuity or a lump sum payment. Effective with the 2010 rate order that changed how pension and other postretirement benefit costs are determined for rate purposes, we only recognize settlement costs if the cost is greater than or equal to the sum of the service and interest cost components of the net periodic benefit cost for the year. Effective January 1, 2008, and May 1, 2008, the defined benefit pension plans were closed to non‐union and union new hires, respectively.

‐ 53 ‐
The following tables provide a reconciliation of the changes in the plans' benefit obligations and fair value of assets during 2011 and 2010: Pension Benefits Other Benefits (Millions) 2011 2010 2011 2010 Change in benefit obligation Obligation at January 1 $ 421.9 $ 410.3 $ 170.7 $ 144.3 Service cost 12.2 11.1 8.6 7.6 Interest cost 23.5 23.5 8.8 8.3 Plan amendments ‐ ‐ (1.0) ‐ Transfers to affiliates (5.1) (15.0) (2.9) (1.8) Actuarial loss (gain), net 38.9 21.2 (5.4) 20.4 Participant contributions ‐ ‐ 7.5 6.7 Benefit payments (36.3) (29.2) (14.3) (15.7) Federal subsidy on benefits paid ‐ ‐ 1.2 0.9 Obligation at December 31 $ 455.1 $ 421.9 $ 173.2 $ 170.7 Change in Fair Value of Plan Assets Fair value of plan assets at January 1 $ 316.1 $ 320.5 $ 31.5 $ 22.3 Actual return on plan assets 5.0 39.7 (0.3) 1.3 Employer contributions 0.1 0.1 23.1 18.7 Transfers to affiliates (5.1) (15.0) (2.9) (1.8) Participant contributions ‐ ‐ 7.5 6.7 Benefit payments (36.3) (29.2) (14.1)* (15.7) Fair value of plan assets at December 31 $ 279.8 $ 316.1 $ 44.8 $ 31.5 Funded status at December 31 $(175.3) $(105.8) $(128.4) $(139.2) * Amount is net of early retirement reinsurance program payments received in 2011. The amounts recognized on our balance sheets at December 31 related to the funded status of the benefit plans were as follows:
Pension Benefits Other Benefits (Millions) 2011 2010 2011 2010 Current liabilities $ 0.4 $ 0.3 $ ‐ $ ‐ Noncurrent liabilities 174.9 105.5 128.4 139.2 Total liabilities $175.3 $105.8 $128.4 $139.2

‐ 54 ‐
The accumulated benefit obligation for all defined benefit pension plans was $385.9 million and $339.0 million at December 31, 2011, and 2010, respectively. Information for pension plans with an accumulated benefit obligation in excess of plan assets is presented in the following table:
December 31 (Millions) 2011 2010 Projected benefit obligation $455.1 $421.9 Accumulated benefit obligation 385.9 339.0 Fair value of plan assets 279.8 316.1
The following table shows the amounts that had not yet been recognized in our net periodic benefit cost as of December 31:
Pension Benefits Other Benefits (Millions) 2011 2010 2011 2010 Net regulatory assets Net actuarial loss $251.7 $193.2 $18.4 $20.3 Prior service credits ‐ ‐ (0.8) ‐ Total $251.7 $193.2 $17.6 $20.3
Effective with the 2010 rate order, we reflect pension and other postretirement benefit costs in rates using Integrys Energy Group's accounting basis, which was established at the time of the February 2007 PELLC merger. Pursuant to the 2010 rate order, a regulatory asset was established for the remaining cumulative difference that existed between our accounting basis and the accounting basis of Integrys Energy Group in the pension and other postretirement benefit obligations. This regulatory asset, composed of unrecognized benefit costs that existed prior to the PELLC merger, is not included in the amounts in the table above. Also, the amortization of this regulatory asset over the average remaining service lives of the participating employees is not included as a component of net periodic benefit cost. The following table shows the estimated amounts that will be amortized into net periodic benefit cost during 2012: (Millions) Pension Benefits Other Benefits
Net actuarial losses $9.3 $ ‐Prior service credits ‐ (0.1)Total 2012 – estimated amortization $9.3 $(0.1)

‐ 55 ‐
The following table shows the components of net periodic benefit cost (including amounts capitalized to our balance sheets) for our benefit plans: Pension Benefits Other Benefits(Millions) 2011 2010 2009 2011 2010 2009Net periodic benefit cost Service cost $12.2 $11.1 $ 9.9 $ 8.6 $ 7.6 $ 6.1Interest cost 23.5 23.5 23.0 8.8 8.3 7.4Expected return on plan assets (29.5) (33.2) (34.7) (3.3) (1.4) (0.6)Amortization of transition obligation ‐ ‐ ‐ ‐ ‐ 1.1Amortization of prior service cost (credits) ‐ ‐ 2.3 (0.1) ‐ ‐Amortization of net actuarial loss 4.9 1.9 2.6 ‐ ‐ ‐Net periodic benefit cost 11.1 3.3 3.1 14.0 14.5 14.0Effects of lump sum settlements upon Retirement ‐ ‐ 13.0 ‐ ‐ ‐ Net benefit cost $11.1 $ 3.3 $16.1 $14.0 $14.5 $14.0
Assumptions – Pension and Other Postretirement Benefit Plans The weighted‐average assumptions used at December 31 to determine benefit obligations for the plans were as follows: Pension Benefits Other Benefits 2011 2010 2011 2010Discount rate 5.10% 5.80% 4.80% 5.45%Rate of compensation increase 4.16% 4.16% N/A N/AAssumed medical cost trend rate (under age 65) N/A N/A 7.00% 7.50%Ultimate trend rate N/A N/A 5.00% 5.00%Year ultimate trend rate is reached N/A N/A 2016 2016Assumed medical cost trend rate (over age 65) N/A N/A 7.50% 8.00%Ultimate trend rate N/A N/A 5.50% 5.50%Year ultimate trend rate is reached N/A N/A 2016 2016Assumed dental cost trend rate N/A N/A 5.00% 5.00%

‐ 56 ‐
The weighted‐average assumptions used to determine net periodic benefit cost for the plans were as follows: Pension Benefits 2011 2010 2009Discount rate 5.80% 6.15% 6.45%Expected return on assets 8.25% 8.50% 8.50%Rate of compensation increase 4.16% 4.16% 4.21%
Other Benefits 2011 2010 2009Discount rate 5.45% 5.80% 6.45%Expected return on assets 8.25% 8.50% 8.50%Assumed medical cost trend rate (under age 65) 7.50% 8.00% 9.00%Ultimate trend rate 5.00% 5.00% 5.00%Year ultimate trend rate is reached 2016 2013 2013Assumed medical cost trend rate (over age 65) 8.00% 8.50% 9.50%Ultimate trend rate 5.50% 5.50% 5.50%Year ultimate trend rate is reached 2016 2013 2013Assumed dental cost trend rate 5.00% 5.00% 5.00%
Assumed health care cost trend rates have a significant effect on the amounts reported by us for our health care plans. For the year ended December 31, 2011, a one‐percentage‐point change in assumed health care cost trend rates would have had the following effects: One‐Percentage‐Point (Millions) Increase Decrease Effect on total of service and interest cost components of net
periodic postretirement health care benefit cost $ 2.2 $ (1.8) Effect on the health care component of the
accumulated postretirement benefit obligation 17.4
(15.1)
Pension and Other Postretirement Benefit Plan Assets Integrys Energy Group's investment policy includes various guidelines and procedures designed to ensure assets are invested in an appropriate manner to meet expected future benefits to be earned by participants. The investment guidelines consider a broad range of economic conditions. The policy is established and administered in a manner that is compliant at all times with applicable regulations.

‐ 57 ‐
Central to the policy are target allocation ranges by major asset categories. The objectives of the target allocations are to maintain investment portfolios that diversify risk through prudent asset allocation parameters and to achieve asset returns that meet or exceed the plans' actuarial assumptions and that are competitive with like instruments employing similar investment strategies. The portfolio diversification provides protection against significant concentrations of risk in the plan assets. The target asset allocations for pension and other postretirement benefit plans that have significant assets are: 70% equity securities and 30% fixed income securities. Equity securities primarily include investments in large‐cap and small‐cap companies. Fixed income securities primarily include corporate bonds of companies from diversified industries, United States government securities, and mortgage‐backed securities. The Board of Directors of Integrys Energy Group established the Employee Benefits Administrator Committee (composed of members of Integrys Energy Group and its subsidiaries' management) to manage the operations and administration of all its and its subsidiaries' benefit plans and trusts. The committee periodically reviews the asset allocation, and the portfolio is rebalanced when necessary. Pension and other postretirement benefit plan investments are recorded at fair value. Information regarding the fair value hierarchy and the classification of fair value measurements based on the types of inputs used are discussed in Note 1(o), "Summary of Significant Accounting Policies – Fair Value." The following table provides the fair value of our investments by asset class: December 31, 2011 Pension Plan Assets Other Benefit Plan Assets(Millions) Level 1 Level 2 Level 3 Total Level 1 Level 2 Level 3 TotalAsset Class Cash and cash equivalents $ 1.1 $ 6.1 $ ‐ $ 7.2 $ ‐ $ 1.4 $ ‐ $ 1.4Equity securities: United States equity 32.3 82.0 ‐ 114.3 ‐ 15.8 ‐ 15.8 International equity 17.6 62.9 ‐ 80.5 ‐ 9.1 ‐ 9.1Fixed income securities: United States government ‐ 23.7 ‐ 23.7 11.1 ‐ ‐ 11.1 Foreign government ‐ 4.4 1.4 5.8 ‐ ‐ ‐ ‐ Corporate debt ‐ 39.9 0.5 40.4 ‐ ‐ ‐ ‐ Asset‐backed securities ‐ 14.0 ‐ 14.0 ‐ ‐ ‐ ‐ Other ‐ 2.1 ‐ 2.1 ‐ ‐ ‐ ‐ 51.0 235.1 1.9 288.0 11.1 26.3 ‐ 37.4401(h) other benefit plan assets invested as pension assets (1) (1.3) (6.1) ‐ (7.4) 1.3 6.1 ‐ 7.4 Total (2) $49.7 $229.0 $1.9 $280.6 $12.4 $32.4 $ ‐ $44.8 (1) Pension trust assets are used to pay other postretirement benefits as allowed under Internal Revenue Code
Section 401(h). (2) Investments do not include accruals or pending transactions that are included in the table reconciling the
change in fair value of plan assets.

‐ 58 ‐
December 31, 2010 Pension Plan Assets Other Benefit Plan Assets(Millions) Level 1 Level 2 Level 3 Total Level 1 Level 2 Level 3 TotalAsset Class Cash and cash equivalents $ 1.0 $ 10.0 $ ‐ $ 11.0 $ ‐ $ 2.3 $ ‐ $ 2.3Equity securities: United States equity 37.0 88.3 ‐ 125.3 ‐ 13.6 ‐ 13.6 International equity 22.4 73.1 ‐ 95.5 ‐ ‐ ‐ ‐Fixed income securities: United States government ‐ 21.6 ‐ 21.6 ‐ 1.9 ‐ 1.9 Foreign government ‐ 3.9 2.3 6.2 ‐ ‐ ‐ ‐ Corporate debt ‐ 42.3 0.6 42.9 ‐ 3.5 ‐ 3.5 Asset‐backed securities ‐ 15.5 0.1 15.6 ‐ 0.3 ‐ 0.3 Other ‐ 1.5 ‐ 1.5 ‐ ‐ ‐ ‐Real estate securities ‐ ‐ 8.8 8.8 ‐ ‐ ‐ ‐ 60.4 256.2 11.8 328.4 ‐ 21.6 ‐ 21.6401(h) other benefit plan assets invested as pension assets (1) (1.8) (7.8) (0.4) (10.0) 1.8 7.8 0.4 10.0 Total(2) $58.6 $248.4 $11.4 $318.4 $1.8 $29.4 $0.4 $31.6 (1) Pension trust assets are used to pay other postretirement benefits as allowed under Internal Revenue Code
Section 401(h). (2) Investments do not include accruals or pending transactions that are included in the table reconciling the
change in fair value of plan assets. The following tables set forth a reconciliation of changes in the fair value of pension plan assets categorized as Level 3 in the fair value hierarchy:
(Millions)
Foreign Government
Debt Corporate
Debt
Asset‐Backed
Securities
Real Estate
Securities Total Beginning balance at December 31, 2010 $ 2.3 $0.6 $0.1 $ 8.8 $11.8Net realized and unrealized losses (0.3) (0.1) ‐ (1.0) (1.4)Purchases 0.5 0.5 ‐ 0.5 1.5Sales (1.1) (0.5) ‐ (8.3) (9.9)Transfers out of Level 3 ‐ ‐ (0.1) ‐ (0.1)Ending balance at December 31, 2011 $ 1.4 $0.5 $ ‐ $ ‐ $ 1.9 Net unrealized losses related to assets still held at the end of the period $(0.1) $ ‐ $ ‐ $ ‐ $ (0.1)

‐ 59 ‐
(Millions)
Foreign Government
Debt Corporate
Debt
Asset‐Backed
Securities
Other Fixed Income Securities
Real Estate
Securities Total Beginning balance at December 31, 2009 $0.1 $ 1.0 $ ‐ $ 0.4 $8.5 $10.0Net realized and unrealized losses ‐ (0.1) ‐ (0.1) ‐ (0.2)Purchases, sales, and settlements 2.2 (0.3) 0.1 (0.3) 0.3 2.0Ending balance at December 31, 2010 $2.3 $ 0.6 $0.1 $ ‐ $8.8 $11.8 Net unrealized losses related to assets still held at the end of the period $ ‐ $(0.1) $ ‐ $ ‐ $ ‐ $(0.1)
Cash Flows Related to Pension and Other Postretirement Benefit Plans Our funding policy is to contribute at least the minimum amounts that are required to be funded under the Employee Retirement Income Security Act, but not more than the maximum amounts that are currently deductible for income tax purposes. We expect to contribute $0.4 million to pension plans and $86.3 million to other postretirement benefit plans in 2012, dependent upon various factors affecting us, including our liquidity position and tax law changes. The following table shows the payments, reflecting expected future service, that we expect to make for pension and other postretirement benefits. These amounts do not include the participants’ share of the cost. In addition, the table shows the expected federal subsidies, provided under the Medicare Prescription Drug, Improvement and Modernization Act of 2003, which will partially offset other postretirement benefits.
(Millions) Pension Benefits Other Benefits Federal Subsidies 2012 $ 48.3 $ 9.6 $(1.0) 2013 53.1 10.3 (1.1) 2014 45.5 11.0 (1.2) 2015 43.2 12.0 (1.2) 2016 44.7 13.0 (1.3) 2017‐2021 255.3 80.9 (7.8)
Defined Contribution Plans Integrys Energy Group maintains a 401(k) Savings Plan for substantially all of our full‐time employees. A percentage of employee contributions are matched through an employee stock ownership plan or cash contribution up to certain limits. Employees who are no longer eligible to participate in the defined benefit pension plan participate in a defined contribution pension plan, in which certain amounts are contributed to an employee’s account based on the employee’s wages, age, and years of service. Our share of the total costs incurred under these plans was $2.5 million, $2.7 million, and $1.8 million for 2011, 2010, and 2009, respectively. NOTE 12—PREFERRED STOCK We have 430,000 shares of preferred stock with a $100 par value authorized for issuance, of which none were issued and outstanding at December 31, 2011.

‐ 60 ‐
NOTE 13—COMMON EQUITY Various laws, regulations, and financial covenants impose restrictions on our ability to pay dividends to the sole holder of our common stock, PELLC. We have short‐term debt obligations containing financial and other covenants, including but not limited to, a requirement to maintain a debt to total capitalization ratio not to exceed 65%. Failure to comply with these covenants could result in an event of default which could result in the acceleration of our outstanding debt obligations. As of December 31, 2011, our total restricted net assets were approximately $302.4 million. Except for the restrictions described above and subject to applicable law, we do not have any other significant dividend restrictions. During the twelve months ended December 31, 2011, we paid common stock dividends of $50.6 million to PELLC. Rates established in the 2012 ICC rate order reflect a common equity ratio of 49% in our regulatory capital structure. We may request ICC authorization to issue additional common stock to PELLC and may return capital in order to maintain utility common equity levels consistent with our current rate order. NOTE 14—STOCK‐BASED COMPENSATION Our employees may be granted awards under Integrys Energy Group's stock‐based compensation plans. At December 31, 2011, stock options, performance stock rights and restricted share units were outstanding under various plans. Compensation cost associated with these awards is allocated to us based on the percentages used for allocation of the award recipients' labor costs. The following table reflects the stock‐based compensation expense and the related deferred tax benefit recognized in income for the years ended December 31: (Millions) 2011 2010 2009Performance stock rights $0.9 $2.6 $1.0Restricted shares and restricted share units 1.4 1.9 0.3Total stock‐based compensation expense $2.3 $4.5 $1.3Income tax benefit $0.9 $1.8 $0.5
Compensation cost recognized for stock options was not significant during 2011, 2010, and 2009. The total compensation cost capitalized for all awards during 2011, 2010, and 2009 was not significant.

‐ 61 ‐
Stock Options Under the provisions of the 2010 Integrys Energy Group Omnibus Incentive Compensation Plan, no single employee who is Integrys Energy Group’s chief executive officer or one of the other three highest compensated officers of Integrys Energy Group (including officers of its subsidiaries) can be granted options for more than 1,000,000 shares during any calendar year. All stock options granted to our employees are for the option to purchase shares of Integrys Energy Group common stock. No stock options can have a term longer than ten years. The exercise price of each stock option is equal to the fair market value of the stock on the date the stock option is granted. Generally, one‐fourth of the stock options granted vest and become exercisable each year on the anniversary of the grant date. The fair values of stock option awards granted were estimated using a binomial lattice model. The expected term of option awards is calculated based on historical exercise behavior and represents the period of time that options are expected to be outstanding. The risk‐free interest rate is based on the United States Treasury yield curve. The expected dividend yield incorporates the current and historical dividend rate of Integrys Energy Group. The expected stock price volatility was estimated using its 10‐year historical volatility. The following table shows the weighted‐average fair values per stock option along with the assumptions incorporated into the valuation models: 2011 Grant 2010 Grant 2009 Grant Weighted‐average fair value per option $6.57 $5.30 $3.83 Expected term 5 years 6 years 8 ‐ 9 years Risk‐free interest rate 0.27% ‐ 3.90% 2.38% 2.50% ‐ 2.78% Expected dividend yield 5.34% 5.46% 5.50% Expected volatility 25% 25% 19%
A summary of stock option activity for 2011, and information related to outstanding and exercisable stock options at December 31, 2011, is presented below:
Stock Options
Weighted‐Average Exercise Price Per
Share
Weighted‐Average Remaining
Contractual Life (in Years)
Aggregate Intrinsic Value
(Millions) Outstanding at December 31, 2010 27,279 $46.02 Granted 5,666 49.40 Exercised (6,989) 43.42 Expired (1,650) 49.89 Outstanding at December 31, 2011 24,306 $47.29 7.39 $0.2Exercisable at December 31, 2011 7,349 $52.94 5.79 $ ‐
As of December 31, 2011, future compensation cost expected to be recognized for unvested and outstanding stock options was not significant. Cash received from option exercises was not significant during 2011, 2010, and 2009. The aggregate intrinsic value for outstanding and exercisable options in the above table represents the total pre‐tax intrinsic value that would have been received by the option holders had they all exercised their options at December 31, 2011. This is calculated as the difference between Integrys Energy Group’s closing stock price on December 31, 2011, and the option exercise price, multiplied by the

‐ 62 ‐
number of in‐the‐money stock options. The intrinsic value of options exercised during 2011, 2010, and 2009 was not significant. Performance Stock Rights Performance stock rights vest over a three‐year performance period. For accounting purposes, awards granted to retirement eligible employees vest over a shorter period; however, the distribution of these awards is not accelerated. No single employee who is Integrys Energy Group’s chief executive officer or one of the other three highest compensated officers of Integrys Energy Group (including officers of its subsidiaries) can receive a payout in excess of 250,000 performance shares during any calendar year. Performance stock rights are either paid out in shares of Integrys Energy Group common stock or an eligible employee can elect to defer the value of their awards into the deferred compensation plan and choose among various investment options, some of which are ultimately paid out in Integrys Energy Group common stock and some of which are ultimately paid out in cash. Beginning in 2011, eligible employees can now only elect to defer up to 80% of the value of their awards. The number of shares paid out is calculated by multiplying a performance percentage by the number of outstanding stock rights at the completion of the performance period. The performance percentage is based on the total shareholder return of Integrys Energy Group’s common stock relative to the total shareholder return of a peer group of companies. The payout may range from 0% to 200% of target. Performance stock rights are accounted for as either an equity award or a liability award depending on their settlement features. Awards that can only be settled in shares of Integrys Energy Group common stock are accounted for as equity awards. Awards that an employee has elected to defer or is still able to defer into the deferred compensation plan are accounted for as liability awards and are recorded at fair value each reporting period. Six months prior to the end of the performance period, employees can no longer change their election to defer the value of their performance stock rights into the deferred compensation plan. As a result, any awards not elected for deferral at this point in the performance period will be settled in Integrys Energy Group’s common stock. This changes the classification of these awards from a liability award to an equity award. The change in classification is accounted for as an award modification. The fair value on the modification date is used to measure these awards for the remaining six months of the performance period. No incremental compensation expense is recorded as a result of this award modification. The fair values of performance stock rights were estimated using a Monte Carlo valuation model. The risk‐free interest rate is based on the United States Treasury yield curve. The expected dividend yield incorporates the current and historical dividend rate for Integrys Energy Group. The expected volatility was estimated using one to three years of historical data. The table below reflects the assumptions used in the valuation of the outstanding grants at December 31: 2011 2010 2009Risk‐free interest rate 0.00% ‐ 1.27% 0.21% ‐ 0.56% 1.38% ‐ 4.71% Expected dividend yield 5.28% ‐ 5.34% 5.34% 4.50% ‐ 5.50% Expected volatility 21% ‐ 36% 20% ‐ 34% 15 % ‐26%

‐ 63 ‐
A summary of the 2011 activity related to performance stock rights accounted for as equity awards is presented below:
Performance Stock Rights
Weighted‐Average Fair Value *
Outstanding at December 31, 2010 ‐ $ ‐ Granted 399 49.21 Award Modifications 2,140 45.96 Outstanding at December 31, 2011 2,539 $46.47
* Reflects the weighted‐average fair value used to measure equity awards. Equity awards are measured using
the grant date fair value or the fair value on the modification date. A summary of the 2011 activity related to performance stock rights accounted for as liability awards is presented below:
Performance Stock Rights
Outstanding at December 31, 2010 4,990 Granted 1,592 Award modifications (2,140) Distributed (1,238) Adjustment for final payout 240 Outstanding at December 31, 2011 3,444
The weighted‐average fair value of all outstanding performance stock rights accounted for as liability awards as of December 31, 2011, was $57.88 per performance stock right. As of December 31, 2011, there was no future compensation cost expected to be recognized for unvested and outstanding performance stock rights (equity and liability awards) due to all recipients being retirement eligible. The total intrinsic value of performance stock rights distributed was not significant for the years ended December 31, 2011 and 2010. No performance stock rights were distributed in 2009 because the performance percentage was below the threshold payout level for those rights that were vested and eligible to be distributed during the year ended December 31, 2009. Restricted Shares and Restricted Share Units Restricted shares and restricted share units generally have a four‐year vesting period, with 25% of each award vesting on each anniversary of the grant date. During the vesting period, restricted share recipients had voting rights and were entitled to dividends in the same manner as other Integrys Energy Group common shareholders. Restricted share unit recipients do not have voting rights, but they receive Integrys Energy Group dividend equivalents in the form of additional restricted share units. During 2011, the last of the outstanding restricted shares vested. Only restricted share units remain outstanding at December 31, 2011.

‐ 64 ‐
Restricted shares and restricted share units are accounted for as either an equity award or a liability award depending on their settlement features. Awards that can only be settled in shares of Integrys Energy Group common stock and cannot be deferred into the deferred compensation plan are accounted for as equity awards. Beginning in 2011, eligible employees can now only elect to defer up to 80% of their awards into the deferred compensation plan. Equity awards are measured based on the fair value on the grant date. Awards that an employee has elected to defer into the deferred compensation plan are accounted for as liability awards and are recorded at fair value each reporting period. A summary of the activity related to all restricted share and restricted share unit awards (equity and liability awards) for the year ended December 31, 2011, is presented below:
Restricted Share and
Restricted Share Unit Awards Weighted‐Average
Grant Date Fair Value
Outstanding at December 31, 2010 17,347 $43.71Granted 5,753 49.40Dividend equivalents 1,818 47.80Vested (6,141) 45.52Forfeited (437) 44.49Outstanding at December 31, 2011 18,340 $45.27
As of December 31, 2011, future compensation cost expected to be recognized for unvested and outstanding restricted stock units was not significant. The total intrinsic value of restricted share and restricted share unit awards vested for the years ended December 31, 2011, 2010, and 2009 was not significant. The weighted‐average grant date fair value of restricted shares and restricted share units awarded during the years ended December 31, 2011, 2010, and 2009 was $49.40, $41.58 and $42.12 per share, respectively. NOTE 15—FAIR VALUE Fair Value Measurements The following tables show financial assets and liabilities that were accounted for at fair value on a recurring basis, categorized by level within the fair value hierarchy: December 31, 2011 (Millions) Level 1 Level 2 Level 3 Total Risk management assets Natural gas contracts $ ‐ $ 8.4 $ ‐ $ 8.4 Risk management liabilities Natural gas contracts ‐ 32.4 ‐ 32.4

‐ 65 ‐
December 31, 2010
(Millions) Level 1 Level 2 Level 3 Total Netting * Balance Sheet Presentation
Risk management assets Natural gas contracts $ ‐ $ 2.6 $ ‐ $ 2.6 $0.2 $ 2.4 Petroleum product contracts 0.1 ‐ ‐ 0.1 ‐ 0.1 Risk management liabilities Natural gas contracts ‐ 18.5 ‐ 18.5 0.2 18.3 * Derivative accounting rules permit the netting of risk management assets and liabilities when a legally
enforceable netting agreement exists, and, when assets and liabilities are netted, requires the netting of related cash collateral positions against the net derivative positions.
The risk management assets and liabilities listed in the tables above include swaps, options, and natural gas purchase contracts used to manage volatility in natural gas supply costs. We also use financial option contracts to manage volatility in the costs of gasoline and diesel fuel used by our utility vehicles. The fair value of these financial option contracts was not significant at December 31, 2011. NYMEX contracts are valued using the NYMEX end‐of‐day settlement price, which is a Level 1 input. Certain derivative instruments are valued using broker quotes or prices for similar contracts at the reporting date, which are Level 2 inputs. The valuation of certain contracts also includes an adjustment related to transportation, and our financial fixed price options are valued using the Black‐76 model, incorporating mid‐market prices obtained from the NYMEX. These contracts are also classified in Level 2. For more information on our derivative instruments, see Note 2, "Risk Management Activities." There were no transfers between the levels of the fair value hierarchy during 2011. Fair Value of Financial Instruments The following table shows the financial instruments included on the balance sheets that are not recorded at fair value.
2011 2010 (Millions)
Carrying Amount
Fair Value
Carrying Amount
Fair Value
Long‐term debt $524.5 $556.8 $525.5 $543.4 The fair value of long‐term debt is estimated based on the quoted market price for the same or similar issues, or on the current rates offered to us for debt of the same remaining maturity. Due to the short‐term nature of cash and cash equivalents, accounts receivable, accounts payable, notes payable, and outstanding commercial paper, the carrying amount for each such item approximates fair value.
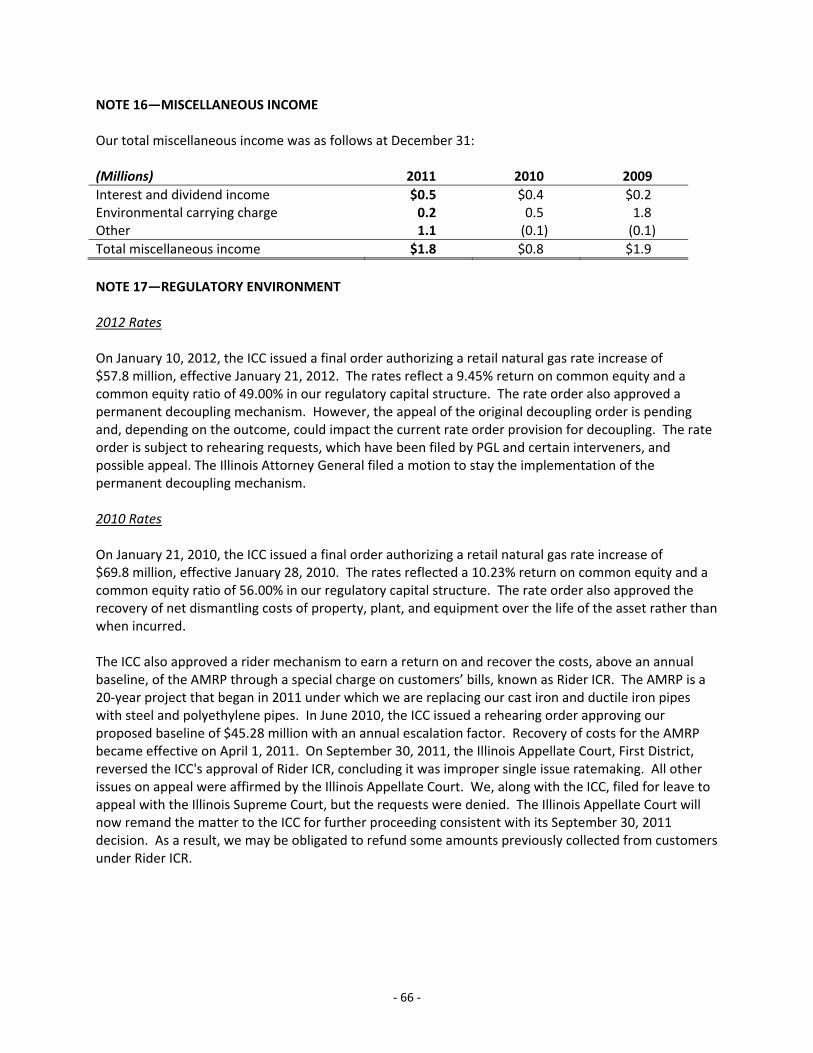
‐ 66 ‐
NOTE 16—MISCELLANEOUS INCOME Our total miscellaneous income was as follows at December 31: (Millions) 2011 2010 2009 Interest and dividend income $0.5 $0.4 $0.2 Environmental carrying charge 0.2 0.5 1.8 Other 1.1 (0.1) (0.1) Total miscellaneous income $1.8 $0.8 $1.9 NOTE 17—REGULATORY ENVIRONMENT 2012 Rates On January 10, 2012, the ICC issued a final order authorizing a retail natural gas rate increase of $57.8 million, effective January 21, 2012. The rates reflect a 9.45% return on common equity and a common equity ratio of 49.00% in our regulatory capital structure. The rate order also approved a permanent decoupling mechanism. However, the appeal of the original decoupling order is pending and, depending on the outcome, could impact the current rate order provision for decoupling. The rate order is subject to rehearing requests, which have been filed by PGL and certain interveners, and possible appeal. The Illinois Attorney General filed a motion to stay the implementation of the permanent decoupling mechanism. 2010 Rates On January 21, 2010, the ICC issued a final order authorizing a retail natural gas rate increase of $69.8 million, effective January 28, 2010. The rates reflected a 10.23% return on common equity and a common equity ratio of 56.00% in our regulatory capital structure. The rate order also approved the recovery of net dismantling costs of property, plant, and equipment over the life of the asset rather than when incurred. The ICC also approved a rider mechanism to earn a return on and recover the costs, above an annual baseline, of the AMRP through a special charge on customers’ bills, known as Rider ICR. The AMRP is a 20‐year project that began in 2011 under which we are replacing our cast iron and ductile iron pipes with steel and polyethylene pipes. In June 2010, the ICC issued a rehearing order approving our proposed baseline of $45.28 million with an annual escalation factor. Recovery of costs for the AMRP became effective on April 1, 2011. On September 30, 2011, the Illinois Appellate Court, First District, reversed the ICC's approval of Rider ICR, concluding it was improper single issue ratemaking. All other issues on appeal were affirmed by the Illinois Appellate Court. We, along with the ICC, filed for leave to appeal with the Illinois Supreme Court, but the requests were denied. The Illinois Appellate Court will now remand the matter to the ICC for further proceeding consistent with its September 30, 2011 decision. As a result, we may be obligated to refund some amounts previously collected from customers under Rider ICR.
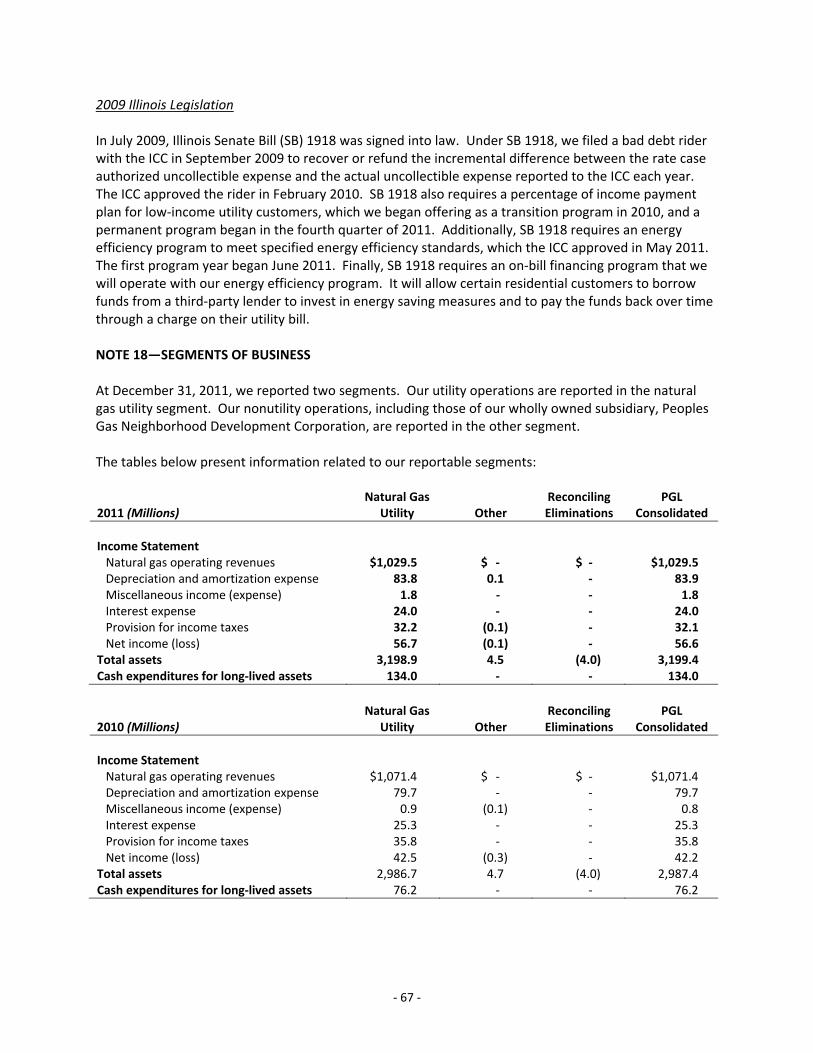
‐ 67 ‐
2009 Illinois Legislation In July 2009, Illinois Senate Bill (SB) 1918 was signed into law. Under SB 1918, we filed a bad debt rider with the ICC in September 2009 to recover or refund the incremental difference between the rate case authorized uncollectible expense and the actual uncollectible expense reported to the ICC each year. The ICC approved the rider in February 2010. SB 1918 also requires a percentage of income payment plan for low‐income utility customers, which we began offering as a transition program in 2010, and a permanent program began in the fourth quarter of 2011. Additionally, SB 1918 requires an energy efficiency program to meet specified energy efficiency standards, which the ICC approved in May 2011. The first program year began June 2011. Finally, SB 1918 requires an on‐bill financing program that we will operate with our energy efficiency program. It will allow certain residential customers to borrow funds from a third‐party lender to invest in energy saving measures and to pay the funds back over time through a charge on their utility bill. NOTE 18—SEGMENTS OF BUSINESS At December 31, 2011, we reported two segments. Our utility operations are reported in the natural gas utility segment. Our nonutility operations, including those of our wholly owned subsidiary, Peoples Gas Neighborhood Development Corporation, are reported in the other segment. The tables below present information related to our reportable segments: 2011 (Millions)
Natural GasUtility Other
Reconciling Eliminations
PGL Consolidated
Income Statement Natural gas operating revenues $1,029.5 $ ‐ $ ‐ $1,029.5 Depreciation and amortization expense 83.8 0.1 ‐ 83.9 Miscellaneous income (expense) 1.8 ‐ ‐ 1.8 Interest expense 24.0 ‐ ‐ 24.0 Provision for income taxes 32.2 (0.1) ‐ 32.1 Net income (loss) 56.7 (0.1) ‐ 56.6Total assets 3,198.9 4.5 (4.0) 3,199.4Cash expenditures for long‐lived assets 134.0 ‐ ‐ 134.0 2010 (Millions)
Natural GasUtility Other
Reconciling Eliminations
PGL Consolidated
Income Statement Natural gas operating revenues $1,071.4 $ ‐ $ ‐ $1,071.4 Depreciation and amortization expense 79.7 ‐ ‐ 79.7 Miscellaneous income (expense) 0.9 (0.1) ‐ 0.8 Interest expense 25.3 ‐ ‐ 25.3 Provision for income taxes 35.8 ‐ ‐ 35.8 Net income (loss) 42.5 (0.3) ‐ 42.2Total assets 2,986.7 4.7 (4.0) 2,987.4Cash expenditures for long‐lived assets 76.2 ‐ ‐ 76.2

‐ 68 ‐
2009 (Millions)
Natural GasUtility Other
Reconciling Eliminations
PGL Consolidated
Income Statement Natural gas operating revenues $1,148.7 $ ‐ $ ‐ $1,148.7 Depreciation and amortization expense 64.6 ‐ ‐ 64.6 Miscellaneous income (expense) 2.1 (0.2) ‐ 1.9 Interest expense 26.5 ‐ ‐ 26.5 Provision (benefit) for income taxes 18.4 (0.2) ‐ 18.2 Net income 28.0 ‐ ‐ 28.0Total assets 2,879.7 5.6 (3.8) 2,881.5Cash expenditures for long‐lived assets 76.8 ‐ ‐ 76.8 NOTE 19—RELATED PARTY TRANSACTIONS We routinely enter into transactions with related parties, including Integrys Energy Group and its subsidiaries. Under the ICC‐approved Services and Transfers Agreement (STA), we can provide to and receive from NSG; our parent, PELLC; and other wholly owned subsidiaries of PELLC, certain facilities, services, and assets. Services between NSG and us are priced at fully distributed cost. Otherwise, if we provide facilities or services, we charge the receiving party an amount equal to or greater than the fully distributed cost. If we receive facilities or services, we are charged the prevailing market price but no more than fully distributed cost. Costs are based on direct charges or an allocation method. For asset transfers between NSG and us, the transferring party charges its current net book value. For transactions involving other parties, the charge is the fair market value. Asset transfers to a nonutility are charged at the prevailing market price. Asset transfers involving us may require prior ICC approval. The ICC must approve changes or amendments to the STA. Under an ICC‐approved affiliated interest agreement (Regulated Agreement), we can provide to and receive from Integrys Energy Group and its regulated utility subsidiaries, certain services. All services are provided at cost. The ICC must approve changes or amendments to the Regulated Agreement. IBS provides 15 categories of services (including financial, human resources, and administrative services) to us pursuant to an affiliated interest agreement (IBS AIA), which has been approved, or from which we have been granted appropriate waivers, by the appropriate regulators. As required by FERC regulations for centralized service companies, IBS renders services at cost. The appropriate public utility commissions, including the ICC, must be notified prior to making changes to the services offered under and the allocation methods specified in the IBS AIA, and other changes would require prior ICC approval. Recovery of allocated costs is addressed in our rate cases. In 2010, a new affiliated interest agreement (Non‐IBS AIA) that would govern the provision of intercompany services, other than IBS services, within Integrys Energy Group, was submitted to the appropriate regulators for approval. (A previous filing in 2008 was withdrawn.) The Non‐IBS AIA was written primarily to limit the scope of services that had been provided under current agreements that are now being provided by IBS. The Non‐IBS AIA would replace the current agreements (except for the IBS AIA) referred to above, after proper approvals. The pricing methodologies from the current agreements would carry forward to the new agreement. The ICC approved the Non‐IBS AIA on

‐ 69 ‐
December 15, 2010, but it cannot take effect until it is approved in all jurisdictions and compliance filings are made. The following table shows activity associated with related party transactions for the year ended December 31: (Millions) 2011 2010 2009Natural gas sales to Integrys Energy Services $0.3 $0.4 $0.6Natural gas purchases from Integrys Energy Services ‐ 0.2 0.2Interest expense to Integrys Energy Group 0.4 0.2 0.4Interest expense to PELLC ‐ ‐ 0.1 We manage our liquidity by maintaining adequate financing commitments with related parties. We have the ability to borrow up to $150.0 million from PELLC and to loan to or borrow from NSG up to $50.0 million. The table below includes related party loan information at December 31: (Millions) 2011 2010Short‐term notes receivable from NSG $8.9 $ ‐

‐70‐
FINANCIAL STATEMENTS AND SUPPLEMENTARY DATA
G. INDEPENDENT AUDITORS’ REPORT To the Board of Directors of The Peoples Gas Light and Coke Company: We have audited the accompanying consolidated balance sheets and statements of capitalization of The Peoples Gas Light and Coke Company and subsidiary (the “Company”) as of December 31, 2011 and 2010, and the related consolidated statements of income, common shareholder’s equity, and cash flows for each of the three years in the period ended December 31, 2011. These financial statements are the responsibility of the Company’s management. Our responsibility is to express an opinion on these financial statements based on our audits. We conducted our audits in accordance with auditing standards generally accepted in the United States of America. Those standards require that we plan and perform the audit to obtain reasonable assurance about whether the financial statements are free of material misstatement. An audit includes consideration of internal control over financial reporting as a basis for designing audit procedures that are appropriate in the circumstances, but not for the purpose of expressing an opinion on the effectiveness of the Company’s internal control over financial reporting. Accordingly, we express no such opinion. An audit also includes examining, on a test basis, evidence supporting the amounts and disclosures in the financial statements, assessing the accounting principles used and significant estimates made by management, as well as evaluating the overall financial statement presentation. We believe that our audits provide a reasonable basis for our opinion. In our opinion, such consolidated financial statements present fairly, in all material respects, the financial position of the Company as of December 31, 2011 and 2010, and the results of their operations and their cash flows for each of the three years in the period ended December 31, 2011 in conformity with accounting principles generally accepted in the United States of America. /s/ Deloitte & Touche LLP March 5, 2012

(Millions, except ratio) 2011 2010 2009 2008 2007
EARNINGS Net income (loss) $56.6 $42.2 $28.0 $37.6 $(13.7)Provision (benefit) for income taxes 32.1 35.8 18.2 22.4 (10.5)
Income (loss) before taxes 88.7 78.0 46.2 60.0 (24.2)Total fixed charges as defined 25.0 26.4 27.5 32.9 33.2
Total earnings as defined $113.7 $104.4 $73.7 $92.9 $9.0
FIXED CHARGESInterest expense 24.0 25.3 26.5 32.4 $32.2 Interest factor applicable to rentals 1.0 1.1 1.0 0.5 1.0
Total fixed charges as defined $25.0 $26.4 $27.5 $32.9 $33.2
RATIO OF EARNINGS TO FIXED CHARGES 4.5 4.0 2.7 2.8 0.3
THE PEOPLES GAS LIGHT AND COKE COMPANYCOMPUTATION OF RATIO OF EARNINGS TO FIXED CHARGES
(Unaudited)
‐ 71 ‐