the people of queensland - section 1 · web view2011 census % of population 2006 census % of...
TRANSCRIPT

The People of QueenslandStatistics from the 2011 Census
Department of Immigration and Border Protection 2014
First published 2014
© Commonwealth of Australia 2014
ISBN: 978-1-920996-27-7
This work is copyright. You may download, display, print and reproduce this material in unaltered form only (retaining this notice) for your personal, non- commercial use or use within your organisation. Apart from any use as permitted under the Copyright Act 1968, all other rights are reserved.
Requests for further authorisation should be directed to the: Commonwealth Copyright Administration,Copyright Law Branch,Attorney-General’s DepartmentRobert Garran Offices National Circuit Barton ACT 2600
Fax: 02 6250 5989Email: [email protected].
Data Source: Australian Bureau of StatisticsData management and layout: SGS Economics and Planning

Contents
About this publication
How to use this publication
Notes on the Data
Abbreviations and Acronyms
SECTION 1 - Australian Overview
Tables
1.1 Australia key facts: 2001, 2006 and 2011 Census
1.2 All states and territories compared: 2011 Census
1.3 Birthplaces - Australia: 2006 and 2011 Census
1.4 Birthplace by birthplace of parents - Australia: 2011 Census
1.5 Generational components of the Australian population - Australia: 2006 and 2011 Census
1.6 Languages spoken at home - Australia: 2006 and 2011 Census
1.7 Australian Indigenous languages spoken at home - Australia: 2011 Census
1.8 Languages spoken at home by persons who speak English not well or not at all - Australia: 2011 Census
1.9 Religious affiliation - Australia: 2006 and 2011 Census
1.10 Ancestry - Australia: 2006 and 2011 Census
1.11 Ancestry by birthplace of parent(s) - Australia: 2011 Census
1.12.1 - 1.12.9 Australia - 4 page profile
Charts
1.1 Main overseas birthplaces - Australia: 2011 Census
1.2 Fastest growing overseas birthplaces - Australia: 2006 and 2011 Census
1.3 Local government areas with the highest number of overseas born - Australia: 2011 Census
1.4 Local government areas with the highest proportion of overseas born - Australia: 2011 Census
1.5 Main languages excluding English and Indigenous - Australia: 2011 Census
1.6 Fastest growing languages excluding English and Indigenous - Australia: 2006 and 2011 Census
1.7 Local government areas with highest number of language other than English speakers - Australia: 2011 Census
1.8 Local government areas with highest proportion of language other than English speakers - Australia: 2011 Census
1.9 Local government areas with highest number who speak English not well or not at all - Australia: 2011 Census
1.10 Local government areas with highest proportion who speak English not well or not at all - Australia: 2011 Census

About this Publication
The People of Queensland is a major compilation of statistics on birthplace, language, religion and ancestry from the2011 Census of Population and Housing. This publication has gone to considerable lengths to create a data source which is unique, accurate, detailed and comprehensive. Some of the features of this publication include:
• Customised local area tables. The People of Queensland presents ranked lists of birthplace, language and religion for each Local Government Area (LGA) in Queensland, along with age profiles of selected birthplace and language groups, and details on ancestry and birthplace of parents for all LGAs. This gives a very complete picture of the diversity of each area.
• Age-gender profiles for the most common birthplace, language and ancestry groups in Queensland show the diverse structure of our population.
• Detailed ancestry data by birthplace of parents, gives a clear picture of the extent of our migrant communities.
• English language competency by age, presenting the differing levels of competency amongst the various language and age groups.
How to use this Publication
This publication is presented in four sections, covering three broad geographical areas around which the data is arranged:
• Section 1 – Australian overview• Section 2 – Queensland overview• Section 3 – South-Eastern Queensland by Local Government Areas• Section 4 – Regional Queensland by Local Government Areas
The first two sections of the publication contain the most detailed data. They present a series of tables and graphics including:
• A full listing of birthplace, language, religion and ancestry data from the 2011 Census with comparisons to 2006 where appropriate.
• Graphics on the residential patterns of the major birthplace groups.• Special cross-tabulations of language with birthplace, religion with birthplace and ancestry with
birthplace of parents which reveal richer information on the make-up of the ethnic and religious communities in the State.
• Data on English language proficiency by age.• Age-sex histograms on major birthplace, language and ancestry groups.
Sections 3 and 4 are comprised of a series of 4 page profiles containing statistics on birthplace, language, religion and ancestry for each LGA in Queensland. These profiles can be used to compare different areas in Queensland – for example identifying the LGA with the highest overseas born population. They can also be compared against the 4 page profile for QLD at the end of section 2 – for example, whether the proportion of Italian speakers for a given area is above or below the QLD average.
Notes on the Data
The figures in this publication are based on data from the 2011, 2006 and 2001 Census of Population and Housing conducted by the Australian Bureau of Statistics (ABS), and are based on usual resident counts, i.e. counts of where people usually lived at the time of the Census.
Geography
In the summary tables, charts and 4 page profiles presented for Queensland, the geographic level used is 2011 Local Government Areas (LGA). Some of these have changed substantially since 2006 and 2001. Where amalgamations have occurred the amalgamated data has been presented. When boundaries have changed due to new LGAs forming or existing LGAs redefining their boundary, 2006 data is presented by aggregating the constituent Statistical Local Areas (SLAs) or Collection Districts (CDs) of the LGA and 2001 data is not presented.

Introduced Random Error
Data released by the ABS is subject to randomisation of small cells to maintain confidentiality of respondents. The following selected text is taken from the ABS 2011 Census Dictionary (further details as to how and when the introduced random error is used can be found in the glossary of ABS 2011 Census Dictionary Cat 2901.0):
Care is taken in the specification of tables to minimise the risk of identifying individuals. In addition, a technique has been developed to randomly adjust cell values. Random adjustment of the data is considered to be the most satisfactory technique for avoiding the release of identifiable Census data. When the technique is applied, all cells are slightly adjusted to prevent any identifiable data being exposed... No reliance should be placed on small cells as they are impacted by random adjustment, respondent and processing errors.(Source: ABS 2011 Census dictionary Cat 2901.0)
The effect of this randomisation is that there are small discrepancies in totals throughout the publication. For example, the total number of Australian born people in Queensland in table 2.2 is 1 person less than the figure shown in table 2.4. This is because table 2.4 is derived from a different ABS source which cross tabulates birthplace by birthplace of parents, each cell of which is subject to different levels of introduced random error.
Due to this randomisation of small numbers, it would be misleading to present numbers with a value of less than 10 in these publications. Therefore such values are suppressed and presented in the tables as “..”. It should be noted however, that even though these small values are not presented in the table, their values do contribute to the totals presented for each table.
Birthplace Data
In the 2011 Census the ABS coded the response to the birthplace question into 292 categories; these are based on the Standard Australian Classification of Countries (SACC) 2nd Edition, Revision 1. In the 2006 Census there were 285 categories.
The major differences between the 2011 and 2006 categories relate to new birthplaces categories being introduced or birthplaces used in 2006 being discontinued. As a result, 2011 data is reported for newly defined categories while 2006 data is not reported for discontinued categories. In order to maintain accurate totals, the data for discontinued 2006 categories is added to the not elsewhere classified category for 2006.
Language DataIn the 2011 Census, the ABS coded the response to the language question into 501 language categories based on the Australian Standard Classification of Languages (ASCL) 2nd Edition, Revision 1. In the 2006 Census there were 430 language categories based on the ASCL 2nd Edition, while the 2001 Census used 240 language categories based on the ASCL 1st Edition.
The major difference between the 2nd Edition, Revision 1 and 2nd edition ASCL results from the disaggregation of languages. This has resulted in the 2011 census reporting newly defined languages categories as well as making some 2006 language categories incomparable with 2011 data due to some elements being reassigned to different categories. Amalgamation of 2006 language categories and language name changes also occur.In cases where it is not possible to provide comparable 2006 data, an entry of “..” along with a footnote will be presented and the counts from these categories will be incorporated into a not elsewhere classified category for 2006. A selection of classification changes are listed below:
• The 2006 categories of Hokkien and Teochew have been amalgamated into the 2011 category Min Nan
• The 2006 category of Assyrian has been disaggregated into the 2011 categories Assyrian Neo-Aramaic, Chaldean Neo-Aramaic and Mandaean (Mandaic)
Religion Data
In the 2011 census there are 136 religion categories based on the Australian Standard Classification of Religious Groups (ASCRG) 2nd Edition, Revision 1. The 2006 also had 136 religion categories. The only difference in classification is the renaming of Latter Day Saints, nfd to Latter-day Saints, nfd.
Ancestry Data
In the 2011 census there are 319 categories based on the Australian Standard Classification of Cultural and Ethnic Groups (ASCCEG) 2nd Edition, Revision 1. The 2006 census used 275 categories.

The major differences between the 2nd Edition, Revision 1 and 2nd Edition ACCEG are due to the disaggregation of ancestries to produce increased classification detail. Many categories have retained the same name between 2006 and 2011 but still have changes in their underlying census classification. A footnote is included for cases in which a category should not be compared to a 2006 value due to some elements having been reassigned to new or existing categories.
In cases where it is not possible to provide comparable 2006 data, an entry of “..” along with a footnote will be presented and the counts from these categories will be incorporated into a not elsewhere classified category for 2006.
For both the 2006 and 2011 census, respondents were asked to mark the ancestries that they most closely identified with and to consider their ancestry back as far as three generations. Respondents had the option of reporting more than one ancestry but only the first two ancestries reported were coded for the census. Respondents did not have the option of ranking their answers to the ancestry question, so where a respondent reports two ancestries, those two ancestries have equal standing.
All ancestry data presented in the publication is based on a count of all responses (which can be up to two per person), meaning that double counting can occur. Where appropriate, the proportion of responses as well as the proportion of all persons in an area is presented along with the counts.
Abbreviations and AcronymsABS Australian Bureau of Statistics
ASCCEG Australian Standard Classification of Cultural and Ethnic Groups
ASCL Australian Standard Classification of Languages
ASCRG Australian Standard Classification of Religious Groups
LGA Local Government Area
LOTE Language Other than English
MESC Main English Speaking Countries
nec Not elsewhere classified
nfd Not further defined
NMESC Non-Main English Speaking Countries
OSB Overseas born
SACC Standard Australian Classification of Countries
SAR Special Administrative Region
SD Statistical Division
SSD Statistical Sub-Division

SECT ION 1Australian Overview
Table 1.1Australia
2001, 2006 and 2011 Census
Key Facts 2001 2006 2011
Population 18,769,271 19,855,287 21,507,719
Overseas Born (OSB)Total 4,105,670 4,416,020 5,290,436As a % of population 21.9 22.2 24.6Born in a non-main English speaking country (NMESC)1 2,503,018 2,740,667 3,377,070Born in a NMESC as a % of population 13.3 13.8 15.7Born in a NMESC as a % of OSB 61.0 62.1 63.8
Australian BornTotal 13,629,481 14,072,958 15,021,553As a % of population 72.6 70.9 69.8with both parents born overseas 1,503,689 1,586,394 1,807,091with both parents OSB as a % of population 8.0 8.0 8.4with only one parent born overseas2 1,973,500 2,056,639 2,265,288with one parent OSB as a % of population 10.5 10.4 10.5
Aboriginal / Torres Strait IslandersTotal 410,003 455,028 548,368As a % of population 2.2 2.3 2.5
Language other than English (LOTE) SpeakersSpeak a language other than English at home 2,853,829 3,146,191 3,912,936LOTE speakers as a % of population 15.2 15.8 18.2
English ProficiencySpeak English not well or not at all 531,835 561,420 655,379Poor English speakers as % of population 2.8 2.8 3.0
Note: The total population includes persons for whom a birthplaces is not stated. Percentage calculations are based on the total population.
1. NMESC excludes people born in Canada, Ireland, New Zealand, South Africa, United Kingdom and United States of America
2. Includes people who had one parent born overseas and one parent with a not stated birthplace

Table 1.2All States and Territories Compared - 2011 Census
Key FactsAustralia
New South Wales Victoria Queensland
South Australia
Western Australia Tasmania
Northern Territory
Australian Capital
TerritoryPopulation 21,507,719 6,917,655 5,354,039 4,332,738 1,596,571 2,239,172 495,352 211,943 357,219Overseas Born (OSB)Total 5,290,436 1,778,544 1,405,332 888,636 353,004 684,510 57,652 35,174 86,324As a % of population 24.6 25.7 26.2 20.5 22.1 30.6 11.6 16.6 24.2Born in a non-main English speaking country (NMESC)1
3,377,070 1,288,847 1,048,073 410,349 202,003 319,725 25,054 22,008 59,856
Born in a NMESC as a % of population 15.7 18.6 19.6 9.5 12.7 14.3 5.1 10.4 16.8Born in a NMESC as a % of OSB 63.8 72.5 74.6 46.2 57.2 46.7 43.5 62.6 69.3Born in mainly English speaking country (MESC) 1,913,366 489,697 357,259 478,287 151,001 364,785 32,598 13,166 26,468Born in a MESC as a % of population 8.9 7.1 6.7 11.0 9.5 16.3 6.6 6.2 7.4Born in a MESC as a % of OSB 36.2 27.5 25.4 53.8 42.8 53.3 56.5 37.4 30.7
Australian BornTotal 15,021,553 4,747,374 3,670,935 3,192,114 1,170,790 1,411,516 414,261 158,034 255,053As a % of population 69.8 68.6 68.6 73.7 73.3 63.0 83.6 74.6 71.4with both parents born overseas 1,807,091 653,631 549,581 224,800 126,966 197,348 15,349 10,291 28,921with both parents OSB as a % of population 8.4 9.4 10.3 5.2 8.0 8.8 3.1 4.9 8.1with only one parent born overseas2 2,265,288 689,322 548,209 457,636 174,997 289,279 42,053 18,633 44,896with one parent OSB as a % of population 10.5 10.0 10.2 10.6 11.0 12.9 8.5 8.8 12.6Aboriginal / Torres Strait IslandersTotal 548,368 172,624 37,990 155,824 30,431 69,665 19,625 56,778 5,185As a % of population 2.5 2.5 0.7 3.6 1.9 3.1 4.0 26.8 1.5Language other than English (LOTE) SpeakersSpeak a language other than English at home 3,912,936 1,554,332 1,235,436 423,840 229,551 325,055 22,149 56,680 64,669LOTE speakers as a % of population 18.2 22.5 23.1 9.8 14.4 14.5 4.5 26.7 18.1English ProficiencySpeak English not well or not at all 655,379 271,683 212,632 62,411 39,929 46,840 3,241 10,396 7,825Poor English speakers as % of population 3.0 3.9 4.0 1.4 2.5 2.1 0.7 4.9 2.2
Note: The total population includes persons for whom a birthplaces is not stated. Percentage calculations are based on the total population.
1. NMESC excludes people born in Canada, Ireland, New Zealand, South Africa, United Kingdom and United States of America
2. Includes people who had one parent born overseas and one parent with a not stated birthplace

Table 1.3Birthplaces
Australia: 2011 and 2066 Census
Ran
k
Birthplace2011
Census% of
Population 2006 CensusChange
2006-2011% change 2006-2011
39 Afghanistan 28,598 0.1 16,752 11,846 70.7223 Aland Islands1 33 0.0 .. .. ..111 Albania 2,398 0.0 2,016 382 18.9125 Algeria 1,171 0.0 1,004 167 16.6245 Americas, nfd 14 0.0 .. .. ..160 Angola 440 0.0 396 44 11.1240 Antarctica, nfd 17 0.0 12 5 41.7224 Antigua and Barbuda 33 0.0 27 6 22.2
64 Argentina 11,986 0.1 11,368 618 5.4131 Armenia 1,042 0.0 973 69 7.1215 Aruba 49 0.0 38 11 28.9
1 Australia 15,021,553 69.8 14,072,958 948,595 6.757 Austria 17,010 0.1 17,927 -917 -5.1
165 Azerbaijan 389 0.0 215 174 80.9176 Bahamas 241 0.0 207 34 16.4121 Bahrain 1,247 0.0 962 285 29.6
41 Bangladesh 27,809 0.1 16,096 11,713 72.8169 Barbados 359 0.0 343 16 4.7118 Belarus 1,604 0.0 1,244 360 28.9
83 Belgium 5,762 0.0 5,060 702 13.9210 Belize 60 0.0 60 0 0.0206 Benin 78 0.0 18 60 333.3158 Bermuda 446 0.0 387 59 15.2110 Bhutan 2,455 0.0 139 2,316 1,666.2138 Bolivia, Plurinational State of2 770 0.0 693 77 11.1
43 Bosnia and Herzegovina 25,683 0.1 24,633 1,050 4.3134 Botswana 969 0.0 864 105 12.2
59 Brazil 14,510 0.1 7,492 7,018 93.7106 Brunei Darussalam 2,626 0.0 2,392 234 9.8100 Bulgaria 2,915 0.0 2,677 238 8.9220 Burkina Faso 39 0.0 25 14 56.0117 Burundi 1,730 0.0 755 975 129.1
40 Cambodia 28,330 0.1 24,529 3,801 15.5174 Cameroon 277 0.0 125 152 121.6
30 Canada 38,871 0.2 31,614 7,257 23.0235 Cape Verde 23 0.0 22 1 4.5177 Caribbean, nfd 239 0.0 207 32 15.5205 Cayman Islands 79 0.0 24 55 229.2241 Central African Republic 17 0.0 .. .. ..225 Central America, nfd 32 0.0 18 14 77.8190 Central and West Africa, nfd 130 0.0 200 -70 -35.0226 Central Asia, nfd 32 0.0 115 -83 -72.2211 Chad 56 0.0 27 29 107.4
45 Chile 24,936 0.1 23,305 1,631 7.04 China (excludes SARs and
Taiwan)3318,969 1.5 206,588 112,381 54.4
66 Colombia 11,318 0.1 5,709 5,609 98.2242 Comoros 17 0.0 12 5 41.7108 Congo, Democratic Republic of 2,575 0.0 618 1,957 316.7
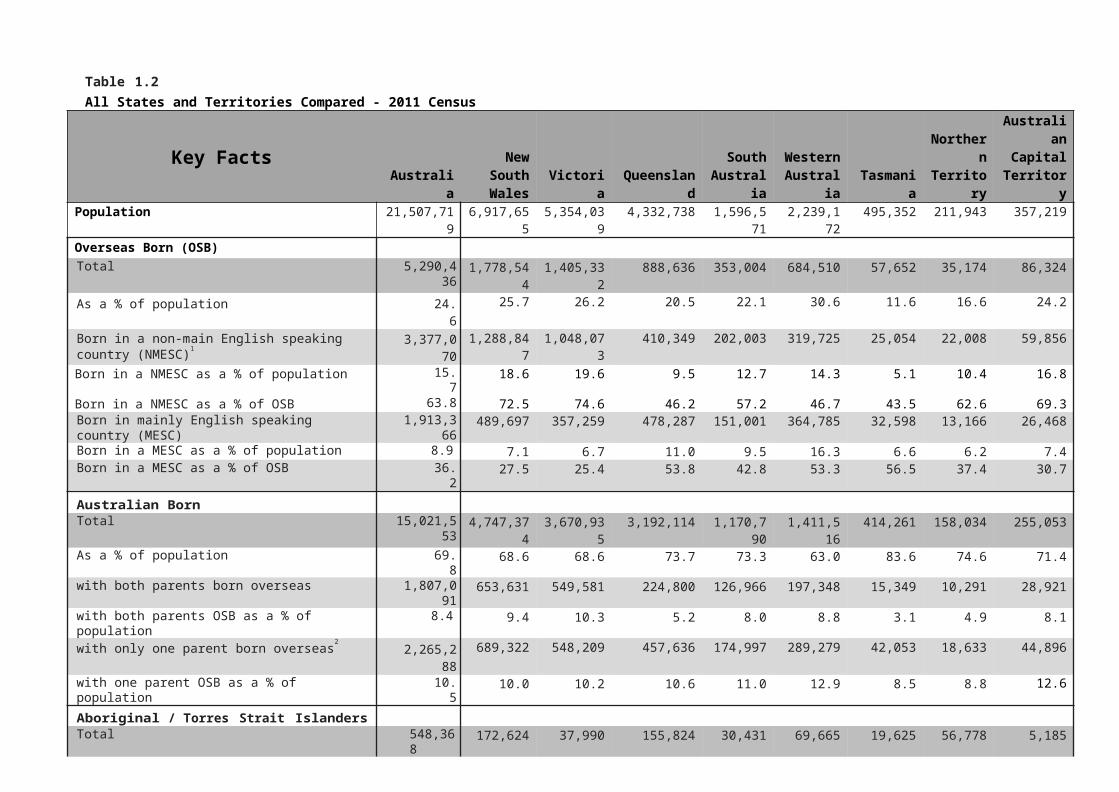
Table 1.3 (continued)Birthplaces
Australia: 2011 and 2006 Census
Ran
k
Birthplace2011
Census% of
Population2006
CensusChange
2006-2011% change 2006-2011
133 Congo, Republic of4 982 0.0 521 461 88.582 Cook Islands 6,092 0.0 5,028 1,064 21.2
166 Costa Rica 388 0.0 314 74 23.6159 Cote d'Ivoire5 445 0.0 255 190 74.5
23 Croatia 48,828 0.2 50,997 -2,169 -4.3146 Cuba 636 0.0 494 142 28.7198 Curacao1 95 0.0 .. .. ..
56 Cyprus 18,070 0.1 18,383 -313 -1.780 Czech Republic 7,437 0.0 7,180 257 3.674 Denmark 9,025 0.0 8,967 58 0.6
189 Djibouti 135 0.0 97 38 39.2231 Dominica 26 0.0 18 8 44.4192 Dominican Republic 121 0.0 80 41 51.3
87 Eastern Europe, nfd 4,768 0.0 5,627 -859 -15.3116 Ecuador 1,736 0.0 1,513 223 14.7
31 Egypt 36,533 0.2 33,495 3,038 9.169 El Salvador 9,652 0.0 9,397 255 2.7
2 England 911,592 4.2 856,940 54,652 6.4248 Equatorial Guinea 13 0.0 10 3 30.0101 Eritrea 2,841 0.0 2,015 826 41.0114 Estonia 1,928 0.0 1,935 -7 -0.4
75 Ethiopia 8,452 0.0 5,634 2,818 50.0195 Falkland Islands 110 0.0 101 9 8.9222 Faroe Islands6 37 0.0 24 13 54.2
22 Fiji 56,979 0.3 48,142 8,837 18.479 Finland 7,938 0.0 7,948 -10 -0.129 Former Yugoslav Republic of
Macedonia (FYROM)40,221 0.2 40,657 -436 -1.1
46 France 24,674 0.1 19,186 5,488 28.6163 French Polynesia 398 0.0 340 58 17.1236 Gabon 23 0.0 25 -2 -8.0202 Gambia 93 0.0 129 -36 -27.9102 Gaza Strip and West Bank 2,696 0.0 2,635 61 2.3161 Georgia 428 0.0 337 91 27.0
12 Germany 108,003 0.5 106,524 1,479 1.493 Ghana 3,866 0.0 2,769 1,097 39.6
162 Gibraltar 421 0.0 382 39 10.213 Greece 99,938 0.5 109,991 -10,053 -9.1
229 Greenland 31 0.0 38 -7 -18.4199 Grenada 95 0.0 110 -15 -13.6239 Guadeloupe 19 0.0 10 9 90.0204 Guam 83 0.0 77 6 7.8167 Guatemala 375 0.0 308 67 21.8150 Guernsey1 604 0.0 .. .. ..144 Guinea 649 0.0 335 314 93.7246 Guinea-Bissau 14 0.0 .. .. ..152 Guyana 525 0.0 498 27 5.4203 Haiti 91 0.0 81 10 12.3

Table 1.3 (continued)Birthplaces
Australia: 2011 and 2006 Census
Ran
k
Birthplace2011
Census% of
Population2006
CensusChange
2006-2011% change 2006-2011
181 Honduras 210 0.0 198 12 6.118 Hong Kong (SAR of China) 74,955 0.3 71,800 3,155 4.454 Hungary 19,092 0.1 20,162 -1,070 -5.3
148 Iceland 615 0.0 504 111 22.05 India 295,363 1.4 147,105 148,258 100.8
21 Indonesia 63,159 0.3 50,975 12,184 23.933 Iran 34,454 0.2 22,548 11,906 52.826 Iraq 48,171 0.2 32,519 15,652 48.120 Ireland 67,318 0.3 50,255 17,063 34.0
139 Isle of Man 755 0.0 689 66 9.671 Israel 9,229 0.0 7,788 1,441 18.5
6 Italy 185,401 0.9 199,124 -13,723 -6.9136 Jamaica 943 0.0 787 156 19.8
32 Japan 35,377 0.2 30,779 4,598 14.9129 Jersey1 1,056 0.0 .. .. ..
89 Jordan 4,620 0.0 3,719 901 24.2127 Kazakhstan 1,106 0.0 651 455 69.9
62 Kenya 13,832 0.1 9,935 3,897 39.2155 Kiribati 499 0.0 396 103 26.0208 Korea, Democratic People's
Republic of (North)69 0.0 56 13 23.2
19 Korea, Republic of (South) 74,538 0.3 52,762 21,776 41.3130 Kosovo1 1,050 0.0 .. .. ..
91 Kuwait 4,061 0.0 2,877 1,184 41.2171 Kyrgyzstan7 326 0.0 206 120 58.3
68 Laos 9,932 0.0 9,376 556 5.988 Latvia 4,675 0.0 5,610 -935 -16.716 Lebanon 76,451 0.4 74,849 1,602 2.1
197 Lesotho 100 0.0 79 21 26.6104 Liberia 2,673 0.0 1,523 1,150 75.5109 Libya 2,557 0.0 1,517 1,040 68.6234 Liechtenstein 24 0.0 .. .. ..105 Lithuania 2,639 0.0 3,071 -432 -14.1182 Luxembourg 203 0.0 167 36 21.6113 Macau (SAR of China) 2,268 0.0 2,015 253 12.6180 Madagascar 223 0.0 189 34 18.0213 Mainland South-East Asia, nfd 52 0.0 36 16 44.4135 Malawi 960 0.0 686 274 39.9
11 Malaysia 116,196 0.5 92,334 23,862 25.8168 Maldives 372 0.0 273 99 36.3214 Mali 51 0.0 47 4 8.5
28 Malta 41,274 0.2 43,701 -2,427 -5.6184 Maritime South-East Asia, nfd 180 0.0 194 -14 -7.2227 Marshall Islands 32 0.0 32 0 0.0217 Martinique 41 0.0 23 18 78.3221 Mauritania 39 0.0 16 23 143.8
48 Mauritius 23,280 0.1 18,173 5,107 28.198 Mexico 3,255 0.0 1,802 1,453 80.6

Table 1.3 (continued)Birthplaces
Australia: 2011 and 2006 Census
Ran
k
Birthplace2011
Census% of
Population2006
CensusChange
2006-2011% change 2006-2011
243 Micronesia, Federated States of 17 0.0 12 5 41.7228 Micronesia, nfd 32 0.0 24 8 33.3147 Middle East, nfd 634 0.0 109 525 481.7137 Moldova 898 0.0 637 261 41.0212 Monaco 55 0.0 50 5 10.0143 Mongolia 668 0.0 242 426 176.0123 Montenegro 1,179 0.0 846 333 39.4119 Morocco 1,564 0.0 1,294 270 20.9140 Mozambique 752 0.0 633 119 18.8
50 Myanmar 21,760 0.1 12,377 9,383 75.8132 Namibia 1,019 0.0 702 317 45.2154 Nauru 515 0.0 487 28 5.7
47 Nepal 24,635 0.1 4,567 20,068 439.417 Netherlands 76,047 0.4 78,923 -2,876 -3.6
122 New Caledonia 1,220 0.0 1,103 117 10.63 New Zealand 483,396 2.2 389,464 93,932 24.1
141 Nicaragua 716 0.0 668 48 7.2232 Niger 26 0.0 11 15 136.4
90 Nigeria 4,519 0.0 2,501 2,018 80.7142 Niue 704 0.0 576 128 22.2178 Norfolk Island 236 0.0 202 34 16.8
191 North Africa and the Middle East, nfd
127 0.0 52 75 144.2
188 North Africa, nfd 141 0.0 33 108 327.3201 Northern America, nfd 94 0.0 108 -14 -13.0238 Northern Europe, nfd 21 0.0 49 -28 -57.1
49 Northern Ireland 22,596 0.1 21,295 1,301 6.1249 Northern Mariana Islands 13 0.0 .. .. ..
94 Norway 3,710 0.0 3,629 81 2.2179 Oceania and Antarctica, nfd 234 0.0 393 -159 -40.5128 Oman 1,096 0.0 826 270 32.7
36 Pakistan 30,221 0.1 16,993 13,228 77.8237 Palau 22 0.0 13 9 69.2183 Panama 197 0.0 180 17 9.4
42 Papua New Guinea 26,787 0.1 24,022 2,765 11.5164 Paraguay 395 0.0 337 58 17.2
76 Peru 8,440 0.0 6,322 2,118 33.58 Philippines 171,233 0.8 120,540 50,693 42.1
24 Poland 48,678 0.2 52,254 -3,576 -6.858 Portugal 15,327 0.1 15,194 133 0.9
194 Puerto Rico 118 0.0 80 38 47.5149 Qatar 607 0.0 427 180 42.2186 Reunion8 174 0.0 127 47 37.0
60 Romania 14,051 0.1 13,879 172 1.255 Russian Federation 18,278 0.1 15,355 2,923 19.0
145 Rwanda 640 0.0 202 438 216.853 Samoa 19,093 0.1 15,242 3,851 25.3
175 Samoa, American 256 0.0 196 60 30.6

Table 1.3 (continued)Birthplaces
Australia: 2011 and 2006 Census
Ran
k
Birthplace2011
Census% of
Population2006
CensusChange
2006-2011% change 2006-2011
252 Sao Tome and Principe9 11 0.0 .. .. ..67 Saudi Arabia 10,517 0.0 3,481 7,036 202.110 Scotland 133,432 0.6 130,205 3,227 2.5
170 Senegal 337 0.0 198 139 70.251 Serbia 20,267 0.1 17,329 2,938 17.0
107 Seychelles 2,592 0.0 2,508 84 3.399 Sierra Leone 3,044 0.0 1,810 1,234 68.225 Singapore 48,646 0.2 39,972 8,674 21.792 Slovakia 3,939 0.0 3,323 616 18.581 Slovenia 6,099 0.0 6,221 -122 -2.0
115 Solomon Islands 1,758 0.0 1,497 261 17.484 Somalia 5,687 0.0 4,314 1,373 31.8
9 South Africa 145,683 0.7 104,133 41,550 39.9185 South America, nfd 180 0.0 .. .. ..
44 South Eastern Europe, nfd 25,070 0.1 33,357 -8,287 -24.895 South Sudan1 3,486 0.0 .. .. ..
233 South-East Asia, nfd 26 0.0 159 -133 -83.6209 Southern and Central Asia, nfd 68 0.0 .. .. ..244 Southern and East Africa, nec 15 0.0 10 5 50.0156 Southern and East Africa, nfd 490 0.0 598 -108 -18.1187 Southern Asia, nfd 142 0.0 55 87 158.2
63 Spain 13,057 0.1 12,277 780 6.414 Sri Lanka 86,413 0.4 62,257 24,156 38.8
216 St Helena 42 0.0 36 6 16.7230 St Kitts and Nevis 30 0.0 23 7 30.4218 St Lucia 41 0.0 25 16 64.0219 St Vincent and the Grenadines 41 0.0 37 4 10.8
52 Sudan 19,369 0.1 19,050 319 1.7196 Suriname 109 0.0 86 23 26.7172 Swaziland 300 0.0 233 67 28.8
78 Sweden 8,354 0.0 7,499 855 11.465 Switzerland 11,943 0.1 11,262 681 6.077 Syria 8,392 0.0 6,969 1,423 20.438 Taiwan 28,628 0.1 24,370 4,258 17.5
200 Tajikistan 95 0.0 46 49 106.596 Tanzania 3,437 0.0 2,300 1,137 49.427 Thailand 45,466 0.2 30,554 14,912 48.872 Timor-Leste10 9,225 0.0 9,317 -92 -1.0
173 Togo 279 0.0 34 245 720.6153 Tokelau 524 0.0 355 169 47.6
73 Tonga 9,208 0.0 7,581 1,627 21.5120 Trinidad and Tobago 1,406 0.0 1,263 143 11.3157 Tunisia 481 0.0 444 37 8.3
34 Turkey 32,845 0.2 30,490 2,355 7.7207 Turkmenistan 74 0.0 46 28 60.9193 Tuvalu 120 0.0 117 3 2.6103 Uganda 2,675 0.0 1,713 962 56.261 Ukraine 13,990 0.1 13,666 324 2.4

Table 1.3 (continued)Birthplaces
Australia: 2011 and 2006 Census
Ran
k
Birthplace2011
Census% of
Population2006
CensusChange
2006-2011% change 2006-2011
86 United Arab Emirates 4,899 0.0 2,975 1,924 64.712 United Kingdom, Channel
Islands and Isle of Man, nfd2,372 0.0 .. .. ..
15 United States of America 77,010 0.4 61,721 15,289 24.870 Uruguay 9,237 0.0 9,380 -143 -1.5124 Uzbekistan 1,175 0.0 697 478 68.6126 Vanuatu 1,108 0.0 987 121 12.397 Venezuela, Bolivarian Republic
of113,403 0.0 1,540 1,863 121.0
7 Vietnam12 185,039 0.9 159,850 25,189 15.8250 Virgin Islands, British 13 0.0 .. .. ..251 Virgin Islands, United States 12 0.0 12 0 0.037 Wales 28,675 0.1 25,314 3,361 13.3247 Wallis and Futuna 14 0.0 16 -2 -12.5151 Yemen 531 0.0 450 81 18.085 Zambia 5,538 0.0 4,079 1,459 35.835 Zimbabwe 30,252 0.1 20,154 10,098 50.1
Inadequately described 9,642 0.0 10,483 -841 -8.0At sea 118 0.0 118 0 0.0Not elsewhere classified13 58 0.0 4,811 -4,753 -98.8Not stated 1,195,730 5.6 1,366,309 -170,579 -12.5
Total Population 21,507,719 100.0 19,855,287 1,652,432 8.3
1. Newly defined countries in 2011 census
2. Reported as Bolivia in 2006
3. Reported as China (excludes SARs and Taiwan Province) in 2006
4. Reported as Congo in 2006
5. Reported as Côte d'Ivoire in 2006
6. Reported as Faeroe Islands in 2006
7. Reported as Kyrgyz Republic in 2006
8. Reported as Réunion in 2006
9. Reported as Sao Tomé and Principe in 2006
10. Reported as East Timor in 2006
11. Reported as Venezuela in 2006
12. Reported as Viet Nam in 2006
13. Countries reported in 2006 which have no 2011 definition are incorporated into an overall NEC category

Table 1.4Birthplace by birthplace of parents
Australia: 2011 Census
Ran
k
Birthplace
Both parents
Australian born
Both parents
overseas born
One parent
OS born/ one
parent Aust born
One parent
OS born/
one parent
not stated Other1 Total
% both parents
Australian born
39 Afghanistan 41 26,194 64 369 1,928 28,596 0.1224 Aland Islands .. 30 .. .. .. 33 ..111 Albania .. 2,286 .. 42 60 2,395 ..124 Algeria .. 1,127 .. 13 24 1,171 ..244 Americas, nfd .. 13 .. .. .. 13 ..160 Angola .. 427 .. .. .. 443 ..240 Antarctica, nfd .. .. .. .. .. 18 ..227 Antigua and Barbuda .. 28 .. .. .. 32 ..
64 Argentina 25 11,624 130 109 101 11,989 0.2131 Armenia .. 1,018 .. .. 15 1,041 ..215 Aruba .. 46 .. .. .. 46 ..
1 Australia 10,590,661 1,807,091 2,236,554 28,734 358,516 15,021,556 70.557 Austria 63 16,289 343 121 194 17,010 0.4
165 Azerbaijan .. 383 .. .. .. 388 ..176 Bahamas 11 203 23 .. .. 237 4.6121 Bahrain 59 1,083 83 10 13 1,248 4.7
41 Bangladesh 61 27,183 63 294 209 27,810 0.2169 Barbados .. 337 13 .. .. 358 ..118 Belarus .. 1,575 .. 11 16 1,602 ..
83 Belgium 102 5,315 258 35 54 5,764 1.8210 Belize .. 52 .. .. .. 57 ..205 Benin .. 69 .. .. .. 77 ..158 Bermuda 12 388 39 .. .. 448 2.7110 Bhutan .. 2,409 .. 25 19 2,453 ..138 Bolivia, Plurinational
State of 41 692 27 .. .. 771 5.343 Bosnia and Herzegovina 13 25,176 84 191 218 25,682 0.1
134 Botswana 14 912 29 11 .. 970 1.459 Brazil 66 14,001 246 106 93 14,512 0.5
106 Brunei Darussalam 98 2,378 112 29 12 2,629 3.7100 Bulgaria .. 2,853 18 17 29 2,917 ..221 Burkina Faso .. 36 .. .. .. 36 ..
50 Myanmar 31 21,144 58 261 265 21,759 0.1117 Burundi .. 1,657 .. 36 30 1,730 ..
40 Cambodia 40 27,349 121 428 393 28,331 0.1174 Cameroon .. 272 .. .. .. 275 ..
30 Canada 1,911 31,778 4,744 216 222 38,871 4.9233 Cape Verde .. 23 .. .. .. 23 ..177 Caribbean, nfd .. 222 .. .. .. 237 ..206 Cayman Islands .. 53 13 .. .. 75 ..241 Central African Republic .. 17 .. .. .. 17 ..225 Central America, nfd .. 29 .. .. .. 33 ..19 Central and West Africa,
nfd .. 124 .. .. .. 130 ..228 Central Asia, nfd .. 32 .. .. .. 32 ..212 Chad .. 48 .. .. .. 54 ..

Table 1.4 (continued)
Birthplace by birthplace of parents
Australia: 2011 Census
Ran
k
Birthplace
Both parents
Australian born
Both parents oversea
s born
One parent OS born/ one
parent Aust born
One parent
OS born/
one parent
not stated Other1 Total
% both parents
Australian born
45 Chile 99 24,082 246 285 228 24,940 0.4
4China (excludes SARs and Taiwan)
472 311,922 1,034 3,011 2,534 318,973 0.1
66 Colombia 118 10,843 155 93 109 11,318 1.0242 Comoros .. 17 .. .. .. 17 ..
108Congo, Democratic Republic of
.. 2,477 19 41 32 2,576 ..
133 Congo, Republic of .. 931 .. 14 31 982 ..82 Cook Islands 17 5,754 67 119 135 6,092 0.3
166 Costa Rica .. 359 18 .. .. 386 ..159 Cote d'Ivoire .. 414 .. 10 .. 445 ..
23 Croatia 37 47,527 265 467 535 48,831 0.1146 Cuba .. 614 .. .. 13 636 ..198 Curacao .. 95 .. .. .. 95 ..
56 Cyprus 26 17,466 192 204 185 18,073 0.180 Czech Republic 21 7,216 57 33 110 7,437 0.374 Denmark 63 8,473 388 57 43 9,024 0.7
189 Djibouti .. 126 .. .. . 134 ..230 Dominica .. 26 .. .. . 26 ..192 Dominican Republic .. 109 .. .. .. 121 ..
87 Eastern Europe, nfd .. 4,664 10 42 47 4,766 ..116 Ecuador .. 1,644 46 13 26 1,736 ..
31 Egypt 41 35,513 209 361 410 36,534 0.169 El Salvador 10 9,361 16 165 100 9,652 0.1
2 England 11,646 850,861 35,104 6,218 7,767 911,596 1.3245 Equatorial Guinea .. 13 .. .. .. 13 ..101 Eritrea .. 2,728 12 52 48 2,844 ..114 Estonia .. 1,884 18 .. 25 1,930 ..
75 Ethiopia 218 7,776 134 172 158 8,458 2.6195 Falkland Islands .. 99 .. .. .. 112 ..222 Faroe Islands .. 34 .. .. .. 34 ..
22 Fiji 937 53,303 1,355 683 705 56,983 1.679 Finland .. 7,686 124 42 81 7,941 ..
29Former Yugoslav Republic of Macedonia (FYROM)
41 38,831 340 480 527 40,219 0.1
46 France 271 22,974 1,029 180 221 24,675 1.1163 French Polynesia .. 356 24 .. .. 395 ..234 Gabon .. 20 .. .. . 23 ..202 Gambia .. 87 .. .. .. 90 ..102 Gaza Strip and West Bank .. 2,571 26 22 70 2,696 ..161 Georgia .. 418 .. .. .. 422 ..
12 Germany 409 103,554 2,386 681 975 108,005 0.493 Ghana 23 3,629 74 81 61 3,868 0.6
162 Gibraltar .. 392 20 .. .. 418 ..13 Greece 212 96,127 1,208 1,082 1,308 99,937 0.2
231 Greenland .. 26 .. .. .. 26 ..
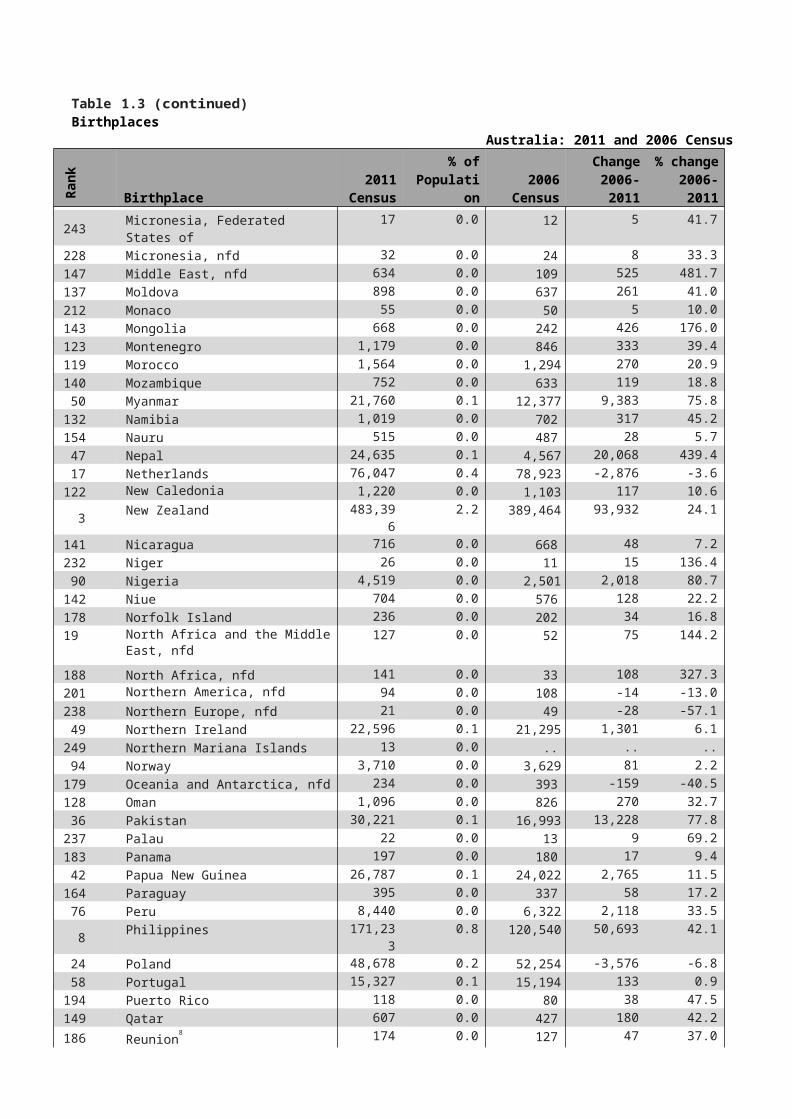
Table 1.4 (continued)Birthplace by birthplace of parents
Australia: 2011 Census
Ran
k
Birthplace
Both parents
Australian born
Both parents
overseas born
One parent
OS born/ one
parent Aust born
One parent
OS born/
one parent
not stated Other1 Total
% both parents
Australian born
199 Grenada .. 92 .. .. .. 95 ..239 Guadeloupe .. 19 .. .. .. 19 ..204 Guam 19 40 24 .. .. 83 22.9167 Guatemala 20 326 26 .. .. 372 5.4150 Guernsey .. 577 15 .. .. 602 ..144 Guinea .. 606 .. 14 24 644 ..246 Guinea-Bissau .. 13 .. .. .. 13 ..153 Guyana .. 510 .. .. .. 520 ..203 Haiti .. 78 .. .. .. 89 ..181 Honduras .. 187 11 .. .. 206 ..
18 Hong Kong (SAR of China) 1,442 70,592 1,864 662 398 74,958 1.953 Hungary 12 18,597 106 148 233 19,096 0.1
148 Iceland .. 562 44 .. .. 610 ..5 India 805 287,921 1,344 3,119 2,172 295,361 0.3
21 Indonesia 273 59,894 1,435 657 905 63,164 0.433 Iran 34 32,733 92 277 1,316 34,452 0.126 Iraq 54 46,608 106 580 824 48,172 0.120 Ireland 204 64,334 1,519 559 705 67,321 0.3
139 Isle of Man .. 705 35 .. .. 758 ..71 Israel 141 8,342 590 76 83 9,232 1.5
6 Italy 346 178,141 1,813 2,176 2,928 185,404 0.2136 Jamaica 18 864 45 .. 14 941 1.9
32 Japan 473 32,127 2,258 304 219 35,381 1.3129 Jersey .. 1,004 45 .. .. 1,058 ..
89 Jordan 18 4,446 59 48 48 4,619 0.4127 Kazakhstan .. 1,073 15 .. .. 1,103 ..
62 Kenya 137 13,097 313 162 125 13,834 1.0155 Kiribati 49 366 67 12 .. 500 9.8
208 Korea, Democratic People's Republic of (North)
.. 62 .. .. .. 67 ..
19 Korea, Republic of (South) 1,176 71,263 659 896 548 74,542 1.6130 Kosovo .. 1,026 .. .. .. 1,050 ..
91 Kuwait 27 3,900 43 56 37 4,063 0.7171 Kyrgyzstan .. 324 .. .. .. 324 ..
68 Laos 19 9,603 29 137 144 9,932 0.288 Latvia .. 4,535 30 31 71 4,674 ..16 Lebanon 124 73,166 939 1,053 1,171 76,453 0.2
197 Lesotho .. 98 .. .. .. 102 ..104 Liberia .. 2,495 11 89 68 2,671 ..109 Libya 25 2,439 15 32 43 2,554 1.0232 Liechtenstein .. 20 .. .. .. 24 ..105 Lithuania .. 2,562 14 .. 48 2,636 ..182 Luxembourg 16 172 11 .. .. 199 8.0113 Macau (SAR of China) .. 2,208 22 19 20 2,272 ..180 Madagascar .. 210 .. .. .. 222 ..

Table 1.4 (continued)Birthplace by birthplace of parents
Australia: 2011 Census
Ran
k
Birthplace
Both parents
Australian born
Both parents
overseas born
One parent
OS born/ one
parent Aust born
One parent
OS born/
one parent
not stated Other1 Total
% both parents
Australian born
213 Mainland South-East Asia, nfd .. 51 .. .. .. 54 ..135 Malawi 11 902 21 13 .. 954 1.2
11 Malaysia 4,181 107,839 2,596 979 605 116,200 3.6168 Maldives .. 369 .. .. .. 369 ..214 Mali .. 48 .. .. .. 51 ..
28 Malta 88 39,791 455 443 500 41,277 0.2184 Maritime South-East Asia, nfd 27 121 32 .. .. 180 15.0223 Marshall Islands .. 22 12 .. .. 34 ..220 Martinique .. 35 .. .. .. 38 ..219 Mauritania .. 39 .. .. .. 39 ..
48 Mauritius 40 22,674 99 237 231 23,281 0.298 Mexico 31 3,017 162 17 30 3,257 1.0
247 Micronesia, Federated States of .. 13 .. .. .. 13 ..226 Micronesia, nfd .. 23 10 .. .. 33 ..147 Middle East, nfd .. 619 .. .. .. 634 ..137 Moldova .. 884 .. 10 .. 897 ..211 Monaco 13 40 .. .. .. 56 23.2143 Mongolia .. 646 .. .. 16 662 ..123 Montenegro .. 1,124 26 .. 17 1,176 ..119 Morocco .. 1,504 35 10 10 1,563 ..140 Mozambique .. 730 .. .. .. 750 ..132 Namibia .. 976 36 .. .. 1,018 ..154 Nauru 100 292 115 .. 13 520 19.2
47 Nepal 53 23,999 59 305 223 24,639 0.217 Netherlands 361 73,039 1,554 412 684 76,050 0.5
122 New Caledonia 28 1,076 94 .. 13 1,220 2.33 New Zealand 5,602 436,963 29,605 4,679 6,549 483,398 1.2
141 Nicaragua .. 690 .. 11 .. 716 ..236 Niger .. 19 .. .. .. 22 ..
90 Nigeria 55 4,241 80 50 93 4,519 1.2142 Niue .. 679 .. 14 10 706 ..178 Norfolk Island 48 94 82 .. 11 235 20.4
191North Africa and the Middle East, nfd .. 116 .. .. .. 124 ..
187 North Africa, nfd .. 136 .. .. .. 140 ..201 Northern America, nfd .. 76 10 .. .. 91 ..237 Northern Europe, nfd .. 21 .. .. .. 21 ..
49 Northern Ireland 52 21,945 358 133 109 22,597 0.2250 Northern Mariana Islands .. .. .. .. .. 12 ..
94 Norway 36 3,377 253 10 31 3,707 1.0179 Oceania and Antarctica, nfd .. 15 .. .. 219 234 ..128 Oman 31 1,000 42 .. 16 1,096 2.8
36 Pakistan 51 29,300 192 328 353 30,224 0.2

Table 1.4 (continued)
Birthplace by birthplace of parents
Australia: 2011 Census
Ran
k
Birthplace
Both parents
Australian born
Both parents
overseas born
One parent
OS born/ one
parent Aust born
One parent
OS born/
one parent
not stated Other1 Total
% both parents
Australian born
238 Palau .. 15 .. .. .. 21 ..183 Panama .. 165 25 .. .. 195 ..
42 Papua New Guinea 7,846 12,953 5,491 193 306 26,789 29.3164 Paraguay .. 375 .. .. .. 393 ..
76 Peru 35 8,132 105 85 82 8,439 0.48 Philippines 512 163,550 3,206 2,163 1,804 171,235 0.3
24 Poland 40 47,506 160 371 605 48,682 0.158 Portugal 20 14,844 117 163 184 15,328 0.1
194 Puerto Rico .. 96 19 .. .. 115 ..149 Qatar 24 540 43 .. .. 607 4.0186 Reunion .. 162 .. .. .. 173 ..
60 Romania 38 13,618 72 137 187 14,052 0.355 Russian Federation 17 17,811 146 141 163 18,278 0.1
145 Rwanda .. 613 .. 13 12 638 ..54 Samoa 56 18,015 203 366 454 19,094 0.3
175 Samoa, American .. 231 14 .. .. 254 ..251 Sao Tome and Principe .. 11 .. .. .. 11 ..
67 Saudi Arabia 112 9,956 228 147 75 10,518 1.110 Scotland 792 127,174 3,296 941 1,227 133,430 0.6
170 Senegal .. 316 .. .. 11 336 ..51 Serbia .. 19,677 173 230 178 20,266 ..
107 Seychelles .. 2,513 23 33 28 2,597 ..99 Sierra Leone 11 2,871 .. 81 71 3,042 0.425 Singapore 2,286 43,524 2,162 419 259 48,650 4.792 Slovakia .. 3,872 18 19 25 3,938 ..81 Slovenia .. 5,921 30 70 70 6,096 ..
115 Solomon Islands 177 1,287 260 19 18 1,761 10.184 Somalia .. 5,320 31 159 166 5,684 ..
9 South Africa 559 140,607 2,769 1,031 721 145,687 0.4185 South America, nfd .. 174 .. .. .. 177 ..
44 South Eastern Europe, nfd 22 24,406 93 270 283 25,074 0.195 South Sudan 13 3,323 16 82 49 3,483 0.4
235 South-East Asia, nfd .. 23 .. .. .. 23 ..209 Southern and Central Asia, nfd .. 67 .. .. .. 67 ..243 Southern and East Africa, nec .. .. .. .. .. 15 ..156 Southern and East Africa, nfd 11 460 .. .. .. 488 2.3188 Southern Asia, nfd .. 137 .. .. .. 137 ..
63 Spain 95 12,296 361 133 174 13,059 0.714 Sri Lanka 334 83,689 409 783 1,201 86,416 0.4
216 St Helena .. 37 .. .. .. 43 ..229 St Kitts and Nevis .. 30 .. .. .. 30 ..217 St Lucia .. 43 .. .. .. 43 ..

Table 1.4 (continued)Birthplace by birthplace of parents
Australia: 2011 Census
Ran
k
Birthplace
Both parents
Australian born
Both parents
overseas born
One parent OS born/ one
parent Aust born
One parent
OS born/
one parent
not stated Other1 Total
% both parents
Australian born
218St Vincent and the Grenadines .. 41 .. .. .. 41 ..
52 Sudan 59 18,270 79 458 505 19,371 0.3196 Suriname .. 106 .. .. .. 106 ..172 Swaziland .. 278 14 .. .. 296 ..
78 Sweden 95 7,544 608 58 49 8,354 1.165 Switzerland 260 10,603 949 66 67 11,945 2.277 Syria .. 8,072 53 128 134 8,393 ..38 Taiwan 170 27,837 237 277 110 28,631 0.6
200 Tajikistan .. 95 .. .. .. 95 ..96 Tanzania 77 3,173 104 43 41 3,438 2.227 Thailand 569 42,220 1,717 470 491 45,467 1.372 Timor-Leste .. 8,942 45 117 113 9,226 ..
173 Togo .. 268 .. .. .. 279 ..152 Tokelau .. 496 .. 18 .. 526 ..
73 Tonga 62 8,649 145 150 203 9,209 0.7120 Trinidad and Tobago .. 1,333 49 14 .. 1,407 ..157 Tunisia .. 473 .. .. .. 483 ..
34 Turkey 41 31,620 360 414 415 32,850 0.1207 Turkmenistan .. 72 .. .. .. 72 ..193 Tuvalu .. 111 .. .. .. 117 ..103 Uganda 19 2,492 51 56 57 2,675 0.7
61 Ukraine 17 13,639 43 99 192 13,990 0.186 United Arab Emirates 229 4,289 308 41 35 4,902 4.7
112United Kingdom, Channel Islands and Isle of Man, nfd 53 1,909 103 25 280 2,370 2.2
15 United States of America 5,048 60,222 10,807 471 464 77,012 6.670 Uruguay .. 8,991 57 87 97 9,238 ..
125 Uzbekistan .. 1,143 .. 16 .. 1,171 ..126 Vanuatu 175 730 193 .. .. 1,107 158
97Venezuela, Bolivarian Republic of 24 3,263 60 39 22 3,408 0.7
7 Vietnam 413 177,967 812 2,490 3,356 185,038 0.2248 Virgin Islands, British .. 13 .. .. .. 13 ..37 Wales 96 27,484 741 173 184 28,678 0.3
249 Wallis and Futuna .. 13 .. .. .. 13 ..151 Yemen .. 494 21 .. .. 534 ..
85 Zambia 84 5,191 177 40 48 5,540 1.535 Zimbabwe 94 29,164 565 228 204 30,255 0.3
Inadequately described 319 8,302 246 159 619 9,645 3.3At sea .. 91 23 .. .. 118 ..
Not elsewhere classified 2
.. 53 .. .. .. 67 ..Not stated 111,755 81,093 21,136 4,227 977,517 1,195,728 9.3
Total 10,757,093 6,876,580 2,396,482 83,004 1,394,560 21,507,719 50.0
1. One parent Australian born and one parent with a not stated birthplace or both parents with a not stated birthplace2. Birthplaces with totals less than 10 are incorporated into an NEC category

Ran
kR
ank
Table 1.5
Generational components of the Australian populationAustralia: 2011 and 2006 Census
2011 Census
% of population
2006 Census
% of population
Change 2006-2011
% Change
2006-2011
Australian born with both parentsAustralian born 10,590,661 49.2 10,057,874 50.7 532,787 5.3Australian born with one parentoverseas born 1 2,265,288 10.5 2,056,639 10.4 208,649 10.1Australian born with both parents overseas born 1,807,091 8.4 1,586,394 8.0 220,697 13.9Australian born with one or both parents birthplace not stated 358,516 1.7 372,047 1.9 -13,531 -3.6
Total Australian born 15,021,556 69.8 14,072,954 70.9 948,602 6.7Total overseas born 5,290,435 24.6 4,416,020 22.2 874,415 19.8Not stated birthplace 1,195,728 5.6 1,366,309 6.9 -170,581 -12.5
Total 21,507,719 100.0 19,855,287 100.0 1,652,432 8.3
1. Includes people who had one parent born overseas and one parent with a not stated birthplace

Chart 1.1Main overseas birthplaces
Australia: 2011 Census
Ran
k Birthplace 2011 Census% of population
1 England 911,592 4.22 New Zealand 483,396 2.23 China (exc. SARs and Taiwan) 318,969 1.54 India 295,363 1.45 Italy 185,401 0.96 Vietnam 185,039 0.97 Philippines 171,233 0.88 South Africa 145,683 0.79 Scotland 133,432 0.610 Malaysia 116,196 0.511 Germany 108,003 0.512 Greece 99,938 0.513 Sri Lanka 86,413 0.414 United States of America 77,010 0.415 Lebanon 76,451 0.416 Netherlands 76,047 0.417 Hong Kong (SAR of China) 74,955 0.318 Korea, Republic of (South) 74,538 0.319 Ireland 67,318 0.320 Indonesia 63,159 0.321 Fiji 56,979 0.322 Croatia 48,828 0.223 Poland 48,678 0.224 Singapore 48,646 0.225 Iraq 48,171 0.226 Thailand 45,466 0.227 Malta 41,274 0.228 Former Yugoslav Republic of 40,221 0.229 Canada 38,871 0.230 Egypt 36,533 0.2

Chart 1.2Fastest growing overseas birthplaces
Australia: 2011 and 2006 Census
Ran
k
Birthplace 2011 Census
% change 2006-11
1 Bhutan 2,455 1666.22 Togo 279 720.63 Nepal 24,635 439.44 Congo, Democratic Republic of 2,575 316.75 Rwanda 640 216.86 Saudi Arabia 10,517 202.17 Mongolia 668 176.08 Burundi 1,730 129.19 Cameroon 277 121.6
10 Venezuela, Bolivarian Republic of 3,403 121.011 India 295,363 100.812 Colombia 11,318 98.213 Guinea 649 93.714 Brazil 14,510 93.715 Congo, Republic of 982 88.516 Azerbaijan 389 80.917 Nigeria 4,519 80.718 Mexico 3,255 80.619 Pakistan 30,221 77.820 Myanmar 21,760 75.821 Liberia 2,673 75.522 Cote d’Ivoire 445 74.523 Bangladesh 27,809 72.824 Afghanistan 28,598 70.725 Senegal 337 70.226 Kazakhstan 1,106 69.927 Uzbekistan 1,175 68.628 Libya 2,557 68.629 Sierra Leone 3,044 68.230 United Arab Emirates 4,899 64.7

Chart 1.3
Local government areas with highest number of overseas bornAustralia: 2011 Census
Ran
k
LGABorn
overseas% of LGA
1 Brisbane (QLD) 295,195 28.32 Gold Coast (QLD) 138,040 27.93 Blacktown (NSW) 113,217 37.64 Fairfield (NSW) 98,655 52.55 Casey (VIC) 88,108 34.96 Brimbank (VIC) 84,291 46.17 Greater Dandenong (VIC) 76,130 56.18 Monash (VIC) 75,806 44.89 Parramatta (NSW) 74,898 44.9
10 Logan (QLD) 72,611 26.111 Sydney (NSW) 72,137 42.612 Liverpool (NSW) 71,714 39.813 Moreton Bay (QLD) 71,709 19.014 Stirling (WA) 70,004 35.815 Bankstown (NSW) 68,722 37.716 Canterbury (NSW) 66,129 48.117 Sunshine Coast (QLD) 60,780 19.818 Wanneroo (WA) 60,458 39.819 Joondalup (WA) 57,425 37.720 Hornsby (NSW) 55,496 35.421 The Hills Shire (NSW) 55,353 32.622 Wyndham (VIC) 54,404 33.723 Hume (VIC) 53,970 32.224 Whittlesea (VIC) 52,007 33.625 Whitehorse (VIC) 50,637 33.526 Moreland (VIC) 49,754 33.827 Randwick (NSW) 49,646 38.528 Darebin (VIC) 46,081 33.829 Glen Eira (VIC) 45,927 35.130 Boroondara (VIC) 45,028 28.3

Chart 1.4
Local government areas with the highest proportion of overseas born
Australia: 2011 Census
Ran
k
LGABorn
overseas % of LGA1 Auburn (NSW) 41,982 56.92 Greater Dandenong (VIC) 76,130 56.13 Strathfield (NSW) 18,532 52.74 Burwood (NSW) 17,066 52.65 Fairfield (NSW) 98,655 52.56 Perth (WA) 8,627 51.67 Canterbury (NSW) 66,129 48.18 Melbourne (VIC) 44,533 47.69 Brimbank (VIC) 84,291 46.1
10 Canning (WA) 39,221 45.911 Parramatta (NSW) 74,898 44.912 Monash (VIC) 75,806 44.813 Ashfield (NSW) 18,248 44.314 Rockdale (NSW) 42,398 43.615 Holroyd (NSW) 42,739 42.616 Sydney (NSW) 72,137 43.117 Willoughby (NSW) 28,533 42.418 Ryde (NSW) 43,544 42.319 Botany Bay (NSW) 16,604 42.220 Hurstville (NSW) 32,931 41.821 Kogarah (NSW) 23,016 41.222 Adelaide (SA) 8,017 40.823 Victoria Park (WA) 13,151 40.524 Liverpool (NSW) 71,714 39.825 Wanneroo (WA) 60,458 39.826 Maribyrnong (VIC) 28,423 39.727 Randwick (NSW) 49,646 38.528 Subiaco (WA) 6,758 38.529 Bayswater (WA) 23,490 38.330 Waverley (NSW) 24,003 37.8

Table 1.6
Languages spoken at homeAustralia: 2011 and 2006 Census
Ran
k
Language2011
Census% of
Population 2006 CensusChange
2006-2011% change 2006-2011
200 Acehnese 79 0.0 80 -1 -1.3114 Acholi 993 0.0 528 465 88.1
84 African Languages, nec1 3,262 0.0 3,790 -528 -13.9103 African Languages, nfd 1,624 0.0 1,609 15 0.9
32 Afrikaans 35,031 0.2 16,809 18,222 108.494 Akan 2,136 0.0 1,358 778 57.358 Albanian 8,945 0.0 7,858 1,087 13.8
191 American Languages 120 0.0 88 32 36.479 Amharic 4,515 0.0 2,854 1,661 58.2
168 Anuak2 209 0.0 .. .. ..4 Arabic 287,175 1.3 243,665 43,510 17.9
54 Armenian 9,707 0.0 9,621 86 0.9207 Aromunian (Macedo-Romanian) 62 0.0 62 0 0.0172 Assamese 193 0.0 103 90 87.4
41 Assyrian Neo-Aramaic2 21,477 0.1 .. .. ..61 Auslan 8,406 0.0 5,537 2,869 51.815 Australian Indigenous Languages 61,798 0.3 55,700 6,098 10.9
165 Azeri 226 0.0 173 53 30.6176 Balinese 162 0.0 124 38 30.6177 Balochi 155 0.0 117 38 32.5139 Bari2 408 0.0 .. .. ..203 Basque 71 0.0 75 -4 -5.3209 Bassa2 57 0.0 .. .. ..186 Belorussian 140 0.0 442 -302 -68.3129 Bemba 628 0.0 253 375 148.2
31 Bengali 35,645 0.2 20,221 15,424 76.3206 Bikol 64 0.0 40 24 60.0
93 Bisaya 2,241 0.0 1,208 1,033 85.5163 Bislama 232 0.0 156 76 48.7
47 Bosnian 16,269 0.1 15,740 529 3.492 Bulgarian 2,317 0.0 1,983 334 16.849 Burmese 12,339 0.1 7,458 4,881 65.4
111Burmese and Related Languages, nec 1,103 0.0 75 1,028 1,370.7
112Burmese and Related Languages, nfd 1,066 0.0 .. .. ..
5 Cantonese 263,674 1.2 244,557 19,117 7.8167 Catalan 211 0.0 146 65 44.5106 Cebuano 1,419 0.0 971 448 46.1218 Celtic, nec 34 0.0 31 3 9.7228 Celtic, nfd 10 0.0 36 -26 -72.2
56 Chaldean Neo-Aramaic2 9,560 0.0 .. .. ..120 Chin Haka3 831 0.0 393 438 111.5198 Chinese, nec 90 0.0 23 67 291.3
40 Chinese, nfd 23,798 0.1 11,668 12,130 104.082 Creole, nfd 3,979 0.0 4,095 -116 -2.816 Croatian 61,547 0.3 63,616 -2,069 -3.3
183 Cypriot, so described 148 0.0 242 -94 -38.867 Czech 7,263 0.0 6,902 361 5.2

Table 1.6 (continued)
Languages spoken at homeAustralia: 2011 and 2006 Census
Ran
k
Language2011
Census% of
Population2006
CensusChange
2006-2011% change 2006-2011
173 Czechoslovakian, so described2 182 0.0 .. .. ..170 Dan (Gio-Dan)2 196 0.0 .. .. ..
74 Danish 5,754 0.0 5,444 310 5.743 Dari 20,179 0.1 14,310 5,869 41.0
143 Dhivehi 364 0.0 246 118 48.053 Dinka 9,807 0.0 6,596 3,211 48.7
201 Dravidian, nec 75 0.0 24 51 212.527 Dutch 37,247 0.2 36,184 1,063 2.9
223 Eastern Asian Languages, nfd 18 0.0 16 2 12.5185 Eastern European Languages, nfd 143 0.0 159 -16 -10.1
1 English 16,509,292 76.8 15,581,333 927,959 6.0107 Estonian 1,417 0.0 1,252 165 13.2140 Ewe 405 0.0 85 320 376.5
69 Fijian 6,828 0.0 5,255 1,573 29.9108 Fijian Hindustani2 1,408 0.0 .. .. ..
20 Filipino 55,401 0.3 39,044 16,357 41.972 Finnish 5,973 0.0 5,873 100 1.718 French 57,739 0.3 43,217 14,522 33.690 French Creole, nfd 2,396 0.0 1,897 499 26.3
199 Frisian 80 0.0 91 -11 -12.1141 Fulfulde2 396 0.0 .. .. ..179 Ga 153 0.0 95 58 61.1121 Gaelic (Scotland) 804 0.0 659 145 22.0180 Georgian 152 0.0 126 26 20.6
11 German 80,370 0.4 75,635 4,735 6.3144 Gilbertese 350 0.0 194 156 80.4
6 Greek 252,217 1.2 252,227 -10 0.035 Gujarati 34,211 0.2 11,875 22,336 188.159 Hakka 8,922 0.0 7,964 958 12.0
133 Harari 519 0.0 374 145 38.8194 Hausa 108 0.0 82 26 31.7
65 Hazaraghi2 7,606 0.0 .. .. ..55 Hebrew 9,667 0.0 7,568 2,099 27.7
9 Hindi 111,351 0.5 70,008 41,343 59.197 Hmong 2,024 0.0 2,013 11 0.542 Hungarian 20,883 0.1 21,561 -678 -3.1
213 Iban 49 0.0 24 25 104.2226 Iberian Romance, nec 15 0.0 22 -7 -31.8216 Iberian Romance, nfd 40 0.0 35 5 14.3153 Icelandic 289 0.0 234 55 23.5116 Igbo 885 0.0 372 513 137.9146 IIokano 343 0.0 322 21 6.5147 Ilonggo (Hiligaynon) 325 0.0 186 139 74.7137 Indo-Aryan, nec1 442 0.0 67 375 559.7
80 Indo-Aryan, nfd 4,230 0.0 5,091 -861 -16.919 Indonesian 55,870 0.3 42,037 13,833 32.9
190 Invented Languages 121 0.0 107 14 13.1220 Iranic, nec1 23 0.0 324 -301 -92.9

Table 1.6 (continued)
Languages spoken at homeAustralia: 2011 and 2006 Census
Ran
k
Language2011
Census% of
Population 2006 CensusChange
2006-2011% change 2006-2011
221 Iranic, nfd 20 0.0 10 10 100.099 Irish 1,896 0.0 915 981 107.2
3 Italian 299,833 1.4 316,893 -17,060 -5.426 Japanese 43,692 0.2 35,112 8,580 24.4
210 Javanese 56 0.0 49 7 14.373 Kannada 5,924 0.0 3,251 2,673 82.271 Karen 6,400 0.0 783 5,617 717.4
178 Kashmiri 155 0.0 85 70 82.437 Khmer 29,519 0.1 24,708 4,811 19.5
189 Kikuyu 125 0.0 93 32 34.4135 Kinyarwanda (Rwanda)2 501 0.0 .. .. ..
87 Kirundi (Rundi)2 2,737 0.0 .. .. ..225 Kiwai 16 0.0 66 -50 -75.8102 Konkani 1,677 0.0 867 810 93.4
12 Korean 79,786 0.4 54,623 25,163 46.1219 Kpelle2 25 0.0 .. .. ..197 Krahn2 96 0.0 .. .. ..
91 Krio 2,364 0.0 792 1,572 198.578 Kurdish 4,586 0.0 3,597 989 27.557 Lao 9,539 0.0 9,373 166 1.8
158 Latin 250 0.0 205 45 22.083 Latvian 3,625 0.0 4,179 -554 -13.3
217 Letzeburgish 40 0.0 28 12 42.9175 Liberian (Liberian English)2 163 0.0 .. .. ..
98 Lithuanian 1,900 0.0 2,005 -105 -5.2208 Loma (Lorma)2 59 0.0 .. .. ..156 Luganda 256 0.0 130 126 96.9196 Luo 97 0.0 85 12 14.1
14 Macedonian 68,848 0.3 67,832 1,016 1.5122 Madi2 765 0.0 .. .. ..166 Makaton 214 0.0 205 9 4.4
45 Malay 16,564 0.1 11,360 5,204 45.839 Malayalam 25,111 0.1 7,090 18,021 254.234 Maltese 34,396 0.2 36,517 -2,121 -5.8
154 Mandaean (Mandaic)2 282 0.0 .. .. ..2 Mandarin 336,409 1.6 220,603 115,806 52.5
134 Mandinka2 506 0.0 .. .. ..195 Mann2 99 0.0 .. .. ..
77 Maori (Cook Island) 4,636 0.0 3,646 990 27.251 Maori (New Zealand) 9,977 0.0 6,617 3,360 50.860 Marathi 8,572 0.0 4,047 4,525 111.885 Mauritian Creole 3,256 0.0 726 2,530 348.5
215Middle Eastern Semitic Languages, nec 47 0.0 .. .. ..
46 Min Nan4 16,372 0.1 14,135 2,237 15.8164 Mon 230 0.0 135 95 70.4128 Mongolian 634 0.0 208 426 204.8127 Mon-Khmer, nec 651 0.0 49 602 1,228.6

Ran
kR
ank
Table 1.6 (continued)
Languages spoken at homeAustralia: 2011 and 2006 Census
Ran
k
Language2011
Census% of
Population 2006 CensusChange
2006-2011% change 2006-2011
182 Moro (Nuba Moro)2 150 0.0 .. .. ..130 Motu (HiriMotu)5 569 0.0 411 158 38.4155 Nauruan 281 0.0 247 34 13.8113 Ndebele 1,064 0.0 394 670 170.1
38 Nepali 27,154 0.1 4,655 22,499 483.3124 Niue 711 0.0 531 180 33.9
88 Norwegian 2,673 0.0 2,296 377 16.4101 Nuer 1,702 0.0 1,198 504 42.1148 Nyanja (Chichewa) 321 0.0 201 120 59.7192 Oceanian Pidgins and Creoles, nec 117 0.0 74 43 58.1222 Oceanian Pidgins and Creoles, nfd 19 0.0 17 2 11.8149 Oriya 318 0.0 180 138 76.7
96 Oromo 2,030 0.0 996 1,034 103.8160 Pacific Austronesian Languages, nec 240 0.0 197 43 21.8188 Pacific Austronesian Languages, nfd 127 0.0 140 -13 -9.3181 Pampangan 151 0.0 113 38 33.6162 Papua New Guinea Languages, nec 235 0.0 116 119 102.6136 Papua New Guinea Languages, nfd 466 0.0 43 423 983.7
76 Pashto 4,801 0.0 2,570 2,231 86.833 Persian (excluding Dari) 34,562 0.2 22,843 11,719 51.3
104 Pidgin, nfd 1,583 0.0 1,452 131 9.0202 Pitcairnese 75 0.0 62 13 21.0
22 Polish 50,695 0.2 53,390 -2,695 -5.036 Portuguese 33,351 0.2 25,776 7,575 29.413 Punjabi 71,230 0.3 23,162 48,068 207.5
151 Rohingya2 298 0.0 .. .. ..50 Romanian 12,246 0.1 10,896 1,350 12.4
184 Romany 148 0.0 150 -2 -1.3145 Rotuman 348 0.0 249 99 39.8
25 Russian 44,059 0.2 36,504 7,555 20.730 Samoan 36,571 0.2 28,527 8,044 28.2
224 Scandinavian, nec 17 0.0 16 1 6.3227 Scandinavian, nfd 11 0.0 .. .. ..
21 Serbian 55,114 0.3 52,529 2,585 4.970 Serbo-Croatian/Yugoslavian, so
described 6,687 0.0 9,315 -2,628 -28.2125 Seychelles Creole 702 0.0 18 684 3,800.0169 Shilluk 202 0.0 59 143 242.4
63 Shona 8,006 0.0 2,796 5,210 186.3205 Sign Languages, nec 66 0.0 30 36 120.0110 Sign Languages, nfd 1,250 0.0 1,378 -128 -9.3118 Sindhi 867 0.0 450 417 92.7
24 Sinhalese 48,191 0.2 29,055 19,136 65.975 Slovak 4,991 0.0 4,578 413 9.081 Slovene 4,183 0.0 4,312 -129 -3.0
161 Solomon Islands Pijin 237 0.0 116 121 104.352 Somali 9,913 0.0 6,650 3,263 49.1

Ran
kR
ank
Table 1.6 (continued)
Languages spoken at homeAustralia: 2011 and 2006 Census
Ran
k
Language2011
Census% of
Population 2006 CensusChange
2006-2011% change 2006-2011
159Southeast Asian Austronesian Languages, nec 247 0.0 138 109 79.0
157Southeast Asian Austronesian Languages, nfd 254 0.0 503 -249 -49.5
62 Southern Asian Languages, nfd 8,151 0.0 6,869 1,282 18.78 Spanish 117,498 0.5 98,003 19,495 19.9
214 Spanish Creole, nfd 48 0.0 226 -178 -78.868 Swahili 6,886 0.0 3,052 3,834 125.666 Swedish 7,332 0.0 5,904 1,428 24.2
126 Swiss, so described 658 0.0 733 -75 -10.210 Tagalog 81,457 0.4 53,286 28,171 52.9
204 Tai, nec 71 0.0 59 12 20.323 Tamil 50,152 0.2 32,703 17,449 53.4
193 Tatar 112 0.0 115 -3 -2.644 Telugu 18,721 0.1 8,278 10,443 126.2
115 Tetum 955 0.0 844 111 13.229 Thai 36,683 0.2 23,643 13,040 55.2
211 Themne2 56 0.0 .. .. ..123 Tibetan 746 0.0 396 350 88.4187 Tigre 131 0.0 132 -1 -0.8
86 Tigrinya 2,794 0.0 1,661 1,133 68.2131 Timorese 553 0.0 623 -70 -11.2
89 Tok Pisin (Neomelanesian)6 2,645 0.0 1,602 1,043 65.1119 Tokelauan 860 0.0 604 256 42.4
48 Tongan 16,008 0.1 12,726 3,282 25.8138 Tswana 442 0.0 508 -66 -13.0142 Tulu 392 0.0 207 185 89.4212 Turkic, nec 53 0.0 17 36 211.8229 Turkic, nfd 10 0.0 .. .. ..
17 Turkish 59,623 0.3 53,858 5,765 10.7150 Turkmen 302 0.0 218 84 38.5174 Tuvaluan 182 0.0 147 35 23.8
64 Ukrainian 7,761 0.0 9,016 -1,255 -13.928 Urdu 36,836 0.2 19,288 17,548 91.0
117 Uygur 874 0.0 369 505 136.9152 Uzbek 291 0.0 140 151 107.9
7 Vietnamese 233,390 1.1 194,852 38,538 19.8105 Welsh 1,430 0.0 1,072 358 33.4
95 Wu 2,065 0.0 1,528 537 35.1171 Xhosa 195 0.0 116 79 68.1100 Yiddish 1,764 0.0 1,907 -143 -7.5109 Yoruba 1,277 0.0 575 702 122.1132 Zulu 544 0.0 285 259 90.9
Other Eastern Asian Languages, nec 53 0.0 62 -9 -14.5Other Eastern European Languages, nec 16 0.0 18 -2 -11.1Other Southeast Asian Languages 43 0.0 46 -3 -6.5Other Southern Asian Languages 675 0.0 229 446 194.8
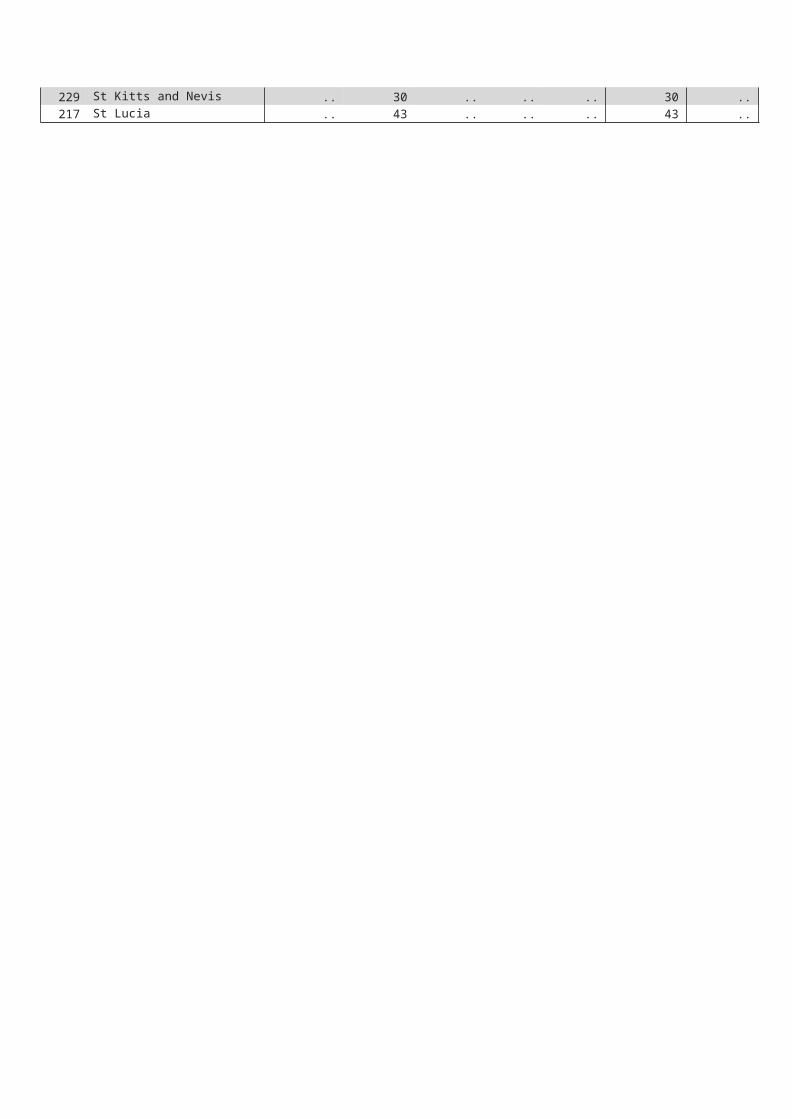
Table 1.6 (continued)
Languages spoken at homeAustralia: 2011 and 2006 Census
Ran
k
Language2011
Census% of
Population 2006 CensusChange
2006-2011% change 2006-2011
Other Southern European Languages, nec 89 0.0 71 18 25.4Other Southwest and Central Asian Languages, nec 13 0.0 .. 10 333.3Inadequately described 8,603 0.0 9,067 -464 -5.1Non-verbal, so described 21,906 0.1 27,002 -5,096 -18.9Not elsewhere classified7 23,524 0.1 23,524 0 0.0Not stated 1,085,491 5.0 1,127,760 -42,269 -3.7Total 21,507,719 100.0 19,855,294 1,652,425 8.3
1. Language classification modified since 2006. Some elements have been moved into newly defined 2011 classifications
2. Newly defined language in 2011
3. Reported as Haka in 2006
4. Reported as two separate languages, Hokkien and Teochew, in 2006
5. Reported as Motu in 2006
6. Reported as Tok Pisin in 20067. Languages reported in 2006 which cannot be assigned a 2011 category are incorporated into this overall NEC category
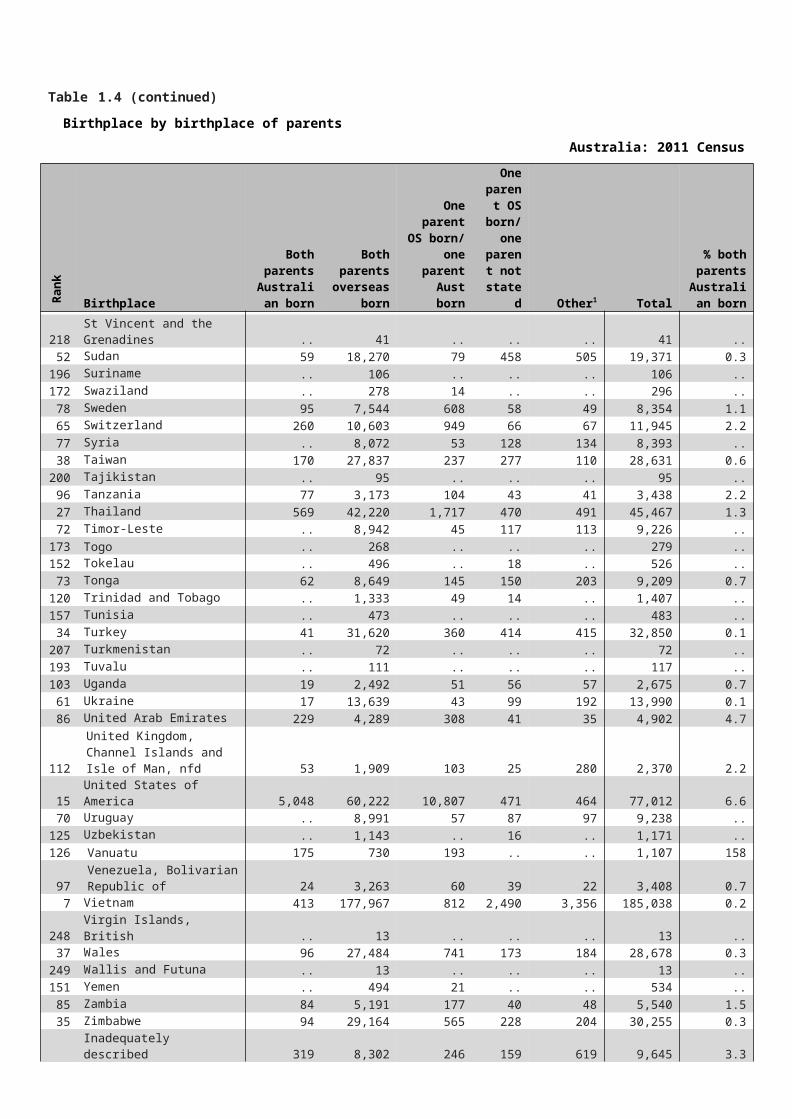
Table 1.7Australian Indigenous languages spoken at home
Australia: 2011 Census
Ran
k
Language2011
Census
% of Indigenous Language Speakers
15 Aboriginal English, so described 1,062 1.753 Adnymathanha 150 0.2
118 Alawa 17 0.0169 Alngith 0 0.0
9 Alyawarr 1,860 3.0169 Amurdak 0 0.0
12 Anindilyakwa 1,485 2.419 Anmatyerr, nec 934 1.5
169 Anmatyerr, nfd 0 0.0169 Antekerrepenh 0 0.0154 Antikarinya 5 0.0141 Arabana 8 0.0169 Arandic, nec 0 0.0169 Arandic, nfd 0 0.0129 Arnhem Land and Daly River Region Languages, nec 11 0.0111 Arnhem Land and Daly River Region Languages, nfd 25 0.0
14 Arrernte, nec 1,322 2.145 Arrernte, nfd 232 0.4
169 Baanbay 0 0.0169 Badimaya 0 0.0
57 Bandjalang 134 0.274 Banyjima 87 0.1
169 Barababaraba 0 0.048 Bardi 172 0.3
141 Batjala 8 0.0140 Bidjara 9 0.0
83 Bilinarra 59 0.169 Bunuba 96 0.220 Burarra 932 1.5
169 Burarran, nfd 0 0.0169 Burraran, nec 0 0.0
42 Cape York Peninsula Languages, nec 243 0.4135 Cape York Peninsula Languages, nfd 10 0.0141 Central Anmatyerr 8 0.0141 Daatiwuy 8 0.0169 Dadi Dadi 0 0.0
78 Dalabon 73 0.194 Dhalwangu 38 0.1
135 Dhanggatti 10 0.0169 Dhangu, nec 0 0.0103 Dhangu, nfd 29 0.0121 Dharawal 16 0.0169 Dhay'yi, nec 0 0.0112 Dhay'yi, nfd 21 0.0112 Dhuwal, nec 21 0.0
44 Dhuwal, nfd 235 0.4169 Dhuwala, nec 0 0.0
71 Dhuwala, nfd 89 0.138 Dhuwaya 285 0.5

Australia : 2011 Census
Table 1.7 (continued)Australian Indigenous languages spoken at home
Australia: 2011 Census
Ran
k
Language2011
Census
% of Indigenous Language Speakers
141 Diyari 8 0.0106 Djabugay 27 0.0118 Djabwurrung 17 0.0
4 Djambarrpuyngu 2,974 4.8169 Djangu 0 0.0108 Djapu 26 0.0169 Djarrwark 0 0.0141 Djinang, nec 8 0.0
65 Djinang, nfd 103 0.2169 Djinba 0 0.0169 Djinba, nec 0 0.0135 Djinba, nfd 10 0.0121 Dyirbal 16 0.0156 Eastern Anmatyerr 4 0.0
25 Eastern Arrernte 527 0.954 Galpu 148 0.2
169 Gambera 0 0.074 Gamilaraay 87 0.196 Ganalbingu 32 0.176 Garrwa 86 0.1
169 Garuwali 0 0.080 Girramay 64 0.1
152 Githabul 7 0.0161 Golumala 3 0.0
63 Gooniyandi 106 0.2161 Gudanji 3 0.0169 Gudjal 0 0.0
47 Gumatj 184 0.382 Gumbaynggir 60 0.1
103 Gundjeihmi 29 0.071 Gun-nartpa 89 0.151 Gupapuyngu 157 0.323 Gurindji 534 0.9
169 Gurindji Kriol 0 0.095 Gurr-goni 35 0.118 Guugu Yimidhirr 977 1.6
169 Guyamirrilili 0 0.056 Iwaidja 135 0.2
169 Jaminjung 0 0.022 Jaru 568 0.9
169 Jawi 0 0.0100 Jawoyn 30 0.0100 Jingulu 30 0.0
17 Kalaw Kawaw Ya/Kalaw Lagaw Ya 985 1.6161 Kanai 3 0.0
93 Karajarri 39 0.1154 Kariyarra 5 0.0
61 Kartujarra 119 0.284 Kaurna 58 0.1
161 Kayardild 3 0.049 Kaytetye 171 0.3
169 Keerray-Woorroong 0 0.0

Table 1.7 (continued)
Australian Indigenous languages spoken at homeAustralia: 2011 Census
Ran
k
Language2011
Census
% of Indigenous Language Speakers
50 Kija 169 0.3118 Kimberley Area Languages, nec 17 0.0156 Kimberley Area Languages, nfd 4 0.0
99 Koko-Bera 31 0.11 Kriol 6,780 11.0
169 Kugu Muminh 0 0.0106 Kukatha 27 0.0
26 Kukatja 521 0.841 Kuku Yalanji 254 0.4
112 Kunbarlang 21 0.060 Kune 121 0.264 Kuninjku 104 0.210 Kunwinjku 1,645 2.7
169 Kunwinjkuan, nec 0 0.058 Kuuk Thayorre 129 0.2
129 Kuuku-Ya'u 11 0.0169 Kuwema 0 0.0169 Kuwinjkuan, nfd 0 0.0169 Ladji Ladji 0 0.0112 Lamalama 21 0.0
71 Lardil 89 0.1141 Larrakiya 8 0.0169 Light Warlpiri 0 0.0161 Liyagalawumirr 3 0.0169 Liyagawumirr 0 0.0
11 Luritja 1,505 2.4161 Madarrpa 3 0.0129 Malak Malak 11 0.0169 Malngin 0 0.0
84 Mangala 58 0.1169 Mangarrayi 0 0.0169 Manggalili 0 0.0169 Manyjalpingu 0 0.0
32 Manyjilyjarra 346 0.6141 Maringarr 8 0.0135 Marra 10 0.0169 Marramaninyshi 0 0.0126 Marrangu 14 0.0169 Marridan (Maridan) 0 0.0116 Marrithiyel 20 0.0
21 Martu Wangka 605 1.0169 Matngala 0 0.0
31 Maung 367 0.679 Mayali 67 0.146 Meriam Mir 186 0.367 Miriwoong 99 0.2
169 Mirning 0 0.0169 Morrobalama 0 0.0
61 Mudburra 119 0.27 Murrinh Patha 2,411 3.9
135 Muruwari 10 0.065 Na-kara 103 0.2

Table 1.7 (continued)
Australian Indigenous languages spoken at homeAustralia: 2011 Census
Ran
k
Language2011
Census
% of Indigenous Language Speakers
89 Narungga 46 0.133 Ndjebbana (Gunavidji) 336 0.516 Ngaanyatjarra 1,041 1.7
169 Ngalakgan 0 0.0169 Ngaliwurru 0 0.0169 Ngandi 0 0.0
68 Ngan'gikurunggurr 98 0.2169 Ngardi 0 0.0
91 Ngarinyin 41 0.134 Ngarinyman 310 0.590 Ngarluma 45 0.139 Ngarrindjeri 271 0.4
169 Ngatjumaya 0 0.0169 Nhangu 0 0.0156 Nhangu, nec 4 0.0169 Northern Desert Fringe Area Languages, nec 0 0.0169 Northern Desert Fringe Area Languages, nfd 0 0.0129 Nungali 11 0.0
43 Nunggubuyu 239 0.496 Nyamal 32 0.140 Nyangumarta 262 0.481 Nyikina 63 0.130 Nyungar 369 0.6
156 Other Australian Indigenous Languages, nfd 4 0.0169 Other Yolngu Matha, nec 0 0.0
88 Paakantyi 47 0.1141 Palyku/Nyiyaparli 8 0.0
55 Pintupi 140 0.23 Pitjantjatjara 3,486 5.6
59 Rembarrnga 124 0.2169 Rirratjingu 0 0.0121 Ritharrngu 16 0.0161 Thaynakwith 3 0.0
8 Tiwi 2,210 3.6169 Tjungundji 0 0.0169 Tjupany 0 0.0
29 Torres Strait Island Languages, nfd 406 0.792 Waanyi 40 0.1
161 Wagilak 3 0.0100 Wagiman 30 0.0
70 Wajarri 92 0.124 Walmajarri 528 0.9
129 Waluwarra 11 0.086 Wambaya 56 0.1
126 Wangkajunga 14 0.0169 Wangkangurru 0 0.0
35 Wangkatha 298 0.5108 Wangurri 26 0.0169 Wanyjirra 0 0.0141 Wardaman 8 0.0169 Wargamay 0 0.0117 Warlmanpa 19 0.0

Table 1.7 (continued)
Australian Indigenous languages spoken at homeAustralia: 2011 Census
Ran
k
Language2011
Census
% of Indigenous Language Speakers
5 Warlpiri 2,554 4.1125 Warnman 15 0.0141 Warramiri 8 0.0
37 Warumungu 286 0.5126 Wergaia 14 0.0
27 Western Arrarnta 487 0.8121 Western Desert Language, nec 16 0.0169 Western Desert Language, nfd 0 0.0
13 Wik Mungkan 1,358 2.2156 Wik Ngathan 4 0.0
52 Wiradjuri 151 0.2169 Worla 0 0.0169 Worrorra 0 0.0169 Wubulkarra 0 0.0129 Wunambal 11 0.0
96 Wurlaki 32 0.1169 Yakuy, nec 0 0.0169 Yakuy, nfd 0 0.0
28 Yankunytjatjara 452 0.7169 Yan-nhangu 0 0.0
77 Yanyuwa 77 0.1108 Yawuru 26 0.0169 Yidiny 0 0.0
36 Yindjibarndi 296 0.5153 Yinhawangka 6 0.0
6 Yolngu Matha, nfd 2,446 4.0103 Yorta Yorta 29 0.0
87 Yulparija 49 0.12 Yumplatok (Torres Strait Creole) 5,368 8.7
169 Yupangathi 0 0.0Other Australian Indigenous Languages, nec 575 0.9Australian Indigenous Languages, nfd 2,743 4.4
Total 61,798 100.0

Table 1.8Languages spoken at home by persons who speak English not well or not at all
Australia: 2011 Census
Language 0-14 15-24Age25-44
Persons45-64 65+ Total
Mandarin 12,104 8,163 18,929 27,119 12,027 78,342Vietnamese 10,777 2,807 21,672 30,495 10,040 75,791Cantonese 6,165 2,865 9,372 28,558 17,735 64,695Arabic 11,888 2,824 11,467 11,573 8,280 46,032Italian 1,630 581 1,499 3,803 34,895 42,408Greek 3,448 630 1,089 6,515 29,828 41,510Korean 4,630 2,057 9,759 6,781 2,700 25,927Non-verbal, so described 14,589 521 744 391 180 16,425Spanish 2,433 365 1,715 3,894 6,066 14,473Turkish 1,830 310 2,822 4,265 2,688 11,915Macedonian 873 108 514 3,693 6,266 11,454Khmer 1,332 476 3,030 3,775 1,368 9,981Serbian 1,029 57 873 4,117 3,781 9,857Croatian 520 55 291 1,765 5,442 8,073Russian 1,198 79 685 1,463 4,091 7,516Japanese 2,419 582 2,621 1,095 556 7,273Chinese, nfd 615 1,809 1,904 1,722 719 6,769Thai 1,149 551 3,135 1,613 250 6,698Punjabi 2,444 285 1,523 1,006 778 6,036Persian (excluding Dari) 1,133 318 1,803 1,543 1,068 5,865Dari 1,748 532 1,803 1,300 422 5,805Hindi 2,927 133 799 785 1,071 5,715Polish 530 40 276 1,581 3,140 5,567Indonesian 1,863 289 1,121 1,218 497 4,988Portuguese 628 177 835 1,483 1,840 4,963Assyrian Neo-Aramaic 997 123 958 1,308 1,078 4,464Karen 1,389 727 1,229 650 146 4,141Tamil 1,624 126 869 756 591 3,966Urdu 2,409 117 686 418 190 3,820Bengali 1,773 178 765 264 105 3,085Samoan 913 121 446 1,053 509 3,042Bosnian 292 28 368 1,587 740 3,015Min Nan 290 46 298 1,355 1,022 3,011Hazaraghi 963 422 1,152 395 40 2,972Burmese 580 260 1,180 707 239 2,966Tagalog 1167 138 462 530 645 2942Nepali 1,010 302 937 500 187 2,936Chaldean Neo-Aramaic 728 177 802 812 343 2862Maltese 71 33 106 638 2,012 2,860Gujarati 1,444 68 651 375 245 2,783Sinhalese 1,365 43 570 462 256 2,696French 1,166 179 360 329 657 2,691Other LOTE Languages 7,190 434 991 1,063 1,700 11,378Not stated 25,833 3,938 11,496 11,801 12,603 65,671
Number of LOTE speakers who speak English not well or not at all 141,106 34,074 124,607 176,556 179,036 655,379

Table 1.8 (continued)
Languages spoken at home by persons who speak English not well or not at allAustralia: 2011 Census
Language 0-14 15-24Percentage
Age25-44
of language
45-64group
65+ Total
Mandarin 15.5 10.4 24.2 34.6 15.4 100.0Vietnamese 14.2 3.7 28.6 40.2 13.2 100.0Cantonese 9.5 4.4 14.5 44.1 27.4 100.0Arabic 25.8 6.1 24.9 25.1 18.0 100.0Italian 3.8 1.4 3.5 9.0 82.3 100.0Greek 8.3 1.5 2.6 15.7 71.9 100.0Korean 17.9 7.9 37.6 26.2 10.4 100.0Non-verbal, so described 88.8 3.2 4.5 2.4 1.1 100.0Spanish 16.8 2.5 11.8 26.9 41.9 100.0Turkish 15.4 2.6 23.7 35.8 22.6 100.0Macedonian 7.6 0.9 4.5 32.2 54.7 100.0Khmer 13.3 4.8 30.4 37.8 13.7 100.0Serbian 10.4 0.6 8.9 41.8 38.4 100.0Croatian 6.4 0.7 3.6 21.9 67.4 100.0Russian 15.9 1.1 9.1 19.5 54.4 100.0Japanese 33.3 8.0 36.0 15.1 7.6 100.0Chinese, nfd 9.1 26.7 28.1 25.4 10.6 100.0Thai 17.2 8.2 46.8 24.1 3.7 100.0Punjabi 40.5 4.7 25.2 16.7 12.9 100.0Persian (excluding Dari) 19.3 5.4 30.7 26.3 18.2 100.0Dari 30.1 9.2 31.1 22.4 7.3 100.0Hindi 51.2 2.3 14.0 13.7 18.7 100.0Polish 9.5 0.7 5.0 28.4 56.4 100.0Indonesian 37.3 5.8 22.5 24.4 10.0 100.0Portuguese 12.7 3.6 16.8 29.9 37.1 100.0Assyrian Neo-Aramaic 22.3 2.8 21.5 29.3 24.1 100.0Karen 33.5 17.6 29.7 15.7 3.5 100.0Tamil 40.9 3.2 21.9 19.1 14.9 100.0Urdu 63.1 3.1 18.0 10.9 5.0 100.0Bengali 57.5 5.8 24.8 8.6 3.4 100.0Samoan 30.0 4.0 14.7 34.6 16.7 100.0Bosnian 9.7 0.9 12.2 52.6 24.5 100.0Min Nan 9.6 1.5 9.9 45.0 33.9 100.0Hazaraghi 32.4 14.2 38.8 13.3 1.3 100.0Burmese 19.6 8.8 39.8 23.8 8.1 100.0Tagalog 39.7 4.7 15.7 18.0 21.9 100.0Nepali 34.4 10.3 31.9 17.0 6.4 100.0Chaldean Neo-Aramaic 25.4 6.2 28.0 28.4 12.0 100.0Maltese 2.5 1.2 3.7 22.3 70.3 100.0Gujarati 51.9 2.4 23.4 13.5 8.8 100.0Sinhalese 50.6 1.6 21.1 17.1 9.5 100.0French 43.3 6.7 13.4 12.2 24.4 100.0Other LOTE Languages 63.2 3.8 8.7 9.3 14.9 100.0Not stated 39.3 6.0 17.5 18.0 19.2 100.0
Number of LOTE speakers who speak English not well or not at all 21.5 5.2 19.0 26.9 27.3 100.0

Chart 1.5Main languages excluding English and Indigenous
Australia: 2011 Census
Ran
k
Language2011
Census% of
population
1 Mandarin 336,409 1.62 Italian 299,833 1.43 Arabic 287,175 1.34 Cantonese 263,674 1.25 Greek 252,217 1.26 Vietnamese 233,390 1.17 Spanish 117,498 0.58 Hindi 111,351 0.59 Tagalog 81,457 0.4
10 German 80,370 0.411 Korean 79,786 0.412 Punjabi 71,230 0.313 Macedonian 68,848 0.314 Croatian 61,547 0.315 Turkish 59,623 0.316 French 57,739 0.317 Indonesian 55,870 0.318 Filipino 55,401 0.319 Serbian 55,114 0.320 Polish 50,695 0.221 Tamil 50,152 0.222 Sinhalese 48,191 0.223 Russian 44,059 0.224 Japanese 43,692 0.225 Dutch 37,247 0.226 Urdu 36,836 0.227 Thai 36,683 0.228 Samoan 36,571 0.229 Bengali 35,645 0.230 Afrikaans 35,031 0.2

Australia: 2011 Census
Chart 1.6Fastest growing languages excluding English and Indigenous
Australia: 2011 and 2006 Census
Ran
k
Language2011
Census% of
population
1 Seychelles Creole 702 3800.02 Karen 6,400 717.43 Nepali 27,154 483.34 Ewe 405 376.55 Mauritian Creole 3,256 348.56 Malayalam 25,111 254.27 Shilluk 202 242.48 Punjabi 71,230 207.59 Mongolian 634 204.8
10 Krio 2,364 198.511 Gujarati 34,211 188.112 Shona 8,006 186.313 Ndebele 1,064 170.114 Bemba 628 148.215 Igbo 885 137.916 Uygur 874 136.917 Telugu 18,721 126.218 Swahili 6,886 125.619 Yoruba 1,277 122.120 Marathi 8,572 111.821 Chin Haka 831 111.522 Afrikaans 35,031 108.423 Uzbek 291 107.924 Irish 1,896 107.225 Solomon Islands Pijin 237 104.326 Oromo 2,030 103.827 Luganda 256 96.928 Konkani 1,677 93.429 Sindhi 867 92.730 Urdu 36,836 91.0

Chart 1.7Local government areas with highest number of language other than English speakers
Australia: 2011 Census
Ran
k
LGALOTE
Speakers% of LGA
1 Brisbane (QLD) 195,410 18.82 Fairfield (NSW) 132,248 70.43 Blacktown (NSW) 112,454 37.34 Brimbank (VIC) 103,686 56.75 Bankstown (NSW) 100,609 55.26 Liverpool (NSW) 90,603 50.37 Canterbury (NSW) 88,499 64.48 Parramatta (NSW) 84,551 50.79 Greater Dandenong (VIC) 84,033 62.0
10 Casey (VIC) 76,429 30.311 Monash (VIC) 75,677 44.712 Hume (VIC) 69,439 41.413 Whittlesea (VIC) 66,716 43.114 Moreland (VIC) 58,572 39.815 Darebin (VIC) 53,370 39.116 Rockdale (NSW) 53,248 54.717 Auburn (NSW) 52,773 71.618 Gold Coast (QLD) 52,005 10.519 Sydney (NSW) 52,112 30.220 Holroyd (NSW) 51,026 51.521 Wyndham (VIC) 49,588 30.722 The Hills Shire (NSW) 48,805 28.723 Stirling (WA) 48,197 24.624 Whitehorse (VIC) 46,228 30.525 Hornsby (NSW) 44,960 28.726 Ryde (NSW) 43,605 42.327 Manningham (VIC) 43,471 39.128 Randwick (NSW) 39,131 30.329 Glen Eira (VIC) 38,989 29.830 Hurstville (NSW) 38,847 49.3

Chart 1.8Local government areas1 with highest proportion of LOTE speakers
Australia: 2011 Census
Ran
k
LGALOTE
Speakers % of LGA
1 Aurukun (QLD) 1,192 92.02 East Arnhem (NT) 8,164 89.73 Hope Vale (QLD) 871 88.64 Torres Strait Island (QLD) 3,750 88.25 Napranum (QLD) 687 80.36 Tiwi Islands (NT) 2,066 80.17 Ngaanyatjarraku (WA) 1,142 79.58 Lockhart River (QLD) 373 77.49 Northern Peninsula Area (QLD) 1,763 76.7
10 Central Desert (NT) 2,808 75.511 West Arnhem (NT) 4,521 72.512 Pormpuraaw (QLD) 479 72.213 Auburn (NSW) 52,773 71.614 Fairfield (NSW) 132,248 70.415 MacDonnell (NT) 4,033 69.216 Victoria-Daly (NT) 3,932 66.417 Canterbury (NSW) 88,499 64.418 Roper Gulf (NT) 3,830 62.619 Greater Dandenong (VIC) 84,033 62.020 Strathfield (NSW) 21,533 61.221 Burwood (NSW) 19,322 59.622 Brimbank (VIC) 103,686 56.723 Bankstown (NSW) 100,609 55.224 Rockdale (NSW) 53,248 54.725 Holroyd (NSW) 51,026 51.526 Parramatta (NSW) 84,551 50.727 Liverpool (NSW) 90,603 50.328 Kogarah (NSW) 27,990 50.229 Halls Creek (WA) 1,771 49.730 Hurstville (NSW) 38,847 49.3
1. Excludes Community Government Councils (CGC), Island Councils (IC) and Aboriginal Councils (AC)

Ran
k
Ran
k
Chart 1.9Local government areas with highest number who speak English not well or not at all
Australia: 2011 Census
Ran
k
LGAPoor
English% of LGA
1 Fairfield (NSW) 38,287 20.42 Brisbane (QLD) 29,980 2.93 Brimbank (VIC) 22,907 12.54 Greater Dandenong (VIC) 21,046 15.55 Canterbury (NSW) 20,182 14.76 Bankstown (NSW) 19,968 11.07 Liverpool (NSW) 15,723 8.78 Parramatta (NSW) 15,033 9.09 Blacktown (NSW) 14,169 4.7
10 Auburn (NSW) 13,776 18.711 Hume (VIC) 12,879 7.712 Whittlesea (VIC) 11,634 7.513 Monash (VIC) 11,592 6.814 Casey (VIC) 11,348 4.515 Moreland (VIC) 10,699 7.316 Darebin (VIC) 10,693 7.817 Rockdale (NSW) 8,515 8.718 Sydney (NSW) 8,313 4.919 Whitehorse (VIC) 8,299 5.520 Holroyd (NSW) 8,040 8.121 Hurstville (NSW) 7,950 10.122 Stirling (WA) 7,825 4.023 Ryde (NSW) 7,145 6.924 Maribyrnong (VIC) 7,105 9.925 Wyndham (VIC) 6,987 4.326 Port Adelaide Enfield (SA) 6,891 6.127 Manningham (VIC) 6,730 6.028 Gold Coast (QLD) 6,647 1.329 Salisbury (SA) 6,593 5.130 Hornsby (NSW) 6,419 4.1

Chart 1.10Local government areas1 with highest proportion who speak English not well or not at all
Australia: 2011 Census
Ran
k
LGAPoor
English% of LGA
1 East Arnhem (NT) 2,125 23.42 Torres Strait Island (QLD) 952 22.43 Fairfield (NSW) 38,287 20.44 Victoria-Daly (NT) 1,127 19.05 Auburn (NSW) 13,776 18.76 MacDonnell (NT) 982 16.87 Greater Dandenong (VIC) 21,046 15.58 Canterbury (NSW) 20,182 14.79 Northern Peninsula Area (QLD) 327 14.2
10 Ngaanyatjarraku (WA) 194 13.511 Pormpuraaw (QLD) 87 13.112 Lockhart River (QLD) 61 12.713 Brimbank (VIC) 22,907 12.514 West Arnhem (NT) 774 12.415 Burwood (NSW) 3,879 12.016 Roper Gulf (NT) 730 11.917 Strathfield (NSW) 3,856 11.018 Bankstown (NSW) 19,968 11.019 Hurstville (NSW) 7,950 10.120 Central Desert (NT) 370 10.021 Maribyrnong (VIC) 7,105 9.922 Menzies (WA) 35 9.123 Parramatta (NSW) 15,033 9.024 Kogarah (NSW) 4,974 8.925 Ashfield (NSW) 3,616 8.826 Rockdale (NSW) 8,515 8.727 Liverpool (NSW) 15,723 8.728 Barkly (NT) 576 8.429 Holroyd (NSW) 8,040 8.130 Darebin (VIC) 10,693 7.8
1. Excludes Community Government Councils (CGC), Island Councils (IC) and Aboriginal Councils (AC)

Table 1.9Religion
Australia: 2011 and 2006 Census
Religion2011
Census% of
population% of
responsesChange
2006-2011% change 2006-2011
Buddhism 528,976 2.5 2.7 418,757 26.3Christianity (total) 13,150,672 61.1 66.9 12,685,827 3.7Christian, nfd (total) 470,941 2.2 2.4 313,193 50.4
Christian, nfd 461,209 2.1 2.3 305,480 51.0Apostolic Church, so described 5,108 0.0 0.0 5,232 -2.4Church of God, so described 975 0.0 0.0 893 9.2Australian Christian Churches, so described 3,640 0.0 0.0 1,584 129.8
Anglican (total) 3,679,906 17.1 18.7 3,718,248 -1.0Anglican Church of Australia 3,678,003 17.1 18.7 3,716,378 -1.0Anglican Catholic Church 1,902 0.0 0.0 1,866 1.9
Baptist 352,497 1.6 1.8 316,742 11.3Brethren 21,732 0.1 0.1 24,227 -10.3Catholic (total) 5,439,268 25.3 27.7 5,126,885 6.1
Western Catholic 5,397,393 25.1 27.4 5,087,115 6.1Maronite Catholic 30,661 0.1 0.2 29,072 5.5Melkite Catholic 2,499 0.0 0.0 1,980 26.2Ukrainian Catholic 3,056 0.0 0.0 3,608 -15.3Chaldean Catholic 4,972 0.0 0.0 4,499 10.5Catholic, nec 682 0.0 0.0 613 11.3
Churches of Christ (total) 49,688 0.2 0.3 54,818 -9.4Churches of Christ, nfd 7,187 0.0 0.0 6,639 8.3Churches of Christ (Conference) 42,144 0.2 0.2 47,772 -11.8Church of Christ (Non-denominational) 331 0.0 0.0 366 -9.6International Church of Christ 30 0.0 0.0 43 -30.2
Jehovah's Witnesses 85,634 0.4 0.4 80,919 5.8Latter-day Saints (total)1 59,770 0.3 0.3 53,199 12.4
Church of Jesus Christ of LDS (Mormons) 58,838 0.3 0.3 52,146 12.8Community of Christ 935 0.0 0.0 1,042 -10.3
Lutheran 251,932 1.2 1.3 251,106 0.3Oriental Orthodox (total) 41,263 0.2 0.2 32,708 26.2
Oriental Orthodox, nfd 49 0.0 0.0 84 -41.7Armenian Apostolic 7,661 0.0 0.0 8,050 -4.8Coptic Orthodox Church 24,693 0.1 0.1 19,924 23.9Syrian Orthodox Church 5,822 0.0 0.0 2,882 102.0Ethiopian Orthodox Church 2,846 0.0 0.0 1,707 66.7Oriental Orthodox, nec 188 0.0 0.0 70 168.6
Assyrian Apostolic (total) 10,589 0.0 0.1 8,192 29.3Assyrian Church of the East 8,497 0.0 0.0 5,956 42.7Ancient Church of the East 2,095 0.0 0.0 2,227 -5.9
Eastern Orthodox (total) 563,073 2.6 2.9 544,162 3.5Eastern Orthodox, nfd 49,577 0.2 0.3 48,157 2.9Albanian Orthodox 48 0.0 0.0 73 -34.2Antiochian Orthodox 8,264 0.0 0.0 7,829 5.6Greek Orthodox 383,400 1.8 1.9 374,575 2.4Macedonian Orthodox 52,052 0.2 0.3 48,082 8.3

Table 1.9 (continued)Religion
Australia: 2011 and 2006 Census
Religion2011
Census% of
population% of
responsesChange
2006-2011% change 2006-2011
Romanian Orthodox 1,883 0.0 0.0 1,607 17.2Russian Orthodox 22,251 0.1 0.1 19,970 11.4Serbian Orthodox 41,833 0.2 0.2 39,969 4.7Ukrainian Orthodox 2,714 0.0 0.0 2,979 -8.9Eastern Orthodox, nec 1,065 0.0 0.0 917 16.1
Presbyterian and Reformed (total) 599,515 2.8 3.0 596,668 0.5Presbyterian 584,816 2.7 3.0 583,396 0.2Reformed 11,981 0.1 0.1 10,609 12.9Free Reformed 2,717 0.0 0.0 2,653 2.4
Salvation Army 60,163 0.3 0.3 64,200 -6.3Seventh-day Adventist 63,000 0.3 0.3 55,251 14.0Uniting Church 1,065,795 5.0 5.4 1,135,426 -6.1Pentecostal (total) 237,987 1.1 1.2 219,691 8.3
Pentecostal, nfd 192,181 0.9 1.0 88,535 117.1Apostolic Church (Australia) 294 0.0 0.0 2,415 -87.8Assemblies of God 28,299 0.1 0.1 94,892 -70.2Bethesda Churches 49 0.0 0.0 91 -46.2Christian City Church 619 0.0 0.0 5,114 -87.9Christian Life Churches International 242 0.0 0.0 481 -49.7Christian Outreach Centres 2,657 0.0 0.0 11,045 -75.9Christian Revival Crusade 3,774 0.0 0.0 5,312 -29.0Faith Churches 38 0.0 0.0 99 -61.6Foursquare Gospel Church 549 0.0 0.0 744 -26.2Full Gospel Church 1,467 0.0 0.0 1,355 8.3Revival Centres 2,227 0.0 0.0 2,966 -24.9Rhema Family Church 50 0.0 0.0 122 -59.0United Pentecostal 848 0.0 0.0 794 6.8Pentecostal, nec 4,685 0.0 0.0 5,726 -18.2
Other Protestant (total) 60,242 0.3 0.3 56,103 7.4Other Protestant, nfd 22,706 0.1 0.1 18,803 20.8Aboriginal Evangelical Missions 3,450 0.0 0.0 3,819 -9.7Born Again Christian 11,885 0.1 0.1 11,775 0.9Christian and Missionary Alliance 1,319 0.0 0.0 2,222 -40.6Church of the Nazarene 1,356 0.0 0.0 1,405 -3.5Congregational 4,359 0.0 0.0 4,689 -7.0Ethnic Evangelical Churches 2,909 0.0 0.0 2,746 5.9Independent Evangelical Churches 1,829 0.0 0.0 1,879 -2.7Wesleyan Methodist Church 3,272 0.0 0.0 3,403 -3.8Other Protestant, nec 7,159 0.0 0.0 5,359 33.6
Other Christian (total) 37,674 0.2 0.2 34,095 10.5Other Christian, nfd 978 0.0 0.0 667 46.6Apostolic Church of Queensland 3,034 0.0 0.0 3,104 -2.3Christadelphians 10,653 0.0 0.1 10,211 4.3Christian Science 1,358 0.0 0.0 1,471 -7.7Gnostic Christians 1,033 0.0 0.0 1,102 -6.3Liberal Catholic Church 304 0.0 0.0 387 -21.4New Apostolic Church 2,888 0.0 0.0 2,729 5.8
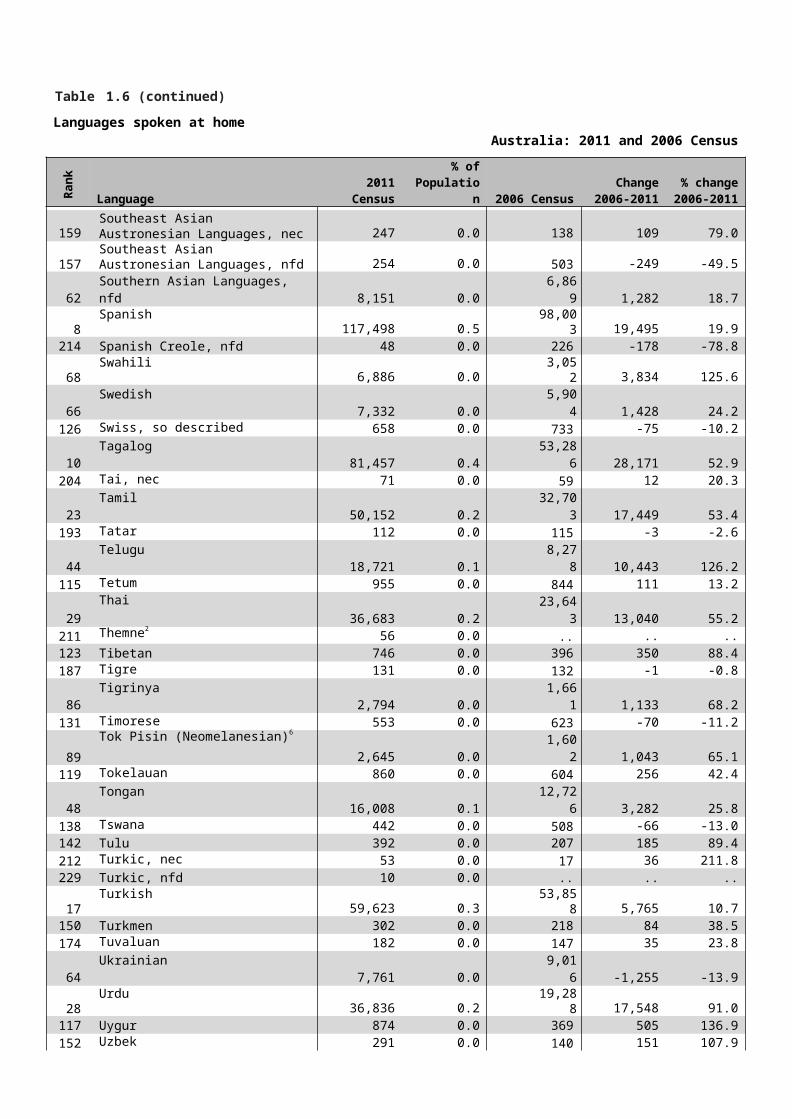
Table 1.9 (continued)Religion
Australia: 2011 and 2006 Census
Religion2011
Census% of
population% of
responsesChange
2006-2011% change 2006-2011
New Churches (Swedenborgian) 331 0.0 0.0 363 -8.8Ratana (Maori) 4,626 0.0 0.0 3,303 40.1Religious Science 292 0.0 0.0 339 -13.9Religious Society of Friends (Quakers) 2,077 0.0 0.0 1,985 4.6Temple Society 703 0.0 0.0 600 17.2Unitarian 1,333 0.0 0.0 1,011 31.8Worldwide Church of God 128 0.0 0.0 584 -78.1Other Christian, nec 7,928 0.0 0.0 6,250 26.8
Hinduism 275,533 1.3 1.4 148,124 86.0Islam 476,291 2.2 2.4 340,393 39.9Judaism 97,335 0.5 0.5 88,831 9.6Other Religions (total) 168,195 0.8 0.9 109,025 54.3Australian Aboriginal Traditional Religions 7,362 0.0 0.0 5,377 36.9Baha'i 13,707 0.1 0.1 12,332 11.1Chinese Religions (total) 5,152 0.0 0.0 4,374 17.8
Chinese Religions, nfd 23 0.0 0.0 12 91.7Ancestor Veneration 507 0.0 0.0 500 1.4Confucianism 342 0.0 0.0 258 32.6Taoism 4,247 0.0 0.0 3,579 18.7Chinese Religions, nec 36 0.0 0.0 26 38.5
Druse 2,974 0.0 0.0 2,976 -0.1Japanese Religions (total) 1,640 0.0 0.0 1,305 25.7
Shinto 1,107 0.0 0.0 734 50.8Sukyo Mahikari 423 0.0 0.0 466 -9.2Tenrikyo 99 0.0 0.0 80 23.8
Nature Religions (total) 32,083 0.1 0.2 29,391 9.2Nature Religions, nfd 92 0.0 0.0 79 16.5Animism 781 0.0 0.0 870 -10.2Druidism 1,047 0.0 0.0 1,021 2.5Paganism 16,850 0.1 0.1 15,515 8.6Pantheism 1,396 0.0 0.0 1,035 34.9Wiccan/Witchcraft 8,413 0.0 0.0 8,206 2.5Nature Religions, nec 3,508 0.0 0.0 2,661 31.8
Sikhism 72,297 0.3 0.4 26,425 173.6Spiritualism 11,551 0.1 0.1 9,845 17.3Miscellaneous Religions (total) 21,428 0.1 0.1 16,994 26.1
Caodaism 681 0.0 0.0 652 4.4Church of Scientology 2,162 0.0 0.0 2,507 -13.8Eckankar 673 0.0 0.0 683 -1.5Rastafarianism 1,392 0.0 0.0 978 42.3Satanism 2,455 0.0 0.0 2,248 9.2Theosophy 1,486 0.0 0.0 1,639 -9.3Jainism 2,922 0.0 0.0 1,262 131.5Zoroastrianism 2,544 0.0 0.0 2,113 20.4Religious Groups, nec 7,126 0.0 0.0 4,916 45.0
No Religion (total) 4,796,786 22.3 24.4 3,706,554 29.4

Table 1.9 (continued)Religion
Australia: 2011 and 2006 Census
Religion2011
Census% of
population% of
responsesChange
2006-2011% change 2006-2011
No Religion, nfd 4,693,162 21.8 23.9 3,643,817 28.8Agnosticism 34,633 0.2 0.2 22,132 56.5Atheism 58,898 0.3 0.3 31,304 88.1Humanism 7,662 0.0 0.0 7,634 0.4Rationalism 2,433 0.0 0.0 1,667 46.0
Supplementary codes (total) 174,281 0.8 0.9 133,819 30.2Religious Belief, nfd 35,169 0.2 0.2 20,539 71.2Not Defined 132,599 0.6 0.7 108,654 22.0New Age, so described 2,627 0.0 0.0 2,016 30.3Theism 3,883 0.0 0.0 2,613 48.6
Not elsewhere classified2 11 0.0 0.0 37 -70.3Not stated 1,839,650 8.6 9.4 2,223,957 -17.3Total responses 19,668,069 .. 100.0 17,631,330 11.6Total population 21,507,719 100.0 19,855,287 8.3
1. Reported as Latter Day Saints (total) in 20062. Religions with 2011 values lower than 10 are reported collectively in an overall NEC category

Table 1.10 Ancestry
Australia: 2011 and 2006 Census
Ran
k
Language 2011 Census% of
Population% of
responses2006
Census% change
2006-2011280 Acehnese 118 0.0 0.0 75 57.3276 Acholi1 135 0.0 0.0 .. ..
49 Afghan 29,474 0.1 0.1 19,414 51.8140 African American 2,245 0.0 0.0 1,803 24.5
56 African, so described 25,305 0.1 0.1 13,362 89.4116 Afrikaner 5,079 0.0 0.0 3,029 67.7268 Akan 169 0.0 0.0 172 -1.7
81 Albanian 13,142 0.1 0.0 11,313 16.2164 Algerian 1,321 0.0 0.0 897 47.3
31 American 62,960 0.3 0.2 56,277 11.9241 Amhara 251 0.0 0.0 144 74.3188 Anglo-Burmese 658 0.0 0.0 712 -7.6
76 Anglo-Indian 14,306 0.1 0.1 13,077 9.4263 Angolan 175 0.0 0.0 144 21.5278 Arab, nec2 127 0.0 0.0 800 -84.1
47 Arab, nfd 30,375 0.1 0.1 19,966 52.193 Argentinian 9,879 0.0 0.0 8,960 10.372 Armenian 16,723 0.1 0.1 15,789 5.9
102 Asian, so described 7,743 0.0 0.0 4,012 93.065 Assyrian1 21,626 0.1 0.1 .. ..
2 Australian 7,098,486 33.0 25.4 7,371,823 -3.718 Australian Aboriginal 127,668 0.6 0.5 115,278 10.7
203 Australian Peoples, nfd 534 0.0 0.0 57 836.8123 Australian South Sea Islander 4,037 0.0 0.0 4,098 -1.5
38 Austrian 42,341 0.2 0.2 41,490 2.1208 Azeri 450 0.0 0.0 294 53.1281 Bahraini1 114 0.0 0.0 .. ..187 Balinese 672 0.0 0.0 517 30.0
57 Bangladeshi1 25,111 0.1 0.1 .. ..217 Barbadian 400 0.0 0.0 283 41.3288 Bari1 82 0.0 0.0 .. ..194 Basque 612 0.0 0.0 541 13.1213 Batswana 416 0.0 0.0 444 -6.3152 Belarusan 1,664 0.0 0.0 1,560 6.7
92 Belgian 10,022 0.0 0.0 8,896 12.7110 Bengali 6,335 0.0 0.0 17,308 -63.4273 Berber 139 0.0 0.0 89 56.2243 Bermudan 248 0.0 0.0 226 9.7137 Bhutanese1 2,618 0.0 0.0 .. ..181 Bolivian 764 0.0 0.0 583 31.0
67 Bosnian 20,247 0.1 0.1 18,463 9.786 Brazilian 12,234 0.1 0.0 6,640 84.2
244 British, nec 248 0.0 0.0 94 163.8111 British, nfd 6,262 0.0 0.0 5,681 10.2228 Bruneian 324 0.0 0.0 236 37.3114 Bulgarian 5,436 0.0 0.0 4,898 11.0191 Burgher 630 0.0 0.0 1,031 -38.9
69 Burmese 20,112 0.1 0.1 13,821 45.5

Table 1.10 (continued)Ancestry
Australia: 2011 and 2006 Census
Ran
k
Language 2011 Census% of
Population% of
responses2006
Census% change
2006-2011136 Burundian1 2,624 0.0 0.0 .. ..254 Cameroonian1 210 0.0 0.0 .. ..
44 Canadian 33,218 0.2 0.1 28,523 16.5185 Caribbean Islander, nec 694 0.0 0.0 557 24.6138 Caribbean Islander, nfd 2,426 0.0 0.0 1,995 21.6265 Catalan 171 0.0 0.0 112 52.7220 Caucasian, so described 380 0.0 0.0 183 107.7223 Central American, nec 361 0.0 0.0 328 10.1214 Central American, nfd 414 0.0 0.0 395 4.8162 Central and West African, nec 1,392 0.0 0.0 2,656 -47.6240 Central and West African, nfd 257 0.0 0.0 191 34.6289 Central Asian, nec 72 0.0 0.0 406 -82.3290 Central Asian, nfd 70 0.0 0.0 92 -23.9
96 Chaldean1 9,005 0.0 0.0 .. ..167 Channel Islander 1,127 0.0 0.0 1,160 -2.8
48 Chilean 30,020 0.1 0.1 25,433 18.0149 Chin1 1,912 0.0 0.0 .. ..
7 Chinese 866,208 4.0 3.1 669,901 29.3224 Chinese Asian, nec 360 0.0 0.0 375 -4.0
89 Colombian 10,193 0.0 0.0 5,006 103.6130 Congolese1 3,246 0.0 0.0 .. ..
74 Cook Islander 16,193 0.1 0.1 11,404 42.0144 Coptic 2,043 0.0 0.0 1,889 8.2226 Costa Rican 343 0.0 0.0 241 42.3199 Creole, so described 567 0.0 0.0 397 42.8
19 Croatian 126,270 0.6 0.5 118,049 7.0176 Cuban 798 0.0 0.0 540 47.8
63 Cypriot 22,680 0.1 0.1 10,722 111.562 Czech 22,772 0.1 0.1 21,194 7.433 Danish 54,026 0.3 0.2 50,414 7.2
306 Darfu/Darfurian1 10 0.0 0.0 .. ..163 Dinka 1,364 0.0 0.0 1,330 2.6
10 Dutch 335,493 1.6 1.2 310,082 8.2232 Eastern European, nec 309 0.0 0.0 114 171.1108 Eastern European, nfd 6,524 0.0 0.0 6,616 -1.4155 Ecuadorian 1,521 0.0 0.0 1,353 12.4
39 Egyptian 39,300 0.2 0.1 31,781 23.7259 Emirati1 180 0.0 0.0 .. ..
1 English 7,238,533 33.7 25.9 6,283,647 15.2121 Eritrean 4,137 0.0 0.0 2,659 55.6100 Estonian 8,551 0.0 0.0 8,234 3.8
99 Ethiopian 8,609 0.0 0.0 5,603 53.6118 Eurasian, so described 4,839 0.0 0.0 3,836 26.1
84 European, so described 12,504 0.1 0.0 9,037 38.459 Fijian 23,770 0.1 0.1 19,172 24.073 Fijian Indian1 16,211 0.1 0.1 .. ..11 Filipino 224,725 1.0 0.8 160,375 40.164 Finnish 22,420 0.1 0.1 20,987 6.8

Table 1.10 (continued)Ancestry
Australia: 2011 and 2006 Census
Ran
k
Language 2011 Census% of
Population% of
responses2006
Census% change
2006-2011195 Flemish 611 0.0 0.0 555 10.1
21 French 110,399 0.5 0.4 98,333 12.3150 French Canadian 1,836 0.0 0.0 1,686 8.9251 Frisian 222 0.0 0.0 244 -9.0286 Fulani1 93 0.0 0.0 .. ..207 Georgian 489 0.0 0.0 383 27.7
6 German 898,674 4.2 3.2 811,543 10.7128 Ghanaian 3,521 0.0 0.0 2,525 39.4262 Gibraltarian 177 0.0 0.0 184 -3.8296 Gio1 38 0.0 0.0 .. ..
9 Greek 378,270 1.8 1.4 365,150 3.6235 Guatemalan 295 0.0 0.0 234 26.1158 Gujarati 1,442 0.0 0.0 424 240.1200 Guyanese 563 0.0 0.0 371 51.8227 Hawaiian 333 0.0 0.0 277 20.2109 Hazara 6,432 0.0 0.0 928 593.1145 Hispanic (North American) 2,028 0.0 0.0 3,899 -48.0134 Hmong 2,747 0.0 0.0 2,189 25.5
29 Hungarian 69,160 0.3 0.2 67,623 2.3173 Icelandic 929 0.0 0.0 759 22.4225 Igbo1 345 0.0 0.0 .. ..186 I-Kiribati 677 0.0 0.0 480 41.0
8 Indian 390,894 1.8 1.4 234,720 66.5205 Indian Tamil1 509 0.0 0.0 .. ..
35 Indonesian 48,836 0.2 0.2 35,940 35.941 Iranian 36,168 0.2 0.1 23,575 53.452 Iraqi 28,001 0.1 0.1 16,763 67.0
3 Irish 2,087,758 9.7 7.5 1,803,736 15.75 Italian 916,121 4.3 3.3 852,421 7.5
292 Ivorean 58 0.0 0.0 112 -48.2139 Jamaican 2,400 0.0 0.0 1,781 34.8
34 Japanese 50,761 0.2 0.2 40,968 23.9175 Javanese 818 0.0 0.0 621 31.7
55 Jewish 25,778 0.1 0.1 15,638 64.8120 Jordanian 4,218 0.0 0.0 3,395 24.2245 Kadazan 246 0.0 0.0 183 34.4113 Karen 6,132 0.0 0.0 887 591.3238 Kashmiri1 260 0.0 0.0 .. ..236 Kazakh 279 0.0 0.0 131 113.0125 Kenyan 3,786 0.0 0.0 2,162 75.1
45 Khmer (Cambodian)3 33,197 0.2 0.1 25,553 29.925 Korean 88,973 0.4 0.3 60,867 46.2
300 Krahn1 33 0.0 0.0 .. ..304 Kunama1 18 0.0 0.0 .. ..107 Kurdish 6,991 0.0 0.0 5,470 27.8198 Kuwaiti 577 0.0 0.0 365 58.1283 Kyrgyz1 107 0.0 0.0 .. ..
85 Lao 12,372 0.1 0.0 10,768 14.9
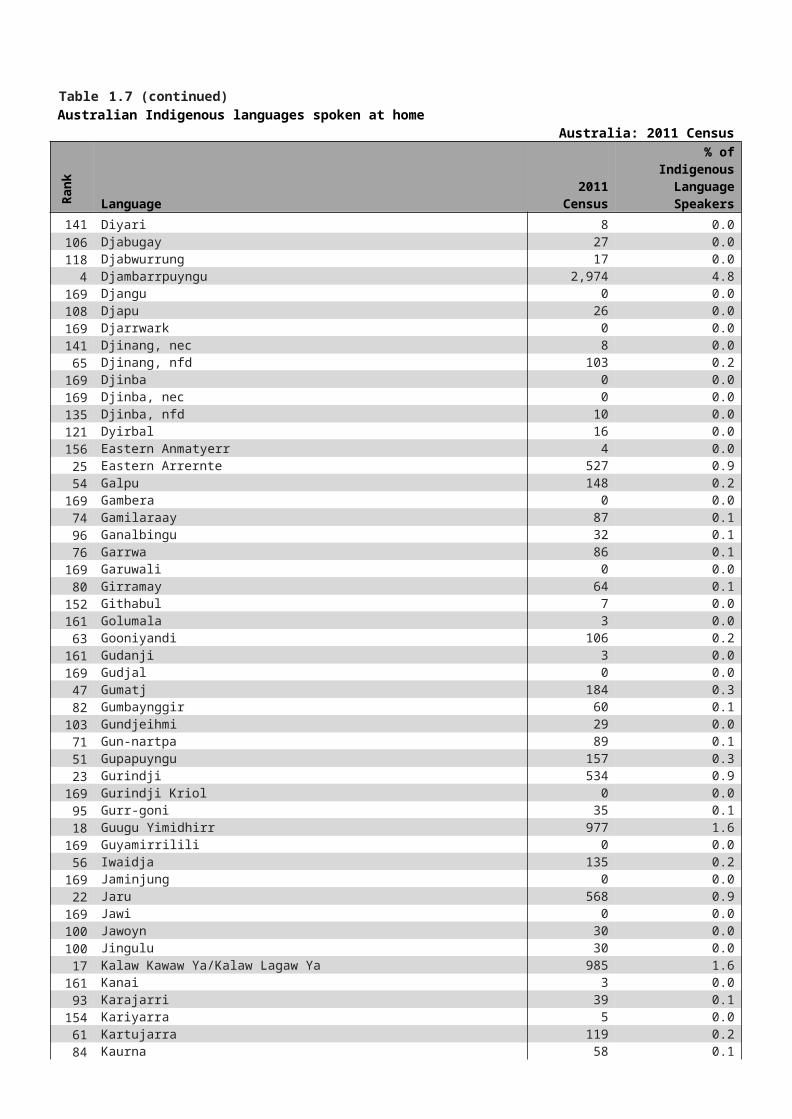
Table 1.10 (continued)Ancestry
Australia: 2011 and 2006 Census
Ran
k
Language 2011 Census% of
Population% of
responses2006
Census% change
2006-201168 Latvian 20,124 0.1 0.1 20,061 0.313 Lebanese 203,139 0.9 0.7 181,753 11.8
146 Liberian 1,986 0.0 0.0 1,144 73.6170 Libyan 1,027 0.0 0.0 275 273.5
78 Lithuanian 13,594 0.1 0.0 13,275 2.4253 Luxembourg 212 0.0 0.0 167 26.9
23 Macedonian 93,570 0.4 0.3 83,983 11.4271 Madi (Ma'di)1 141 0.0 0.0 .. ..202 Mainland South-East Asian, nec2 547 0.0 0.0 615 -11.1277 Mainland South-East Asian, nfd 130 0.0 0.0 .. ..237 Malawian 279 0.0 0.0 191 46.1
43 Malay 33,620 0.2 0.1 25,318 32.8169 Malayali 1,030 0.0 0.0 230 347.8209 Maldivian 446 0.0 0.0 303 47.2
16 Maltese 163,990 0.8 0.6 153,802 6.6233 Mandaean1 298 0.0 0.0 .. ..287 Mandinka1 87 0.0 0.0 .. ..147 Manx 1,983 0.0 0.0 1,853 7.0
17 Maori 128,430 0.6 0.5 92,917 38.2135 Maritime South-East Asian, nec 2,677 0.0 0.0 659 306.2302 Masai 27 0.0 0.0 32 -15.6
51 Mauritian 28,045 0.1 0.1 21,825 28.5264 Mayan 175 0.0 0.0 127 37.8204 Melanesian and Papuan, nec 530 0.0 0.0 362 46.4190 Melanesian and Papuan, nfd 643 0.0 0.0 459 40.1117 Mexican 4,862 0.0 0.0 2,776 75.1274 Micronesian, nec 138 0.0 0.0 154 -10.4285 Micronesian, nfd 99 0.0 0.0 100 -1.0221 Moldovan 374 0.0 0.0 231 61.9250 Mon 229 0.0 0.0 159 44.0165 Mongolian 1,235 0.0 0.0 630 96.0154 Montenegrin 1,554 0.0 0.0 1,168 33.0143 Moroccan 2,119 0.0 0.0 1,516 39.8266 Mozambican 171 0.0 0.0 135 26.7252 Namibian1 218 0.0 0.0 .. ..132 Native North American Indian 3,140 0.0 0.0 3,933 -20.2216 Nauruan 409 0.0 0.0 373 9.7
54 Nepalese 26,575 0.1 0.1 5,305 400.9255 New Caledonian 204 0.0 0.0 246 -17.1
14 New Zealander 187,212 0.9 0.7 160,683 16.5201 Nicaraguan 551 0.0 0.0 454 21.4129 Nigerian 3,467 0.0 0.0 1,929 79.7131 Niuean 3,143 0.0 0.0 2,180 44.2184 Ni-Vanuatu 705 0.0 0.0 509 38.5
122 North African and Middle Eastern, nfd 4,111 0.0 0.0 2,067 98.9
272 North American, nec 140 0.0 0.0 134 4.5174 North American, nfd 862 0.0 0.0 .. ..260 Northern European, nec 180 0.0 0.0 163 10.4

Table 1.10 (continued)Ancestry
Australia: 2011 and 2006 Census
Ran
k
Language 2011 Census% of
Population% of
responses2006
Census% change
2006-2011126 Northern European, nfd 3,728 0.0 0.0 2,962 25.9168 North-West European, nfd 1,043 0.0 0.0 2,000 -47.9
60 Norwegian 23,037 0.1 0.1 20,442 12.7295 Nubian1 43 0.0 0.0 .. ..249 Nuer 233 0.0 0.0 285 -18.2
83 Oceanian, nfd 12,541 0.1 0.0 9,740 28.8305 Ogaden1 13 0.0 0.0 .. ..246 Omani1 244 0.0 0.0 .. ..160 Oromo 1,410 0.0 0.0 526 168.1
97 Other North African and Middle Eastern, nec2 8,861 0.0 0.0 7,816 13.4
279 Other North African and Middle Eastern, nfd 119 0.0 0.0 .. ..
46 Pakistani 33,049 0.2 0.1 18,497 78.795 Palestinian 9,107 0.0 0.0 7,665 18.875 Papua New Guinean 15,460 0.1 0.1 12,548 23.2
231 Paraguayan 311 0.0 0.0 290 7.2275 Parsi1 136 0.0 0.0 .. ..182 Pathan 739 0.0 0.0 379 95.0124 Peoples of the Americas, nfd 3,903 0.0 0.0 573 581.2267 Peoples of the Sudan, nec1 170 0.0 0.0 .. ..159 Peoples of the Sudan, nfd1 1,414 0.0 0.0 .. ..
98 Peruvian 8,630 0.0 0.0 6,425 34.315 Polish 170,354 0.8 0.6 163,802 4.0
211 Polynesian, nec 443 0.0 0.0 488 -9.2142 Polynesian, nfd 2,164 0.0 0.0 1,697 27.5
36 Portuguese 46,519 0.2 0.2 41,226 12.8230 Puerto Rican 318 0.0 0.0 225 41.3
88 Punjabi 11,722 0.1 0.0 4,855 141.4239 Rohingya1 258 0.0 0.0 .. ..180 Roma/Gypsy 776 0.0 0.0 658 17.9
66 Romanian 20,998 0.1 0.1 18,325 14.627 Russian 74,317 0.3 0.3 67,056 10.8
189 Rwandan1 654 0.0 0.0 .. ..104 Salvadoran 7,484 0.0 0.0 6,871 8.9
32 Samoan 55,843 0.3 0.2 39,998 39.6127 Saudi Arabian 3,696 0.0 0.0 751 392.1
4 Scottish 1,792,622 8.3 6.4 1,501,200 19.4270 Senegalese1 144 0.0 0.0 .. ..
28 Serbian 69,544 0.3 0.2 95,362 -27.1133 Seychellois 3,086 0.0 0.0 2,713 13.7197 Shona1 582 0.0 0.0 .. ..151 Sierra Leonean 1,749 0.0 0.0 875 99.9103 Sikh 7,494 0.0 0.0 2,168 245.7234 Sindhi1 296 0.0 0.0 .. ..112 Singaporean 6,149 0.0 0.0 4,623 33.0
61 Sinhalese 22,945 0.1 0.1 73,849 -68.991 Slovak 10,053 0.0 0.0 8,504 18.2

Table 1.10 (continued)Ancestry
Australia: 2011 and 2006 Census
Ran
k
Language 2011 Census% of
Population% of
responses2006
Census% change
2006-201171 Slovene 17,150 0.1 0.1 16,085 6.6
161 Solomon Islander 1,405 0.0 0.0 1,114 26.190 Somali 10,131 0.0 0.0 6,404 58.2
256 Sorb/Wend 193 0.0 0.0 243 -20.622 South African 108,955 0.5 0.4 79,518 37.0
193 South American, nec 620 0.0 0.0 617 0.594 South American, nfd 9,353 0.0 0.0 8,292 12.8
303 South Eastern European, nec 25 0.0 0.0 12 108.353 South Eastern European, nfd 27,786 0.1 0.1 1,005 2,664.8
119 South Sudanese1 4,825 0.0 0.0 .. ..242 South-East Asian, nfd 251 0.0 0.0 119 110.9301 Southern and Central Asian, nfd 30 0.0 0.0 .. ..156 Southern and East African, nec 1,513 0.0 0.0 2,865 -47.2219 Southern and East African, nfd 383 0.0 0.0 383 0.0148 Southern and Eastern European, nfd 1,917 0.0 0.0 1,894 1.2166 Southern Asian, nec 1,216 0.0 0.0 1,452 -16.3
87 Southern Asian, nfd 12,160 0.1 0.0 5,771 110.7297 Southern European, nec 37 0.0 0.0 28 32.1298 Southern European, nfd 37 0.0 0.0 36 2.8
24 Spanish 92,952 0.4 0.3 84,327 10.226 Sri Lankan1 75,136 0.3 0.3 .. ..
115 Sri Lankan Tamil1 5,182 0.0 0.0 .. ..282 Sub-Saharan African, nfd 113 0.0 0.0 61 85.2
70 Sudanese 17,186 0.1 0.1 17,844 -3.7247 Sundanese 244 0.0 0.0 141 73.0248 Swahili1 241 0.0 0.0 .. ..284 Swazilander1 100 0.0 0.0 .. ..
42 Swedish 34,029 0.2 0.1 30,378 12.050 Swiss 28,947 0.1 0.1 26,512 9.279 Syrian 13,517 0.1 0.0 10,151 33.2
183 Tahitian 722 0.0 0.0 692 4.3101 Taiwanese 8,210 0.0 0.0 5,839 40.6257 Tajik 186 0.0 0.0 118 57.6
77 Tamil, nfd1 13,735 0.1 0.0 .. ..192 Tanzanian 623 0.0 0.0 380 63.9215 Tatar 412 0.0 0.0 299 37.8177 Telugu1 796 0.0 0.0 .. ..
37 Thai 45,635 0.2 0.2 30,022 52.0294 Themne1 47 0.0 0.0 .. ..171 Tibetan 955 0.0 0.0 532 79.5261 Tigrayan 180 0.0 0.0 91 97.8299 Tigre 37 0.0 0.0 23 60.9106 Timorese 7,085 0.0 0.0 6,242 13.5258 Togolese1 186 0.0 0.0 .. ..153 Tokelauan 1,655 0.0 0.0 1,133 46.1
58 Tongan 25,096 0.1 0.1 18,420 36.280 Torres Strait Islander 13,354 0.1 0.0 13,811 -3.3
179 Trinidadian (Tobagonian) 782 0.0 0.0 642 21.8

Table 1.10 (continued)Ancestry
Australia: 2011 and 2006 Census
Ran
k
Language 2011 Census% of
Population% of
responses2006
Census% change 2006-2011
210 Tunisian 445 0.0 0.0 324 37.330 Turkish 66,919 0.3 0.2 59,397 12.7
222 Turkmen 368 0.0 0.0 299 23.1212 Tuvaluan 430 0.0 0.0 332 29.5172 Ugandan 941 0.0 0.0 554 69.9178 Uighur 791 0.0 0.0 300 163.7
40 Ukrainian 38,791 0.2 0.1 37,584 3.2105 Uruguayan 7,221 0.0 0.0 6,483 11.4196 Uzbek 588 0.0 0.0 272 116.2141 Venezuelan 2,206 0.0 0.0 878 151.3
12 Vietnamese 221,114 1.0 0.8 173,666 27.3293 Vlach 57 0.0 0.0 76 -25.0
20 Welsh 125,597 0.6 0.4 113,244 10.9269 Western European, nec 149 0.0 0.0 252 -40.9291 Western European, nfd 70 0.0 0.0 60 16.7206 Yemeni 498 0.0 0.0 313 59.1218 Yoruba 399 0.0 0.0 175 128.0157 Zambian 1,479 0.0 0.0 953 55.2
82 Zimbabwean 13,027 0.1 0.0 7,658 70.1229 Zulu 321 0.0 0.0 267 20.2
Inadequately described 31,927 0.1 0.1 27,166 17.5Not elsewhere classified4 34 0.0 0.0 33,448 -99.9Not stated 1,475,230 6.9 5.3 1,609,441 -8.3Total responses 27,960,402 .. 100.0 25,451,368 9.9Total population 21,507,719 100.0 .. 19,855,287 8.3
Note: Census respondents may select one or more Ancestry categories. Where a respondent marks more than one category, only the first two are coded. This table presents a count of all coded responses along with a percentage of all responses and a percentage of all persons. Care should be taken if adding responses together to achieve subtotals as double counting could occur.
1. Newly defined ethnicity in 2011 census2. Increased classification detail in 2011. Some elements which were included in 2006 have been
redistributed into other classifications3. Reported as Khmer in 20064. Ancestries reported in 2006 which have no 2011 definition are incorporated into an overall NEC category

Table 1.11Ancestry by birthplace of parents
Australia: 2011 Census
Australian BornOverseas
BornBirthplace not stated
% of Total responses
Ancestry
Both parents
Australian born
Both parents
overseas born
One parent OS born/
one parent Aust born
One parent OS born/
one parent not stated Other1
English 4,318,269 392,636 1,015,051 7,574 105,977 1,299,416 99,425 25.9Australian 5,485,168 103,004 1,156,018 4,352 121,475 139,318 88,942 25.4Irish 1,489,170 68,649 212,158 1,107 27,598 262,632 25,835 7.5Scottish 1,117,342 91,695 242,044 1,363 19,894 299,754 19,999 6.4Italian 312,402 213,731 150,952 2,302 8,588 215,766 11,810 3.3German 552,539 66,926 105,738 811 9,863 151,581 10,758 3.2Chinese 37,303 147,050 33,550 1,441 2,890 634,293 9,195 3.1Indian 5,962 56,533 14,865 478 809 308,600 3,254 1.4Greek 89,592 111,479 52,108 1,203 3,335 113,889 6,024 1.4Dutch 79,710 61,486 80,675 520 2,067 107,386 2,936 1.2Filipino 2,409 35,000 21,426 321 1,020 160,952 3,049 0.8Vietnamese 1,374 65,934 5,701 1,150 1,424 142,179 3,042 0.8Lebanese 23,303 69,200 32,124 972 2,729 71,017 3,385 0.7New Zealander 9,477 28,536 53,313 247 1,090 92,246 1,611 0.7Polish 32,868 40,082 26,278 287 917 67,092 2,059 0.6Maltese 42,305 43,210 31,436 389 1,273 42,453 2,374 0.6Maori 5,659 17,017 18,557 271 807 83,824 1,633 0.5Australian Aboriginal 119,506 116 3,851 12 1,998 261 1,344 0.5Croatian 20,114 36,342 17,567 224 777 48,698 1,887 0.5Welsh 47,753 10,961 21,696 79 699 42,817 974 0.4French 38,319 10,283 13,886 55 789 45,461 1,090 0.4South African 2,381 13,558 12,894 60 209 78,720 735 0.4Macedonian 10,836 27,850 10,434 277 724 41,244 1,763 0.3Spanish 15,976 14,787 10,387 167 542 49,279 1,171 0.3Korean 211 11,741 1,749 90 116 73,984 842 0.3Sri Lankan 2,107 13,029 6,395 64 144 52,288 757 0.3Russian 11,168 14,344 9,333 60 311 37,537 867 0.3Serbian 4,317 16,696 6,435 98 313 40,050 1,099 0.2Hungarian 9,816 16,541 11,759 77 283 29,252 834 0.2Turkish 2,585 21,567 7,338 274 558 32,945 1,299 0.2American 5,463 6,256 18,844 27 245 31,105 383 0.2Samoan 743 11,587 5,073 165 526 36,376 1,065 0.2Inadequately described 14,251 1,629 2,176 47 2,099 9,032 719 0.1Other ancestries 165,759 315,495 185,963 2,144 7,340 1,060,182 20,927 6.3Not stated 245,286 44,629 38,521 2,241 100,394 121,649 922,095 5.3Total responses 14,321,443 2,200,798 3,636,295 30,949 429,823 6,023,278 1,255,182 100.0
Note: Census respondents may select one or more Ancestry categories. Where a respondent marks
more than one category, only the first two are coded. This table presents a count of all coded
responses along with a percentage of all responses and a percentage of all persons. Care should be
taken if adding responses together to achieve subtotals as double counting could occur.
1. One parent Australian born and one parent with a not stated birthplace or both parents with a not stated birthplace

AustraliaTable 1.12.1
Summary Indicators2011
Census% of
population2006
CensusChange
2011-2006%
changePopulation 21,507,719 100.0 19,855,287 1,652,432 8.3Australian born 15,021,553 69.8 14,072,958 948,595 6.7Overseas born 5,290,436 24.6 4,416,020 874,416 19.8Birthplace not stated 1,195,730 5.6 1,366,312 -170,582 -12.5Overseas born - Main English speaking countries 1,913,360 8.9 1,675,351 238,009 14.2Overseas born - Non-Main English speaking countries 3,377,076 15.7 2,740,678 636,398 23.2Overseas born - Australian citizens 3,308,895 15.4 2,953,185 355,710 12.0Aboriginal and/or Torres Strait Islanders 548,368 2.5 455,028 93,340 20.5Language other than English spoken at home 3,912,939 18.2 3,146,200 766,739 24.4Overseas born arrived since 2006 1,190,324 5.5 .. .. ..Overseas born arrived since 2006 from NMESC 827,129 3.8 .. .. ..Overseas born with Internet access 4,213,823 19.6 2,944,699 1,269,124 43.1Australian born with Internet access 12,254,158 57.0 9,559,644 2,694,514 28.2LOTE spoken at home with internet access 3,118,978 14.5 2,042,337 1,076,641 52.7
Table 1.12.2Overseas born: Birthplace by Gender, 2011, 2006 and 2001 Census
Birthplace Males Females Persons% of OSB
2006 Census
2001 Census
% change 2006-2011
England 459,568 452,024 911,592 17.2 856,938 847,365 6.4New Zealand 245,090 238,307 483,397 9.1 389,467 355,765 24.1China (excludes SARs and Taiwan) 141,595 177,374 318,969 6.0 206,590 142,780 54.4India 164,208 131,154 295,362 5.6 147,105 95,452 100.8Italy 94,812 90,591 185,403 3.5 199,123 218,718 -6.9Vietnam 84,806 100,230 185,036 3.5 159,849 154,830 15.8Philippines 64,620 106,614 171,234 3.2 120,540 103,942 42.1South Africa 71,713 73,969 145,682 2.8 104,131 79,425 39.9Scotland 66,592 66,840 133,432 2.5 130,204 137,252 2.5Malaysia 52,866 63,329 116,195 2.2 92,335 78,858 25.8Germany 51,327 56,675 108,002 2.0 106,524 108,219 1.4Greece 48,812 51,125 99,937 1.9 109,989 116,430 -9.1Sri Lanka 44,121 42,294 86,415 1.6 62,256 53,461 38.8United States of America 38,228 38,781 77,009 1.5 61,719 53,694 24.8Lebanon 39,538 36,912 76,450 1.4 74,849 71,349 2.1Netherlands 38,691 37,357 76,048 1.4 78,923 83,324 -3.6Hong Kong (SAR of China) 35,778 39,177 74,955 1.4 71,802 67,121 4.4Korea, Republic of (South) 34,383 40,153 74,536 1.4 52,761 38,899 41.3Ireland 36,231 31,085 67,316 1.3 50,256 50,234 33.9Indonesia 28,038 35,122 63,160 1.2 50,974 47,158 23.9Fiji 26,377 30,603 56,980 1.1 48,144 44,261 18.4Croatia 24,599 24,230 48,829 0.9 50,995 51,909 -4.2Poland 21,220 27,459 48,679 0.9 52,256 58,111 -6.8Singapore 22,077 26,569 48,646 0.9 39,973 33,485 21.7Iraq 24,851 23,317 48,168 0.9 32,521 24,832 48.1Thailand 14,852 30,612 45,464 0.9 30,554 23,600 48.8Malta 20,989 20,286 41,275 0.8 43,701 46,998 -5.6Former Yugoslav Republic of Macedonia (FYROM) 20,152 20,071 40,223 0.8 40,656 43,527 -1.1Canada 18,155 20,715 38,870 0.7 31,612 27,289 23.0Egypt 18,997 17,533 36,530 0.7 33,494 33,432 9.1Other birthplaces 540,472 549,884 1,090,356 20.6 885,794 813,950 23.1
Total overseas born2,590,34
0 2,700,102 5,290,442 100.04,416,02
44,105,67
0 19.9

Australia (continued)Table 1.12.3Birthplace by Age: Selected birthplace Groups, 2011 CensusPercentage in age group for each birthplace - total expressed as a number
Birthplace 0-14 15-24 25-44 45-64 65+ TotalEngland 5.3 4.4 21.7 40.2 28.4 911,591New Zealand 10.3 12.2 36.9 32.0 8.6 483,397China (excl. SARs and Taiwan) 3.7 22.6 38.3 25.4 9.9 318,970India 8.2 11.9 57.2 15.7 7.0 295,364Italy 0.6 0.8 5.6 34.4 58.6 185,402Vietnam 2.4 7.5 43.9 37.9 8.2 185,037Philippines 9.5 10.6 41.3 33.2 5.4 171,234South Africa 11.5 13.8 37.0 28.7 9.0 145,685Scotland 3.5 3.3 18.9 41.5 32.8 133,431Malaysia 5.5 16.9 36.3 32.0 9.2 116,195Australia
24.2 14.7 26.2 22.9 11.915,017,84
6Mainly English speaking countries 7.3 7.5 28.2 36.2 20.8 1,913,363Non-main English speaking countries 5.4 10.8 35.7 30.1 18.0 3,380,780
Table 1.12.4Birthplace by Year of Arrival: Selected birthplace Groups, 2011 CensusPercentage in arrival group for each birthplace - total expressed as a number and includes 'not stated' category
BirthplaceBefore
1981 1981- 1990 1991- 2000 2001- 2005 2006-2010 2011 TotalEngland 54.2 11.6 8.4 7.8 12.1 1.2 911,594New Zealand 18.6 19.0 19.4 12.8 21.0 3.5 483,398China (excl. SARs and Taiwan) 4.7 13.8 19.7 18.4 35.8 3.1 318,969India 8.7 6.0 12.4 16.6 49.5 3.4 295,361Italy 86.1 2.1 1.6 1.1 2.0 0.3 185,402Vietnam 15.9 36.8 21.8 6.1 12.6 1.3 185,039Philippines 6.4 26.3 21.3 11.1 28.4 3.0 171,234South Africa 12.0 14.2 19.8 19.2 29.8 2.4 145,683Scotland 57.7 12.9 7.6 6.2 9.6 1.2 133,432Malaysia 18.5 25.1 12.8 12.7 23.9 3.9 116,196
Table 1.12.5Languages other than English Spoken At Home by Gender, 2011, 2006, and 2001 Census
Language Males Females Persons% of LOTE
speakers2006
Census2001
Census% change
2006-11Mandarin 154,260 182,149 336,409 8.6 220,605 139,286 52.5Italian 144,429 155,404 299,833 7.7 316,895 353,603 -5.4Arabic 147,232 139,944 287,176 7.3 243,662 209,372 17.9Cantonese 123,791 139,883 263,674 6.7 244,557 225,307 7.8Greek 123,464 128,753 252,217 6.4 252,228 263,718 0.0Vietnamese 111,087 122,301 233,388 6.0 194,856 174,236 19.8Spanish 55,838 61,659 117,497 3.0 98,001 93,595 19.9Hindi 57,922 53,430 111,352 2.8 70,008 47,817 59.1Tagalog 33,533 47,922 81,455 2.1 53,284 .. 52.9German 36,882 43,488 80,370 2.1 75,635 76,444 6.3Korean 37,855 41,930 79,785 2.0 54,623 39,531 46.1Punjabi 42,199 29,031 71,230 1.8 23,165 14,896 207.5Macedonian 34,306 34,541 68,847 1.8 67,832 71,994 1.5Australian Indigenous Languages 29,862 31,937 61,799 1.6 55,697 50,958 11.0Croatian 29,870 31,676 61,546 1.6 63,616 69,851 -3.3Turkish 29,899 29,724 59,623 1.5 53,860 50,693 10.7French 27,669 30,071 57,740 1.5 43,215 39,643 33.6Other languages
673,100 715,8981,388,99
8 35.51,014,46
1 932,885 36.9
Total LOTE speakers 1,893,198 2,019,741
3,912,939 100.0
3,146,200
2,853,829 24.4

Australia (continued)Table 1.12.6English Language Proficiency by Age: Selected Language Groups, 2011 Census
Language0-14
Years15-24 Years
25-44 Years
45-64 Years
65+ Years Total
Mandarin Speak English well/very well 33,711 70,402 106,789 40,952 3,757 255,611 Speak English not well/not at all 12104 8163 18928 27,119 12,026 78,340 Total including not stated 46,457 79,142 126,391 68,476 15,944 336,410 Percent not well/not at all 26% 10% 15% 40% 75% 23%Italian Speak English well/very well 14,211 13,570 62,680 87,486 75,015 252,962 Speak English not well/not at all 1631 580 1498 3801 34,897 42,407 Total including not stated 16,222 14,364 65,150 92,642 111,457 299,835 Percent not well/not at all 10% 4% 2% 4% 31% 14%Arabic Speak English well/very well 55,313 44,624 82,950 43,891 10,898 237,676 Speak English not well/not at all 11886 2825 11467 11570 8,283 46,031 Total including not stated 68,924 47,905 95,113 55,876 19,357 287,175 Percent not well/not at all 17% 6% 12% 21% 43% 16%Cantonese Speak English well/very well 25,248 43,782 64,167 53,617 10,463 197,277 Speak English not well/not at all 6169 2864 9371 28559 17733 64,696 Total including not stated 31,801 46,912 73,941 82,618 28,403 263,675 Percent not well/not at all 19% 6% 13% 35% 62% 25%Greek Speak English well/very well 26416 18299 68,303 56,746 38,391 208,155 Speak English not well/not at all 3448 629 1089 6514 29,828 41508 Total including not stated 30386 19089 70,053 63,833 68,858 252,219 Percent not well/not at all 11% 3% 2% 10% 43% 16%All Speakers of languages other than English Speak English well/very well 472,255 500,495 1,210,411 728,510 307,223 3,218,894 Speak English not well/not at all 133,910 33,647 123,620 175,493 177,333 644,003 Total including not stated 623,695 540,041 1,345,967 912,336 490,896 3,912,935 Percent not well/not at all 21% 6% 9% 19% 36% 16%
Table 1.12.7Ancestry by Birthplace of Parent(s): Selected Ancestry Groups, 2011 Census
Australian BornOverseas
BornNot stated birthplace
Total responses
Ancestry
Both parents born in
Australia
Both parents
born overseas
One parent OS born/
one parent Aust born
One parent OS/ one
parent birthplace not stated Other1
English 4,318,277 392,629 1,015,069 7,710 106,043 1,299,413 99,428 7,238,569Australian 5,485,168 103,050 1,156,106 4,536 121,417 139,286 88,925 7,098,488Irish 1,489,150 68,761 212,235 1,332 27,736 262,684 25,852 2,087,750Scottish 1,117,336 91,761 242,161 1,561 20,046 299,751 19,986 1,792,602Italian 312,460 213,710 151,010 2,405 8,846 215,801 11,886 916,118German 552,497 66,976 105,805 962 10,027 151,593 10,811 898,671Chinese 37,313 147,115 33,705 1,465 3,034 634,323 9,253 866,208Indian 6,004 56,585 14,967 546 920 308,631 3,262 390,915Greek 89,650 111,482 52,277 1,322 3,431 113,997 6,106 378,265Dutch 79,806 61,511 80,814 669 2,286 107,391 2,998 335,475
1. One parent Australian born / one or both parent(s) birthplace not stated

Australia (continued)Table 1.12.8Religious Affiliation by Gender, 2011 and 2066 Census
Religion Males Females Persons
% of populatio
n2006
CensusChange 2006-11
% change
Western Catholic 2,586,508 2,810,888 5,397,396 25.1 5,087,116 310,280 6.1No Religion, nfd 2,495,971 2,197,190 4,693,161 21.8 3,643,819 1,049,342 28.8Anglican Church of Australia 1,729,125 1,948,880 3,678,005 17.1 3,716,377 -38,372 -1.0Uniting Church 476,640 589,155 1,065,795 5.0 1,135,427 -69,632 -6.1Presbyterian 280,389 304,429 584,818 2.7 583,396 1,422 0.2Buddhism 240,186 288,792 528,978 2.5 418,759 110,219 26.3Islam 249,023 227,268 476,291 2.2 340,392 135,899 39.9Christian, nfd 215,297 245,913 461,210 2.1 305,480 155,730 51.0Greek Orthodox 190,967 192,433 383,400 1.8 374,575 8,825 2.4Baptist 166,186 186,312 352,498 1.6 316,742 35,756 11.3Hinduism 148,462 127,073 275,535 1.3 148,125 127,410 86.0Lutheran 119,066 132,863 251,929 1.2 251,105 824 0.3Pentecostal, nfd 88,766 103,414 192,180 0.9 88,534 103,646 117.1Not Defined 90,178 42,419 132,597 0.6 108,654 23,943 22.0Judaism 47,062 50,273 97,335 0.5 88,831 8,504 9.6Jehovah's Witnesses 37,479 48,158 85,637 0.4 80,918 4,719 5.8Sikhism 42,227 30,068 72,295 0.3 26,426 45,869 173.6Seventh-day Adventist 28,744 34,258 63,002 0.3 55,253 7,749 14.0Salvation Army 26,400 33,761 60,161 0.3 64,200 -4,039 -6.3Atheism 34,583 24,315 58,898 0.3 31,305 27,593 88.1Church of Jesus Christ of LDS (Mormons) 27,927 30,910 58,837 0.3 52,146 6,691 12.8Macedonian Orthodox 26,416 25,632 52,048 0.2 48,084 3,964 8.2Eastern Orthodox, nfd 24,255 25,322 49,577 0.2 48,158 1,419 2.9Churches of Christ (Conference) 18,633 23,510 42,143 0.2 47,773 -5,630 -11.8Serbian Orthodox 20,970 20,861 41,831 0.2 39,968 1,863 4.7Religious Belief, nfd 16,138 19,032 35,170 0.2 20,539 14,631 71.2Agnosticism 18,177 16,454 34,631 0.2 22,131 12,500 56.5Maronite Catholic 15,297 15,363 30,660 0.1 29,071 1,589 5.5Assemblies of God 12,849 15,452 28,301 0.1 94,891 -66,590 -70.2Coptic Orthodox Church 12,599 12,096 24,695 0.1 19,923 4,772 24.0Other religions 167,572 191,484 359,056 1.7 343,212 15,844 4.6Not stated 979,921 859,728 1,839,649 8.6 2,223,957 -384,308 -17.3
Total Persons 10,634,01310,8
73,706 21,507,719 100.019,855,28
7 1,652,432 8.3
Table 1.12.9Religion by Birthplace and Age: Selected Religious Groups, 2011 Census
Birthplace AgeReligion Australia Overseas Not Stated 0-14 15-24 25-44 45-64 65+Western Catholic
4,042,488 1,266,757 88,1501,105,61
4 721,3911,438,38
61,368,03
1 763,971No Religion, nfd
3,602,221 1,044,619 46,3231,101,63
1 777,1631,531,98
0 983,287 299,101Anglican Church of Australia 2,982,367 632,086 63,550 543,317 351,862 845,294
1,132,308 805,223
Uniting Church 928,240 119,987 17,567 145,817 107,085 216,432 336,006 260,454Presbyterian 425,983 146,947 11,887 53,702 41,649 111,277 211,806 166,384Buddhism 159,282 361,738 7,958 78,228 77,987 190,936 146,219 35,609Islam 179,083 286,160 11,045 138,921 82,413 168,112 70,801 16,043Christian, nfd 328,421 127,307 5,481 107,242 71,166 130,998 110,994 40,809Other religions 1,639,187 1,100,378 42,857 504,231 378,861 873,130 662,227 363,973Not stated 734,517 204,223 900,910 365,323 256,893 523,491 433,229 260,712
Total persons 15,021,789 5,290,202 1,195,7284,144,02
6 2,866,4706,030,03
65,454,90
8 3,012,279
