the people behind the numbers ieldworker - statssa.gov.za · 2 the fieldworker, april/may 2014 the...
TRANSCRIPT

Census 2011 paints a picture of progress since 1994, as depicted in the two areas that these youngsters come from — see below.
Figures provided by Faizel Mohammed and Kevin Parry
FieldworkerVolume 5 Number 2, April/May 2014
The people behind the numbers
www.statssa.gov.za
Inside this edition: What is the Master Sample? p2; All about household statistics p3; Victims of crime: Housebreakings and home robberies p4; Monthly economic statistics p6; The dynamics of travel in SA p7; Test your knowledge p8
Producing data that people can trust and use is at the heart of our existence. However, we will fail in our mission if the data provided is not used by our stakeholders to improve the lives of all South Africans.
In this edition there are countless illustrations of the use or potential use of statistics to inform democracy. As we stand on the verge of South Africa’s fifth democratic elections we look at how life has changed for those born in a free, fair, and democratic country. We also provide a glimpse of the number of registered voters (as per the IEC) in comparison to the number of voters who are eligible to vote (as per Census 2011) on May 7. We delve into the latest Victims of Crime report which provides a number of pointers on our country’s crime situation and provide interesting insights into the travel patterns of South Africans (as per the results of the latest National Household Travel Survey). In our ongoing efforts to share the depth and breadth of Stats SA’s work, we also take you through the range of household and some of the business surveys conducted by the organisation.
Knowledge is power and there is power in numbers. This publication aims to get you to understand the environment in which you live, work and play — through statistics. We would like to urge you to read our publication, access our data, and empower yourself with knowledge to understand your South Africa and to make decisions based on evidence.
We trust that you will enjoy this edition of The Fieldworker. Happy reading.
Editorial
THE SOUTH AFRICA I KNOW, THE HOME I UNDERSTAND
Who makes up the first generation of voters born in a free South Africa? Biziwe Maswili reports
www.facebook.com/StatsSA@StatsSA
The born frees – also known as the “Mandela genera-tion” – represent a significant percentage of South Africa’s population. They live in every
province, city, town, township or village. Most are between the ages of 18 and 20 and, according to Census 2011, they make up 40% of the population.
These young people are either in matric, first year at a tertiary institution or entering the job market. Unfortunately, some have become what is now known as “NEETs” (the youth between ages 15 to 24 years not in education, employed or training).
According to the Quarterly Labour Force Survey (QLFS) 2013 (quarter four), 30,2% of 15- to 24-year-olds fall within this cat-
egory. Whatever their situation,
many will for the first time cast their vote in the coun-try’s fifth demo-
cratic elec-tion to be
held in May
hands of the apartheid regime,” says Kegak-ilwe who is not shy in adding that he comes from an educated family.
Mittah Raditlhalo (21) grew up in Geelhout Park in Rustenburg. She is quick to point out that she was raised in the “new South Africa”. “It was at a time when the country was free from racial segregation, thus I have been able to chase my dreams with-out any fear,” boasts Mittah.
Besides racial discrimination, South Africa has moved a long way in addressing imbalances created by the past government. The new politi-cal dispensation prides itself in the new Constitution, which affords every citizen the rights, privileges and bene-fits of this country.
“In this new era, all South Africans have been given opportuni-ties to better themselves.
Although we now live in a free society, we face another struggle. The struggle of class and status, where those who are economi-cally successful look down on the less privi-
leged and this represents inequal-ity. We can see it everywhere;
the privileged boasting about the brands of cloth-ing they wear, the cars they drive, and the areas they live in. This lowers the esteem of the disadvantaged as
they think they are less capable,” adds Mittah.
When you see this arrow it means the release is available on www.statssa.gov.za
Born Free in South Africa
this year. They will play a role in shaping the future of the country.
Although they may not have been exposed to apartheid laws and policies, most of them understand the damage caused to this coun-try by “apartheid”. They are concerned about their future in this country and often do not see things across racial lines like many older South Africans.
The born frees know Nelson Mandela and the sacrifices he made towards the fight for freedom and democracy. Born frees are now his legacy and, as the future of this country, they should ensure that the injustices of the past are never repeated.
Fieldworker interviewed two “born frees” who are part of Stats SA’s 2014 Internship Programme, to get their views on life in the new South Africa.
Kegakilwe Shole (22) believes 1994 yielded many opportunities and possibilities for previously disadvantaged South Africans.
While his father comes from Tlokweng Village in North West, Kegakilwe was born in Ga-Rankuwa, north of Pretoria, in 1991. He was only three years old when South Africans took to the polls on 27 April 1994 – an era that resulted in the birth of the new dispensation.
“Although I feel privileged, I have had to understand the injustices many South Africans suffered at the
Ga-Rankuwa (Tshwane Wards 30, 31 and 32) 1996 2001 2011
Population 61014 76286 92989Households 12819 18895 28705Household services (% of households)Piped water in dwelling/yard 97,2 88,1 93,4Electricity for lighting 83,0 84,9 95,1Refuse removal 95,5 88,8 92,4Highest education level reached (% of those age 20+)No schooling 7,2 7,6 3,6Matric 24,3 32,6 37,4Higher 9,9 13,0 17,0
Did you know?
The number of first-time registered voters between
ages 18 and 19 for the 2014 elections is:Male 313 310Female 370 206
Source: IEC
Geelhout Park (Rustenburg Ward 08) 1996 2001 2011
Population 4208 8376 21899Households 889 2509 6685Household services (% of households)Piped water 99,8 96,1 99,4Electricity 99,7 95,2 99,0Refuse removal 99,9 97,1 99,5Highest education level reached (% of those age 20+)No schooling 1,6 2,9 1,1Matric 34,9 37,1 43,9Higher 21,0 27,1 31,9
Mittah Raditlhalo
Kegakilwe Shole

2 The Fieldworker, April/May 2014 The Fieldworker, April/May 2014 3
Above and below: Examples of how primary sample units are demarcated
What is the Master Sample?
All about household statistics
General Household Survey (GHS)Background: The General Household Survey (GHS) is designed to measure multiple aspects of South African households’ living conditions as well as the quality of service delivery in a number of key service sectors. The GHS covers six broad areas: education, health and social development, housing, household access to services and facilities, food security, and agriculture.
Sample: The survey covers about 33 000 dwellings/houses across the nine provinces in South Africa.
The survey’s importance and use:n Assists in generating national social development indicators used to measure the life circumstances of South African households; and n It provides information, which assists in measuring the impact of government policies and programmes, thereby highlighting the needs, availability and use of services provided by government.
Domestic Tourism Survey (DTS)Background: The Domestic Tourism Survey (DTS) collects information on the travel behaviour and spending patterns of South African residents travelling within the borders of South Africa.
Sample:The survey covers about 33 000 dwellings/houses across all provinces in South Africa.
The survey’s importance and use:n To understand the travel behaviour of an average South African resident; andn Determine the contribution of the tourism industry towards the South African economy. The survey information assists with planning, marketing, policy formulation and regulation of tourism-related activities.
Quarterly Labour Force Survey (QLFS)Background:The Quarterly Labour Force Survey (QLFS) is a household-based survey that collects information from persons between the ages of 15 to 64 in the labour market — that is those who are employed, unemployed, and those who are not economically active.
How are employed, unemployed or not economically active individuals defined in the survey?n Employed individuals refer to persons aged 15 to 64 who worked for a salary or are involved in running a business.n Unemployed persons refer to persons aged 15 to 64 who are actively seeking employment. n Not economically active defines persons who did not work, did not look for work and were not available to start work. The discouraged, a sub-set of the not economically active, wanted to work but did not try and find a job as they lost hope in finding any kind of employment, or they were unable to find a job requiring their skills or there were no jobs available in their area.
The information collected from the QLFS is used to:Provide a basis for monitoring current trends and changes in the labour market and employment situation of South Africa on a regular basis.
Sample:The survey covers about 33 000 dwellings/houses across the nine provinces in South Africa.
Why is the survey important?n Assists in determining the labour market status (employment, unemployment and inactivity) of persons in the country;n Provides insight into key labour market patterns in the country. Key labour market patterns would include the changes over time in the number of employed, unemployed and inactive persons. In addition the share of employed in the working age population (those aged 15–64 years), also called the absorption rate as well as the unemployment rate, can be tracked to determine the performance of the labour market. n In addition, the survey can provide insight into the changes in employment in different industries, for example persons employed in the Manufacturing industry.
Victims of Crime Survey (VOCS)BackgroundThe Victims of Crime Survey (VOCS) collects information on people’s perceptions and experiences of crime. Information is also collcted on the views regarding access to and the effectiveness of the police and criminal justice system. See centre spread.
Want to know which industries are hiring, or where South Africans travel? Statistics South Africa produces comprehensive information about the country’s people. Let’s take a look at some of our household surveys
The Fieldworker editorial team
Editor-in-chief: Trevor Oosterwyk
Editor: Shirazaan Taylor
Deputy Editor and News Editor: Aneen Jordaan
Contributors: Vienie Botha, Mbongiseni Mndebele, Biziwe Maswili; Dion Pietersen, Kevin Parry, Faizel Mohammed, Gerald White
Language editor, layout and design: Cheryl Taylor
Printer: Law PrintThe Fieldworker is a bimonthly publication produced by Statistics South Africa, Private Bag X44, Pretoria 0001 Tel: (012) 310 6552;
Please send your comments to us at [email protected]
The Master Sample (MS) is a sample drawn from a popula-tion of the country for use on a number of future occasions for surveys, so as to avoid ad hoc
sampling on each occasion. The informa-tion contained in the master sample is that of households by province and the settle-ment types, for example, traditional or urban. The dwelling frame is a sampling frame from which dwelling units are selected for household surveys by Statistics South Africa (Stats SA).
The Master Sample is essentially a sample frame that is generated from a process of list-ing of all structures and features from selected areas within a country. Each of the different settlement types is reflected in the MS frame. The frame thus covers all areas where the civilian population resides within the country. Structures where households reside are given private dwelling (PD) feature codes and thus become eligible to be selected to participate in our household surveys.
What is listing?Listing is the process of identifying, recording, and capturing, in a consecutive order, all struc-tures and features within the boundaries of spe-cific areas called primary sample units (PSUs).
All structures that are used for residential purposes, all non-residential buildings such as churches, schools, businesses, shops, and promi-nent features such as soccer fields, vacant stands, and parks that are found in the PSU are listed.
Why is listing done for the Master Sample? Listing is done prior to data collection to make sure that there is an up-to-date and accurate record of all structures in a given PSU. The sample is drawn for data collec-tion from listed PSUs.
It is the households within these sampled dwelling units that will be interviewed for Stats SA’s household surveys.
Complete and accurate listings are essen-tial if a statistical organisation wants an unbiased sample for its surveys
How is the listing done?The listing exercise entails the following: n Stats SA fieldwork staff, called “listers”, will physically visit PSUs and will record all structures and features in the selected area in a listing book.n Dependent on the settlement type, listers would profile areas and apply the appropriate listing methodology for the area being worked in. For example, in some traditional and for-mal residential areas, a process of “blocking” is implemented. Blocking can be defined as a process of using roads and streets to physically ensure complete coverage of an area, thus omit-ting duplication and omission of structures.
n Serpentine listing is used in farm areas – a process of listing all structures that are confined in the farm boundary starting from the farm owner or manager’s house and then listing all structures on the left until all structures in the farm have been listed before moving to the next farm.
n A process of segmentation was intro-duced into the Master Sample in 2006/7. Segmentation is applied only in informal areas. There are two phases to segmentation.
Phase one: Involves the creation of segments on the map that is issued to the lister (using a gel pen). The lister will cre-ate boundaries within the PSU – boundaries can be in the form of gravel roads, footpaths and dirt roads. Each segment should have between eight and 15 dwelling units (some are a bit larger due to the physical situation on the ground).
Phase two: Once completed, this information is sent to a team of methodolo-gists who then sample a segment (or seg-ments) for the actual listing process. The lis-ter then goes back to the area and only lists those structures that fall within the segment boundaries that were identified earlier.
Where necessary the lister will ask questions about occupancy of structures in the yards that
fall within the boundaries of the areas they are working in – this allows for accurate sampling for our surveys – only houses with people resid-ing in them or those that have the potential to have a household reside in them will become eligible for our surveys.
How to identify our listers?Listers work in teams of two. They will carry an official Stats SA identification card (that has an official Stats SA logo). This card contains information on: n Name and surname of the listern The lister’s identity numbern Province where the lister is assigned to work
Listing enquiries can be directed for the attention of the fieldwork operations man-agers in the respective provinces. They can be contacted using the provincial office con-tact details on page 8.
How the public can helpIf your premises needs to be listed we would appreciate your cooperation in allowing our staff to enter your premises to record the structures and features.
We also appeal to you to answer ques-tions on occupancy and use of the structure as it will assist in coding of the structures – if there are people living in a structure, then the structure becomes eligible to be selected for participation in our surveys.
Your support and cooperation is appreci-ated by the organisation. — Compiled by Dion Pietersen
One in three South African adults are regular users of drugs. This shocking fig-ure, sourced from a survey conducted by the Anti Drug
Alliance of South Africa, was published in The Times in early 2013, which ran with the dismaying headline: “SA has lost the war on drugs”. It was also published in The Star, which quoted the Alliance’s survey report as describing South Africa as a country “hit by a drug tsunami”.
Very frightening indeed, and frightening statistics – because they draw on our fears – are often repeated and cited around the braai fire or on social media.
Incredibly alarming and seemingly over-the-top statistics should be regarded with a fair amount of scepticism.
To arrive at some conclusion on whether to trust what a specific set of statistics say about the world around us, one should practise the habit of not focusing on what the statistic actually says, but ask critical questions on how the statistic was calculated.
Africa Check, a non-profit organisation that fact-checks claims made in the public arena, did just that with the Anti Drug Alli-ance survey, by subjecting the report to two questions:
n What was the sample size of the survey?
n Was the sample representative? Who did it include and who did it exclude?
The sample consisted of 57 809 respond-ents who were reached using an online survey, emails, telephone calls and social media platforms. However, as Africa Check concluded, this sample was not representa-tive of the South African population as a whole.
First, most of the respondents were indi-viduals who had previously interacted with the Anti Drug Alliance; this group would tend to overestimate the drug problem, as it is likely that they have had some exposure to the effects of drug abuse.
Second, the survey only included individ-uals who have access to the Internet. Thus, the results of the survey cannot be used to conclude what is happening in South Afri-can society as a whole.
Statistics South Africa (Stats SA), as the country’s official source of statistics, uses rigorous techniques to ensure a survey sam-ple is representative.
Stats SA uses international best practice to select representative samples. Our sam-ple for household surveys consists of about 33 000 dwellings, reflecting South African society at large, in terms of urban, rural, and provincial location, and metro and non-metro, for example. In other words, all dif-ferent kinds of South African households are targeted in a survey.
This is also true for surveys relying on information from businesses for the range of economic statistics produced.
Businesses are selected across industries, and size – from major corporations to the entrepreneur.
So, when you hear someone citing an incredible statistic, ask the important ques-tion: how large was the sample, and was care taken to ensure that the sample is repre-sentative of the entire population? — Kevin Parry
Don’t be fooled by statistics
A household is a person, or group of persons who live together and provide themselves jointly with food and/or other essentials for living
Dwelling units are structures in which households reside
What is expected from you?If you are selected to participate in a survey as a respondent, we would appreciate it if you could:n Set aside time to meet with the Stats SA Survey Officer to complete the once-off household questionnaire.n Truthfully answer the questions asked by the Survey Officer.
Did you know?
48,1% of households in Limpopo and 30,4%
of households in Eastern Cape were still using wood and paraffin for
cooking.Source: GHS
Did you know?
In 2010 and 2011, KwaZulu-Natal and
Gauteng were the most visited destinations for
overnight trips. Source: DTS
Compiled by Gerald White and Biziwe Maswili
4 The Fieldworker, April/May 2014 The Fieldworker, April/May 2014 5
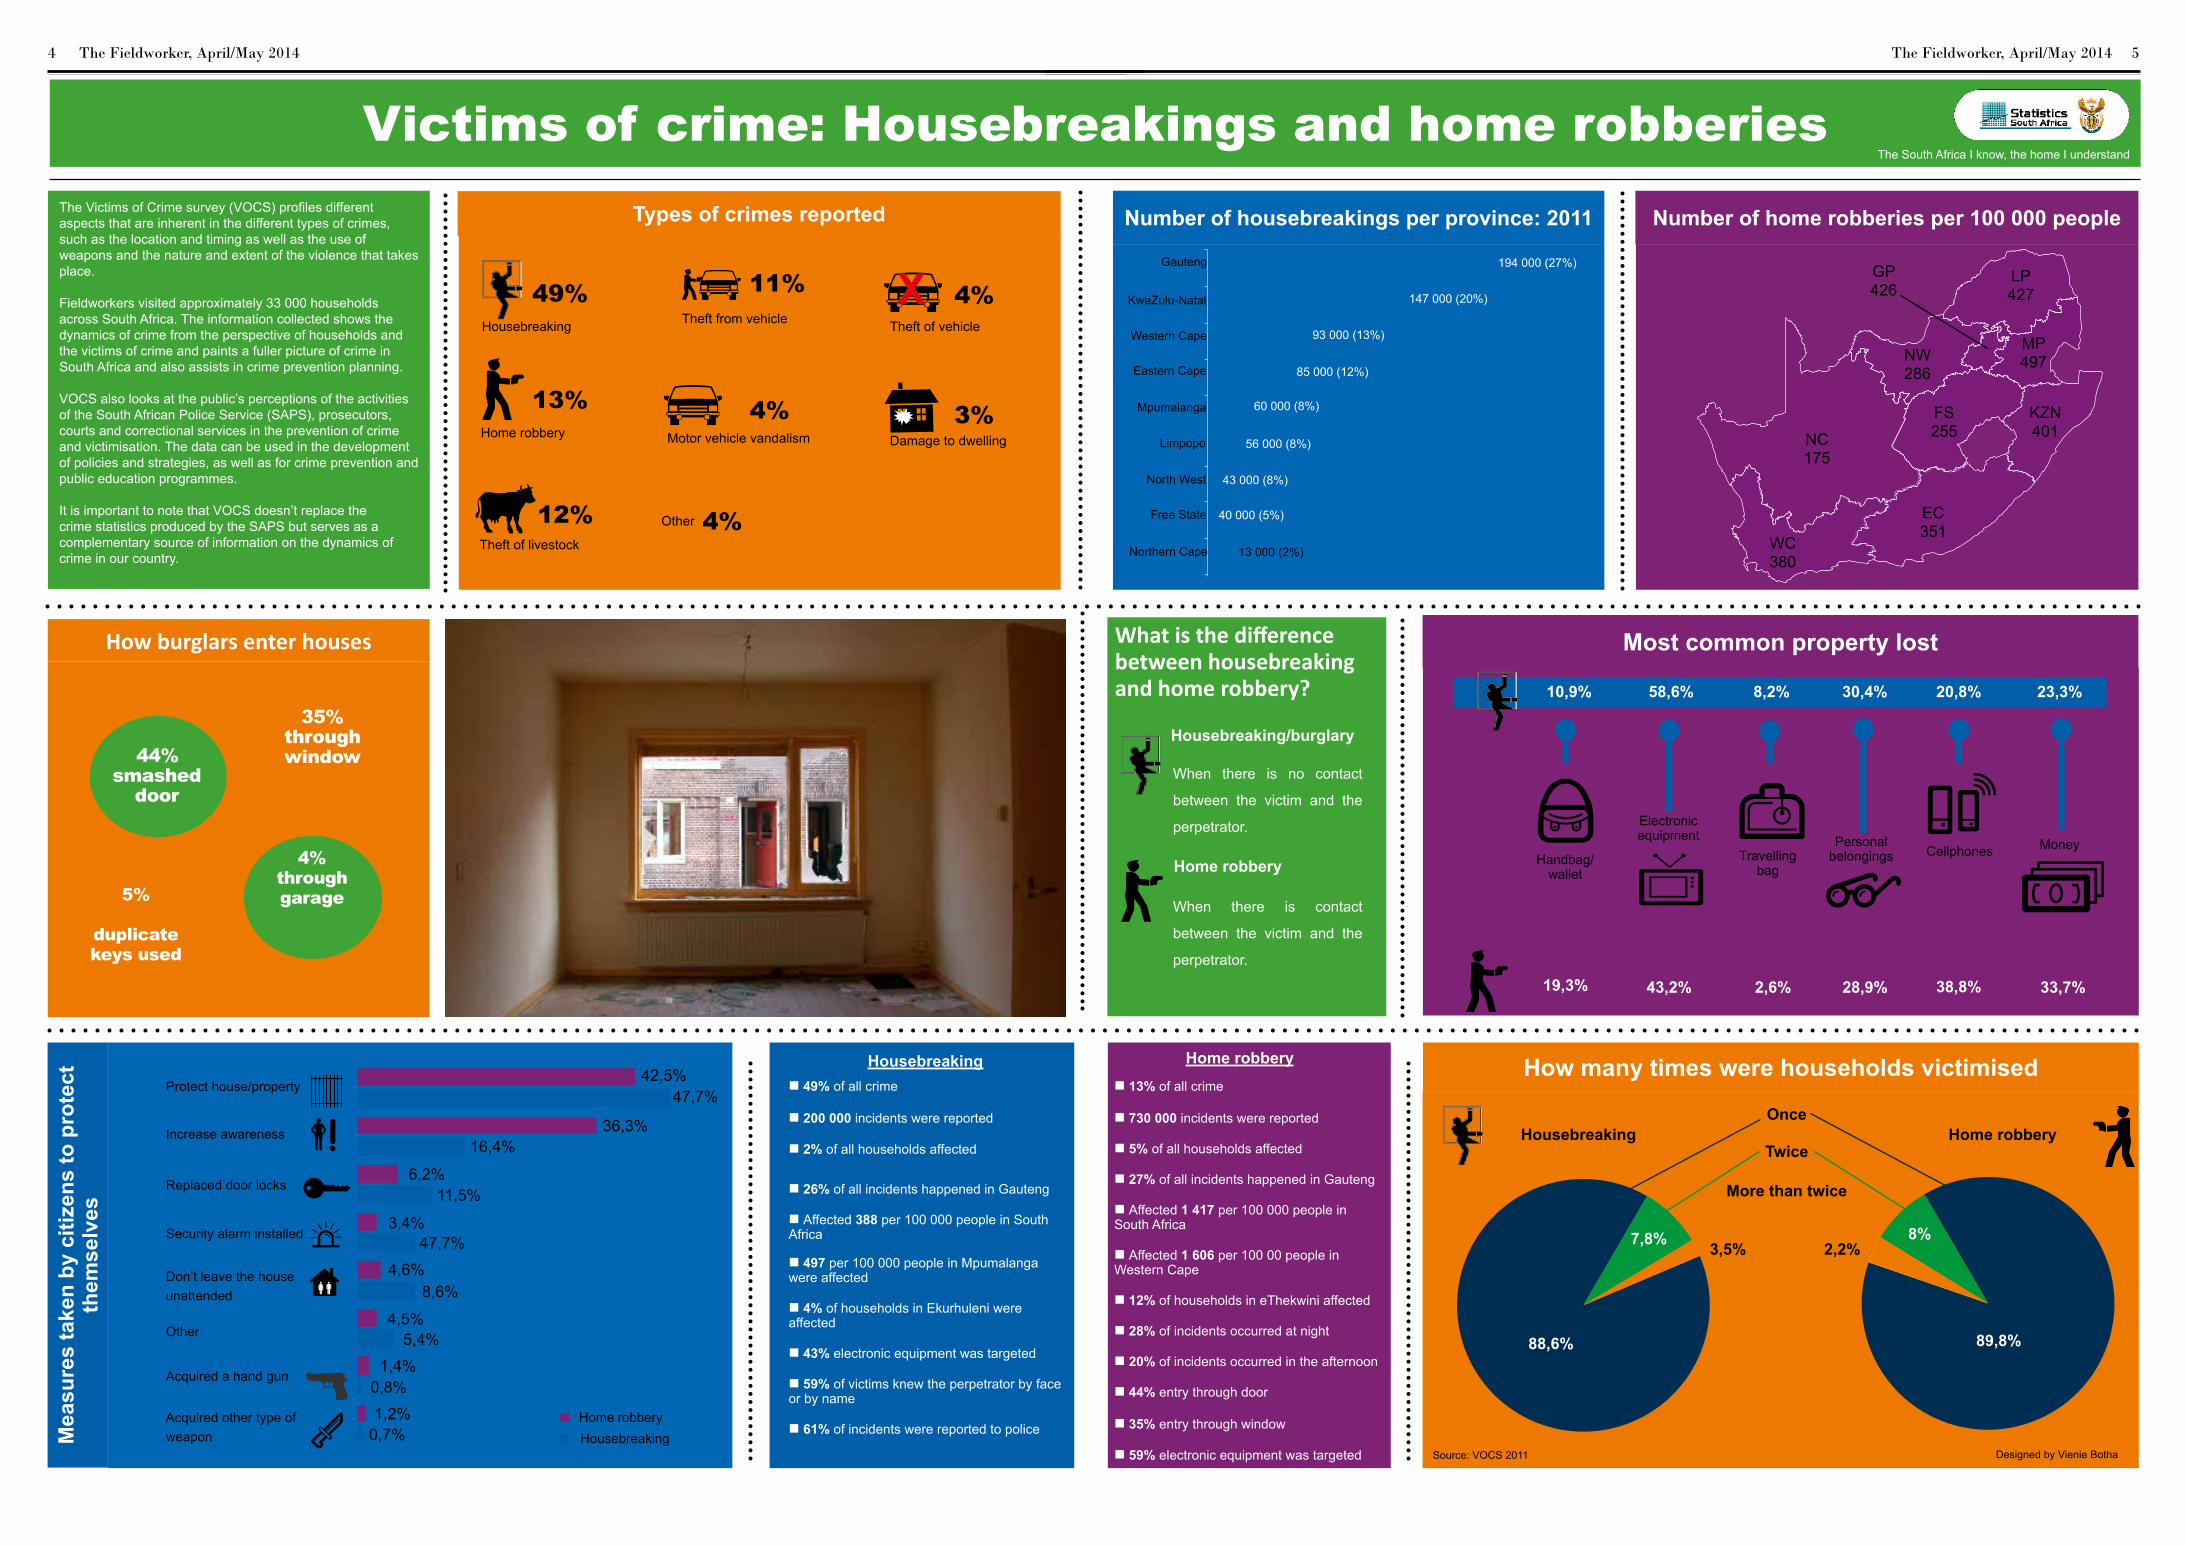
The Victims of Crime survey (VOCS) profiles different aspects that are inherent in the different types of crimes, such as the location and timing as well as the use of weapons and the nature and extent of the violence that takes place.
Fieldworkers visited approximately 33 000 households across South Africa. The information collected shows the dynamics of crime from the perspective of households and the victims of crime and paints a fuller picture of crime in South Africa and also assists in crime prevention planning.
VOCS also looks at the public’s perceptions of the activities of the South African Police Service (SAPS), prosecutors, courts and correctional services in the prevention of crime and victimisation. The data can be used in the development of policies and strategies, as well as for crime prevention and public education programmes.
It is important to note that VOCS doesn’t replace the crime statistics produced by the SAPS but serves as a complementary source of information on the dynamics of crime in our country.
Other 4%
Victims of crime: Housebreakings and home robberiesTypes of crimes reported
How burglars enter houses
Number of housebreakings per province: 2011
How many times were households victimised
Number of home robberies per 100 000 people
44%smashed
door
5%
duplicate keys used
4%through garage
35%through window
Source: VOCS 2011 Designed by Vienie Botha
What is the difference between housebreaking and home robbery?
When there is no contact
between the victim and the
perpetrator.
When there is contact
between the victim and the
perpetrator.
Mea
sure
s ta
ken
by c
itize
ns to
pro
tect
th
emse
lves
Gauteng
KwaZulu-Natal
Western Cape
Eastern Cape
Mpumalanga
Limpopo 56 000 (8%)
Northern Cape
Free State
North West
40 000 (5%)
13 000 (2%)
60 000 (8%)
147 000 (20%)
194 000 (27%)
93 000 (13%)
85 000 (12%)
In 2011, South Africa experienced an estimated 730 000 housebreakings, 27% of these took place in Gauteng
South Africa388
42,5%47,7%
16,4%
11,5%
47,7%
8,6%
5,4%
0,8%
0,7%
36,3%
6,2%
3,4%
4,6%
4,5%
1,4%
1,2%
Protect house/property
Increase awareness
Replaced door locks
Security alarm installed
Don’t leave the house unattended
Other
Home robberyHousebreaking
Acquired a hand gun
Acquired other type of weapon
! Housebreaking Home robbery
Home robberyn 13% of all crime
n 730 000 incidents were reported
n 5% of all households affected
n 27% of all incidents happened in Gauteng
n Affected 1 417 per 100 000 people in South Africa
n Affected 1 606 per 100 00 people in Western Cape
n 12% of households in eThekwini affected
n 28% of incidents occurred at night
n 20% of incidents occurred in the afternoon
n 44% entry through door
n 35% entry through window
n 59% electronic equipment was targeted
Housebreakingn 49% of all crime
n 200 000 incidents were reported
n 2% of all households affected
n 26% of all incidents happened in Gauteng
n Affected 388 per 100 000 people in South Africa
n 497 per 100 000 people in Mpumalanga were affected
n 4% of households in Ekurhuleni were affected
n 43% electronic equipment was targeted
n 59% of victims knew the perpetrator by face or by name
n 61% of incidents were reported to police
43 000 (8%)
Most common property lost
Once
Twice
More than twice
7,8% 3,5% 2,2%8%
88,6% 89,8%
Theft of livestock
12%
Theft of vehicle
4%X
Motor vehicle vandalism
4%Home robbery
13%
Theft from vehicle
11%
Damage to dwelling3%
Housebreaking
49%
10,9%
Handbag/wallet
Electronic equipment
Travelling bag
Personal belongings Cellphones Money
43,2%19,3% 2,6% 28,9% 38,8% 33,7%
58,6% 8,2% 30,4% 20,8% 23,3%
NC175
WC380
EC351
NW286
LP427
MP497
KZN401
FS255
GP426
Housebreaking/burglary
Home robbery
The South Africa I know, the home I understand

6 The Fieldworker, April/May 2014 The Fieldworker, April/May 2014 7
Answers from page 8Crossword:Across2. Household6. Housebreaking7. Taxi9. Born Frees
Down1. Spending patterns2. Hourly3. Electronic4. Gauteng5. Census8. Four
Trivia: 1. B 2. C3. A 4. D5. C 6. B7. A 8. D9. C 10. A
From entrepreneurs to CEOs, information produced by Stats SA can be used to inform just about any business-related activity
Monthly economic statisticsHow the collection is done Questionnaires are sent to the survey-specific sample through the use of email, fax, telephone and post.
The selected businesses are requested to complete the questionnaire and return to Statistics South Africa by the due date, which is 10 days after the reference month.
The collected information is checked and captured.
Once the information is captured, it is then analysed and used to compile the monthly statistical release.
The confidentiality of the information provided is protected by section 16 of the Statistics Act (Act No. 6 of 1999). Penalties and even jail time are imposed on any staff member who breaks this confidentiality.
Why the surveys are important For government to make informed decisions and monitor the country’s economic policies monthly, up-to-date information is needed. These decisions ultimately affect the lives of all South Africans through the impact of the policy on the country’s economic well-being.
The information from the monthly economic surveys filters into the production of the gross domestic product (GDP). GDP measures the performance of a country’s economy, which is the total value of goods and services produced in South Africa over a specific period. This impacts on the everyday person. For example, an increase in the production of goods and services builds a stronger economy, which increases the possibility that companies will hire more staff. Earning a salary leads to more spending in the country and further strengthens the economy. A strong economy leads to more investment in the country, which is good for South Africa and its people.
Each industry has to plan for its development and growth. The information provided by these surveys assists the industry or businesses in measuring changes within the relevant industry and assists with making informed decisions. Accurate information is the basis for sound decision-making in business.
Terms explainedn The business sample frame is a list of businesses registered at the South African Revenue Service (SARS) for value added tax (VAT) and income tax (IT) that operate within the borders of South Africa.
n Reference month is the month/period for which the information is being collected.
This survey covers enterprises from the wholesale trade industry,
which are drawn from the business sample frame. The results from the survey feature information on key growth
rates in wholesale trade sales, wholesale trade sales at current
prices, percentage changes from year to year, and contribution by type of dealer.
SampleApproximately 1 050 wholesalers from a population of about 19 300 enterprises are selected to participate in the survey each month.
Did you know? The following types of wholesale dealers are included in the sample: n fee or contract basis – sales by commission agents, commodity brokers, auctioneers and ‘other’ wholesale trade on a fee or contract basis;n agricultural raw materials and livestock;n food, beverages and tobacco;n textiles, clothing and footwear;n ‘other’ household goods except precious stones. This group includes wholesale trade in household furniture, requisites and appliances, wholesale trade in books and stationery, wholesale trade in pharmaceuticals and toiletries and wholesale trade in ‘other’ household goods not elsewhere classified;n precious stones, jewellery and silverware;n solid, liquid and gaseous fuels and related products;n metals and metal ores;n construction materials, hardware, plumbing and heating equipment and supplies;n ‘other’ intermediate products, waste and scrap;n machinery, equipment and supplies; andn ‘other’ goods. This group covers general wholesale trade and ‘other’ wholesale trade not classified elsewhere.n Five out of the 12 types of dealers accounted for approximately 73% of total wholesale sales in 2013, namely food, beverages and tobacco; ‘other’ household goods except precious stones; solid, liquid and gaseous fuels and related products; machinery, equipment and supplies; and ‘other’ goods.
The Tourist accommodation survey covers a sample of public and
private enterprises that are involved in the short-stay accommodation industry in South Africa and are registered
for value added tax (VAT). The survey provides the following
information by type of accommodation:n stay units available (e.g. hotel room);
n stay unit nights sold (e.g. hotel room occupied for one night);n average income per stay unit night sold; andn income from accommodation.
Sample: The survey includes all large and medium enterprises that provide short-stay accommodation and a sample of small and micro-enterprises. Approximately 1 000 enterprises from a population of 4 300 enterprises are selected to participate in the survey.
Did you know? Short-stay commercial accommodation includes: n hotels, motels, botels and inns; n caravan parks and camping sites; n guest-houses and guest-farms; andn ‘other’ accommodation (e.g. lodges, bed-and-breakfast establishments, self-catering establishments and ‘other’ establishments not elsewhere classified).n Caravan parks and camping sites (51,1%) and hotels (20,3%) recorded the highest year-on-year growth rates for income from accommodation in December 2013.
This survey deals with the electricity industry and covers
electricity undertakings and establishments. It looks at the volume of electricity units:n produced and consumed in
South Africa; n purchased and sold outside
South Africa; and n distributed by Eskom according to
province on a monthly basis.
Sample: The survey is conducted by mail, email and telephone and includes all large electricity undertakings and establishments generating electricity for re-distribution or for own use, and a sample of smaller undertakings and establishments. The total sample size is 25.
Did you know? n Unlike the other industries in the economic sector, electricity is produced according to need. n Electricity cannot be stored, thus it is produced hourly according to demand after imports and exports of electricity are taken into account.n Annual consumption of electricity decreased by 0,5% in 2013 compared with 2012, according to the December 2013 reportn The unit of measurement for electricity is: 1 unit of electricity = 1 Kilowatt-hour 1 000 000 units of electricity = 1 Gigawatt-hour
This survey collects data on physical quantities of manufactured products and value of stocks and sales from a sample of enterprises in the manufacturing industry of the South African economy. The main topics covered in this survey include indices of the physical volume of manufacturing production and the total value of sales. It covers manufacturing enterprises conducting activities in:n the manufacturing, processing, making or packing of products;n the slaughtering of animals, including poultry; andn installation, assembly, completion, repair and related work.
Sample: The survey includes all large manufacturers and a sample of smaller manufacturers. The sample size is approximately 3 000.
Did you know? Manufacturing production for 2013 increased by 1,3% compared with 2012. The annual increase was mainly due to: n food and beverages contributing 0,8 of a percentage point;n basic iron and steel, non-ferrous metal products and metal products and machinery contributing 0,5 of a percentage point; andn petroleum, chemical products, rubber and plastic products contributing 0,3 of a percentage point.
South Africa’s fifth democratic National and Provincial elec-tions take place on Wednesday, 7 May 2014. Here is a break-down of the Independent Elec-
toral Commission’s (IEC) voter registration numbers as at February 2014.
You can check your registration details:n Online, visit https://www.elections.org.za/content/For-voters/My-voter-registration-details/ n SMS your ID number to 32810 (R1/SMS)n Call 0800 11 8000 (Monday to Friday, 8am to 5pm). — Aneen Jordaan
IEC finalises voters’ roll Find us online ...
Total population 51,7 million (Census 2011)Number of eligible voters 31,4 million (Census 2011)Total number of registered voters 25,390 150 million Percentage of eligible voters registered 80,8%
Total new voters 2,3 millionPercentage of 18 and 19 year olds registered to vote 33,6%
Out of country registered voters 6,789Provincial registrationEastern Cape: 85,4%Western Cape: 78%Northern Cape: 84,4%North West: 78,7%Mpumalanga: 77,9%Limpopo: 81,2%KwaZulu-Natal: 83,9%Gauteng: 77,1%Free State: 86%
Transport gets us to work, to further our education or just a trip to get away from it all. The way in which we travel to our destination differs; it could be
by car, bus, taxi, train or plane. Travel affects our daily lives with various factors influenc-ing the ease or difficulty of travelling.
To gain insight into travel patterns in the country, the National Department of Trans-port, in partnership with Statistics South Africa (Stats SA), conducted the first National Household Travel Survey (NHTS) in 2003 to find out how and why people travel.
In 2013, the second NHTS was con-ducted across all provinces. Fieldworkers visited more than 50 000 homes to gather information from South Africans on their travel needs and travel behaviours across land, air and sea. The results were recently released, and here are some of the findings:
General travel patternsn Most people who went on trips during the reference period lived in Gauteng. Northern Cape residents undertook the least number of trips. n The number of people who took trips seven days before the survey increased from 75,9% in 2003 to 81,5% in 2013. n Of the 42,6 million people who took trips across all provinces, a quarter lived in Gaut-eng (25%), 18% in KwaZulu-Natal, and 12% in Eastern Cape.n When asked why they “do not travel”, 43,3% of respondents nationally indicated that they “do not need to travel”. Other rea-
sons for not travelling included being too old or too young to travel (22,7%), and that it was too expensive to travel (12,9%).
Education related travelThis relates to travel to education institu-tions such as schools, universities and lit-eracy classes.n Taxis (69,5%), buses (24,7%), and trains (5,8%) were most likely to be used as public transport by those who attended educational institutions. n Most learners who attended pre-school, school, adult basic education and training (ABET) and literacy classes, walked all the way to reach these educational institutions. n Taxis (14,8%) and driving cars/trucks
(private transport) (24,8%) were more likely to be used by learners who attended higher educational institutions such as universities. n The majority of learners (60,4%) were on the road (travelled) between 7:00 and 07:59 in the morning to their place of learning.n In the Western Cape and Eastern Cape, as many as 74% of learners travelled during this time slot.n In Limpopo, only 46,2% of learners trav-elled at this time. A significant number trav-elled before 06:30 (21,6%), and between 06:30 and 06:59 (27,2%).
Work related travelTravelling to usual place of work. n 38,8% of workers used public transport
as their main mode of travel to work. The same percentage used private transport. n About one in five workers (21,6%) reported walking all the way to work.n The number of workers who walked to work were highest in Northern Cape (42%) and Limpopo (33%).n 64,9% of rural workers leave for work before 7:00am as opposed to 58,2% in met-ropolitan areas, and 54,5% in urban areas.
Business tripsn Business trips are trips taken by people aged 15 years and older, as part of the exe-cution of their duties. Business trips can be day or overnight trip(s), and are defined as trips of 20km or more from the usual place of work.n Four out of 10 business travellers were from Gauteng (42,5%), 12% from Western Cape, and 11,9% from KwaZulu-Natal.n Most people travelled for business within their own provinces; however, when leaving their province of residence, they were most likely to travel to Gauteng.
Factors influencing the household’s choice in mode of transportn About 32,5% of households indicated that “travel time” was the biggest factor
in deciding on the mode of transport to be used. n The “cost of travel” was important to 26,2% of households. n “Flexibility” was mentioned by 9,2% of households and “safety from accidents” by 8,7%.
Transport problemsn Eastern Cape (19,6%), Free State (17,4%), Limpopo (13,7%) and North West (11,6%) had the highest complaints about the condition of roads. n Nationally, 16,3% of households iden-tified lack of buses as their main trans-port related problem, with the majority of complaints coming from those residing in Gauteng (20,5%), Western Cape (19,8%), KwaZulu-Natal (18,4%) and Eastern Cape (16,2%).n In Gauteng, about 61,6% of households indicated they were not satisfied with the distance between the train station and their home. n Nationally, 8,5% of households were dis-satisfied with the level of crowding in buses. n Overall, 6,9% considered reckless driving by taxi drivers as one of their most impor-tant transport related problems.
The information from this survey is used for transport policy-making and strategic planning at all levels of government. The results from the survey also assist transport authorities to effectively target where trans-port subsidies are needed. — Compiled by Aneen Jordaan
The dynamics of travel in SATourist accommodation
Manufacturing producion and
sales
Wholesale trade sales
Electricity generated & available for distribution
The reference period for this survey is seven days prior to the interview.
Previous and current editions of Fieldworker are available online on www.statssa.gov.za
Most South Africans use public transport for travel, and Stats SA provides the information that allows for planning of this essential service
What do you think of
The Fieldworker?
Email us: [email protected] by Aneen Jordaan

8 The Fieldworker, April/May 2014
Across: 2. The Master Sample is used to draw samples for which kind of surveys?6. As per the Victims of Crime Survey ........... occurs when there is no contact between the victim and perpetrator. 7. This type of public transport is most likely to be used by those who attend educational institutions.
9. This group, between the ages of 18 and 20 years old, make up 40% of the population, according to Census 2011 (two words).
Down: 1. The Domestic Tourism Survey aims to determine the travel behaviour and ..... ...... (two words) of South African residents travelling within the borders of the country. 2. Stats SA releases information on electricity generated and available for distribution. Over which time period is electricity produced? 3. This kind of equipment is the most common property lost during housebreaking and home robbery.4. The results of the latest National Household Travel Survey show that business travellers are most likely to travel to this province. 5. Which of Stats SA’s surveys conducted in 2011 is used to calculate the number of eligible voters in South Africa? 8. How many household surveys does Stats SA conduct continuously throughout the year?
Answers on page 7
Crossword
North WestTel: (018) 384 2878/9Fax: (018) 384 2832
GautengTel: (011) 781 3495
No fax
Northern CapeTel: (053) 802 6800Fax: (053) 832 5407
Western CapeTel: (021) 481 5500Fax: (021) 422 1741
Free StateTel: (051) 412 7500Fax: (051) 412 7507
KwaZulu-NatalTel: (031) 360 0600Fax (031) 305 9960
LimpopoTel: (015) 295 3300/1/3/4
Fax: (015) 295 3579
MpumalangaTel: (013) 754 0600Fax: (013) 755 2898
Eastern CapeTel: (043) 707 4907Fax: (043) 707 4906
Head OfficeTel: (012) 310 8911
Email: [email protected]
Stats SA provincial numbers
Test your knowledge1
What is the sample size of each of Stats SA’s
household surveys?a) Everyone in South Africa
b) About 33 000 dwelling unitsc) More than 63 000 dwelling
unitsd) Less than 93 000
dwelling units
8What is the biggest factor influencing a
household’s choice of which mode of transport
to use, when travelling, as reported in the recent National
Household Travel Survey?a) Cost
b) Safetyc) Flexibility
d) Travel time
2In the latest
National Household Travel Survey, 16,3% of
households identified lack of buses as their main transport
problem. In which province was this problem most common?
a) KwaZulu-Natalb) Mpumalanga
c) Gautengd) Limpopo
3According to Census
2011 figures, how many people are eligible to vote in the May 2014 national
elections? a) 31,4 millionb) 51,7 millionc) 25,3 milliond) 28,6 million
6When checking the
statistical accuracy of a survey, what should one
take into account?a) The type of questions asked
b) The sample size and representivityc) The period of the survey
d) If the survey was done over the internet
9According to the
Victims of Crime Survey which type of crime is
reported more? a) Theft of vehicleb) Home robbery c) Housebreaking
d) Theft from vehicle
4Master Sample listing
is under way across the country. What information
appears on the lister’s identity card?
a) Name and surname of the listerb) The lister’s identity numberc) Province where the lister is
assigned to workd) All of the above
7Which province, in 2011,
had the highest percentage of housebreakings according
to the Victims of Crime Survey?
a) Gautengb) Western Capec) KwaZulu-Natald) Eastern Cape
5Which business
survey, conducted by Stats SA, collects information
on physical quantities of manufactured products and value of stocks and sales?
a) Electricity generatedb) Wholesale trade
c) Manufacturing production and sales
d) Retail trade
10Census data show that
1996, 34,9% of Geelhout Park (Rustenburg) residents had a matric qualification.
What was the percentage in 2011?
a) 43,9%b) 37,1%c) 32,6%d) 35,7%
How much do you remember from reading this newspaper?
Answers on page 7
Statistical publications scheduleAll releases can be accessed on www.statssa.gov.za on the day of release
Statistical Release Release DateElectricity generated and available for distribution 03 April Manufacturing: Production and Sales 10 April Mining: Production and Sales 10 April Selected building statistics of the private sector as reported by local government institutions
16 April
Retail Trade Sales 16 April Statistics of civil cases of debt 17 April Wholesale Trade Sales 17 April Motor Trade Sales 17 April Tourist Accommodation 22 April Food and Beverages 22 April Land Transport Statistics 22 April March - Consumer Price Index (CPI) 23 April March - Producer Price Index (PPI) 24 April Export and import price indices 24 April Contract Price Adjustment Provisions (CPAP) – Work group Indices
24 April
Statistics on liquidations and insolvencies 29 April Tourism and Migration 29 April Domestic Tourism Survey (DTS) - 2013 29 April Electricity generated and available for distribution 30 April Quaterly Labour Force Survey (QLFS) – 1st Quarter 06 May Manufacturing: Production and Sales 08 May Manufacturing: utilisation of production capacity by large enterprises
08 May
Mining: Production and Sales 13 May Retail Trade Sales 14 May Motor Trade Sales 15 MayWholesale Trade Sales 15 May Tourist Accommodation 19 May Food and Beverages 19 May Land Transport Statistics 19 May April – Consumer Price Index (CPI) 21 May Statistics of civil cases of debt 22 May Selected building statistics of the private sector as reported by local government institutions
22 May
Statistics on liquidations and insolvencies 26 MayTourism and Migration 26 May1st Quarter - Gross Domestic Product (GDP) 27 May Survey of employers and the self-employed – 2013 27 May April - Producer Price Index (PPI) 29 May Export and import price indices 29 May Contract Price Adjustment Provisions (CPAP) – Work group Indices
29 May
General Household Survey (GHS) – 2013 29 May Selected development indicators – 2013 29 May
** Release dates are subject to change(s).