the organization of european multinationals
TRANSCRIPT

Sonderforschungsbereich/Transregio 15 � www.sfbtr15.de
Universität Mannheim � Freie Universität Berlin � Humboldt-Universität zu Berlin � Ludwig-Maximilians-Universität München
Rheinische Friedrich-Wilhelms-Universität Bonn � Zentrum für Europäische Wirtschaftsforschung Mannheim
Speaker: Prof. Dr. Urs Schweizer. � Department of Economics � University of Bonn � D-53113 Bonn,
Phone: +49(0228)739220 � Fax: +49(0228)739221
* University of Munich and BRUEGEL ** European Central Bank
November 2011
Financial support from the Deutsche Forschungsgemeinschaft through SFB/TR 15 is gratefully acknowledged.
Discussion Paper No. 367
The Organization of European
Multinationals
Dalia Marin * Linda Rousová **

The Organization of European Multinationals
Dalia Marin, University of Munich and BRUEGEL
Linda Rousová, European Central Bank*
September 2011
Abstract
Recent literature on international trade has established that the most
productive �rms become multinationals. But our data reveal a startling
variation in productivity levels of foreign a�liates across the countries in Eastern
Europe of the same European multinational parent �rms suggesting that not
all multinationals transplant their home productivity advantage to the new
EU Member States and Emerging Europe. One candidate for this startling
di�erence in productivity levels among foreign a�liates is the ability of European
multinationals to transport their business model abroad. This paper examines
the conditions under which European multinationals give autonomy to their
subsidiaries and delegate authority to them. We also analyse the conditions
under which European multinationals transplant their business model to Eastern
Europe. We collect original and unique matched parent and a�liate data on
the internal organization of 660 German and Austrian parent �rms and 2200
of their subsidiaries in Eastern Europe including the former Soviet Union. We
test the hypothesis that the ability of European multinationals to transplant their
business model to foreign a�liates is determined by the organization of European
multinationals on the one hand and the market environment their a�liate �rms
face in Eastern Europe on the other hand. We show that the business culture of
parent �rms accounts for about 50 percent of the variation of the organization of
subsidiaries, while the market environment of subsidiaries contributes the rest.
*This paper should not be reported as representing the views of the European Central Bank
(ECB). The views expressed are those of the authors and do not necessarily re�ect those of the ECB.
The paper was written during Linda Rousova's a�liation with the University of Munich.
1

1 Introduction
Recent literature on international trade has established that the most productive �rms
of a country tend to become multinationals.1 One reason is that more productive
�rms appear to be better able to cover the large �xed costs of entering a foreign
country. How much, however, of this productivity advantage of multinational �rms
is translated to the host countries in which these �rms invest? Marin (2004) �nds
that German multinationals increase the productivity level of their subsidiaries in
Central Eastern Europe (including Russia, Ukraine and other former Soviet Union
countries) to, on average, 60 percent of their parent �rms in Germany compared
with national �rms in Central Eastern Europe which produce 23 percent of the
productivity level of German �rms during the late 1990s. Austrian multinationals
in Eastern Europe reach 32 percent of the productivity level of parent �rms in
Austria. Similarly, Bloom, Sadun, and van Reenen (2007) �nd that US multinationals
are more productive than non-US multinationals and national �rms in the UK. They
attribute this to the better management practices and the more decentralized internal
organization of US �rms (see Bloom, Sadun, and van Reenen, 2009).
Figure 1, however, reveals a surprisingly wide variation in productivity levels of
German and Austrian subsidiaries in Eastern Europe relative to their parent �rms in
Germany and Austria, suggesting that the ability of multinational �rms to transplant
their home productivity advantage to other countries is by no means secure. The
startling di�erences in productivity levels by the same �rms across di�erent host
countries may be because of di�erences in the market and regulation environment that
multinationals face in host countries, or because of sectoral di�erences, or di�erences
in the ability of multinationals to transplant their business model to other countries.
If organizational capital is key to understanding �rms' productivity performance, as
suggested by Bloom, Sadun, and van Reenen (2007) and Marin and Verdier (2008a),
then the question arises as to what determines whether multinationals export their
business model to the countries they invest in.2
To answer this question we need detailed information on the internal organization
of multinational parents and their subsidiaries. Therefore, we analyze unique matched
data of 660 parent �rms in Austria and Germany with 2200 subsidiaries in Eastern
1See Helpman, Melitz, and Yeaple (2004); Antras and Helpman (2004).2Marin and Rousová (2009) indeed �nd that subsidiaries tend to be more productive when they
use the same business model as their parent �rms.
2

Figure 1: Productivity of Foreign A�liates in Host Countries
in Percentage of Parent Firms
02
04
06
08
01
00
Oth
er fo
rmer
Sov
iet U
nion
Baltic
sta
tes
Ukr
aine
Slova
kia
Rom
ania
Bulga
ria
Cze
ch R
epub
lic
Cro
atia
Polan
d
Rus
sia
Slove
nia
Hun
gary
Rom
ania
Slova
kia
Bulga
ria
Polan
d
Oth
er fo
rmer
Sov
iet U
nion
Ukr
aine
Cze
ch R
epub
lic
Slove
nia
Cro
atia
Baltic
sta
tes
Hun
gary
Rus
sia
Austrian Multinationals German Multinationals
Re
lative
Pro
du
ctivity
Notes: The �gures plot the productivity of foreign a�liates in host countries relative to Austrian and German parent �rms, respectively,in percentages. "Other former Soviet Union" refers to Azerbaijan, Armenia, Belarus, Georgia, Moldova, Kazakhstan, Tajikistan,Turkmenistan, and Uzbekistan; and "Baltic states" to Estonia, Latvia, and Lithuania. The aggregation achieves at least eight observationsper bar.
Europe including Russia, Ukraine and other former Soviet Union countries. We
designed and collected these data from a full population of �rms in Austria and
Germany investing in Eastern Europe in the years between 1990 and 2001. The sample
represents 80 percent of German foreign direct investment and 100 percent of Austrian
foreign direct investment in Eastern Europe between 1998 and 2000.
As a measure of internal organization of parent and subsidiary �rms we use the level
of decentralization of thirteen corporate decisions such as decisions on acquisitions,
new strategy, transfer prices or budget (see Table 14 in Appendix B for a full list of
corporate decisions for which we have information on the hierarchical level at which
these decisions are taken). Furthermore, we use two proxies for the transportation
of business culture of multinationals to their subsidiaries, one via taking the �rm
organization abroad and one via taking the CEO abroad. More speci�cally, we use
a similarity measure counting the number of corporate decisions which are taken at
the same hierarchical level in parent and subsidiary �rms and we use the information
whether or not parent �rms send one or more managers from the home country to run
the subsidiary.
3

Table 1 takes a �rst look at whether or not multinationals in Austria and Germany
transplant their organization to the host countries. Some 50 per cent of multinationals
do not transplant (the responsibility for �ve or more corporate decisions is allocated to
di�erent hierarchical levels in subsidiaries compared with parent �rms), 27 percent of
these �rms transplant partially (the allocation of power di�ers for two to four corporate
decisions between subsidiaries and parents) and 24 percent of �rms transplant fully (all
corporate decisions have the same allocation in subsidiaries as in parent �rms or the
allocation of one corporate decision di�ers).
Table 1: Transplantation via Organization
Subsidiaries with Parents' Organization All parent
Transplanted �rms
Not1 Partially1 Fully1
Centralized3 290 69 77 436
Decentralization 66.5 % 15.8% 17.7% 32.7%
ofCooperative3
260 212 132 604
Parent Firm2 43.0% 35.1% 21.9% 45.2%
Decentralized3 112 74 109 295
38.0 % 25.1% 36.9% 22.1%
All subsidiary �rms662 355 318 1335
49.6% 26.6% 23.8% 100%
Notes: The table reports absolute number of cases and row percentages, except for the column "All parent �rms", where columnpercentages are given. The Person's χ2 test rejects the null hypothesis that the transplantation of the business model is independent ofthe level of decentralization of parent �rms at any conventional signi�cance level (χ2(4) = 76.8, p-value = 0.000).1 The degree of transplantation via organization (full, partial and no transplantation) depends on the number of corporate decisions whichare taken at the same hierarchical level in parent and subsidiary �rms. For a listing of corporate decisions see Table 14 in Appendix B.The organization is fully transplanted if each corporate decision obtained the same hierarchical rank for the subsidiary �rm as for theparent �rm or if only one corporate decision di�ers. It is partially transplanted if two to four corporate decisions di�er in hierarchicalrank and the organization is not transplanted if �ve or more corporate decisions are di�erent.2 Mean of ranking between one (centralized) and �ve (decentralized) of several corporate decisions depending on whether the headquartersof the parent �rm (centralized) or the CEO (decentralized) takes the decision. The CEO is the subsidiary manager for decentralizationof subsidiary �rm or divisional manager for decentralization of parent �rm (see 12 in Appendix A for more details). For a listing ofcorporate decisions see Table 14 in Appendix B.3 A �rm is centralized when the level of decentralization is in the range of 1.0 to 2.5, it is cooperative in the range of 2.51 to 3.5 anddecentralized in the range of 3.51 to 5.
Furthermore, the table looks at whether the organizational mode of multinational
parent �rms signi�cantly a�ects their ability to transplant their organization to another
country. It appears that decentralized parent �rms transplant their organization
signi�cantly more often than centralized parent �rms. Some 37 percent of foreign
a�liates use the same business model as parent �rms when their parent �rms are
decentralized compared with 24 percent of subsidiaries for all parent �rms and 67
percent of subsidiaries use a di�erent business model from parent �rms when their
parent �rms are centralized compared with 50 percent of subsidiaries for all parent
�rms.
4
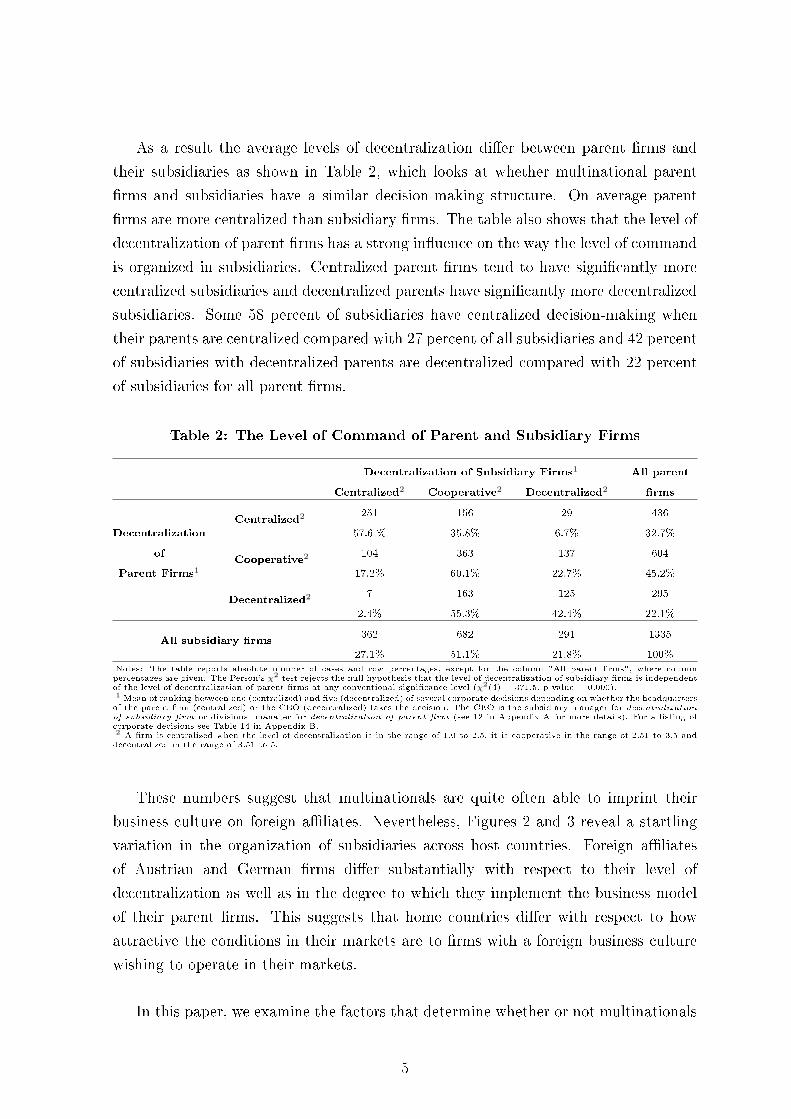
As a result the average levels of decentralization di�er between parent �rms and
their subsidiaries as shown in Table 2, which looks at whether multinational parent
�rms and subsidiaries have a similar decision-making structure. On average parent
�rms are more centralized than subsidiary �rms. The table also shows that the level of
decentralization of parent �rms has a strong in�uence on the way the level of command
is organized in subsidiaries. Centralized parent �rms tend to have signi�cantly more
centralized subsidiaries and decentralized parents have signi�cantly more decentralized
subsidiaries. Some 58 percent of subsidiaries have centralized decision-making when
their parents are centralized compared with 27 percent of all subsidiaries and 42 percent
of subsidiaries with decentralized parents are decentralized compared with 22 percent
of subsidiaries for all parent �rms.
Table 2: The Level of Command of Parent and Subsidiary Firms
Decentralization of Subsidiary Firms1 All parent
Centralized2 Cooperative2 Decentralized2 �rms
Centralized2 251 156 29 436
Decentralization 57.6 % 35.8% 6.7% 32.7%
ofCooperative2
104 363 137 604
Parent Firms1 17.2% 60.1% 22.7% 45.2%
Decentralized2 7 163 125 295
2.4% 55.3% 42.4% 22.1%
All subsidiary �rms362 682 291 1335
27.1% 51.1% 21.8% 100%
Notes: The table reports absolute number of cases and row percentages, except for the column "All parent �rms", where columnpercentages are given. The Person's χ2 test rejects the null hypothesis that the level of decentralization of subsidiary �rms is independentof the level of decentralization of parent �rms at any conventional signi�cance level (χ2(4) = 371.5, p-value = 0.000).1 Mean of ranking between one (centralized) and �ve (decentralized) of several corporate decisions depending on whether the headquartersof the parent �rm (centralized) or the CEO (decentralized) takes the decision. The CEO is the subsidiary manager for decentralizationof subsidiary �rm or divisional manager for decentralization of parent �rm (see 12 in Appendix A for more details). For a listing ofcorporate decisions see Table 14 in Appendix B.2 A �rm is centralized when the level of decentralization is in the range of 1.0 to 2.5, it is cooperative in the range of 2.51 to 3.5 anddecentralized in the range of 3.51 to 5.
These numbers suggest that multinationals are quite often able to imprint their
business culture on foreign a�liates. Nevertheless, Figures 2 and 3 reveal a startling
variation in the organization of subsidiaries across host countries. Foreign a�liates
of Austrian and German �rms di�er substantially with respect to their level of
decentralization as well as in the degree to which they implement the business model
of their parent �rms. This suggests that home countries di�er with respect to how
attractive the conditions in their markets are to �rms with a foreign business culture
wishing to operate in their markets.
In this paper, we examine the factors that determine whether or not multinationals
5

Figure 2: Level of Decentralization of Parent Firms and their A�liates
in Host Countries
2.6
2.8
33
.23
.4
Le
ve
l o
f D
ece
ntr
alis
atio
n
Austri
a
Oth
er fo
rmer
Sov
iet U
nion
Cze
ch R
epub
lic
Bulga
ria
Serbia
Ukr
aine
Slova
kia
Rus
sia
Slove
nia
Hun
gary
Ger
man
y
Rom
ania
Polan
d
Cro
atia
Lith
uania
Latvia
Bosnia
and
Her
zego
vina
Belar
us
Eston
ia
Notes: Level of decentralization is a mean of ranking between one (centralized) and �ve (decentralized) of several corporate decisionsdepending on whether the headquarters of the parent �rm (centralized) or the subsidiary manager (in host countries)/divisional manager(in Austria or Germany) (decentralized) takes the decision (see Table 12 in Appendix A for more details). For a listing of corporatedecisions see Table 14 in Appendix B. "Other former Soviet Union" refers to Azerbaijan, Armenia, Georgia, Moldova, Kazakhstan,Kyrgyzstan, Tajikistan, Turkmenistan, and Uzbekistan. The aggregation achieves at least eight observations per bar.
export their business culture to other countries. So far this has been little understood.
Previous research on organizations in international trade has focused on how �rms'
home productivity advantage determines the mode of organization �rms choose abroad
(Helpman, Melitz, and Yeaple, 2004; Antras and Helpman, 2004) and how a greater
exposure to international trade in�uences the business model �rms choose at home
(Marin and Verdier, 2004, 2007, 2008b). The research on the transportation of culture
across countries has so far not focused on �rm organization but rather on whether the
fertility rates of second-generation immigrants in the US re�ect the culture in the US or
that of their parents in their home country (Fernández and Fogli, 2009) or on parking
�ne behavior of diplomats (Fisman and Miguel, 2008).
More recently, empirical literature on �rm decentralization has emerged
with a focus on national �rms. The literature examines the trend of
decentralization of US �rms (Rajan and Wulf, 2006) and how information technology
(Acemoglu, Aghion, Lelarge, Reenen, and Zilibotti, 2007), international trade and
competition (Marin and Verdier, 2004, 2007; Guadalupe and Wulf, 2008), and trust
and hierarchical religion (Bloom, Sadun, and van Reenen, 2009) a�ect the level of
decentralization of �rms. The paper by Bloom, Sadun, and van Reenen (2009) is the
6
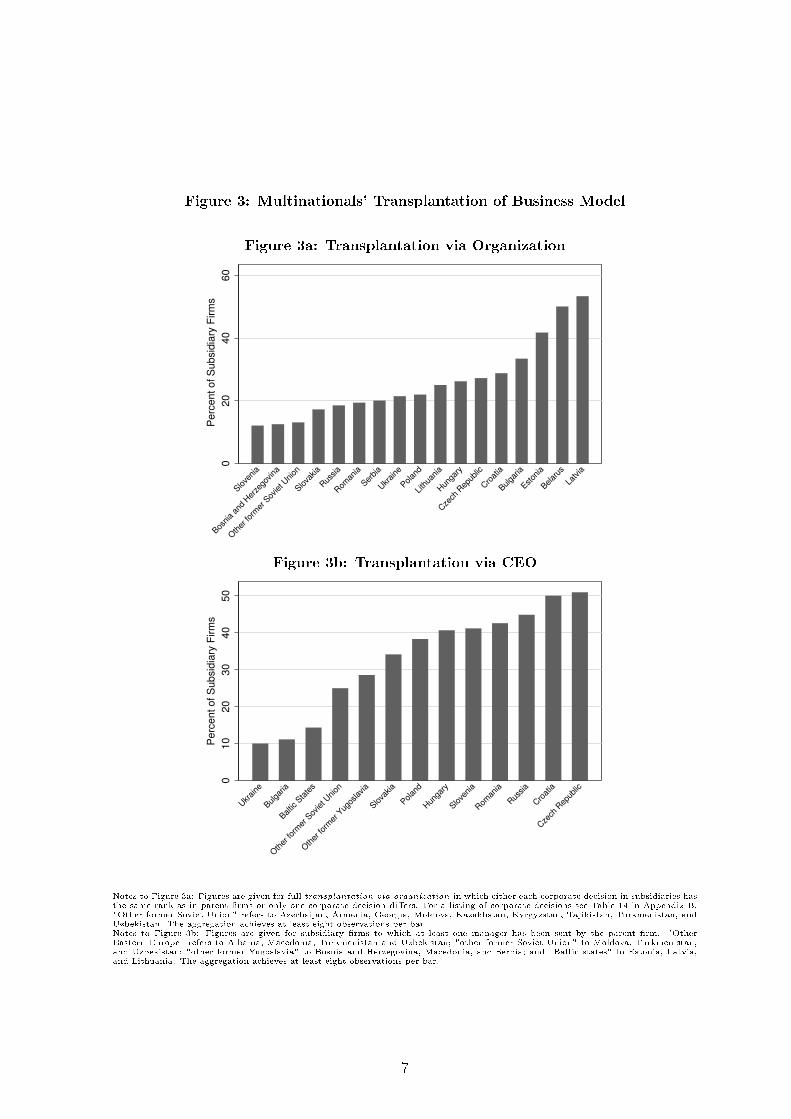
Figure 3: Multinationals' Transplantation of Business Model
Figure 3a: Transplantation via Organization
02
04
06
0
Pe
rce
nt
of
Su
bsid
iary
Firm
s
Slove
nia
Bosnia
and
Her
zego
vina
Oth
er fo
rmer
Sov
iet U
nion
Slova
kia
Rus
sia
Rom
ania
Serbia
Ukr
aine
Polan
d
Lith
uania
Hun
gary
Cze
ch R
epub
lic
Cro
atia
Bulga
ria
Eston
ia
Belar
us
Latvia
Figure 3b: Transplantation via CEO
01
02
03
04
05
0
Pe
rce
nt
of
Su
bsid
iary
Firm
s
Ukr
aine
Bulga
ria
Baltic
Sta
tes
Oth
er fo
rmer
Sov
iet U
nion
Oth
er fo
rmer
Yug
oslavia
Slova
kia
Polan
d
Hun
gary
Slove
nia
Rom
ania
Rus
sia
Cro
atia
Cze
ch R
epub
lic
Notes to Figure 3a: Figures are given for full transplantation via organization in which either each corporate decision in subsidiaries hasthe same rank as in parent �rms or only one corporate decision di�ers. For a listing of corporate decisions see Table 14 in Appendix B."Other former Soviet Union" refers to Azerbaijan, Armenia, Georgia, Moldova, Kazakhstan, Kyrgyzstan, Tajikistan, Turkmenistan, andUzbekistan. The aggregation achieves at least eight observations per bar.Notes to Figure 3b: Figures are given for subsidiary �rms to which at least one manager has been sent by the parent �rm. "OtherEastern Europe" refers to Albania, Macedonia, Turkmenistan and Uzbekistan; "other former Soviet Union" to Moldova, Turkmenistan,and Uzbekistan; "other former Yugoslavia" to Bosnia and Herzegovina, Macedonia, and Serbia; and "Baltic states" to Estonia, Latvia,and Lithuania. The aggregation achieves at least eight observations per bar.
7

closest to ours, since their �rm sample includes information on multinational �rms.
Their data on multinationals, however, do not include matched parent and foreign
a�liate information, which is what we use in this paper. Therefore, they are not
able to answer how the characteristics of parent �rms and their country of origin
are in�uencing the ability of multinational �rms to transport their business culture
abroad. Our matched parent and a�liate data sample allows us to quantify to what
extent a�liates' organizations re�ect the cultural traits of their parents and to what
extent they are a response to the market environment subsidiary �rms face in host
countries.
The rest of the paper is organized as follows. Section 2 introduces the various data
used. In particular, it describes how we measure organization of multinational �rms
and transplantation of their business culture to foreign a�liates. Section 3 examines the
determinants of these two measures and their estimated e�ects. Section 4 concludes.
2 Data
We collected survey data for 660 multinational corporations in Austria (200) and
Germany (460) with 2200 subsidiaries in Eastern Europe including the former Soviet
Union countries during the period 1990 to 2001. The survey questions refer typically
to the years 1998 and 1999, when the data represented 100 percent of Austrian and 80
percent of German direct investment in Eastern Europe. This dataset is unique, since
it includes matched information on the organization of 600 parent �rms in Austria and
Germany and 2200 of their subsidiaries in Eastern Europe.3 In particular, we have
information about the level of decentralization of parent �rms and their subsidiaries
which is measured by the level of decision-making within the corporation. This in turn
enables us to study when the business model of parent �rms is transplanted to their
subsidiaries.
3For a detailed overview of all variables and their descriptive statistics see Table 12 and 13,respectively, in Appendix A.
8

2.1 Measuring Organization
Measuring Decentralization
Our measure of decentralization of parent �rms is based on the survey question: "Who
decides on the following issues concerning your corporation: the headquarters or the
divisional manager?" The issues involve thirteen corporate decisions for Austrian and
German parent �rms, i.e. decisions on acquisitions, �nances, new strategy, wage
increase, R&D expenditure, budget, transfer and product prices, introducing a new
product, changing a supplier, hiring two and 20 new workers as well as a new secretary.
See also Table 14 in Appendix B for the listing of the decisions. Responses ranged
between one and �ve with one as a centralized decision, taken entirely at headquarters,
and 5 as a decentralized decision, taken at the divisional level. We use a simple mean
of the available ranking to measure the overall level of decentralization of the �rm and
call it the decentralization of parent �rm. A counterpart, decentralization of subsidiary
�rm, is obtained from answers to the question "Who decides on the following issues
concerning your corporation: the headquarters of the parent �rm or the manager of
the subsidiary �rm in the host country?"
Table 14 in Appendix B shows that the most centralized decision is the decision
on acquisitions with a mean ranking of 1.34 and 1.41 for parent and subsidiary �rms,
respectively, followed by the decision on a new strategy (with a respective mean ranking
of 1.90 and 1.88). Not surprisingly, the most decentralized decisions tend to be the
decision on hiring a secretary (mean ranking of 4.15 and 4.65) and the decision on
hiring two new workers, whereas the decision on R&D and the decision to introduce
a new product tend to be taken cooperatively between headquarters and subsidiary
managers in the host country (with a respective mean ranking of 2.58 and 2.80).
Measuring Transplantation
We use two indicators to proxy for the transplantation of the business model from
parent �rms to foreign a�liates. The �rst proxy is a dummy variable transplantation
via organization which indicates whether or not the organization of the parent �rm is
fully transplanted to the subsidiary. It takes a value of one if each individual corporate
9

decision has the same hierarchical rank or if one of the decisions di�ers in hierarchical
rank between parent and subsidiary �rms.
Table 15 in Appendix B looks at the similarity in the hierarchical levels of corporate
decisions in parent and subsidiary �rms. The hierarchical level ranges between one
(centralized) and �ve (decentralized) in subsidiaries and parent �rms for each of the
corporate decisions individually. When parent and subsidiaries allocate an individual
decision at the same hierarchical level, we consider the decision to be fully transplanted
to the subsidiary and the similarity index in Panel A becomes zero, otherwise it takes
values in the interval (-4,4). We obtain this measure by subtracting the hierarchical
level of the subsidiary �rm from that of the parent �rm.
Panel A gives a quantitative measure of transplantation by providing the percent-
ages of subsidiaries where a particular decision is taken at the same hierarchical level as
in parent �rms (= 0) and at di�erent hierarchical levels ( 6= 0). It shows that the most
centralized and the most decentralized corporate decisions tend to be transplanted most
often to foreign a�liates (compare Tables 14 and 15 in Appendix B). In 78 percent, 70
percent, and 64 percent of the a�liates the decision on acquisitions, hiring a secretary,
and hiring two new workers, respectively, are taken at the same hierarchical level in
foreign a�liates as in parent �rms. The least often transplanted decisions tend to be
in the middle of the corporate ladder such as the decision on �nances and R&D. Only
in about half of the a�liates are these two decisions at the same hierarchical level in
subsidiaries as in parent �rms.
Panel B gives a qualitative measure of transplantation by listing in addition which
corporate decisions in the subsidiary are more (> 0) or less decentralized (< 0) than
in the parent �rm. As can be seen from Panel B, when subsidiaries deviate in the
allocation of decision power from their parent �rms they tend to decentralize more than
their parent �rms. One exception is the decision on R&D which is more decentralized
in parent �rms than in subsidiary �rms. Of the 49 percent of foreign a�liates which
di�er in their allocation of decision power over R&D from their parent �rms, 30 percent
of subsidiaries are more centralized compared with parent �rms (< 0) and 19 percent
are more decentralized (> 0).
Finally, Panel C reports the degree of transplantation by listing the degree to which
the decisions in foreign a�liates deviate from their parent �rms. When a�liates di�er
in their decision-making from their parent �rms they do not choose a radical departure
10

from their parent �rms. Mostly, they tend to decentralize or to centralize by one or
two hierarchical levels more compared with their parent �rms.
As a second proxy for the transplantation of parent �rms' business model we use a
dummy variable transplantation via CEO. It takes a value of one if at least one manager
is sent from the parent �rm to the subsidiary in the host country. The idea here is that
parent �rms use their own managers to implement the corporation's business culture
in the subsidiary abroad. The dummy is constructed from the survey question "How
many of your managers from the parent �rm are sent to the subsidiary �rm?" In more
than 40 percent of foreign a�liates the parent �rm has sent at least one manager to
run the subsidiary and to transfer the organizational knowledge. This high frequency
of transplantation via CEO suggests that the two proxies for the transplantation of the
business model are complements rather than substitutes. We indeed �nd that the two
measures are weakly positively correlated (see Table 3).
Table 3: Multinationals' Transplantation of Business Model
Transplantation via CEO1 All subsidiary
= 0 = 1 �rms
= 0348 232 580
Transplantation 60.0% 40.0% 80.8%
via Organization2
= 173 65 138
52.9% 47.1% 19.2%
All subsidiary �rms421 297 718
58.6% 41.4% 100%
Notes: The table reports absolute number of cases and row percentages, except for the column "All subsidiary �rms", where columnpercentages are given. The Person's χ2 test rejects the null hypothesis that the transplantation via organization is independent oftransplantation via CEO at 15 percent signi�cance level (χ2(1) = 2.32, p-value = 0.13).1 A dummy that takes a value of one if at least one manager is sent from the parent �rm to the subsidiary and zero otherwise.2 A dummy that takes a value of one if the organization is fully transplanted from the parent �rm to its subsidiary and zero otherwise.The organization is fully transplanted if each corporate decision obtained the same rank for the subsidiary �rm as for the parent �rm orif only one corporate decision di�ers.
Other Organizational Information
Our sample provides additional information on the organizational structure of the
multinational corporation. We construct dummy variables to distinguish four di�erent
categories of the parent �rms' organization: when the parent �rm is a family �rm
(parent is a family �rm), a domestic multinational (parent is a domestic MNE ) or a
subsidiary of a larger foreign multinational enterprise (parent is a subsidiary of foreign
MNE ) or of a domestic multinational �rm (parent is a subsidiary of domestic MNE ).
11

In addition, a dummy parent is a subsidiary captures the two latter cases together
and takes a value of one if the parent �rm is a subsidiary of either a foreign or a
domestic multinational. Some 16 percent of parent �rms are family �rms, 36 percent
are domestic multinationals and 48 percent are a subsidiary of a domestic or foreign
multinational (see Table 13 in Appendix A for the descriptive statistics).
The survey includes further information on the organization of subsidiary �rms. The
variable horizontal investment is calculated as the share of output of the subsidiary �rm
which is sold at the local market. It ranges between 0 and 100 percent with a mean of 82
percent. Two indicators of how tightly foreign a�liates are linked to their parent �rms
are the variables parent �rms' ownership share in the subsidiary and the importance
of intra-�rm trade. Parent's ownership share measures the parent �rms' stakes in
the foreign venture with a mean ownership share of 86 percent. Hence, Austrian and
German �rms tend to have a high involvement in their subsidiaries in Eastern Europe.
The variable intra-�rm trade gives the share of imports from the subsidiary �rm to the
parent �rm in percentage of parent �rm's sales. On average, parent �rms import two
percent of sales from each of their subsidiary �rm in Eastern Europe either as input
or �nal goods. Furthermore, the variable distance between parent and subsidiary �rm
is a measure of cultural di�erences between the parent �rms and the host regions.
The further away the foreign a�liate from the headquarters �rm the more important
becomes the local knowledge and the less able is headquarters to monitor the subsidiary
�rm.
Finally, we have information on how innovative the technology is that the parent
�rm transfers to the subsidiary �rm. The innovativeness of the technology is captured
by a dummy technology is innovative which takes a value of one if the technology is
new, a dummy technology is established with value of one if the technology is relatively
established and a dummy technology is outdated refers to a fully established or even
outdated technology. The size of the multinational corporation is measured by the
number of employees as the size of parent �rm and the size of subsidiary �rm. Another
measure of size is the total number of a�liates in Eastern Europe which is recorded
for each parent �rm, though we put nine and more a�liates into one category to avoid
outliers.
12

2.2 Measuring Competition and Trade
We use several data sources to measure product market competition and exposure to
international trade. First we obtain from our survey data of 660 Austrian and German
multinationals with their 2200 foreign a�liates two subjective measures of competition
as perceived by parent and subsidiary �rms. They are dummy variables indicating
for each parent or subsidiary �rm whether the �rm faces many domestic competitors
and many world competitors rather than few competitors, respectively. Second, we use
the AMADEUS database from Bureau van Dijk (2005) to calculate the Lerner index
of competition based on a large number of �rms in the two home countries of the
headquarters of multinational �rms and in all host countries of their a�liates at the
three-digit ISIC industry level. The Lerner index is de�ned as (1 - average pro�ts/sales),
where the average is taken, �rst, across all �rms available in a three-digit industry in a
speci�c country and, second, over the years 1996 to 2000. Finally, we use trade and tari�
data from the WITS UN COMTRADE and TRAINS databases (World Bank, 2009) as
well as data on domestic production from the INDSTAT 4 (UNIDO, 2008) and STAN
(OECD, 2009) databases to proxy for the exposure to international trade of the sector
of parent and subsidiary �rms. From these types of data, we calculate the import share
(de�ned as total imports divided by domestic production), the export share (de�ned
as total exports divided by domestic production), and the average e�ective tari� rates
on imports. These variables are calculated for each country at the three-digit industry
level. If data at the three-digit industry level are missing, the two-digit level is used.
2.3 Social Capital in Host Countries
We consider additional characteristics of the subsidiaries' market environment. In
particular, the variable contract enforcement re�ects the perception by parent �rms
of ten possible risk factors that the subsidiary faces in host countries. The variable is
calculated as the mean of ranking between one and �ve with one as a very important
and �ve as an unimportant risk factor. The risk factors include the risk of pro�t
transfer, exchange rate volatility, expropriation, changes in taxes or tari�s, property
rights, macro-economic instability, political turnaround, corruption, crime and ma�a,
and f banking sector collapse.
Further characteristics of the market environment of host countries are captured by
the variables trust and hierarchical religion. Trust measures the proportion of people
13

who answer "Most people can be trusted" to the question: "Generally speaking, would
you say that most people can be trusted, or that you can't be too careful in dealing with
people?" Hierarchical religion captures the proportion of the population belonging to
a "hierarchical religion" such as Roman and Greek Catholic, Orthodox, Gregorian and
Armenian Apostolic Church, or Islam. Both sets of data come from the World Value
Survey undertaken by the WVS Organization (2009).
3 Empirical Speci�cation and Results
We are interested in two di�erent, though inter-linked questions: What favors
decentralization of the subsidiary �rm? What determines the transplantation of the
business model from the parent �rm to the subsidiary �rm? We start with the �rst
question.
3.1 What Favors Decentralization in Foreign A�liates of Multi-
nationals?
The Organization of the Multinational Corporation
We �rst look in Table 4 at the baseline model which examines how the organization of
the multinational corporation in�uences the level of decentralization of foreign a�liates
as measured by decentralization of subsidiary �rm. We start with the organization of
parent �rms. As can be seen from Table 4, subsidiary �rms are more decentralized when
their parent �rms are more decentralized, when parent �rms themselves are a subsidiary
of a domestic multinational (with parent is a family �rm as the omitted category)
and when parent �rms have more a�liates in other countries, though the e�ect is
nonlinear. Subsidiary �rms will, however, be more centralized when their parent �rms
are larger and located in Germany and when they are themselves a subsidiary of a
foreign multinational. The signi�cant and positive coe�cient of decentralization of
parent of 0.42 suggests that when parent �rms become more decentralized by one rank
(a 25 percent increase in the possible range of the level of decentralization) the level of
decentralization of subsidiary �rms increases by 10.5 percent. We obtain this number
by multiplying 1 (an increase of one rank) with the coe�cient of 0.42 resulting in an
14

increase of the level of decentralization in the subsidiary of 0.42, which is 10.5 percent
of the possible range of levels of decentralization of subsidiaries. Hence, the level of
decentralization of parent �rms is an economically important variable determining how
decentralized the subsidiary is.
The organization of subsidiary �rms also matters for the level of decentralization.
Subsidiaries tend to be more decentralized when they are a horizontal foreign
investment in which they sell mostly at the local market, when they are larger and
further away from headquarters. Subsidiaries are, however, more centralized when
they are more tightly linked to their parent �rms. This is the case when headquarters
has a larger ownership stake in subsidiaries and when the subsidiary is part of a global
supply chain (measured by the volume of intra-�rm trade) when it primarily provides
inputs and �nal goods to headquarters.
All estimated coe�cients are mostly signi�cant at conventional levels and robust
to the inclusion of host country and industry �xed e�ects. The inclusion of industry
�xed e�ects substantially contributes to the explanatory power of the regression in
columns (3) and (4) as the R2 increases from 0.28 to 0.46. The inclusion of host
country �xed e�ects appears less important (column (2)). We include both types of
�xed e�ects in the following analysis. The organizational variables together account
for about 50 percent of the variation in the level of decentralization of foreign a�liates
(column (9)) which leaves room for other variables to play a role.
Market Competition and International Trade
Next, we turn to the in�uence of the market environment in host countries on the
ability of foreign a�liates to decentralize. We start with the role of competition and
international trade in Table 5. In their theory of decentralization Marin and Verdier
(2004, 2007, 2008b) suggest that the level of competition and international trade needs
to reach a critical level before �rms start to decentralize. Firms trade o� the pro�t gain
from having control against the pro�t loss from losing the initiative of middle managers.
When competition becomes su�ciently strong the latter e�ect on pro�ts dominates and
�rms decentralize to empower middle managers. In contrast to the previous empirical
literature on the decentralization of national �rms (Marin and Verdier, 2007; Marin,
2008; Guadalupe and Wulf, 2008; Bloom, Sadun, and van Reenen, 2009) we �nd that
foreign a�liates of multinational corporations tend to centralize in response to more
15

Table 4: Level of Decentralization in Subsidiary Firms
The Basic Model
Dependent Variable Decentralization of Subsidiary Firm1
(1) (2) (3) (4) (5) (6) (7) (8) (9)
Decentralization of parent �rm1 0.42*** 0.40*** 0.43*** 0.42*** 0.43*** 0.42*** 0.42*** 0.41*** 0.41***
(0.00) (0.00) (0.00) (0.00) (0.00) (0.00) (0.00) (0.00) (0.00)
Parent is located in Germany -0.11*** -0.12*** -0.19*** -0.19*** -0.17*** -0.20*** -0.23*** -0.24*** -0.29***
(0.00) (0.00) (0.00) (0.00) (0.00) (0.00) (0.00) (0.00) (0.00)
Parent is a subsidiary of foreign MNE2 -0.049 -0.059 -0.12* -0.12* -0.16** -0.12* -0.13** -0.12* -0.13**
(0.37) (0.29) (0.07) (0.06) (0.02) (0.06) (0.05) (0.06) (0.04)
Parent is a subsidiary of domestic MNE2 0.10** 0.090* 0.13** 0.13** 0.043 0.13** 0.12** 0.14*** 0.14***
(0.04) (0.07) (0.01) (0.01) (0.42) (0.01) (0.02) (0.01) (0.01)
Parent is a domestic MNE2 -0.042 -0.046 -0.020 -0.0089 -0.036 -0.014 -0.019 -0.031 -0.045
(0.41) (0.37) (0.73) (0.87) (0.53) (0.80) (0.74) (0.58) (0.43)
Log (Size of parent �rm) -0.042*** -0.040*** -0.039*** -0.039*** -0.046*** -0.035*** -0.040*** -0.029** -0.027**
(0.00) (0.00) (0.00) (0.00) (0.00) (0.00) (0.00) (0.02) (0.03)
Log (Size of subsidiary �rm) 0.023* 0.033** 0.045*** 0.059*** 0.050*** 0.056*** 0.059*** 0.063*** 0.060***
(0.06) (0.02) (0.00) (0.00) (0.00) (0.00) (0.00) (0.00) (0.00)
Number of a�liates 0.11*** 0.11*** 0.098** 0.095** 0.11** 0.093** 0.099** 0.083* 0.088*
(0.00) (0.01) (0.03) (0.04) (0.02) (0.04) (0.03) (0.07) (0.06)
(Number of a�liates)2 -0.0093*** -0.0095*** -0.0090** -0.0091** -0.011*** -0.0088** -0.0094** -0.0082** -0.0084**
(0.00) (0.00) (0.02) (0.02) (0.01) (0.02) (0.02) (0.04) (0.03)
Intra-�rm trade -0.21
(0.43)
Parent's ownership share -0.23*** -0.18**
(0.00) (0.03)
Log (Distance) 0.068* 0.065*
(0.06) (0.08)
Horizontal investment 0.27*** 0.25***
(0.00) (0.01)
Country dummies NO YES NO YES YES YES YES YES YES
Industry dummies (3d) NO NO YES YES YES YES YES YES YES
Observations 1157 1157 1157 1157 1078 1154 1157 1111 1108
Adjusted R2 0.28 0.28 0.46 0.47 0.50 0.47 0.47 0.49 0.49
* signi�cant at 10%, ** signi�cant at 5%, ***signi�cant at 1%Notes: Coe�cients obtained by OLS with robust standard errors. P-values reported in parentheses. See Table 12 in Appendix A for the de�nition of variables.1 Mean of ranking between one (centralized) and �ve (decentralized) of several corporate decisions depending on whether the headquarters of the parent �rm (centralized) or the CEO (decentralized) takesthe decision. The CEO is the subsidiary manager for decentralization of subsidiary �rm or divisional manager for decentralization of parent �rm (see 12 in Appendix A for more details). For a listingof corporate decisions see Table 14 in Appendix B.2 Parent is a family �rm is the omitted category of parent �rm's organization.
16

competition in host countries. Column (1) shows that the level of decentralization of
subsidiaries declines with many domestic competitors rather than few competitors (the
omitted category). When subsidiaries face many domestic competitors rather than few
competitors they reduce the level of decentralization by a rank of 0.11 which is 2.75
percent.
One problem with the subjective �rm level measure of competition is that it may
su�er from reverse causality. More decentralized �rms may face less tough competition
(because they may empower their knowledge workers to bring new ideas to the �rm
resulting in higher quality of products) rather than that �rms facing less tough
competition decentralize more, as we postulate here. To prevent the possibility of
a single �rm in�uencing the market outcome we introduce a more exogenous measure
of competition at the sectoral level for the host country markets given by the Lerner
index. Column (2) reports the results and shows that the previous result in column
(1) is robust to the measure of competition as subsidiaries tend to centralize with an
increase in the Lerner index. An increase in the Lerner index in the a�liates' markets
by ten percent reduces the level of decentralization in a�liates by a rank of 0.14 which
is 3.5 percent.
A possible explanation for the contrasting results with the empirical literature on
national �rms is that subsidiaries in host countries of Eastern Europe (including the
former Soviet Union) may face less competition compared with �rms in developed
market economies and hence they do not reach the threshold level of competition
suggested by Marin and Verdier (2007) and they stay centralized. A comparison of
the Lerner index and the �rm level measure of domestic competition in Austria and
Germany with those in host countries (see Tables 13, 16 and 17 in Appendix C) reveals,
however, that competition does not seem to be weaker in host countries. It appears
then that the results are driven by the fact that the �rms in our data sample are
multinational rather than national �rms. Austrian and German multinationals relocate
activities to Eastern Europe and the former Soviet Union in order to exploit the lower
labor costs there. When competition intensi�es in host countries the level of costs
matters more for pro�ts and hence multinationals centralize foreign a�liates to avoid
the possibility that subsidiary managers choose activities which are more favorable to
them than to the pro�ts of the �rm. The pro�t gain from having control dominates
the pro�t loss from losing the initiative of subsidiary managers when multinationals
relocate activities to low-cost host countries to save labor costs.
17

Table 5: Level of Decentralization in Subsidiary Firms
The Role of Competition and Trade: OLS Estimates
Dependent Variable Decentralization of Subsidiary Firm1
(1) (2) (3) (4) (5) (6)
Decentralization of parent �rm1 0.41*** 0.40*** 0.41*** 0.35*** 0.35*** 0.35***
(0.00) (0.00) (0.00) (0.00) (0.00) (0.00)
Parent is located in Germany -0.32*** -0.30*** -0.31*** -0.47*** -0.47*** -0.34***
(0.00) (0.00) (0.00) (0.00) (0.00) (0.00)
Parent is a subsidiary of foreign MNE2 -0.20*** -0.10 -0.18*** 0.011 0.0100 -0.14
(0.00) (0.13) (0.01) (0.94) (0.94) (0.32)
Parent is a subsidiary of domestic MNE2 0.15*** 0.17*** 0.17*** 0.31*** 0.31*** 0.16
(0.01) (0.00) (0.00) (0.00) (0.00) (0.11)
Parent is a domestic MNE2 -0.065 0.010 -0.053 0.044 0.044 -0.12
(0.26) (0.86) (0.36) (0.70) (0.71) (0.28)
Log (Size of parent �rm) -0.023* -0.027* -0.029** 0.0070 0.0065 0.0014
(0.07) (0.05) (0.02) (0.84) (0.85) (0.97)
Log (Size of subsidiary �rm) 0.062*** 0.063*** 0.060*** 0.068** 0.069** 0.087***
(0.00) (0.00) (0.00) (0.04) (0.04) (0.00)
Number of a�liates 0.098** 0.11** 0.081* 0.30*** 0.30*** 0.23***
(0.04) (0.03) (0.08) (0.00) (0.00) (0.00)
(Number of a�liates)2 -0.0091** -0.011*** -0.0076* -0.029*** -0.028*** -0.023***
(0.02) (0.01) (0.05) (0.00) (0.00) (0.00)
Parent's ownership share -0.21** -0.16* -0.21** -0.24* -0.24* -0.29**
(0.01) (0.08) (0.01) (0.07) (0.06) (0.03)
Log (Distance) 0.043 0.076* 0.055 0.15** 0.15** 0.11
(0.26) (0.06) (0.14) (0.01) (0.01) (0.13)
Horizontal investment 0.25*** 0.26*** 0.26*** 0.11 0.11 0.11
(0.01) (0.01) (0.01) (0.44) (0.43) (0.45)
Many domestic competitors3 -0.11**
(0.01)
Subsidiary market Lerner -0.014**
(0.03)
Many world competitors3 0.089*
(0.09)
Import share -0.028*
(0.09)
Export share -0.032**
(0.02)
Tari�s -0.00098
(0.46)
Country dummies YES YES YES YES YES YES
Industry dummies (3d) YES YES YES YES YES YES
Observations 1090 960 1083 373 375 372
Adjusted R2 0.50 0.47 0.50 0.54 0.55 0.52
* signi�cant at 10%, ** signi�cant at 5%, ***signi�cant at 1%Notes: Coe�cients obtained by OLS with robust standard errors. P-values reported in parentheses. See Table 12 in Appendix A for thede�nition of variables.1 Mean of ranking between one (centralized) and �ve (decentralized) of several corporate decisions depending on whether the headquartersof the parent �rm (centralized) or the CEO (decentralized) takes the decision. The CEO is the subsidiary manager for decentralizationof subsidiary �rm or divisional manager for decentralization of parent �rm (see 12 in Appendix A for more details). For a listing ofcorporate decisions see Table 14 in Appendix B.2 Parent is a family �rm is the omitted category of parent �rm's organization.3 Many domestic competitors and many world competitors refer to subsidiary �rm's market.
18

Furthermore, we �nd that subsidiaries centralize their organization in response to
a greater exposure to international trade as measured by the import and export ratios
at the sectoral level given in columns (4) and (5). The e�ect of a change in the trade
ratios on the level of command in a�liates is, however, almost negligible. An increase
in the trade ratios in host countries by ten percentage points reduces the level of
decentralization in foreign a�liates by a rank of approximately 0.003 which is 0.08
percent. The negligible e�ect of the trade ratios on the level of decentralization of
a�liates is, however, not surprising. The average trade ratio of a sector hides the true
exposure to trade of individual �rms. As suggested by recent literature on trade and
�rm heterogeneity (see Melitz, 2003; Bernard, Jensen, Redding, and Schott, 2007) the
distribution of individual �rms' trade exposure in a sector is particularly skewed. Only
a small proportion of �rms in a sector engage in trade activities (the extensive margin
of trade) and produce a signi�cant share of their output for the world market (the
intensive margin of trade). Therefore, an increase in the trade ratio of the sector does
not expose the mass of subsidiary �rms in the sector to the critical level of international
competition as is suggested by Marin and Verdier (2007) and thus a�liate �rms do not
signi�cantly change the level of decentralization.
We introduce the �rm level measure of trade many world competitors which is
supposed to be better able to capture �rms' true exposure to trade. Interestingly,
we �nd that many world competitors is positively associated with the level of
decentralization of a�liates (column (3)). When subsidiaries are faced with many
foreign competitors rather than a few, they increase the level of decentralization by
a rank of 0.09 which is 2.25 percent. We interpret the contrasting results of the
two measures of trade as suggesting that a�liates with a large number of foreign
competitors reach the critical level of international competition and thus decentralize,
whereas an increase in the trade ratio of the sector does not expose a su�cient number
of �rms in the sector to this critical level of trade and thus they remain centralized.4
Note that the estimated coe�cients of the organizational variables do not change
with the inclusion of the di�erent measures of competition. The size of the estimated
coe�cients does, however, change with the inclusion of the trade ratios. This is,
nevertheless, a result of a substantial drop in the sample size owing to the unavailability
4When we aggregate the �rm level measure of trade many world competitors over all host countriesand compare it with the �rm level measure of trade for the two home countries Austria and Germany,we indeed �nd that host countries are on average much less exposed to international competition.About 30 percent of subsidiaries in host countries face many world competitors compared with 73percent of parent �rms in Austria and Germany. See Table 13 in Appendix A.
19
of data on trade shares for some of the Eastern European countries.
Surprisingly, the e�ective tari� rates on imports have no signi�cant e�ect on the
level of decentralization of foreign a�liates. A closer inspection of the data reveals,
however, that Eastern European countries tend to have higher tari�s on imports in
less productive sectors with lower pro�ts. Hence, import tari�s and pro�ts tend to be
negatively (rather than positively) correlated.
Endogeneity
We proceed next to address the problem of endogeneity associated with using the level
of decentralization of parent �rms as a determinant of the level of decentralization of
foreign a�liates. It could be argued that the level of decentralization of subsidiary
�rms may in�uence the level of command in parent �rms rather than the other way
around. Parent �rms' involvement in foreign a�liates may crowd out the CEO's ability
to monitor and control at headquarters. This trade-o� between monitoring at home and
abroad may then force parent �rms to decentralize. In this case we would underestimate
the true e�ect of the parents' level of decentralization on subsidiary �rms. We address
the potential endogeneity problem in Table 6.
We introduce the toughness of competition at the headquarters' �rms' markets
as an instrument for the level of decentralization of parent �rms. The relevance of
this instrument is motivated by the theory of decentralization of �rms suggested by
Marin and Verdier (2007). They argue that the level of decentralization of �rms will
be governed by the toughness of competition in the market and they indeed �nd
that the intensity of competition has a statistically signi�cant e�ect on the level of
decentralization of Austrian and German �rms. We measure the instrument toughness
of competition in headquarters' �rms' markets by the Lerner index and denote it
as parent market Lerner. The instrument can be considered as exogenous to the
decentralization of subsidiary �rms as it re�ects the competitive conditions in parent
�rms' markets rather than in subsidiaries' �rms' markets and the Lerner index for the
headquarters' �rms' markets is based on a large sample of �rms at the three-digit ISIC
level from the AMADEUS data. Therefore, we can safely exclude feedback e�ects from
the level of decentralization of subsidiaries on the intensity of competition in parent
�rms' markets.
20
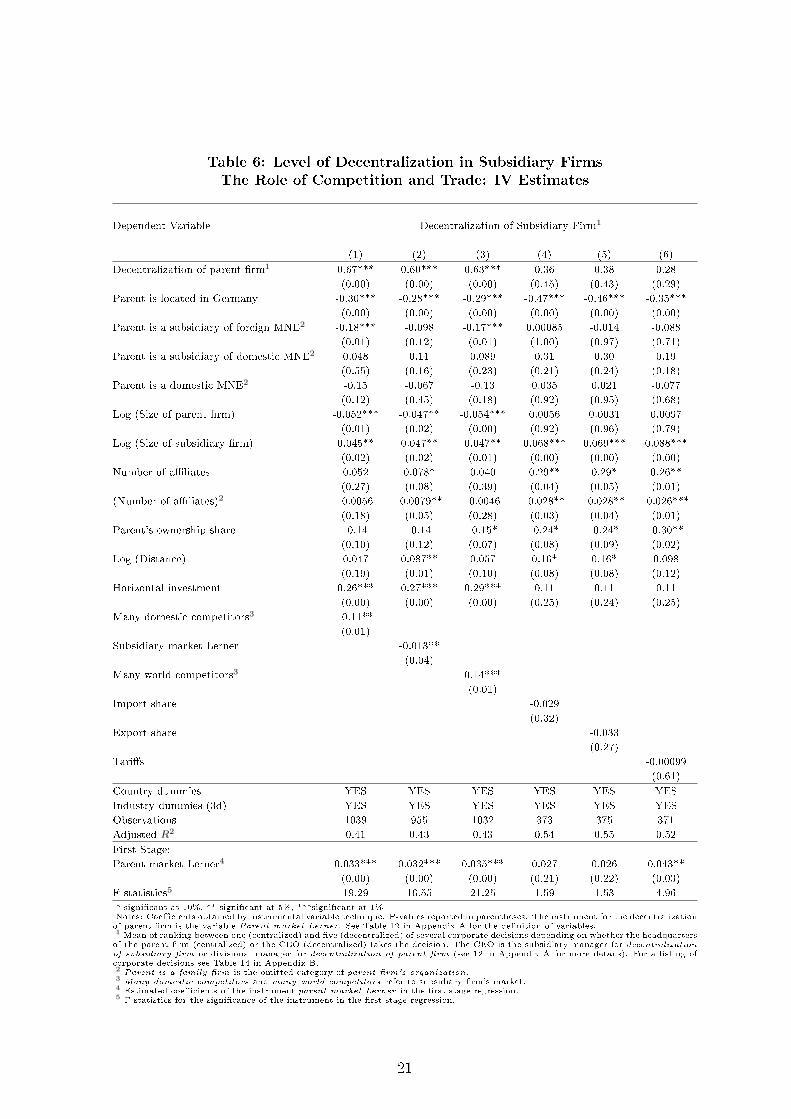
Table 6: Level of Decentralization in Subsidiary Firms
The Role of Competition and Trade: IV Estimates
Dependent Variable Decentralization of Subsidiary Firm1
(1) (2) (3) (4) (5) (6)
Decentralization of parent �rm1 0.67*** 0.60*** 0.63*** 0.36 0.38 0.28
(0.00) (0.00) (0.00) (0.45) (0.43) (0.29)
Parent is located in Germany -0.30*** -0.28*** -0.29*** -0.47*** -0.46*** -0.35***
(0.00) (0.00) (0.00) (0.00) (0.00) (0.00)
Parent is a subsidiary of foreign MNE2 -0.18*** -0.098 -0.17*** 0.00085 -0.014 -0.088
(0.01) (0.12) (0.01) (1.00) (0.97) (0.71)
Parent is a subsidiary of domestic MNE2 0.048 0.11 0.089 0.31 0.30 0.19
(0.55) (0.16) (0.23) (0.21) (0.24) (0.18)
Parent is a domestic MNE2 -0.15 -0.067 -0.13 0.035 0.021 -0.077
(0.12) (0.45) (0.18) (0.92) (0.95) (0.68)
Log (Size of parent �rm) -0.052*** -0.047** -0.054*** 0.0056 0.0031 0.0097
(0.01) (0.02) (0.00) (0.92) (0.96) (0.79)
Log (Size of subsidiary �rm) 0.045** 0.047** 0.047** 0.068*** 0.069*** 0.088***
(0.02) (0.02) (0.01) (0.00) (0.00) (0.00)
Number of a�liates 0.052 0.078* 0.040 0.29** 0.29* 0.26**
(0.27) (0.08) (0.39) (0.04) (0.05) (0.01)
(Number of a�liates)2 -0.0056 -0.0079** -0.0046 -0.028** -0.028** -0.026***
(0.18) (0.05) (0.28) (0.03) (0.04) (0.01)
Parent's ownership share -0.14 -0.14 -0.15* -0.24* -0.24* -0.30**
(0.10) (0.12) (0.07) (0.08) (0.09) (0.02)
Log (Distance) 0.047 0.087** 0.057 0.16* 0.16* 0.098
(0.19) (0.01) (0.10) (0.08) (0.08) (0.12)
Horizontal investment 0.26*** 0.27*** 0.29*** 0.11 0.11 0.11
(0.00) (0.00) (0.00) (0.25) (0.24) (0.25)
Many domestic competitors3 -0.11**
(0.01)
Subsidiary market Lerner -0.013**
(0.04)
Many world competitors3 0.14***
(0.01)
Import share -0.029
(0.32)
Export share -0.033
(0.27)
Tari�s -0.00099
(0.61)
Country dummies YES YES YES YES YES YES
Industry dummies (3d) YES YES YES YES YES YES
Observations 1039 955 1032 373 375 371
Adjusted R2 0.41 0.43 0.43 0.54 0.55 0.52
First Stage:
Parent market Lerner4 0.033*** 0.032*** 0.035*** 0.027 0.026 0.043**
(0.00) (0.00) (0.00) (0.21) (0.22) (0.03)
F-statistics5 19.29 16.55 21.25 1.59 1.53 4.96
* signi�cant at 10%, ** signi�cant at 5%, ***signi�cant at 1%Notes: Coe�cients obtained by instrumental variable technique. P-values reported in parentheses. The instrument for the decentralizationof parent �rm is the variable Parent market Lerner. See Table 12 in Appendix A for the de�nition of variables.1 Mean of ranking between one (centralized) and �ve (decentralized) of several corporate decisions depending on whether the headquartersof the parent �rm (centralized) or the CEO (decentralized) takes the decision. The CEO is the subsidiary manager for decentralizationof subsidiary �rm or divisional manager for decentralization of parent �rm (see 12 in Appendix A for more details). For a listing ofcorporate decisions see Table 14 in Appendix B.2 Parent is a family �rm is the omitted category of parent �rm's organization.3 Many domestic competitors and many world competitors refer to subsidiary �rm's market.4 Estimated coe�cients of the instrument parent market Lerner in the �rst stage regression.5 F-statistics for the signi�cance of the instrument in the �rst stage regression.
21

In Table 6 we indeed �nd that the level of competition in parent �rms' markets
is a relevant instrument as more competition is estimated to signi�cantly increase the
level of decentralization of parent �rms in the �rst stage regressions (columns (1) to
(3)). Moreover, the estimated e�ect of the parent �rms' decentralization on the level of
command in subsidiaries indeed turns out to be underestimated in the OLS regressions
as the estimated coe�cients increase now to over 0.6 compared with 0.4 before. In
the IV regressions in columns (1) to (3) some of the other organizational variables
now become insigni�cant or weakly signi�cant, whereas the �rm level measure of trade
many world competitors now has a much stronger e�ect on the level of decentralization
of subsidiaries. Turning to the results with the sectoral measures of trade in columns
(4) to (6), we �nd that the Lerner index of headquarters' �rms' markets is only a
weak instrument and the level of decentralization of parent �rms as well as the trade
ratios becomes insigni�cant. We do not, however, have the same con�dence in these
regressions since the sample size drops to one-third and the sectoral trade ratios are less
able to capture �rms' true exposure to trade. Still, the sign of the estimated coe�cients
remains the same as in the OLS regressions and thus the direction of the estimated
e�ects appears robust to the use of the alternative estimation technique.
Social Capital: Contract Enforcement, Trust, and Religion
Finally, we turn to other characteristics of the market environment which may have
helped foreign a�liates to decentralize. Bloom, Sadun, and van Reenen (2009) have
found that social capital as proxied by trust and the rule of law are positively associated
with the level of decentralization in 4000 �rms in the US, Europe, and Asia. We expect
these variables to play an even more important role in our data sample as our a�liates
are often located in countries with very weak legal institutions and low protection
of property rights. When contracts are not respected, trust and religion may become
critical mechanisms for obtaining cooperation between parent �rms and their subsidiary
managers. Figure 4 indeed shows for three groups of host countries that contracts and
trust appear to be substitutes as they are weakly negatively correlated.5 Therefore,
we include these measures of social capital in Table 7. We exclude the country �xed
e�ects in the regressions when trust and hierarchical religion are included, since both
are country-speci�c variables.
5See also Figures 5, 6, and 7 in Appendix C for the level of contract enforcement, trust, andhierarchical religion in host countries, respectively.
22

Table 7: Level of Decentralization in Subsidiary Firms
The Role of Contracts, Trust, and Religion
Dependent Variable Decentralization of Subsidiary Firm1
(1) (2) (3) (4) (5) (6)
OLS OLS OLS OLS IV IV
Decentralization of parent �rm1 0.41*** 0.41*** 0.41*** 0.41*** 0.57*** 0.56***
(0.00) (0.00) (0.00) (0.00) (0.00) (0.00)
Parent is located in Germany -0.28*** -0.28*** -0.27*** -0.28*** -0.27*** -0.27***
(0.00) (0.00) (0.00) (0.00) (0.00) (0.00)
Parent is a subsidiary of foreign MNE2 -0.058 -0.041 -0.042 -0.054 -0.064 -0.060
(0.41) (0.55) (0.54) (0.44) (0.31) (0.34)
Parent is a subsidiary of domestic MNE2 0.21*** 0.23*** 0.23*** 0.22*** 0.15* 0.16**
(0.00) (0.00) (0.00) (0.00) (0.05) (0.04)
Parent is a domestic MNE2 0.058 0.072 0.067 0.064 -0.028 -0.015
(0.36) (0.25) (0.29) (0.31) (0.76) (0.87)
Log (Size of parent �rm) -0.029** -0.027* -0.028** -0.028* -0.045** -0.042**
(0.04) (0.06) (0.05) (0.05) (0.01) (0.01)
Log (Size of subsidiary �rm) 0.067*** 0.059*** 0.059*** 0.062*** 0.054*** 0.051***
(0.00) (0.00) (0.00) (0.00) (0.00) (0.00)
Number of a�liates 0.12** 0.12*** 0.12*** 0.12** 0.091** 0.092**
(0.01) (0.01) (0.01) (0.01) (0.04) (0.04)
(Number of a�liates)2 -0.012*** -0.012*** -0.012*** -0.012*** -0.0092** -0.0092**
(0.00) (0.00) (0.00) (0.00) (0.02) (0.02)
Parent's ownership share -0.21** -0.22** -0.21** -0.21** -0.18** -0.19**
(0.03) (0.02) (0.03) (0.02) (0.04) (0.03)
Log (Distance) 0.069* 0.062** 0.050** 0.064** 0.082** 0.073***
(0.09) (0.01) (0.04) (0.01) (0.02) (0.00)
Horizontal investment 0.23** 0.23** 0.24** 0.24** 0.26*** 0.26***
(0.02) (0.02) (0.02) (0.02) (0.00) (0.00)
Subsidiary market Lerner -0.014** -0.015*** -0.011** -0.016*** -0.014** -0.015***
(0.02) (0.00) (0.02) (0.00) (0.03) (0.01)
Contract enforcement 0.10*** 0.095*** 0.092*** 0.10*** 0.13*** 0.13***
(0.00) (0.00) (0.00) (0.00) (0.00) (0.00)
Trust 0.55 1.56** 1.52**
(0.28) (0.01) (0.02)
Hierarchical religion 0.089 0.27** 0.26**
(0.30) (0.01) (0.02)
Country dummies YES NO NO NO YES NO
Industry dummies (3d) YES YES YES YES YES YES
Observations 946 946 946 946 941 941
Adjusted R2 0.48 0.48 0.48 0.48 0.45 0.46
First Stage:
Parent market Lerner3 0.040*** 0.041***
(0.00) (0.00)
F-statistics4 26.69 27.52
* signi�cant at 10%, ** signi�cant at 5%, ***signi�cant at 1%Notes: OLS estimates with robust standard errors in columns (1) to (4) and IV estimates in columns (5) and (6). P-values reported inparentheses. The instrument for the decentralization of parent �rm is the variable parent market Lerner. See Table 12 in Appendix Afor the de�nition of variables.1 Mean of ranking between one (centralized) and �ve (decentralized) of several corporate decisions depending on whether the headquartersof the parent �rm (centralized) or the CEO (decentralized) takes the decision. The CEO is the subsidiary manager for decentralizationof subsidiary �rm or divisional manager for decentralization of parent �rm (see 12 in Appendix A for more details). For a listing ofcorporate decisions see Table 14 in Appendix B.2 Parent is a family �rm is the omitted category of parent �rm's organization.3 Estimated coe�cients of the instrument parent market Lerner in the �rst stage regression.4 F-statistics for the signi�cance of the instrument in the �rst stage regression.
23

Figure 4: Social Capital in Host Regions
00
.20
.60
.40
.8S
ocia
l C
ap
ita
l
CEE and Baltics SEE Former Soviet Union
trust contract enforcement
hierarchical religion
Notes: CEE refers to Central Eastern European countries (Czech Republic, Hungary, Slovakia, Slovenia, Poland), Baltics to Balticcountries (Estonia, Latvia, Lithuania), SEE to South Eastern European countries (Albania, Bosnia and Herzegovina, Bulgaria, Croatia,Macedonia, Romania, Serbia), and Former Soviet Union includes Armenia, Azerbaijan, Belarus, Georgia, Kazakhstan, Kyrgyzstan,Moldova, Russia, Tajikistan, Turkmenistan, Ukraine, Uzbekistan. The level of contract enforcement is used as a mean of ranking betweenone (important) and �ve (not important) factors a�ecting contract enforcement divided by �ve to obtain a measure in the range zeroand one (for a listing of the factors see Table 12 in Appendix A). The level of hierarchical religion is the proportion of people that list ahierarchical religion (Roman Catholic, Greek Catholic, Orthodox, Islam, Gregorian or Armenian Apostolic Church) to the question: "Doyou belong to a religious denomination? If yes: Which one?" The level of trust is the proportion of people that answer "Most peoplecan be trusted" to the question: "Generally speaking, would you say that most people can be trusted or that you can't be too careful indealing with people?"
We �nd that multinationals tend to give subsidiary managers more autonomy when
they perceive that contracts are well enforced in host countries. An improvement in
contract enforcement by one rank in host countries (a 25 percent increase in the possible
range between one and �ve) induces a�liates to decentralize by a rank of 0.13 which
is 3.25 percent. In other words, multinational parent �rms in Austria and Germany
appear not to delegate responsibility in decision-making to their subsidiary managers
in host countries with weak legal institutions, because they may fear that subsidiary
managers will exploit the opportunity and misuse the �rms' assets under their control
when the likelihood of punishment by the legal system is low. Similarly, we �nd that
trust facilitates decentralization. A ten percentage point increase in the share of people
who trust others leads to an increase in the level of decentralization of 0.16 ranks
which is four percent. The estimated coe�cient of hierarchical religion contradicts the
�ndings of Bloom, Sadun, and van Reenen (2009). We �nd that a larger proportion of
the population in a country belonging to a hierarchical religion (believing in authority)
favors decentralization rather than centralization. One possible explanation is that non-
hierarchical religions such as the Protestant Christian church are not very prevalent
24
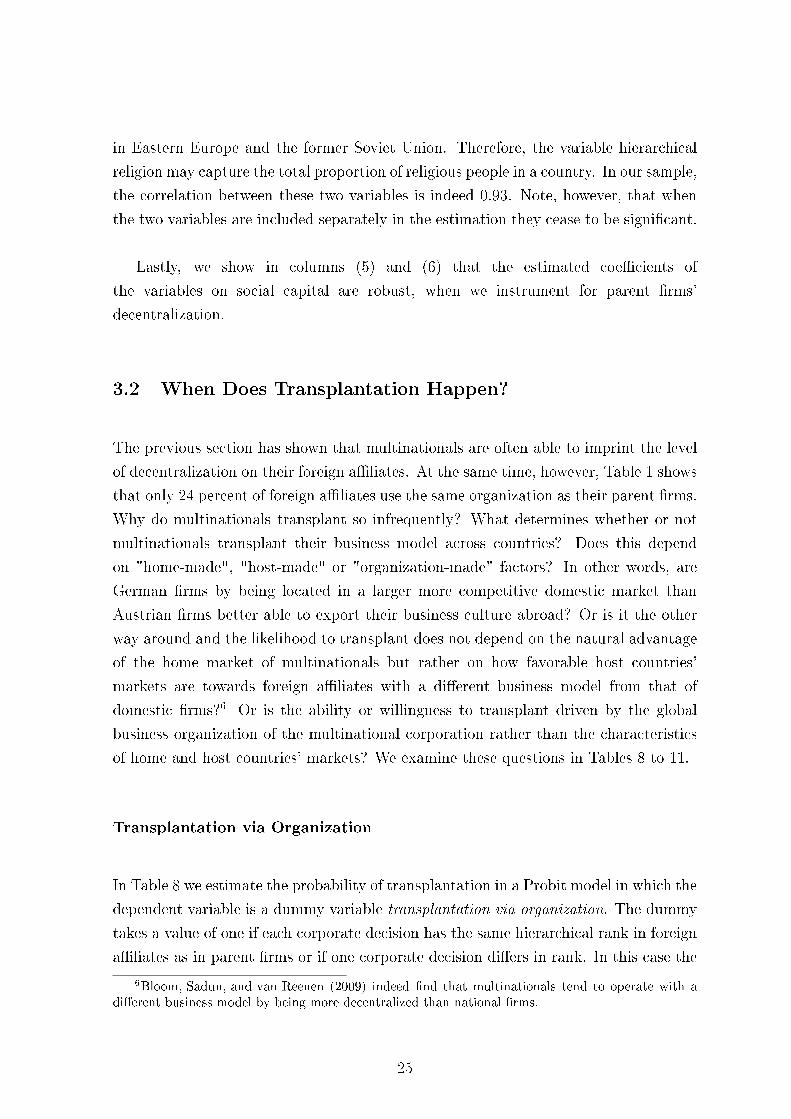
in Eastern Europe and the former Soviet Union. Therefore, the variable hierarchical
religion may capture the total proportion of religious people in a country. In our sample,
the correlation between these two variables is indeed 0.93. Note, however, that when
the two variables are included separately in the estimation they cease to be signi�cant.
Lastly, we show in columns (5) and (6) that the estimated coe�cients of
the variables on social capital are robust, when we instrument for parent �rms'
decentralization.
3.2 When Does Transplantation Happen?
The previous section has shown that multinationals are often able to imprint the level
of decentralization on their foreign a�liates. At the same time, however, Table 1 shows
that only 24 percent of foreign a�liates use the same organization as their parent �rms.
Why do multinationals transplant so infrequently? What determines whether or not
multinationals transplant their business model across countries? Does this depend
on "home-made", "host-made" or "organization-made" factors? In other words, are
German �rms by being located in a larger more competitive domestic market than
Austrian �rms better able to export their business culture abroad? Or is it the other
way around and the likelihood to transplant does not depend on the natural advantage
of the home market of multinationals but rather on how favorable host countries'
markets are towards foreign a�liates with a di�erent business model from that of
domestic �rms?6 Or is the ability or willingness to transplant driven by the global
business organization of the multinational corporation rather than the characteristics
of home and host countries' markets? We examine these questions in Tables 8 to 11.
Transplantation via Organization
In Table 8 we estimate the probability of transplantation in a Probit model in which the
dependent variable is a dummy variable transplantation via organization. The dummy
takes a value of one if each corporate decision has the same hierarchical rank in foreign
a�liates as in parent �rms or if one corporate decision di�ers in rank. In this case the
6Bloom, Sadun, and van Reenen (2009) indeed �nd that multinationals tend to operate with adi�erent business model by being more decentralized than national �rms.
25

organization is fully transplanted, otherwise (when more than one corporate decision
di�ers in hierarchical rank) we consider the organization as not transplanted.7
In column (1) we estimate the baseline model including all variables determining
the global business organization of the multinational corporation such as the level
of decentralization of parent and subsidiary �rms, parent is subsidiary, number of
a�liates, size of subsidiary, parent �rms' ownership share in the foreign a�liate and
distance. We �nd that multinationals are more likely to transplant their business model
to foreign a�liates in host countries when parent �rms are more decentralized, the
a�liates are larger and when multinationals have a larger number of a�liates (although
the e�ect is nonlinear). Multinationals are, however, less likely to transplant when
the a�liates are more decentralized and further away, when the parent �rm is itself a
subsidiary and when it has a larger stake in the subsidiary. The level of decentralization
of the parent �rm has an economically important e�ect on the likelihood to transplant.
When the level of decentralization increases by one rank (the parent �rm becomes more
decentralized by 25 percent) then the probability to transplant the business model to
the foreign a�liate increases by about 16 percentage points (for the partial e�ects of
Table 8 see Table 9).
One variable stands out by virtue of its importance in the likelihood to transplant
via organization, namely, the level of innovation of the technology transferred to foreign
a�liates. When the parent �rm transfers an innovative technology rather than a fully
established or even outdated technology (the omitted category) then the probability
to transplant the organization to subsidiary �rms is increased by 40 percentage points.
It appears that technology transfer and organizational transfer are complements and
go together.8
Taken together the "organization-made" factors appear to be most important for
the probability determining whether or not multinationals transplant their business
model to foreign a�liates.
The positive and signi�cant coe�cient of the home country dummy parent is located
in Germany rather than Austria does support the notion that "home-made" factors are
7As a robustness check we also use softer versions of full transplantation of organization with verysimilar results.
8This corresponds to evidence in Acemoglu, Aghion, Lelarge, Reenen, and Zilibotti (2007);Bloom, Sadun, and van Reenen (2007). Bloom, Sadun, and van Reenen �nd that US �rms do ITbetter than European �rms because they are more decentralized, giving more �exibility and power tothose workers that are implementing the technology.
26

Table 8: Transplantation via Organization
The Role of Competition, Contracts, and Religion
Dependent Variable Transplantation via Organization1
(1) (2) (3) (4) (5) (6)
Decentralization of parent �rm 0.75*** 0.74*** 0.79*** 0.69*** 0.79*** 0.73***
(0.00) (0.00) (0.00) (0.00) (0.00) (0.00)
Decentralization of subsidiary �rm -0.62*** -0.64*** -0.63*** -0.58*** -0.58*** -0.58***
(0.00) (0.00) (0.00) (0.00) (0.00) (0.00)
Parent is located in Germany 0.51*** 0.59*** 0.50*** 0.32* 0.66*** 0.20
(0.00) (0.00) (0.00) (0.09) (0.00) (0.26)
Parent is a subsidiary -0.24** -0.27** -0.37*** -0.39*** -0.40*** -0.33**
(0.04) (0.02) (0.00) (0.00) (0.00) (0.01)
Log (Size of subsidiary) 0.070* 0.085** 0.10** 0.10** 0.095** 0.077*
(0.08) (0.05) (0.02) (0.04) (0.04) (0.10)
Number of a�liates 0.56*** 0.60*** 0.62*** 0.57*** 0.68*** 0.58***
(0.00) (0.00) (0.00) (0.00) (0.00) (0.00)
(Number of a�liates)2 -0.044*** -0.048*** -0.051*** -0.046*** -0.057*** -0.047***
(0.00) (0.00) (0.00) (0.00) (0.00) (0.00)
Log (Distance) -0.23*** -0.35*** -0.36*** -0.33*** -0.40*** -0.21**
(0.00) (0.00) (0.01) (0.01) (0.00) (0.01)
Parent's ownership share -0.82*** -1.02*** -0.85*** -0.81*** -0.65** -0.76***
(0.00) (0.00) (0.00) (0.00) (0.01) (0.01)
Technology is established2 0.40*** 0.46*** 0.56*** 0.37** 0.46*** 0.38**
(0.01) (0.00) (0.00) (0.03) (0.01) (0.02)
Technology is innovative2 1.24*** 1.22*** 1.29*** 1.27*** 1.25*** 1.32***
(0.00) (0.00) (0.00) (0.00) (0.00) (0.00)
Many domestic competitors-subsidiary 0.72***
(0.00)
Many domestic competitors-parent -0.17
(0.30)
Subsidiary market Lerner 0.045* 0.039*
(0.09) (0.06)
Parent market Lerner 0.084*** 0.086***
(0.00) (0.00)
Many world competitors-subsidiary 0.43***
(0.01)
Many world competitors-parent -0.43***
(0.00)
Contract enforcement 0.059
(0.60)
Trust -0.87
(0.71)
Hierarchical religion -0.46
(0.25)
Country dummies NO YES YES YES YES NO
Industry dummies (2d) YES YES YES YES YES YES
Observations 933 920 887 794 865 785
Pseudo R2 0.29 0.32 0.35 0.36 0.35 0.35
* signi�cant at 10%, ** signi�cant at 5%, ***signi�cant at 1%Notes: Probit estimates with robust standard errors. P-values reported in parentheses. See Table 12 in Appendix A for the de�nition ofvariables.1 A dummy that takes a value of one if the organization is fully transplanted and zero otherwise. The organization is fully transplanted ifeach corporate decision obtained the same hierarchical rank for the parent �rm as for the subsidiary �rm or if only one corporate decisiondi�ers.2 Technology is outdated is the omitted category of technology.
27

Table 9: Transplantation via Organization
The Role of Competition, Contracts, and Religion: Marginal E�ects1
Dependent Variable Transplantation via Organization2
(1) (2) (3) (4) (5) (6)
Decentralization of parent �rm 16.5 16.1 14.6 14.4 15.4 15.0
Decentralization of subsidiary �rm -13.7 -13.9 -11.6 -12.1 -11.2 -12.3
Parent is located in Germany 13.7 14.9 10.9 7.3 15.7 6.8
Parent is a subsidiary -5.2 -5.8 -7.0 -8.1 -7.9 -7.6
Log (Size of subsidiary) 1.5 1.8 1.9 2.1 1.8 2.0
Number of a�liates 12.3 13.0 11.6 11.8 13.2 12.6
Number of a�liates2 -1.0 -1.0 -0.9 -1.0 -1.1 -1.0
Log (Distance) -5.0 -7.7 -6.6 -6.9 -7.7 -6.4
Parent's ownership share -18.1 -22.1 -15.7 -16.8 -12.6 -16.3
Technology is established3 8.5 9.6 9.7 7.3 8.4 7.9
Technology is innovative3 40.1 39.0 38.5 40.0 38.2 40.1
Many domestic competitors-subsidiary 13.6
Many domestic competitors-parent -3.1
Subsidiary market Lerner 0.9 1.0
Parent market Lerner 1.8 1.8
Many world competitors-subsidiary 9.4
Many world competitors-parent -9.3
Contract enforcement 0.8
Trust 0.0
Hierarchical religion 0.0
Country dummies NO YES YES YES YES NO
Industry dummies (2d) YES YES YES YES YES YES
Observations 933 920 887 794 865 785
Pseudo R2 0.29 0.32 0.35 0.36 0.35 0.351 Marginal e�ects at mean in percentage points for continuous variables and discrete changes from zero to one in percentage points fordummy variables based on Probit estimates with robust standard errors in Table 8. See Table 12 in Appendix A for the de�nition ofvariables.2 A dummy that takes a value of one if the organization is fully transplanted and zero otherwise. The organization is fully transplanted ifeach corporate decision obtained the same hierarchical rank for the parent �rm as for the subsidiary �rm or if only one corporate decisiondi�ers.3 Technology is outdated is the omitted category of technology.
also important for the likelihood to transplant. Multinational �rms located in Germany
rather than Austria are by some 15 percentage points more likely to transplant. This
e�ect acts beyond and above the fact that German parent �rms tend to be more
decentralized than Austrian parent �rms (which is already captured by the positive
coe�cient of decentralization of parent in the regression). Another important "home-
made" factor is the level of competition and the exposure to trade in the home markets
where headquarters' �rms are located. It appears that more domestic competition in
the parent �rms' market increases the likelihood that transplantation takes place (as
is suggested by parent market Lerner, but the �rm level measure of competition many
domestic competitors in the parent market is not signi�cant at conventional levels). An
28

increase of parent market Lerner by ten percentage points increases the probability to
transplant by eighteen percentage points. This e�ect of competition on the probability
to transplant is beyond and above the e�ect of decentralization of parent �rms on
the probability to transplant. This result indeed suggests that Germany is the more
favorable home market for transplantation.9 Furthermore, we �nd that when parent
�rms face many world competitors rather than a few they are less likely to transplant
by nine percentage points.
We turn now to the in�uence of "host-made" factors on the probability to transplant
the organization to subsidiary �rms in host countries. In column (2) of Table 8 we
include the host country dummies in the regression which increase the pseudo R2
from 0.29 to 0.32, suggesting that "host-made" factors do play a role in explaining the
probability to transplant. As in home countries, we expect the level of competition and
trade in host countries to be important for the ability of multinationals to transplant.
We indeed �nd this. The Lerner index and the �rm level measure of domestic
competition as well as world competition for the subsidiaries markets all indicate
that transplantation is more likely when competition is tougher and trade exposure
is stronger in host countries. An increase in the subsidiary market Lerner by ten
percentage points increases the likelihood to transplant by nine percentage points and
the probability to transplant is fourteen and nine percentage points, respectively, larger
when the subsidiary �rm faces many rather than few domestic and foreign competitors
(see columns (3) to (5) of Table 9).
Interestingly, contracts, trust, and hierarchical religion appear not to a�ect the
probability to transplant via organization (column (6)).
Transplantation via CEO
Alternatively to transplanting via organization, the multinational �rm may a�ect the
business culture of the subsidiary �rm by sending one or more managers from the
parent �rm to the host country to run the foreign a�liate. This seems to be a common
practice, since more than 40 percent of foreign a�liates are run by CEOs of parent
�rms (see Table 1). We examine the probability of sending at least one manager to the
foreign a�liate in Table 10 and 11.
9Marin and Verdier (2007) show that more intense competition in the parents' markets has ledparent �rms to decentralize their organization. This �nding is also in line with our �rst stage regressionresults in Table 6.
29

Table 10: Transplantation via CEO
The Role of Competition, Contracts, and Religion
Dependent Variable Transplantation via CEO1
(1) (2) (3) (4) (5) (6) (7) (8)
Decentralization of parent �rm 0.016 0.087 0.037 -0.085 0.012 0.0073 0.0045 0.0073(0.88) (0.41) (0.74) (0.42) (0.91) (0.95) (0.97) (0.95)
Decentralization of subsidiary �rm -0.34*** -0.44*** -0.40*** -0.22 -0.40*** -0.35** -0.34** -0.34**(0.01) (0.00) (0.00) (0.11) (0.01) (0.01) (0.02) (0.02)
Parent is located in Germany -1.08*** -1.29*** -0.95*** -0.98*** -1.41*** -1.44*** -1.48*** -1.50***(0.00) (0.00) (0.00) (0.00) (0.00) (0.00) (0.00) (0.00)
Log (Size of parent �rm) 0.20*** 0.24*** 0.15** 0.24*** 0.27*** 0.24*** 0.25*** 0.25***(0.00) (0.00) (0.02) (0.00) (0.00) (0.00) (0.00) (0.00)
Log (Size of subsidiary �rm) 0.11* 0.11** 0.14** 0.12** 0.075 0.091* 0.080 0.078(0.06) (0.05) (0.03) (0.05) (0.19) (0.08) (0.13) (0.13)
Number of a�liates -0.083*** -0.10*** -0.085** -0.11*** -0.10*** -0.12*** -0.12*** -0.12***(0.01) (0.00) (0.02) (0.00) (0.00) (0.00) (0.00) (0.00)
Technology is established2 0.25 0.17 0.36* 0.24 0.17 0.12 0.12 0.12(0.17) (0.35) (0.08) (0.19) (0.34) (0.50) (0.49) (0.51)
Technology is innovative2 0.67** 0.67** 0.80*** 0.71** 0.60** 0.66** 0.62** 0.60**(0.02) (0.01) (0.01) (0.01) (0.03) (0.02) (0.02) (0.03)
Many domestic competitors-subsidiary -0.60*** -0.61*** -0.48** -0.49** -0.49**(0.01) (0.01) (0.03) (0.03) (0.03)
Many domestic competitors-parent 0.48** 0.45** 0.42* 0.42* 0.43*(0.03) (0.04) (0.06) (0.06) (0.06)
Subsidiary market Lerner -0.049*(0.10)
Parent market Lerner 0.0095(0.74)
Many world competitors-subsidiary -0.40*(0.06)
Many world competitors-parent -0.39*(0.06)
Contract enforcement -0.46*** -0.28** -0.31** -0.32**(0.00) (0.02) (0.01) (0.01)
Trust 0.81 -1.33(0.56) (0.46)
Hierarchical religion -0.57* -0.76*(0.08) (0.07)
Country dummies YES YES YES YES YES NO NO NOIndustry dummies (3d) YES YES YES YES YES YES YES YESObservations 552 549 480 547 549 559 559 559Pseudo R2 0.24 0.26 0.23 0.26 0.27 0.24 0.25 0.25
* signi�cant at 10%, ** signi�cant at 5%, ***signi�cant at 1%Notes: Probit estimates with robust standard errors. P-values reported in parentheses. See Table 12 in Appendix A for the de�nition of variables.1 A dummy that takes a value of one if at least one manager is sent from the parent �rm to the subsidiary �rm and zero otherwise.2 Technology is outdated is the omitted category of technology.
30

Table 11: Transplantation via CEO
The Role of Competition, Contracts, and Religion: Marginal E�ects1
Dependent Variable Transplantation via CEO2
(1) (2) (3) (4) (5) (6) (7) (8)
Decentralization of parent �rm -13.1 -17.1 -15.1 -8.5 -15.2 -13.3 -12.9 -13.0
Decentralization of subsidiary �rm 0.6 3.3 1.4 -3.3 0.5 0.3 0.2 0.3
Parent is located in Germany -32.8 -36.1 -28.1 -30.5 -37.5 -38.1 -38.6 -38.9
Log (Size of parent) 7.6 9.3 5.7 9.1 10.4 9.2 9.6 9.6
Log (Size of subsidiary) 4.1 4.3 5.1 4.5 2.9 3.5 3.0 3.0
Number of a�liates -3.2 -3.9 -3.2 -4.3 -4.0 -4.6 -4.5 -4.5
Technology is established3 9.4 6.5 13.3 9.3 6.6 4.5 4.5 4.4
Technology is innovative3 26.2 26.3 31.0 27.8 23.5 25.8 24.2 23.5
Many domestic competitors-subsidiary -22.8 -22.9 -18.2 -18.5 -18.6
Many domestic competitors-parent 18.2 17.1 16.0 16.1 16.2
Subsidiary market Lerner -1.9
Parent market Lerner 0.4
Many world competitors-subsidiary -14.9
Many world competitors-parent -15.3
Contract enforcement -17.8 -10.8 -11.9 -12.3
Trust 30.8 -50.8
Hierarchical religion -21.6 -29.1
Country dummies YES YES YES YES YES NO NO NO
Industry dummies (3d) YES YES YES YES YES YES YES YES
Observations 552 549 480 547 549 559 559 559
Pseudo R2 0.24 0.26 0.23 0.26 0.27 0.24 0.25 0.251 Marginal e�ects at mean in percentage points for continuous variables and discrete changes from zero to one in percentage points for dummy variables based on Probit estimates with robust standarderrors in Table 10. See Table 12 in Appendix A for the de�nition of variables.2 A dummy that takes a value of one if at least one manager is sent from the parent �rm to the subsidiary �rm and zero otherwise.3 Technology is outdated is the omitted category of technology.
31

We run Probit regressions with the dependent variable transplantation via CEO
which takes a value of one if at least one manager is sent from the parent �rm to its
subsidiary �rm. Parent �rms are more likely to send their own managers to run the
a�liate �rm when the parent and subsidiary �rm is larger, when the parent �rm is
located in Austria rather than Germany, when the subsidiary �rm is centralized and
has little autonomy, when the multinational �rm does not have too many a�liates and
when the technology transferred to the foreign a�liate is innovative. Among these
determinants, being an Austrian multinational which transfers a new technology to
a foreign a�liate with little autonomy from the parent �rm maximizes the chances
that the multinational �rm will send one or more CEOs to its foreign a�liate (see
Table 11). As sending a manager is more likely when the subsidiary has little autonomy
from the parent �rm, the two ways of transplanting appear to be complements which
reinforce each other in helping the parent �rm to exert control over its subsidiary �rm.
In addition, it appears that Austrian multinationals are less likely to transplant via
organization but rather imprint their business culture on their subsidiaries by sending
CEOs.
We now turn to the in�uence of the market environment on the probability of
sending a CEO to the subsidiary given in columns (2) to (4) of Tables 10 and 11. We
start with the host countries' markets. More domestic competition in the subsidiary
�rms' markets (given by the subsidiary market Lerner and by the �rm level measure
many domestic competitors) as well as a stronger exposure to trade (measured by
many world competitors) makes it less likely that the parent �rms will send their own
managers to run the subsidiary. A possible explanation is that when the subsidiary
is faced with tough domestic and foreign competition, the local knowledge of the
market becomes more important and hence local rather than foreign CEOs tend to
be employed to run the subsidiary. Turning to the parent �rms' markets, we �nd
that more domestic competition favors engaging the parent �rm's CEO in the foreign
a�liate (at least according to the �rm level measure of domestic competition), whereas
a greater exposure to trade of the parent �rm tends to make it less likely that the
multinational will send its manager to the a�liate. A possible explanation for the
latter result is given by the model of Marin and Verdier (2004) and the evidence in
Marin (2009). With a greater exposure to trade in the parent �rms' market a "war
for manager talent" may be leading foreign �rms to compete with incumbent �rms for
manager talent, making the available managers in the parent �rms' market more scarce.
This trade-induced scarcity of managers in the parent �rms' market makes it less likely
that parent �rms will send additional managers to their a�liates in host countries.
32
The parent and subsidiary �rm's market conditions are economically important for the
probability of sending a CEO. Many world competitors at the parent market or many
domestic competitors at the subsidiary market rather than few make it less likely by
15 to 23 percentage points that a manager is sent to the a�liate.
Interestingly, although the social capital variables do not change the probability
to transplant the organization to the a�liate, they do a�ect the probability to send
a manager to the a�liate. In host countries with working legal institutions and
good contract enforcement it is less likely (and probably less important) that the
multinational �rm will send its own manager to control the subsidiary. A larger
proportion of the population in the host countries belonging to hierarchical religion
and thus believing in authority makes it also less likely that a parent �rm's manager
is employed in the subsidiary. One possible reason is that the belief in authority does
not extend to foreign managers. Another possible explanation is that in countries with
a larger proportion of religious people in the population it is less likely that workers
shirk their duty and hence it is less important to exert control.
4 Conclusions
In this paper we investigate with unique data on 660 headquarters' �rms in Austria
and Germany with their 2200 foreign a�liates in Eastern Europe including the former
Soviet Union countries the conditions under which foreign a�liates decentralize their
decision-making and implement the business model of their multinational parent �rms.
We �nd that one variable stands out in terms of importance for the level of
decentralization of subsidiary �rms, namely the level of decentralization of parent �rms.
We also identify other organizational variables as central in the decision to decentralize
the subsidiary such as the size of the multinational corporation and whether the
foreign a�liate is a horizontal rather than a vertical foreign direct investment. In
addition, the competitive and trading environments in host countries play a role
in the level of decentralization of subsidiaries. Interestingly, we �nd in contrast to
the available empirical literature on national �rms that multinational �rms centralize
their subsidiaries with more competition than national �rms. The trade exposure, in
turn, turns out to favor decentralization of the subsidiary. The e�ect of competition
on the level of decentralization of the subsidiaries is robust to di�erent measures of
33

competition. Moreover, the results remain unchanged when we deal with the possible
problem of endogeneity of the parent's �rm organization. We use the parent �rms' level
of competition in their home market as an instrument for their organization. Finally,
we somewhat con�rm the results of the importance of social capital for the level of
decentralization found in a previous paper on national �rms, namely, that trust and
contract enforcement tend to facilitate decentralization.
In contrast to the decision to decentralize, the decision to transplant the business
model to the foreign a�liate is more strongly a�ected by the market conditions
in both the home and host country, whereas trust, contracts and religion in host
countries appear to be less decisive. We examine two ways of transplanting the
multinational business model to the foreign a�liate, one via transplanting the
organization and one via transplanting the CEO. We �nd that tougher domestic and
foreign competition in the subsidiary markets favors transplantation via organization
but hinders transplantation via manager. Tougher domestic competition in the parent
market, however, favors both types of transplantation whereas foreign competition in
parent markets decreases the likelihood that multinationals transplant via organization
as well as via CEO. Transplantation of organization and of CEO appear to be weak
complements although German multinationals tend to go for transplanting via the
organization and Austrian multinationals for transplanting via the CEO.
34

Appendix A Data and Descriptives
Table 12: Description of Variables and Data Sources
Variable Description
1. Organization of the Multinational Corporation
Organization of the Parent Firm
Decentralization
of parent �rm
mean of ranking between one (centralized) and �ve (decentralized) of several
corporate decisions depending on whether the headquarters (centralized) or the
divisional manager of the parent �rm (decentralized) takes the decision; see
Table 14 for a listing of corporate decisions
Parent is located
in Germany
dummy that takes a value of one if the parent �rm is located in Germany and
zero otherwise
Parent �rm's organization categorical variable with four categories: parent is a family �rm, parent is a
subsidiary of a foreign MNE, parent is a subsidiary of domestic MNE and parent
is a domestic MNE; a more detailed description of the categories follows
→֒ Parent is a family �rm dummy that takes a value of one if the parent �rm is a family �rm (i.e.
independent �rm with subsidiaries only in Eastern Europe) and zero otherwise
→֒ Parent is a subsidiary
of foreign MNE
dummy that takes a value of one if the parent �rm is a subsidiary of foreign
multinational and zero otherwise
→֒ Parent is a subsidiary
of domestic MNE
dummy that takes a value of one if the parent �rm is a subsidiary of domestic
(Austrian/German) multinational and zero otherwise
→֒ Parent is
a domestic MNE
dummy that takes a value of one if the parent �rm is a domestic (Austrian/
German) multinational and zero otherwise
Parent is a subsidiary dummy that takes a value of one if the parent �rm is a subsidiary of a larger
(foreign or domestic) multinational and zero otherwise
Organization of the Subsidiary Firm
Decentralization
of subsidiary �rm
mean of ranking between one (centralized) and �ve (decentralized) of several
corporate decisions depending on whether the headquarters of the parent �rm
(centralized) or the subsidiary manager (decentralized) takes the decision; see
Table 14 for a listing of corporate decisions
Transplantation
via organization
dummy that takes a value of one if the organization is fully transplanted from the
parent �rm to its subsidiary and zero otherwise; full transplantation means that
either each corporate decision obtained the same hierarchical rank for the parent
�rm as for the subsidiary �rm or only one corporate decision di�ers
Continued on next page . . .
35

. . . continued from previous page
Variable Description
Transplantation via CEO dummy that takes a value of one if at least one manager is sent from the parent
�rm to the subsidiary and zero otherwise
Intra-�rm trade share of intra-�rm imports from the subsidiary �rm to the parent �rm in parent
sales
Parent's ownership share parent �rm's ownership share in the subsidiary �rm
Distance distance between the parent and the subsidiary �rm in km
Horizontal investment share of output sold by the subsidiary �rm at its domestic market
Technology categorical variable with three categories: technology is outdated, established,
and new; a more detailed description of the categories follows
→֒ Technology is outdated dummy that takes a value of one if the technology of the investment project is
fully established or outdated and zero otherwise
→֒ Technology is established dummy that takes a value of one if the technology of the investment project is
relatively established and zero otherwise
→֒ Technology is innovative dummy that takes a value of one if the technology of the investment project is
new and zero otherwise
Country dummies country dummies for the location of subsidiary �rm
Industry dummies (3d) three-digit industry dummies for the subsidiary �rm based on ISIC Rev. 3
Industry dummies (2d) two-digit industry dummies for the subsidiary �rm based on ISIC Rev. 3
2. Size of the Multinational Corporation
Size of parent �rm number of employees of parent �rm
Size of subsidiary �rm number of employees of subsidiary �rm
Number of a�liates number of a�liates in Eastern Europe of parent �rm; more than nine subsidiaries
are coded as nine subsidiaries
3. Market Environment
Competition
Many domestic competitors
→֒ subsidiary/parent
dummy that takes a value of one if the subsidiary/parent �rm has many
competitors at the domestic market and zero otherwise
Lerner
→֒ subsidiary/parent market
for a three-digit ISIC Rev. 3 industry j of country k:
Lernerjk =
1−1
Njk
∑
i∈jk
pro�t before taxesioperating revenuei
∗ 100%,
where Njk denotes the number of �rms i in industry j of country k; a simple
Continued on next page . . .
36
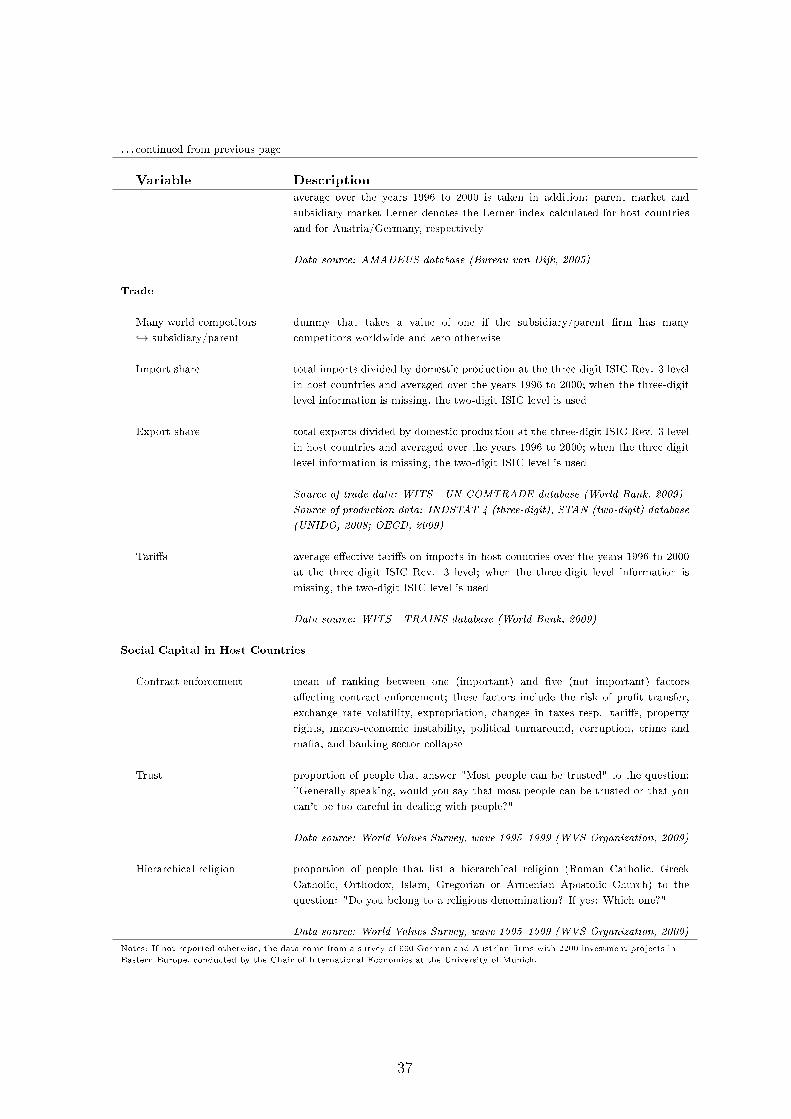
. . . continued from previous page
Variable Description
average over the years 1996 to 2000 is taken in addition; parent market and
subsidiary market Lerner denotes the Lerner index calculated for host countries
and for Austria/Germany, respectively
Data source: AMADEUS database (Bureau van Dijk, 2005)
Trade
Many world competitors
→֒ subsidiary/parent
dummy that takes a value of one if the subsidiary/parent �rm has many
competitors worldwide and zero otherwise
Import share total imports divided by domestic production at the three-digit ISIC Rev. 3 level
in host countries and averaged over the years 1996 to 2000; when the three-digit
level information is missing, the two-digit ISIC level is used
Export share total exports divided by domestic production at the three-digit ISIC Rev. 3 level
in host countries and averaged over the years 1996 to 2000; when the three-digit
level information is missing, the two-digit ISIC level is used
Source of trade data: WITS - UN COMTRADE database (World Bank, 2009)
Source of production data: INDSTAT 4 (three-digit), STAN (two-digit) database
(UNIDO, 2008; OECD, 2009)
Tari�s average e�ective tari�s on imports in host countries over the years 1996 to 2000
at the three-digit ISIC Rev. 3 level; when the three-digit level information is
missing, the two-digit ISIC level is used
Data source: WITS - TRAINS database (World Bank, 2009)
Social Capital in Host Countries
Contract enforcement mean of ranking between one (important) and �ve (not important) factors
a�ecting contract enforcement; these factors include the risk of pro�t transfer,
exchange rate volatility, expropriation, changes in taxes resp. tari�s, property
rights, macro-economic instability, political turnaround, corruption, crime and
ma�a, and banking sector collapse
Trust proportion of people that answer "Most people can be trusted" to the question:
"Generally speaking, would you say that most people can be trusted or that you
can't be too careful in dealing with people?"
Data source: World Values Survey, wave 1995�1999 (WVS Organization, 2009)
Hierarchical religion proportion of people that list a hierarchical religion (Roman Catholic, Greek
Catholic, Orthodox, Islam, Gregorian or Armenian Apostolic Church) to the
question: "Do you belong to a religious denomination? If yes: Which one?"
Data source: World Values Survey, wave 1995�1999 (WVS Organization, 2009)
Notes: If not reported otherwise, the data come from a survey of 660 German and Austrian �rms with 2200 investment projects in
Eastern Europe, conducted by the Chair of International Economics at the University of Munich.
37

Table 13: Descriptive Statistics
Variable Obs. Mean Min Max Std. Dev. Obs. with
dummy = 1
1. Organization of the Multinational Corporation
Organization of the Parent Firm
Decentralization of parent �rm 1472 2.81 1 5 0.84 .
Parent is located in Germany 2123 0.56 0 1 0.50 1186
Parent is a family �rm 2123 0.16 0 1 0.36 333
Parent is a subsidiary of foreign MNE 2123 0.18 0 1 0.38 372
Parent is a subsidiary of domestic MNE 2123 0.31 0 1 0.46 657
Parent is a domestic MNE 2123 0.36 0 1 0.35 761
Parent is a subsidiary 2123 0.48 0 1 0.50 1029
Organization of the Subsidiary Firm
Decentralization of subsidiary �rm 1388 2.95 1 5 0.69 .
Transplantation via organization 1335 0.24 0 1 0.43 318
Transplantation via CEO 751 0.41 0 1 0.49 306
Intra-�rm trade 1934 0.021 0 1 0.090 .
Parent's ownership share 2093 0.86 0 1 0.23 .
Distance 2122 903.04 17 6000 799.24 .
Horizontal investment 1981 0.82 0 1 0.36 .
Technology is outdated 1826 0.32 0 1 0.47 585
Technology is established 1826 0.60 0 1 0.49 1099
Technology is innovative 1826 0.08 0 1 0.27 142
2. Size of the Multinational Corporation
Size of parent �rm 1993 6970.20 1 233000 25233.78 .
Size of subsidiary �rm 1921 346.61 1 49000 1660.02 .
Number of a�liates 2123 5.41 1 9 3.01 .
3. Market Environment
Competition
Many domestic competitors-subsidiary 1978 0.46 0 1 0.50 900
Many domestic competitors-parent 2058 0.46 0 1 0.50 940
→֒ Austria 936 0.45 0 1 0.50 424
→֒ Germany 1122 0.46 0 1 0.50 516
Subsidiary market Lerner 1900 96.57 54.73 124.56 4.42 .
Parent market Lerner 2053 93.68 73.15 121.58 6.14 .
→֒ Austria 890 92.83 77.52 121.58 6.58 .
→֒ Germany 1163 94.32 73.15 119.61 5.69 .
Trade
Many world competitors-subsidiary 1938 0.29 0 1 0.45 563
Many world competitors-parent 2010 0.73 0 1 0.45 1463
→֒ Austria 934 0.72 0 1 0.45 675
→֒ Germany 1076 0.73 0 1 0.44 788
Import share 827 0. 67 0.0028 23.74 1.18 .
Export share 843 0.53 0.0039 25.17 1.07 .
Tari�s 875 10.17 0 246.08 19.37 .
Social Capital in Host Countries
Contract enforcement 2064 3.73 1 5 0.71 .
Trust 2101 0.23 0.082 0.52 0.045 .
Hierarchical religion 2100 0.68 0.17 0.98 0.21 .
38
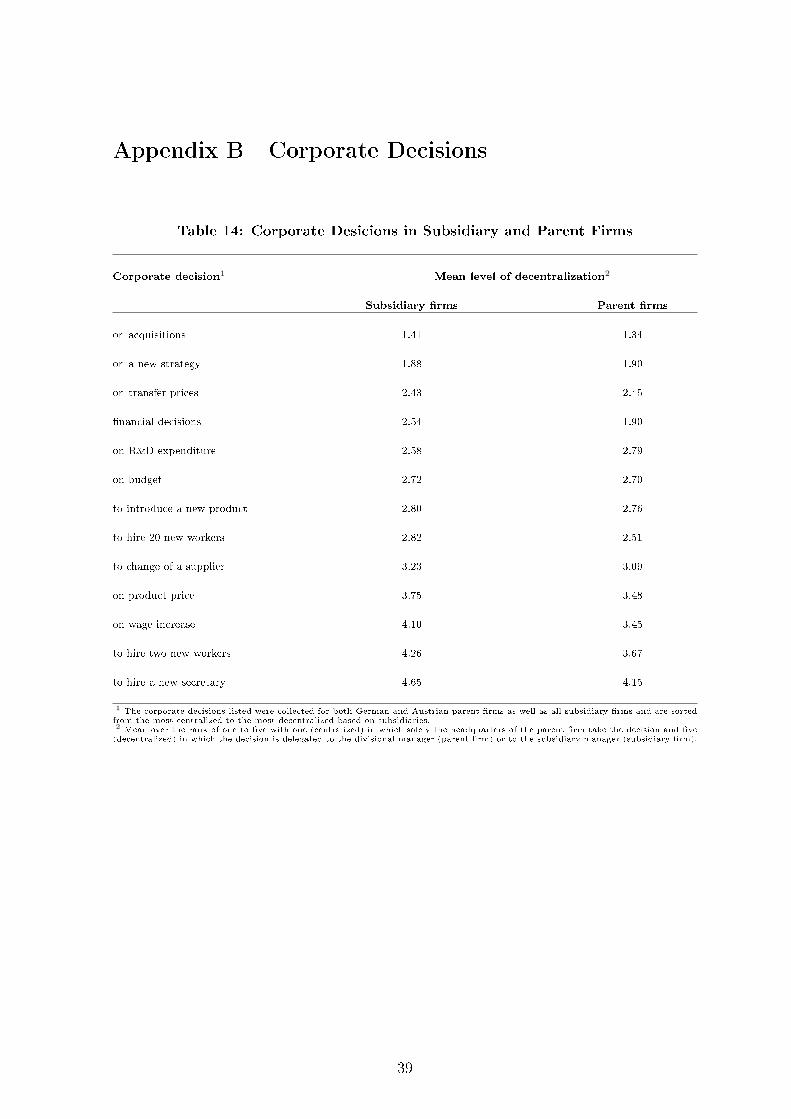
Appendix B Corporate Decisions
Table 14: Corporate Desicions in Subsidiary and Parent Firms
Corporate decision1 Mean level of decentralization2
Subsidiary �rms Parent �rms
on acquisitions 1.41 1.34
on a new strategy 1.88 1.90
on transfer prices 2.43 2.45
�nancial decisions 2.54 1.90
on R&D expenditure 2.58 2.79
on budget 2.72 2.70
to introduce a new product 2.80 2.76
to hire 20 new workers 2.82 2.51
to change of a supplier 3.23 3.09
on product price 3.75 3.48
on wage increase 4.10 3.45
to hire two new workers 4.26 3.67
to hire a new secretary 4.65 4.15
1 The corporate decisions listed were collected for both German and Austrian parent �rms as well as all subsidiary �rms and are sortedfrom the most centralized to the most decentralized based on subsidiaries.2 Mean over the rank of one to �ve with one (centralized) in which solely the headquarters of the parent �rm take the decision and �ve(decentralized) in which the decision is delegated to the divisional manager (parent �rm) or to the subsidiary manager (subsidiary �rm).
39

Table 15: Similarity of Corporate Decisions between Subsidiaries and Parent Firms
Panel A Panel B Panel C
Subsidiaries more more more more
with decision: same di�erent centralized decentralized centralized decentralized
Decision1 Similarity index2 Similarity index2 Similarity index2 =
on =0 6= 0 <0 >0 -4 -3 -2 -1 1 2 3 4
acquisitions1008 288 151 137 2 1 23 125 61 46 8 22
78% 22% 12% 11% 0% 0% 2% 10% 5% 4% 1% 2%
to hire a 897 387 90 297 9 0 34 47 80 53 48 116
new secretary 70% 30% 7% 23% 1% 0% 3% 4% 6% 4% 4% 9%
to hire two 820 468 77 391 1 2 11 63 123 136 55 77
new workers 64% 36% 6% 30% 0% 0% 1% 5% 10% 11% 4% 6%
to change 714 448 159 289 20 13 38 88 203 46 7 33
a supplier 61% 39% 14% 25% 2% 1% 3% 8% 17% 4% 1% 3%
on transfer 660 417 208 208 22 32 52 102 116 58 6 28
prices 61% 39% 19% 19% 2% 3% 5% 9% 11% 5% 1% 3%
on budget793 520 256 264 4 8 129 115 119 121 13 11
60% 40% 19% 20% 0% 1% 10% 9% 9% 9% 1% 1%
to hire 20 752 521 146 375 0 31 45 70 160 174 25 16
new workers 59% 41% 11% 29% 0% 2% 4% 5% 13% 14% 2% 1%
to introduce 661 532 266 266 16 35 69 146 108 110 20 28
a new product 55% 45% 22% 22% 1% 3% 6% 12% 9% 9% 2% 2%
on wage 699 574 137 437 12 12 53 60 115 134 59 129
increase 55% 45% 11% 34% 1% 1% 4% 5% 9% 11% 5% 10%
on product 659 570 212 358 17 44 66 85 125 134 42 57
price 54% 46% 17% 29% 1% 4% 5% 7% 10% 11% 3% 5%
on a new 702 588 298 290 6 12 112 168 173 106 5 6
strategy 54% 46% 23% 22% 0% 1% 9% 13% 13% 8% 0% 0%
�nancial 610 556 113 443 0 12 40 61 174 130 71 68
decisions 52% 48% 10% 38% 0% 1% 3% 5% 15% 11% 6% 6%
on R&D 235 230 141 89 11 16 61 53 30 40 14 5
expenditure 51% 49% 30% 19% 2% 3% 13% 11% 6% 9% 3% 1%
Notes: The table reports absolute number of subsidiary �rms and percent of subsidiary �rms.1 Corporate decisions are sorted from the most similar decisions in subsidiary �rms compared with parent �rms to the least similar decisions.2 The similarity index is computed as the hierarchical level at which the decision is taken in the subsidiary �rm minus the hierarchical level at which the decision is taken in the parent �rm. Since thepossible hierarchical levels are 1, 2, . . . , 5 for both the parent and the subsidiary �rm, the similarity index takes values in the interval (-4, 4).
40

Appendix C Market Environment in Host Countries
Figure 5: Level of Contract Enforcement in Host Countries
33
.54
Le
ve
l o
f C
on
tra
ct
En
forc
em
en
t
Rus
sia
Belar
us
Ukr
aine
Oth
er fo
rmer
Sov
iet U
nion
Rom
ania
Bosnia
and
Her
zego
vina
Bulga
ria
Cro
atia
Lith
uania
Slova
kia
Serbia
Cze
ch R
epub
lic
Polan
d
Hun
gary
Slove
nia
Eston
ia
Latvia
Notes: The level of contract enforcement is as a mean of ranking between one (important) and �ve (not important) factors a�ectingcontract enforcement; these factors include the risk of pro�t transfer, exchange rate volatility, expropriation, changes in taxes resp. tari�s,property rights, macro-economic instability, political turnaround, corruption, crime and ma�a, and banking sector collapse. "Other formerSoviet Union" refers to Armenia, Georgia, Kazakhstan, Kyrgyzstan, Moldova, Tajikistan, Turkmenistan and Uzbekistan. The aggregationachieves at least eight observations per bar.
41

Figure 6: Level of Trust in Host Countries
0.1
.2.3
Le
ve
l o
f T
rust
Mac
edon
ia
Slove
nia
Polan
d
Rom
ania
Geo
rgia
Azerb
aijan
Eston
ia
Lith
uania
Moldo
va
Hun
gary
Rus
sia
Belar
us
Armen
ia
Latvia
Cro
atia
Bosnia
and
Her
zego
vina
Alban
ia
Slova
kia
Cze
ch R
epub
lic
Bulga
ria
Serbia
Ukr
aine
Notes: The level of trust is the proportion of people that answer "Most people can be trusted" to the question: "Generally speaking,would you say that most people can be trusted or that you can't be too careful in dealing with people?"
Figure 7: Level of Hierarchical Religion in Host Countries
0.2
.4.6
.81
Le
ve
l o
f H
iera
rch
ica
l R
elig
ion
Eston
ia
Latvia
Cze
ch R
epub
lic
Rus
sia
Hun
gary
Bosnia
and
Her
zego
vina
Belar
us
Ukr
aine
Bulga
ria
Mac
edon
ia
Slove
nia
Slova
kia
Serbia
Lith
uania
Moldo
va
Armen
ia
Cro
atia
Geo
rgia
Azerb
aijan
Polan
d
Rom
ania
Alban
ia
Notes: The level of hierarchical religion is the proportion of people that list a hierarchical religion (Roman Catholic, Greek Catholic,Orthodox, Islam, Gregorian or Armenian Apostolic Church) to the question: "Do you belong to a religious denomination? If yes: Whichone?"
42

Table 16: Market Environment: Czech Republic and Hungary
ISIC Rev. 3 Classi�cation Czech Republic Hungary
ISIC Code and Name of Product1 Import Export Tari�s Lerner Import Export Tari�s Lerner
A Agriculture, hunting and forestry
1 Agriculture, hunting and related service activities 0.16 0.06 4.26 101.34 0.06 0.11 20.15 96.552 Forestry, logging and related service activities 0.01 0.03 1.02 100.62 0.10 0.26 8.36 98.14B Fishing
5 Fishing, operation of �sh hatcheries and �sh farms 0.00 0.02 0.71 98.42 0.06 0.29 13.24 99.38C Mining
10 Mining of coal and lignite; extraction of peat 0.04 0.24 0.85 99.63 0.80 0.01 3.89 98.1111 Extraction of crude petroleum and natural gas 1.10 0.01 0.00 93.07 14.76 0.00 0.69 95.1212 Mining of uranium and thorium ores 0.00 . . 108.21 . . . .13 Mining of metal ores . . . . 0.91 0.02 0.05 99.0314 Other mining and quarrying 23.74 25.17 0.37 96.63 0.42 0.07 2.43 88.03D Manufacturing
15 Manufacture of food products and beverages 0.14 0.10 11.14 100.11 0.11 0.26 37.99 96.6716 Manufacture of tobacco products 0.01 0.01 40.88 92.77 0.04 0.19 76.50 93.2317 Manufacture of textiles 0.40 0.44 5.27 102.39 1.20 0.55 7.26 96.8618 Manufacture of wearing apparel; dressing and dyeing of fur 0.19 0.31 5.14 100.28 0.26 0.80 10.05 90.2319 Tanning and dressing of leather 0.43 0.37 5.00 102.93 0.88 0.84 6.96 92.2820 Manufacture of wood and of products of wood and cork, except furniture 0.53 1.30 4.56 100.02 0.33 0.42 4.78 95.6221 Manufacture of paper and paper products 0.27 0.21 6.70 102.45 1.02 0.43 5.11 94.9722 Publishing, printing and reproduction of recorded media 0.28 0.26 4.06 99.05 0.14 0.06 4.76 93.8423 Manufacture of coke, re�ned petroleum products and nuclear fuel 0.04 0.03 2.43 97.62 0.14 0.16 1.89 95.1624 Manufacture of chemicals and chemical products 2.07 1.21 3.57 98.77 0.97 0.51 4.50 93.5025 Manufacture of rubber and plastics products 3.29 2.58 5.18 98.10 0.71 0.40 9.69 93.4026 Manufacture of other non-metallic mineral products 0.25 0.58 6.24 98.51 0.36 0.31 5.39 95.4227 Manufacture of basic metals 0.20 0.20 3.66 101.77 0.79 0.50 3.73 94.3828 Manufacture of fabricated metal products, except machinery and equipment 4.38 99.74 0.44 0.31 6.76 92.3729 Manufacture of machinery and equipment n.e.c. 0.28 0.29 3.92 99.86 1.30 0.65 6.37 93.2030 Manufacture of o�ce, accounting and computing machinery 0.17 0.06 3.64 97.56 0.63 0.98 5.07 92.6031 Manufacture of electrical machinery and apparatus n.e.c. 4.12 4.21 5.32 98.39 0.61 0.77 7.52 91.5832 Manufacture of radio, television and communication equipment and apparatus 0.52 0.28 4.44 95.86 0.99 0.74 8.04 92.5433 Manufacture of medical, precision and optical instruments, watches and clocks 0.63 0.27 4.66 97.58 1.03 0.49 6.42 92.3734 Manufacture of motor vehicles, trailers and semi-trailers 0.37 0.58 6.86 99.71 0.56 0.70 9.60 91.7135 Manufacture of other transport equipment 0.10 0.11 5.47 103.48 0.51 0.40 5.77 96.0936 Manufacture of furniture; manufacturing n.e.c. 0.25 0.53 7.09 97.94 0.73 0.95 6.61 95.81E Electricity, gas and water supply
40 Electricity, gas, steam and hot water supply 0.01 0.02 0.28 99.66 0.03 0.03 0.00 98.37
Notes: Import, Export and Lerner stand for import share, export share, and subsidiary market Lerner, respectively. See Table 12 in Appendix A for the de�nition of variables.1 For the exact name of product see http://unstats.un.org/unsd/cr/registry/regcst.asp?Cl=2.
43

Table 17: Market Environment: Poland and Slovak Republic
ISIC Rev. 3 Classi�cation Poland Slovak Republic
ISIC Code and Name of Product1 Import Export Tari�s Lerner Import Export Lerner
A Agriculture, hunting and forestry
1 Agriculture, hunting and related service activities 0.08 0.02 23.83 99.90 0.12 0.06 100.262 Forestry, logging and related service activities 0.04 0.04 32.85 93.47 0.04 0.15 97.57B Fishing
5 Fishing, operation of �sh hatcheries and �sh farms 0.13 0.09 9.20 94.35 1.40 0.51 .C Mining
10 Mining of coal and lignite; extraction of peat 0.02 0.19 2.61 105.58 2.49 0.00 101.0911 Extraction of crude petroleum and natural gas 56.82 0.14 0.09 92.73 9.90 0.02 .12 Mining of uranium and thorium ores . . . . . . .13 Mining of metal ores . . 0.53 92.04 5.00 0.25 .14 Other mining and quarrying . . 0.76 95.20 0.43 0.60 93.99D Manufacturing
15 Manufacture of food products and beverages 0.09 0.10 42.90 98.96 0.23 0.12 99.0516 Manufacture of tobacco products 0.01 0.04 246.07 99.61 0.59 0.28 .17 Manufacture of textiles 1.03 0.36 6.82 98.59 1.53 0.65 97.4218 Manufacture of wearing apparel; dressing and dyeing of fur 0.15 0.75 15.30 95.96 0.27 1.09 101.3419 Tanning and dressing of leather 0.49 0.39 8.98 95.19 0.57 0.78 102.0320 Manufacture of wood and of products of wood and cork, except furniture 0.09 0.27 4.53 96.46 0.19 0.49 100.6021 Manufacture of paper and paper products 0.63 0.30 3.22 99.91 0.39 0.64 96.6422 Publishing, printing and reproduction of recorded media 0.09 0.04 2.98 92.62 0.23 0.23 97.6323 Manufacture of coke, re�ned petroleum products and nuclear fuel 0.07 0.07 4.36 103.88 0.08 0.16 94.5224 Manufacture of chemicals and chemical products 0.83 0.27 4.60 93.38 1.06 0.81 102.1625 Manufacture of rubber and plastics products 0.45 0.20 4.49 94.78 0.73 0.63 99.2126 Manufacture of other non-metallic mineral products 0.21 0.15 4.05 94.82 0.26 0.45 96.6727 Manufacture of basic metals 0.34 0.40 6.75 101.71 0.25 0.58 101.6728 Manufacture of fabricated metal products, except machinery and equipment 0.30 0.29 5.59 95.97 0.42 0.38 99.3729 Manufacture of machinery and equipment n.e.c. 0.98 0.29 3.66 98.03 1.15 0.71 101.2430 Manufacture of o�ce, accounting and computing machinery 3.72 0.20 4.30 93.60 4.01 1.16 105.8931 Manufacture of electrical machinery and apparatus n.e.c. 0.56 0.46 3.78 95.73 0.82 0.70 102.4832 Manufacture of radio, television and communication equipment and apparatus 1.12 0.45 7.56 98.07 1.73 0.83 100.7233 Manufacture of medical, precision and optical instruments, watches and clocks 0.75 0.12 4.92 94.26 1.07 0.31 96.4334 Manufacture of motor vehicles, trailers and semi-trailers 0.68 0.36 8.41 97.50 0.85 1.16 96.4535 Manufacture of other transport equipment 0.22 0.49 4.55 102.62 0.56 0.75 97.8136 Manufacture of furniture; manufacturing n.e.c. 0.19 0.49 6.84 97.33 0.47 0.56 99.61E Electricity, gas and water supply
40 Electricity, gas, steam and hot water supply 0.00 0.01 2.27 97.99 0.02 0.01 97.65
Notes: Import, Export and Lerner stand for import share, export share, and subsidiary market Lerner, respectively. See Table 12 in Appendix A for the de�nition of variables.1 For the exact name of product see http://unstats.un.org/unsd/cr/registry/regcst.asp?Cl=2.2 Tari� data for the Slovak Republic are missing and therefore not reported.
44

References
Acemoglu, D., Aghion, P., Lelarge, C., Reenen, J. V., Zilibotti, F., 2007. Technology,
Information and the Decentralization of the Firm. Quarterly Journal of Economics
122 (4), 1759�1799.
Antras, P., Helpman, E., 2004. Global Sourcing. Journal of Political Economy 112 (3),
552�580.
Bernard, A. B., Jensen, J. B., Redding, S. J., Schott, P. K., 2007. Firms in International
Trade. Journal of Economic Perspectives 21 (3), 105�130.
Bloom, N., Sadun, R., van Reenen, J., 2009. The Organization of Firms across
Countries. CEP Discussion Papers dp0937, Centre for Economic Performance,
London School of Economics, London.
Bloom, N., Sadun, R., van Reenen, J. M., 2007. Americans Do I.T. Better: US
Multinationals and the Productivity Miracle. NBER Working Paper Series w13085,
National Bureau of Economic Research, Cambridge, MA.
Bureau van Dijk, 2005. AMADEUS database. Available at http://www.bvdep.com/
en/Amadeus.html.
Fernández, R., Fogli, A., 2009. Culture: An Empirical Investigation of Beliefs, Work,
and Fertility. American Economic Journal: Macroeconomics 1 (1), 146�177.
Fisman, R., Miguel, E., 2008. Corruption, Norms, and Legal Enforcement: Evidence
from Diplomatic Parking Tickets. Journal of Political Economy 115 (6), 1020�-1048.
Guadalupe, M., Wulf, J., 2008. The Flattening Firm and Product Market Competition:
The E�ect of Trade Liberalization. NBER Working Papers 14491, National Bureau
of Economic Research, Cambridge, MA.
Helpman, E., Melitz, M. J., Yeaple, S. R., 2004. Export versus FDI with Heterogeneous
Firms. American Economic Review 94 (1), 300�316.
Marin, D., 2004. A Nation of Poets and Thinkers: Less so with Eastern Enlargement?
Austria and Germany. CEPR Discussion Paper 4358, Centre for Economic Policy
Research, London.
Marin, D., 2008. The New Corporation in Europe. Bruegel Policy Brief, Bruegel,
Brussels.
45

Marin, D., 2009. The Battle for Talent: Globalization and the Rise of Executive Pay.
Working Paper 2009/01, Bruegel, Brussels.
Marin, D., Rousová, L., 2009. The Transfer of Productivity to Eastern Europe: The
Role of Organization. Mimeo, University of Munich, Munich.
Marin, D., Verdier, T., 2004. Globalization and the Empowerment of Talent. Discussion
Papers 1, SFB/TR 15 Governance and the E�ciency of Economic Systems,
University of Munich, Munich.
Marin, D., Verdier, T., 2007. Corporate Hierarchies and the Size of Nations: Theory
and Evidence. Working Papers 07�14, New York University, Leonard N. Stern School
of Business, Department of Economics, New York.
Marin, D., Verdier, T., 2008a. Competing in Organizations: Firm Heterogeneity
and International Trade. In: Helpman, E., Marin, D., Verdier, T. (Eds.), The
Organization of Firms in a Global Economy. Harvard University Press, pp. 142�172.
Marin, D., Verdier, T., 2008b. Power Inside the Firm and the Market: A General
Equilibrium Approach. Journal of the European Economic Association 6 (4), 752�
788.
Melitz, M. J., 2003. The Impact of Trade on Intra-Industry Reallocations and
Aggregate Industry Productivity. Econometrica 71 (6), 1695�1725.
OECD, 2009. Structural Analysis Database (STAN). Available at www.oecd.org/sti/
stan.
Rajan, R. G., Wulf, J., 2006. The Flattening Firm: Evidence from Panel Data an
the Changing Nature of Corporate Hierarchies. Review of Economics and Statistics
88 (4), 759�773.
UNIDO, 2008. Industrial Statistics Database (INDSTAT 4, Revision 3). Available at
http://www.unido.org/index.php?id=o3533.
World Bank, 2009. World Integrated Trade Solution (WITS). Available at http://
wits.worldbank.org.
WVS Organization, 2009. World Value Survey 1995, Waves 1995�1999. Available at
http://www.worldvaluessurvey.org.
46