the optimisation of the enzyme linked immunosorbant assay...
TRANSCRIPT

1 of 82
THE OPTIMISATION OF THE ENZYME LINKED IMMUNOSORBANT
ASSAY (ELISA) FOR THYROID PEROXIDASE AUTOANTIBODIES (TPO)
AUTOANTIBODIES (aAbs)
By
STUART COOK
A thesis submitted to the University of Birmingham for the degree of MASTER OF RESEARCH
School of Chemistry College of Engineering the Physical Sciences
University of Birmingham October 2009

University of Birmingham Research Archive
e-theses repository This unpublished thesis/dissertation is copyright of the author and/or third parties. The intellectual property rights of the author or third parties in respect of this work are as defined by The Copyright Designs and Patents Act 1988 or as modified by any successor legislation. Any use made of information contained in this thesis/dissertation must be in accordance with that legislation and must be properly acknowledged. Further distribution or reproduction in any format is prohibited without the permission of the copyright holder.

2 of 82
The Optimisation of the Enzyme Linked Immunosorbant Assay (ELISA) for
Thyroid Peroxidase (TPO) Autoantibodies (aAbs)
Contents
Chapter 1
1. Introduction
1.1 Autoimmune Diseases of the Thyroid and Thyroid Peroxidase
1.2 The History of Enzyme-Linked Immunosorbant Assays
1.3 ELISA as a Tool for the Quantification of TPO aAbs in Human Sera
1.4 Problems with TPO as an Analyte
1.5 TPO, the Current State of Research
1.6 Indirect ELISA Process
1.7 The Drawbacks of TPO ELISA
1.8 Objectives of Study
Chapter 2
2. Experimental
2.1 Basic Method for Production of TPO Indirect ELISA Plates
2.1.1 Method for Coating TPO ELISA Wells
2.1.2 Method for Blocking TPO ELISA Wells
2.2 Basic ELISA Test Procedure
2.2.1 Assay Preparation
2.2.2 Basic ELISA Assay Method

3 of 82
2.3 Methods for Modifications made to the TPO ELISA and Assays run to Assess
TPO ELISA
2.3.1 Variation of Sodium Deoxycholate Concentration
2.3.2 Modification of Coating buffer from trizma-buffered saline to
sodium carbonate
2.3.3 Variation of Bound Antigen Concentration
2.3.4 Modification of Sample Diluent from trizma buffered saline to
phosphate buffered saline
2.3.5 Examination of Antibody Concentrates from Varying Patients
2.3.6 Variation of Conjugate Antibody Dilution
2.3.7 Variation of Antigen Batch and Concentration (with Variation of
Conjugate antibody Concentration)
2.3.8 Production and Testing of Mimic Plates
2.3.9 Analysis and Comparison of Competitors Plate
2.3.10 Method for Assessment of TPO ELISA In-House Standards
2.3.11 Method for Assessment of TPO ELISA Antibody concentrates
2.3.12 Analysis of National Institute for Biological Standards and Control
(NIBSC) Reference
2.3.13 Method for Fixing Antibody Calibrators Against NIBSC Reference
2.4 Materials

4 of 82
Chapter 3
3. Results and Discussion: Objective 1
3.1 The Effect of Coating Conditions
3.1.1 The Effect of NaDC Concentration in the Coating buffer
3.1.2 The Effect of TPO Concentration in the Coating buffer
3.2 The Effect of Varying Assay Method
3.2.1 The Effect of Different Antibody Calibrator Diluents Used during
the Assay Process
3.2.2 The Effect of Modifying the Concentration of Conjugate Antibody
Chapter 4
4. Results and Discussion: Objective 2
4.1 Results pertaining to the performance of TPO ELISA In-House Standards
4.2 Results pertaining to the performance of Antibody concentrates
4.3 Results pertaining to the use of NIBSC Reference in fixing Calibration
Chapter 5
5. Conclusions
6. References

5 of 82
Chapter 1
1. Introduction
1.1 Autoimmune Diseases of the Thyroid and Thyroid Peroxidase
Autoimmune diseases of the thyroid gland affect between 2-4% of women and 1% of
men worldwide1-4. They are generally characterized by hyperthyroidism (Graves disease)
or hypothyroidism (Hashimoto’s thyroiditis) along with some form of enlargement
(goitre) of the thyroid gland, resulting in hormone disruption which can lead to many
adverse symptoms including tachycardia, tremors and glucose intolerance1,5. Both Graves
disease and Hashimoto’s thyroiditis are propagated by the body producing antibodies that
attack the naturally occurring thyroid products, Thyroid Stimulating Hormone (THS) and
Thyroid Peroxidase (TPO), a surface bound enzyme6-8. In a healthy patient TPO is
produced by the thyroid in order to catalyse certain enzymic functions such as the
halogenation of thyroglobulin and the reaction between iodotyrosine residues to form
thyroid hormone1,8. However, in patients with autoimmune thyroid diseases TPO
becomes an autoantigen that stimulates a humoral immune response from anti-TPO
antibodies (TPO aAbs), either caused by, or leading to, the aforementioned conditions7, 8.
TPO aAbs are found in patients with both Graves’ Disease and Hashimoto’s Thyroiditis,
with their presence detected in 75% and 90% of patients, respectively1,4.
Therefore, to aid in diagnosis, it has become important for there to exist a clinical
method that can ascertain the concentration of TPO aAbs in human blood sera. This
technique is usually a biological assay, which exist in many forms. When studying
antibodies, assay types include,

6 of 82
(i) the simple western blot technique9
(ii) immunoprecipitation10
(iii) agglutination11
(iv) immunofluorescence 12
(v) immunoassay13, 14
In this thesis, immunoassays are considered, more specifically, the Enzyme-Linked
Immunosorbent Assay or ELISA.
The concept of the immunoassay has been around since the 1960’s. The idea was
first developed based on the need for a highly explicit, highly responsive assay for
insulin. The methods that resulted were the original immunoassays, the
radioimmunoassay (RIA)15 and the immunofluorescence assay (IMF)16. However, despite
being effective in their own ways they both had serious shortcomings15, 16. It would be a
decade until the superior ELISA technique would first be reported.
1.2 The History of Enzyme-Linked Immunosorbant Assays
The ELISA technique was first introduced between 1971 and 1972. It is based on
the practical theories and experiments of Engvall and Perlmann who described a method
for the analysis of the concentration of Immunoglobulin G in human sera17. The method
involves a solid phase where the proposed antigen (or antibody) could be bound followed
by the addition of sera for examination18. If the sera sample contained antibodies
associated with the immobilized antigen or antibody, then they would bind the solid
phase. This antigen/antibody surface binding is the basis of all immunoassays and occurs
due to the ‘lock and key’ system, where the antibody contains a chemical ‘lock’ and the

7 of 82
antigen contains a specific chemical group or ‘key’ that fits this lock. In an organism the
attached antibody is a marker indicating to the body that the antigen it is bound to should
be destroyed i.e. it is the immune trigger17,18. In an immunoassay antibodies are bound in
a ‘well’ to the antigen, allowing their concentration to be read. However, what makes
ELISA so superior to other techniques is the method by which the bound analyte is read.
In RIA for instance, the antigen of interest is measured indirectly by radio-labeling a
known concentration of the same antigen and binding it on to a solid phase-bound
antibody. When a sera, positive for the desired antigen, is introduced to the solid phase
the antigen present will displace the radio-labeled versions. The concentration of
displaced antigen is calculated by measuring the free radioactive signal. This process was
extremely time consuming and tedious. In ELISA the concentration of the desired analyte
is measured by adding a generic monoclonal antibody that has been conjugated to an
enzyme. The enzyme will undergo a colour change with the addition of a simple
substrate, allowing the concentration of bound analytes to be read. This more accessible
read process makes ELISA a cheap, simple and direct process, whilst only losing
negligible amounts of specificity and sensitivity.
This marked improvement in read methods meant that the ELISA technique was
recognized quickly as superior to previously used tests, such as the aforementioned RIA
and IMF. Both RIA and IMF did achieve the same goal as ELISA techniques, that being
the detection and quantification of antibodies or antigens within human sera. However,
IMF is time consuming and small scale with high sensitivity, whereas RIA can handle
large scale tests, but the instruments involved were too technical and the involvement of
isotopic reagents gave the test a poor shelf life. In short, neither test was sufficient as a
viable, dependable and consistent clinical test19. The ELISA method combined the most

8 of 82
advantageous elements of RIA and IMF, by being responsive and reliable, as well as
being relatively quick and cheap to produce and perform. In addition, ELISA is a highly
adaptable test, being possible to modify the test procedure in order to detect almost any
antigen, antibody or other protein contained within human sera. The most common types
of ELISA technique are,
(i) Direct ELISA
(ii) Indirect ELISA
(iii) Sandwich ELSIA
(iv) Competitive ELISA.
The latter two variants follow the same principle as direct and indirect ELISA, but
methods are changed slightly to accommodate different types of antigen, or take different
observations for experimental work. The direct and indirect methods only differ slightly
in technique. Namely, when using direct ELISA the antibodies are bound to the solid
phase and antigens are detected within sera, whereas indirect ELISA binds antigen to the
solid phase so that antibody concentrations can be examined.
In the three decades since the discovery of the ELISA technique, it has been
adapted and tested as a viable bioassay for many hundreds of antigens and antibodies.
Such analytes include,
(i) Cytomegalo-virus20-22
(ii) Toxoplasmosis23-25
(iii) Hepatitis-A26, 27 and Hepatitis-B28-30
(iv) Rheumatoid Factor31-33
More recently, due to various experimental and statistical analyses, the ELISA test for
Antinuclear Antibodies (ANA) is being accepted as an increasingly valuable tool in the

9 of 82
diagnosis of many autoimmune diseases, including systemic lupus erythematosus34-36.
However, due to the much needed specificity in ANA testing, immunofluorescence has
remained the preferred ANA diagnostic for most clinicians. Additionally, ELISA has
been employed in the detection of the Human Immunodeficiency Virus (HIV)37-40. It is
this use of ELISA in HIV testing that represents the cutting edge of ELISA use. With
techniques being developed and incorporated that use such innovation as two separate
immunosorbent stages in order to detect all the sub-types of the HIV virus in sera37,
combined with new ways of making recombinant proteins that the HIV virus will respond
to on a solid phase38, 40, ELISA tests continue to make improvements to the way HIV is
diagnosed.
Despite the multitude of changes to the uses for which ELISA has been utilized,
the general methodology has remained largely unchanged since it was first introduced. In
its current form the ELISA technique uses a polystyrene microtitre well as a solid phase,
arranged in to a 96-well plate, allowing for multiple assays to be carried out under the
same conditions in a short space of time. It is difficult to pinpoint at which point the
ELISA method was first conducted within microtitre wells rather than the tubes used by
Engvall and Perlmann, but it can be safely assumed that most researchers had switched to
the more efficient wells by 197820, 27. Other than this, the main element of the ELISA
procedure which has changed since its introduction is the source of the material bound to
the solid phase. In the early days of ELISA antigens and antibodies to be applied would
have to be harvested from naturally occurring tissues, a costly and infecund process
which restricted the development of ELISA techniques quite significantly. However,
during the 1980’s came the full-scale introduction of recombinant biological
materials41,42. The use of recombinant materials (rather than those harvested from living
10 of 82
tissue) involves producing many antigens and antibodies in a laboratory environment.
Production is achieved by taking the relevant cDNA’s for that antigen or antibody and
transplanting them into bacterium, or other suitable cells (many prokaryotic and
eukaryotic systems have been tried14), and purifying the expressed material41, 42.
1.3 ELISA as a Tool for the Quantification of TPO aAbs in Human Sera
The ELISA for TPO aAbs uses a typical indirect ELISA technique: recombinant
TPO is bound inside microtitre wells and human sera from patients with suspected
thyroid conditions are introduced. If TPO aAbs are present in the sera binding to the TPO
will occur. A read step using anti-human antibody that has been enzyme linked allows the
amount of binding that has occurred to be read. Reading occurs via a substrate that
changes colour in the presence of the linked enzyme. The intensity of this colour is
representative of the amount of TPO aAbs present in the sample. Intensity is then read by
colorimitry and each well is assigned an absorbance value in optical density. In addition,
solutions containing known concentrations of TPO aAbs are tested and a simple
calibration curve is constructed using optical density values. The calibration curve is then
used to calculate the relative concentration of TPO aAbs in the patient sera. The TPO
ELISA is well established as a diagnostic process, being cited as both an experimental
and clinical technique since the first published example of a TPO ELISA in 199243. The
publication by Lauberg et al., demonstrated a stable ELISA for TPO aAbs with a good
dose response and good reproducibility43. Since then the test has been used in diagnosis1,
2 as well as in experimental work involving TPO or TPO aAbs6, 44.

11 of 82
1.4 Problems with TPO as an Analyte
TPO ELISA is still an imperfect system due to the fact that information regarding
several aspects of the test is still obscure19. Research in this area concerns two areas: role
of the target antibody during the antigen/antibody interaction and the nature and structure
of the TPO molecule. TPO is a large complex enzyme (approximately 104000amu) that
consists of 933 amino acid residues in combination with a complement control protein,
epidermal growth factor protein and a protein comparable to myeloperoxidase44, 45. Due
to this formidable complexity and several structural idiosyncrasies its full three-
dimensional arrangement is yet to be fully elucidated. To further complicate matters there
is also evidence to suggest that TPO exists in two isoforms, named TPO-1 and TPO-2.
TPO-1 being the full length naturally occurring enzyme and TPO-2 being an alternatively
spliced shorter version (833 residues)46. It is still unclear whether TPO-2 has any role in
thyroid function, but is expressed in the thyroid tissue of Graves’ disease patients.
1.5 TPO, the Current State of Research
However, there are numerous studies that reveal aspects of the TPO enzyme’s
true nature. These mainly look at, amongst other things,
(i) The isolation of the TPO from its native tissues45, 47. This area of research is
largely outdated now where ELISA is concerned, as recombinant methods are
far superior for obtaining TPO. However, harvesting native TPO still occurs,
mainly as a source of material for research looking at TPO’s natural functions.

12 of 82
(ii) Analysis of TPO activity and role during natural enzyme reactions47, 48. The
analysis of TPO’s natural functions is generally an in vitro examination of its
iodinating properties or its role in catalyzing enzymatic functions.
(iii) The region of the TPO molecule that binds antigenically (the epitope or
immunodominant region (IDR))8, 44, 49, 50. The search for the TPO IDR and its
activity is an area of considerable interest to modern science, it is hoped that
analysis of this aspect of the TPO molecule will shed light on the causes of
Graves’ disease and Hashimoto’s thyroiditis, eventually leading to causes and
treatments.
(iv) The gene sequence that codes for TPO production14, 41, 42, 51-53. These
sequences concerns are essential for the production of recombinant TPO.
In addition, there is also some data on the activity of TPO when binding with it’s
associated aAbs within the ELISA well44. Work carried out by Bresson et al. showed that
TPO’s IDR is split into two regions (IDR/A and IDR/B)44. Each region has aAbs that
bind with more affinity to one particular region, but in more advanced stages of
autoimmune thyroid disease the surface of the TPO molcules become increasingly more
antigenic. It is also shown in the same paper that the varying specificity of TPO aAbs
corresponds to a varying binding activity on the surface of the plate. It is also indicated
that, generally, when increasing the concentration of TPO aAbs in a antibody calibrator
by one order of magnitude should result in an increase in one unit of absorbance, giving
sigmoidal calibration curve shapes, flattening at around three orders of magnitude.
Bresson’s work aside, very few studies exist that observe TPO within an ELISA
environment, making it difficult to predict its behavior in such situations.

13 of 82
To summarise, it can be observed from current literature that the ELISA method
for antibody detection is a much tested and useful technique. However, when used to
detect the antibodies associated with autoimmune thyroid disease (i.e. TPO aAbs) then
there are still many areas of knowledge that are unclear and require further research.
1.6 Indirect ELISA Process
The indirect ELISA method is described. Like all ELISA techniques the indirect version
relies on the specific binding of antibodies in human sera to the antigen bound to the solid
phase of the test, in the case of this project, the surface of a microtitre well. The following
set of steps describe the current indirect ELISA process (experimentally, the specifics of
each step will be described in Chapter 2) A pictorial presentation of indirect ELISA Steps
1-7 can be found in figure 1 with details of each step below. Steps 1-3 concern the
preparation for the assay (i.e. production of assay plates) and Steps 4-8 concern the assay
proper.

14 of 82
Figure 1. A schematic representation of the Indirect ELISA process.
Step 1. Irradiation
Step 2. Coating buffer addition
Step 4. Samples and antibody calibrators addition
Step 3. Blocking buffer addition
Step 5. Incubation and wash. The well is
washed to remove non-bound material.
E
TPO is bound to the
surface of the well.
Surface of
microtitre well is
irradiated to
produce positive
charge.
TPO aAb binds
to TPO molecule
when sera is
added.
Enzyme-conjugated
anti-human IgG
binds to TPO aAb.
(Step 5 is repeated).
E
E
TMB TMB substrate is
added.
TMB changes
colour in the
presence of the
enzyme allowing
the TPO aAb
concentration to
be read.
TMB
Radiation Step 6. Conjugate antibody addition
Step 7. Substrate addition
BSA molecules
are bound to the
surface to block
non-specific
binding.
_
_
_
_
_
_
_
_ _ _
_ _ _ _
_ _ _ _
_ _ _ _
_ _ _ _
Key
TMB
HRP conjugated anti-human IgG
TPO aAb
TPO
BSA Substrate
E
Step 8. Read and Results

15 of 82
Assay Preparation:
Step 1. Irradiation: The first stage of the ELISA process requires the solid phase.
In most cases this is a microtitre plate (figure 2) that consists of 96 polystyrene
wells (figure 3). The polystyrene wells are then irradiated with a source of beta
radiation. The radiation creates positive surface charge within the well, caused by
the reaction shown in figure 4.
Figure 2. 96 well microtitre plate
Figure 3. 1 microtitre well
Figure 4. Irradiated polystyrene on the surface of the microtitre well containing positive charge to
allow adsorption of antigen.
Polystyrene Irradiated polystyrene
-e-
Beta irradiation n
+.
n

16 of 82
Step 2. Coating buffer addition: The target antigen is diluted in an appropriate
chemical buffer (known as the coating buffer) and added to one of the irradiated
plates. The antigen will undergo adsorption on to the surface of the well.
Adsorption occurs due to negatively charged functional groups on parts of the
TPO protein strand which allows electrostatic binding between TPO molecules
and the well surface.
Step 3. Blocking buffer addition: Following the coating stage is the blocking
stage. The blocking stage is where a protein (usually Bovine Serum Albumin,
BSA) is absorbed on to the well surface that is not covered by the antigen. The
BSA is added in a second chemical buffer known as the blocking buffer. The
process of blocking blocks the areas of the well surface where TPO is not bound
prevents non-specific antibody binding from occurring when human sera is added.
Assay:
Step 4. Samples and antibody calibrators addition: Samples of human sera for
testing are diluted into a chemical buffer. Antibody concentrates containing
known amounts of antibody are diluted in to a range of concentrations to create a
set of antibody antibody calibrators. Each sample is added to a separate well on
the microtitre plate in duplicate. For the purpose of the TPO ELISA antibody
calibrator concentrations are calculated in U/ml. The unit “U/ml” is a
standardized unit indicating the relative amount of the desired antibodies that are
present in a solution, it should be read as “Antibody Units/ml”. Antibody

17 of 82
calibrator concentrations are usually 2700 U/ml, 900 U/ml, 300 U/ml, 100 U/ml
and 33 U/ml.
Step 5. Incubation and wash: The plate is incubated for 30 minutes at room
temperature. Incubating the plate allows time for antibodies specific to the target
antigen present the well to bind accordingly. Once this process is complete each
well is thoroughly washed, this is to ensure that all unbound antibodies and other
biological materials are removed from the well. If unbound antibodies were to
remain in the well (sera samples are likely to contain antibodies not specific to the
target antigen) then they would be read in the following phases of the test, giving
a falsely elevated result.
Step 6. Conjugate Antibody addition: Following the wash, the conjugate is
added. The conjugate is anti-human Immunoglobulin G (IgG) that will bind to
analyte antibodies (TPO aAbs in a TPO ELISA). The IgG has been conjugated
with an enzyme that will allow the read process to take place (in this ELISA the
enzyme is horseradish peroxidise (HRP)). This step is followed by a further
incubation and wash as in step 5 (above). In the case of a positive ELISA test
conjugated antibodies will bind to any TPO aAbs bound inside the well. In the
case of a negative test the conjugated antibody will be removed with the wash.
This discrimination means that wells containing sera that are positive for TPO
aAbs will contain conjugated antibody.

18 of 82
Step 7. Substrate addition: Next, a substrate is added to the well. This substrate
will undergo a redox reaction with the enzyme conjugate. The redox reaction
between the conjugate enzyme and the substrate induces a colour change within
the well, the intensity of which will be related to the amount of TPO aAbs. The
substrate that is added is 3,3’,5,5’-tetramethylbenzidine (TMB)54, 55. The TMB,
upon addition to the well, is oxidized by the H2O2 in the horseradish peroxidase
giving the liquid in the well a blue colour. The reaction is then quenched using
phosphoric acid.
Step 8. Read and Results: Each well is read by colorimetry at 450nm. The result
for each well is an intensity given in optical density. The relative optical intensity
given by a well is directly proportional to the amount of TPO/TPO aAb binding
that occurred within the well. The optical density values for each of the antibody
calibrators is taken and used to plot a calibration curve (figure 5).

19 of 82
Figure 5. ELISA calibration curve for typical assay. Result taken from The Binding Site Ltd. ELISA for
Tetanus toxoid.
ELISA calibration curves are plotted logarithmically and favourably have a steep
gradient as shown in figure 5. A steep gradient provides a strong positive/negative
indication i.e. patients sera test against this curve could be clearly defined as
positive or negative.
0
0.5
1
1.5
2
2.5
3
10 100 1000 10000
Antibody Calibrator Concentration (U/ml)
Optical Den
sity (A
U)
m= 1.55
Positive Indication
Negative Indication

20 of 82
1.7 The Drawbacks of TPO ELISA
The graph in figure 5 shows a typical ELISA results graph for Tetanus toxoid, the graph
in figure 6 shows a typical ELISA result for TPO.
Figure 6. ELISA calibration curve for typical TPO assay.
It is clear from the comparison between figures 5 and 6 that the TPO ELISA has a much
less steep gradient overall (m= 0.55). A lower value for m and flattening of the curve
makes the test less clinically useful as there are not clearly defined positive/negative
indicators.
0
0.5
1
1.5
2
2.5
3
10 100 1000 10000
Antibody Calibrator Concentration (UI/ml)
Optical Density (A
U)
m= 0.55

21 of 82
1.8 Objectives of Study
The objective of this study, primarily, was to rectify the problem of the TPO
ELISA calibration curve flattening shown in figure 6 in order to obtain more normal
boundaries between positive samples and negative samples (as shown in figure 5). The
second objective of this study was to test and analyse the reproducibility of the assay over
time and, if necessary modify the test to improve it.
This gives two objectives:
Objective 1: To modify either the way in which the assay is produced or the way in
which the assay is run in order for it to produce a stable and reproducible calibration
curve with a steeper gradient similar to the one shown in figure 5.
Objective 2: To analyse the reproducibility of the assay over time and, if necessary,
modify either the way in which the assay is produced or the way in which the assay is
run in order to improve the reproducibility of the assay.
Objective 1 was tackled by modifying different areas of the test production and
procedure. The areas studied correspond to steps outlined in section 1.6, these steps
being,
(i) Step 2. Coating conditions were examined. The first stage was to look at how
changing the buffers within which TPO is bound to the solid phase affects the
assay.

22 of 82
(ii) Step 4. Samples and Antibody calibrators. The chemical buffers that contain
samples and antibody calibrators during the assay process were studied for their
effect on assay performance.
(iii) Step 6. Conjugate antibody addition. The read chemical, the conjugate antibody,
was studied for its affect on assay performance.
Objective 2 was tackled almost exclusively by looking at the antibody calibrators and
antibody concentrates used within the test.
Any modifications to the assay production or procedure made throughout the study in
order to reach Objectives 1 or 2 must not change either of the following,
(i) The economic feasibility of the test. Any modification made to the test, its
production or its procedure must not increase the cost by a large margin. This
mainly concerns increasing concentrations of expensive reagents.
(ii) The practical feasibility of the test. For the test to sell as a product its procedure
must adhere to a standard model. For example, changing the dilutions of antibody
calibrators and samples or prolonging incubation times cannot be deemed
acceptable as part of a solution to either objective.

23 of 82
Chapter 2
2. Experimental
This section will describe, firstly the traditional steps taken when producing and assaying
a TPO ELISA test and secondly, the various modifications made to this procedure during
the experiments conducted for this study.
2.1 Basic Method for Production of TPO Indirect ELISA Plates
2.1.1 Method for Coating TPO ELISA Wells (Step 2, Figure 1)
A solution of 2-amino-2-(hydroxymethyl)-1,3-propanediol (trizma base) (0.975g), of
sodium chloride (NaCl) (4.5g) and sodium deoxycholate (NaDC) (0.125g) was adjusted
to pH 8.00 by adding 5M HCl dropwise. Recombinant TPO (5µl, 1mg/ml) (Diarect AG,
Germany) was added to the solution to give a final concentration of antigen within the
solution of 0.2µg/ml. The solution is mixed and is known as coating buffer. The coating
buffer (110µl) is added to each of the 96 wells of the microtitre plate. Plates are then
placed in an air-tight container lined with paper towels that have been pre-saturated in
ultra-pure water. Plates are then incubated for 24 hours at 5ºC. Following incubation the
plates are removed from the air-tight container and the coating buffer is aspirated by
hand.

24 of 82
2.1.2 Method for Blocking TPO ELISA Wells (Step 3, Figure 1)
Stabilguard is diluted by 50% in ultra-pure water. This solution is known as the blocking
buffer. Stabilguard is phosphate-buffered saline containing 1% BSA, as well as other
sugars (including lactose) used in stabilizing large solid phase bound proteins (the exact
constituents are proprietary to Diarect AG). The blocking buffer solution (100µl) is added
to each microtitre well and left for 30 minutes. Following this the blocking buffer is
removed and each plate is dried by placing the plates in a 37ºC incubator for 2 hours.
Once dry, each plate assay plate is sealed in a sterile foil bag and stored at 5ºC before use.
2.2 Basic ELISA Test Procedure
2.2.1 Assay Preparation (Step 4, Figure 1)
The assay plate must be removed from storage and left to stand (in its packaging) until
the plate is at room temperature. During this time the antibody calibrators are produced.
Production of antibody calibrators is achieved by taking an antibody concentrate and
diluting it to five known concentrations (33U/ml, 100U/ml, 300U/ml, 900U/ml and
2700U/ml of TPO aAbs). The antibody concentrate is a solution of TPO aAbs of known
concentration refined from the blood sera of a Graves disease patient. For standard
diluent (trizma-buffered saline (TBS) with 0.1% BSA, 0.25% sodium azide and 1% 4,5-
dichloro-2-n-octyl-isothiazolin-3-one (Kathon) and 1% polyethylene glycol (Triton X-
100)) is used to dilute all antibody calibrators. Then each sera sample (10µl) (and in-
house standard if necessary) is diluted in to sample diluent (1000µl) to give 1:100

25 of 82
solutions. Sample diluent is a similar mixture to standard diluent. Horseradish peroxidase
(HRP) conjugated anti-human rabbit Immunoglobulin G (IgG) (10µl) is added to HRP
conjugate diluent (200µl ultra-pure water, 10% stabilzyme, 0.45% Proclin 300 and 8%
NaCl, 200µl) to create a 1:20 solution. This solutution is then diluted again in the same
diluent to create a 1:20000 solution of HRP-conjugated anti-human rabbit IgG (referred
to as conjugate antibody).
2.2.2 Basic ELISA Assay Method (Steps 4-6, Figure 1)
The assay plate is removed from its packaging each and antibody calibrator and diluted
sample (100µl) is added to two separate wells in order to examine each antibody
calibrator and sample in duplicate (Step 4, Figure 1). The loaded assay plates are placed
in an incubator for 30 minutes at 25oC. The plate is removed and the liquid aspirated
from each well. The wash process is performed by an automatic aspirator/dispenser. This
device is used to wash each well with a 1% solution of tween-20. This process, known as
the ‘wash’ process, is then repeated twice more (Step 5, Figure 1). The wash process
serves to remove any unbound material from the well. Conjugate antibody (100µl,
1:20000) solution is added to each well (Step 6, Figure 1) and the plate is placed in the
incubator for a further 30 minutes at 25oC. The wash process is then repeated to remove
any unbound conjugate antibody. After this 3,3’,5,5’-tetramethylbenzidine (TMB, 100µl)
is added to each well (Step 7, Figure 1) and the plate is again placed in the incubator for
30 minutes at 25oC. This stage of the process is referred to as ‘substrate addition’. When
the plate is removed from the incubator for the final time the wells that have a positive
response for TPO aAbs will have developed so that the liquid in the well is now blue. The
26 of 82
intensity of this colour responds to the relative concentration of TPO aAbs in the original
sample added to that well. Phosphoric acid (100µl, 0.5M) is added to each well in order
to stop the reaction. The plate is then read by an absorbance colorimeter at 450nm. Each
well is assigned a value in optical density which is then averaged for each sample. The
calibration curve is then constructed from the known five concentrations of the antibody
calibrators and each sample is read from this curve.
2.3 Methods for Modifications made to the TPO ELISA and Assays run to Assess
TPO ELISA
2.3.1 Variation of Sodium Deoxycholate Concentration (Step 2, Figure 1)
Sodium deoxycholate (NaDC) (figure 7) is added in the coating buffer stage as an agent
that unfolds the TPO protein strand, theoretically making the antigen/antibody interaction
more likely. Protein unfolding of this nature occurs due to the amphiphilic nature of
NaDC. In the first stage of the project, plates were made using coating buffers with a
range of NaDC concentration to test its affect upon assay performance and calibration
curve shape. The concentration range consisted of 0%, 0.005%, 0.010%, 0.020%,
0.025%, 0.030%, 0.035% and 0.050% NaDC in coating buffers (with 0.025% being
standard). Note: concentrations are expressed in percentage by weight.

27 of 82
Production
Eight coating buffers were made by the method in section 2.1 (250ml each). An amount
of NaDC was added to each to make the desired concentration (i.e. to one buffer solution
(250ml) 0.00625g of NaDC was added to create a 0.025% solution). Each coating buffer
coated 2 ELISA plates. No other changes were made to the procedures stated in section
2.1.
Assay
The 8 concentrations of NaDC (8 plates in total) were then assayed using standard
procedures as stated in section 2.2. On each plate a antibody calibrator set of 33U/ml,
100U/ml, 300U/ml, 900U/ml and 2700U/ml was used. Antibody calibrators were diluted
into standard diluent. Six in-house standards (panels) were also tested to confirm the
accuracy of the test. Panels were diluted in sample diluent.
O
O
CH3
OH
OH
CH3
CH3
Na+
Figure 7. Sodium Deoxycholate

28 of 82
2.3.2 Modification of Coating buffer from trizma-buffered saline to sodium
carbonate (Step 2, Figure 1)
To ascertain whether the nature of the coating buffer was affecting the performance of the
assay in any way the coating buffer was changed from the normal TBS to a NaHCO3
solution as reported in a method by Rebuffat56.
Production
To ultra-pure water (500ml) was added sodium carbonate (0.785g), sodium hydrogen
carbonate (1.456g) and NaDC (0.125g). The solution was then adjusted to a pH of 9.0 (as
recommended by Rebuffat56) using 5M HCl. All other procedures for coating and
blocking stated in section 2.1 were followed.
Assay
The plate was then assayed according to standard procedures as stated in section 2.2. As a
comparison, a plate using a standard TBS coating buffer was assayed in parallel, using
exactly the same test materials and antibody calibrators. On each plate a antibody
calibrator set of 33U/ml, 100U/ml, 300U/ml, 900U/ml and 2700U/ml was used. Antibody
calibrators were diluted into standard diluent. Six in-house standards were also tested to
confirm the accuracy of the test. Panels were diluted in sample diluent.

29 of 82
2.3.3 Variation of Bound Antigen Concentration (Step 2, Figure 1)
Testing the elevation of the concentration of antigen bound to the surface of the well was
the next variation made to the TPO ELISA test. It was thought that by increasing the
amount of binding occurring between the antigen and antibody the gradient of the
calibration curve could be increased. However, this meant that the optical densities of the
wells with higher concentrations of binding would exceed the operational limit of the
colorimeter. Therefore, it was decided that lowering the concentration of the conjugate
antibody solution (effectively reading less of the plate) would solve this problem. In this
experiment plates were coated with 0.2, 0.3, 0.4 and 0.5µg/ml recombinant TPO (with
0.2µg/ml being the standard concentration).
Production
Coating buffer solution was made according to procedure stated in section 2.1. Following
pH adjustment the solution was split into four equal parts of 25ml. Recombinant TPO
(1mg/ml. 5µl, 7.5µl, 10µl and 12.5µl) was added to each solution, respectively. Final
antigen concentrations in each well were therefore 0.2, 0.3, 0.4 and 0.5µg/ml. Four blank
microtitre plates were then coated, each with a different concentration of antigen.
Incubation, blocking and drying then occurred according to normal procedure.
Assay I
Each plate was tested according to normal procedure with a standard antibody calibrator
set made from antibody concentrate EQ1601 and a conjugate antibody solution of

30 of 82
1:20000. In-house standards were also tested on each plate. All other standard procedures
were followed from section 2.2.
Assay II
In the second test, each plate was tested again, but this time to each plate the same
antibody calibrator sets was assayed three times. On each was applied a different
concentration of conjugate antibody solution. The conjugate antibody solutions used
were 1:25000 and 1:30000 in concentration using the standard HRP-conjugated anti-
human rabbit IgG. The third conjugate antibody solution was a 1:50000 solution of the
same type of IgG, but from a different manufacturer (Jackson Immunoresearch, U.S.A),
who produce a more refined and responsive version of the same conjugated antibody. All
other standard procedures were followed from section 2.2.

31 of 82
2.3.4 Modification of Sample Diluent from trizma buffered saline to
phosphate buffered saline (Step 4, Figure 1)
To determine if the contents of the sample diluent was restricting the interaction between
TPO and TPO aAbs, assays were run to compare the traditional TBS with phosphate-
buffered saline (PBS). This test was run on plates made in sections 2.3.1 and 2.3.2 as to
observe the effect of different diluents on plates with varying NaDC concentration and
coating buffer.
Production
Plates from sections 2.3.1 and 2.3.2 were used.
Assay
A plate using the standard TBS coating buffer (section 2.3.1) and a plate using the
experimental NaHCO3 coating buffer (section 2.3.2) was assayed. On each plate two
antibody calibrator sets of 33U/ml, 100U/ml, 300U/ml, 900U/ml and 2700U/ml were
used; one set diluted in standard diluent (TBS) and one set diluted in PBS. The PBS used
was made from ultra-pure water with 10% NaCl, buffered with 0.25% KCl, 1% disodium
hydrogen orthophosphate and 0.2% sodium dihydrogen orthophosphate. The solution
also contains the same stabilizing agents and preservatives as standard diluent; namely
BSA, Kathon and sodium azide. Six in-house standards (panels) were also tested on each
plate to confirm the accuracy of the test. The rest of the procedures stated in section 2.2
were followed.
32 of 82
2.3.5 Examination of Antibody Concentrates from Varying Patients (Step
4, Figure 1)
Various antibody concentrates used to produce the antibody calibrators were tested for
differing effects on assay performance. Several different antibody concentrates were
obtained and antibody calibrator sets made from each of them, each antibody
concentrate coming from a different patient. The various antibody concentrates were
coded as EQ1227 (the standard antibody concentrate), EQ1207, EQ1600, EQ1601 and
Ha28790. All the calibration solutions were then tested on mimic plates from section
2.3.4 as well as plates obtained from Diarect AG and plates manufactured according to
the methods from section 2.1.
Production
Plates were manufactured according to methods in section 2.1 and section 2.3. Plates
obtained from Diarect AG were also used.
Assay
The antibody calibrator set 33U/ml, 100U/ml, 300U/ml, 900U/ml, 2700U/ml was
produced from each antibody concentrate (EQ1227, EQ1207, EQ1600, EQ1601 and
Ha28790). One of each plate type (mimic, Diarect AG, standard) was then taken and the
antibody calibrator sets made from all six antibody concentrates were tested on each
plate. The six in-house standards (panels) were also tested on each plate. All other assay
procedures from section 2.2 were followed.

33 of 82
2.3.6 Variation of Conjugate antibody Dilution (Step 6, Figure 1)
To examine the effect of conjugate antibody solution upon assay performance, several
assays were carried out using various antibody concentrations. A single antibody
concentrate was used in this experiment (EQ1601). This experiment was carried out on
plates manufactured in the standard manner.
Production
Plates were produced according to the methods in section 2.1.
Assay
A standard antibody calibrator set of 33U/ml, 100U/ml, 300U/ml, 900U/ml, 2700U/ml
was produced from antibody concentrate EQ1601. Then four different solutions of
conjugate antibody were produced from a standard 1:20 solution: concentrations of
1:5000, 1:10000, 1:15000 and 1:20000 were made. Then the antibody calibrator set was
tested four separate times on a single plate along with the in-house standards. During the
assay process each antibody calibrator set was subjected to a different concentration of
conjugate antibody. All other assay procedures stated in section 2.2 were followed.

34 of 82
2.3.7 Variation of Antigen Batch and Concentration (with Variation of
Conjugate antibody Concentration) (Step 2 and 6, Figure 1)
The concentration of antigen coated per well was increased again, this time to 1 and
1.5µg/ml (five and seven times higher than normal, respectively). However, the
concentration of the conjugate antibody solution was modified from 1:20000 to 1:100000
to account for the increased activity; keeping optical density readings within the
operational parameters of the colorimeter.
Production
Two plates were produced according to the method shown in section 2.3.2 one with
1µg/ml of TPO in its coating buffer and one with 1.5µg/ml. All other standard procedures
from section 2.1 were followed.
Assay
Each plate was tested with a standard antibody calibrator set made from antibody
concentrate EQ1601. In-house standards were also tested on each plate. A conjugate
antibody solution was made from IgG from Jackson Immunoresearch (U.S.A) at a
concentration of 1:100000. All other assay procedures from section 2.2 were followed.

35 of 82
2.3.8 Production and Testing of Mimic Plates
Production methods for TPO ELISA plates were acquired from Diarect AG and tested.
Supposedly, the method suggested by Diarect AG would give a more favourable curve
shape. In parallel, plates manufactured by Diarect AG were obtained and results were
compared to determine whether the Diarect AG plate did have more favourable curve
shape and whether or not it could be replicated with available materials.
Production of Mimic Plates
Plates were manufactured according to the method suggested by Diarect AG.
-Coating
To ultra pure water (250ml) was added sodium chloride (2.19g), trizma base (0.304g) and
NaDC (0.135g). The pH of the solution was then adjusted to pH 8.00 by adding 5M HCl
dropwise. Then recombinant TPO (5µl, 1mg/ml) was added to the solution to give a final
antigen concentration in the solution of 0.1µg/ml. The solution was thoroughly mixed
throughout. Next, two blank microtitre plates were taken and 120µl of the coating buffer
was added to each well. The plates were then incubated for 14 hours at 15ºC before the
coating buffer was removed.
-Blocking
A blocking solution of 0.5% lactose and 1% BSA in PBS (ultra-pure water with 9%
NaCl, 3% disodium hydrogen orthophosphate and 1% sodium dihydrogen
orthophosphate) was adjusted to pH 7.4 was prepared for blocking. To each well blocking

36 of 82
buffer (150 µl) was added and left for 1 hour. Following this the blocking buffer was
removed and the plates were dried in a 37ºC incubator for 2 hours.
Assay I
The mimic plate was then tested using standard procedures described in 2.2. On the plate
a antibody calibrator set of 33U/ml, 100U/ml, 300U/ml, 900U/ml and 2700U/ml was
used. Antibody calibrators were diluted into standard diluent. Six in-house standards
(panels) were also tested to confirm the accuracy of the test. Panels were diluted in
sample diluent.
Assay II
Plates manufactured by Diarect AG were then obtained and the same assay described
above was repeated. Alongside this assay, the mimic plates from above were tested again.
This repeat was performed because the concentration of the conjugate antibody was
increased from 1:20000 to 1:10000 in this second test and for the purposes of fair
comparison both plates were assayed under the same conditions. All other condition from
the above assay and procedures stated in section 2.2 were followed.
Assay III
In addition Assay II was repeated using the conjugate antibody solution supplied by
Diarect AG.

37 of 82
2.3.9 Analysis and Comparison of Competitors Plate
To rule out the possibility that the problems observed in the TPO ELISA caused by
something localised to the laboratory (e.g. a contaminant) several ELISA tests for TPO
aAbs were obtained from an external source. A plate was then assayed following all of
the manufacturer’s instructions as well as substituting all the standard diluents, antibody
calibrators, conjugate antibody solution and other test materials for those supplied by the
manufacturer. Further tests were then conducted to compare the performance of the
ELISA test under study and that of the test obtained externally.
Production
Anti-TPO ELISA plates were obtained from Phadia AB (Sweden). Plates for comparison
were manufactured according to the methods in section 2.1.
Assay I
The plate obtained from Phadia AB was tested according to the manufacturer’s
instructions. Two supplied controls were also tested. The method for this assay was
fundamentally the same as the procedures stated in section 2.2 with some minor changes.
Mainly, the antibody calibrator set supplied contained six solutions of 0U/ml, 30U/ml,
100U/ml, 300U/ml, 1000U/ml and 3000U/ml. For full details of these instructions see
Appendix A.
38 of 82
Assay II
To compare the two tests one plate made using standard method and one from Phadia
were taken and tested identically. Applied to each plate were three separate antibody
calibrator sets: one made from the standard EQ1227, one made from EQ1601 and the
antibody calibrators supplied by Phadia. On both plates all assay materials including
wash buffers, diluents and conjugate antibody solutions were standard as in section 2.2.
The assay of both plates was then repeated, but in this second instance assay materials
used were those supplied by Phadia.

39 of 82
2.3.10 Method for Assessment of TPO ELISA In-House Standards
The in-house standards, which are coded P1.2, P2.2, P3.2, P4.2, P5.2 and P6.2 are fluids
taken from a stock solution containing an exhaustively tested concentration of TPO aAbs.
They are then tested as normal samples (i.e. diluted in sample diluent to a concentration
of 1:100) within a TPO ELISA and are used to regulate the calibration curve. These
standards are prepared and stored separately to other fluids used in assay procedure to
avoid contamination. Details of each standard can be found below in Table 1. The
coefficient of variation (CV) is a number derived by looking at the concentration value
returned for a particular standard by several assays of the same type. Over time, this
value should not fluctuate by more than 10%. Standards were tested over a period of 5
days.
Standard Dilution in assay
Mean Concentration
(U/ml)
Acceptable Range
(U/ml)
P1.2 1:100 87 74-100
P2.2 1:100 168 143-193
P3.2 1:100 223 189-256
P4.2 1:100 280 238-322
P5.2 1:100 376 320-432
P6.2 1:100 700 595-804
Table 1. Concentration values for each in-house standard and the range of values an assay may return to be
deemed acceptable.
Production
Ten assay plates were made identically according to the methods in section 2.1.
Assay

40 of 82
One plate was assayed morning and afternoon for five days. All methods (indicated in
section 2.2) were followed and all assay conditions, additives and procedures were
followed in exactly the same manner for every assay. A new sample of each standard was
taken for use each day (as they are stored in 100µl batches). A standard antibody
calibrator set was produced from antibody concentrate EQ1227. In addition a 400U/ml
solution of EQ1207 was tested on each plate. Note: a solution of 400U/ml is a positive
control supplied with each test.

41 of 82
2.3.11 Method for Assessment of TPO ELISA Antibody concentrate
A recovery test was performed on each standard listed in Table 1. In a recovery test serial
dilutions are made from standards. For example P1.2, before an assay it is diluted just
like a sample to make a solution of 1:100: this solution is expected to give a value of
87U/ml. In this test however, a solution of 1:10 is made and then serially diluted to give a
set of solutions with 1:10, 1:20, 1:40, 1:80 and 1:160 (with expected values of
approximately 800, 400, 200, 100 and 50U/ml). A serial dilution is range is created in
this manner for all in house standards. However, some top concentrations are adjusted to
keep the serial within the calibration range (see Table 2). All solutions are then tested
against the same antibody calibrator set.
Production
Plates produced according to the methods in section 2.1 were used for this test.
Assay I
In this first assay standard antibody concentrate EQ1227 was tested. All serial dilutions
were tested on one plate with a antibody calibrator set made from EQ1227. Dilution
series shown in Table 2 were made. In addition, a positive control was tested as in the
assay from section 2.3.10.

42 of 82
Table 2. Showing serial dilutions made from standards in assessment of antibody concentrate EQ1227. Concentrations given in U/ml.
Assay II
In a second assay the test was repeated in a similar fashion, but this time only using a
cross section of the standard serial dilutions (those tested are shown in Table 3). The test
was carried out in this manner in order to fit more sets of antibody calibrators on the
same plate. On this plate antibody calibrator sets made from EQ1600, EQ1601 and
EQ1227 were tested along with two new antibody concentrates coded Cal5078 and
Cal28793. All antibody calibrator sets were made to the standard concentrations.
Performing the test in this way meant that several antibody concentrates could be
efficiently tested for recovery. The plate was assayed according to all procedures stated in
section 2.1.
Standard P1.2 P2.2 P3.2 P4.2 P5.2 P6.2
Expected
conc. 1:100 80 200 240 300 400 1000
Conc. Dil. Conc. Dil. Conc. Dil. Conc. Dil. Conc. Dil. Conc. Dil.
Serial
Dilutions 800 1:10 2000 1:10 2400 1:10 2000 1:15 2000 1:20 2000 1:50
400 1:20 1000 1:20 1200 1:20 1000 1:30 1000 1:40 1000 1:100
200 1:40 500 1:40 600 1:40 500 1:60 500 1:80 500 1:200
100 1:80 250 1:80 300 1:80 250 1:120 250 1:160 250 1:400
50 1:160 125 1:160 150 1:160 125 1:240 125 1:320 125 1:800

43 of 82
Standard P1.2 P3.2 P6.2
Expected conc.
1:100 80 240 1000
Conc. Dil. Conc. Dil. Conc. Dil.
Serial Dilutions 800 1:10 2400 1:10 2000 1:100
400 1:20 1200 1:20 1000 1:200
200 1:40 600 1:40 500 1:400
100 1:80 300 1:80 250 1:800
50 1:160 150 1:160 125 1:1600
Table 3. Showing serial dilutions made from standards in assessment of antibody concentrates EQ1600, EQ1601, EQ1227, Cal5078 and Cal28793. Concentrations given in U/ml.

44 of 82
2.3.12 Analysis of National Institute for Biological Standards and Control
(NIBSC) Reference
A nationally recognised standard was used to examine TPO antibody concentrates. A
national standard for TPO aAbs was obtained from National Institute for Biological
Standards and Control (NIBSC, U.K.) and tested on standard plates. A antibody
calibrator set was made from NIBSC reference material was tested against antibody
calibrator sets made from antibody concentrates EQ1600 and EQ1601.
Production
Plates were produced with the new TPO batch according to the methods in section 2.1.
Assay
NIBSC reference was taken and diluted (into sample diluent) to make a antibody
calibrator set consisting of 5 solutions with concentrations 30.86U/ml, 92.59U/ml,
277.77U/ml, 833.33U/ml and 2500U/ml. Antibody calibrator sets using antibody
concentrates EQ1600 and EQ1601 were also made to standard concentrations. The three
sets were then tested on a single plate along with the six in-house standards according to
procedures from section 2.2. In parallel, the exact same antibody calibrator sets and
standards were tested on a plate coated with the original TPO batch for added
comparison.

45 of 82
2.3.13 Method for Fixing Antibody calibrators against NIBSC Reference
A method to use the NIBSC reference material to align antibody calibrator sets with their
correct values. Assays were run using in-house standards with an antibody calibrator set
made from NIBSC reference. The concentrations for the in-house standards returned by
the NIBSC reference calibration curve were considered to be taken as correct. Comparing
the concentration values for each standard returned by the NIBSC curve with those
returned by other antibody calibrators sets would allow an adjustment value to be
derived. This value would then be used to adjust the concentration of the antibody
concentrates so that the calibration curves obtained from their antibody calibrator sets
matched the curves obtained from the NIBSC.
Example
The results in table 4 show the concentrations of all six standards by two different
antibody calibrator sets.
Antibody Concentrate NIBSC Reference EQ1600
Standard Concentration (U/ml) P1.2 85.73 71.18 P2.2 141.42 122.4 P3.2 203.97 177.94 P4.2 268.305 229.24 P5.2 423.49 333.6 P6.2 666.36 471.06
Table 4. Concentration results for each standard returned by the NIBSC reference calibration and a calibration curve given by antibody concentrate EQ1600
It is clear from the values in Table 4 that EQ1600 is returning incorrect values. Therefore
the results are processed according to table 5.

46 of 82
NIBSC Reference EQ1600
Standard Concentration (U/ml)
Adjustment Value (NIBSC concentration value/ Returned concentration value)
P1.2 85.73 1.00 1.22 P2.2 141.42 1.00 1.37 P3.2 203.97 1.00 1.25 P4.2 268.305 1.00 1.22 P5.2 423.49 1.00 1.13 P6.2 666.36 1.00 1.49
Mean 1.00 1.24 Table 5. Deriving adjustment value from results in Table 4. The concentrations of standards given by the
NIBSC calibration curve are translated as the correct values.
In this scenario then, when making an antibody calibrator set from EQ1600 the initial
dilution would be adjusted by 1.24. This change would mean that if in the assay these
results came from EQ1600 was diluted to 1:60 to get a concentration of 2700U/ml then in
the next assay it would be diluted to 1:75 to adjust.
Production
All plates in assays from section 2.3.14 were made according to methods stated in section
2.1.
Assay
A NIBSC antibody calibrator set was produced and assayed with concentrations
30.86U/ml, 92.59U/ml, 277.77U/ml, 833.33U/ml and 2500U/ml. The top NIBSC
antibody calibrator (2500U/ml) was made by diluting the concentrated NIBSC solution
by 1:200. Antibody calibrator sets of standard concentration were made from EQ1600
and EQ1601 were also assayed. EQ1600 was diluted to a 1:60 (20.5µl in 1250µl) solution
to create the 2700U/ml antibody calibrator and EQ1601 was diluted to 1:33 (25µl in
840µl). NIBSC reference material and the six in-house standards were diluted into

47 of 82
sample diluent and other antibody calibrator sets were diluted into standard diluent. All
assay procedures from section 2.2 were followed.
Assay II
Antibody calibrator sets of standard concentration were made from EQ1600, EQ1601.
The 2700U/ml antibody calibrator for each set was made according to the following
dilutions: EQ1600 was diluted to 1:75 (14.5µl in 1100µl) and EQ1601 was diluted to
1:58 (15.5µl in 900µl). NIBSC reference material and the six in-house standards were
diluted into sample diluent and other antibody calibrator sets were diluted into standard
diluent. All assay procedures from section 2.2 were followed.
Assay III
The assay as above was repeated with the following adjustments: EQ1600 adjusted by
1.14 to a dilution of 1:86 and EQ1601 adjusted by 1.22 to a dilution of 1:73
Assay IV and V
Assay II and then Assay III were repeated to confirm results. Antibody calibrator sets
from EQ1600 and EQ1601 were tested twice during each repeat, once at 1:83 and once at
1:50. The final concentration for EQ1600 was 1:75 and the final result for EQ1601 was
1:58.

48 of 82
2.4 Materials
2-Amino-2-(hydroxymethyl)-1,3-propanediol (trizma base) (Sigma Aldritch, Germany)
3,3’,5,5’-Tetramethylbenzidine
4,5-Dichloro-2-n-octyl-isothiazolin-3-one (Kathon) (Diarect AG, Germany)
Blank 96-well Microtitre Plates (Thermo Fisher Scientific, UK)
Bovine Serum Albumin BSA (Sigma Aldritch, Germany)
Disodium Hydrogen Orthophosphate (Sigma Aldritch, Germany)
Horseradish peroxidase (HRP) conjugated anti-human Immunoglobulin G (IgG) (Dako,
Denmark)
Horseradish peroxidase (HRP) conjugated anti-human Immunoglobulin G (IgG) (Jackson
Immunoresearch, U.S.A)
Hydrochloric Acid (HCl) (Sigma Aldritch, Germany)
Phosphoric Acid (Sigma Aldritch, Germany)
Polyethylene Glycol (Triton X-100)
Pottasium Chloride (KCl) (Sigma Aldritch, Germany)
Proclin 300 (Sigma Aldritch, Germany)
Recombinant TPO (Diarect AG, Germany)
Sodium Chloride (NaCl (Analar)) (Sigma Aldritch, Germany)
Sodium Deoxycholate (NaDC) (Sigma Aldritch, Germany)
Sodium Dihydrogen Orthophosphate (Sigma Aldritch, Germany)
Stabilguard (Diarect AG, Germany)
Stabilzyme (Diarect AG, Germany)
Sodium Azide (Sigma Aldritch, Germany)
Thyroid Peroxidase (TPO) (Diarect AG, Germany)

49 of 82
TPO ELISA Kit (Diarect AG, Germany)
TPO ELISA Kit (The Binding Site, U.K.)
TPO ELISA Kit (Varelisa, Denmark)
Tween-20 (Sigma Aldritch, Germany)

50 of 82
Chapter 3
3. Results and Discussion: Objective 1
3.1 The Effect of Coating Conditions
3.1.1 The Effect of NaDC Concentration in the Coating buffer (Step 2,
Figure 1)
The first experiment to examine the effect different coating buffers had on assay
performance looked at sodium deoxycholate (NaDC, figure 7). In this experiment several
plates were assayed with identical antibody calibrators, each plate having a different
concentration of NaDC in its coating buffer, results are shown in figure 8.
Figure 8. Graph showing how NaDC concentration to coating buffers effects assay response. Attached percentages show the amount of NaDC (% by weight) added to the coating buffer for each assay plate
during production.
0
0.5
1
1.5
2
2.5
3
10 100 1000 10000
Calibrator Concentration (U/ml)
Optical Density (A
U)
0%
0.005%
0.01%
0.05%
0.02%
0.025%
m= 0.561
m= 0.0056
m= 0.388
2700
0.1
2.7
51 of 82
As it can be seen from figure 8 the addition of NaDC to the assay has a dramatic effect on
response. Increasing the amount of NaDC in the coating matrix of the TPO increases the
antigenic activity during the assay procedure and therefore the calibration gradient (by 10
fold between 0% and 0.02% NaDC). Even at antibody calibrator concentrations of
2700U/ml TPO aAbs the plate coated with 0% NaDC was returning values 7-8 times
lower than the standard plate coated with 0.25%. The plate which had the standard
0.025% NaDC returned an expected curve, similar to the one in figure 5. The effect of
NaDC on antigen/antibody interaction is likely to occur because of the amphiphilic nature
of NaDC. Figure 7 (page 26) shows that NaDC has a hydrophilic end, which would
attach itself to parts of TPO and a hydrophobic end which would, at the same time, be
dissolved in the aqueous phase, in turn unfolding the protein. To illustrate how this is so
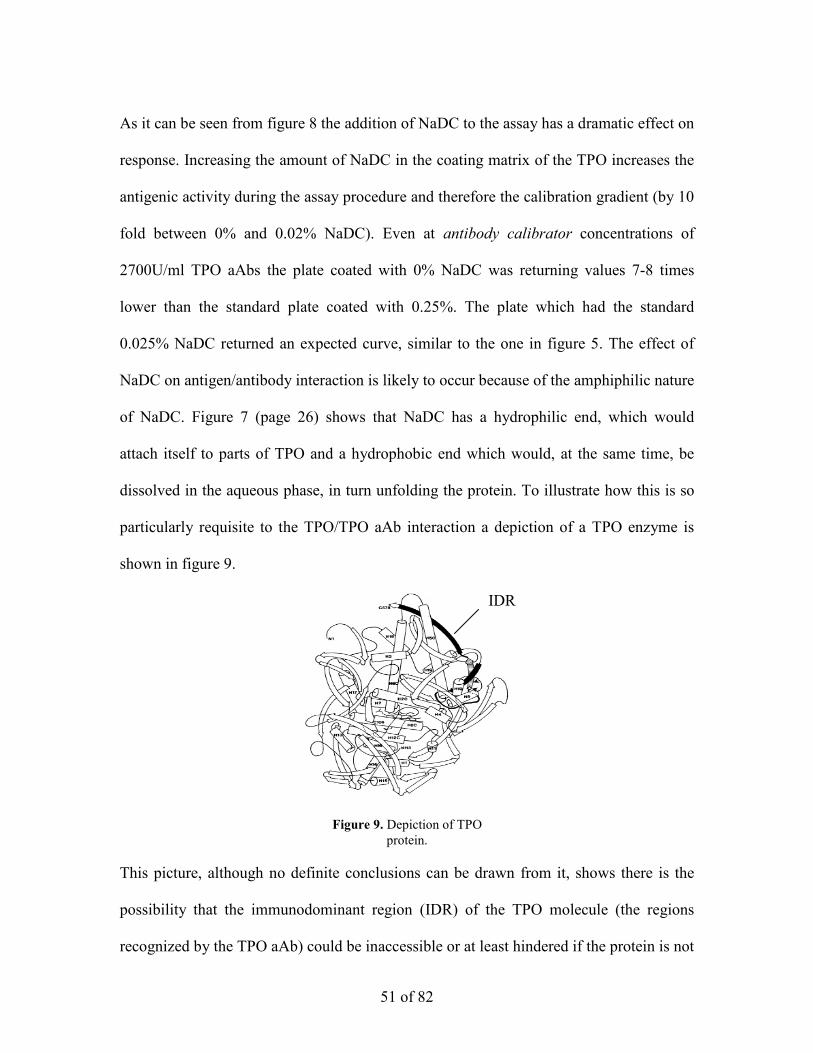
particularly requisite to the TPO/TPO aAb interaction a depiction of a TPO enzyme is
shown in figure 9.
This picture, although no definite conclusions can be drawn from it, shows there is the
possibility that the immunodominant region (IDR) of the TPO molecule (the regions
recognized by the TPO aAb) could be inaccessible or at least hindered if the protein is not
Figure 9. Depiction of TPO protein.
IDR

52 of 82
unfolded in some fashion; a theory borne out by the results is figure 8. It is also observed
that increasing the amount of NaDC in the matrix too much starts to null the desirable
effect that NaDC has on assay interaction. In figure 8, this seems to begin to happen after
0.02%, with 0.025% and 0.05% giving lower responses. This effect can be seen more
clearly in figure 10 (which includes data for plates with 0.03% and 0.035% NaDC).
Figure 10. Graph showing how NaDC concentration affects the response value of each antibody
calibrator. Labels indicate the concentration of the antibody calibrator.
From the graph in figure 10 it is visible that the effect of NaDC on assay activity peaks
and then tails of after around 0.03% NaDC in the coating buffer. The decline in activity
could be explained by the high concentration of NaDC unfolding the protein to a point
where it is denatured. However, the effect of NaDC also dips at around 0.025%
unexpectedly (the results boxed on figure 10). This dip may indicate that the NaDC may
form micelles at this concentration as reported57,62.
0
0.5
1
1.5
2
2.5
3
0 0.005 0.01 0.015 0.02 0.025 0.03 0.035 0.04 0.045 0.05 0.055
NaDC concentration in coat buffer (%)
Optical Density (A
U)
33U/ml
100U/ml
300U/ml
900U/ml
2700U/ml

53 of 82
NaDC is a compound known to aggregate under certain conditions and form
micelles57-62. In aqueous solutions these conditions seem to be optimal at pH 7.8 but no
more than pH 8 (pH 8 being the approximate pH of coating buffers in most cases). In
addition, it has been shown by Robinson and Tanford that amphipathic compounds tested
(including Triton X-100, used in both standard and sample diluent) will bind to proteins
in a desirable manner at concentrations surrounding the critical micelle concentration
(CMC)57. Therefore, it would follow naturally that if the concentration of NaDC added to
the coating buffer was exactly the CMC for NaDC then the unfolding effect would be
decreased by the formation of micelles. In addition, if the work by Robinson and Tanford
translates for TPO molecules then the optimal effect would be observed at concentrations
slightly above and below the CMC. As shown in the work by Masuoka and Moroi the
CMC for NaDC is dependant on the temperature of the solution62. In general the
temperature of coating buffer solutions can be assumed to be at room temperature
(approx. 295K). It can be seen from the graph in figure 11 that the CMC for NaDC at this
temperature would be around 6mmol/dm3.

54 of 82
Therefore concentrations either side of the CMC should produce an optimal effect. From
figure 10, it can be seen that an optimal effect is observed at 0.02% and 0.03% NaDC in
coating buffers, concentrations which correspond to 4.83mmol/dm3 and 7.24mmol/dm3
respectively. The concentration 0.025% seen to experience a deviation in the unfolding
effect on figure 10 corresponds to concentration of 6.038mmol/dm3 and hence the CMC
of NaDC.
3.1.2 The effect of increasing Concentration of TPO in the Coating buffer
(Step 2, Figure 1)
To assess whether or not the flattening in the curve could be due to the concentration of
TPO being coated to the inside of each well (0.2µg/ml) an experiment was conducted
where plates were coated with increasing amounts of the antigen. The hypothesis was that
if more antigen/antibody activity could be encouraged at higher concentrations (e.g.
Figure 11. Graph from study by Matsuoka and Moroi62
indicating the Critical Micelle Concentration (CMC) for NaDC at varying temperature. The dotted line indicates
the CMC at temperature of 295°K.
RT
6mmol dm3

55 of 82
900U/ml, 2700U/ml antibody calibrators) whilst keeping the same activity at the lower
concentrations then a favourable steepening of the curve may be observed. Figure 12
shows the results.
Figure 12. Graph showing 4 assay calibration curves, each with a different concentration of TPO coated in its wells (attached values). The same antibody calibrator sets were used for each assay. The concentration
of the conjugate antibody was 1:20000 It can be seen from figure 12 that the hypothesised increase in gradient is observed. Table
6 shows the increasing gradient of the calibration curves shown in figure 12.
Table 6. Gradient (m) values for curves shown in figure 12.
Amount of TPO in Coating buffer (µg/ml) Calibration curve gradient (m)
0.2 0.599
0.3 0.717
0.4 0.945
0.5 1.016
0
0.5
1
1.5
2
2.5
3
3.5
10 100 1000 10000
Calibrator Concentration (U/ml)
Optical D
ensity (AU)
0.3µg/ml
0.2µg/ml
0.4µg/ml 0.5µg/ml

56 of 82
Therefore, in the following experiment the concentration was pushed up again, to 1µg/ml
and 1.5µg/ml.
When preparing for the test using 1µg/ml and 1.5µg/ml coats, it was realised that
assays coated with these higher concentrations of TPO would experience an increase in
activity that would return optical density values likely be to be too high to be read by the
colorimeters. Therefore, the concentration of the conjugate antibody solution used would
be significantly reduced, lowering the overall assay response as far fewer TPO/TPO aAb
binding situations would be read. Lowering the amount of TPO aAbs read would reduce
overall assay response, meaning that optical density values would be in range of the
colorimeter. Consequently, it was decided that the concentration of the conjugate
antibody solution should be reduced from 1:20000 to 1:100000 for the assays with 1 and
1.5µg/ml of TPO. Results for this assay are shown in figure 13 and table 7.
Figure 13 Graph showing calibration curves from two assays, one with 1µg/ml TPO coated and one with
1.5µg/ml. The same antibody calibrator sets were used for both assays. The concentration of the conjugate antibody solution was 1:100000.
0
0.5
1
1.5
2
2.5
3
10 100 1000 10000
Concentration (U/ml)
Optical Density at 450n
m (AU)
1µg/ml 1.5µg/ml

57 of 82
Amount of TPO in Coating buffer (µg/ml) Calibration curve gradient (M)
1 0.611
1.5 0.640
Table 7. Gradient (m) values for curves shown in figure 13.
It can be observed from figure 13 and table 7 that increasing the antigen concentration to
1 and 1.5µg/ml will eventually lead to a reduction in activity
The reduction in the concentration of the conjugate antibody however, may have
depressed the assay response and therefore the gradient. It is possible therefore, that
coating concentrations 1µg/ml and 1.5µg/ml provide a gradient that would meet the
expectations of Objective 1. However, increasing the antigen concentration so much
would increase the cost of the test and modifying the conjugate antibody concentration
changes the practical nature of the test, thus breaking both constraints listed in section
1.8.
3.2 The Effect Varying Assay Method
3.2.1 The Effect of Different Antibody calibrator Diluents used during the
Assay Process (Step 4, Figure 1)
Two identical antibody calibrator sets were diluted into two different diluents (PBS and
the traditionally used TBS) and assayed on the same plate. This test was conducted on
both the standard TBS coated plate and plates with an NaHCO3 coating buffer. Results
follow in figure 14.
0
0.5
1
1.5
2
2.5
3
10.00 100.00 1000.00 10000.00
Calibrator Concentration (U/ml)
Optical Density (A
U)
1 2
3
4
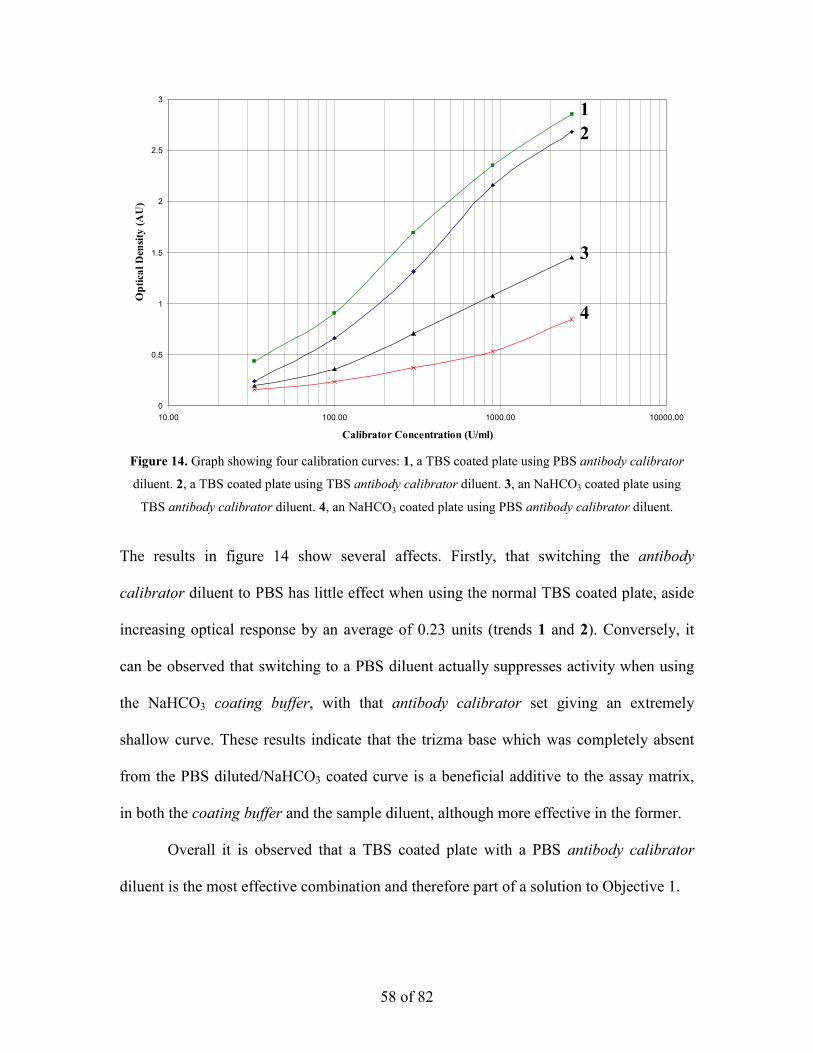
Figure 14. Graph showing four calibration curves: 1, a TBS coated plate using PBS antibody calibrator
diluent. 2, a TBS coated plate using TBS antibody calibrator diluent. 3, an NaHCO3 coated plate using
TBS antibody calibrator diluent. 4, an NaHCO3 coated plate using PBS antibody calibrator diluent.
58 of 82
The results in figure 14 show several affects. Firstly, that switching the antibody
calibrator diluent to PBS has little effect when using the normal TBS coated plate, aside
increasing optical response by an average of 0.23 units (trends 1 and 2). Conversely, it
can be observed that switching to a PBS diluent actually suppresses activity when using
the NaHCO3 coating buffer, with that antibody calibrator set giving an extremely
shallow curve. These results indicate that the trizma base which was completely absent
from the PBS diluted/NaHCO3 coated curve is a beneficial additive to the assay matrix,
in both the coating buffer and the sample diluent, although more effective in the former.
Overall it is observed that a TBS coated plate with a PBS antibody calibrator
diluent is the most effective combination and therefore part of a solution to Objective 1.

59 of 82
3.2.2 The Effect of Modifying the Concentration of Conjugate Antibody
(Step 6, Figure 1)
It was hypothesised at this point that the flattening in the calibration curve at higher
concentrations may be because to few of the interactions were being read. It was
therefore decided to test this by subjecting a single antibody calibrator set to four
different concentrations of conjugate antibody. Results from this experiment follow in
figure 15 and table 8.
Figure 15. Graph showing four calibration curves from the same antibody calibrator set on the same plate
but subjected a different concentration of conjugate antibody. Labels indicate the concentration of conjugate antibody used.
Conjugate Antibody concentration Calibration curve gradient (M)
1:5000 1.222
1:10000 1.104
1:15000 0.785
1:20000 0.618
Table 8. Gradient (m) values for curves shown in figure 15.
0
0.5
1
1.5
2
2.5
3
3.5
4
10 100 1000 10000
Calibrator Concentration (U/ml)
Optical Density (AU)
1:5000
1:10000
1:15000
1:20000
M=0.618
M= 1.222

60 of 82
The first thing observed from figure 15 and table 8 is that the two higher concentration
solutions of conjugate antibody (1:5000, 1:10000) induced such a large portion of the
well to be read that the optical density values for the 900 and 2700U/ml antibody
calibrators were higher than the colorimeter could read. It can be seen from table 8
however, that these two curves had a much steeper curve up to this point, indicating that
increasing conjugate antibody solution improves curve gradient, making increased
conjugate antibody concentration a viable solution to Objective 1.
Increasing conjugate antibody concentration as a method for gradient
improvement is prevented from being tested more extensively by the fact that this would
involve diluting the rest of the test down, and therefore, modifying the test a to too
greater degree. Additionally, increasing conjugate antibody concentration would disrupt
the reliability of the test, i.e. trying to detect small numbers of interactions with a large
amount of read material would start to increase error.
Having looked at Steps 2, 4 and 6 (figure 1), despite having found many useful premises
concerning the TPO ELISA and the improvement of its calibration curve gradient, no
completely viable solution objective 1 that meets all the required criteria was found.
Therefore, this area of research was abandoned in favour of analysing the tests reliability
and reproducibility.

61 of 82
Chapter 4
4. Results and Discussion: Objective 2
The experiments regarding objective 2 are shown here. This section of the study concerns
3 elements.
1. The analysis of the TPO ELISA’s poor reproducibility over time, discussed in
section 4.1.
2. The discovery of the cause of the TPO ELISA’s poor reproducibility, discussed in
section 4.2.
3. The fixing of the TPO ELISA’s poor reproducibility using the NIBSC reference
material discussed in section 4.3.
4.1 Results pertaining to the performance of TPO ELISA In-House
Standards
This section of results considers the experiments conducted to test the reliability of the
TPO ELISA test as stated in Objective 2.
In order to analyse the stability of the TPO ELISA test over time, in-house
standards were tested a total of 10 times over a period of 6 days with each assay being
carried out under identical conditions. Results from these assays were then statistically
analysed for variation. For each in-house standard a Coefficient of Variation (%CV) was
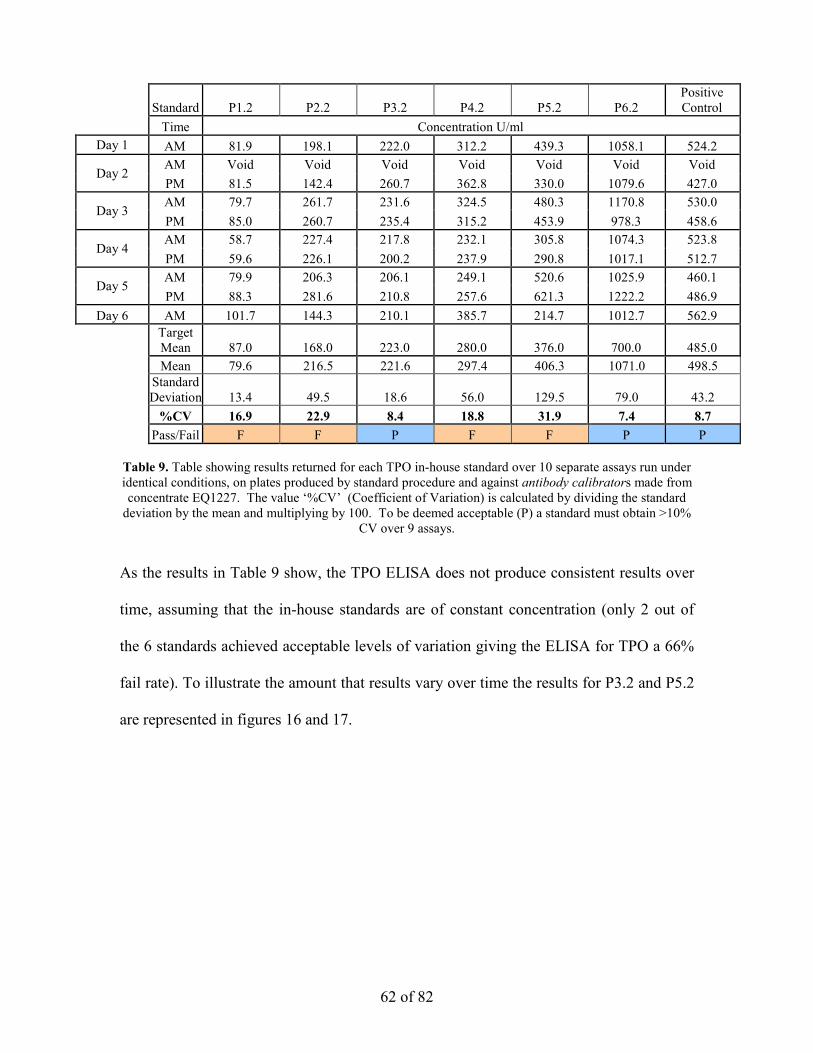
calculated, to be deemed acceptable the %CV must not exceed 10%. Table 9 shows the
results to obtained from this analysis.
62 of 82
Standard P1.2 P2.2 P3.2 P4.2 P5.2 P6.2 Positive Control
Time Concentration U/ml Day 1 AM 81.9 198.1 222.0 312.2 439.3 1058.1 524.2
Day 2 AM Void Void Void Void Void Void Void PM 81.5 142.4 260.7 362.8 330.0 1079.6 427.0
Day 3 AM 79.7 261.7 231.6 324.5 480.3 1170.8 530.0 PM 85.0 260.7 235.4 315.2 453.9 978.3 458.6
Day 4 AM 58.7 227.4 217.8 232.1 305.8 1074.3 523.8 PM 59.6 226.1 200.2 237.9 290.8 1017.1 512.7
Day 5 AM 79.9 206.3 206.1 249.1 520.6 1025.9 460.1 PM 88.3 281.6 210.8 257.6 621.3 1222.2 486.9
Day 6 AM 101.7 144.3 210.1 385.7 214.7 1012.7 562.9
Target Mean 87.0 168.0 223.0 280.0 376.0 700.0 485.0
Mean 79.6 216.5 221.6 297.4 406.3 1071.0 498.5
Standard Deviation 13.4 49.5 18.6 56.0 129.5 79.0 43.2
%CV 16.9 22.9 8.4 18.8 31.9 7.4 8.7 Pass/Fail F F P F F P P Table 9. Table showing results returned for each TPO in-house standard over 10 separate assays run under identical conditions, on plates produced by standard procedure and against antibody calibrators made from concentrate EQ1227. The value ‘%CV’ (Coefficient of Variation) is calculated by dividing the standard
deviation by the mean and multiplying by 100. To be deemed acceptable (P) a standard must obtain >10% CV over 9 assays.
As the results in Table 9 show, the TPO ELISA does not produce consistent results over
time, assuming that the in-house standards are of constant concentration (only 2 out of
the 6 standards achieved acceptable levels of variation giving the ELISA for TPO a 66%
fail rate). To illustrate the amount that results vary over time the results for P3.2 and P5.2
are represented in figures 16 and 17.

63 of 82
Figure 16. Graph showing how the concentration of standard P3.2 varied over time, P3.2 passed the linearity test. Error taken at 2 standard deviations.
Figure 17. Graph showing how the concentration of standard P5.2 varied over time, P5.2 failed the
linearity test. Error taken at 2 standard deviations.
P3.2 CV= 8.4% Pass
P5.2 CV= 31.9% Fail

64 of 82
The graphs shown in figures 16 and 17 indicate just how much the results returned over
time can vary. It is even shown that the results vary on a day-by-day basis, but that could
be purely coincidental and would have to be tested exhaustively to be proven. However,
it is certain that at least one aspect of the assay was causing considerable inconsistency
in results over time. In a bid to ascertain the nature of the cause and find a solution to
this problem, tests were carried out on the antibody concentrates. These tests would
discern whether or not it was the standards themselves that were the source of the
inconsistency (for example, if aggregation was occurring in the standard fluid) or
whether it was the antibody calibrators returning inconsistent curves, leading to
inconsistent results.
4.2 Results pertaining to the performance of Antibody concentrates
In order to test whether the antibody calibrators were responsible for the obvious
inconsistency inherent within the TPO ELISA shown in section 3.5, a recovery test was
conducted. A recovery test involves testing a antibody concentrates ability to return
consistent curves. In the recovery test performed, several antibody calibrator sets were
tested against serially diluted standards. If the antibody concentrates return concentration
values that correctly reflect their serial dilutions then it indicates that the concentrate is
giving consistent curves.
To illustrate how the values from the following results are calculated, and
therefore, how they relate back to actual ELISA results and to a demonstrate how varying
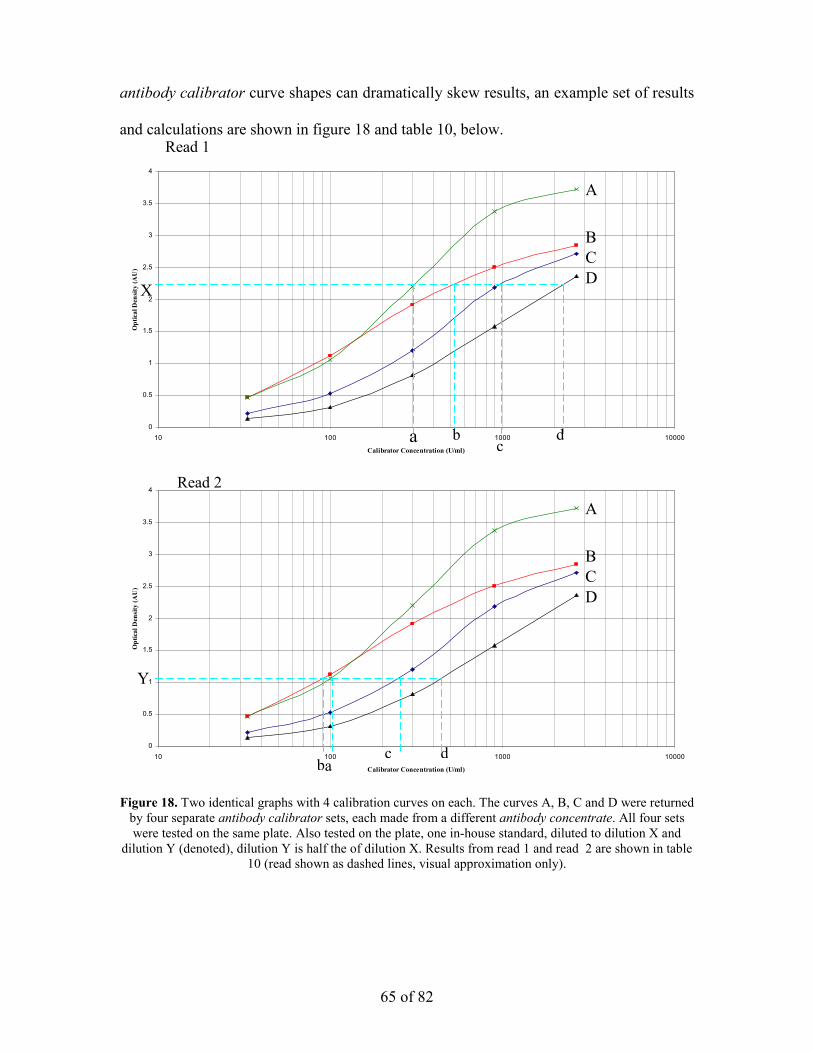
antibody calibrator curve shapes can dramatically skew results, an example set of results
and ca re shown in figure 18 and table 10, below.
Figureby fowere
dilutio
0
0.5
1
1.5
2
2.5
3
3.5
4
1
Optical Den
sity (A
U)
X
0
0.5
1
1.5
2
2.5
3
3.5
4
1
Optical Density (A
U)
Y
lculations aRead 1
65 of 82
18. Two identical graphs with 4 calibration curves on each. The curves A, B, C and D were returned ur separate antibody calibrator sets, each made from a different antibody concentrate. All four sets tested on the same plate. Also tested on the plate, one in-house standard, diluted to dilution X and n Y (denoted), dilution Y is half the of dilution X. Results from read 1 and read 2 are shown in table
10 (read shown as dashed lines, visual approximation only).
0 100 1000 10000
Calibrator Concentration (U/ml)
A
B C D
a b c
d
0 100 1000 10000
Calibrator Concentration (U/ml)
A
B C D
a b c d
Read 2

66 of 82
Curve A B C D
Concentration (U/ml)
Read X 160 210 515 1410
Expected Y
(X/2)
80 105 275 705
Read Y 90 105 210 315
Recovery 112.5% 100% 81.5% 44.6%
The hypothetical example shown in figure 18 and table 10 demonstrate how ineffective
calibration curves can entirely misrepresent the concentration of a sample. Tables 11, 12
and 13, below, show the results from the examination of three antibody concentrates. The
antibody concentrates are coded EQ1227, EQ1600 and EQ1601 and each represent sera
taken from a different Graves disease patient.
P3.2 P6.2
Dilution Obtained (U/ml)
Expected (U/ml)
Recovery (%) Dilution
Obtained (U/ml)
Expected (U/ml)
Recovery (%)
1:10 903.5 903.5 100.00 1:100 845.0 845.0 100.00 1:20 374.9 451.7 83.00 1:200 363.5 422.5 86.05 1:40 154.5 225.8 68.39 1:400 160.3 211.2 75.89 1:80 75.11 112.9 66.50 1:800 87.55 105.6 82.88
1:160 35.23 56.47 62.39 1:1600 39.40 52.81 74.60
Mean Recovery
(%) 76.0
Mean Recovery
(%) 83.8 Table 11. Showing the results of the recovery examination from standards P3.2 and P6.2. Tested against
standard antibody concentrate EQ1227 on a plate produced by standard procedure.
Table 10. Table showing results taken from figure 18, illustrating how recovery values are calculated (values taken approximated).
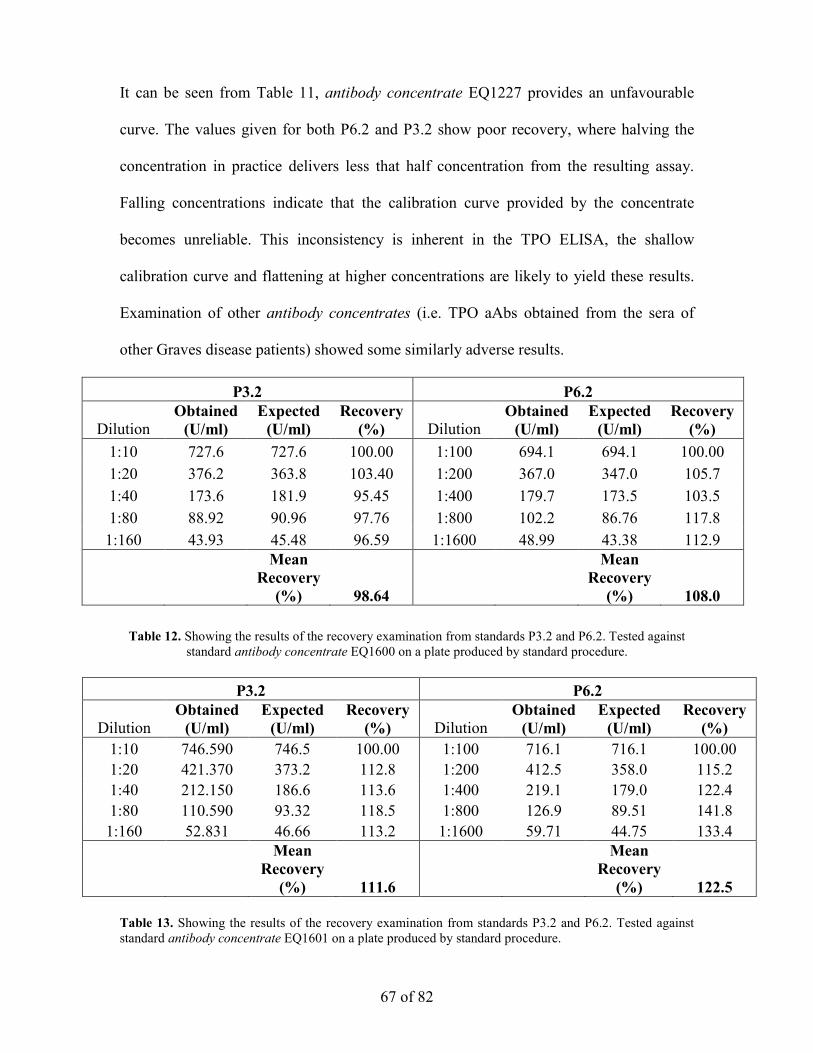
67 of 82
It can be seen from Table 11, antibody concentrate EQ1227 provides an unfavourable
curve. The values given for both P6.2 and P3.2 show poor recovery, where halving the
concentration in practice delivers less that half concentration from the resulting assay.
Falling concentrations indicate that the calibration curve provided by the concentrate
becomes unreliable. This inconsistency is inherent in the TPO ELISA, the shallow
calibration curve and flattening at higher concentrations are likely to yield these results.
Examination of other antibody concentrates (i.e. TPO aAbs obtained from the sera of
other Graves disease patients) showed some similarly adverse results.
P3.2 P6.2
Dilution Obtained (U/ml)
Expected (U/ml)
Recovery (%) Dilution
Obtained (U/ml)
Expected (U/ml)
Recovery (%)
1:10 727.6 727.6 100.00 1:100 694.1 694.1 100.00 1:20 376.2 363.8 103.40 1:200 367.0 347.0 105.7 1:40 173.6 181.9 95.45 1:400 179.7 173.5 103.5 1:80 88.92 90.96 97.76 1:800 102.2 86.76 117.8
1:160 43.93 45.48 96.59 1:1600 48.99 43.38 112.9
Mean Recovery
(%) 98.64
Mean Recovery
(%) 108.0
Table 12. Showing the results of the recovery examination from standards P3.2 and P6.2. Tested against standard antibody concentrate EQ1600 on a plate produced by standard procedure.
P3.2 P6.2
Dilution Obtained (U/ml)
Expected (U/ml)
Recovery (%) Dilution
Obtained (U/ml)
Expected (U/ml)
Recovery (%)
1:10 746.590 746.5 100.00 1:100 716.1 716.1 100.00 1:20 421.370 373.2 112.8 1:200 412.5 358.0 115.2 1:40 212.150 186.6 113.6 1:400 219.1 179.0 122.4 1:80 110.590 93.32 118.5 1:800 126.9 89.51 141.8
1:160 52.831 46.66 113.2 1:1600 59.71 44.75 133.4
Mean Recovery
(%) 111.6
Mean Recovery
(%) 122.5 Table 13. Showing the results of the recovery examination from standards P3.2 and P6.2. Tested against standard antibody concentrate EQ1601 on a plate produced by standard procedure.

68 of 82
The results in Tables 11, 12 and 13 clearly show that the antibody concentrates used in
TPO ELISA return poor calibration curves. In order to rectify this problem an outsider
standard was obtained in order to fix antibody calibrators and standards to definite
concentrations.
4.3 Results pertaining to the use of NIBSC Reference in fixing Calibration
The NIBSC (National Institute for Biological Standards and Controls) reference is a fluid
that contains an amount of TPO aAbs that has been exhaustively tested by several
external laboratories. It was acquired in order to fix the TPO ELISA test, this was
achieved by constructing a antibody calibrator set from the NIBSC fluid and assaying
against antibody calibrator sets from other concentrates as well as the in-house standards.
The entire test was conducted on a single standard plate using standard procedures. If the
calibration curve given by a concentrate matches the curve of the NIBSC set then that
concentrate is functioning properly. The results from the first instance of this experiment
are displayed in figure 19.

69 of 82
Figure 19. Graph showing three calibration curves returned from the same plate in the first NIBSC experiment. Labels indicate which concentrate each antibody calibrator set was constructed from.
Figure 19 shows that the two antibody concentrates tested do not behave in the same way
as the NIBSC, indicating that they should be adjusted to do so. This adjustment is
numerated by observing the value returned for each standard by the NIBSC reference
calibration curve. The values for the standards are then compared against the values from
the other two curves and an adjustment value is calculated by the method shown in Table
14.
0
0.5
1
1.5
2
2.5
3
10 100 1000 10000
Concentration (U/ml)
Optical D
ensity (AU)
NIBSC EQ1600
EQ1601

70 of 82
Table 14. Table showing the calculation of adjustment values from the first NIBSC experiment. Adjustment values are calculated by dividing the value for the a standard given by the NIBSC reference by
the standard value given by the antibody calibrator being assessed.
A divergence of 1.00 indicates that the value returned by that particular calibration curve
is 100% correct. The concentration values for each standard returned by the NIBSC curve
is assumed to be 100% correct. A divergence value of greater than 1.00 indicates that the
values being returned by the antibody calibrators are too low. The mean adjustment
value are an average divergence that each antibody calibrator set has from the NIBSC
curve.
The mean adjustment value gleaned from this test indicated that the antibody
calibrator sets made from concentrates EQ1600 and EQ1601 would have to be adjusted
down in concentration by 1.24 and 1.47, respectively. This meant reducing the
concentration of the 2700U/ml antibody calibrator from EQ1600 from a concentration of
1:60 to 1:75 (1.e 60 multiplied by 1.24 gives the new dilution factor of 74.4 which is
NIBSC Reference EQ1600 EQ1601
Standard
Concentration
(U/ml) Average Concentration (U/ml) Average Concentration
(U/ml) Average P1.2 84.26 87.19 85.73 69.92 72.45 71.18 51.11 52.8 51.98 P2.2 120.7 162.0 141.4 103.4 141.4 122.4 76.74 111.1 93.95 P3.2 203.0 204.8 203.9 177.1 178.7 177.9 147.0 148.6 147.8 P4.2 254.2 282.3 268.3 218.6 239.8 229.2 193.6 219.8 206.7 P5.2 423.4 423.4 423.4 333.6 333.6 333.6 360.0 360.0 360.0 P6.2 683.6 649.0 666.3 480.5 461.6 471.0 664.1 619.7 641.9
NIBSC Standard
Value Divergence
Divergence Divergence 85.73 1.00
Adjustment Values
1.22 1.67 141.4 1.00 1.37 1.79 203.9 1.00 1.25 1.51 268.3 1.00 1.22 1.35 423.4 1.00 1.13 1.04 666.3 1.00 1.49 1.09
Standard Dev. 0.00 0.13 0.30
Mean 1.00 Mean
Adjustment Value 1.24 1.47
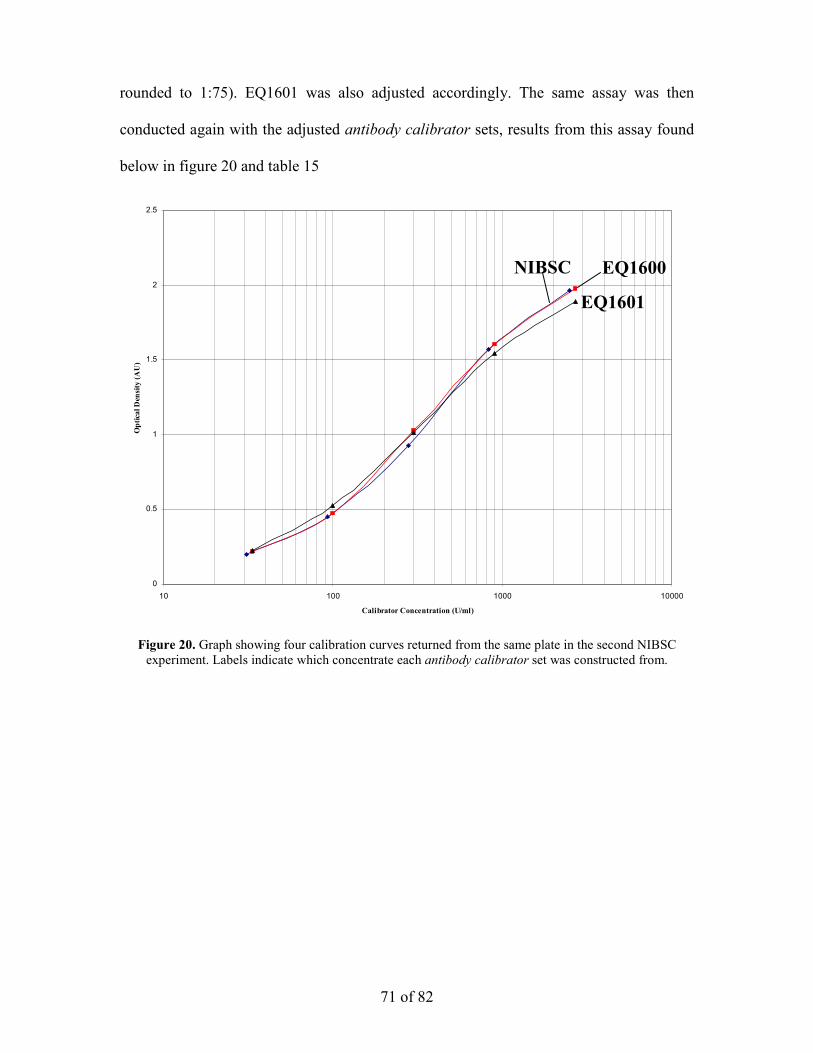
71 of 82
rounded to 1:75). EQ1601 was also adjusted accordingly. The same assay was then
conducted again with the adjusted antibody calibrator sets, results from this assay found
below in figure 20 and table 15
Figure 20. Graph showing four calibration curves returned from the same plate in the second NIBSC experiment. Labels indicate which concentrate each antibody calibrator set was constructed from.
0
0.5
1
1.5
2
2.5
10 100 1000 10000
Calibrator Concentration (U/ml)
Optical Den
sity (A
U)
NIBSC EQ1600
EQ1601

72 of 82
NIBSC Reference
EQ1600
EQ1601
Standard
Concentration (U/ml) Average
Concentration (U/ml) Average
Concentration
(U/ml) Average
P1.2 78.634 79.23 78.93 75.82 76.36 76.09 63.25 63.71 63.48 P2.2 134.2 140.0 137.1 121.5 126.0 123.8 107.7 112.4 110.1 P3.2 186.6 195.0 190.8 161.4 167.8 164.6 150.8 157.8 154.3 P4.2 266.8 276.9 271.8 223.9 232.0 227.9 221.1 230.4 225.8 P5.2 358.0 370.0 364.0 300.7 311.4 306.1 309.8 322.2 316.0 P6.2 482.6 481.9 482.3 415.9 415.1 415.5 443.6 442.7 443.2
NIBSC Standard
Value Divergen
ce Divergen
ce Divergen
ce 78.9 1.00
Adjustment Values
1.04 1.24 137.2 1.00 1.11 1.25 190.8 1.00 1.16 1.24 271.9 1.00 1.19 1.20 364.1 1.00 1.19 1.15 482.3 1.00 1.16 1.09
Standard Dev. 0.00 0.06 0.06
Mean 1.00 Mean
Adjustment Value 1.14 1.22 Table 15. Table showing the calculation of adjustment values from the second NIBSC experiment.
Adjustment values are calculated by dividing the value for the a standard given by the NIBSC reference by the standard value given by the antibody calibrator being assessed.
The results in table 15 show that after the first adjustment, although aligning the antibody
calibrators sets made from antibody concentrates EQ1600 and EQ1601 with the NIBSC
calibrator set, they are still not commensurate. This finding is not portrayed in figure 22,
which shows the NIBSC curve and the curve from EQ1600 being almost in accord with
one another. However, the key difference between the curves is in the lower half of the
curve (values below 500 U/ml), where the standard readings are taken, as the curves
made from EQ1600 and EQ1601 are aligned.
Using the results from table 15 the process was repeated, adjusting the antibody
calibrator sets using the mean adjustment values and then running the assay again, in
identical conditions. This assay gave the results shown in figure 21 and table 16.

73 of 82
Figure 21. Graph showing four calibration curves returned from the same plate in the third NIBSC experiment. Labels indicate which antibody concentrate each antibody calibrator set was constructed from.
0
0.5
1
1.5
2
2.5
3
3.5
4
10 100 1000 10000
Calibrator Concentration (U/ml)
Optical Den
sity (A
U)
NIBSC
EQ1600 EQ1601

74 of 82
Table 16. Table showing the calculation of adjustment values from the third NIBSC experiment. Adjustment values are calculated by dividing the value for the a standard given by the NIBSC reference by the standard value given by the antibody calibrator being assessed.
Even though the calibration curves do no match exactly in figure 21, mathematically the
results in Table 13 show that antibody calibrator sets made from EQ1600 and EQ1601
have been adjusted to concentrations commensurate with NIBSC reference. The
conclusion that the antibody calibrators had been fixed to an accurate dilution despite the
divergence of antibody calibrator curves in figure 21 was deemed acceptable because
over the range of concentrations values contained within the standards (P1.2-P6.2) both
EQ1600 and EQ1601 made accurate returns. This range of concentrations is acceptable
because it straddles the limit of diagnosis, above which, sera is deemed ‘positive’. The
final concentrations for EQ1600 and EQ1601 being 1:86 and 1:73, respectively.
NIBSC Reference EQ1600 EQ1601 Standard
Concentration
(U/ml) Average
Concentration (U/ml) Average
Concentration
(U/ml) Average
P1.2 75.50 78.90 77.20 73.722 77.05 75.38 76.06 79.26 77.66 P2.2 182.1 174.9 178.5 187.35 179.2 183.3 181.2 173.6 177.4 P3.2 162.2 161.0 161.6 165.22 164.0 164.6 160.6 159.5 160.1 P4.2 260.3 249.9 255.1 276.13 264.1 270.1 267.7 255.4 261.5 P5.2 235.9 289.7 262.8 248.12 310.1 279.1 239.4 303.5 271.5 P6.2 413.0 406.3 409.7 458.18 449.7 453.9 482.0 471.0 476.5
NIBSC Standard
Value Divergence
Divergence Divergence 77.20 1.00
Adjustment Values
1.02 0.99 178.5 1.00 0.97 1.01 161.6 1.00 0.98 1.01 255.1 1.00 0.94 0.98 262.8 1.00 0.94 0.97 409.7 1.00 0.90 0.86
Standard Dev. 0.00 0.04 0.06
Mean 1.00 Mean
Adjustment Value 0.97 0.99

75 of 82
The solution provided by the NIBSC reference material ultimately satisfies
Objective 2. After adjusting the antibody concentrates to the optimal concentrations
described above, the linearity test described in section 4.1, Table 9, in which the TPO
ELISA achieved a 33% pass rate, was repeated. In the repeated test the TPO ELISA
achieved a 100% pass rate.

76 of 82
Chapter 5
5. Conclusions
The findings in the study have revealed many theories regarding the nature of the TPO
ELISA. By assessing assay performance under varying conditions, it have been possible
to demonstrate several paradigms concerning the calibration curve and therefore the
antigen/antibody interaction of the TPO ELISA.
(i) It was demonstrated in section 3.1.1 that NaDC is essential in the TPO ELISA for
the purpose of unfolding the TPO protein. Although unfolding the protein to a
greater degree (increasing NaDC concentration) increased curve gradient, the
effect only extended up to 0.03% NaDC in the coating buffer. Beyong 0.03%
NaDC the protein became unfolded to the point where it started to become
denatured, causing its antigenic nature to fall.
(ii) It was demonstrated in section 3.1.2 that increasing the coat concentration of TPO
between 0 and 0.5µg/ml within the ELISA well greatly increased assay response.
Unfortunately above 1µg/ml activity was increased beyond the operational
parameters of the colorimeters used to read the ELISA plate. Although increasing
antigen concentration was a part-solution to Objective 1, the economic
implications meant this avenue of research was discarded.
(iii) In section 3.2 the assay method was examined. Calibrator diluents that optimise
assay response were recognised in a combination of TBS as a coating buffer and
PBS as an antibody calibrator diluent. It was also discovered that increasing the
concentration of the conjugate antibody increased calibrator curve gradient,

77 of 82
making it a possible solution to Objective 1. However, economical and practical
implications again meant abandoning the search for a solution to Objective 1.
To summarise these observations it is fair to say that the TPO ELISA’s combination of
delicate responses and resistance to changing curve shape are likely drawn from the
fundamental nature of the relationship between TPO and its antibody. When activity
within the ELISA well increased above a certain amount, the assay would return a
flattened curve indicating the possibility of a hindering phenomenon between TPO and
TPO aAbs not affected by conditions and therefore difficult to investigate within an
ELISA setting.
Although these findings hold scientific interest, it is unfortunate that no solutions
to Objective 1 of the study were gleaned from them. Changing variables within test
conditions and observing the changes in behaviour of the ELISA yielded some incite into
the nature of TPO, TPO aAbs and their activity within an ELISA well but the restraints of
industrial research restricted any one of the avenues being researched further. The
conclusions to this area of the study therefore, are left somewhat unfinished. In closing,
further study into the actions and nature of TPO and TPO aAbs, their response to
surrounding conditions both in vivo and in vitro and their responsiveness to other agents
such as sodium deoxycholate would be needed to more fully understand the concepts
explored here.
The most useful outcome of the study, therefore, extends from the solution
provided to Objective 2. Improvements were made to the TPO ELISA by fixing the
inability of the TPO ELISA to return consistent results over time. This was achieved by
fixing the antibody concentrates to their correct concentrations. Fixing the antibody
concentrates also allowed the in-house standards to be fixed to their correct

78 of 82
concentrations. This solution to Objective 2 improved the TPO ELISA’s reproducibility
pass rate from 33% to 100%.
6. References
1. Swain M., Swain T., and Mohanty K.M. (2005) Indian J. Biochem. 20(1): p. 19-
22.
2. Caturegli P., Kimura H., Rocchi R., and Rose N.R. (2007) Curr. Opin.
Rheumatol. 19: p. 44-48.
3. Hayward S.L, Suzuki K., and Elliott J.F. (2007) J. Immunol. Meth. 323: p. 114-
122.
4. Chardès T., Chapal N., Bresson D., Dès C., Giudicelli V., Lefranc M.P., and
Péraldi-Roux S.M. (2002) Immunogen. 54(141-157).
5. Dayan C.M. and Daniels G.H. (1996) N. Engl. J. Med. 335(14): p. 99-107.
6. Takamatsu J., Yoshida S., Yokozawa T., Kirai K., Kuma K., Ohsawa N., and
Hosyoa T. (1998) Thyro. 8(12): p. 1101-1105.
7. Ng H.P. and Kung A.W.C. (2006) Endocrin. 147(6): p. 3085-3092.
8. Estienne V., Duthoit C., Vinet L., Durand-Gorde J.M., Carayon P., and Ruf J.
(1998) J. Biol.. Chem. 273(4): p. 8056-8062.
9. Ashley R.L., Militoni J., Lee F., Nahmias A., and Corey L. (1988) J. Clin.
Microbiol. 26(4): p. 662-667.
10. Brown J.P, Wright P.W., Hart C.E., Woodbury R.G., Hellstrom K.E., and H. I.
(1980) J. Biol. Chem. 255(11): p. 4980-4988.
11. Hirst G. K. (1942) J. Exp. Med. 75(1): p. 49-64.

79 of 82
12. Rizzetto M., Canese M. G., Arico S., Crivelli O., Trepo C., Bonino F., and Verme
G. (1977) GUT 18(12): p. 997-1003.
13. Schalch D. S. and Parker M. L. (1964) Nature. 203(495): p. 1141-1145.
14. Gonzales-Buitrago J.M. and Gonzales C. (2006) Clin. Chim. Act. 365(50-57).
15. Yalow R.S. and Berson S.A. (1960) J. Clin. Invest. 39(7): p. 1157-1175.
16. Hales C.N. and Randle P.J. (1960) Biochem. J. 88(1): p. 137-88.
17. Engvall E. and Perlmann P. (1971) Immunochem. 8: p. 871-874.
18. Engvall E. and Perlmann P. (1972) J. Immunol. 109: p. 129-135.
19. Voller A., Bartlett A., and Bidwell D.E. (1978) J. Clin. Pathol. 31: p. 507-520.
20. Booth J.C., Hannington G., Aziz T.A.G., and Stern H. (1979) J. Clin. Pathol..
32(2): p. 122-127.
21. Sarov I., Andersen P., and Andersen H.K. (1980) Acta. Pathologica. Et.
Microbiologica. Scandinavica. Section B-Microbiology. 88(1): p. 1-9.
22. Sundqvist V.A. and Wahren B. (1981) J. Virol. Methods. 2(5): p. 301-312.
23. Walls K. W., Bullock S. L., and English D. K. (1977) J. Clin. Microbiol. 5(3): p.
273-277.
24. Carlier Y., Bout D., Dessaint J. P., Capron A., Vanknapen F., Ruitenberg E. J.,
Bergquist R., and Huldt G. (1980) Bulletin. World. Health. Organization. 58(1):
p. 99-105.
25. Johnson, A.M., H. Roberts, and A.M. Tenter (1992) J. Med. Microbiol.. 37(6): p.
404-409.
26. Duermeyer W. and Vanderveen J. (1978) Lancet. 2(8091): p. 684-685.
27. Duermeyer W., Vanderveen J., and Koster B. (1978) Lancet. (8068): p. 823-824.
28. Vandervelde E. M. (1978) J. Med. Virol. 3(1): p. 17-18.

80 of 82
29. Dickson J. D. and Peutherer J. F. (1981) Med. Lab. Sci. 38(4): p. 413-414.
30. Usuda S., Okamoto H., Iwanari H., Baba K., Tsuda F., Miyakawa Y., and
Mayumi M. (1999) J. Virol. Met. 80(1): p. 97-112.
31. Willems F.T.C. and Klaassendekort C.C.M. (1978) Lancet. 1(8071): p. 994-995.
32. Faith A., Pontesilli O., Panayi G. S., Kalsi J. S., and Johns P. (1981) An. Rheumat.
Dis. 40(2): p. 201-201.
33. Meghlaoui A., Herbage D., Huc A., and Monier J. C. (1981) Annales. D.
Immunologie. C132(3): p. 287-305.
34. Paz E., Adawi M., Lavi I., Mussel Y., and Mader R. (2007) Rheumat. Internatl.
27(10): p. 941-945.
35. Fenger M., Wiik A., Hoier-Madsen M., Lykkegaard J.J., Rozenfeld T., Hansen
M.S., Samsoe B.D., and Jacobsen S. (2004) Clin. Chem. 50(11): p. 2141-2147.
36. Gniewek R. A., Stites D. P., McHugh T. M., Hilton J. F., and Nakagawa M.
(1997) Clin. Diagn. Lab. Immunol. 4(2): p. 185-188.
37. Weber B., Fall E.H.M., Berger A., and Doerr H.W. (1998) J. Clin. Microbiol.
36(8): p. 2235-2239.
38. Bhardwaj D., Bhatt S., Khamar B. M., Modi R. I., and Ghosh P. K. (2006) Curr.
Sci. 91(7): p. 913-917.
39. Tehe A., Maurice C., Hanson D. L., Borget M. Y., Abiola N., Maran M., Yavo
D., Tomasik Z., and Boni J. (2006) J. Clin. Virol. 37(3): p. 199-205.
40. Sanchez A., Gemrot F., and Castro J. M. D. (2008) J. Immunolog. Meth. 332(1-2):
p. 53-60.
41. Haubruck H., Mauch L., Cook N.J., Steffens U., Hunt N., Berthold H., Niemann
H., Wiebelauer C., and Northemann W. (1993) Autoimmun. 15: p. 275-284.

81 of 82
42. Kaufman K. D., Rapoport B., SetoP., Chazenbalk G. D., and Magnusson R. P.
(1989) J. Clin. Invest. 84(2): p. 394-403.
43. Laurberg P., Pederson K.M., Vittinghus E., and Ekelund S. (1992) Scand. J. Clin.
Lab. Invest. 52: p. 663-669.
44. Bresson D., Rebuffat S.A., Nguyen B., Banga J.P., Gradas A., and Peraldi-Roux
S. (2005) Endocrin. 14(6): p. 2834-2844.
45. Gardas A., Sohi M.K., Sutton B.J., McGregor A.M., and Banga J.P. (1997)
Biochem. Biophys. Res. Commun. 234: p. 366-370.
46. Gardas A., Leweartowska A., Sutton B.J., Pasieka Z., McGregor A.M., and Banga
J.P. (1997) J. Clin. Endocrinol. Metab. 82(11): p. 3752-3755.
47. Coval M.L. and Taurog A. (1967) J. Biol. Chem. 242(23): p. 5510-5523.
48. Hosoya T. and Morrison M. (2008) J. Biol. Chem. 242: p. 2828-2836.
49. Guo J., Xin-Min Y., McLachlan S.M., and Rapoport B. (2001) J. Immunol.
166(2): p. 1327-1333.
50. Portolano S., Chazenbalk G.D., Seto P., Hutchinson J.S., Rapoport B., and
McLachlan S.M. (1992) J. Clin. Invest. 90: p. 720-726.
51. Pratt M.A.C., Eggo M.C., Taurog A., Carayon P., and Burrow G.N. (1987)
Annales. D. Endocrinologie. 48(2): p. 145-145.
52. Kimura S., Kotani T, and Mcbride O.W. (1987) Proc. Natl. Acad. Sci. U.S.A. 84:
p. 5555-5559.
53. McLachlan S.M. and Rapoport B. (1992) Endocrin. Rev. 13: p. 192-203.
54. Josephy P.D, Elin T., and Mason D. (1982) J. Biol. Chem. 257(7): p. 3669-3675.
55. Volpe G., Compagnone D., Draisci R., and Palleschi G. (1998) Analyst 123: p.
1303-1307.

82 of 82
56. Rebuffat S.A., Bresson D., Nguyen B., and Peraldi-Roux S.A. (2006) Int.
Immunol.. 18(7): p. 1091-1099.
57. Robinson N.C. and Tanford C. (1975) Biochem. 14(2): p. 369-377.
58. Murata Y., Suglhara G., Fukushlma K., Tanaka M., and Matsushlta K. (1982) J.
Phys. Chem. 86: p. 4690-4694.
59. Esposito G., Giglio E., Pavel N.V., and Zanobit A. (1986) J. Phys. Chem. 91(2):
p. 356-362.
60. Coello A., Meijide F., Rodriguez-Nuänez E., and Vaäzquez-Tato J. (1995) J.
Pharm. Sci. 85(1): p. 9-15.
61. Conte G., Di Blasi R., Giglio E., Parretta A., and Pavelt N.V. (1984) J. Phys.
Chem. 88(23): p. 5720-5724.
62. Matsuoka K. and Moroi Y. (2002) Biochim. Biophys. Acta. 1580: p. 189-199.