the opportunities and economics of direct potable reuse...water and wastewater agencies, and other...
TRANSCRIPT

TThhee OOppppoorrttuunniittiieess aanndd EEccoonnoommiiccss ooff DDiirreecctt PPoottaabbllee RReeuussee
WWaatteeRReeuussee RReesseeaarrcchh FFoouunnddaattiioonn


The Opportunities and Economics of
Direct Potable Reuse

About the WateReuse Research Foundation
The mission of the WateReuse Research Foundation is to conduct and promote applied research on the reclamation, recycling, reuse, and desalination of water. The Foundation’s research advances the science of water reuse and supports communities across the United States and abroad in their efforts to create new sources of high-quality water through reclamation, recycling, reuse, and desalination while protecting public health and the environment.
The Foundation sponsors research on all aspects of water reuse, including emerging chemical contaminants, microbiological agents, treatment technologies, salinity management and desalination, public perception and acceptance, economics, and marketing. The Foundation’s research informs the public of the safety of reclaimed water and provides water professionals with the tools and knowledge to meet their commitment of increasing reliability and quality.
The Foundation’s funding partners include the Bureau of Reclamation, the California State Water Resources Control Board, the California Energy Commission, and the California Department of Water Resources. Funding is also provided by the Foundation’s Subscribers, water and wastewater agencies, and other interested organizations.

The Opportunities and Economics
of Direct Potable Reuse
Robert S. Raucher, Ph.D., Principal Investigator Stratus Consulting Inc. George Tchobanoglous, Ph.D., Principal Investigator University of California, Davis Cosponsors WateReuse California
WateReuse Research Foundation Alexandria, VA

Disclaimer
This report was sponsored by the WateReuse Research Foundation. The Foundation, its Board Members, and the project cosponsors assume no responsibility for the content of this publication or for the opinions or statements of facts expressed in the report. The mention of trade names of commercial products does not represent or imply the approval or endorsement of the WateReuse Research Foundation, its Board Members, or the cosponsors. This report is published solely for informational purposes.
For more information, contact:
WateReuse Research Foundation 1199 North Fairfax Street, Suite 410 Alexandria, VA 22314 703-548-0880 703-548-5085 (fax) www.WateReuse.org/Foundation
© Copyright 2014 by the WateReuse Research Foundation. All rights reserved. Permission to reproduce must be obtained from the WateReuse Research Foundation.
WateReuse Research Foundation Project Number: WRRF-14-08 WateReuse Research Foundation Product Number: 14-08-1
ISBN: 978-1-941242-17-9 Library of Congress Control Number: 2014956524
Printed in the United States of America
Printed on Recycled Paper

WateReuse Research Foundation v
Table of Contents
List of Figures ......................................................................................................................... vii
List of Tables ......................................................................................................................... viii
Acronyms and Abbreviations ................................................................................................... ix
Foreword ................................................................................................................................... xi
Acknowledgments .................................................................................................................. xii
Executive Summary ............................................................................................................... xiii
Chapter 1. Introduction ........................................................................................................... 1
1.1 Scope of White Paper ....................................................................................................... 1
1.2 Organization of White Paper ............................................................................................ 1
Chapter 2. Potable Reuse: Definitions and Examples .......................................................... 3
2.1 DPR ................................................................................................................................. 3
2.2 IPR ................................................................................................................................. 3
2.3 Examples of Past and Current DPR and IPR Projects ..................................................... 5
Chapter 3. DPR Treatment Processes .................................................................................... 7
3.1 Benchmark CAT Process ................................................................................................. 7
3.2 Alternative Technologies ................................................................................................. 7
3.3 Regulatory Requirements of DPR .................................................................................. 10
3.3.1. Pathogenic Microorganisms .............................................................................. 10
3.3.2. A Third Water Source ....................................................................................... 10
3.3.3. Regulatory Monitoring ...................................................................................... 11
3.4 Brine Management ......................................................................................................... 11
3.4.1. Brine Disposal Options ..................................................................................... 11
3.4.2. Brine Treatment Options ................................................................................... 13
Chapter 4. Cost and Energy Usage of DPR ......................................................................... 15
4.1 Cost of CAT ................................................................................................................... 15
4.1.1. Sources of Information ...................................................................................... 15
4.1.2. Treatment Technologies Included in the CAT Process ..................................... 15
4.1.3. Treatment Costs Based on OCWD CAT Facilities ........................................... 15
4.1.4. Cost of CAT Facilities at Other Locations ........................................................ 17
4.1.5. Summary ........................................................................................................... 17
4.2 Cost of Conveyance ....................................................................................................... 17
4.3 Cost of Brine Management ............................................................................................ 17
4.4 Total Cost of DPR .......................................................................................................... 18
4.5 Energy Usage for DPR ................................................................................................... 18
4.5.1. Energy Required for CAT ................................................................................. 18
4.5.2. Energy Required for Conveyance ..................................................................... 20

vi WateReuse Research Foundation
4.5.3. Energy Required for Brine Management .......................................................... 20
Chapter 5. Comparison of the Cost of DPR with the Costs of Alternative Water Supplies ................................................................................................... 23
5.1 Limitations of Cost Information .................................................................................... 23
5.2 Comparative Costs of Alternative New Water Supply Options .................................... 23
Chapter 6. Relative Carbon Footprint of Potable Reuse and of Its Alternatives ............ 27
6.1 Potable Reuse ................................................................................................................ 27
6.2 Desalination ................................................................................................................... 28
6.3 Imported Water .............................................................................................................. 29
6.4 Summary ....................................................................................................................... 29
Chapter 7. Direct and Comparative Benefits of DPR ........................................................ 31
7.1 Direct Benefits of Implementing Potable Reuse ............................................................ 31
7.1.1. Public Water Supply Benefits ........................................................................... 31
7.1.2. Agriculture Benefits ......................................................................................... 31
7.1.3. Environmental Benefits .................................................................................... 31
7.1.4. Energy Conservation Benefits .......................................................................... 32
7.1.5. Cost Savings ..................................................................................................... 32
7.2 Comparative Benefits of Implementing Potable Reuse ................................................. 32
7.2.1. Comparative Benefits of Potable Reuse Relative to Imported Waters ............. 32
7.2.2. Comparative Benefits of Potable Reuse Relative to Desalination .................... 33
7.2.3. Comparative Benefits of Potable Reuse Relative to Conservation and Curtailments ..................................................................................................... 34
7.2.4. Comparative Benefits of Potable Reuse Relative to NPR ................................ 35
7.2.5. Comparative Benefits of DPR Relative to IPR ................................................. 35
7.2.6. Summary ........................................................................................................... 36
Chapter 8. Potential New Water from DPR and IPR in California ................................. 37
8.1 Water Quantities Discharged to Surface Waters or to the Ocean in 2020 ..................... 37
8.1.1. Current and Future Population Projections by State Board Region ................. 37
8.1.2. Number of People Served by On-site and Centralized Collection Systems in Each State Board Region .............................................................................. 39
8.1.3. Amount of Wastewater Discharged to Centralized Collection Systems in Each State Board Region .................................................................................. 39
8.1.4. Potential Amount of Water Available for Reuse Applications Including DPR and IPR .................................................................................................... 40
8.2 Potential Amount of Water Available for Potable Use .................................................. 41
References .............................................................................................................................. 43
Appendix A. Population Served by Centralized Collection and On-site Systems by SWRCB Region ......................................................................................... 47

WateReuse Research Foundation vii
Figures
2.1 Proposed flow diagrams for DPR: (a) with engineered buffer and (b) without engineered buffer ........................................................................................... 4
2.2 Proposed flow diagrams for IPR: (a) with groundwater aquifer as an environmental buffer and (b) with surface water storage reservoir as an environmental buffer ........................................................................................................ 4
3.1 Proposed flow diagram for a CAT process ...................................................................... 8
3.2 Water reclamation process flow diagram at the Goreangab Water Reclamation Plant in Windhoek, Namibia ............................................................................................ 9
3.3 Ultimate disposal options for concentrated and unconcentrated brine solutions ........... 12

viii WateReuse Research Foundation
Tables
2.1 Examples of DPR and IPR Projects ................................................................................. 5
3.1 Summary of Treatment Technologies Employed for CAT Water Purification ............... 8
3.2 Log-Removal Credits of Various Treatment Processes ................................................. 11
3.3 Summary of Brine Disposal and Management Options ................................................ 12
3.4 Summary of Brine Processing Options .......................................................................... 13
4.1 Summary of Treatment Technologies Employed for Advanced Water Purification .................................................................................................................... 16
4.2 Cost of CAT for IPR and DPR without Conveyance and Brine Management Costs .............................................................................................................................. 16
4.3 Estimated Costs of Selected Brine Disposal Options .................................................... 18
4.4 Typical Energy Requirements for Various Treatment Process Technologies Used for Advanced Treatment ....................................................................................... 19
4.5 Typical Energy Usage for Water, Wastewater, and CAT Systems ............................... 20
5.1 Comparative Costs of Potable Reuse and Alternative New Supply Options ................. 24
6.1 Comparative Energy Requirements for Alternative Sources of Water .......................... 28
8.1 Estimated and Projected Population of California ......................................................... 38
8.2 Estimated Summary Demographic Information for 2020 for California by SWRCB Region ............................................................................................................. 38
8.3 Current and Projected Municipal Water Use Quantities in the United States ............... 39
8.4 Estimated Amount of Water Discharged to Wastewater Collection Systems in 2020 by SWRCB Region ........................................................................................... 40
8.5 Estimated Amount of Treated Wastewater Potentially Available in 2020 for Reuse by SWRCB Region ............................................................................................. 41
8.6 Estimated Amount of Treated Wastewater Potentially Available in 2020 for Reuse by DPR and/or IPR by SWRCB Region ............................................................. 42

WateReuse Research Foundation ix
Acronyms and Abbreviations
BAC biologically active carbon
CAT complete advanced treatment
CDPH California Department of Public Health (all recycled and nearly all drinking water regulatory responsibilities were transferred from the CDPH to the California State Water Resources Control Board on July 1, 2014)
Cl2 free chlorine
CO2 carbon dioxide
CWTRC California Wastewater Training and Research Center
DDW Division of Drinking Water (California’s State Water Resources Control Board)
DPR direct potable reuse
ECLSS Environmental Control and Life Support System
GHG greenhouse gas
GWRS Groundwater Replenishment System
H2O2 hydrogen peroxide
IPR indirect potable reuse
ISS International Space Station
MWD Metropolitan Water District of Southern California
NASA National Aeronautics and Space Administration
NPR nonpotable reuse
O3 ozone
OCWD Orange County Water District
O&M operating and maintenance
SWP State Water Project
SWRCB State Water Resources Control Board (California)
TDS total dissolved solids
U.S. EPA United States Environmental Protection Agency
UV ultraviolet
ZLD zero liquid discharge
Abbreviations for Units of Measure
A acre; 43,560 ft2 [(5280 ft/mi2)/(640 ac/mi2)]
AF acre-foot (325,850 gallons)
AF/y acre-foot per year (also referred to as “AFY”)
ft3/s cubic foot per second
gal/capita•d gallons per capita per day
kg CO2e/AF kilogram carbon dioxide equivalent per acre-foot

x WateReuse Research Foundation
kg CO2e/kWh kilogram carbon dioxide equivalent per kilowatt hour
kWh kilowatt hour
kWh/AF kilowatt hour per acre-foot
kWh/m3 kilowatt hour per cubic meter
kWh/103 gal kilowatt hour per thousand gallons
lb/ft3 pounds per cubic foot
MAF/y million acre-feet per year
mg/L milligram per liter
Mgal/d million gallons per day
MT metric tonne
MT CO2e/AF metric tonne carbon dioxide equivalent per acre-foot
tonne metric tonne (1000 kg)
µm micrometer

WateReuse Research Foundation xi
Foreword
The WateReuse Research Foundation, a nonprofit corporation, sponsors research that advances the science of water reclamation, recycling, reuse, and desalination. The Foundation funds projects that meet the water reuse and desalination research needs of water and wastewater agencies and the public. The goal of the Foundation’s research is to ensure that water reuse and desalination projects provide sustainable sources of high-quality water, protect public health, and improve the environment.
An Operating Plan guides the Foundation’s research program. Under the plan, a research agenda of high-priority topics is maintained. The agenda is developed in cooperation with the water reuse and desalination communities including water professionals, academics, and Foundation subscribers. The Foundation’s research focuses on a broad range of water reuse and desalination research topics including
Defining and addressing emerging contaminants, including chemicals and pathogens
Determining effective and efficient treatment technologies to create “fit for purpose” water
Understanding public perceptions and increasing acceptance of water reuse
Enhancing management practices related to direct and indirect potable reuse
Managing concentrate resulting from desalination and potable reuse operations
Demonstrating the feasibility and safety of direct potable reuse (DPR)
The Operating Plan outlines the role of the Foundation’s Research Advisory Committee (RAC), Project Advisory Committees (PACs), and Foundation staff. The RAC sets priorities, recommends projects for funding, and provides advice and recommendations on the Foundation’s research agenda and other related efforts. PACs are convened for each project to provide technical review and oversight. The Foundation’s RAC and PACs consist of experts in their fields and provide the Foundation with an independent review, which ensures the credibility of the Foundation’s research results. The Foundation’s Project Managers facilitate the efforts of the RAC and PACs and provide overall management of projects.
Prolonged and severe droughts and other factors have made water supplies increasingly scarce in California, Texas, and many other regions of the United States, as well as elsewhere around the globe. Based on these conditions, there is a clear need to more effectively tap our water resources to provide reliable high-quality potable supplies to our communities. In this context, there is considerable interest in water recycling in general and in potable reuse in particular. This White Paper provides basic information about potable reuse, with a focus on California and the potential value offered by DPR. DPR offers many advantages—including carbon footprint, yields, and costs—compared with the other alternatives available to provide new sources to community water-supply portfolios. Richard Nagel Chair WateReuse Research Foundation
Melissa Meeker Executive Director WateReuse Research Foundation

xii WateReuse Research Foundation
Acknowledgments
This project was funded by the WateReuse Research Foundation in cooperation with WateReuse California.
The authors greatly appreciate the informative data, insights, and time provided by several individuals, including utility-specific input furnished by Mike Markus, Orange County Water District (OCWD); Amy Dorman and Marsi Steirer, City of San Diego; and Jeannine Larabee and Hossein Ashktorab, Santa Clara Valley Water District. The guidance and input from the following individuals is acknowledged gratefully: the WateReuse Research Foundation’s Project Manager, Justin Mattingly, and PAC members Mike Markus, OCWD; Wade Miller, Water Strategies Consultant; Doug Owen, ARCADIS; Tom Richardson, RMC Water and Environment; and Dave Smith, Merritt-Smith Consulting. Thank you.
Principal Investigators Robert S Raucher PhD, Stratus Consulting Inc. George Tchobanoglous, PhD, University of California, Davis
Project Advisory Committee Mike Markus, OCWD Wade Miller, Water Strategies Consultant Doug Owen, ARCADIS Tom Richardson, RMC Water and Environment Dave Smith, Merritt-Smith Consulting
WateReuse Research Foundation xiii
Executive Summary
Prolonged and severe droughts and other factors have made water supplies increasingly scarce in California, Texas, and many other regions of the United States, as well as elsewhere around the globe. Based on these conditions, there is a clear need to more effectively tap our water resources to provide reliable high-quality potable supplies to our communities. In this context, there is considerable interest in water recycling in general and potable reuse in particular. This White Paper provides basic information about potable reuse, with a focus on California and the potential value offered by direct potable reuse.
S.1 What is Potable Reuse?
Potable reuse may be characterized as either indirect potable reuse (IPR) or direct potable reuse (DPR). In IPR, wastewater that has been highly purified by complete advanced treatment (CAT) is introduced into an environmental buffer for a specified period of time before being withdrawn for potable purposes. The environmental buffer may be a groundwater aquifer or a surface water reservoir. The purpose of the environmental buffer is to provide an additional barrier for the protection of public health. For example, the Division of Drinking Water (DDW) of California’s State Water Resources Control Board (SWRCB) allows one-log of virus removal credit for each month the purified water remains in the aquifer.
In DPR, purified wastewater from a CAT facility is introduced into the raw water supply feeding a water treatment plant (or directly into a potable water supply distribution system, “downstream” of a water treatment plant) with or without the use of an engineered buffer. The purpose of the engineered buffer is to provide sufficient volumetric capacity to retain purified water for a specified period of time to allow for the measurement and reporting of specific water quality parameters, to be assured that the water provided meets all applicable water quality standards prior to being introduced into the potable water system. In most situations, the storage capacity of the transmission line used to transport the purified recycled water to a water treatment plant will provide sufficient retention time to make any needed interventions.
Both IPR and DPR have been used successfully in many locations. IPR is applied in California and other places, and DPR has been used safely and reliably in Windhoek, Namibia for more than 40 years and is now being implemented in Texas and elsewhere. These existing potable reuse projects are important because the treatment technologies employed have been accepted by various regulatory authorities as being able to reliably produce safe potable drinking water, and the implementation of these projects has been accepted by the public.
S.2 How Much Potable Water Can Reuse Provide?
In California, there is a considerable quantity of highly treated wastewater that is discharged to the ocean or to inland waterways. A significant portion of water discharged to the ocean could be utilized to create potable supplies. It is estimated, using available data and information, that more than 2300 Mgal/d—which amounts to 2.6 MAF/y—may be available in California for new water recycling projects in 2020. This source water, after receiving

xiv WateReuse Research Foundation
CAT, could yield more than 1000 Mgal/d (or more than 1.1 MAF/y) of potable supplies. To place this into context, 1.1 MAF/y is sufficient potable water to supply all municipal needs (including commercial and industrial uses) for more than 8 million Californians, or roughly one-fifth of the state’s projected population for 2020.
S.3 Are Proven Technologies Available to Safely and Reliably Provide Potable Reuse?
The individual technologies and their performances in the sequenced combination of a CAT process for potable reuse applications are well established as reliable and safe (e.g., a process flow that combines micro or ultrafiltration, cartridge filtration, reverse osmosis, and advanced oxidation, amongst other treatment components). For example, the Groundwater Replenishment System (GWRS) CAT water purification facility operated by the Orange County Water District (OCWD) has proven to be the standard against which other treatment technologies and process flow diagrams for DPR and/or IPR are compared. In operation since 2008, a number of proven technologies have been integrated in the process (as detailed in Chapter 3). Because the purified water from OCWD’s GWRS meets or exceeds all potable drinking water standards and because all unregulated chemicals known or suspected to be of health concern are reduced to non-measurable or de minimis levels, the water is considered to be safe for direct human consumption (Burris, 2010).
S.4 What Does Potable Reuse Cost?
The cost of potable reuse depends considerably on many site-specific factors but is expected to be on the order of $820 to $2000/AF (about $2.52/1000 gal at the low end and up to $6.14/1000 gal), which includes about $700/AF for CAT and $120/AF for conveyance at the low end of the cost range. The lower end cost estimate is based on actual experience at the OCWD GWRS, using the CAT processes that typically are expected to be deployed for DPR and IPR projects. The upper end reflects treatment plus a relatively expensive conveyance expense for pipeline construction and operation for an IPR system as well as brine management costs. It is important to note that the cost of CAT for either DPR or IPR will be about the same but that conveyance and brine management costs will be site-specific.
Potable reuse is generally less expensive than—or comparable in cost to—the potential alternative sources of new water supply available to California communities. For example, in San Diego, seawater desalination delivered from the Carlsbad facility is slated to cost $2080 to $2330/AF in 2014 dollars (about $6.38 to $7.15/1000 gal), and the West Basin Municipal Water District estimates that seawater desalination will cost between about $1500 to $2000/AF, depending on facility design, phasing, and sizing options. Treated imported water currently costs residential customers about $1300/AF ($4.00/1000 gal) and also adversely impacts the Bay Delta ecosystem, requires considerable pumping energy, conveys salt loads to the region, provides a far less reliable yield compared with potable reuse (as imported waters are vulnerable to drought, seismic risks, and legal constraints), and continues to experience considerable cost escalations over time.

WateReuse Research Foundation xv
S.5 How Does Potable Reuse Compare with Other New Water Supply Alternatives?
An overview of how DPR and IPR compare to each other and to other potential sources of new water supplies for California residents is provided in Table S.1. Most of the new water supply alternatives share similar characteristics in terms of treatment technologies used, cost, energy requirements, and related environmental concerns. However, potable reuse (and especially DPR) provides many important advantages compared with these alternatives.
S.6 What Are the Advantages of DPR Relative to IPR?
DPR is a technically feasible option in virtually any location, whereas IPR requires access to a suitable environmental buffer—meaning the availability of either a surface water reservoir or aquifer system in which to store, blend, and extract the water. The need for an environmental buffer renders IPR infeasible for many communities because there are many locations in which a suitable surface water or groundwater buffer system is not available. Further, the relative proximity of treatment to the IPR or DPR application affects conveyance, which can significantly impact costs. DPR may provide the opportunity to reduce conveyance costs in some instances.
S.7 Conclusion
Potable reuse, via IPR or DPR, is a feasible and proven approach for providing safe, reliable yields of drinking water to meet community needs, independent of climate conditions. The treatment technologies associated with CAT are well established, and there is a considerable volume of potable water that can be produced in California through expanded recycling. In addition, potable reuse compares favorably with other new water supply alternatives in terms of cost, energy requirements, environmental considerations, and reliability. Adding DPR to the water supply mix for California will enable many communities to tap into potable reuse where IPR is not feasible (because of the lack of suitable surface reservoir or aquifer storage) and may save many communities on cost and energy requirements as well.

xvi
Wat
eReu
se R
ese
arch
Fou
nda
tion
Tab
le S
.1. O
verv
iew
of
DP
R a
nd
Oth
er A
vail
able
Wat
er S
up
ply
Alt
ern
ativ
es
SU
PP
LY
O
PT
ION
C
ost
($/A
F)a
Op
por
tun
itie
s an
d V
alu
es
Cha
llen
ges
and
Con
stra
ints
DP
R
820–
2000
P
rovi
des
extr
emel
y hi
gh-q
ualit
y po
tabl
e w
ater
sui
tabl
e fo
r al
l use
s. P
rovi
des
relia
ble,
dro
ught
-res
ista
nt y
ield
s.
Rel
ies
on p
rove
n te
chno
logi
es w
idel
y us
ed in
the
Uni
ted
Sta
tes
and
else
whe
re. R
educ
es d
isch
arge
of
effl
uent
to r
ecei
ving
wat
ers.
Use
s ex
isti
ng w
ater
di
stri
buti
on in
fras
truc
ture
, onc
e re
turn
ed to
the
wat
er
supp
ly s
yste
m.
Req
uire
s ad
ditio
nal m
onito
ring
and
(in
som
e ca
ses)
an
adde
d tr
eatm
ent b
arri
er (
e.g.
, dis
infe
ctio
n) to
pro
vide
fai
l-sa
fe q
uali
ty
assu
ranc
e (c
ompa
red
to I
PR
). T
he u
se o
f an
eng
inee
red
buff
er (
e.g.
, st
orag
e) m
ay b
e re
quir
ed to
pro
vide
suf
fici
ent t
ime
for
mon
itori
ng
and
qual
ity a
ssur
ance
.
IPR
82
0–20
00
Env
iron
men
tal b
uffe
r (s
uita
ble
rese
rvoi
r or
aqu
ifer
) no
t ava
ilabl
e in
m
any
loca
tions
. Ris
k of
con
tam
inat
ion
or w
ater
rig
hts
disp
utes
with
in
the
envi
ronm
enta
l buf
fer.
Cos
t to
mon
itor
and
man
age
the
buff
er.
May
req
uire
mor
e pi
pe a
nd p
umpi
ng (
and
ener
gy u
se)
than
DP
R.
Sea
wat
er
Des
alin
atio
n
1500
–233
0 P
rovi
des
high
-qua
lity
pota
ble
supp
ly (
afte
r bl
endi
ng
and/
or c
hem
ical
add
itio
n). O
ffer
s cl
imat
e-re
sist
ant
yiel
ds. S
ourc
e w
ater
s (s
eaw
ater
) ar
e vi
rtua
lly
unlim
ited
in a
vaila
bilit
y al
ong
coas
tal a
reas
.
Pot
entia
l env
iron
men
tal i
mpa
cts
asso
ciat
ed w
ith in
take
s, b
rine
di
scha
rges
, and
nea
r-sh
ore
faci
litie
s. R
elat
ivel
y hi
gh e
nerg
y de
man
ds. A
cces
sibl
e on
ly a
t coa
stal
loca
tions
. Vul
nera
ble
to r
ed
tides
and
sea
leve
l ris
e. A
lso,
the
perm
ittin
g pr
oces
s is
com
plex
.
Bra
ckis
h
Gro
und
wat
er
Des
alin
atio
n
930–
1290
P
rovi
des
high
-qua
lity
pota
ble
supp
ly (
afte
r bl
endi
ng
and/
or c
hem
ical
add
itio
n). O
ffer
s cl
imat
e re
sist
ant
yiel
ds in
mos
t loc
atio
ns w
ith a
cces
s to
bra
ckis
h gr
ound
wat
er.
Ava
ilab
le o
nly
at lo
cati
ons
wit
h ac
cess
to b
rack
ish
aqui
fers
. C
onsi
dera
ble
regu
lato
ry c
hall
enge
s as
soci
ated
wit
h co
ncen
trat
e (b
rine
) m
anag
emen
t (un
less
a b
rine
line
is lo
cally
ava
ilabl
e fo
r co
asta
l dis
char
ge).
Imp
orte
d
Wat
er [
e.g.
, S
tate
Wat
er
Pro
ject
(S
WP
)]
850–
1300
E
xist
ing
infr
astr
uctu
re a
nd in
stit
utio
ns a
re in
pla
ce to
go
vern
and
del
iver
wat
er, a
s av
aila
ble.
Y
ield
s ar
e hi
ghly
unc
erta
in a
nd v
aria
ble
and
are
subj
ect t
o se
vera
l po
ssib
le d
isru
ptio
ns (
e.g.
, dro
ught
, sei
smic
eve
nt, l
itiga
tion)
. Cos
ts
are
incr
easi
ng r
apid
ly. E
nerg
y in
tens
ive
pum
ping
. Adv
erse
en
viro
nmen
tal i
mpa
cts
(e.g
., B
ay-D
elta
). I
ncre
ases
sal
t loa
ding
s to
im
port
reg
ions
.
Non
pota
ble
R
euse
(N
PR
) 31
0–19
60
Hel
ps r
educ
e de
man
ds o
n po
tabl
e sy
stem
s. P
rovi
des
relia
ble,
dro
ught
-res
ista
nt y
ield
s, m
atch
ing
wat
er
qual
ity to
use
s fo
r ag
ricu
lture
, gol
f co
urse
s, a
nd o
ther
ir
riga
tion
and
for
cool
ing
and
indu
stri
al c
usto
mer
s.
Cos
ts o
f se
para
te “
purp
le p
ipe”
net
wor
ks, u
ser
on-s
ite r
etro
fits
, and
pu
mpi
ng. S
easo
nal d
eman
ds c
reat
e st
rand
ed a
sset
s or
a n
eed
for
stor
age.
Siti
ng p
ipel
ines
in c
row
ded
righ
ts-o
f-w
ay is
bot
h di
ffic
ult
and
expe
nsiv
e. C
osts
of
som
e op
tion
s m
ay e
xcee
d th
e st
ated
ran
ge.
Wat
er U
se
Eff
icie
ncy
, C
onse
rvat
ion
, an
d U
se
Res
tric
tion
s
465–
980
Hel
ps r
educ
e ov
eral
l wat
er d
eman
ds (
or h
elps
man
age
shor
tage
s). R
educ
es e
nerg
y us
ed to
trea
t and
pum
p w
ater
. Add
ition
al e
nerg
y sa
ving
s w
here
less
hot
wat
er
is u
sed
(e.g
., hi
gh-e
ffic
ienc
y cl
othe
s w
ashe
rs).
Lon
g-st
andi
ng w
ater
use
eff
icie
ncy
and
cons
erva
tion
prog
ram
s ha
ve
“har
dene
d” d
eman
d in
mos
t loc
atio
ns, l
imit
ing
oppo
rtun
ities
for
ad
diti
onal
, cos
t-ef
fect
ive
wat
er s
avin
gs. R
estr
icti
ons
may
adv
erse
ly
impa
ct lo
cal b
usin
esse
s, p
rope
rty
valu
es, a
nd c
omm
unity
am
eniti
es
and
may
hav
e ne
gativ
e im
pact
s on
was
tew
ater
col
lect
ion
syst
ems.
C
osts
sho
wn
do n
ot r
efle
ct c
osts
bor
ne b
y cu
stom
ers.
Not
e: a B
asis
and
cit
atio
ns
for
cost
-ran
ge e
stim
ates
are
pro
vide
d in
Ch
apte
r 5,
ref
lect
ing
2014
U.S
. dol
lars
, un
less
oth
erw
ise
ind
icat
ed.

WateReuse Research Foundation 1
Chapter 1
Introduction
Water shortages, the limitations of current water supplies, the impacts of climate change, and new legal definitions of water and water rights are motivating water agencies to expand and secure their water portfolios. Included in the mix of water supply sources being considered are indirect potable reuse (IPR) and direct potable reuse (DPR). To assist water agencies, the WateReuse Association, the WateReuse Research Foundation, and WateReuse California have provided leadership by sponsoring a combination of research, advocacy, and education and outreach in IPR and DPR. However, a number of questions have arisen that demand answers. For example, how much will DPR cost versus other sources of water? What is the carbon footprint of DPR, and how much new water could be made available through DPR in California? To answer these questions, the WateReuse Research Foundation commissioned the preparation of this “White Paper.”
1.1. Scope of White Paper
The scope of this White Paper is as follows:
1. Estimate the capital costs, operation and maintenance costs, and energy requirements of DPR
2. Compare the estimated costs and energy requirements of DPR and of other sources of water
3. Assess the potential cost savings associated with DPR as an alternative water supply source
4. Estimate the total volume of “new water” that could be generated from DPR in California
5. Summarize in a final report the benefits and costs of fully exploiting DPR
6. Prepare a paper for publication in WateReuse’s journal and in a peer-reviewed journal
1.2. Organization of White Paper
The white paper is organized into the following chapters:
1. Introduction
2. Potable Reuse: Definitions and Examples
3. DPR Treatment Processes
4. Cost and Energy Usage of DPR
5. Comparison of the Cost of DPR with the Costs of Alternative Water Supplies
6. Relative Carbon Footprint of Potable Reuse and of Its Alternatives
7. Direct and Comparative Benefits of DPR
8. Potential New Water From DPR and IPR in California

2 WateReuse Research Foundation
Definitions of DPR and IPR are presented and discussed in Chapter 2. The benchmark DPR treatment process to be used in the economic assessment is described in Chapter 3. The cost and energy required for DPR is documented in Chapter 4. Cost comparisons with other water sources are considered in Chapter 5. The energy requirements and carbon footprints of potable reuse and of other water sources are reviewed in Chapter 6. The direct and comparative benefits of DPR are examined in Chapter 7. The amount of new water that could be made available in California is discussed in Chapter 8. References cited in this White Paper are presented following Chapter 8.

WateReuse Research Foundation 3
Chapter 2
Potable Reuse: Definitions and Examples
The two different forms of potable reuse—direct potable reuse (DPR) and indirect potable reuse (IPR)—are introduced in this chapter along with some examples. Details of the required treatment technologies are presented in Chapter 3. The cost of potable reuse is considered in Chapter 4. Cost comparisons with other sources of water are presented in Chapter 5.
2.1. DPR
In DPR, purified water from a complete advanced treatment (CAT) facility, as illustrated in Figure 2.1, is introduced, with or without the use of an engineered buffer, either into the raw water supply immediately upstream of a water treatment plant or directly into a potable water supply distribution system, downstream of a water treatment plant.
In Figure 2.1a, an engineered storage buffer is included before the purified water is introduced to the water treatment system. The purpose of the engineered storage buffer is to provide a water storage containment facility of sufficient volumetric capacity to retain purified water for a specified period of time to allow for the measurement and reporting of specific constituents, to be assured that the quality of water provided meets all applicable water-quality-related public health standards prior to being introduced into the potable water system.
The engineered storage buffer is not included in Figure 2.1b. In most situations, the storage capacity of the transmission line used to transport the purified water to a water treatment plant will provide sufficient retention time to make any needed interventions. Although the dashed line in Figures 2.1a and 2.1b is used to denote the introduction of purified water directly into the water distribution system, it is not recommended at this time to bypass the potable water treatment facility.
It is anticipated that in the future, as monitoring equipment becomes more sensitive in the measurement of critical constituents of concern, bypassing the potable water treatment facility will be possible, assuming the blending and other public health requirements can be met.
2.2. IPR
In IPR, purified water is introduced into an environmental buffer for a specified period of time before being withdrawn for potable purposes. In Figure 2.2a, the environmental buffer is a groundwater aquifer. In Figure 2.2b, a surface water storage reservoir serves as the environmental buffer. The purpose of the environmental buffer is to provide an additional barrier for the protection of public health. For example, the California SWRCB Division of Drinking Water (DDW) allows one-log of virus removal credit for each month the purified water remains in the aquifer.

4 WateReuse Research Foundation
Figure 2.1. Proposed flow diagrams for DPR: (a) with engineered buffer and (b) without engineered buffer.
Figure 2.2. Proposed flow diagrams for IPR: (a) with groundwater aquifer as an environmental buffer and (b) with surface water storage reservoir as an environmental buffer.

WateReuse Research Foundation 5
Where a surface water reservoir is used, the minimum dilution factor required by DDW is likely to be 100 to 1 during some critical period, typically during periods of water turnover within the reservoir. Alternatives to the 100-to-1 dilution requirement have also been proposed, including one option that would require additional treatment in lieu of an increased dilution factor. It must also be recognized that under some operating conditions, all of the water in the reservoir could be purified water from advanced wastewater treatment plants (i.e., virtually no inflow from surface water sources). In the situation of limited alternative inflows, volumetric and specific constituent dilution factors have very different meanings. For example, if the quality of the water in the reservoir is essentially the same as the influent purified water for a specific constituent that is being added, then there is no dilution.
2.3. Examples of Past and Current DPR and IPR Projects
Some examples of potable reuse projects that have been undertaken in the past, are currently in operation, or are under design/construction are reviewed briefly in Table 2.1. These projects are of importance because the treatment process flow diagrams and treatment technologies employed have been accepted by various regulatory authorities as being able to reliably produce safe potable water. Further, the implementation of these projects has been accepted by the public.
In 2012, the National Research Council of the National Academy of Engineering completed a comprehensive evaluation of expanding the nation's water supply through reuse of municipal wastewater (NRC, 2012). Additional details on IPR and DPR can be found in several references (Tchobanoglous and Eliassen, 1969; Asano et al., 2007; Leverenz et al., 2011; Tchobanoglous et al., 2011, 2014; ATSE, 2013; Cotruvo, 2014).

6 WateReuse Research Foundation
Table 2.1. Examples of DPR and IPR Projects
Entity
Project
Type Description
City of Windhoek, Namibia
DPR Since 1968, highly treated reclaimed water has been added to the drinking water supply system. The blending of reclaimed water with potable water takes place directly in the pipeline that feeds the potable water distribution network (see dashed line in Figure 2.1b).
Pure Cycle Corporation, Colorado
DPR The Pure Cycle Corporation developed a complete water recycling system for the production of potable drinking water in the 1970s. A number of these systems were installed in Colorado at individual homes from 1976 through 1982 (see dashed line in Figure 2.1b).
National Aeronautics and Space Administration (NASA) International Space Station (ISS)
DPR To expand the ISS crew size from three to six members, it was necessary to develop a regenerative Environmental Control and Life Support System (ECLSS). The ECLSS is comprised of the Water Recovery System and the Urine Processor Assembly (Carter, 2009). These two systems are used to produce potable water from a combination of condensate and urine collected on the ISS.
Village of Cloudcroft, New Mexico
DPR Purified wastewater will be blended with a slightly greater (51%) amount of spring water and/or well water. The blended water will then be placed into a storage reservoir (blending tank) with a detention time of about two weeks. Water from the storage reservoir will be treated in a water treatment plant before being placed into the distribution system (see Figure 2.1a), where the blending water will be added to the engineered storage buffer. Construction of the system is scheduled to be completed in the spring of 2015.
Big Spring, Texas DPR Filtered secondary effluent is treated with CAT. The purified water is blended with raw water in a transmission line. The blended water is then treated in a water treatment plant before distribution. The DPR process has been operational since the spring of 2013 (see Figure 2.1b).
OCWD Groundwater Replenishment System (GWRS), California
IPR Currently, GWRS is the largest water reclamation facility of its kind in the world that employs the latest CAT. Purified water from an advanced treatment process is infiltrated into the groundwater aquifer by means of spreading basins. Blended purified water and groundwater are pumped from the groundwater basin and serve as a water supply source for Orange County (see Figure 2.2a). The IPR process has been in operation since 2008.
San Diego, California
IPR Pending approvals and funding, a complete advanced water treatment plant and transmission pipeline will be constructed. The city’s Advanced Treatment facility will treat tertiary effluent from the North City Water Reclamation Plant, which meets current recycle requirements. The purified water will be transported with a 23 mile pipeline to San Vicente Reservoir, where it will blend with imported untreated water and will be retained for a significant period of time. The blended water from the reservoir will be sent to water treatment plants for additional treatment and distribution as potable water (see Figure 2.2b).
Source: Adapted from Tchobanoglous et al., 2011.

WateReuse Research Foundation 7
Chapter 3
DPR Treatment Processes
To assess the cost of DPR it will be necessary to select some benchmark treatment process against which comparisons can be made. The purpose of this chapter is to identify the benchmark CAT process that will be used to assess comparative costs. Topics considered include the benchmark advanced treatment process flow diagram, a brief discussion of the development of alternative technologies, the regulatory requirements for a successful DPR project, and brine management.
3.1. Benchmark CAT Process
To date in the United States, the GWRS advanced water purification facility operated by the Orange County Water District (OCWD) has proven to be the standard against which other treatment technologies and process flow diagrams for DPR and/or IPR are compared. Since it began operation in 2008, a number of proven technologies have been integrated in the process flow diagram, as illustrated in Figure 3.1. Because the purified water from OCWD’s GWRS meets or exceeds all drinking water standards and because all unregulated chemicals known or suspected to be of health concern are reduced to non-measurable or de minimis levels, the water is considered to be safe for direct human consumption (Burris, 2010). For these reasons and because the OCWD treatment process has been approved by the DDW [formally the California Department of Public Health (CDPH)], the GWRS flow diagram will be used as the benchmark for the DPR cost evaluation and comparisons. A brief description of each of the treatment components is presented in Table 3.1. Additional details on these processes may be found in Crittenden et al. (2012) and Tchobanoglous et al. (2014).
3.2. Alternative Technologies
A number of alternative treatment process flow diagrams have been considered and are currently in various stages of development, implementation, and acceptance for the production of purified water. For example, the DPR system currently in use in the City of Windhoek, Namibia (see Figure 3.2 and Table 2.1) does not use reverse osmosis. Further, the development of advanced processes that are able to remove or convert trace constituents without physical separation of constituents from the product water are of special interest, especially in inland locations where management of the residual brines is often cost prohibitive and logistically challenging (see Sections 3.4 and 4.5). Currently, the City of San Diego is evaluating the use of ozone (O3) and biologically active carbon (BAC) as a pretreatment step before the microfiltration process (see also Figure 3.1). The purpose of the evaluation program is both to assess whether the O3–BAC process can enhance the breakdown of trace organics and to improve the performance of the microfiltration or ultrafiltration membranes.
Because the thrust of this White Paper is the cost of DPR with proven treatment technologies, alternative treatment processes and systems are not considered here. The equivalency of a variety of alternative treatment trains has been evaluated in detail in a recent WateReuse Research Foundation report (Trussell et al., 2013).

8 WateReuse Research Foundation
Figure 3.1. Proposed flow diagram for a CAT process.
Notes: The proposed treatment process corresponds to the OCWD water purification treatment process; WWTP = wastewater treatment plant.

WateReuse Research Foundation 9
Table 3.1. Summary of Treatment Technologies Employed for CAT Water Purification
Treatment Option Use/Description
Secondary treatment Conventional activated sludge secondary treatment without effluent filtration.
Secondary treatment with effluent filtration
Used to remove residual suspended solids remaining in secondary effluent following gravity separation (sedimentation).
Secondary treatment with nitrogen removal and effluent filtration
Activated sludge treatment with nitrification/denitrification and effluent filtration. It has been demonstrated that the performance of the microfiltration process is enhanced with tertiary treated effluent. Flow equalization and separate treatment or elimination of return flows will further improve the performance of the advanced treatment process.
Filter screen Used to remove any large suspended solids in unfiltered secondary effluent. Filter screens are used where effluent filtration is not included in the secondary treatment process.
Flow equalization Used to eliminate diurnal flow-rate and mass loading variations and to reduce the size of downstream units. Constant flow to the advanced treatment process reduces wear and tear on equipment (e.g., development of stress cracks in equipment because of cycling) and results in improved performance.
Microfiltration Used to remove residual suspended particles by mechanical sieving. Typicalmembrane pore size ranges from 0.07 to 2.0 m.
Cartridge filtration Used to remove suspended and colloidal impurities from chemicals added toprevent scaling of the reverse osmosis membranes. Typical filter cartridge pore size ranges from 5 to 10 m.
Ultrafiltration Used to remove residual suspended particles by mechanical sieving. Typicalmembrane pore size is in the range from 0.008 to 0.2 m. Ultrafiltration is often used in place of microfiltration.
Reverse osmosis Used to remove residual colloidal and dissolved solids by means of size exclusion and solution/diffusion. Typical membrane pore size ranges from 0.0001 to 0.002 m.
Ultraviolet (UV) oxidation without and with chemical addition
UV photolysis used to destroy or alter trace constituents that cannot be oxidized completely by conventional biological treatment processes. Hydrogen peroxide (H2O2) or O3 is often added to enhance the oxidation process. UV oxidation also serves as an excellent disinfectant.
Decarbonation Used to remove (strip-out) carbon dioxide (CO2) from reverse osmosis product water. Removing the CO2 increases the pH of the product water andreduces the amount of chemical that must be added to stabilize it (see the following).
Stabilization Chemicals (typically lime) are added to stabilize the decarbonated product water with respect to its corrosive properties. A variety of indexes (e.g., Aggressiveness Index, Langelier Saturation Index) are used to assess the stability of the product water.
Engineered buffer A purposely defined, natural or constructed storage facility used for flow retention and quality assurance. Examples of such features include storage tanks and pipelines. In DPR applications (see Figure 2.1a), the buffer could involve disinfection with free chlorine (Cl2) or O3 prior to blending with other water sources at the entrance to a potable water treatment plant.
Source: Adapted in part from Tchobanoglous et al. (2014).

10 WateReuse Research Foundation
Figure 3.2. Water reclamation process flow diagram at the Goreangab Water Reclamation Plant in Windhoek, Namibia.
Source: Adapted from du Pisani (2005) and Lahnsteiner and Lempert (2005).
3.3. Regulatory Requirements of DPR
The constituents of public health concern in the purified water from an advanced treatment process may include regulated and unregulated inorganic and organic chemical constituents and pathogenic microorganisms. It is important to note, as cited previously, that the treatment process flow diagram identified in Figure 3.1 produces water that meets or exceeds all potable drinking water standards and that all unregulated chemicals known or suspected to be of health concern are reduced to non-measurable or de minimis levels. Additional details on the treatment capabilities of the benchmark CAT process may be found in a WateReuse Research Foundation report (Trussell et al., 2013) and in OCWD annual reports.
3.3.1. Pathogenic Microorganisms
Pathogenic organisms, which present acute risks, are of greatest concern in potable reuse applications. For example, the DDW has established overall treatment process log-removal levels for viruses, Giardia, and Cryptosporidium of 12, 10, and 10, respectively, for IPR projects. It is anticipated that the same values will apply to DPR projects. The pathogen reduction-log credits achieved by the benchmark treatment process components are compared with the DDW-required values for IPR in Table 3.2. It should be noted that Texas uses lower total log-removal values; however, they are applied to the effluent from secondary treatment rather than to untreated wastewater. If log-removal credits for conventional secondary treatment were added to the credits required for treatment processes following secondary treatment, then the Texas overall treatment process log-removal levels for viruses, Giardia, and Cryptosporidium would be similar to those required by the DDW. Also, some other states question whether the use of log-removal values for individual treatment processes is the appropriate method of regulation for pathogenic microorganisms. As reported in Table 3.2, disinfection with Cl2 or O3 can be used following CAT for additional redundancy.
3.3.2. A Third Water Source
In the future, it may be appropriate to designate treated wastewater as a third water source for drinking water along with groundwater and surface water. Further, it is not unreasonable to assume that selected treatment requirements similar to those contained in the current United States Environmental Protection Agency (U.S. EPA) Long-Term 2 Enhanced Surface Water Treatment Rule could be developed and applied to CAT-purified water. If the current surface water rules were applied, CAT-purified water would need minimal additional treatment, if any.

WateReuse Research Foundation 11
3.3.3. Regulatory Monitoring
OCWD currently has an extensive monitoring program for the CAT process for water quality, water quality assurance, and process performance and control. The monitoring program includes both on-line continuous monitoring and laboratory testing as well as critical control point monitoring and full-scale comparative testing of new technologies. Also, as new and/or improved methods of testing and analysis become available, these methods have been incorporated into the monitoring and testing program. Based on the long-term monitoring results, the extensive nature of the OCWD monitoring program, and the fact that the CAT process operated by OCWD was the first DDW-approved IRP injection project in California, it is anticipated that no significant increase in regulatory monitoring would be required for DPR (with the exception of some additional continuous on-line treatment process monitoring).
Table 3.2. Log-Removal Credits of Various Treatment Processes
Process
Log Reduction Credit
Virus Giardia Cryptosporidum
Benchmark Treatment Processes
Secondary treatment 2 2 2
Microfiltration/ultrafiltration 0 4 4
Reverse osmosis 2 2 2
UV/H2O2 6 6 6
Water treatment 4 4 4
Total credits 14 18 18
Required creditsa 12 10 10
Additional Log-Removal Values with Other Treatment Processes
O3b 4 3 1
Cl2 (Cl2 disinfectionc) 4 2 0
Notes: aDDW of the California SWRCB requirement. bO3 could be used before microfiltration or ultrafiltration or following advanced oxidation prior to blending with other water sources at the entrance to a potable water treatment plant. cDisinfection with Cl2 following advanced oxidation prior to blending with other water sources at the entrance to a potable water treatment plant.
3.4. Brine Management
Because the benchmark CAT system employs reverse osmosis, some form of brine management will be required. In coastal and near-coastal locations, brine typically is discharged to the ocean using an ocean outfall. In inland locations where a brine line to the ocean is not available and in coastal locations where ocean discharge is not allowed or is restricted, other disposal options must be used.
3.4.1. Brine Disposal Options
The principal brine disposal options currently in use are shown pictorially in Figure 3.3 and are described in Table 3.3. For inland locations without access to an ocean brine line, the first

12 WateReuse Research Foundation
five options, arranged in the order of use, comprise 99% of the disposal options currently in use. It is important to note that for inland desalting operations of a scale sufficient to serve as part of a community water system (i.e., serving more than 30 households), deep-well injection is often the only potentially feasible brine management option [i.e., there generally are insufficient freshwater flows to adequately dilute brines discharged to inland surface waters (Archuleta, 2014)]. In some cases, brine from an inland location can be hauled for discharge into a wastewater collection system with sufficient dilution capacity.
Figure 3.3. Ultimate disposal options for concentrated and unconcentrated brine solutions.

WateReuse Research Foundation 13
Table 3.3. Summary of Brine Disposal and Management Options
Disposal Optiona Use/Description
1. Surface water discharge
Discharge of brines to surface waters where sufficient dilution capacity is available is a common method of disposal for concentrated brine solutions. In some cases, the brine serves to dilute the constituent concentration of the surface water (e.g., Big Spring, Texas).
2. Discharge to wastewater collection system
This option is suitable for relatively small discharges such that the increase in total dissolved solids (TDS) is not significant (e.g., typically less than 20 to 50 mg/L).
3. Deep-well injection
This depends on the availability of a suitable subsurface aquifer and whether the aquifer is brackish water or is otherwise unsuitable for domestic uses.
4. Evaporation ponds (without and with greenhouse)
A large surface area is required in most areas with the exception of some southern and western states. The required surface area can be reduced using greenhouses. The solidified constituents are typically disposed of in a hazardous waste landfill.
5. Land application Land application has been used for some low-concentration brine solutions. This option is generally not available. Concentrated brine solutions can be disposed of in secure hazardous waste landfills.
6. Zero liquid discharge (ZLD)
ZLD involves the use of brine concentrators (e.g., a vapor compression evaporator) and crystallizers or spray dryers to convert the brine concentrate to water and a solid dry product suitable for landfill disposal. The recovery of useful salts may also be possible.
7. Brine line to ocean
This is the disposal option of choice for facilities located in the coastal regions of the United States. Typically, a brine line, with a deep ocean discharge, is used by a number of dischargers. Combined discharge with power plant cooling water has been used in Florida. For inland locations, trucks, rail hauling, or pipelines are needed for transportation.
Source: Adapted in part from Mickley (2009) and Tchobanoglous et al. (2014)
Note: aFor inland locations without access to a brine line, the first five options, arranged in the order of use, comprise 99% of the disposal options currently in use; however, of these five options, only deep-well injection appears viable for systems scaled for community supply.
3.4.2. Brine Treatment Options
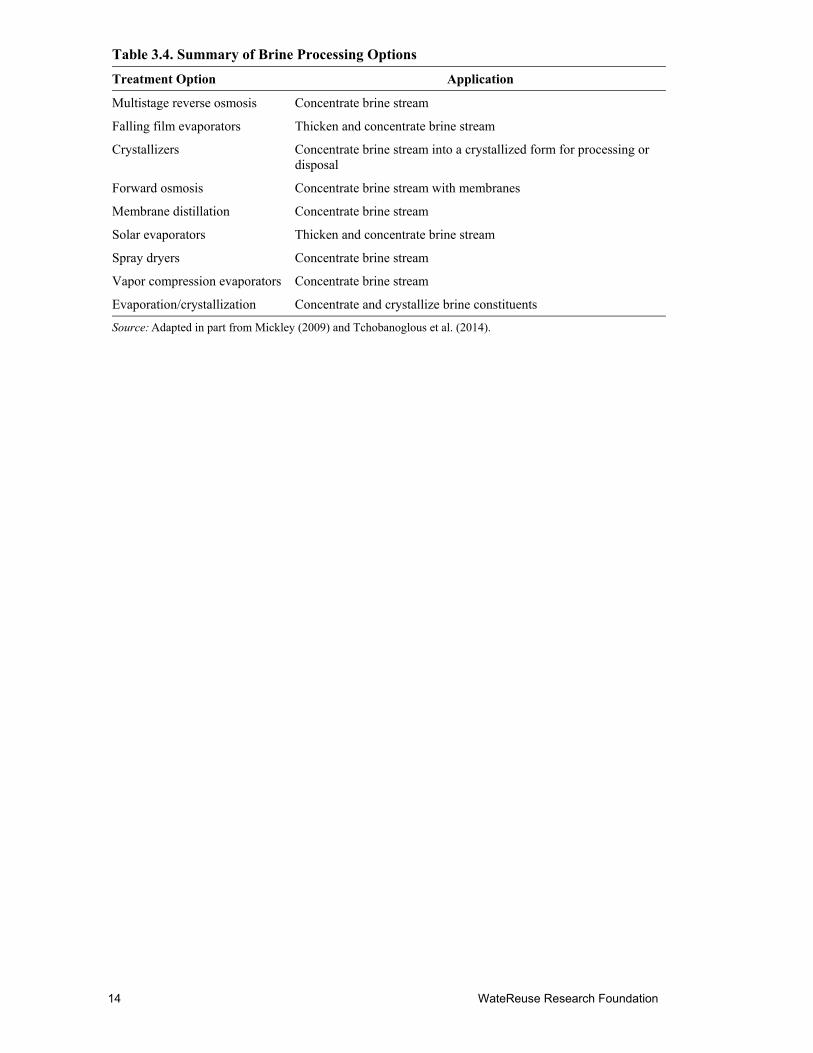
To reduce the volume of brine that must be managed, a variety of brine treatment processes have been developed. The principal processes used for brine minimization are summarized in Table 3.4. In some applications, the treatment processes have been used in conjunction with other processes for the recovery of specific constituents. The application of the technologies listed in Table 3.4 is usually site-specific and will depend on the volume and constituent concentration of the brine.
14 WateReuse Research Foundation
Table 3.4. Summary of Brine Processing Options
Treatment Option Application
Multistage reverse osmosis Concentrate brine stream
Falling film evaporators Thicken and concentrate brine stream
Crystallizers Concentrate brine stream into a crystallized form for processing or disposal
Forward osmosis Concentrate brine stream with membranes
Membrane distillation Concentrate brine stream
Solar evaporators Thicken and concentrate brine stream
Spray dryers Concentrate brine stream
Vapor compression evaporators Concentrate brine stream
Evaporation/crystallization Concentrate and crystallize brine constituents
Source: Adapted in part from Mickley (2009) and Tchobanoglous et al. (2014).

WateReuse Research Foundation 15
Chapter 4
Cost and Energy Usage of DPR
The cost of DPR is composed of (1) the cost of CAT, (2) the cost of conveyance, and (3) the cost of brine management. Each of these costs, along with energy usage, is considered separately in the following discussion. A comparison of DPR costs with the costs of other new water supply options is considered in Chapter 5.
4.1. Cost of CAT
The cost and energy usage information for CAT is based on the CAT process described in Chapter 3. Because of the regulatory uncertainty, it is challenging to provide cost comparisons for other treatment process flow diagrams.
4.1.1. Sources of Information
The sources of information used to assess the cost of the CAT process are (1) the actual costs and operational expenses of the original OCWD GWRS put into operation in 2008 and (2) the actual bid prices and estimated operational expenses for the expansion of the OCWD GWRS to be put into operation in 2015. In addition, the estimated costs of the CAT facilities of other proposed DPR and/or IPR alternatives were reviewed for consistency.
4.1.2. Treatment Technologies Included in the CAT Process
The treatment technologies that comprise the CAT process for the original OCWD GWRS project and expansion are given in Table 4.1. As reported in Table 4.1, the difference between the original and the expansion projects was the inclusion of flow equalization in the expansion project.
4.1.3. Treatment Costs Based on OCWD CAT Facilities
The estimated cost of the CAT process for potable reuse, as described in Chapter 3 and shown in Table 4.1, is presented in Table 4.2. As shown in Table 4.2, the cost for the original CAT process, based on actual operating data, is about $685/AF. The projected cost for the expansion is $701/AF. Capital costs account for roughly 40% of total annualized costs, with annual operating and maintenance (O&M) costs comprising the majority of the costs. The operating cost for the expansion can be predicted with reasonable accuracy based on the current operating costs of the original facility.

16 WateReuse Research Foundation
Table 4.1. Summary of Treatment Technologies Employed for Advanced Water Purification
Treatment Technology OCWD Original
OCWD Expansion
Secondary treatment ✔ ✔
Secondary treatment with effluent filtration
Secondary treatment with nitrogen removal and effluent filtration
Filter screens ✔ ✔
Flow equalization ✔
Microfiltration ✔ ✔
Ultrafiltration
Cartridge filtration ✔ ✔
Reverse osmosis ✔ ✔
UV oxidation ✔ ✔
Decarbonation ✔ ✔
Stabilization ✔ ✔
Table 4.2. Cost of CAT for IPR and DPR without Conveyance and Brine Management Costs
Cost/item Unit
Orange County GWRS IPR Project
Original Expansion
Capital expense $ 350,000,000 128,773,322
Annualized capitala $/y 19,267,500 8,376,705
Annual O&M $/y 28,700,000 13,361,005
Total annual cost $/y 47,967,500 21,737,710
Yield AF/y 70,000 31,000
Unit cost $/AF 685 701
Notes: aCapital cost annualized at 5% interest rate over a 30-year period; capital recovery factor equals 0.06505 for the expansion; note that the original OCWD GWRS received more favorable financing.
There are some differences in the components that make up the cost of the expansion as compared with the original facility. The original facility did not include flow equalization, which is included in the expansion. Also, the capital cost of the expansion facility is lower because much of the required yard piping was installed with the original facility. If it is assumed that 30% of the original $70 million spent on yard piping would be needed for a standalone expansion facility, then the unit cost for the expansion would increase by $44/AF. If the capital cost of the flow equalization facilities ($20 million) is excluded, the unit cost drops by about $42/AF. Also, it is estimated that the unit cost of the original facility would have been lower by about $20/AF if the expansion piping had not been installed. Taking all

WateReuse Research Foundation 17
of these factors into account, there is essentially no scaling factor on unit cost between plant capacities of 31,000 versus 71,000 AF/y. For the purpose of comparisons, a value of $700/AF will be used as the low estimate for CAT, excluding flow equalization.
4.1.4. Cost of CAT Facilities at Other Locations
Projected and bid price data were reviewed for San Diego and Santa Clara County, California.
San Diego, California. The treatment process flow diagram proposed for the San Diego IPR project is essentially the same as that used at OCWD. Preliminary cost data for the proposed IPR CAT process for San Diego was reviewed and found to be similar given local constraints. For example, flow equalization will not be used at one of the two proposed facilities because the wastewater treatment plant operates at a constant flow rate.
Santa Clara County, California. Similarly, the cost data for the Santa Clara Valley Water District CAT process, which is also essentially the same as that used at the OCWD facility, was reviewed and found to be similar, again with slight local variations.
4.1.5. Summary
The cost of CAT will vary, as noted previously, with site-specific factors including the characteristics of the influent water and the number of technologies employed as well as varying somewhat with the overall plant capacity, but it is expected to be on the order of $700/AF, excluding conveyance and brine management costs.
4.2. Cost of Conveyance
In addition to the cost of CAT, both DPR and IPR will require conveyance to either the drinking water system or an environmental buffer. For IPR, the conveyance cost for pipe construction and associated pumping may be modest or quite expensive, depending on local circumstances (e.g., distance and terrain between the CAT facility and the environmental buffer and between the buffer and the drinking water system). For example, for OCWD’s GWRS, the purified stabilized water is pumped approximately 13 miles to the groundwater infiltration basins. The conveyance cost for OCWD’s GWRS amounts to $120/AF. In other settings, the conveyance cost may be substantial. For example, for San Diego, the preliminary estimates of conveyance costs alone for two IPR options under consideration exceed $750/AF per option and may run as high as $1250/AF for one of the options.
For DPR, the conveyance cost may be less expensive, depending on site-specific considerations such as the distance and elevation between the advanced treatment plant and the drinking water treatment facility and the need for engineered storage in cases where the point of water addition to the distribution system is near the CAT facility. In San Diego, for example, one potential treatment facility location may have conveyance capital cost savings of more than $100 million for the DPR configuration as compared with the IPR alternative.
4.3. Cost of Brine Management
As with CAT and conveyance costs, the costs associated with brine management are site-specific and can vary widely depending on the characteristics and volume of the brine that must be managed. Typically, brine will be discharged through an existing wastewater

18 WateReuse Research Foundation
treatment ocean outfall. In some cases, a number of nearby agencies will join forces and construct a separate brine disposal line, which is the situation in Southern California.
Typical brine disposal costs are reported in Table 4.3. For example, in deep-well brine disposal systems, the length of the pipeline from the treatment facility to the location of the injection well can vary from less than one mile to more than 30 miles. Similarly, the cost of the injection well depends on the depth of the receiving aquifer, which can vary from 2000 to 10,000 feet.
4.4. Total Cost of DPR
The total cost of DPR, including CAT, treatment, conveyance, and brine management, may run between $820/AF ($700/AF for CAT plus $120/AF for conveyance) and $2000/AF. The low-end cost is based on the assumption that brine would be discharged through an existing ocean outfall. The upper-end cost includes CAT plus a relatively expensive conveyance expense for pipeline construction and operation and can include the cost of a separate brine line. In general, the cost of CAT for either DPR or IPR will be about the same, but conveyance and brine management costs will be site-specific and may be quite different. Also, it is important to note that the cost of drinking water treatment (i.e., the cost to re-treat the CAT-generated water at the drinking water system treatment plant) is not included because the same quantity of water is being treated; only the source of supply has changed.
4.5. Energy Usage for DPR
The energy required for DPR is composed of the energy requirements for (1) CAT, (2) conveyance, and (3) brine management. Each of these energy requirements is considered in the following.
4.5.1. Energy Required for CAT
The energy requirements for CAT depend on the flow rate, the characteristics of the incoming secondary or tertiary effluent, and the specific treatment processes employed. Typical energy requirements for individual treatment technologies used in the CAT process (see Figure 3.1 in Chapter 3) are presented in Table 4.4. The energy requirement for the benchmark CAT process, identified in Figure 3.1 and in Table 4.1 (column 5), will vary between 1050 and 1140 kWh/AF, based on actual operating data from OCWD. The total energy requirement for other advanced treatment configurations can be estimated using the values given in Table 4.4.
Table 4.3. Estimated Costs of Selected Brine Disposal Options
Disposal Option
Cost ($/AF)
Range Typical
Deep-well injection 60–80 70
Evaporation ponds 140–175 155
Land application, spray 130–160 140
ZLD 600–750 700
Brine line to ocean 110–150 115
Source: Adapted in part from Raucher et al. (2010) and Voutchkov (2013).

WateReuse Research Foundation 19
Table 4.4. Typical Energy Requirement for Various Treatment Process Technologies Used for Advanced Treatment
Technology
Product Recoverya
(%)
Energy Consumption
kWh/103 gal kWh/m3 kWh/AF
Wastewater with TDS from 800 to 1200 mg/L
Secondary treatmentb 94–96 1–1.6 0.26–0.42 330–520
Tertiary treatmentc 94–96 1.6–2.2 0.42–0.54 520–670
Media filtration (depth) 96–99 0.1–0.3 0.03–0.08 33–40
Media filtration (surface) 96–99 0.05–0.2 0.001–0.005 15–20
Filter screens 96–99 0.004–0.005 0.001–0.0013 1.25–1.75
Cartridge filtration 96–99 0.04–0.2 0.011–0.05 13–20
Microfiltration (vacuum type) 85–95 0.75–1.1 0.2–0.3 240–360
Microfiltration (pressure type) 85–95 0.75–1.1 0.2–0.3 240–360
Ultrafiltration 85–95 0.75–1.1 0.2–0.3 240–360
Nanofiltration 85–94 1.5–1.9 0.4–0.5 490–620
Reverse osmosis (without energy recovery) 80–85 1.9–2.3 0.50–0.61 620–750
Reverse osmosis (with energy recovery)d 80–85 1.7–2.2 0.46–0.58 550–700
Advanced oxidation na 0.31–0.40 0.053–0.106 100–130
Carbon dioxide stripping na 0.031–0.046 0.008–0.012 10–15
Lime saturation na 0.006–0.012 0.0016–0.0032 2–4
CATe 80–85 3.2–3.5 0.84–0.92 1050–1140
Seawater with TDS of about 35,000 mg/L
Ultrafiltration (pretreatment) 85–95 0.75–1.1 0.2–0.3 240–360
Reverse osmosis (with turbine/pump energy recovery) 30–55 19–26 5–7 5200–8500
Reverse osmosis (with pressure exchange energy recovery) 30–55 9.5–15 ~ 2.5–4 3100–4900
Source: Adapted from Tchobanoglous et al. (2014).
Notes: aValues based on crossflow mode of operation. bConventional activated sludge without energy recovery (50 to 5 Mgal/d; see Table 4.5). cActivated sludge with nitrification/denitrification and effluent filtration without energy recover (50 to 5 Mgal/d). dOverall total energy reduction will vary from 6 to 12%, depending on the energy recovery device (ERD) and process configuration. eBased on actual operating data from OCWD for 2012–2013.
Note: kWh/m3 x 3.785 = kWh/103 gal; kWh/103 gal x 325.892 = kWh/AF.

20 WateReuse Research Foundation
For the purpose of comparison, the electrical energy requirements of various secondary treatment processes and of conventional water treatment are presented in Table 4.5, in terms of stepped flow-rate increments. The lowest treatment capacity for which electrical energy requirements are given is 5 Mgal/d. Below 5 Mgal/d, wastewater treatment energy-use values vary widely and are unpredictable. Above 5 Mgal/d, there is a decrease in the energy requirements with plant size to about 20 Mgal/d. Beyond 20 Mgal/d, the energy cost for wastewater treatment does not vary significantly. It is interesting to note that the energy usage for water treatment also does not vary significantly with increasing plant size, in part because many of the processes are modular. Similarly, the energy required for the CAT process at various capacities does not change significantly with plant size because the standard module size is typically about 5 Mgal/d.
4.5.2. Energy Required for Conveyance
The energy requirements for conveyance are also highly site-specific and will depend on the total dynamic head for the conveyance system, the properties of the fluid being pumped, and the efficiency of the pumping equipment. In addition, the energy requirements for the support equipment and facilities must be taken into account. For example, for a flow of 31,000 AF/y (27.7 Mgal/d or 42.8 ft3/s), which corresponds to the OCWD plant expansion, the energy required for conveyance for every 10 feet of total dynamic head (static head plus dynamic losses) is equal to 64.6 horsepower or 48.2 kW, which corresponds to 13.6 kWh/AF. The computed value is based on the assumption that the specific weight of the purified water at 20°C is 62.3 lb/ft3 and the pump efficiency is 75%. If the total dynamic head were 250 feet (which is not uncommon), the corresponding value would be 340 kWh/AF. Clearly, the energy required for conveyance can become significant.
Table 4.5. Typical Energy Usage for Water, Wastewater, and CAT Systems
Capacity (Mgal/d)
Energy Required (kWh/AF)
Activated Sludge
Activated Sludge with Filtration
Activated Sludge with Nutrient Removal and
Filtration
Conventional Surface Watera
Complete Advanced Treatment
5 520 570 670 128 1100
10 450 480 600 124 1090
20 380 435 555 123 1080
40 340 400 530 123 1065
80 330 385 520 122 1060
Source: Adapted in part from Burton (1996), EPRI (1994, 2013), and Howe et al. (2012).
Note: aIncludes influent pumping (45 kWh/AF) but does not include pumping for distribution.
4.5.3. Energy Required for Brine Management
With the exception of the ZLD process, the corresponding energy requirements of the various brine disposal options described in Table 3.3 and listed in Table 4.5 are also site-specific and are even more difficult to generalize. For ZLD, if it is assumed that the system is composed

WateReuse Research Foundation 21
of an evaporator and a crystallizer, the following values can be used to estimate the energy requirements, excluding the energy required for landfilling (Voutchkov, 2013):
Evaporator: 60–90 kWh/1000 gal of brine feed water
Crystallizer: 200–260 kWh/1000 gal of concentrated brine from the evaporator
If it is assumed that the percentage of brine is 15% and that the brine is thickened to 95%, the corresponding values for the evaporator and crystallizer, expressed in terms of kWh/AF of product water, are as follows:
Evaporator: 2930–4000 kWh/AF gal of product water
Crystallizer: 490–640 kWh/AF gal of product water
On the basis of these values, the combined energy requirement will vary from 3420 to 5030 kWh/AF, which is about five times the amount of energy required for the CAT process but is similar to the energy requirements for seawater desalination. It is anticipated that these energy requirements will be reduced in the future based on a number of new technologies being tested and others currently under development.


WateReuse Research Foundation 23
Chapter 5
Comparison of the Cost of DPR with the Costs of Alternative Water Supplies
The costs of DPR, IPR, and other alternative new water supply options will depend largely on several factors, including site-specific conditions, the size and scale of the facility, and regulatory requirements. As noted previously, providing cost comparisons across a wide range of alternatives is challenging because the final DPR regulations are unknown. However, data ranges from a number of different alternative water sources are reviewed in this chapter.
5.1. Limitations of Cost Information
In comparing potable reuse costs to other options, other complications arise. Ideally, a comparison of the costs of water supply alternatives reflects a shared set of conditions, such as the full cost to deliver water to the customers’ taps or the full cost to deliver water to the entry of the drinking water treatment plant. However, in many instances the available cost information pertains only to the cost of the applicable treatment facilities (e.g., the cost per AF to generate water at a desalination plant) and may exclude the costs and energy requirements needed to pipe and pump the water from that facility to the drinking water treatment plant or distribution system.
5.2. Comparative Costs of Alternative New Water Supply Options
Alternative options for developing new water supplies are fairly limited; they include desalination (of seawater or, where available, brackish groundwater), increased reliance on already stressed imported water via the State Water Project (SWP) or the Colorado River, nonpotable reuse (NPR; e.g., for irrigation), and water conservation. A summary of the estimated costs of these alternatives, along with their respective caveats, is presented in Table 5.1. In general, potable reuse is likely to have costs comparable to the potentially available alternatives.

24
Wat
eReu
se R
ese
arch
Fou
nda
tion
Tab
le 5
.1. C
omp
arat
ive
Cos
ts o
f P
otab
le R
euse
an
d A
lter
nat
ive
New
Su
pp
ly O
pti
ons
Su
pp
ly O
pti
on
Cos
t
($/A
F)a
Com
men
ts a
nd C
avea
ts
Bas
is/C
itat
ions
DP
R
820–
2000
L
ow-e
nd v
alue
incl
udes
the
cost
of
CA
T a
nd $
120/
AF
for
conv
eyan
ce b
ut d
oes
not i
nclu
de b
rine
dis
posa
l cos
t. C
onve
yanc
e an
d br
ine
disp
osal
cos
ts a
re h
ighl
y si
te-
spec
ific
. At t
he lo
w e
nd, i
t is
assu
med
that
bri
ne is
dis
pose
d of
thro
ugh
an e
xist
ing
was
tew
ater
trea
tmen
t pla
nt o
utfa
ll.
Low
-end
val
ue is
bas
ed o
n O
CW
D G
WR
S a
ctua
l cos
ts f
or
the
DP
R-t
ype
CA
T p
roce
ss. H
igh-
end
valu
e is
bas
ed o
n pr
elim
inar
y S
an D
iego
est
imat
es a
nd a
utho
rs’
appr
oxim
atio
n of
pot
entia
l con
veya
nce
cost
s.
IPR
82
0–20
00
Low
-end
val
ue in
clud
es th
e co
st o
f C
AT
and
$12
0/A
F fo
r co
nvey
ance
but
doe
s no
t inc
lude
bri
ne d
ispo
sal c
ost.
Con
veya
nce
and
brin
e di
spos
al c
osts
are
hig
hly
site
-sp
ecif
ic. I
n so
me
case
s, c
onve
yanc
e co
sts
may
be
sign
ific
ant
(e.g
., $7
00 to
$10
00/A
F) a
nd m
ay b
e co
nsid
erab
ly h
ighe
r th
an f
or D
PR
.
Low
-end
val
ue is
bas
ed o
n O
CW
D G
WR
S a
ctua
l IP
R c
osts
fo
r tr
eatm
ent a
nd c
onve
yanc
e. H
igh-
end
valu
e is
bas
ed o
n th
e S
an D
iego
pre
lim
inar
y es
tim
ate
for
a m
odes
t-sc
ale
IPR
w
ith
San
Vin
cent
e R
eser
voir
as
the
buff
er. A
t the
low
end
, it
is a
ssum
ed th
at b
rine
is d
ispo
sed
of th
roug
h an
exi
stin
g w
aste
wat
er tr
eatm
ent p
lant
out
fall
.
Sea
wat
er
Des
alin
atio
n 15
00–2
330
Rep
orte
d co
sts
of s
eaw
ater
des
alin
atio
n sp
an a
ver
y br
oad
rang
e an
d ge
nera
lly a
re $
2000
or
mor
e pe
r A
F. R
epor
ted
cost
s m
ay n
ot in
clud
e al
l com
pone
nts,
suc
h as
con
veya
nce
to th
e po
tabl
e w
ater
sup
ply
syst
em, o
r pe
rmits
, whi
ch m
ay
add
cons
ider
able
upf
ront
cap
ital a
nd O
&M
exp
ense
.
Low
-end
cos
ts r
efle
ct le
ast-
cost
con
figu
ratio
ns f
rom
Wes
t B
asin
Mun
icip
al W
ater
Dis
tric
t mas
ter
plan
(M
alco
lm P
irni
e,
2013
). U
pper
end
bas
ed o
n w
ater
pur
chas
e ag
reem
ent-
spec
ifie
d pr
ices
for
fut
ure
Car
lsba
d fa
cili
ty d
eliv
erie
s to
San
D
iego
Cou
nty,
upd
ated
to 2
014
doll
ars.
The
se c
ontr
act-
spec
ifie
d pr
ices
may
not
ref
lect
ful
l cos
ts. C
onve
yanc
e co
sts
to p
otab
le w
ater
sup
ply
syst
em c
an b
e si
gnif
ican
t (e.
g., $
700
to $
1000
/AF
). H
ighe
r co
sts
antic
ipat
ed in
som
e lo
catio
ns.
Bra
ckis
h G
roun
dwat
er
Des
alin
atio
n (i
nlan
d)
930–
1290
C
osts
may
be
cons
ider
ably
hig
her
than
indi
cate
d if
a lo
w-
cost
con
cent
rate
man
agem
ent o
ptio
n (s
uch
as a
bri
ne li
ne)
is n
ot lo
cally
ava
ilabl
e. R
egul
ator
y ba
rrie
rs to
inla
nd
conc
entr
ate
man
agem
ent a
re a
sig
nifi
cant
cos
t fac
tor
and
an im
pedi
men
t to
broa
der
impl
emen
tatio
n.
Bas
ed o
n ac
tual
cos
ts a
t the
Chi
no d
esal
ting
fac
ilit
y,
incl
udin
g re
lativ
ely
inex
pens
ive
conc
entr
ate
man
agem
ent v
ia
the
San
ta A
na R
egio
nal I
nter
cept
or b
rine
line
. Hig
h-en
d va
lue
is b
ased
on
CD
WR
(20
03)
and
may
be
unde
rsta
ted.
Impo
rted
Wat
er
(e.g
., SW
P)
850–
1300
(m
ay b
e $2
000/
AF
by
202
0)
Cos
ts e
scal
atin
g ra
pidl
y (9
–10%
ann
ually
ove
r th
e pa
st f
ive
year
s) a
nd m
ay e
xcee
d $2
000/
AF
by
2020
. Add
ition
al
yiel
ds g
ener
ally
una
vaila
ble;
exi
stin
g yi
elds
are
unr
elia
ble.
S
alt m
anag
emen
t and
env
iron
men
tal c
osts
are
not
ref
lect
ed
in p
rice
s.
Bas
ed o
n pr
ices
bor
ne in
Los
Ang
eles
and
San
Die
go f
or
wat
er o
btai
ned
from
the
Met
ropo
lita
n W
ater
Dis
tric
t of
Sou
ther
n C
alif
orni
a (M
WD
) in
201
4. F
utur
e co
st e
scal
atio
n (u
p to
10%
per
yea
r: $
2000
/AF
by
2020
) re
flec
ts o
bser
ved
tren
ds o
ver
the
past
5 a
nd 1
0 ye
ars.
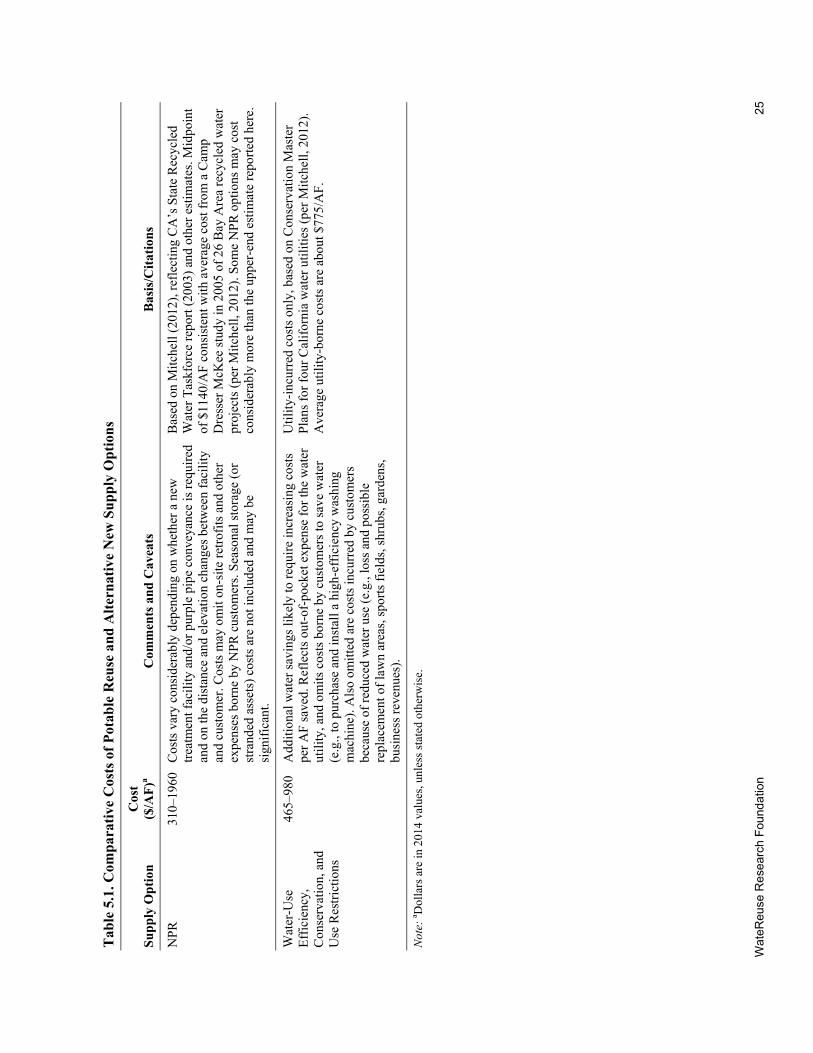
Wat
eReu
se R
ese
arch
Fou
nda
tion
25
Tab
le 5
.1. C
omp
arat
ive
Cos
ts o
f P
otab
le R
euse
an
d A
lter
nat
ive
New
Su
pp
ly O
pti
ons
Su
pp
ly O
pti
on
Cos
t
($/A
F)a
Com
men
ts a
nd C
avea
ts
Bas
is/C
itat
ions
NP
R
310–
1960
C
osts
var
y co
nsid
erab
ly d
epen
ding
on
whe
ther
a n
ew
trea
tmen
t fac
ility
and
/or
purp
le p
ipe
conv
eyan
ce is
req
uire
d an
d on
the
dist
ance
and
ele
vatio
n ch
ange
s be
twee
n fa
cilit
y an
d cu
stom
er. C
osts
may
om
it o
n-si
te r
etro
fits
and
oth
er
expe
nses
bor
ne b
y N
PR
cus
tom
ers.
Sea
sona
l sto
rage
(or
st
rand
ed a
sset
s) c
osts
are
not
incl
uded
and
may
be
sign
ific
ant.
Bas
ed o
n M
itche
ll (2
012)
, ref
lect
ing
CA
’s S
tate
Rec
ycle
d W
ater
Tas
kfor
ce r
epor
t (20
03)
and
othe
r es
timat
es. M
idpo
int
of $
1140
/AF
con
sist
ent w
ith a
vera
ge c
ost f
rom
a C
amp
Dre
sser
McK
ee s
tudy
in 2
005
of 2
6 B
ay A
rea
recy
cled
wat
er
proj
ects
(pe
r M
itche
ll, 2
012)
. Som
e N
PR
opt
ions
may
cos
t co
nsid
erab
ly m
ore
than
the
uppe
r-en
d es
tim
ate
repo
rted
her
e.
Wat
er-U
se
Eff
icie
ncy,
C
onse
rvat
ion,
and
U
se R
estr
icti
ons
465–
980
Add
ition
al w
ater
sav
ings
like
ly to
req
uire
incr
easi
ng c
osts
pe
r A
F sa
ved.
Ref
lect
s ou
t-of
-poc
ket e
xpen
se f
or th
e w
ater
ut
ilit
y, a
nd o
mit
s co
sts
born
e by
cus
tom
ers
to s
ave
wat
er
(e.g
., to
pur
chas
e an
d in
stal
l a h
igh-
effi
cien
cy w
ashi
ng
mac
hine
). A
lso
omit
ted
are
cost
s in
curr
ed b
y cu
stom
ers
beca
use
of r
educ
ed w
ater
use
(e.
g., l
oss
and
poss
ible
re
plac
emen
t of
law
n ar
eas,
spo
rts
fiel
ds, s
hrub
s, g
arde
ns,
busi
ness
rev
enue
s).
Util
ity-i
ncur
red
cost
s on
ly, b
ased
on
Con
serv
atio
n M
aste
r P
lans
for
fou
r C
alif
orni
a w
ater
uti
liti
es (
per
Mit
chel
l, 20
12).
A
vera
ge u
tility
-bor
ne c
osts
are
abo
ut $
775/
AF
.
Not
e: a D
olla
rs a
re in
201
4 va
lues
, unl
ess
stat
ed o
ther
wis
e.


WateReuse Research Foundation 27
Chapter 6
Relative Carbon Footprint of Potable Reuse and of Its Alternatives
A key consideration for new water supply alternatives is the amount of energy—and the associated carbon footprint—required to obtain, treat, and deliver potable quality water. Other than water-use efficiency and conservation (which can reduce energy as well as water use), all of the water supply alternatives considered as viable new supplies rely on a considerable amount of energy for complete advanced treatment (CAT) and/or conveyance. The relative carbon footprints associated with potable reuse, desalination, and imported water are discussed in this chapter.
6.1. Potable Reuse
The energy requirements associated with applicable treatment components of CAT for purifying wastewater were discussed previously in Chapter 4. The overall energy requirements for CAT, brackish water and seawater desalination, and imported water are reported in Table 6.1, along with the corresponding carbon footprint values. For the overall CAT process, the OCWD GWRS's experience with potable reuse provides a useful benchmark of the energy required for the CAT of wastewater for IPR or DPR applications. For the GWRS, the CAT process requires about 1060 kWh/AF of potable water produced, based on actual operating experience from July 2012 through July 2013. (An additional 340 kWh/AF is required for pumping to convey the potable water to the groundwater recharge facilities.) Energy costs for the CAT process amount to $92/AF, which is about 23% of the total O&M expense for treatment at the GWRS.
The carbon footprint values associated with the energy required for the various technologies and water sources are presented in column 4 of Table 6.1. The reported values are obtained by multiplying the energy required in kWh/AF by a conversion factor (0.346 kg CO2e/kWh), which reflects the CO2 emission equivalents released in the production of a kilowatt hour of energy. The conversion factor is based on the California Action Registry General Reporting Protocol and represents a mix of energy sources that is specific for California. Thus, the carbon footprint for the CAT process is 367 kg CO2e/AF or 367 MT/1000 AF.
Beyond treatment, potable reuse and other supply alternatives require additional energy for conveyance of the product water to the drinking water system and for the management of brine. Energy requirements for pumping depend on the distance, elevation gain, terrain, and other site-specific factors and can be substantial in some settings. There also can be a considerable carbon footprint associated with manufacturing and installing the pipeline itself. Similarly, the energy requirements for brine management will depend on whether an existing brine line or ocean outfall can be used or a new brine management system needs to be developed and deployed.

28 WateReuse Research Foundation
Table 6.1. Comparative Energy Requirements for Alternative Sources of Water
Technology/Water Source
Energy Required (kWh/AF) Carbon Footprint
(kg CO2e/AF)Range Typical
Secondary treatment without nitrogen removala 330–520b 450c 156
Tertiary treatment with nitrogen removal and effluent filtrationa 520–670b 600d 208
CAT 1050–1140 1080 373
Brackish water desalinationd 1500–2000 1900 657
Ocean water desalinationd 3100–4900 3900 1349
California State Project watere 2500–5300 3300 1142
Colorado River water 2000–2100 2000 692
Conventional drinking water treatmentf 120–130b 124c 43
Membrane-based water treatmentf 140–150 145c 50
Notes: aEnergy recovery is not included; for plants that are 10 Mgal/d and larger, the potential energy recovery from biogas is on the order of 115 kWh/AF. bThe low and high range limits of the energy required are for an 80 and a 5 Mgal/d treatment plant, respectively (see Table 4.4). cThe typical energy required value is for a 10 Mgal/d treatment plant. dThe energy required for distribution is not included.
eThis includes the energy required for delivery to point-of-treatment, including energy recovery; the energy required for treatment and distribution is not included; the range of energy-required values reflects the different points of water delivery. fThis includes influent pumping (45 kWh/AF) but does not include pumping for distribution.
Source: Adapted in part from Larson et al. (2007), Taffler et al. (2008), and Tchobanoglous et al. (2014).
6.2. Desalination
Desalination is a relatively energy-intensive water supply alternative. Advances in membrane technologies and energy recovery systems have contributed to reducing the net amount of energy required for desalination facilities. Seawater desalination typically requires 3700 kWh/AF of product water. This equates to a carbon footprint of about 1280 MT CO2e/1000 AF produced.
Brackish water desalination, as may be feasible at some inland locations, tends to be much less energy intensive than seawater desalination because source water TDS levels tend to be much less than 10,000 mg/L (in contrast to seawater, which has TDS levels of about 35,000 mg/L). At the Chino groundwater desalting facilities in the Inland Empire Utilities Agency, energy requirements are 1900 kWh/AF, with an associated carbon footprint of 657 MT CO2e/1000 AF.

WateReuse Research Foundation 29
6.3. Imported Water
The broader application of potable reuse, including DPR, will in many locations generate a reduced reliance on imported water. Reducing water imports will in turn avoid the extensive energy requirements associated with transporting water from the Bay Delta or the Colorado River. By offsetting the demand of 1000 AF of imported SWP water (for example), a local potable reuse project will avoid greenhouse gas (GHG) emissions of roughly 1142 MT CO2e/1000 AF. This value does not include the additional energy and carbon footprint required to treat and distribute the imported water or to address the salt management challenge associated with high TDS loads conveyed by imported waters (see Chapter 7).
On net, a potable reuse project would save about 775 MT of GHG emissions (367 MT versus 1142 MT) for each 1000 AF produced. In turn, this savings would cut CO2e emissions by about two-thirds when the project is used in lieu of imported waters. In addition, it would yield a higher quality and more reliable supply and would free up import waters for other users and/or environmental flows.
6.4. Summary
Using CAT to generate reclaimed water suitable for potable reuse is less energy intensive than the alternatives available for generating new water for California. Although potable reuse using CAT is more energy intensive than conventional drinking water treatment processes (as shown in Table 6.1), traditional supplies have been fully developed and new alternatives need to be considered. Amongst the viable new sources of water supply, potable reuse is considerably less energy intensive than seawater or brackish groundwater desalination or transporting import waters to Southern California. Potable reuse may reduce energy demands and carbon footprints to one-third or one-half the levels associated with the alternatives.


WateReuse Research Foundation 31
Chapter 7
Direct and Comparative Benefits of DPR
In California and elsewhere, potable reuse can offer important benefits relative to the other feasible alternatives for ensuring adequate and reliable water supplies into the future. Further, DPR can offer a number of benefits compared with other recycling opportunities, specifically IPR (which requires an environmental buffer) or NPR (which limits types of uses and requires its own distribution infrastructure). Potable reuse also compares favorably with other new water supply alternatives and with imported water on the basis of cost, availability, reliability, energy requirements, and carbon footprint.
7.1. Direct Benefits of Implementing Potable Reuse
The principal benefits of implementing potable reuse can be assessed in terms of (1) public water supply, (2) agriculture, (3) the environment, (4) energy conservation, and (5) cost. The discussion of each of these areas of benefit is derived, in part, from Schroeder et al. (2012).
7.1.1. Public Water Supply Benefits
Alternative solutions to meet urban water supply requirements include the development of local surface and groundwater storage reservoirs, the development and implementation of inter-basin water transfer systems, desalination of brackish water and seawater, conservation, and DPR and/or IPR. In many locations the development of local storage reservoirs is not feasible. Inter-basin water transfers often result in damage to local agriculture and the environment, and transmission systems are at risk from earthquake damage and other natural disasters. Seawater and brackish groundwater desalination is costly and energy intensive, and for inland locations, brine disposal is a serious fiscal and environmental compliance issue. In many communities, the relatively cost-effective demand reductions available through conservation and water-use efficiency measures have already been achieved. In contrast, in many locations sustainable local sources combined with DPR and/or IPR may be adequate. Compared with other alternatives, potable reuse can provide a stable local source of water that is less subject to natural disasters and has relatively modest energy requirements (see Chapter 6). Potable reuse also contributes a more diversified local water supply portfolio, drawing on a locally generated, locally controlled, and climate-independent supplement to a community water supply. It also may free up other local (or imported) waters for other uses.
7.1.2. Agriculture Benefits
Water that is not exported for urban use can be made available for food production and can also help minimize subsidence that is due to overdrafting of aquifers. Given the projected population growth over the next 25 years, protecting agricultural water supplies for irrigation will become of greater importance, especially in times of drought.
7.1.3. Environmental Benefits
A reduction in the amount of water exported to urban areas can have direct environmental benefits by allowing for more effective management of instream flows and aquatic ecosystems. The reduction of aquifer overdrafting can, as noted previously, help to reduce the

32 WateReuse Research Foundation
lowering of groundwater levels and the resulting increase in pumping energy costs, subsidence, and damage to surface infrastructure. Reducing groundwater overdraft will also help maintain base flows for many freshwater rivers and streams, thereby protecting aquatic and riparian habitats.
7.1.4. Energy Conservation Benefits
As noted in Chapter 6, the energy required for the production of purified water through the CAT process will vary from 1050 to 1140 kWh/AF beyond that needed for secondary treatment, depending on the wastewater TDS (i.e., about 500 to 1000 mg/L). By comparison, desalination of seawater, with energy recovery, requires about 3100 to 4900 kWh/AF. Inter-basin transfers of water typically require large expenditures of energy (2500 to 3500 kWh/AF; see Chapter 6 and Table 5.2) to pump water over the mountain ranges that separate and define the basins. In addition, using sources with lower energy demands also reduces the carbon footprint of water supply provision.
7.1.5. Cost Savings
DPR and/or IPR can, as described in Chapter 5, have significant cost-saving benefits. In Southern California, the cost of IPR water produced by the OCWD GWRS, which meets or exceeds all of the drinking water standards, is less than the cost of water from the SWP. In the future, SWP water costs are expected to continue to increase at rates well above general inflation, whereas the costs of CAT will remain relatively the same or may even decrease though continual technological developments.
7.2. Comparative Benefits of Implementing Potable Reuse
The benefits of DPR in a comparative context relative to other alternative available water supply options are considered in the following with respect to (1) imported waters, (2) desalination, (3) conservation and curtailments, (4) NPR, and (5) IPR.
7.2.1. Comparative Benefits of Potable Reuse Relative to Imported Waters
Much of California currently relies extensively on waters imported from the Bay Delta via the SWP or on water drawn from the Colorado River. There are many problems associated with the reliance on imported waters: (1) the yields are subject to many possible natural and institutional disruptions and limitations, resulting in potentially large inter-annual variability; (2) the quality of these imported waters is variable (and they tend to include relatively high salt loads); (3) the energy and associated carbon footprint required to transport these waters is considerable; (4) the extraction of these waters imposes significant adverse environmental consequences; and (5) the cost of imports is high and escalating rapidly. It is vital for California’s future that it reduce rather than increase its reliance on imported water.
7.2.1.1. Potable Reuse Provides a More Reliable, Locally Controlled Supply Relative to Imports
In Southern California, the availability of imported water (from both the Colorado River and the SWP) is subject to a number of natural and societal forces, including (1) increased demands from population growth, (2) drought, (3) changes in snowpack, (4) seismic events, (5) earthquakes, and (6) environmental regulations, water rights determinations, and the associated legal challenges and court rulings. Local groundwater extraction is also limited in

WateReuse Research Foundation 33
many areas because of past overdrafting and/or adverse water-quality impacts, highlighting the need for additional reliable sources of water to meet current and future demands under all hydrologic conditions.
In addition, by reducing the need for imported SWP water, wide-scale implementation of potable reuse will augment instream flows in the Sacramento-San Joaquin River Delta (which provides the means by which the SWP delivers water from Northern California to the south) or will offset other diversions that may otherwise reduce instream flows. Reduced demands on Delta supplies also will help reduce the overall salinity of the Delta and improve Delta habitat.
7.2.1.2. Potable Reuse Improves Water Quality by Reducing Import-Related Salt Loading
In the San Diego Recycled Water Study (City of San Diego, 2012), it was noted that when blended with imported water, highly purified water produced using CAT has the potential to reduce salinity in reservoirs by up to 50%. Imported water entering San Vicente Reservoir averages 500 mg/L of TDS, whereas water from Orange County’s GWRS—an operating CAT plant—averages 35 to 50 mg/L. The reservoirs that receive the CAT-purified water, and the soil that is irrigated with the water, would all benefit from having water with up to half the current salinity levels. In addition, residents would directly benefit from softer water that extends the lives of household appliances such as water heaters, dishwashers, clothes washers, and faucets.
To estimate the magnitude of potential statewide water-quality improvements that could accrue from potable reuse, the amount of salt import that is avoided by using purified recycled water in lieu of imported water supplies can be used as a metric. For example, if 1 million AFY of potable reuse is generated and offsets about half of MWD’s imports into Southern California, then the estimated salt content (50 mg/L) of potable reuse supply results in avoiding 320 million pounds of salt import each year.
7.2.1.3. Reuse Reduces Wastewater Effluent Discharge to the Ocean
Approximately 3.5 million AFY of freshwater is currently discharged to the ocean as wastewater in California (WateReuse California, 2009). Not only could this ocean discharge serve as a source of expanded water reuse opportunities, but an expanded water-recycling program would also reduce wastewater effluent discharge into the marine environment.
For example, in San Diego, the U.S. EPA in 2010 allowed the City of San Diego to continue to operate the Point Loma Wastewater Treatment Plant as a chemically enhanced, primary treatment facility under a modification to its National Pollutant Discharge Elimination System Permit. During the 2008–2010 permit modification process, two environmental organizations entered into a Cooperative Agreement with the city to conduct the Recycled Water Study, the purpose of which was to identify alternatives to large-scale wastewater system upgrades, including the alternative of a water reuse program. Reductions in ocean discharges could have a substantial impact on coastal ecosystems directly adjacent to ocean outfalls (City of San Diego, 2012).
7.2.2. Comparative Benefits of Potable Reuse Relative to Desalination
In coastal locations, seawater desalination may be a technically feasible option that can provide a high-quality potable supply (after blending and/or chemical addition) that adds to

34 WateReuse Research Foundation
the portfolio of water sources in a region. Seawater desalination also offers climate resistant yields, and its source water (seawater) is virtually unlimited in availability along coastal areas.
Seawater desalination also has some important drawbacks, including potential environmental impacts associated with feed water intakes, brine discharges, and the construction of facilities at sensitive shoreline or near-shore locations. Seawater desalination also has relatively high energy demands and carbon footprints compared with potable reuse. Feed water quality for desalination is vulnerable to red tides and other ocean water quality challenges, and coastal facilities may be vulnerable to sea level rise and storm surge. Seawater desalination facilities are subject to considerable permitting and regulatory requirements and have proven to be very difficult, costly, and time-consuming to receive authorization for and to build. These collective factors can make seawater desalination a more expensive option than potable reuse.
Brackish water desalination may be a viable option in some inland and coastal locations. It provides a high-quality potable supply and offers reliable, climate-resistant yields in most locations with access to brackish groundwater. It also tends to be less energy intensive and less expensive than seawater desalination.
A disadvantage of inland brackish water desalination, relative to potable reuse, is that desalination is available only at locations with access to brackish aquifers. Inland desalting also appears to be somewhat more energy intensive than CAT for potable reuse, depending on the TDS of the brackish water source. Perhaps most importantly, there are considerable regulatory challenges and costs associated with concentrate (brine) management at inland desalination facilities (unless a brine line is locally available for coastal discharge).
7.2.3. Comparative Benefits of Potable Reuse Relative to Conservation and Curtailments
Improvements in water-use efficiency and conservation are very desirable and are an essential component of prudent water resource management. As a result of concerted efforts throughout the past few decades to educate water users and to incentivize water savings through rebates and other mechanisms, significant per capita water-use reductions have been realized in residential, commercial, and industrial settings. This has not only conserved water but also saved the energy required to pump, treat, and heat the water. At this point in time, however, the “low hanging fruit” of water-use reductions have been harvested, and there is now more limited potential for major additional advances in urban water savings to free up existing supplies. Long-standing water-use efficiency and conservation programs have “hardened” demand in most locations, limiting opportunities for additional, cost-effective water savings. Additional water conservation is likely to come at a relatively high cost per AF of water saved.
It also is important to note that the costs estimated for conservation efforts are typically only those expenses borne by the water utility. Costs borne directly and indirectly by customers investing in water-saving appliances or foregoing lawns and gardens are not factored into the estimates. These omitted customer and community costs include the expense of acquiring and installing water-saving appliances and the losses incurred by foregoing residential and public green spaces. In addition, reduced revenues from lower water sales create a sizable challenge to water utilities, which typically face high fixed costs. Rate increases are often necessary to enable utilities to meet fiscal obligations associated with large capital investment needs for infrastructure renewal and regulatory compliance.

WateReuse Research Foundation 35
7.2.4. Comparative Benefits of Potable Reuse Relative to NPR
NPR has been widely implemented throughout California and elsewhere, generating important benefits for a wide array of water users, communities, and the environment. NPR provides a dependable and generally cost-effective water supply to agricultural irrigators, reducing the uncertainties and periodic drought-related adverse economic impacts associated with crop production in many communities with important agricultural sectors. It likewise has provided a reliable and cost-effective water supply for many industrial users, energy producers, large-scale cooling operations, and other businesses critically reliant on a dependable supply as a vital input in their production processes.
NPR has also served to relieve demand-side pressures on potable supplies, providing “fit for use” water that offsets potable demands otherwise needed for irrigating golf courses, athletic fields, school yards, public parks, community landscapes, and residential gardens. As such, NPR has enabled potable supplies to stretch further while concurrently enhancing property values, community aesthetics, recreational opportunities, and overall quality of life. NPR also has been used to restore and create important environmental resources, such as wetlands and other ecosystems that provide important natural functions, including the provision of critical habitat for flora and fauna.
NPR does have its limitations, however. Many NPR demands are seasonal, meaning either that water recycling assets are underutilized part of each year or that a form of storage needs to be created to match year-round production with part-year demands. Further, NPR requires its own separate distribution system, requiring not only a significant investment in pipes and pumps but also the considerable disruption often associated with large-scale pipeline projects.
In contrast, potable reuse relies predominantly on existing water supply distribution systems, provides the highest quality water to meet the highest value uses, and serves a basic human need that does not fluctuate with the seasons or over time. Ultimately, potable reuse has higher value than NPR and also is likely to be less expensive in many instances (especially as the most cost-effective opportunities for NPR become tapped).
7.2.5. Comparative Benefits of DPR Relative to IPR
The comparative advantage of DPR relative to IPR is due to a number of factors, including (1) avoiding water rights issues that may arise when water is placed into an environmental buffer, (2) the lack of suitable surface or groundwater environmental buffers in proximity to some locations where reclaimed water is produced (meaning that IPR is not feasible in such locations), (3) the potential for contamination of the reclaimed water when it is released into the environmental buffer, and (4) the costs associated with maintenance, operation, and monitoring of environmental buffers (NRC, 2012).
In some instances, DPR will typically avoid or minimize the need for expensive pipelines, pump stations, and other infrastructure that is generally required to transport recycled water to IPR environmental buffer locations (e.g., reservoirs, aquifer recharge sites) or to nonpotable customers using purple pipe networks. This will also typically reduce the energy use and GHG emissions associated with conveying the recycled water to the buffer site or to customer locations.
The benefits of being able to implement potable reuse without an environmental buffer may be illustrated by one of the alternatives under preliminary consideration by the City of San

36 WateReuse Research Foundation
Diego. Because of increasing concerns over the reliability of imported water in Southern California, San Diego has developed extensive plans for expanding potable reuse within its service area. Currently, the city is evaluating the potential for an IPR program that might ultimately recycle up to nearly 100,000 AF/y of wastewater using CAT. Following treatment, this water could be pumped to the San Vicente Reservoir (which effectively serves as the environmental buffer), blended with water from other sources, and ultimately treated again at the potable water treatment plant. For one location being considered for IPR in San Diego, the pipeline from the city’s Advanced Treatment Facility to the San Vicente Reservoir would be 23 miles long.
Although IPR through reservoir augmentation (i.e., using the San Vicente Reservoir as an environmental buffer) would provide important benefits to the city, potable reuse without the use of an environmental buffer has the potential to save the city significant amounts of money (a preliminary estimate is more than $100 million in construction costs for the pipeline development alone). With one DPR option, recycled water would also be developed at the city’s Advanced Treatment Facility but would be delivered directly to San Diego County Water Authority’s regional raw aqueduct system (which serves the City of San Diego and other local communities). Similar to IPR, this water would be treated again at a potable water treatment plant. The pipeline from the city’s Advanced Treatment Facility to the raw aqueduct system would be 10 miles long. The cost savings arise from the reduction in the conveyance pipeline of 13 miles.
It is likely that in most applications, DPR will require less piping and pumping to deliver the recycled water supplies to the potable water treatment and distribution facilities as compared with the pipe and pumping distances typically associated with delivering recycled water to an environmental buffer. Thus, it is likely that DPR approaches will typically have lower construction costs, lower energy needs, and lower related O&M costs for water transport compared with IPR. This will vary by location, depending on site-specific circumstances.
In addition, where pipeline construction is reduced via a DPR approach, there will also be a considerably reduced carbon footprint as well as considerably reduced environmental disruption associated with the construction (and operation) of the conveyance system. For the San Diego illustration, the avoidance of 13 miles of pipeline with the DPR alternative would save more than 50,000 MT of CO2e emissions, most of which is embedded in the manufacturing of the pipe itself.
7.2.6. Summary
Implementation of DPR in areas having limited surface and groundwater sources can result in a sustainable and reliable system for supplying high-quality water to urban communities. Because the water requirements of cities are greater than wastewater discharges, DPR will not be a standalone water supply, but it can serve as a highly valuable water supply asset within a broader integrated regional water management portfolio.

WateReuse Research Foundation 37
Chapter 8
Potential New Water from DPR and IPR in California
An important question that must be assessed is how much water could be made available in California through DPR. For the purpose of this analysis, the year 2020 was selected to serve as the basis for analysis, taking into account the projected increase in population and the impact of additional water conservation measures. Estimates beyond 2020 are too highly speculative. The amount of water that could be made available through DPR is addressed by first estimating the amount of treated wastewater that will be discharged to surface waters or the ocean in the year 2020 and then estimating the amount of that water that could potentially be available for recycling, including DPR and IPR.
8.1. Water Quantities Discharged to Surface Waters or to the Ocean in 2020
To estimate the amount of water that will be discharged to surface water or to the ocean in California in 2020, it was necessary to (1) consider the current and future population projections by California State Water Resources Control Board (SWRCB) Region; (2) estimate the number of people served by on-site and centralized collection systems in each State Board Region; (3) estimate the amount of wastewater that will be discharged to centralized collections systems; (4) subtract the expected amount of water to be recycled in 2020 from the total amount of water discharged; and (5) finally, estimate the potential amount of water that could be available for recycling, including DPR and IPR. The various steps involved are delineated in what follows. Detailed computation tables are presented in Appendix A. The reason for aggregating the flow-rate data by SWRCB Region is that data are available by SWRCB Region on the number of people served by on-site systems and on the amount of water now recycled.
8.1.1. Current and Future Population Projections by State Board Region
The current and projected future population data by county used in the analysis were developed by California Department of Finance (2013). The estimated 2010 population data and the projected total population data in five year increments until 2030 are presented in Table 8.1. The population data for each of the counties were then distributed by SWRCB Region. The resulting populations by SWRCB Region for 2020 are presented in Table 8.2 in column 2. The detailed computation tables used to derive the data in column 2 are presented in Appendix A.

38 WateReuse Research Foundation
Table 8.1. Estimated and Projected Population of California
Year
Population
Estimated Projected
2010 37,309,382
2015 38,801,062
2020 40,643,643
2025 42,451,760
2030 44,279,354
Source: From California Department of Finance (2013).
Table 8.2. Estimated Summary Demographic Information for 2020 for California by SWRCB Region
SWRCB Region Total
Populationa
Population Served by
On-site Systemsb
Population Served with Centralized
Collection Systemsc
1. North Coast 723,503 263,953 459,550
2. San Francisco Bay 5,516,277 176,705 5,339,572
3. Central Coast 2,395,293 327,258 2,068,035
4. Los Angeles 10,200,553 162,516 10,038,037
5. Central Valley 8,502,994 1,778,752 6,724,250
6. Lahontan 2,592,811 480,248 2,112,565
7. Colorado River 2,682,984 827,522 1,855,462
8. Santa Ana 4,917,468 395,332 4,522,136
9. San Diego 3,111,760 197,066 2,914,694
Total 40,643,643 4,609,352 36,034,301
Source: aFrom California Department of Finance (2013).
Notes: bScaled according to population growth based on information from CWTRC and U.S. EPA (2003). cDifference between total population and population served by on-site systems.

WateReuse Research Foundation 39
8.1.2. Number of People Served by On-site and Centralized Collection Systems in Each State Board Region
The number of people in 2020 served by on-site systems (e.g., septic tanks) was estimated by scaling the values available by SWRCB Region in a report prepared by the California Wastewater Training and Research Center and U.S. EPA (CWTRC and U.S. EPA, 2003). The estimated population served by on-site systems in 2020 is given in column 3 in Table 8.2. The population served by centralized collection systems (sewers), the difference between the values in columns 2 and 3, is reported in column 4 in Table 8.2.
8.1.3. Amount of Wastewater Discharged to Centralized Collection Systems in Each State Board Region
The amount of wastewater discharged to centralized collection systems was estimated using the per capita wastewater flow rate given in Table 8.3 for the year 2020 and the population served by centralized collection systems from Table 8.2 (column 4). The estimated wastewater flow rates in 2020 are given in Table 8.4 for three different per capita flow rates. The value of 90 gal/capita•d used to estimate the total wastewater given in column 3 was derived from information given in Table 8.3 by assuming the amount of water from indoor use, commercial use, and municipal use that will become wastewater is 50, 30, and 10 gal/capita•d, respectively. Lower per capita values were used to compute the wastewater flow rate in columns 4 and 5 to represent less-optimistic estimates of the amount of wastewater that will be available.
Table 8.3. Current and Projected Municipal Water Use Quantities in the United States
Use
Flow (gal/capita•d)
2013 2020 2030
Range Typical Range Typical Range Typical
Domestic
Indoor use 40–80 60a 35–65 55 30–60 45
Outdoor use 16–50 35b 16–50 35 16–50 35
Commercial 10–75 40 10–70 35 10–65 30
Public 15–25 20 15–25 18 15–25 15
Loss and waste 15–25 20 15–25 18 15–25 15
Total 96–255 175 91–235 161 86–225 140
Sources: Adapted from Tchobanoglous et al. (2014), with input from DeOreo (2013) and Mayer (2014).
Notes: a2014 Water Research Foundation Residential End Uses of Water Update (rounded up from 58.5 gal/capita•d). bIn some parts of the country, outdoor water use is significantly higher than indoor use, depending on location and season of the year.

40 WateReuse Research Foundation
Table 8.4. Estimated Amount of Water Discharged to Wastewater Collection Systems in 2020 by SWRCB Region
SWRCB Region
PopulationServed with
Sewers in 2020a
Estimated Amount of Wastewater Collected in 2020 Based on Different Per Capita Wastewater Flow Rates
(Mgal/d)a,b
90 gal/capita•d 80 gal/capita•d 70 gal/capita•d
1. North Coast 459,550 41.4c 36.8 32.2
2. San Francisco Bay 5,339,572 480.6 427.2 373.8
3. Central Coast 2,068,035 186.1 165.4 144.8
4. Los Angeles 10,038,037 903.4 803.0 702.7
5. Central Valley 6,724,242 605.2 537.9 470.7
6. Lahontan 2,112,563 190.1 169.0 147.9
7. Colorado River 1,855,462 167.0 148.4 129.9
8. Santa Ana 4,522,136 407.0 361.8 316.5
9. San Diego 2,914,694 262.3 233.2 204.0
Total 36,034,291 3243.1 2882.7 2522.5
Sources: aPopulation data from Table 8.2 and Appendix A; bper capita flow-rate data from Table 8.3.
Note: cFor example, 41.4 Mgal/d = (459,550 capita)(90 gal/capita•d).
8.1.4. Potential Amount of Water Available for Reuse Applications Including DPR and IPR
The estimated amount of treated wastewater available in 2020 for recycling, including DPR and IPR, is presented in Table 8.5. The values presented in Table 8.5 were derived as follows. The values in column 2 are from Table 8.4 (column 3). The values in column 3 represent the amounts of water recycled in 2011, based on data from California Water Boards’ Annual Performance Report Fiscal Year 2010–2011, Plan and Assess: Water Recycling. The values in columns 4 and 5 are the estimated amounts of wastewater recycled in 2020 expressed in different units and were derived by scaling up the 2011 values (column 3) by 15% to reflect growth in recycling by 2020. Finally, the value in column 6 is the estimated amount of treated effluent that will be discharged to surface waters or the ocean, taking into account water lost to sludge processing (estimated to be 10%). The water discharged to surface waters or the ocean represents the amount of water that could be available for recycling, including DPR and IPR. If the actual amount of wastewater discharged to the collection system were 70 gal/capita•d, the total amount of water available would be on the order of 1789 Mgal/d. The estimated amount of water that could be realistically recycled by means of DPR or IPR is considered in the following section.

WateReuse Research Foundation 41
Table 8.5. Estimated Amount of Treated Wastewater Potentially Available in 2020 for Reuse by SWRCB Region
Water Resources Control Board Region
EstimatedAmount of
Wastewater Collected in 2020
Based on90 gal/capita•da
(Mgal/d)
Estimated Amount of
Water Recycled in Various
Applications in 2011b
(AF/y)
Estimated Amount of
Water Recycled
in Various Applications
in 2020c
Estimated Amount of Water
Discharged to Surface Water
or Oceand
(Mgal/d)
Mgal/d AF/y
1. North Coast 41.4 25,772 26.5 29,638 13.4
2. San Francisco Bay 480.6 41,019 42.1 47,172 394.7
3. Central Coast 186.1 23,275 23.9 26,766 146.0
4. Los Angeles 903.4 169,641 174.2 195,087 652.6
5. Central Valley 605.2 177,885 182.6 204,568 380.3
6. Lahontan 190.1 9810 10.1 11,282 169.9
7. Colorado River 167.0 14,090 14.5 16,204 101.0
8. Santa Ana 407.0 155,743 159.9 179,104 222.4
9. San Diego 262.3 51,952 53.3 59,745 224.4
Total 3243.1 669,187 687.1 769,566 2304.7
Sources: aFlow-rate data from Table 8.4; bbased on data from California Water Boards’ Annual Performance Report Fiscal Year 2010–2011, Plan and Assess: Water Recycling; cdata from 2011 scaled up to 2020 by a factor or 15%.
Notes: dDifference between amount of wastewater collected and amount recycled times a factor of 0.9 to account for other water losses (e.g., sludge processing); the actual amount of water available will vary by region, depending on the types of reuse projects that may be implemented.
Mgal/d x 1120.15 = AF/y.
8.2. Potential Amount of Water Available for Potable Use
The total amount of water available for recycling in 2020—including water that could be used for DPR and IPR—corresponds to the estimated amount of water discharged to surface waters and the ocean in 2020, as reported in column 6 in Table 8.5. The amount of water that could be recycled by DPR and/or IPR will be some percentage of the total for each of the Regional Boards; recycling by DPR and/or IPR would most likely occur in coastal areas of the state where ocean outfalls are available for the discharge of residual brine.
The estimated amount of water that could be used for DPR and/or IPR by Regional Board is reported in columns 5 and 6 in Table 8.6 in terms of Mgal/d and AF/y. The estimated percentage of the available amount of water that could potentially be used for DPR and IPR is shown in column 4. As shown in column 4, zero percent was assumed for some of the inland counties with sparse population. Thirty percent was allocated for the Central Valley where larger communities are located, including (from north to south) Sacramento, Stockton, Merced, Fresno, and Bakersfield. As shown in Table 8.6, about 50% of the
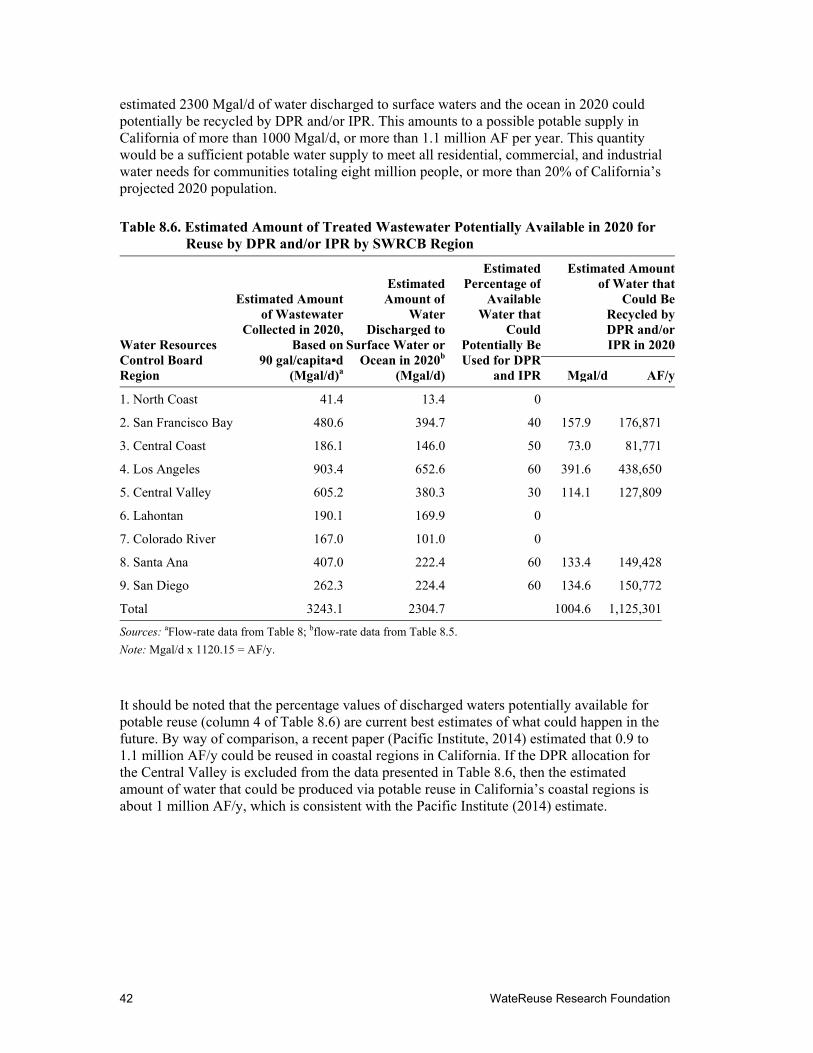
42 WateReuse Research Foundation
estimated 2300 Mgal/d of water discharged to surface waters and the ocean in 2020 could potentially be recycled by DPR and/or IPR. This amounts to a possible potable supply in California of more than 1000 Mgal/d, or more than 1.1 million AF per year. This quantity would be a sufficient potable water supply to meet all residential, commercial, and industrial water needs for communities totaling eight million people, or more than 20% of California’s projected 2020 population.
It should be noted that the percentage values of discharged waters potentially available for potable reuse (column 4 of Table 8.6) are current best estimates of what could happen in the future. By way of comparison, a recent paper (Pacific Institute, 2014) estimated that 0.9 to 1.1 million AF/y could be reused in coastal regions in California. If the DPR allocation for the Central Valley is excluded from the data presented in Table 8.6, then the estimated amount of water that could be produced via potable reuse in California’s coastal regions is about 1 million AF/y, which is consistent with the Pacific Institute (2014) estimate.
Table 8.6. Estimated Amount of Treated Wastewater Potentially Available in 2020 for Reuse by DPR and/or IPR by SWRCB Region
Water Resources Control Board Region
Estimated Amountof Wastewater
Collected in 2020,Based on
90 gal/capita•d(Mgal/d)a
Estimated Amount of
Water Discharged to
Surface Water or Ocean in 2020b
(Mgal/d)
Estimated Percentage of
Available Water that
Could Potentially Be Used for DPR
and IPR
Estimated Amount of Water that
Could Be Recycled byDPR and/or IPR in 2020
Mgal/d AF/y
1. North Coast 41.4 13.4 0
2. San Francisco Bay 480.6 394.7 40 157.9 176,871
3. Central Coast 186.1 146.0 50 73.0 81,771
4. Los Angeles 903.4 652.6 60 391.6 438,650
5. Central Valley 605.2 380.3 30 114.1 127,809
6. Lahontan 190.1 169.9 0
7. Colorado River 167.0 101.0 0
8. Santa Ana 407.0 222.4 60 133.4 149,428
9. San Diego 262.3 224.4 60 134.6 150,772
Total 3243.1 2304.7 1004.6 1,125,301
Sources: aFlow-rate data from Table 8; bflow-rate data from Table 8.5.
Note: Mgal/d x 1120.15 = AF/y.

WateReuse Research Foundation 43
References
Archuleta, E.G. Desalination Concentrate Management Policy Analysis for the Arid West; WERF5C11; Water Environment Research Foundation: Alexandria, VA, 2014.
Asano, T.; Burton, F. L.; Leverenz, H.; Tsuchihashi, R.; Tchobanoglous, G. Water Reuse: Issues, Technologies, and Applications; McGraw-Hill: New York, NY, 2007.
ATSE. Drinking Water Through Recycling: The Benefits and Costs of Supplying Direct to the Distribution System; Australian Academy of Technological Sciences and Engineering: Melbourne Victoria, Australia, 2013.
Burris, D. L. Groundwater Replenishment System 2009 Annual Report; Prepared for the California Regional Water Quality Control Board, Santa Ana Region, Fountain Valley, CA, 2010.
Burton, F. L. Water and Wastewater Industries: Characteristics and Energy Management Opportunities; CEC Report 106941; Electric Power Research Institute: St. Louis, MO, 1996.
California Department of Finance. Population Estimates for Cities, Counties, and the State: January 1, 2013 and 2014. Demographic Research Unit, State of California, Scramento, CA,: January 2013.
Carter, D. L. Status of the Regenerative ECLSS Water Recovery System. SAE Technical Paper, 2009. doi: 10.4271/2009-01-2352.
CDWR, Water Desalination Task Force. Feedwater Intake Working Paper – Revised Draft; California Department of Water Resources, Office of Water Use Efficiency and Transfers: Sacramento, CA, September 12, 2003.
City of San Diego. San Diego Recycled Water Study (Final Draft), City of San Diego: San Diego, CA, May 10, 2012.
Cotruvo, J. A. Direct potable reuse then and now. World Water: Water Reuse Desal. 2014, 1, 10–13.
Crittenden, J. C.; Trussell, R. R.; Hand, D. W.; Howe, K. J.; Tchobanoglous. G. Water Treatment: Principles and Design, 3rd ed.; Wiley & Sons: New York, NY, 2012.
CWTRC; U.S. EPA. Status Report: Onsite Wastewater Treatment Systems in California; Prepared by the California Wastewater Training and Research Center, California State University: Chico, CA, and EPA Region 9 Ground Water Office; August, 2003.
DeOreo, W. Analysis of Household and Per Capita Water Use in Residential Customers; Report prepared by Aquacraft Water Engineering and Management for the New Mexico State Engineer Office: Boulder, CO, 2013.
du Pisani, P. L. Direct reclamation of potable water at Windhoek’s Goreangab Reclamation Plant. In Integrated Concepts in Water Recycling 2005; Khan, S. J., Muston, M. H., Schafer, A. I., Eds.; University of Wollongong: Wollongong, Australia, 2005; pp 193–202.
EPRI. Energy Audit Manual for Water and Wastewater Facilities; Electric Power Research Institute: St. Louis, MO, 1994.

44 WateReuse Research Foundation
EPRI. Electricity Use and Management in the Municipal Water Supply and Wastewater Industries; A joint report prepared by the Electric Power Research Institute and Water Research Foundation: Palo Alto, CA, 2013.
Howe, K. J.; Hand, D. W.; Tchobanoglous, G.; Crittenden, J. C.; Trussell, R. R. Water Treatment: Principles; Wiley & Sons: New York, NY, 2012.
Lahnsteiner, J.; Lempert, G. Water management in Windhoek/Namibia. Water Science & Technology 2007, 55 (1–2), 441–448.
Larson, D.; Lee, C.; Tellinghuisen, S.; Keller, A. California’s energy-water nexus: Water use in electricity generation. Southwest Hydrology 2007, 6 (5), 16–19.
Leverenz, H. L.; Tchobanoglous, G.; Asano, T. Direct potable reuse: A future imperative. J. Water Reuse and Desal. 2011, 1 (1), 2–10.
Malcolm Pirnie. West Basin Municipal Water District Ocean Water Desalination Program Master Plan; Malcolm Pirnie, Water Division of ARCADIS: Irvine, CA, January 2013.
Mayer, P. Personal communication. Research progress update based on Residential End Uses; Water Demand Management, Water Research Foundation: Boulder, CO, 2014.
Mickley, M. Treatment of Concentrate; Desalination and Water Purification Research and Development Program Report No. 155; U.S. Department of the Interior, Water and Environmental Services Division, Water Treatment Engineering Research Team: Denver, CO, 2009.
Mitchell, D. Review of Unit Cost Ranges for CWF Water Efficiency Strategies; Technical memorandum prepared by M-Cubed for Mike Wyatt, California Water Foundation: Oakland, CA, 2012.
NRC. Water Reuse: Potential for Expanding the Nation's Water Supply Through Reuse of Municipal Wastewater; National Research Council, National Academies Press: Washington, DC, 2012.
Pacific Institute. Water Reuse Potential in California; Issue Paper, IB:14-05-E; Pacific Institute and NRDC: Oakland, CA, 2014.
Raucher, R.; Clements, J.; Xu, P.; Oxenford, J.; Ruetten, J.; Choto, Z.; Reiss, R. Guidelines for Implementing Seawater and Brackish Water Desalination Facilities; Report No. 4078 and Associated Planning Issues Matrix Tool: Water Research Foundation: Denver, CO, 2010.
Schroeder, E.; Tchobanoglous, G.; Leverenz, H. L.; Asano, T. Direct Potable Reuse: Benefits for Public Water Supplies, Agriculture, the Environment, and Energy Conservation; National Water Research Institute: Fountain Valley, CA, 2012.
Taffler, D.; Lesley, D.; Zelenka, A. Hidden potential—Recycled water and the water-energy-carbon nexus. Water Environment & Technology 2008, 20 (11), 34–41.
Tchobanoglous, G.; Eliassen, R. The indirect cycle of water reuse. Water and Wastes Eng. 1969, 6 (2), 35–41.
Tchobanoglous, G.; Leverenz, H.; Nellor, M. H.; Crook, J. Direct Potable Reuse: A Path Forward; WateReuse Research and WateReuse California: Washington, DC, 2011.

WateReuse Research Foundation 45
Tchobanoglous, G.; Stensel, H. D.; Tsuchihashi, R.; Burton, F. L. Wastewater Engineering: Treatment and Resource Recovery, 5th ed.; Metcalf and Eddy I AECOM, McGraw-Hill Book Company: New York, NY, 2014.
Trussell, R. R.; Salveson, A.; Snyder, S. A.; Trussell, R. S.; Gerrity, D.; Pecson, B. M. Potable Reuse: State of the Science Report and Equivalency Criteria for Treatment Trains; WateReuse Research Foundation: Alexandria, VA, 2013.
Voutchkov, N. Desalination Engineering Planning and Design; McGraw-Hill: New York, NY, 2013.
WateReuse California. Potable Reuse Program Position Statement; WateReuse California: CA, December 10, 2009. http://www.watereuse.org/sites/default/files/u8/PR%20position%20statement%20v3a.pdf.


WateReuse Research Foundation 47
Appendix A
Population Served by Centralized Collection and On-site Systems by SWRCB Region
The population by California SWRCB Region was determined by taking the California Department of Finance (2013) county population data and allocating it according to State Board Region for each of the nine State Board Regions. The required computations are presented in Tables A.1 through A.9. A summary population table by SWRCB Region is given in Table A.10.
The development of the population data for each SWRCB Region is illustrated by considering SWRCB Region 1, which is presented in Table A.1. The counties included in Region 1 are listed in the first column. The estimated 2020 population for each county is listed in column 2. Because some counties are in two or more regional boards, the population had to be distributed between regional boards. The estimated percentage of the county population that is in the region is given in column 3. The total estimated population in State Board Region 1 is given in column 4. The estimated population served by on-site systems is given in column 5. The population data in column 5 were based on information from CWTRC and U.S. EPA (2003).

48 WateReuse Research Foundation
Table A.1. Estimated Demographic Information for SWRCB Region 1
County or Portion of County in SWRCB Region 1
2020 Total
Population in Countya
Percentage of County
Population in Region 1
2020 Total
Population in Region 1
2020 On-site
Population in Region 1
Del Norte 29,635 100 29,635 14,331
Glen 30,780 10 3078 1508
Humboldt 139,132 100 139,132 44,837
Lake 71,228 20 14,245 8396
Marin 251,361 10 25,136 3884
Mendocino 91,498 100 91,498 55,730
Modoc 9965 50 4983 3871
Siskiyou 46,369 100 46,369 24,027
Sonoma 507,250 70 355,075 92,628
Trinity 14,352 100 14,352 14,741
Total 723,503 263,953
Source: aFrom California Department of Finance (2013).
Table A.2. Estimated Demographic Information for SWRCB Region 2
County or Portion of County in SWRCB Region 2
2020 Total
Population in Countya
Percentage of County
Population in Region 2
2020 Total
Population in Region 2
2020 On-site
Population in Region 2
Alameda 1,608,204 100 1,608,204 13,900
Contra Costa 1,147,399 50 573,700 20,072
Marin 251,361 90 226,225 20,000
Napa 145,660 50 72,830 15,210
San Francisco 852,788 100 852,788 0
Santa Clara (north of Morgan Hill) 1,889,898 60 1,133,939 37,380
San Mateo 747,563 90 672,807 20,000
Solano 447,217 50 223,609 10,445
Sonoma 507,250 30 152,175 39,698
Total 5,516,277 176,705
Source: aFrom California Department of Finance (2013).

WateReuse Research Foundation 49
Table A.3. Estimated Demographic Information for SWRCB Region 3
County or Portion of County in SWRCB Region 3
2020 Total
Population in Countya
Percentage of County
Population in Region 3
2020 Total
Population in Region 3
2020 On-site
Population in Region 3
Kern (small portion) 1,057,440 100 0 0
Monterey 436,107 100 436,107 74,293
Santa Barbara 449,505 95 427,030 36,000
San Benito 60,278 85 51,239 19,000
Santa Clara (south of Morgan Hill) 1,889,898 40 755,959 24,920
San Mateo (southern portion) 747,563 10 74,756 355
Santa Cruz 275,704 100 275,704 80,374
San Luis Obispo 287,744 100 287,744 86,410
Ventura (northern portions) 867,535 10 86,754 5906
Total 2,395,293 327,258
Source: aFrom California Department of Finance (2013).
Table A.4. Estimated Demographic Information for SWRCB Region 4
County or Portion of County in SWRCB Region 4
2020 Total
Population in Countya
Percentage of County
Population in Region 4
2020 Total
Population in Region 4
2020 On-site
Population in Region 4
Los Angeles 10,441,441 90 9,397297 108,164
Ventura 867,535 90 780,781 53,622
Kern (small portions) 1,057,440 0 0 0
Santa Barbara (small portions) 449,505 5 22,475 730
Total 10,200,553 162,516
Source: aFrom California Department of Finance (2013).

50 WateReuse Research Foundation
Table A.5. Estimated Demographic Information for SWRCB Region 5
County or Portion of County in SWRCB Region 5
2020 Total
Population in Countya
Percentage of County
Population in Region 5
2020 Total
Population in Region 5
2020 On-site
Population in Region 5
Amador 39,352 100 39,352 27,250
Butte 241,521 100 241,521 132,249
Calaveras 48,312 100 48,312 48,947
Colusa 24,886 100 24,886 9686
Contra Costa (east) 1,147,399 50 573,700 20,073
El Dorado 203,095 85 172,630 102,917
Fresno 1,071,728 100 1,071,728 181,135
Glen 30,780 90 27,702 13,567
Kern 1,057,440 55 581,592 122,384
Kings 176,647 100 176,647 26,319
Lake 71,228 80 56,982 33,586
Lassen 35,934 30 10,780 5006
Madera 185,056 100 185,056 83,042
Mariposa 20,463 100 20,463 18,639
Merced 301,376 100 301,376 72,537
Modoc 9965 25 2491 1935
Napa (northeast) 145,660 50 72,830 15,210
Nevada 104,343 90 93,909 7515
Placer 391,682 85 332,930 90,293
Plumas 20,731 100 20,731 20,336
Sacramento 1,543,522 100 1,543,522 66,039
San Benito 60,278 15 9042 708
San Joaquin 810,845 100 810,845 119,568
San Luis Obispo 287,744 100 0 0
Shasta 199,814 100 199,814 88,224
Sierra 3034 75 2276 2397
Siskiyou 46,369 100 0 0
Solano (west) 447,217 50 223,609 10,445
Stanislaus 589,156 100 589,156 112,918
Sutter 108,939 100 108,939 47,616
Tehama 69,340 100 69,340 43,133
Tulare 526,718 100 526,718 166,354

WateReuse Research Foundation 51
Table A.5. Estimated Demographic Information for SWRCB Region 5
County or Portion of County in SWRCB Region 5
2020 Total
Population in Countya
Percentage of County
Population in Region 5
2020 Total
Population in Region 5
2020 On-site
Population in Region 5
Tuolumne 55,938 100 55,938 41,733
Yolo 223,657 100 223,657 20,848
Yuba 84,520 100 84,520 26,143
Total 8,502,994 1,778,752
Source: aFrom California Department of Finance (2013).
Table A.6. Estimated Demographic Information for SWRCB Region 6
County or Portion of County in SWRCB Region 6
2020 Total
Population in Countya
Percentage of County
Population in Region 6
2020 Total
Population in Region 6
2020 On-site
Population in Region 6
Alpine 1172 100 1172 1293
El Dorado 203,095 15 30,464 17,159
Inyo, 19,350 100 19,350 5449
Kern (east) 1,057,440 45 475,848 100,132
Lassen (east side) 35,934 70 25,154 11,680
Los Angeles (northeast corner) 10,441,441 10 1,044,144 200,875
Modoc (east) 9,965 25 2491 1936
Mono 15,037 100 15,037 7933
Nevada 104,343 10 10,433 60,000
Placer 391,682 15 58,752 15,935
San Bernardino 2,273,017 40 909,207 57,057
Sierra 3034 25 759 799
Total 2,592,811 480,248
Source: aFrom California Department of Finance (2013).

52 WateReuse Research Foundation
Table A.7. Estimated Demographic Information for SWRCB Region 7
County or Portion of County in SWRCB Region 7
2020 Total
Population in Countya
Percentage of County
Population in Region 7
2020 Total
Population in Region 7
2020 On-site
Population in Region 7
Imperial 222,920 100 222,920 31,860
Riverside 2,593,211 30 777,963 355,883
San Bernardino 2,273,017 30 681,905 256,758
San Diego 3,333,995 30 1,000,196 183,021
Total 2,682,984 827,522
Source: aFrom California Department of Finance (2013).
Table A.8. Estimated Demographic Information for SWRCB Region 8
County or Portion of County in SWRCB Region 8
2020 Total
Population in Countya
Percentage of County
Population in Region 8
2020 Total
Population in Region 8
2020 On-site
Population in Region 8
Orange 3,198,279 100 3,198,279 19,946
Riverside 2,593,211 40 1,037,284 118,628
San Bernardino 2,273,017 30 681,905 256,758
Total 4,917,468 395,332
Source: aFrom California Department of Finance (2013).
Table A.9. Estimated Demographic Information for SWRCB Region 9
County or Portion of County in SWRCB Region 9
2020 Total
Population in Countya
Percentage of County
Population in Region 9
2020 Total
Population in Region 9
2020 On-site
Population in Region 9
Riverside 2,593,211 30 777,963 118,628
San Diego 3,333,995 70 2,333,797 78,438
Total 3,111,760 197,066
Source: aFrom California Department of Finance (2013).

WateReuse Research Foundation 53
Table A.10. Estimated Summary Demographic Information for 2020 for California by SWRCB Region
SWRCB Region Total
Populationa Population Served by
On-site Systemsb Population Served
with Sewersc
1. North Coast 723,503 263,953 459,550
2. San Francisco Bay 5,516,277 176,705 5,339,572
3. Central Coast 2,395,293 327,258 2,068,035
4. Los Angeles 10,200,553 162,516 10,038,037
5. Central Valley 8,503,002 1,778,752 6,724,250
6. Lahontan 2,592,813 480,248 2,112,565
7. Colorado River 2,682,984 827,522 1,855,462
8. Santa Ana 4,917,468 395,332 4,522,136
9. San Diego 3,111,760 197,066 2,914,694
Total 40,643,653 4,609,352 36,034,301
Sources: aFrom California Department of Finance (2013). bScaled according to population growth based on information from CWTRC and U.S. EPA (2003).
Note: cDifference between total population and population served by on-site systems.


1199 North Fairfax Street, Suite 410
Alexandria, VA 22314 USA
(703) 548-0880
Fax (703) 548-5085
E-mail: [email protected]
wwwwww..WWaatteeRReeuussee..oorrgg//FFoouunnddaattiioonn
Practical Solutions for Water Scarcity