the open petroleum engineering journal · 152 the open petroleum engineering journal, 2017, 10,...
TRANSCRIPT

Send Orders for Reprints to [email protected]
152 The Open Petroleum Engineering Journal, 2017, 10, 152-176
1874-8341/17 2017 Bentham Open
The Open Petroleum EngineeringJournal
Content list available at: www.benthamopen.com/TOPEJ/
DOI: 10.2174/1874834101710010152
RESEARCH ARTICLE
Inflow Performance Relationship Correlation for Solution Gas-DriveReservoirs Using Non-Parametric Regression Technique
Ahmed M. Daoud1,*, Mahmoud Abdel Salam2, Abdel Alim Hashem1 and M.H. Sayyouh1
1Department of Petroleum Engineering, Cairo University, Giza, EGYPT2Ganoub ElWadi Petroleum Company, Cairo, EGYPT
Received: March 28, 2017 Revised: May 08, 2017 Accepted: June 13, 2017
Abstract:
Background:
The Inflow Performance Relationship (IPR) describes the behavior of flow rate with flowing pressure, which is an important tool inunderstanding the well productivity. Different correlations to model this behavior can be classified into empirically-derived andanalytically-derived correlations. The empirically-derived are those derived from field or simulation data. The analytically-derivedare those derived from basic principle of mass balance that describes multiphase flow within the reservoir. The empirical correlationssuffer from the limited ranges of data used in its generation and they are not function of reservoir rock and fluid data that vary pereach reservoir. The analytical correlations suffer from the difficulty of obtaining their input data for its application.
Objectives:
In this work, the effects of wide range of rock and fluid properties on IPR for solution gas-drive reservoirs were studied using 3Dradial single well simulation models to generate a general IPR correlation that functions of the highly sensitive rock and fluid data.
Methodology:
More than 500 combinations of rock and fluid properties were used to generate different IPRs. Non-linear regression was used to getone distinct parameter representing each IPR. Then a non-parametric regression was used to generate the general IPR correlation.The generated IPR correlation was tested on nine synthetic and three field cases.
Results & Conclusion:
The results showed the high application range of the proposed correlation compared to others that failed to predict the IPR.Moreover, the proposed correlation has an advantage that it is explicitly function of rock and fluid properties that vary per eachreservoir.
Keywords: Inflow Performance Relationship (IPR), Analytical and empirical correlations, Solution gas-drive reservoirs, 3D radialsingle well simulation models, Non-linear regression, Non-parametric regression.
1. INTRODUCTION
Predicting the relationship between the flow rate and the pressure drop performance in the reservoir is veryimportant for continuous production optimization. IPR curve can be combined with tubing performance curve tomonitor well productivity, designing production and artificial lift equipment and to choose the proper remedialtreatment options (acidizing, fracturing, work over, etc.) for optimum well performance.
* Address correspondence to this author at the Department of Petroleum Engineering, Cairo University, Giza, Egypt; Tel: +965-972-59268; E-mails:[email protected]; [email protected]

Inflow Performance Relationship Correlation The Open Petroleum Engineering Journal, 2017, Volume 10 153
In calculating oil production, it was assumed that an oil production rate is directly proportional to draw down. Usingthis assumption, well’s behavior can be described by productivity index; PI. This PI relationship was developed fromDarcy’s law for steady state radial flow of a single incompressible fluid.
(1)
Evinger and Muskat [1] pointed that the above relationship is not valid for two phase flow.
The first presentation of an inflow performance relationship (IPR) was made by Rawlins and Schellhardt [2]. Theyused their plot to show the effect of liquid loading on the production performance of gas wells. Gilbert [3] introducedthe concept of an “Inflow Performance Relationship” (IPR).
Based on our literature survey, the different IPR correlations can be divided into empirically-derived andanalytically-derived correlations.
1.1. The empirically derived correlations are:
Vogel [4]Fetkovich [5]Jones et al. [6]Richardson and Shaw [7]Wiggins [8, 9]Klins and Majcher [10]Sukarno and Wisnogroho [11]
1.2. The Analytical correlations are:
Wiggins et al. [8, 12]Del Castillo et al. [13, 14]
Detailed description of all the above IPR models is given on Abdel Salam [15].
Different attempts afterwards were used to either give theoretical explanations of the above IPR correlations or tointroduce modifications to the above IPR correlations. Examples of these attempts are as follows:
In 2007, Haiquan et al. [16] deduced a dimensionless IPR for a single phase (oil or gas), based on the nonlinear flowmathematical model developed by Forcheimer. This IPR for solution gas-drive reservoirs (Pr ≤ Pb) as well as partialsolution gas- drive reservoirs (Pr ≥ Pb and Pwf ≤ Pb), developed by recognizing the similarity of deliverability equationsbetween laminar flow and nonlinear (turbulent) flow of a single phase, and a general dimensionless IPR formula isgained by summing up and normalizing the IPRs in different cases as shown below where the characteristic parameters(a) and (n) have explicit physical significance.
(2)
The parameter (n) describes the average extent of solution gas-drive. If n = 1, Eq. 2 is the dimensionless IPR forsingle phase oil flow (without solution gas-drive); n=2, dimensionless IPR for single phase gas flow or oil flow bysolution gas-drive; and 1<n<2, dimensionless IPR for partial solution gas-drive. The parameter (a) describes the type offlow where for a=1, the flow is considered of laminar flow.
Ilk et al. [17] provided the analytical development of “Vogel”-type Inflow Performance Relationship correlationsfor solution gas-drive reservoir systems by proposing a characteristic mobility function that extended Del Castillo andArcher et al. [13, 14] work for assuming a polynomial mobility profile rather than the linear profile.
In 2009, Jahanbani and Shadizadeh [18] presented analytical solution for determination of IPR curves of oil wellsbelow the bubble point pressure. This approach uses the results of well test analysis along with relative permeability andPVT data using the analytically derived flow equation in both transient and pseudo steady state.
Elias et al. [19] extended the Del Castillo and Archer et al. [13, 14] mobility equation as function of pressure and
)( PwfPeJq
� �2
maxmax
11 ��
�
����
�
�
�����
����
�
o
o
o
on
r
wf
qqa
qqa
pp
154 The Open Petroleum Engineering Journal, 2017, Volume 10 Daoud et al.
generated an empirical mobility ratio equation based on 47 field cases.
In 2012, Khasanov et al. [20] studied the effect of change in relative permeability and hence the mobility on theshape of the IPR using single well reservoir simulation models. They showed that Fetkovich Equation can be a goodrepresentation of the deliverability equation especially in the transition zone where the Pwf is slightly lower than the Pb
and the shape of Krg is not increasing sharply with increase in gas saturation. Khasanov et al. [20] proposed a genericIPR correlation close to Fetkovich equation as follows:
(3)
Where mk ranges from 1.4 to 2 with value of 2 being noticed when the Pwf is close to Pb and Krg is not increasingsharply with increase in gas saturation with Krg max value being less than 0.05. The nk values range from 0.75 to 1 withlow values occurring in the transition zone during the depletion process where the Pwf is slightly lower than the Pb withlow gas saturation and nk value tends to be1 when the reservoir pressure and the Pwf are far below the Pb.
Through time IPR curves have used in different applications, Brown [21] in 1982 used IPR combined with tubingintake curves to provide an optimum artificial lift method to produce the well. In 1988, Avery and Evans [22] utilizeIPR curves in examining the well performance under different artificial lift designs. IPR curves were also used duringenhanced oil recovery process where Yeu et al. [23] in 1997 used IPR to predict the performance of an oil well underthe implementation of polymer flooding. After emerging of the multi-lateral technology, Guo et al. [24] in 2006 derivedcomposite IPR for multi-lateral wells. These are few of the many applications of IPR in oil industry.
Most of the IPR correlations suffer from common limitations that they are not explicitly function of the differentreservoir rock and fluid properties that vary from one reservoir to another or its difficulty to be applied. This will affectthe accuracy of the correlations especially if the reservoir properties of the well under study are completely differentfrom the properties used in generating these correlations. In this work, a single well 3D radial reservoir model withsolution gas-drive as the main driving mechanism was built and reservoir simulation was used to generate differentIPRs by changing the reservoir rock and fluid properties. The most sensitive reservoir rock and fluid properties wereselected to generate the new IPR correlation. This new correlation is based on generating 550 combination of theselected reservoir rock and fluid properties and run the simulation models to generate different 550 IPR curves. Then,the non-parametric regression technique was used to generate the new IPR correlation that is explicitly function of thereservoir rock and fluid properties that highly affect the IPR curve.
The outline of the paper is as follows. Firstly, we presented the assumptions we used in generating the single wellreservoir simulation model. Secondly, we studied the sensitivity of the IPR towards different rock and fluid parametersto choose the highly sensitive parameters to be used in the IPR correlation. Thirdly, we presented the nonlinear andnon-parametric regression techniques we used to develop the IPR correlation that is explicitly function of reservoir rockand fluid properties. Finally, we presented the validation of the new correlation based on different synthetic and fieldcases.
2. MODEL CONSTRUCTION
MORE [25] that stands for Modular Oil Reservoir Evaluation was used to simulate the multi-rate test forconstructing the IPR curve. The reservoir simulator was used to construct 550 reservoir models that cover a wide rangeof rock and fluid properties. These different reservoir models were used to examine the sensitivity of IPR curve towardsthe change in the reservoir rock and fluid properties, to select the highly sensitive properties for developing the IPRcorrelation. It is important to mention here that in constructing the single well reservoir simulation model, all the pointson the IPR curve were in the pseudo-steady flow period with constant rate at the inner boundary and no flow at theouter boundary with two phases flowing which were oil and gas. The general assumptions used in building the reservoirmodels can be summarized as follows:
3D radial flow into the well bore as shown in Fig. (1).The reservoir initially at the bubble point pressureVertical well at the center of the formation.The well is completed through the whole formation thickness.
kk
nm
r
wf
o
oPP
���
�
���
�
��� 1
max

Inflow Performance Relationship Correlation The Open Petroleum Engineering Journal, 2017, Volume 10 155
Homogeneous, bounded reservoir (Pseudo steady state flow period).Isothermal conditions existTwo Phase Flow (Oil & Gas).Capillary pressure is neglected
Fig. (1). 3D radial Model.
3. SENSITIVITY ANALYSIS
The sensitivity analysis is performed to examine the effect of different reservoir rock and fluid properties on the IPRbehavior and hence selecting the highly sensitive parameters to be used in generating the IPR correlation.
Table (1) gives the range of reservoir rock and fluid properties used in this study. In the sensitivity analysis, oneparameter was changed at a time while the rest was kept at its base value to be able to identify the sensitive parametersto the shape of the IPR curve.
Different rock and fluid properties are included in this study and the following list gives the properties that werefound to have major effect on the IPR behavior using both IPR and dimensionless IPR plots:
Bubble Point Pressure, Pb
Reservoir Depletion Ratio (Pr/Pb)Critical Gas Saturation, Sgcr
Residual Oil Saturation in Gas, Sorg
Relative Permeability to Oil at Swcr, Krow at (Swcr)Relative Permeability to Gas at (1-Swcr-Sorg), Krg at (1-Swcr-Sorg)Oil-Gas Relative Permeability Exponent, OGEXPGas Relative Permeability Exponent, GEXPSkin, S
Figs. (2 to 19) show the IPR and dimensionless IPR behavior under the effect of the above mentioned rock and fluidproperties that affect the IPR.
Table 1. Range of data used in the construction of the Proposed IPR Correlation.
Rock/Fluid Property Range UnitsInitial Reservoir Pressure(Bubble point pressure) 1451 - 5413 psi
Reservoir Depletion Ratio (Pr/Pb) 0.33 - 0.95 dimensionlessReservoir Temperature 100 - 400 ° F
Oil Gravity 0.7 - 0.85 dimensionless
Single well at the center

156 The Open Petroleum Engineering Journal, 2017, Volume 10 Daoud et al.
Rock/Fluid Property Range UnitsGas Gravity 0.5 - 1.2 dimensionless
Water Gravity 1.0 – 1.25 dimensionlessWater Viscosity 0.1 - 1.0 cp
Rs 0.47 - 2.16 Mscf/stbΒo 1.12 - 2.52 bbl/stbµo 0.09 - 0.44 cp
Z(Gas Deviation Factor) 0.7 - 1.042 dimensionlessSwcr 0 - 0.3 fractionSgcr 0 - 0.3 fractionSorw 0 - 0.6 fractionSorg 0 - 0.4 fraction
OGEXP (Krog Exponent) 1 - 5 dimensionlessOWEXP (Krow Exponent) 1 - 7 dimensionlessWEXP (Krw Exponent) 2 - 8 dimensionlessGEXP (Krg Exponent) 1 - 7 dimensionless
Krw at (Sorw) 0.2 – 1.0 fractionKrow at (Swcr) 0.2 – 1.0 fraction
Krg at (1-Swcr-Sorg) 0.4 – 1.0 fractionDrainage Radius 100 - 10000 ft
Thickness, h 10 - 1000 ftKv 0.5 – 500 mdKh 1 - 1000 md
Skin (-6) to (6) dimensionlessPorosity 0.03 - 0.35 fraction
Fig. (2). Effect of Bubble Point Pressure on the IPR curve.
(Table 1) contd.....
0
1000
2000
3000
4000
5000
6000
0 50000 100000 150000 200000 250000 300000 350000
Oil Rate, BOPD
P wf,p
si
1451 psi1945 psi2439 psi2934 psi3086 psi3924 psi4420 psi4916 psi5413 psi

Inflow Performance Relationship Correlation The Open Petroleum Engineering Journal, 2017, Volume 10 157
Fig. (3). Effect of Bubble Point Pressure on the dimensionless IPR curve.
Fig. (4). Effect of Reservoir Pressure Depletion on the IPR curve.
Fig. (5). Effect of Reservoir Pressure Depletion on the dimensionless IPR curve.
0
0.1
0.2
0.3
0.4
0.5
0.6
0.7
0.8
0.9
1
0 0.1 0.2 0.3 0.4 0.5 0.6 0.7 0.8 0.9 1
qo/qomax
P wf/P
r
1451 psi1945 psi2439 psi2934 psi3429 psi3924 psi4420 psi4916 psi5413 psi

158 The Open Petroleum Engineering Journal, 2017, Volume 10 Daoud et al.
Fig. (6). Effect of Sgcr on the IPR curve.
Fig. (7). Effect of Sgcr on the dimensionless IPR curve.
Fig. (8). Effect of Sorg on the IPR curve.
0
500
1000
1500
2000
2500
0 50000 100000 150000 200000 250000 300000
P wf,
psi
Oil Rate, BOPD
00.10.20.250.270.280.3
0
0.1
0.2
0.3
0.4
0.5
0.6
0.7
0.8
0.9
1
0
0.1
0.2
0.3
0.4
0.5
0.6
0.7
0.8
0.9
1
0 0.1 0.2 0.3 0.4 0.5 0.6 0.7 0.8 0.9
Krg
Kro
Sg
Kro
Krg Sgcr=0
Krg Sgcr=0.2
0
0.1
0.2
0.3
0.4
0.5
0.6
0.7
0.8
0.9
1
0 0.1 0.2 0.3 0.4 0.5 0.6 0.7 0.8 0.9 1qo/qomax
P wf/P
r
00.10.20.250.270.280.3
0.0
500.0
1000.0
1500.0
2000.0
2500.0
0 50000 100000 150000 200000 250000 300000
P wf, p
si
Oil Rate, BOPD
00.10.20.30.350.4
0
0.1
0.2
0.3
0.4
0.5
0.6
0.7
0.8
0.9
1
0
0.1
0.2
0.3
0.4
0.5
0.6
0.7
0.8
0.9
1
0 0.1 0.2 0.3 0.4 0.5 0.6 0.7 0.8 0.9 1
K rg
K rog
Sg
Krog Sorg=0
Krog Sorg=0.2
Krog Sorg=0.4
Krg

Inflow Performance Relationship Correlation The Open Petroleum Engineering Journal, 2017, Volume 10 159
Fig. (9). Effect of Sorg on the dimensionless IPR curve.
Fig. (10). Effect of Krow at (Swcr) on the IPR curve.
Fig. (11). Effect of Krow at (Swcr) on the dimensionless IPR curve.
0.0
0.1
0.2
0.3
0.4
0.5
0.6
0.7
0.8
0.9
1.0
0 0.1 0.2 0.3 0.4 0.5 0.6 0.7 0.8 0.9 1
qo/qomax
P wf/P
r
00.10.20.30.350.4
0
500
1000
1500
2000
2500
0 50000 100000 150000 200000 250000 300000
Oil Rate, BOPD
P wf,
psi
0.20.40.60.81.0
0
0.1
0.2
0.3
0.4
0.5
0.6
0.7
0.8
0.9
1
0 0.1 0.2 0.3 0.4 0.5 0.6 0.7 0.8 0.9 1
qo/qomax
P wf/P
r
0.20.40.60.81.0

160 The Open Petroleum Engineering Journal, 2017, Volume 10 Daoud et al.
Fig. (12). Effect of Krg at (1-Swcr-Sorg) on the IPR curve.
Fig. (13). Effect of Krg at (1-Swcr-Sorg) on the dimensionless IPR curve.
Fig. (14). Effect of OG Exponent on the IPR curve.
0
0.1
0.2
0.3
0.4
0.5
0.6
0.7
0.8
0.9
1
0 0.1 0.2 0.3 0.4 0.5 0.6 0.7 0.8 0.9 1
qo/qomax
p wf/p
r
0.40.60.80.91.0
0
500
1000
1500
2000
2500
0 50000 100000 150000 200000 250000 300000 350000 400000 450000
p wf, p
si
Oil Rate, BOPD
1235
0
0.1
0.2
0.3
0.4
0.5
0.6
0.7
0.8
0.9
1
0
0.1
0.2
0.3
0.4
0.5
0.6
0.7
0.8
0.9
1
0 0.1 0.2 0.3 0.4 0.5 0.6 0.7 0.8 0.9 1
KrgK
rog
Sg
Kro OGEXP=1Kro OGEXP=3Kro OGEXP=5Krg
Inflow Performance Relationship Correlation The Open Petroleum Engineering Journal, 2017, Volume 10 161
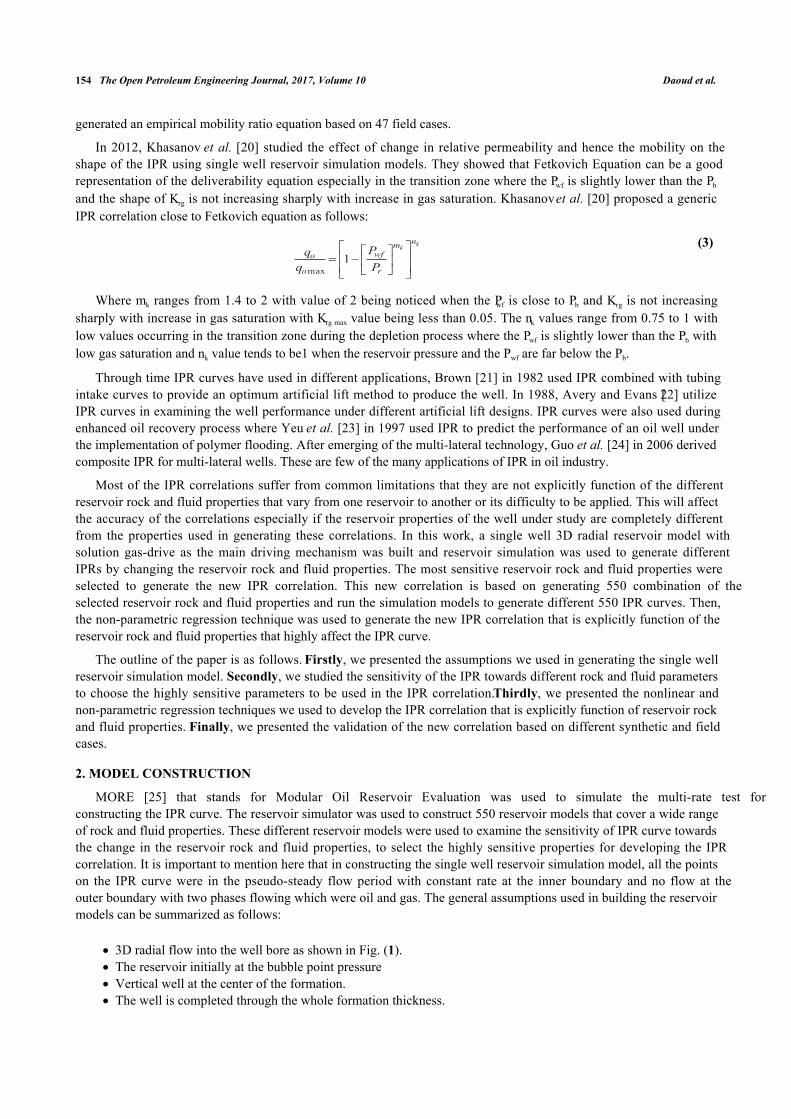
Fig. (15). Effect of OG Exponent on the dimensionless IPR curve.
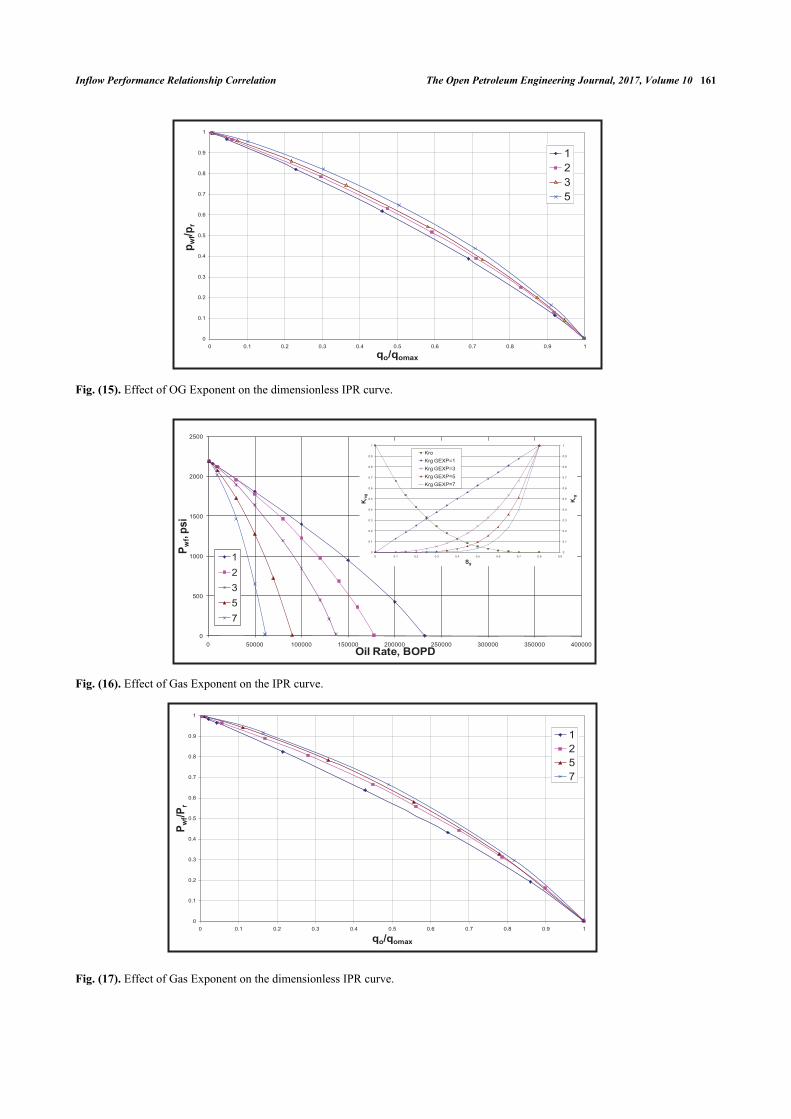
Fig. (16). Effect of Gas Exponent on the IPR curve.
Fig. (17). Effect of Gas Exponent on the dimensionless IPR curve.
0
0.1
0.2
0.3
0.4
0.5
0.6
0.7
0.8
0.9
1
0 0.1 0.2 0.3 0.4 0.5 0.6 0.7 0.8 0.9 1
qo/qomax
p wf/p
r
1235
0
500
1000
1500
2000
2500
0 50000 100000 150000 200000 250000 300000 350000 400000
P wf, p
si
Oil Rate, BOPD
12357
0
0.1
0.2
0.3
0.4
0.5
0.6
0.7
0.8
0.9
1
0
0.1
0.2
0.3
0.4
0.5
0.6
0.7
0.8
0.9
1
0 0.1 0.2 0.3 0.4 0.5 0.6 0.7 0.8 0.9
K rg
K rog
Sg
KroKrg GEXP=1Krg GEXP=3Krg GEXP=5Krg GEXP=7
0
0.1
0.2
0.3
0.4
0.5
0.6
0.7
0.8
0.9
1
0 0.1 0.2 0.3 0.4 0.5 0.6 0.7 0.8 0.9 1
qo/qomax
P wf/P
r
1257
162 The Open Petroleum Engineering Journal, 2017, Volume 10 Daoud et al.
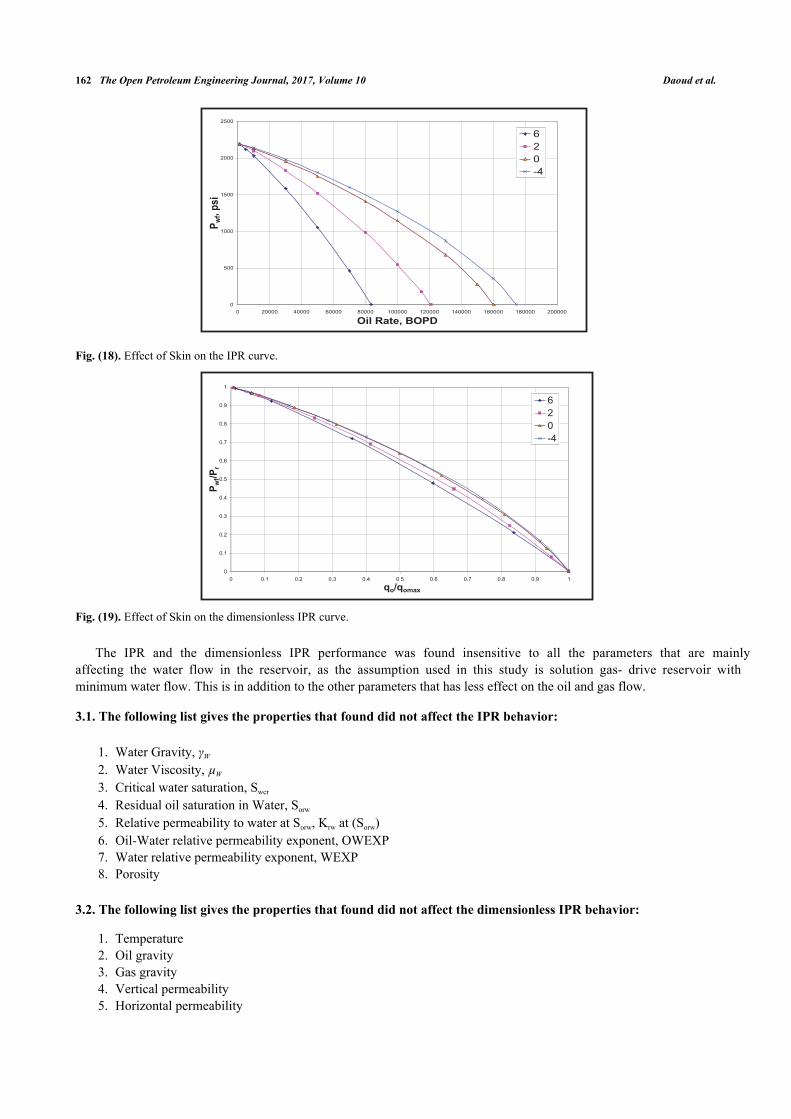
Fig. (18). Effect of Skin on the IPR curve.
Fig. (19). Effect of Skin on the dimensionless IPR curve.
The IPR and the dimensionless IPR performance was found insensitive to all the parameters that are mainlyaffecting the water flow in the reservoir, as the assumption used in this study is solution gas- drive reservoir withminimum water flow. This is in addition to the other parameters that has less effect on the oil and gas flow.
3.1. The following list gives the properties that found did not affect the IPR behavior:
Water Gravity, γW1.Water Viscosity, µW2.Critical water saturation, Swcr3.Residual oil saturation in Water, Sorw4.Relative permeability to water at Sorw, Krw at (Sorw)5.Oil-Water relative permeability exponent, OWEXP6.Water relative permeability exponent, WEXP7.Porosity8.
3.2. The following list gives the properties that found did not affect the dimensionless IPR behavior:
Temperature1.Oil gravity2.Gas gravity3.Vertical permeability4.Horizontal permeability5.
0
500
1000
1500
2000
2500
0 20000 40000 60000 80000 100000 120000 140000 160000 180000 200000
Oil Rate, BOPD
P wf, p
si
620-4
0
0.1
0.2
0.3
0.4
0.5
0.6
0.7
0.8
0.9
1
0 0.1 0.2 0.3 0.4 0.5 0.6 0.7 0.8 0.9 1
qo/qomax
P wf/P
r
620-4

Inflow Performance Relationship Correlation The Open Petroleum Engineering Journal, 2017, Volume 10 163
Drainage radius6.Formation thickness7.
3.3. Non-Parametric Regression Analysis
550 IPRs were generated from the combination of the 9 sensitive parameters identified from the sensitivity analysisusing simulation models. This was followed by implementing the non-linear regression technique to get the distinctparameter (C1) that represents each IPR based on Vogel [4] and Richardson and Shaw [7] correlations as shown belowin Eq. 4:
(4)
The generated values for C1 corresponding to the 550 combinations of different rock and fluid properties representthe database used in generating the new IPR correlation.
In order to generate IPR correlation that is explicitly function of the different reservoir rock and fluid properties, weneed to build a correlation between the C1 (dependent variables) given in Eq. 4 and the 9 sensitive rock and fluidproperties (independent variables) presented before. Since the formula that relates the dependent and independentvariables is not known so parametric regression analysis cannot be implemented here which leads to the implementationof non-parametric regression analysis in our work. Neural Network modeling can be considered as one of the non-parametric modeling approaches and has wide range of applications in oil industry. However, the method that was usedhere is based on the Alternating Conditional Expectation (ACE) algorithm [26, 27]. A comparison between NeuralNetwork and ACE algorithm was used to build bubble point pressure correlation for oil reservoirs [28] and it was foundthat the predictive strength of ACE is much higher compared to Neural Network for the studied samples. The ACEalgorithm is based on the concept of developing non-parametric transformations of the dependent and independentvariables. Moreover, the transformations are constructed point wise based only on the data without the need to know aprior function between the dependent and independent variables. The final correlation is given by plotting thetransformed dependent variable against the sum of the transformed independent variables. The final result is amaximum correlation between the dependent and multiple independent variables with a minimum error. Fig. (20) showsthe relationship between the transformed dependent variable C1 versus the sum of the transformed independent variablesthat gives the highest correlation coefficient. The optimal regression correlation here is 0.91775 as shown in Fig. (20).
Fig. (20). Transformed dependent variable vs. sum of the transformed independent variables.
The 550 several combinations of the 9 sensitive parameters which represent the independent variables with onedependent variable that is C1 were used in the ACE Algorithm [27] to find the best correlation between the dependentand the independent variables. The resulted IPR correlation is given in Eq. 4 with C1 as explicit polynomial function of
� �2
11max
11 ��
�
����
�
�
���
r
wf
r
wf
o
o
PP
CPP
Cq
q
Optimal Regression, Correl:0.91775
-3.00E+00
-2.00E+00
-1.00E+00
0.00E+00
1.00E+00
2.00E+00
3.00E+00
4.00E+00
-3.00E+00 -2.00E+00 -1.00E+00 0.00E+00 1.00E+00 2.00E+00 3.00E+00 4.00E+00
Sum_Tr_Indep
C1_
Tr

164 The Open Petroleum Engineering Journal, 2017, Volume 10 Daoud et al.
different reservoir rock and fluid properties which is given as follows:
(5)
Where, the independent variable (A) is given as:
(6)
Fig. (21) shows the comparison between the calculated and measured C1 distinct IPR parameter from our reservoirparameters data base used in building the IPR correlation. This reflects the good accuracy of the correlation toaccurately predict the IPR performance within our data base. At the same time, the variation of C1 from 0 to 1 reflectsthat the selected reservoir parameters used in building the IPR correlation cover wide range of reservoir rock and fluidproperties which increase the range of application of the proposed IPR correlation compared to C1 of 0.2 used by Vogel[4] correlation.
Fig. (21). C1 comparison; simulation versus proposed correlation for the data base cases.
� � � � 0.517 +0.161 + 0.012- 2
1 AAC �
JIHGFEDCBA Where,
0.1 +1.326 -1.34 2
b
r
b
rP
PP
PB
1.431 +0.766 -0.072 2 GEXPGEXPC
0.457 -0.634 + 0.054 )1(
2
)1( SorgSwirgSorgSwirg KKD
0.793 + 1.471 - 0.424 2
wcrwcr SrowSrow KKE
1.487 +0.816 -0.083 2 OGEXPOGEXPF
0.225 +04-2.28E -08-4.812E 2bb PPG
0.171 -2.421 +1.192- 2gcrgcr SSH
0.165 -0.202 +0.02 2 ssI
0.161 +1.351 -0.963 2orgorg SSJ
0
0.1
0.2
0.3
0.4
0.5
0.6
0.7
0.8
0.9
1
1 51 101 151 201 251 301 351 401 451 501 551No of simulation runs
C 1
simulationcorrelation

Inflow Performance Relationship Correlation The Open Petroleum Engineering Journal, 2017, Volume 10 165
4. VALIDATION
4.1. Synthetic Cases
In order to test the performance of our proposed IPR correlation in accurately predicting the IPR performance, wegenerated nine different combinations of reservoir rock and fluid properties which are different from those used in ourdata base used in building the correlation, and then we used reservoir simulation model to generate the IPRs for these 9different combinations. We used our proposed correlation with the nine different reservoir rock and fluid properties toestimate the distinct IPR parameter C1 which is then used to get the IPR performance per each reservoir and compare itwith the actual IPR generated from the reservoir simulation. The proposed IPR correlation was able to successfullypredict the true IPR with the least error compared to the other IPR models within errors range from 2.0 to 2.4%. Fig.(22) shows the comparison between the actual C1 generated from the reservoir simulation models with that calculatedfrom the proposed IPR correlation from the data base cases and the nine validation cases (points in pink color). Inaddition, Figs. (23a and b) and Tables (2a and b) give the IPR comparison from 2 out of the 9 validation cases whichshow 2.4 and 2.3% error respectively. As observed from Figs. (23a, and b) and Table (2a and b) our proposedcorrelation was able to accurately predict the IPR performance within an acceptable accuracy compared to the othercorrelations. In all these synthetic cases, the multi rate test data was taken at high draw down that can reach to morethan 90% of the reservoir pressure which is practically difficult to be done in the field cases as will be shown later.
Fig. (22). Comparison of C1 from the simulation models and the proposed correlation for the 550 data base cases and 9 syntheticcases.
Table 2a. Multi-rate test data and estimated flow rates for synthetic case 1.
Multi rate Data ProposedCorrelation Vogel Fetkovich Jones et al. Klins and
Majcher
Archer, DelCastillo andBlasingame
WigginsEmpiricalSolution
WigginsAnalyticalSolution
Sukarno andWisnogroho
Pwf
(psi)qo
(bbl/day)qo (bbl/day) qo
(bbl/day)qo (bbl/day) qo
(bbl/day)qo
(bbl/day)qo
(bbl/day)qo (bbl/day) qo (bbl/day) qo
(bbl/day)2917 1000 1012 1058 906 994 1373 1040 1013 1014 11032569 5000 5066 5200 5000 5000 6010 5148 5083 5082 53232105 10000 10000 10000 10000 10000 10000 10000 10000 10000 100001602 15000 14753 14282 14463 15070 12472 14465 14685 14598 138951031 20000 19378 17963 18130 20444 14009 18512 19171 18760 16904321 25000 24016 20815 20506 26699 15227 22056 23543 22238 187887 26550 25662 21459 20761 29321 15712 23089 25039 23133 190560 25699 21470 20762 29383 15724 23110 25072 23149 19059
Average absoluteerrors 2.4% 10.1% 12.4% 4.1% 30.7% 7.1% 3.5% 6.0% 15.5%
0
0.1
0.2
0.3
0.4
0.5
0.6
0.7
0.8
0.9
1
0 0.1 0.2 0.3 0.4 0.5 0.6 0.7 0.8 0.9 1
C1_Simulation
C1_C
orrel
ation
Data Base Cases
Validation cases
Synthetic Case 1
Synthetic Case 2

166 The Open Petroleum Engineering Journal, 2017, Volume 10 Daoud et al.
Table 2b. Multi-rate test data and estimated flow rates for synthetic case 2.
Multi rate Data ProposedCorrelation Vogel Fetkovich Jones et
al..Klins andMajcher
Archer, DelCastillo andBlasingame
WigginsEmpiricalSolution
WigginsAnalyticalSolution
Sukarno andWisnogroho
Pwf
(psi)qo
(bbl/day)qo (bbl/day) qo
(bbl/day)qo (bbl/day) qo
(bbl/day)qo
(bbl/day)qo
(bbl/day)qo (bbl/day) qo (bbl/day) qo
(bbl/day)3810 1000 937 985 898 967 1466 974 944 951 10403152 4000 3969 4060 4000 4000 4743 4039 3987 4010 41562669 6000 6000 6000 6000 6000 6000 6000 6000 6000 60002137 8000 8037 7812 7851 8027 6787 7866 7991 7895 76151524 10000 10131 9491 9498 10192 7329 9642 9998 9671 8984824 12000 12187 10866 10714 12482 7788 11177 11911 11148 9984390 13000 13284 11431 11106 13824 8055 11867 12896 11776 103519 13660 14136 11745 11220 14959 8288 12307 13634 12153 105420 14155 11750 11220 14985 8294 12315 13650 12160 10545
Average absoluteerrors 2.3% 6.6% 10.0% 4.2% 31.4% 4.9% 1.1% 5.3% 11.8%
Fig. (23). IPR comparison of two validation cases from the proposed correlation compared to actual generated from simulation andother commonly used IPR correlations.
4.2. Field Cases
Three different field cases from different solution gas-drive fields worldwide were used to test the practicalapplication of the proposed correlation compared to the other widely used correlations in accurately predicting themulti-rate test data. The major difficulties noticed in these field cases are that, most of the multi rate tests taken fromwells especially in solution gas-drive reservoirs were obtained with minimum range of draw down as it is practicallydifficult to design multi rate tests for wells with high drawdown. On the contrary, for the synthetic cases shown above,we have tendency to reach very high drawdown where the bottom hole flowing pressure can reach to extremely lowvalues as shown in Figs. (23a and b) where one is able to test the performance of different correlations at low and highdrawdown conditions for better judgement. This problem in most of the multi-rate test data of all the field cases leads tothe difficulty in assessing the effectiveness of our proposed correlation compared to the other correlations as all of thecorrelations give acceptable results at low range of drawdowns which will be observed in the next section of the fieldcases discussion.
(a) (b) IPR comparison for synthetic case 1 IPR comparison for synthetic case 2
0
500
1000
1500
2000
2500
3000
3500
0 5000 10000 15000 20000 25000 30000 35000Oil Rate, BOPD
Pwf,p
si
New CorrelationvogelfetkovichJones et alKlins and MajcherArcher, Del Castillo and BlasingameWiggin Empirical ApproachWiggin Analytical ApproahSukarno and Wisnogrohosimulation
test point
0
500
1000
1500
2000
2500
3000
3500
4000
4500
0 2000 4000 6000 8000 10000 12000 14000 16000
Oil Rate, BOPD
Pwf,
psi
New correlationvogelfetkovichJones et alKlins and MajcherArcher, Del Castillo and BlasingameWiggin Empirical ApproachWiggin Analytical ApproahSukarno and Wisnogrohosimulation
test point
Inflow Performance Relationship Correlation The Open Petroleum Engineering Journal, 2017, Volume 10 167
4.2.1. Field Case 1: Well 6, Field A [5, 29]
Field A is solution gas-drive carbonate reservoir; the average gas saturation at the time of the tests was between 10and 12%. The reservoir was above the critical gas saturation at the time of the tests. The rock and fluid properties andthe C1 IPR distinct parameters calculated from the proposed correlation are given in Table (3).
The test consists of seven individual flows, the first four flow rates were run in a normal increasing sequencefollowed by reducing rate and then increasing rate. Table (4) shows the multi-rate test data taken from this well.
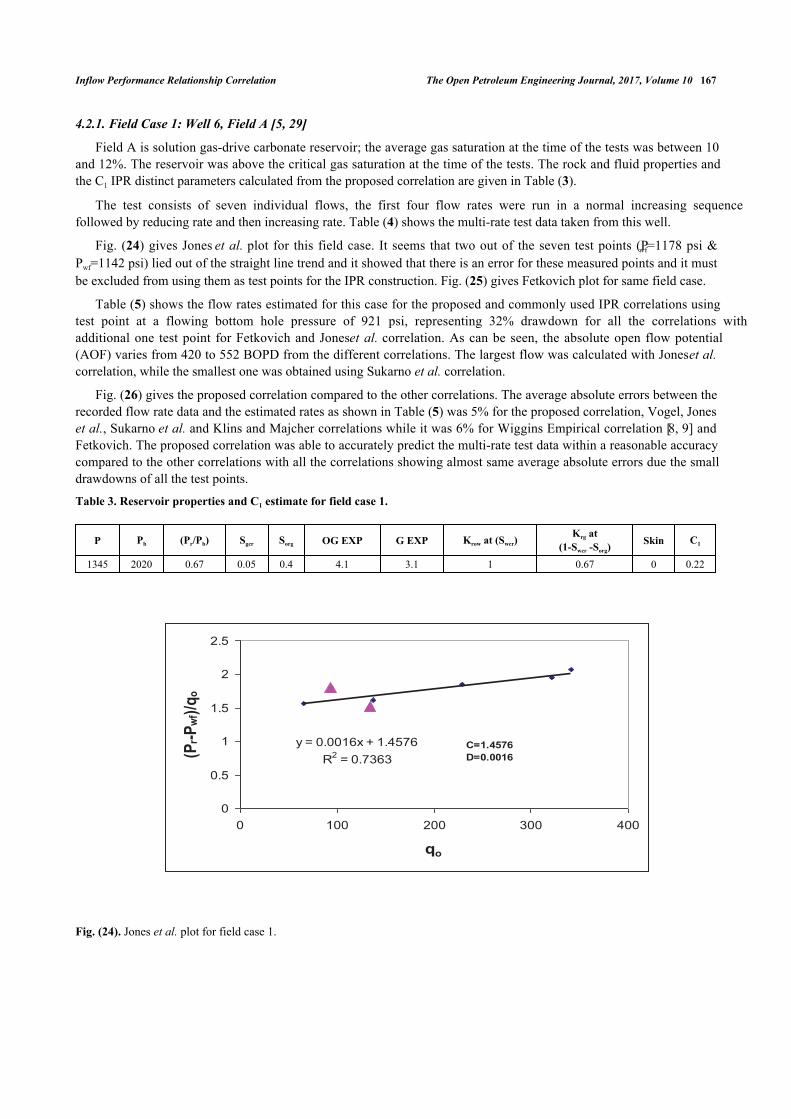
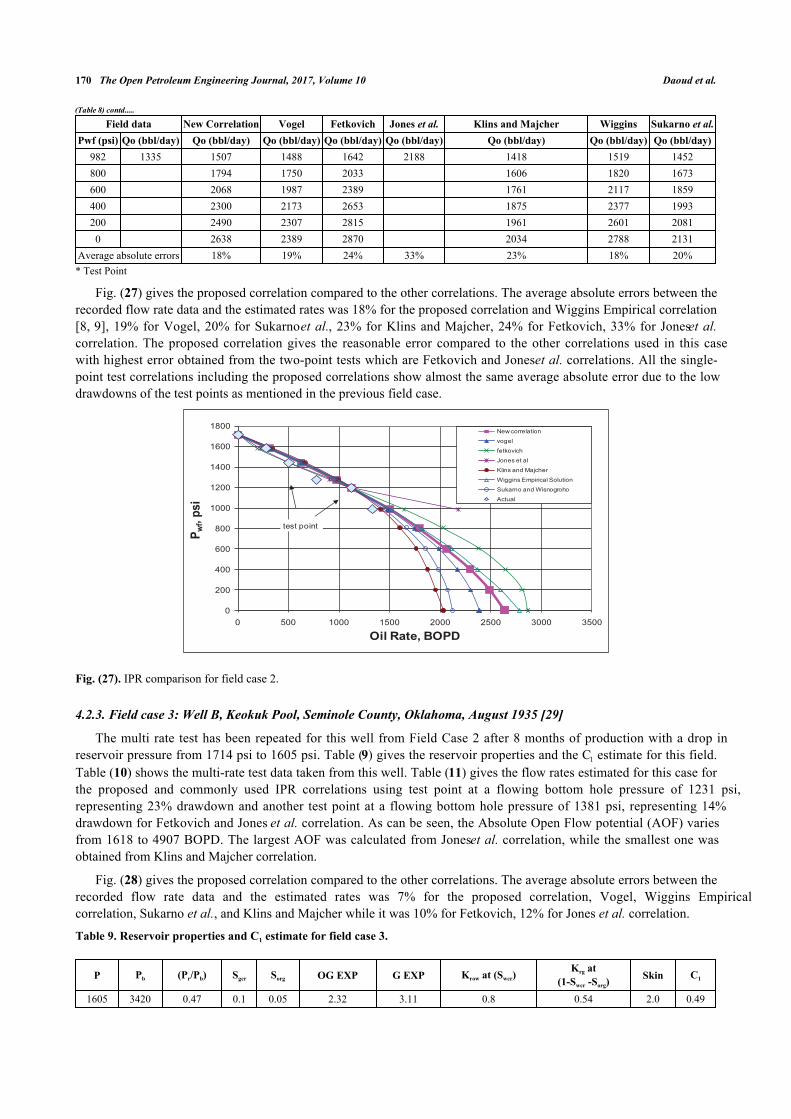
Fig. (24) gives Jones et al. plot for this field case. It seems that two out of the seven test points (Pwf=1178 psi &Pwf=1142 psi) lied out of the straight line trend and it showed that there is an error for these measured points and it mustbe excluded from using them as test points for the IPR construction. Fig. (25) gives Fetkovich plot for same field case.
Table (5) shows the flow rates estimated for this case for the proposed and commonly used IPR correlations usingtest point at a flowing bottom hole pressure of 921 psi, representing 32% drawdown for all the correlations withadditional one test point for Fetkovich and Jones et al. correlation. As can be seen, the absolute open flow potential(AOF) varies from 420 to 552 BOPD from the different correlations. The largest flow was calculated with Jones et al.correlation, while the smallest one was obtained using Sukarno et al. correlation.
Fig. (26) gives the proposed correlation compared to the other correlations. The average absolute errors between therecorded flow rate data and the estimated rates as shown in Table (5) was 5% for the proposed correlation, Vogel, Joneset al., Sukarno et al. and Klins and Majcher correlations while it was 6% for Wiggins Empirical correlation [8, 9] andFetkovich. The proposed correlation was able to accurately predict the multi-rate test data within a reasonable accuracycompared to the other correlations with all the correlations showing almost same average absolute errors due the smalldrawdowns of all the test points.
Table 3. Reservoir properties and C1 estimate for field case 1.
P Pb (Pr/Pb) Sgcr Sorg OG EXP G EXP Krow at (Swcr)Krg at
(1-Swcr -Sorg)Skin C1
1345 2020 0.67 0.05 0.4 4.1 3.1 1 0.67 0 0.22
Fig. (24). Jones et al. plot for field case 1.
y = 0.0016x + 1.4576R2 = 0.7363
0
0.5
1
1.5
2
2.5
0 100 200 300 400
qo
(Pr-P
wf)/q
o
C=1.4576D=0.0016
168 The Open Petroleum Engineering Journal, 2017, Volume 10 Daoud et al.
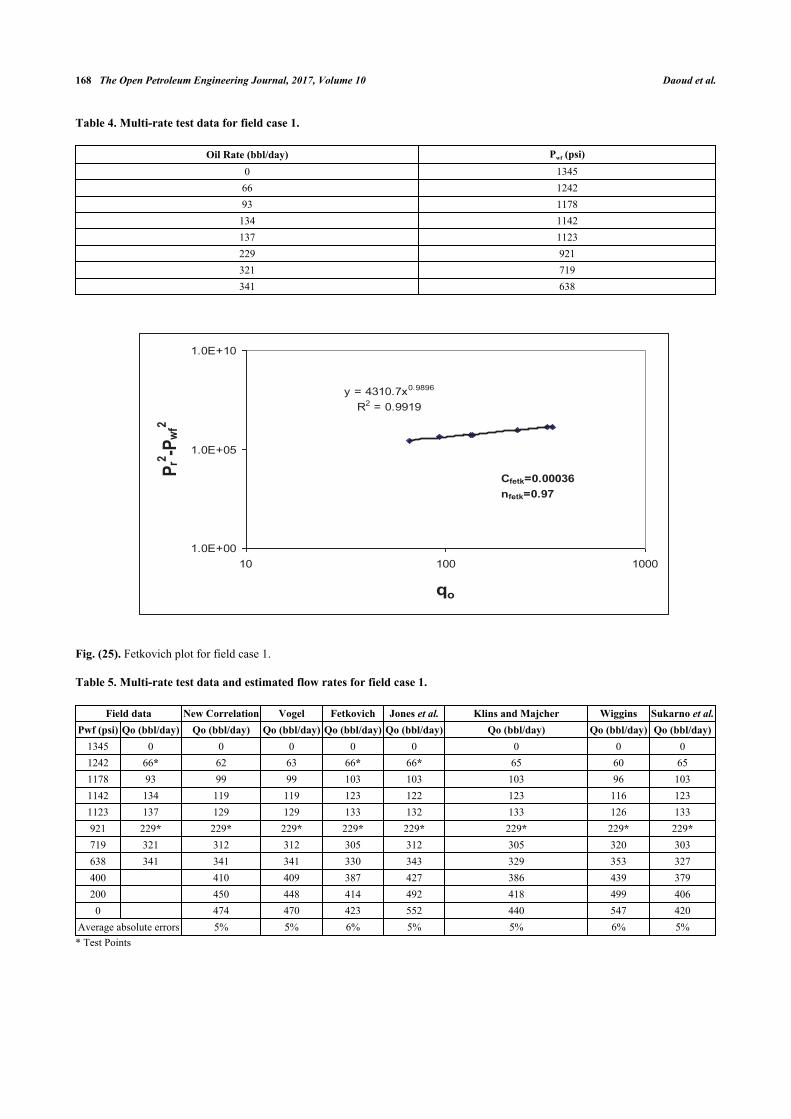
Table 4. Multi-rate test data for field case 1.
Oil Rate (bbl/day) Pwf (psi)0 134566 124293 1178134 1142137 1123229 921321 719341 638
Fig. (25). Fetkovich plot for field case 1.
Table 5. Multi-rate test data and estimated flow rates for field case 1.
Field data New Correlation Vogel Fetkovich Jones et al. Klins and Majcher Wiggins Sukarno et al.Pwf (psi) Qo (bbl/day) Qo (bbl/day) Qo (bbl/day) Qo (bbl/day) Qo (bbl/day) Qo (bbl/day) Qo (bbl/day) Qo (bbl/day)
1345 0 0 0 0 0 0 0 01242 66* 62 63 66* 66* 65 60 651178 93 99 99 103 103 103 96 1031142 134 119 119 123 122 123 116 1231123 137 129 129 133 132 133 126 133921 229* 229* 229* 229* 229* 229* 229* 229*719 321 312 312 305 312 305 320 303638 341 341 341 330 343 329 353 327400 410 409 387 427 386 439 379200 450 448 414 492 418 499 4060 474 470 423 552 440 547 420
Average absolute errors 5% 5% 6% 5% 5% 6% 5%* Test Points
y = 4310.7x0.9896
R2 = 0.9919
1.0E+00
1.0E+05
1.0E+10
10 100 1000
qo
P r2 -P
wf2
Cfetk=0.00036nfetk=0.97

Inflow Performance Relationship Correlation The Open Petroleum Engineering Journal, 2017, Volume 10 169
Fig. (26). IPR comparison for field case 1.
4.2.2. Field case 2: Well B, Keokuk Pool, Seminole County, Oklahoma, December 1934 [29]
Table (6) gives the reservoir properties and the C1 estimate for this field case. Table (7) shows the multi-rate testdata taken from this case. Table (8) shows the flow rates estimated for this case for the proposed and commonly usedIPR correlations using test point at a flowing bottom hole pressure of 1196 psi, representing 30% drawdown andanother test point at a flowing bottom hole pressure of 1443 psi, representing 16% drawdown for Fetkovich and Jones etal. correlation. The absolute open flow potential (AOF) varies from 2034 to 2870 BOPD. The largest AOF wascalculated from Fetkovich while the smallest one was obtained from Klins and Majcher correlation.
Table 6. Reservoir properties and C1 estimate for field case 2.
P Pb (Pr/Pb) Sgcr Sorg OG EXP G EXP Krow at (Swcr)Krg at
(1-Swcr -Sorg)Skin C1
1714 3420 0.50 0.1 0.05 2.32 3.11 0.8 0.54 0.1 0.41
Table 7. Multi-rate test data for field case 2.
Oil Rate (bbl/day) Pwf (psi)0 1714
280 1583508 1443780 12721125 11961335 982
Table 8. Multi-rate test data and estimated flow rates for field case 2.
Field data New Correlation Vogel Fetkovich Jones et al. Klins and Majcher Wiggins Sukarno et al.Pwf (psi) Qo (bbl/day) Qo (bbl/day) Qo (bbl/day) Qo (bbl/day) Qo (bbl/day) Qo (bbl/day) Qo (bbl/day) Qo (bbl/day)
1714 0 0 0 0 0 0 0 01583 280 311 317 195 231 349 307 3311443 508* 624 632 508* 508* 671 619 6501272 780 978 982 934 910 1000 975 9901196 1125* 1125* 1125* 1125* 1125* 1125* 1125* 1125*
0
200
400
600
800
1000
1200
1400
1600
0 100 200 300 400 500 600Oil Rate, BOPD
P wf,
psi
New correlationvogelfetkovichJones et alKlins and Majcherw iggins Empirical SolutionSukarno and WisnogrohoActual
test point
170 The Open Petroleum Engineering Journal, 2017, Volume 10 Daoud et al.
Field data New Correlation Vogel Fetkovich Jones et al. Klins and Majcher Wiggins Sukarno et al.Pwf (psi) Qo (bbl/day) Qo (bbl/day) Qo (bbl/day) Qo (bbl/day) Qo (bbl/day) Qo (bbl/day) Qo (bbl/day) Qo (bbl/day)
982 1335 1507 1488 1642 2188 1418 1519 1452800 1794 1750 2033 1606 1820 1673600 2068 1987 2389 1761 2117 1859400 2300 2173 2653 1875 2377 1993200 2490 2307 2815 1961 2601 20810 2638 2389 2870 2034 2788 2131
Average absolute errors 18% 19% 24% 33% 23% 18% 20%* Test Point
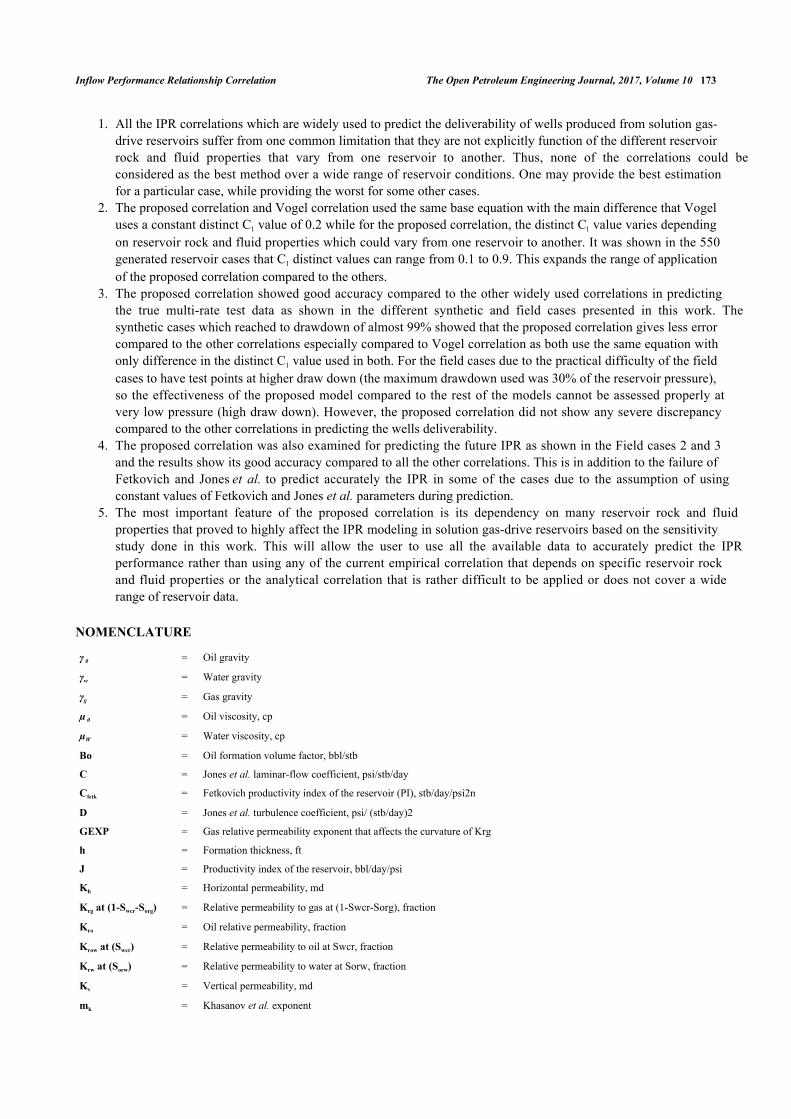
Fig. (27) gives the proposed correlation compared to the other correlations. The average absolute errors between therecorded flow rate data and the estimated rates was 18% for the proposed correlation and Wiggins Empirical correlation[8, 9], 19% for Vogel, 20% for Sukarno et al., 23% for Klins and Majcher, 24% for Fetkovich, 33% for Jones et al.correlation. The proposed correlation gives the reasonable error compared to the other correlations used in this casewith highest error obtained from the two-point tests which are Fetkovich and Jones et al. correlations. All the single-point test correlations including the proposed correlations show almost the same average absolute error due to the lowdrawdowns of the test points as mentioned in the previous field case.
Fig. (27). IPR comparison for field case 2.
4.2.3. Field case 3: Well B, Keokuk Pool, Seminole County, Oklahoma, August 1935 [29]
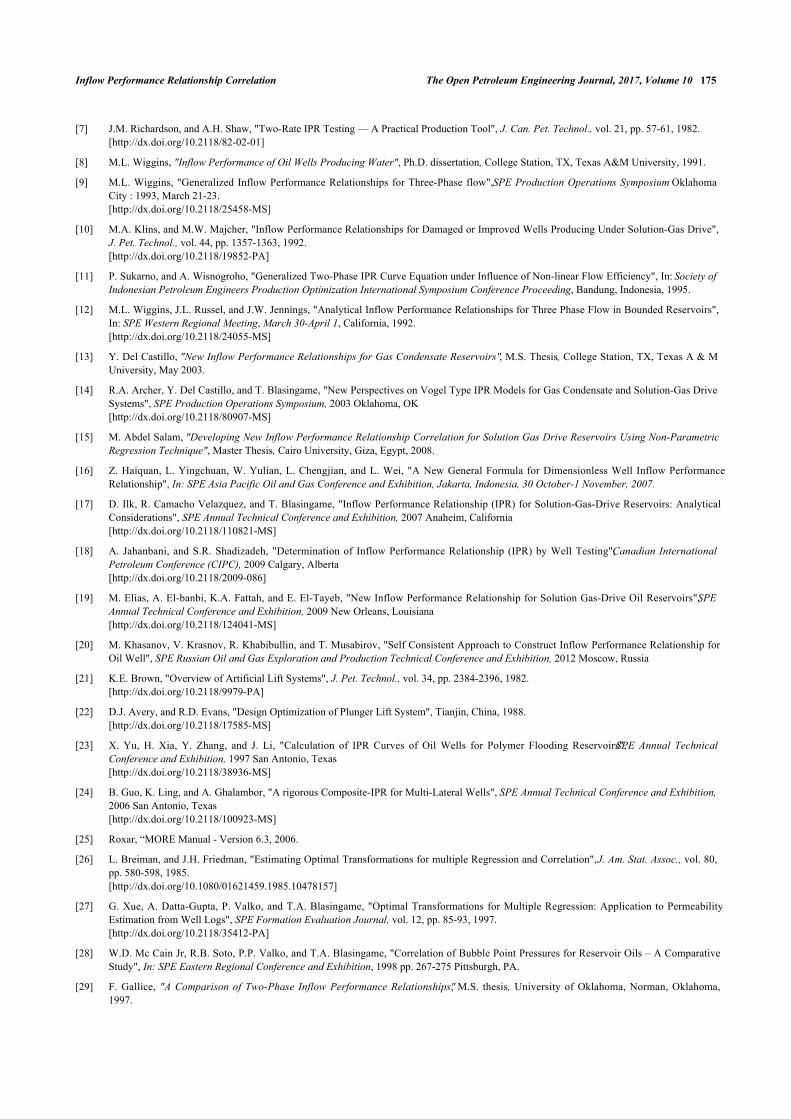
The multi rate test has been repeated for this well from Field Case 2 after 8 months of production with a drop inreservoir pressure from 1714 psi to 1605 psi. Table (9) gives the reservoir properties and the C1 estimate for this field.Table (10) shows the multi-rate test data taken from this well. Table (11) gives the flow rates estimated for this case forthe proposed and commonly used IPR correlations using test point at a flowing bottom hole pressure of 1231 psi,representing 23% drawdown and another test point at a flowing bottom hole pressure of 1381 psi, representing 14%drawdown for Fetkovich and Jones et al. correlation. As can be seen, the Absolute Open Flow potential (AOF) variesfrom 1618 to 4907 BOPD. The largest AOF was calculated from Jones et al. correlation, while the smallest one wasobtained from Klins and Majcher correlation.
Fig. (28) gives the proposed correlation compared to the other correlations. The average absolute errors between therecorded flow rate data and the estimated rates was 7% for the proposed correlation, Vogel, Wiggins Empiricalcorrelation, Sukarno et al., and Klins and Majcher while it was 10% for Fetkovich, 12% for Jones et al. correlation.
Table 9. Reservoir properties and C1 estimate for field case 3.
P Pb (Pr/Pb) Sgcr Sorg OG EXP G EXP Krow at (Swcr)Krg at
(1-Swcr -Sorg)Skin C1
1605 3420 0.47 0.1 0.05 2.32 3.11 0.8 0.54 2.0 0.49
(Table 8) contd.....
0
200
400
600
800
1000
1200
1400
1600
1800
0 500 1000 1500 2000 2500 3000 3500
P wf, p
si
Oil Rate, BOPD
New correlation
vogel
fetkovich
Jones et al
Klins and Majcher
Wiggins Empirical Solution
Sukarno and Wisnogroho
Actual
test point

Inflow Performance Relationship Correlation The Open Petroleum Engineering Journal, 2017, Volume 10 171
Table 10. Multi-rate test data for field case 3.
Oil Rate (bbl/day) Pwf (psi)0 1605
420 1381720 1231850 1120
Table 11. Multi-rate test data and estimated flow rates for field case 3.
Field data New Correlation Vogel Fetkovich Jones et al. Klins and Majcher Wiggins Sukarno et al.Pwf (psi) Qo (bbl/day) Qo (bbl/day) Qo (bbl/day) Qo (bbl/day) Qo (bbl/day) Qo (bbl/day) Qo (bbl/day) Qo (bbl/day)
1605 0 0 0 0 0 0 0 01381 420* 446 451 420* 420* 467 445 4591231 720* 720* 720* 720* 720* 720* 720* 720*1120 850 910 902 931 953 880 911 889982 1131 1107 1174 1259 1048 1134 1073800 1397 1343 1454 1695 1226 1404 1273600 1656 1558 1703 2233 1372 1668 1442400 1880 1724 1883 2861 1478 1899 1561200 2069 1843 1993 3651 1555 2095 16390 2222 1915 2030 4907 1618 2258 1683
Average absolute errors 7% 7% 10% 12% 7% 7% 7%* Test Point
Fig. (28). IPR comparison for field case 3.
This case represents a good opportunity to examine the behavior of the proposed correlation in predicting the futureIPR using Eickmeier [30] Equation compared to the other correlations. Eickmeier equation as shown below is used topredict maximum oil rate by knowing the predicted reservoir pressure:
(7)
The IPR prediction using Fetkovich is based on assuming constant values for nfetk, Cfetk. Case 2 and 3 show minordifferences in these values so the assumption of using these values as constant during prediction is valid in this caseonly.
Table (12) shows the predicted flow rates for field case 3 using data from case 2 for the proposed and the othercommonly used correlations. As can be seen, the absolute open flow potential (AOF) varies from 1670 to 2357 BOPD.
0
200
400
600
800
1000
1200
1400
1600
1800
0 500 1000 1500 2000 2500 3000 3500 4000 4500 5000
P wf, p
si
Oil Rate, BOPD
New correlation
vogel
fetkovich
Jones et al
Klins and Majcher
Wiggins Empirical Solution
Sukarno and Wisnogroho
Actualtest point

172 The Open Petroleum Engineering Journal, 2017, Volume 10 Daoud et al.
The largest AOF was calculated from Fetkovich while the smallest one was obtained from Klins and Majcher. Fig. (29)gives the proposed correlation compared to the other correlations. The average absolute errors between the recordedflow rate data and the estimated rates was 3% for the proposed correlation, 6% for Wiggins Empirical correlation, 7%for Vogel, 8% for Klins and Majcher, 9% for Sukarno et al., and Jones et al. and 10% for Fetkovich. The proposedcorrelation gives the least error compared to the other correlations during the prediction which indicates the reasonableaccuracy of the proposed correlation in predicting the future IPR.
Field cases 2 & 3 present good real field examples to examine the prediction of future IPR using Eickmeier [30]Equation. The results showed that using constant values for Fetkovich and Jones et al. during predicting the future IPRmight not be a good assumption in some cases. The proposed correlation that depends on only single-point test showsits good accuracy in predicting the future IPR compared to all the other correlations as seen from Table (12).
Table 12. Multi-rate test data and estimated future flow rates for field case 3.
Field data New Correlation Vogel Fetkovich Jones et al. Klins and Majcher Wiggins Sukarno et al.Pwf (psi) Qo (bbl/day) Qo (bbl/day) Qo (bbl/day) Qo (bbl/day) Qo (bbl/day) Qo (bbl/day) Qo (bbl/day) Qo (bbl/day)
1605 0 0 0 0 0 0 0 01381 420 435 462 355 411 482 451 4781231 720 702 738 678 739 743 730 7491120 850 887 924 924 1028 908 924 925982 1103 1134 1220 1496 1082 1150 1116800 1362 1376 1578 1265 1423 1324600 1614 1596 1908 1416 1691 1499400 1832 1766 2154 1525 1925 1623200 2016 1888 2305 1606 2124 17040 2166 1962 2357 1670 2289 1750
Average absolute errors 3% 7% 10% 9% 8% 6% 9%
Fig. (29). Future IPR comparison for field case 3.
As shown from the above field cases, variety of field cases with different reservoir rock and fluid properties werepresented. Jones at al. Correlation failed to predict the IPR to the AOF for field case 2 due to having a negativeturbulent flow coefficient (D), which resulted in calculating unreal value for the flow rates at low bottom hole flowingpressure. This limits the practical application of Jones et al. correlation.
SUMMARY AND CONCLUSION
Following conclusions can be drawn:
0
200
400
600
800
1000
1200
1400
1600
1800
0 500 1000 1500 2000 2500 3000
Pw
f, ps
i
Oil Rate, BOPD
Dec-1934
New correlation
vogel
fetkovich
Jones et al
Klins and Majcher
Wiggins Empirical Solution
Sukarno and Wisnogroho
Aug-1935
Inflow Performance Relationship Correlation The Open Petroleum Engineering Journal, 2017, Volume 10 173
All the IPR correlations which are widely used to predict the deliverability of wells produced from solution gas-1.drive reservoirs suffer from one common limitation that they are not explicitly function of the different reservoirrock and fluid properties that vary from one reservoir to another. Thus, none of the correlations could beconsidered as the best method over a wide range of reservoir conditions. One may provide the best estimationfor a particular case, while providing the worst for some other cases.The proposed correlation and Vogel correlation used the same base equation with the main difference that Vogel2.uses a constant distinct C1 value of 0.2 while for the proposed correlation, the distinct C1 value varies dependingon reservoir rock and fluid properties which could vary from one reservoir to another. It was shown in the 550generated reservoir cases that C1 distinct values can range from 0.1 to 0.9. This expands the range of applicationof the proposed correlation compared to the others.The proposed correlation showed good accuracy compared to the other widely used correlations in predicting3.the true multi-rate test data as shown in the different synthetic and field cases presented in this work. Thesynthetic cases which reached to drawdown of almost 99% showed that the proposed correlation gives less errorcompared to the other correlations especially compared to Vogel correlation as both use the same equation withonly difference in the distinct C1 value used in both. For the field cases due to the practical difficulty of the fieldcases to have test points at higher draw down (the maximum drawdown used was 30% of the reservoir pressure),so the effectiveness of the proposed model compared to the rest of the models cannot be assessed properly atvery low pressure (high draw down). However, the proposed correlation did not show any severe discrepancycompared to the other correlations in predicting the wells deliverability.The proposed correlation was also examined for predicting the future IPR as shown in the Field cases 2 and 34.and the results show its good accuracy compared to all the other correlations. This is in addition to the failure ofFetkovich and Jones et al. to predict accurately the IPR in some of the cases due to the assumption of usingconstant values of Fetkovich and Jones et al. parameters during prediction.The most important feature of the proposed correlation is its dependency on many reservoir rock and fluid5.properties that proved to highly affect the IPR modeling in solution gas-drive reservoirs based on the sensitivitystudy done in this work. This will allow the user to use all the available data to accurately predict the IPRperformance rather than using any of the current empirical correlation that depends on specific reservoir rockand fluid properties or the analytical correlation that is rather difficult to be applied or does not cover a widerange of reservoir data.
NOMENCLATURE
γ 0 = Oil gravity
γw = Water gravity
γg = Gas gravity
µ 0 = Oil viscosity, cp
µW = Water viscosity, cp
Bo = Oil formation volume factor, bbl/stb
C = Jones et al. laminar-flow coefficient, psi/stb/day
Cfetk = Fetkovich productivity index of the reservoir (PI), stb/day/psi2n
D = Jones et al. turbulence coefficient, psi/ (stb/day)2
GEXP = Gas relative permeability exponent that affects the curvature of Krg
h = Formation thickness, ft
J = Productivity index of the reservoir, bbl/day/psi
Kh = Horizontal permeability, md
Krg at (1-Swcr-Sorg) = Relative permeability to gas at (1-Swcr-Sorg), fraction
Kro = Oil relative permeability, fraction
Krow at (Swcr) = Relative permeability to oil at Swcr, fraction
Krw at (Sorw) = Relative permeability to water at Sorw, fraction
Kv = Vertical permeability, md
mk = Khasanov et al. exponent

174 The Open Petroleum Engineering Journal, 2017, Volume 10 Daoud et al.
nfetk = Fetkovich flow exponent
nk = Khasanov et al. exponent
OGEXP = Oil-Gas relative permeability exponent that affects the curvature of Krog
OWEXP = Oil-Water relative permeability exponent that affects the curvature of Krow
Pb = Bubble Point Pressure, psi
Pe = Pressure at the outer boundary, psi
Pr = Average reservoir pressure, psi
Pr1, Pr2 = Average reservoir pressure at the current and predicted IPR correlation, respectively, psi
Pwf = Bottom hole flowing pressure, psi
qo = Oil flow rate, bbl/day
qomax = Maximum oil flow rate, bbl/day
qomax1, qomax2 = Maximum oil flow rate at the current and predicted IPR correlation, respectively, bbl/day
re = Drainage Radius, ft
Rs = Solution Gas Oil Ratio, Mscf/STB
rw = Well radius, ft
S = Skin
Sgcr = Critical gas saturation, fraction
Sorg = Residual oil saturation in gas, fraction
Sorw = Residual oil saturation in water, fraction
Swcr = Critical water saturation, fraction
Tr = Reservoir temperature, F
WEXP = Water relative permeability exponent that affects the curvature of Krw
Z = Gas deviation factor
ETHICS APPROVAL AND CONSENT TO PARTICIPATE
Not applicable.
CONSENT FOR PUBLICATION
Not applicable.
CONFLICT OF INTEREST
The authors declare no conflict of interest, financial or otherwise.
ACKNOWLEDGEMENT
Declared None.
REFERENCES
[1] H.H. Evinger, and M. Muskat, "Calculation of Theoretical Productivity Factors", Trans. Metall. Soc. AIME, vol. 146, pp. 126-139, 1942.[http://dx.doi.org/10.2118/942126-G]
[2] E.L. Rawlins, and M.A. Schellhardt, “Backpressure Data on Natural Gas Wells and Their Application to Production Practices”, MonographSeries 7, U.S. Bureau of Mines., American Gas Association, Lord Baltimore Press, 1935.
[3] W.E. Gilbert, "Flowing and Gas-Lift Well Performance", In: American Petroleum Institute Proceedings, 1954, pp. 126-157.
[4] J.V. Vogel, "Inflow Performance Relationships for Solution Gas-Drive Wells", J. Pet. Technol., vol. 20, pp. 83-92, 1968.[http://dx.doi.org/10.2118/1476-PA]
[5] M.J. Fetkovich, "The Isochronal Testing of Oil Wells", In: SPE Annual Meeting, September 30-October 3, Las Vegas, NV, 1973.[http://dx.doi.org/10.2118/4529-MS]
[6] L.G. Jones, E.M. Blount, and O.H. Glaze, "Use of Short Term Multiple Rate Flow Tests to Predict Performance of Wells HavingTurbulence", In: SPE Annual Technical Meeting and Exhibition, Oct. 3-6, New Orleans, 1976.[http://dx.doi.org/10.2118/6133-MS]
Inflow Performance Relationship Correlation The Open Petroleum Engineering Journal, 2017, Volume 10 175
[7] J.M. Richardson, and A.H. Shaw, "Two-Rate IPR Testing — A Practical Production Tool", J. Can. Pet. Technol., vol. 21, pp. 57-61, 1982.[http://dx.doi.org/10.2118/82-02-01]
[8] M.L. Wiggins, "Inflow Performance of Oil Wells Producing Water", Ph.D. dissertation, College Station, TX, Texas A&M University, 1991.
[9] M.L. Wiggins, "Generalized Inflow Performance Relationships for Three-Phase flow", SPE Production Operations Symposium OklahomaCity : 1993, March 21-23.[http://dx.doi.org/10.2118/25458-MS]
[10] M.A. Klins, and M.W. Majcher, "Inflow Performance Relationships for Damaged or Improved Wells Producing Under Solution-Gas Drive",J. Pet. Technol., vol. 44, pp. 1357-1363, 1992.[http://dx.doi.org/10.2118/19852-PA]
[11] P. Sukarno, and A. Wisnogroho, "Generalized Two-Phase IPR Curve Equation under Influence of Non-linear Flow Efficiency", In: Society ofIndonesian Petroleum Engineers Production Optimization International Symposium Conference Proceeding, Bandung, Indonesia, 1995.
[12] M.L. Wiggins, J.L. Russel, and J.W. Jennings, "Analytical Inflow Performance Relationships for Three Phase Flow in Bounded Reservoirs",In: SPE Western Regional Meeting, March 30-April 1, California, 1992.[http://dx.doi.org/10.2118/24055-MS]
[13] Y. Del Castillo, "New Inflow Performance Relationships for Gas Condensate Reservoirs", M.S. Thesis, College Station, TX, Texas A & MUniversity, May 2003.
[14] R.A. Archer, Y. Del Castillo, and T. Blasingame, "New Perspectives on Vogel Type IPR Models for Gas Condensate and Solution-Gas DriveSystems", SPE Production Operations Symposium, 2003 Oklahoma, OK[http://dx.doi.org/10.2118/80907-MS]
[15] M. Abdel Salam, "Developing New Inflow Performance Relationship Correlation for Solution Gas Drive Reservoirs Using Non-ParametricRegression Technique", Master Thesis, Cairo University, Giza, Egypt, 2008.
[16] Z. Haiquan, L. Yingchuan, W. Yulian, L. Chengjian, and L. Wei, "A New General Formula for Dimensionless Well Inflow PerformanceRelationship", In: SPE Asia Pacific Oil and Gas Conference and Exhibition, Jakarta, Indonesia, 30 October-1 November, 2007.
[17] D. Ilk, R. Camacho Velazquez, and T. Blasingame, "Inflow Performance Relationship (IPR) for Solution-Gas-Drive Reservoirs: AnalyticalConsiderations", SPE Annual Technical Conference and Exhibition, 2007 Anaheim, California[http://dx.doi.org/10.2118/110821-MS]
[18] A. Jahanbani, and S.R. Shadizadeh, "Determination of Inflow Performance Relationship (IPR) by Well Testing", Canadian InternationalPetroleum Conference (CIPC), 2009 Calgary, Alberta[http://dx.doi.org/10.2118/2009-086]
[19] M. Elias, A. El-banbi, K.A. Fattah, and E. El-Tayeb, "New Inflow Performance Relationship for Solution Gas-Drive Oil Reservoirs", SPEAnnual Technical Conference and Exhibition, 2009 New Orleans, Louisiana[http://dx.doi.org/10.2118/124041-MS]
[20] M. Khasanov, V. Krasnov, R. Khabibullin, and T. Musabirov, "Self Consistent Approach to Construct Inflow Performance Relationship forOil Well", SPE Russian Oil and Gas Exploration and Production Technical Conference and Exhibition, 2012 Moscow, Russia
[21] K.E. Brown, "Overview of Artificial Lift Systems", J. Pet. Technol., vol. 34, pp. 2384-2396, 1982.[http://dx.doi.org/10.2118/9979-PA]
[22] D.J. Avery, and R.D. Evans, "Design Optimization of Plunger Lift System", Tianjin, China, 1988.[http://dx.doi.org/10.2118/17585-MS]
[23] X. Yu, H. Xia, Y. Zhang, and J. Li, "Calculation of IPR Curves of Oil Wells for Polymer Flooding Reservoirs", SPE Annual TechnicalConference and Exhibition, 1997 San Antonio, Texas[http://dx.doi.org/10.2118/38936-MS]
[24] B. Guo, K. Ling, and A. Ghalambor, "A rigorous Composite-IPR for Multi-Lateral Wells", SPE Annual Technical Conference and Exhibition,2006 San Antonio, Texas[http://dx.doi.org/10.2118/100923-MS]
[25] Roxar, “MORE Manual - Version 6.3, 2006.
[26] L. Breiman, and J.H. Friedman, "Estimating Optimal Transformations for multiple Regression and Correlation", J. Am. Stat. Assoc., vol. 80,pp. 580-598, 1985.[http://dx.doi.org/10.1080/01621459.1985.10478157]
[27] G. Xue, A. Datta-Gupta, P. Valko, and T.A. Blasingame, "Optimal Transformations for Multiple Regression: Application to PermeabilityEstimation from Well Logs", SPE Formation Evaluation Journal, vol. 12, pp. 85-93, 1997.[http://dx.doi.org/10.2118/35412-PA]
[28] W.D. Mc Cain Jr, R.B. Soto, P.P. Valko, and T.A. Blasingame, "Correlation of Bubble Point Pressures for Reservoir Oils – A ComparativeStudy", In: SPE Eastern Regional Conference and Exhibition, 1998 pp. 267-275 Pittsburgh, PA.
[29] F. Gallice, "A Comparison of Two-Phase Inflow Performance Relationships", M.S. thesis, University of Oklahoma, Norman, Oklahoma,1997.

176 The Open Petroleum Engineering Journal, 2017, Volume 10 Daoud et al.
[30] J. R. Eickmeier, "How to Accurately Predict Future Well Productivities", World Oil, 1968.
© 2017 Daoud et al.
This is an open access article distributed under the terms of the Creative Commons Attribution 4.0 International Public License (CC-BY 4.0), acopy of which is available at: https://creativecommons.org/licenses/by/4.0/legalcode. This license permits unrestricted use, distribution, andreproduction in any medium, provided the original author and source are credited.