the open economy - kids in prison program · •when goods markets are open, ... to generalize...
TRANSCRIPT

The Open Economy
2 of 40
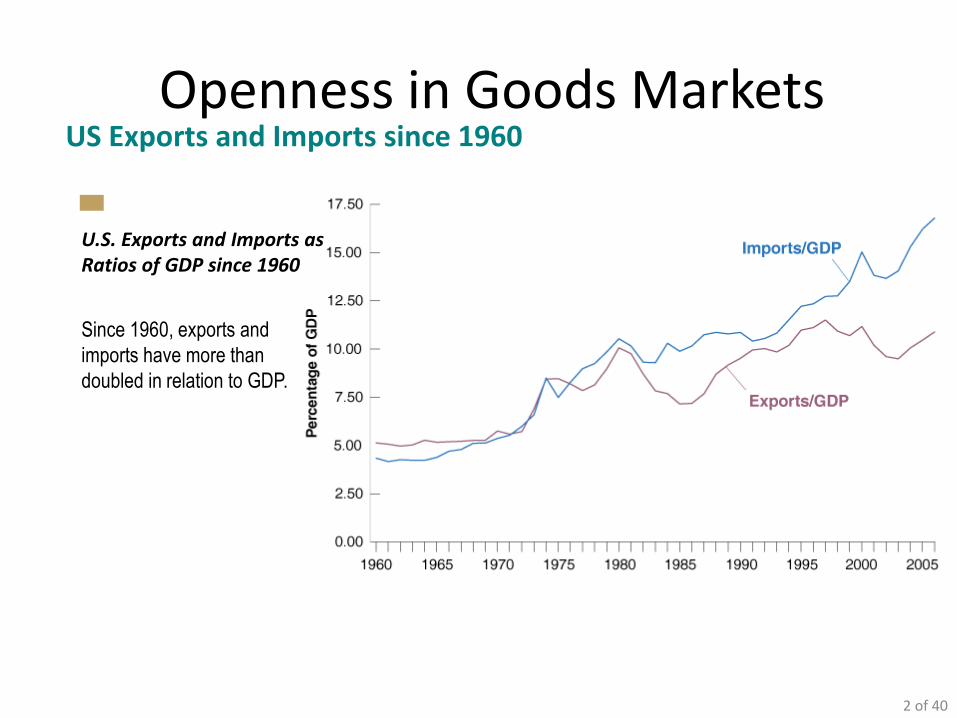
Openness in Goods MarketsUS Exports and Imports since 1960
Since 1960, exports and
imports have more than
doubled in relation to GDP.
U.S. Exports and Imports as Ratios of GDP since 1960
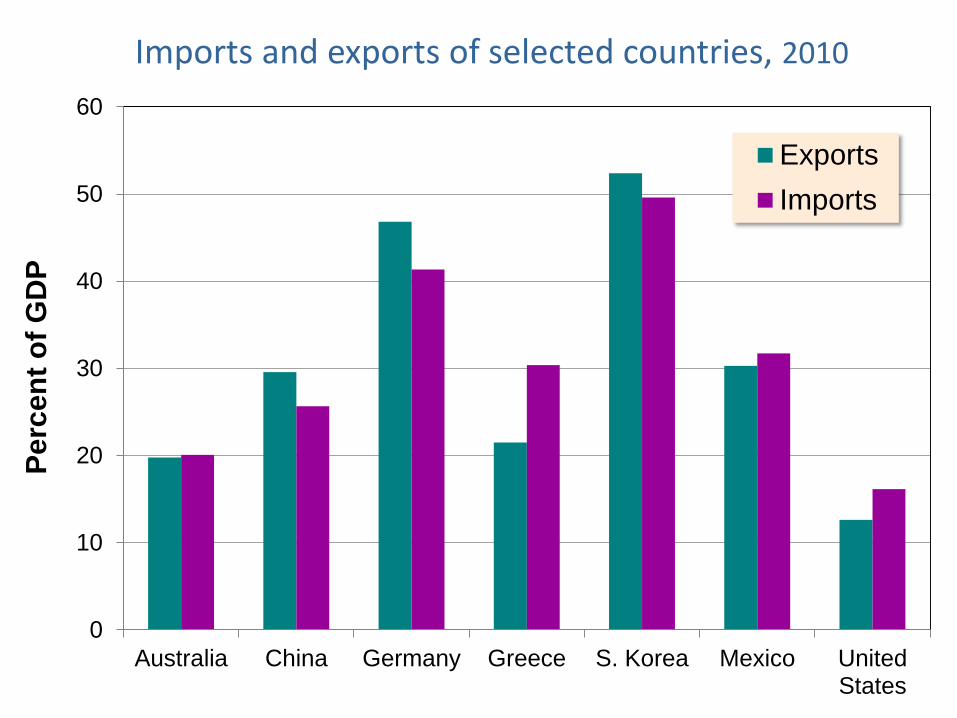
Imports and exports of selected countries, 2010
0
10
20
30
40
50
60
Australia China Germany Greece S. Korea Mexico UnitedStates
Perc
en
t o
f G
DP
Exports
Imports

5 of 40
•The main factors behind differences in export ratios are geography and country size:
• - Distance from other markets.
• - Size also matters: The smaller the country, the more it must specialize in producing and exporting only a few products and rely on imports for other products.
Table 18-1 Ratios of Exports to GDP for Selected OECD Countries, 2006
Country Export Ratio (%) Country Export Ratio (%)
United States 11 Switzerland 54
Japan 18 Netherlands 80
United Kingdom 30 Belgium 92
Germany 48 Singapore 167
Openness in Goods MarketsExports and Imports

6 of 40
Can Exports Exceed GDP?
Countries can have export ratios larger than the value of their GDP because exports and imports may include exports and imports of intermediate goods.

7 of 40
•When goods markets are open, domestic consumers must decide not only how much to consume and save, but also whether to buy domestic goods or to buy foreign goods.
•Central to the second decision is the price of domestic goods relative to foreign goods, or the real exchange rate.
•First, however, we will discuss the nominal exchange rate which is the exchange rate that determines, for example, how many eurosyou get for your dollars if you go on a study abroad to Paris or Hamburg.
Openness in Goods MarketsThe Choice between Domestic Goods and Foreign Goods

8 of 40
•Nominal exchange rates between two currencies can be quoted in one of two ways:
– As the price of the domestic currency in terms of the foreign currency. This is what we will use.
– As the price of the foreign currency in terms of the domestic currency.
Openness in Goods MarketsNominal Exchange Rates

9 of 40
•The nominal exchange rate is the price of the domestic currency in terms of the foreign currency.
– An appreciation of the domestic currency is an increase in the price of the domestic currency in terms of the foreign currency, which corresponds to a increase in the exchange rate.
– A depreciation of the domestic currency is a decrease in the price of the domestic currency in terms of the foreign currency, or a decrease in the exchange rate.
Openness in Goods MarketsNominal Exchange Rates
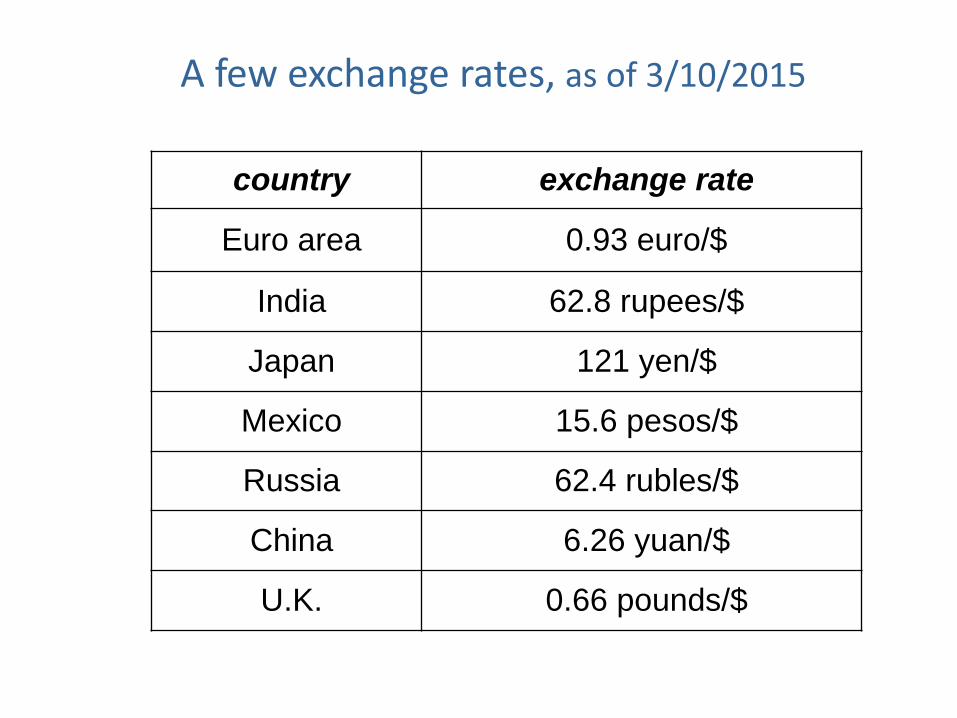
A few exchange rates, as of 3/10/2015
country exchange rate
Euro area 0.93 euro/$
India 62.8 rupees/$
Japan 121 yen/$
Mexico 15.6 pesos/$
Russia 62.4 rubles/$
China 6.26 yuan/$
U.K. 0.66 pounds/$

11 of 40
Openness in Goods MarketsNominal Exchange Rates
Although the dollar has
appreciated relative to the
pound over the past four
decades, this appreciation has
come with large swings in the
nominal exchange rate
between the two currencies,
especially in the 1980s.
The Nominal Exchange Rate between the Dollar and the Pound since 1970

12 of 40
Let’s look at a simple e.g. to illustrate the idea of the real exchange rate between the United States and the UK.
– If the price of a typical meal (Big Mac and medium fries) in the US is $5.69, and a dollar is worth 0.60 pounds, then the price of a Big Mac and fries in pounds is $5.69 X 0.60 = £3.41.
– If the price of a typical meal (fish and chips) in the UK is £4.20, then the price of a Big Mac and fries in terms of fish and chips would be £3.41/ £4.20 = 0.81.
– Another example: Big Mac Index
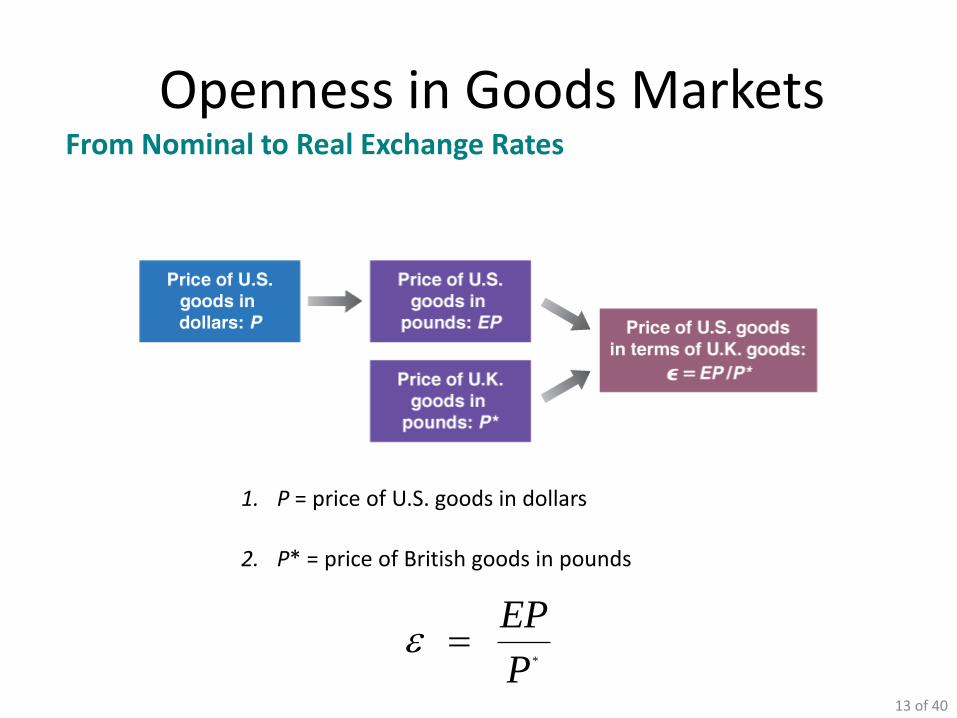
To generalize these examples to all of the goods in the economy, we use a price index for the economy, such as the GDP deflator.
Openness in Goods MarketsFrom Nominal to Real Exchange Rates
13 of 40
1. P = price of U.S. goods in dollars
2. P* = price of British goods in pounds
*
EP
P
Openness in Goods MarketsFrom Nominal to Real Exchange Rates

In an open economy,
• spending need not equal output
• saving need not equal investment
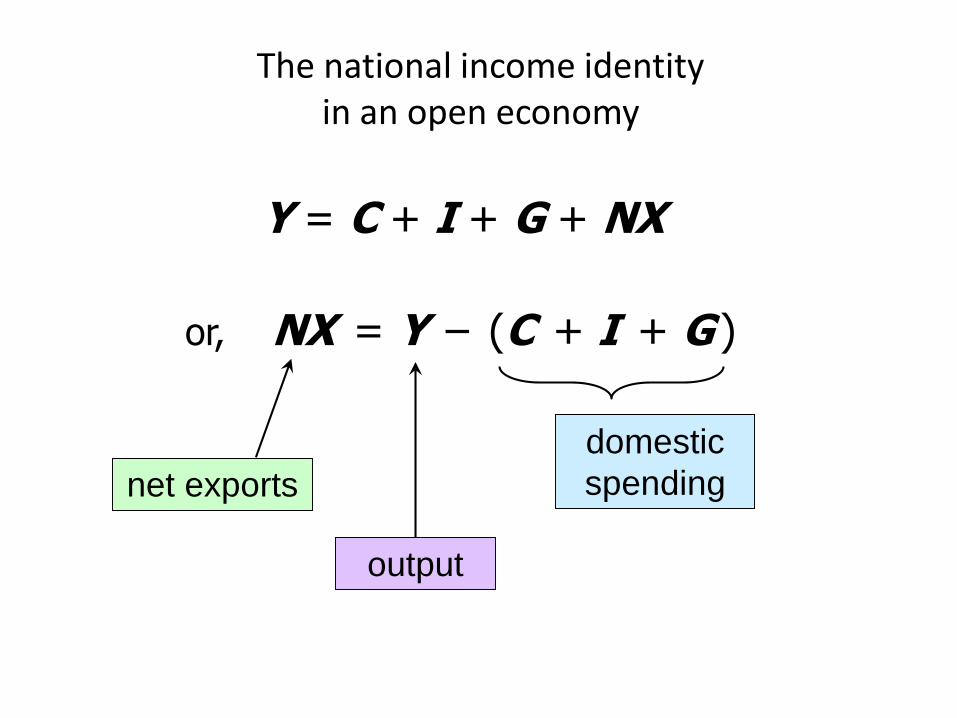
The national income identity in an open economy
Y = C + I + G + NX
or, NX = Y – (C + I + G )
net exports
domestic
spending
output
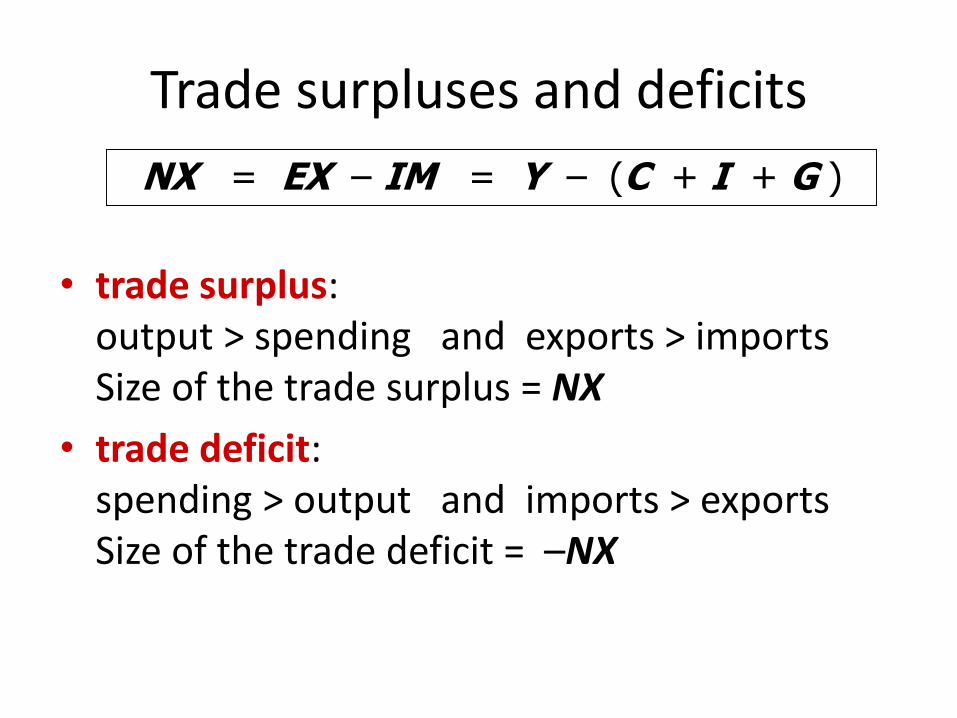
Trade surpluses and deficits
• trade surplus: output > spending and exports > imports Size of the trade surplus = NX
• trade deficit: spending > output and imports > exports Size of the trade deficit = –NX
NX = EX – IM = Y – (C + I + G )

International capital flows
• Net capital outflow
= S – I
= net outflow of “loanable funds”
= net purchases of foreign assetsthe country’s purchases of foreign assets
minus foreign purchases of domestic assets
• When S > I, country is a net lender
• When S < I, country is a net borrower
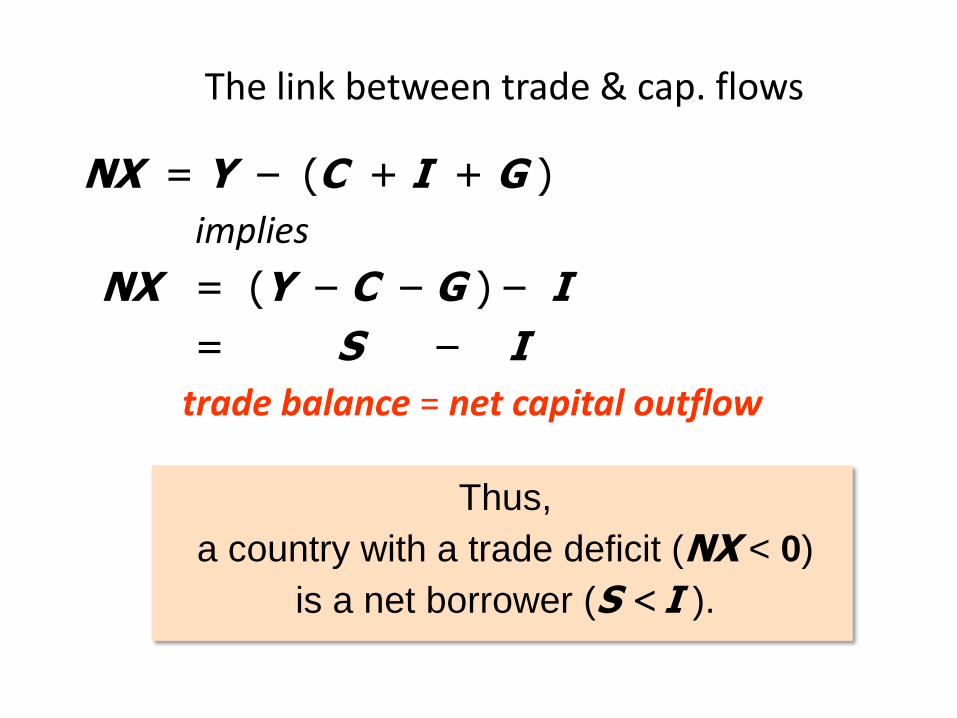
The link between trade & cap. flows
NX = Y – (C + I + G )
implies
NX = (Y – C – G ) – I
= S – I
trade balance = net capital outflow
Thus,
a country with a trade deficit (NX < 0)
is a net borrower (S <I ).

-10%
-5%
0%
5%
10%
15%
0%
5%
10%
15%
20%
25%
1960 1965 1970 1975 1980 1985 1990 1995 2000 2005 2010
Tra
de B
ala
nce (
% o
f G
DP
)
Savin
g, In
vestm
ent
(% o
f G
DP
)
Saving, investment, and the trade balance 1960–2012
trade balance
(right scale)
saving
investment
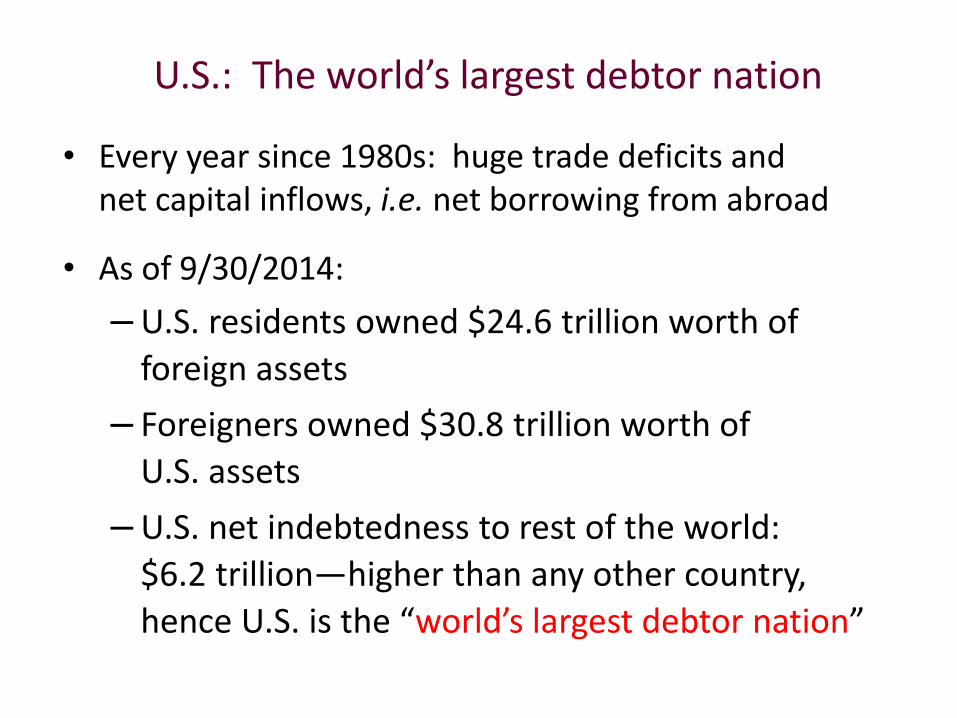
U.S.: The world’s largest debtor nation
• Every year since 1980s: huge trade deficits and net capital inflows, i.e. net borrowing from abroad
• As of 9/30/2014:
– U.S. residents owned $24.6 trillion worth of
foreign assets
– Foreigners owned $30.8 trillion worth of
U.S. assets
– U.S. net indebtedness to rest of the world:
$6.2 trillion—higher than any other country,
hence U.S. is the “world’s largest debtor nation”

ε in the real world & our model
• In the real world:We can think of ε as the relative price of a basket of domestic goods in terms of a basket of foreign goods
• In our macro model:There’s just one good, “output.”So ε is the relative price of one country’s output in terms of the other country’s output

How NX depends on ε
ε U.S. goods become more expensive
relative to foreign goods
EX, IM
NX
0
20
40
60
80
100
120
140
-8%
-6%
-4%
-2%
0%
2%
4%
1970 1975 1980 1985 1990 1995 2000 2005 2010
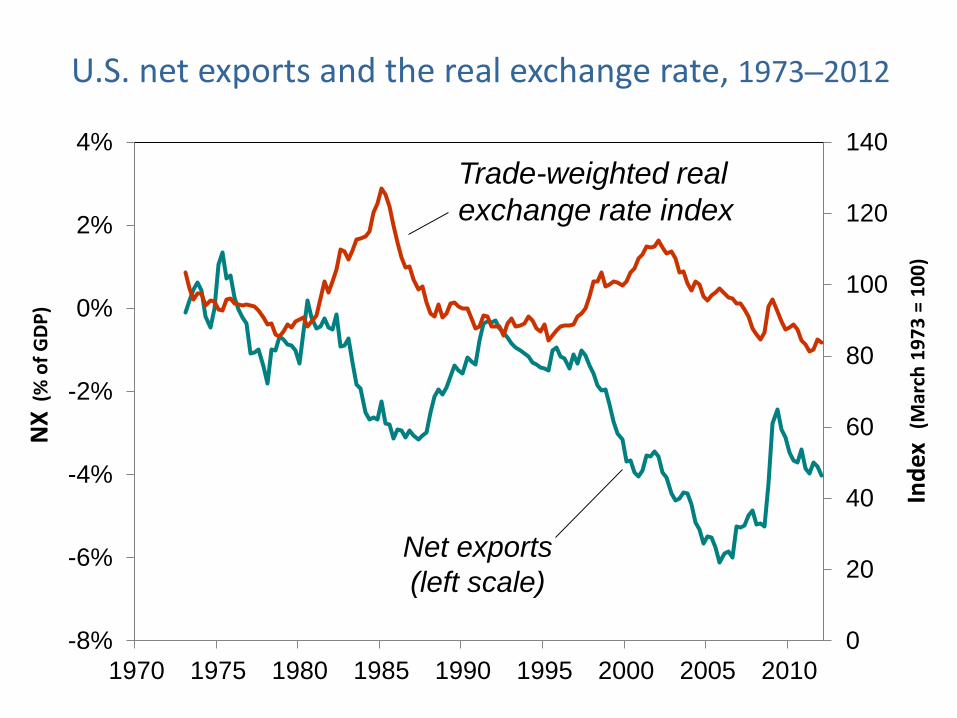
U.S. net exports and the real exchange rate, 1973–2012N
X(%
of
GD
P)
Ind
ex(M
arch
19
73
= 1
00
)
Trade-weighted real
exchange rate index
Net exports
(left scale)

The net exports function
• The net exports function reflects this inverse
relationship between NX and ε :
NX = NX(ε )

The NX curve for the U.S.
0 NX
ε
NX(ε)
ε1
When ε is
relatively low,
U.S. goods are
relatively
inexpensive
NX(ε1)
so U.S. net
exports will
be high
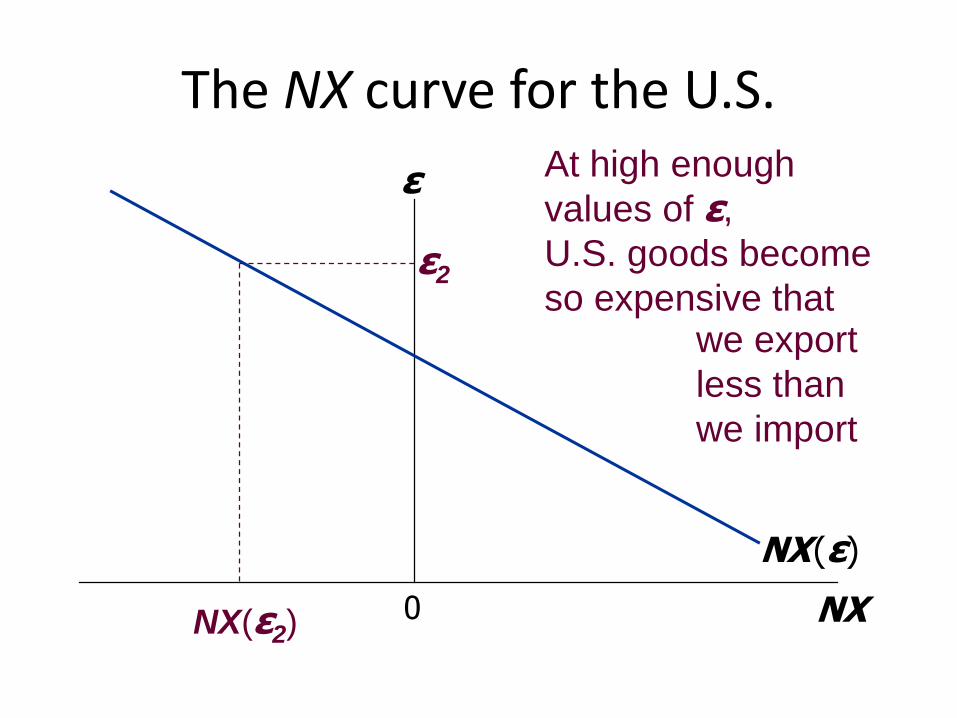
The NX curve for the U.S.
0 NX
ε
NX(ε)
ε2
At high enough
values of ε,
U.S. goods become
so expensive that
NX(ε2)
we export
less than
we import

How ε is determined
• The accounting identity says NX = S – I
• We saw earlier how S – I is determined:– S depends on domestic factors (output, fiscal policy
variables, etc.)
– I is determined by the interest rate r
• So, ε must adjust to ensure that
that NX(ε ) = S – I(r)
( ) ( )*NX ε S I r

The determinants of the nominal exchange rate
• Start with the expression for the real exchange rate:
*
e Pε
P
Solve for the nominal exchange rate:*P
e εP
The determinants of the nominal exchange rate
( * , )M
L r YP
( ) ( )*NX ε S I r
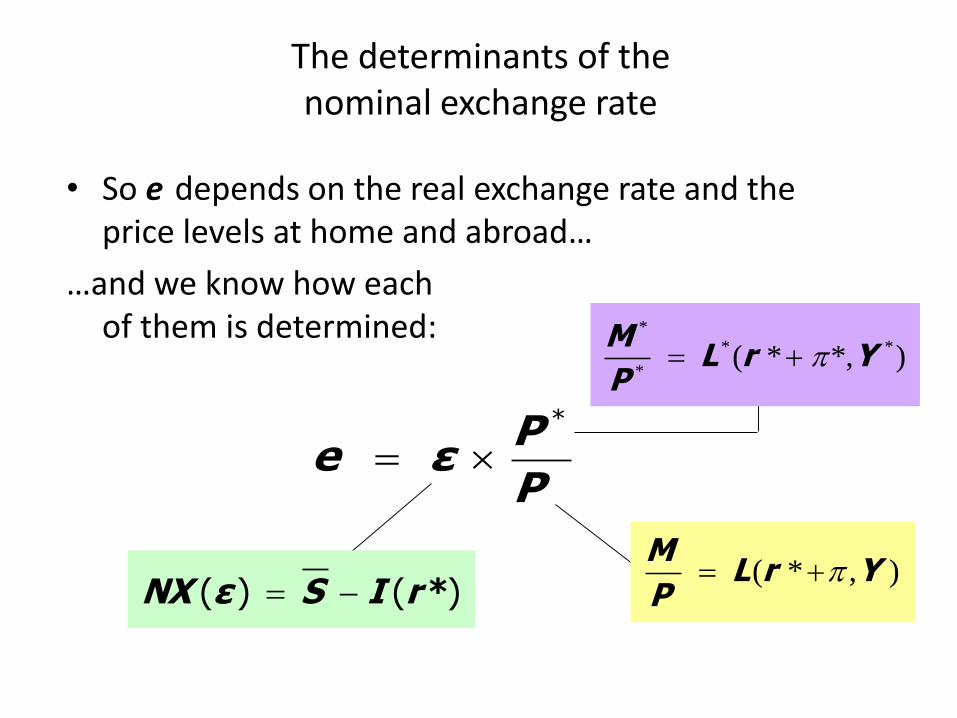
• So e depends on the real exchange rate and the price levels at home and abroad…
…and we know how each of them is determined:
*Pe ε
P
** *
*( * *, )
ML r Y
P
The determinants of the nominal exchange rate
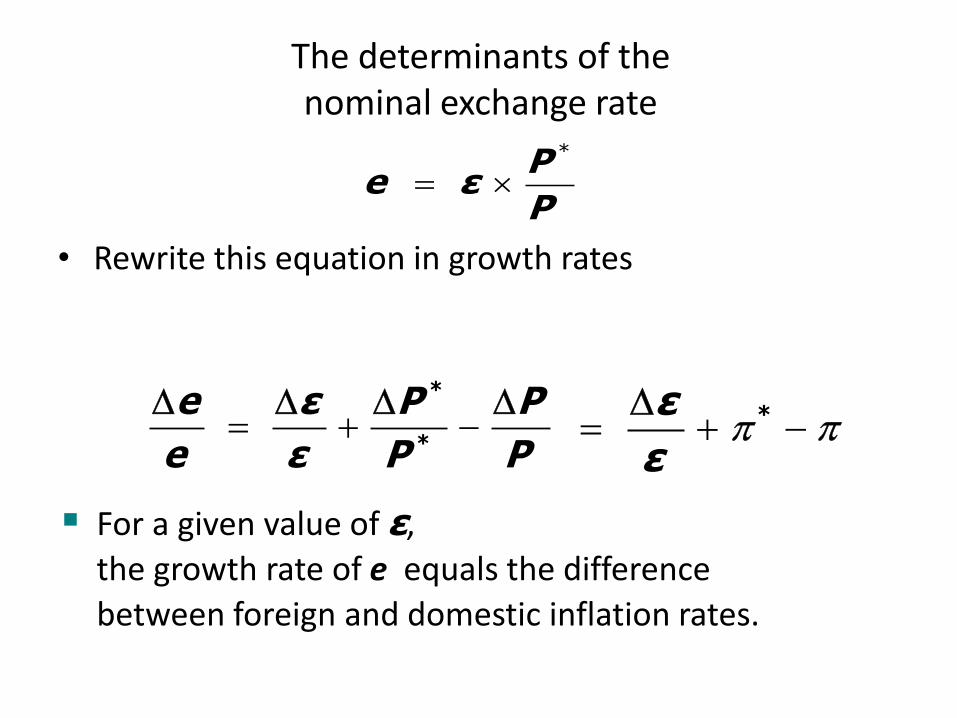
• Rewrite this equation in growth rates
*Pe ε
P
*
*
e ε P P
e ε P P
*ε
ε
For a given value of ε,
the growth rate of e equals the difference
between foreign and domestic inflation rates.

-6%
-4%
-2%
0%
2%
4%
6%
8%
-4% -2% 0% 2% 4% 6% 8%
Inflation differentials and nominal exchange rates for a cross section of countries
% change
in nominal
exchange
rate
inflation differential
Pakistan
U.K.
Singapore
Switzerland
Japan
Sweden
Iceland
Mexico
S. Korea
S. Africa
Australia
Canada
Denmark
New Zealand

L E C T U R E S U M M A R Y
• Net exports—the difference between
– exports and imports
– a country’s output (Y ) and its spending (C + I + G)
• Net capital outflow equals
– purchases of foreign assets minus foreign purchases of the country’s assets
– the difference between saving and investment
34

L E C T U R E S U M M A R Y
• National income accounts identities
– Y = C + I + G + NX
– trade balance NX = S – I net capital outflow
• Impact of policies on NX
– NX increases if policy causes S to rise
or I to fall
– NX does not change if policy affects
neither S nor I. Example: trade policy
35

L E C T U R E S U M M A R Y
• Exchange rates
– nominal: the price of a country’s currency in terms of
another country’s currency
– real: the price of a country’s goods in terms of
another country’s goods
– The real exchange rate equals the nominal rate times
the ratio of prices of the two countries.
36
L E C T U R E S U M M A R Y
• How the real exchange rate is determined
– NX depends negatively on the real exchange rate,
other things equal
– The real exchange rate adjusts to equate
NX with net capital outflow
37
L E C T U R E S U M M A R Y
• How the nominal exchange rate is determined
– e equals the real exchange rate times the country’s
price level relative to the foreign price level.
– For a given value of the real exchange rate, the
percentage change in the nominal exchange rate
equals the difference between the foreign & domestic
inflation rates.
38