the oil & gas valve industry in italy - home | · pdf filethe oil & gas valve industry...
TRANSCRIPT

BERGAMO, MAY 24th 2017
THE OIL & GAS VALVE
INDUSTRY IN ITALYBUSINESS STRUCTURE
AND COMPETITIVE POSITIONING

The oil & gas valves industry in Italy – Business structure and competitive positioning - 2
Business structure
Italy’s role in the European oil & gas valve industry
The Italian firms’ performance
International trade and Italy’s export performance

The oil & gas valves industry in Italy – Business structure and competitive positioning - 3
The Italian industry of tapes and valves
A core sector of Made in Italy IM&E industry (2015)
1 352(5.8%)
8.4(7.6%)
30 480(7.2%)
303 3.5 11 292
704 3.7 13 962
345 1.2 5 226
Other industrial valves*
Household taps
Oil & Gas valves
Number of
enterprises
Number of
employees
Production value
(€ billion)
TAPES AND VALVES
(% share of Machinery and
Equipment industry)
* Hydraulic valves, valves for food & beverage industry,
valves for pharmaceutical industry, etc.

The oil & gas valves industry in Italy – Business structure and competitive positioning - 4
The oil & gas valves industry in Italy
Main Italian production areas and companies size
The main Italian production areas (% share over
total) and number of enterprises with turnover
>50 € mln (marked in red)
PAVIA
21%;2
BERGAMO
12% ; 4
PIACENZA
11%; 2
VARESE
10%; 1
BRESCIA
4%; 1
LECCO
7% ; 2
Nearly 90% of the Italian production
is concentrated within a 100 km
radius around Bergamo
MONZA-B.
5%; 2
Total turnover by firm (€ million)
MILANO
18% ; 2
MACHINERY AND
EQUIPMENT
6,3
Oil & gas valves
11,7
Other industrial valves
5,3
Household taps
3,5
Source: Prometeia’s calculation on ISTAT data and Companies balance sheets

The oil & gas valves industry in Italy – Business structure and competitive positioning - 5
Business structure
Italy’s role in the European oil & gas valve industry
The Italian firms’ performance
International trade and Italy’s export performance

The oil & gas valves industry in Italy – Business structure and competitive positioning - 6
Oil & gas valve industry in Europe
Italy is the European leading manufacturer of oil & gas valves
3134
2472
13811207
432
1875
1624
478
787
279
2015 2006
Italy Germany UK France Spain
The main European production countries: sold production value*
(€ million)
Source: Prometeia’s
calculation on Eurostat
data (PRODCOM)
* Production value generated at
national production plants
Italy is the largest oil
and gas valves
producing country in
Europe
3.1 over a total of 3.5
billions invoiced by
Italian companies are
generated at national
production plants
EU 28:
9985 ; 6126
The oil & gas valves industry in Italy – Business structure and competitive positioning - 7
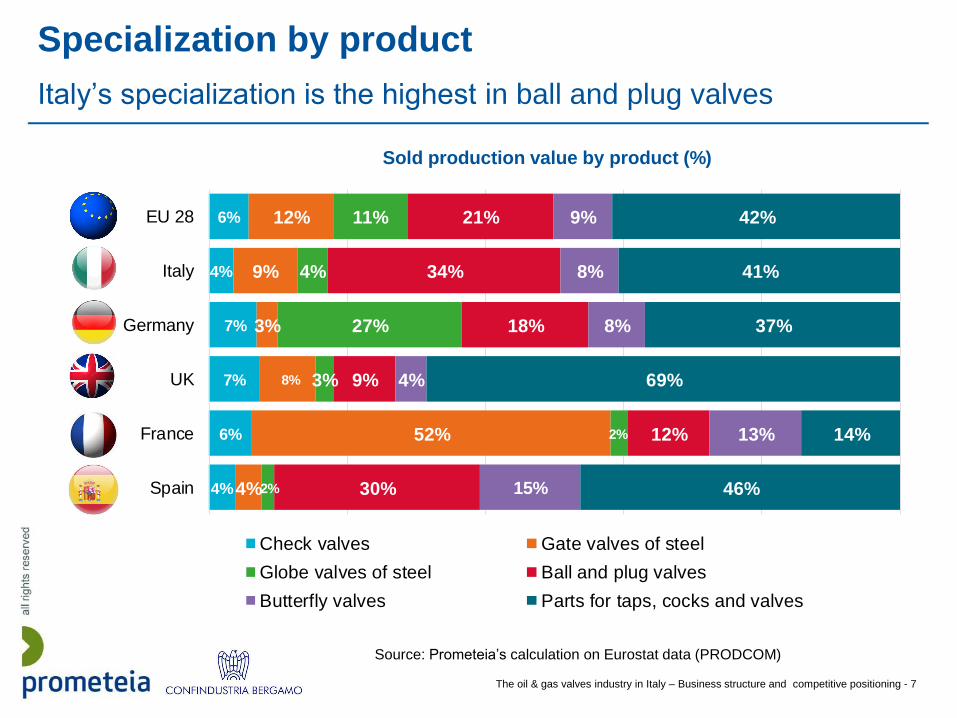
4%
6%
7%
7%
4%
6%
4%
52%
8%
3%
9%
12%
2%
2%
3%
27%
4%
11%
30%
12%
9%
18%
34%
21%
15%
13%
4%
8%
8%
9%
46%
14%
69%
37%
41%
42%
Spain
France
UK
Germany
Italy
EU 28
Check valves Gate valves of steel
Globe valves of steel Ball and plug valves
Butterfly valves Parts for taps, cocks and valves
Specialization by product
Italy’s specialization is the highest in ball and plug valves
Sold production value by product (%)
Source: Prometeia’s calculation on Eurostat data (PRODCOM)
The oil & gas valves industry in Italy – Business structure and competitive positioning - 8
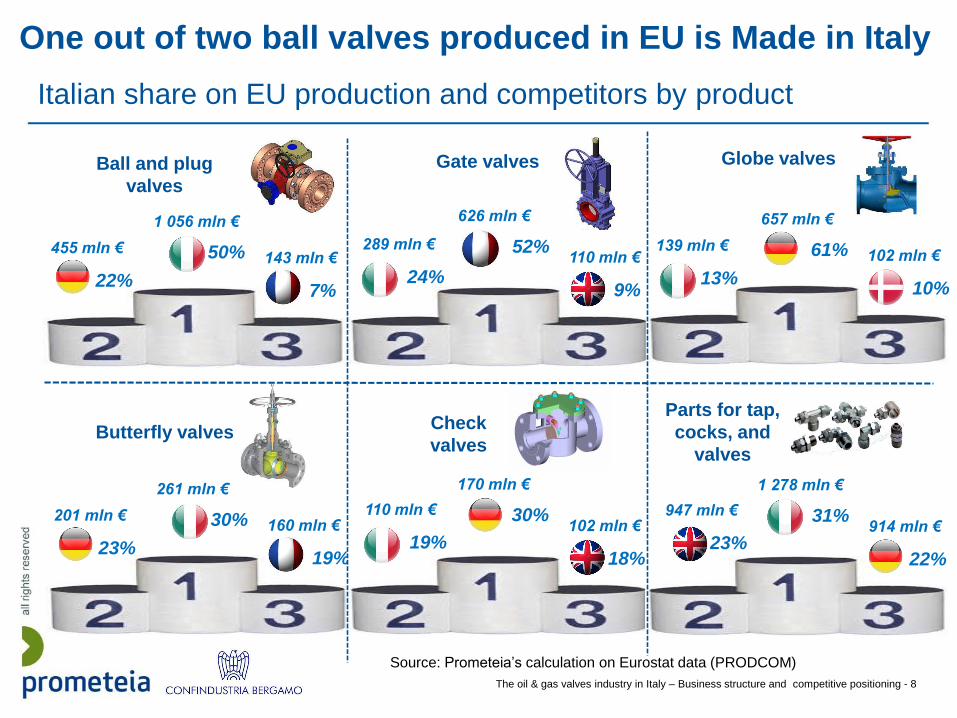
One out of two ball valves produced in EU is Made in Italy
Italian share on EU production and competitors by product
Ball and plug
valves
1 056 mln €
50% 143 mln €
7%
455 mln €
22%
626 mln €
52% 110 mln €
9%
289 mln €
24%
Gate valves
657 mln €
61% 102 mln €
10%
139 mln €
13%
Globe valves
Butterfly valves
261 mln €
30% 160 mln €
19%
201 mln €
23%
Check
valves
170 mln €
30% 102 mln €
18%
110 mln €
19%
1 278 mln €
31% 914 mln €
22%
947 mln €
23%
Parts for tap,
cocks, and
valves
Source: Prometeia’s calculation on Eurostat data (PRODCOM)

The oil & gas valves industry in Italy – Business structure and competitive positioning - 9
Business structure
Italy’s role in the European oil & gas valve industry
The Italian firms’ performance
International trade and Italy’s export performance
The oil & gas valves industry in Italy – Business structure and competitive positioning - 10
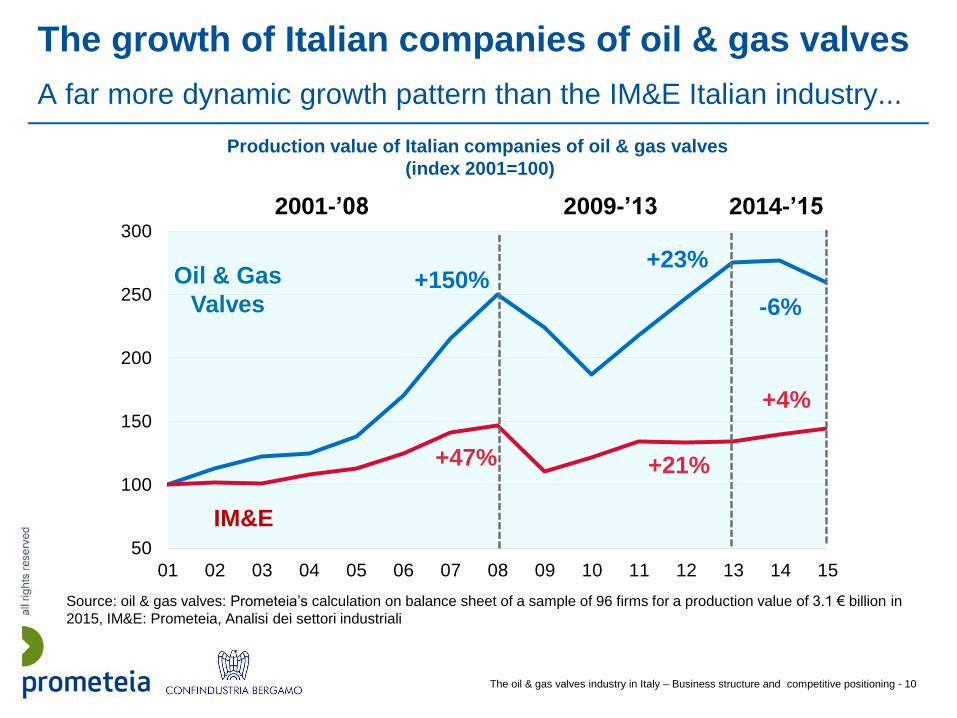
The growth of Italian companies of oil & gas valves
A far more dynamic growth pattern than the IM&E Italian industry...
Production value of Italian companies of oil & gas valves
(index 2001=100)
Source: oil & gas valves: Prometeia’s calculation on balance sheet of a sample of 96 firms for a production value of 3.1 € billion in
2015, IM&E: Prometeia, Analisi dei settori industriali
50
100
150
200
250
300
01 02 03 04 05 06 07 08 09 10 11 12 13 14 15
2001-’08 2009-’13 2014-’15
+150%
+47%
Oil & Gas
Valves
IM&E
+23%
+21%
-6%
+4%
The oil & gas valves industry in Italy – Business structure and competitive positioning - 11
0
10
20
30
40
50
60
70
80
90
100
50
100
150
200
250
300
350
01 02 03 04 05 06 07 08 09 10 11 12 13 14 15 16 17 18
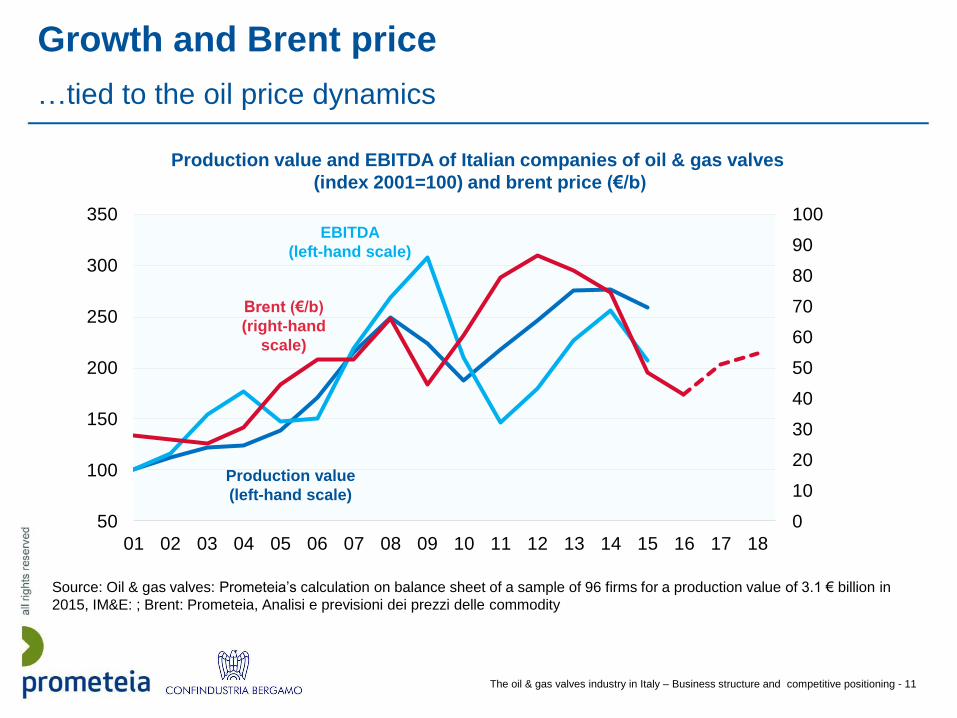
Growth and Brent price
…tied to the oil price dynamics
Production value and EBITDA of Italian companies of oil & gas valves
(index 2001=100) and brent price (€/b)
Production value
(left-hand scale)
EBITDA
(left-hand scale)
Brent (€/b)
(right-hand
scale)
Source: Oil & gas valves: Prometeia’s calculation on balance sheet of a sample of 96 firms for a production value of 3.1 € billion in
2015, IM&E: ; Brent: Prometeia, Analisi e previsioni dei prezzi delle commodity

The oil & gas valves industry in Italy – Business structure and competitive positioning - 12
Profitability and investments
Double-digit EBITDA and high propensity to invest
EBITDA (% share of the production value Fixed capital investments: C.A.G.R.
the Italian oil & gas valve industry shines as for profitability, even though
the 2015 Brent price collapse has had a relevant impact on margins
Source: oil & gas valves: Prometeia’s calculation on balance sheet of a sample of 96 firms for a production value of 3.1 € billion in
2015, IM&E: Prometeia, Analisi dei settori industriali
2011 2012 2013 2014 2015
11.6
14.4
18.220.4
16.6
8.2 8.5 8.7 9.3 9.7
oil & gas valves IM&E
2006-'10 2011-'15
9.9
11.9
8.3
0.8
oil & gas valves IM&E
The oil & gas valves industry in Italy – Business structure and competitive positioning - 13
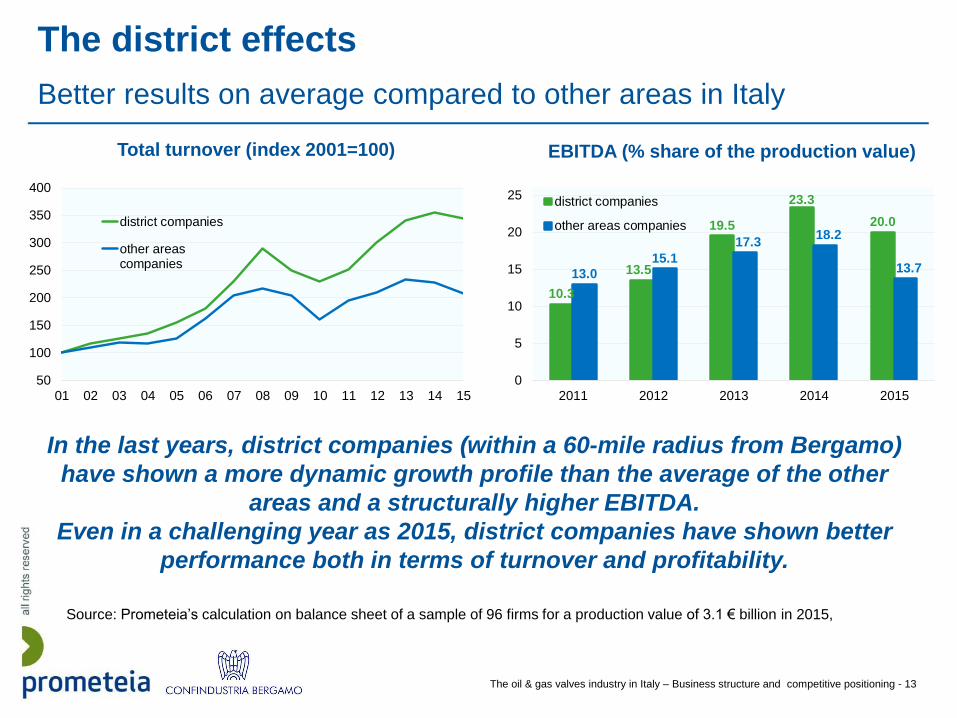
The district effects
Better results on average compared to other areas in Italy
EBITDA (% share of the production value)Total turnover (index 2001=100)
In the last years, district companies (within a 60-mile radius from Bergamo)
have shown a more dynamic growth profile than the average of the other
areas and a structurally higher EBITDA.
Even in a challenging year as 2015, district companies have shown better
performance both in terms of turnover and profitability.
Source: Prometeia’s calculation on balance sheet of a sample of 96 firms for a production value of 3.1 € billion in 2015,
50
100
150
200
250
300
350
400
01 02 03 04 05 06 07 08 09 10 11 12 13 14 15
district companies
other areascompanies
10.3
13.5
19.5
23.3
20.0
13.0
15.1
17.318.2
13.7
0
5
10
15
20
25
2011 2012 2013 2014 2015
district companies
other areas companies
The oil & gas valves industry in Italy – Business structure and competitive positioning - 14
Business structure
Italy’s role in the European oil & gas valve industry
The Italian firms’ performance
International trade and Italy’s export performance

The oil & gas valves industry in Italy – Business structure and competitive positioning - 15
Oil & gas valve international trade
World imports and Italy’s share
World imports 2016
Source: Prometeia’s calculation on ITC data
€ 25.5 billions
World imports (2007=100) and Italy’s share (%)
14.115.3 15.6
11.2 11.0 11.6 12.1 11.6 11.5 11.5
0.0
5.0
10.0
15.0
20.0
25.0
30.0
35.0
40.0
0
20
40
60
80
100
120
140
160
180
200
07 08 09 10 11 12 13 14 15 16
Italy's share (right scale)
World imports (left scale)
2016
-8%2000-2015
+75%
Italian exports 2016
€ 2.9 billions
3rd world
exporter
behind
China and
Germany

The oil & gas valves industry in Italy – Business structure and competitive positioning - 16
2.3%3.0%
6.4%
-8.0%
6.5%
-0.6%
4.9%
-7.9%
2013 2014 2015 2016
World importsItalian exports
World imports and Italian exports
Recent results: 4 years of ups and downs for the Italian export
World imports and Italian exports of oil & gas industrial valves (% change on euro data)
Source: Prometeia’s calculation on ITC data
‘’monetary illusion’’:
if calculated on data in
dollars, it would be:
-12.3%-11.0%
The oil & gas valves industry in Italy – Business structure and competitive positioning - 17
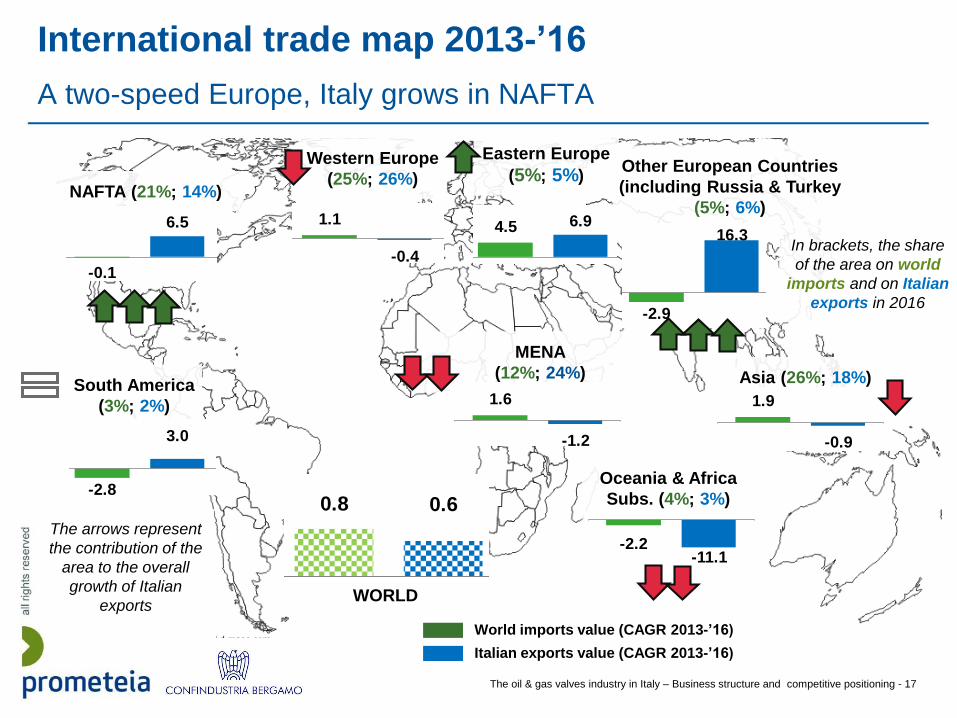
International trade map 2013-’16
A two-speed Europe, Italy grows in NAFTA
Eastern Europe
(5%; 5%)Western Europe
(25%; 26%)
World imports value (CAGR 2013-’16)
Italian exports value (CAGR 2013-’16)
MENA
(12%; 24%) Asia (26%; 18%)South America
(3%; 2%)
NAFTA (21%; 14%)
Oceania & Africa
Subs. (4%; 3%)
-2.2-11.1
1.9
-0.9
1.1
-0.4
4.5 6.9
-2.9
16.3
1.6
-1.2
-0.1
6.5
-2.8
3.0
In brackets, the share
of the area on world
imports and on Italian
exports in 2016
WORLD
0.8 0.6The arrows represent
the contribution of the
area to the overall
growth of Italian
exports
Other European Countries
(including Russia & Turkey
(5%; 6%)

The oil & gas valves industry in Italy – Business structure and competitive positioning - 18
8.5
8.8
10.1
11.8
12.5
14.3
17.1
20.3
29.9
71.4
-8.9
0.3
28.9
-1.1
2.5
1.2
14.2
3.9
10.7
21.4
Russia (3.0)
United States (11.7)
Azerbaijan (1.1)
Brazil (1.5)
Netherlands2.2)
Saudi Arabia (7.8)
Iraq (1.8)
Kazakhstan (1.9)
Turkey (2.1)
Oman (3.2)
Worldimports
Italianexports -1.0
-2.3
-3.5
-4.1
-5.9
-6.1
-6.4
-10.7
-14.9
-19.0
1.2
0.7
-0.3
-7.0
-7.2
-1.1
2.7
-1.0
6.0
-5.7
India (1.0)
South Korea (3.9)
Thailand (1.3)
Canada (1.5)
Norway (2.8)
UK (3.0)
Spain (1.8)
United Arab Em.(4.9)
Kuwait (1.1)
Australia (1.2)
Worldimports
Italianexports
Best and worst performing markets
Significant growth in the Middle East… but not in every market
The markets listed in the two charts (sorted by the growth rate of Italian exports) account for 59% of Italian exports in 2016 and 48% of
world imports.
Italian exports and World imports in the main markets for Italy: CAGR 2013-’16; in brackets, the
share of market on Italian exports in 2016
Best performing markets Worst performing markets
Source: Prometeia’s calculation on ITC data

The oil & gas valves industry in Italy – Business structure and competitive positioning - 19
Italy’s and its competitors’ performance
The rise of China challenge the western producers… but Italy
Export growth and world market shares by world leading exporters
EX
PO
RT
C.A
.G.R
20
13
-16
5%
La dimensione della
bolla rappresenta la
quota sul commercio
mondiale di valvole per
oil & gas nel 2016
Source: Prometeia’s calculation on ITC data
China
GermanyItaly
United States
South Korea
JapanUnited
Kingdom
France
India
Canada
-6.0
-4.0
-2.0
0.0
2.0
4.0
6.0
8.0
-2.0 -1.5 -1.0 -0.5 0.0 0.5 1.0 1.5 2.0 2.5 3.0
25.2
11.711.57.8
4.6
4.03.9
3.1
3.1
3.2
ABSOLUTE CHANGES IN MARKET SHARES OF WORLD EXPORTS (2013-’16)
5%The size of the bubbles
represents the share of
oil and gas valve world
exports in 2016

The oil & gas valves industry in Italy – Business structure and competitive positioning - 20
Italian positioning by region
Italy leads in the MENA and is well positioned in Europe
Eastern
Europe
South America
Oceania e Africa
Subs.
MENA
22.8 21.6
10.1
Other European Countries
(including Russia & Turkey)
26.9
16.212.5
33.2
20.4
9.7
Western
Europe
19.7 18.212.3
28.4
9.5 9.1 7.7
Asia
27.6
13.2 12.3
31.1
14.510.2 7.7
NAFTA
33.3
11.98.9
Source: Prometeia’s
calculation on ITC data

The oil & gas valves industry in Italy – Business structure and competitive positioning - 21
The potential of Italian exports
1.2 billion higher in 4 years without export gap
Difference between Italian exports growth and world
imports growth in top-20 world markets (2013-’16); in
brackets the share on world imports
-30.0 -10.0 10.0 30.0
MEXICO (2.7)
UNITED KINGDOM (3.1)
SOUTH KOREA (2.8)
INDONESIA (1.3)
POLAND (1.4)
SINGAPORE (2.1)
THAILAND (1.5)
MALAYSIA (1.6)
INDIA (1.8)
UNITED ARAB EM. (2.9)
FRANCE (2.8)
GERMANY (5.1)
CHINA (6.4)
CANADA (2.5)
SPAIN (1.8)
NETHERLANDS (2.2)
UNITED STATES (15.4)
SAUDI ARABIA (2.7)
RUSSIA (2.3)
TURKEY (1.4)
In the last four years, Italian
exports underperformed with
respect to the total import
growth in 13 out of 20 main
valves import markets.
Without this export gap, Italian
foreign turnover would have
been € 300 million higher each
year.
top-20 markets share on
world imports
64%
The oil & gas valves industry in Italy – Business structure and competitive positioning - 22
Contacts
Mobile 3351436883
Phone 0516480911
Department Strategie Industriali Territoriali
Location Bologna
Giuseppe Schirone
Manager
Mobile 3442760227
Phone 0516480911
Department Strategie Industriali Territoriali
Location Bologna
Giampaolo Morittu
Senior economist
Phone 035275284
Location Bergamo
Massimo Longhi
Resp. Studi e Internazionalizzazione
Prometeia
Confindustria Bergamo
Phone 035275381
Location Bergamo
Luca Pandolfi
Project Manager
IVS

The oil & gas valves industry in Italy – Business structure and competitive positioning - 23
Any partial or total reproduction of its content is prohibited without written consent
by Prometeia.
Copyright © 2017 Prometeia / Confindustria Bergamo

The oil & gas valves industry in Italy – Business structure and competitive positioning - 24
Prometeia
Bologna
Via Guglielmo Marconi,43
+39 051 6480911
Milan
Via Brera, 18
+39 02 80505845
Viale Monza, 265
Beirut
2nd floor, Chebli Building,
669 Ashrafieh
+961 1 425206
Istanbul
Metrocity Is Merkezi No. 171 A blok 3. Kat
Büyükdere Cad Mecidiyeköy
+ 90 212 7090280–81–82
London
Dashwood House 69 Old Broad Street
London EC2M 1QS
+44 (0) 207 786 3525
Moscow
ul. Ilyinka, 4
Capital Business Center Office 308
www.prometeia.com
Prometeia
prometeiagroup
@PrometeiaGroup
Youtube
prometeia
Rome
Via Tirso, 26