the ohio state university · the ohio state university wexner medical center is one of the the...
TRANSCRIPT
The Ohio State University (A Component Unit of the State of Ohio)
EIN: 31-6025986
Financial Statements as of and for the years ended June 30, 2017 and 2016 and Report on Federal Financial Assistance Programs in Accordance with the OMB Uniform Guidance for the year ended June 30, 2017

The Ohio State University Index June 30, 2017 and 2016
Page(s)
1 – 3 Report of Independent Auditors
Management’s Discussion and Analysis (unaudited) 4 – 19
Financial Statements
Statements of Net Position 20
Statements of Revenues, Expenses and Other Changes in Net Position 21
Statements of Cash Flows 22 – 23
Notes to the Financial Statements 24 – 87
Supplementary Information:
88
89 – 90
91 – 128
Required Supplementary Information on GASB 68 Pension Liabilities
Other Information on the Long-Term Investment Pool
Schedule of Expenditures of Federal Awards
Notes to Schedule of Expenditures of Federal Awards 129 – 131
Report of Independent Auditors on Internal Control over Financial Reporting and on Compliance and Other Matters based on an Audit of Financial Statements Performed in Accordance with Government Auditing Standards
Report of Independent Auditors on Compliance with Requirements That Could Have A Direct and Material Effect on Each Major Program and on Internal Control over Compliance in Accordance with the OMB Uniform Guidance
134 – 135
136 – 138 Schedule of Findings and Questioned Costs
Summary of Prior Audit Findings
Management's Corrective Action Plan
139
132 – 133
140

1 PricewaterhouseCoopers LLP, 41 South High Street, Suite 2500, Columbus, OH 43215 T: (614) 225 8700, F: (614) 224 1044, www.pwc.com
Report of Independent Auditors To the Board of Trustees of The Ohio State University Columbus, Ohio: Report on the Financial Statements We have audited the financial statements of the primary institution and of the aggregate discretely presented component units, which collectively comprise The Ohio State University (the “University”), appearing on pages 20 to 23, which consist of the statements of net position as of June 30, 2017 and June 30, 2016, the related statements of revenues, expenses and other changes in net position and of cash flows for the years then ended, and the related notes to the financial statements, which collectively comprise the University’s basic financial statements. The University is a component unit of the State of Ohio. Management’s Responsibility for the Financial Statements Management is responsible for the preparation and fair presentation of the financial statements in accordance with accounting principles generally accepted in the United States of America; this includes the design, implementation, and maintenance of internal control relevant to the preparation and fair presentation of financial statements that are free from material misstatement, whether due to fraud or error. Auditors’ Responsibility Our responsibility is to express opinions on the financial statements based on our audits. We conducted our audits in accordance with auditing standards generally accepted in the United States of America and the standards applicable to financial audits contained in Government Auditing Standards, issued by the Comptroller General of the United States. Those standards require that we plan and perform the audit to obtain reasonable assurance about whether the financial statements are free from material misstatement. An audit involves performing procedures to obtain audit evidence about the amounts and disclosures in the financial statements. The procedures selected depend on our judgment, including the assessment of the risks of material misstatement of the financial statements, whether due to fraud or error. In making those risk assessments, we consider internal control relevant to the University's preparation and fair presentation of the financial statements in order to design audit procedures that are appropriate in the circumstances, but not for the purpose of expressing an opinion on the effectiveness of the University's internal control. Accordingly, we express no such opinion. An audit also includes evaluating the appropriateness of accounting policies used and the reasonableness of significant accounting estimates made by management, as well as evaluating the overall presentation of the financial statements. We believe that the audit evidence we have obtained is sufficient and appropriate to provide a basis for our audit opinions. Opinions In our opinion, the financial statements referred to above present fairly, in all material respects, the respective financial position of the primary institution and the aggregate discretely presented component

2
units of the University as of June 30, 2017 and June 30, 2016, and the respective changes in financial position and cash flows thereof for the years then ended in accordance with accounting principles generally accepted in the United States of America. Other Matters Required Supplementary Information The accompanying management’s discussion and analysis on pages 4 through 19, and the Required Supplementary Information on GASB 68 Pension Liabilities on page 88 are required by accounting principles generally accepted in the United States of America to supplement the basic financial statements. Such information, although not a part of the basic financial statements, is required by the Governmental Accounting Standards Board who considers it to be an essential part of financial reporting for placing the basic financial statements in an appropriate operational, economic, or historical context. We have applied certain limited procedures to the required supplementary information in accordance with auditing standards generally accepted in the United States of America, which consisted of inquiries of management about the methods of preparing the information and comparing the information for consistency with management's responses to our inquiries, the basic financial statements, and other knowledge we obtained during our audits of the basic financial statements. We do not express an opinion or provide any assurance on the information because the limited procedures do not provide us with sufficient evidence to express an opinion or provide any assurance. Other Information Our audits were conducted for the purpose of forming opinions on the financial statements that collectively comprise the University’s basic financial statements. The accompanying other information on the long-term investment pool on pages 89 through 90 is presented for purposes of additional analysis and is not a required part of the basic financial statements. Such information has not been subjected to the auditing procedures applied in the audit of the basic financial statements and, accordingly, we do not express an opinion or provide any assurance on it. The accompanying schedule of expenditures of federal awards for the year ended June 30, 2017 on pages 91 through 128 is presented for purposes of additional analysis as required by Title 2 U.S. Code of Federal Regulations Part 200, Uniform Administrative Requirements, Cost Principles, and Audit Requirements for Federal Awards (Uniform Guidance) and is not a required part of the basic financial statements. The accompanying schedule of expenditures of federal awards is the responsibility of management and was derived from and relates directly to the underlying accounting and other records used to prepare the basic financial statements. Such information has been subjected to the auditing procedures applied in the audit of the basic financial statements and certain additional procedures, including comparing and reconciling such information directly to the underlying accounting and other records used to prepare the basic financial statements or to the basic financial statements themselves, and other additional procedures in accordance with auditing standards generally accepted in the United States of America. In our opinion, the schedule of expenditures of federal awards is fairly stated, in all material respects, in relation to the basic financial statements as a whole.

3
Other Reporting Required by Government Auditing Standards In accordance with Government Auditing Standards, we have also issued our report dated November 6, 2017 on our consideration of the University’s internal control over financial reporting and on our tests of its compliance with certain provisions of laws, regulations, contracts and grant agreements and other matters for the year ended June 30, 2017. The purpose of that report is to describe the scope of our testing of internal control over financial reporting and compliance and the results of that testing and not to provide an opinion on internal control over financial reporting or on compliance. That report is an integral part of an audit performed in accordance with Government Auditing Standards in considering the University’s internal control over financial reporting and compliance.
November 6, 2017

Management’s Discussion and Analysis for the Year Ended June 30, 2017 (Unaudited)
2017 Financial Report 4
The following Management’s Discussion and Analysis, or MD&A, provides an overview of the financial position and activities of The Ohio State University (the “university”) for the year ended June 30, 2017, with comparative information for the years ended June 30, 2016 and June 30, 2015. We encourage you to read this MD&A section in conjunction with the audited financial statements and footnotes appearing in this report.
About The Ohio State University
The Ohio State University is the State of Ohio’s flagship research institution and one of thelargest universities in the United States of America, with over 66,000 students, 7,000 facultymembers and 25,000 staff members. Founded in 1870 under the Morrill Land Grant Act, theuniversity – which was originally known as the Ohio Agricultural and Mechanical College -- hasgrown over the years into a comprehensive public institution of higher learning, with over 200undergraduate majors, 157 master’s degree programs, 121 doctoral programs and seven professional degree programs.
The Ohio State University Wexner Medical Center is one of the the largest and most diverseacademic medical centers in the country and the only academic medical center in central Ohio.As a part of the Wexner Medical Center, the Health System operates under the governance ofThe Ohio State University Board of Trustees and is comprised of seven hospitals and anetwork of ambulatory care locations. The Health System provides care across the spectrumfrom primary care to quaternary specialized care. Key clinical care locations and facilities atthe Health System include:
• University Hospital: the Medical Center’s full-service tertiary care facility that providescare to patients throughout the region.
• Arthur G. James Cancer Hospital and Solove Research Institute: one of only 41National Cancer Institute-designated Comprehensive Cancer Centers. In fiscal 2015,the Arthur G. James Cancer Hospital and Solove Research Institute opened a newtower, which is a transformational facility that fosters collaboration and integration ofcancer research and clinical cancer care.
• Richard M. Ross Heart Hospital: The Ross is home to OSU’s Heart and Vascularprogram, ranked 26th out of nearly 5,000 hospitals around the country by US Newsand World Report.
• OSU Harding Hospital: provides the most comprehensive behavioral healthcareservices in central Ohio.
• University Hospital East: a full service community hospital.• Dodd Hall: a 60-bed inpatient rehabilitation facility.• Brain and Spine Hospital: provides comprehensive neuroscience care to improve
prevention, detection and treatment of brain and spine disorders.• Ambulatory Services: a network of community-based primary and subspecialty care
facilities.
The Health System provided services to approximatey 61,700 adult inpatients and 1,764,000 outpatients during fiscal year 2017, 59,300 adult inpatients and 1,724,000 outpatients during fiscal year 2016, and 58,200 adult inpatients and 1,664,000 outpatients during fiscal year 2015.

Management’s Discussion & Analysis (Unaudited) - continued
5 The Ohio State University
The university is governed by a board of trustees who are responsible for oversight of academic programs, budgets, general administration, and employment of faculty and staff. The university’s 15 colleges, four regional campuses, the Wexner Medical Center and various academic support units operate largely on a decentralized basis. The Board approves annual budgets for university operations, but these budgets are managed at the college and department level.
The following financial statements reflect all assets, liabilities, deferred inflows/outflows andnet position (equity) of the university, the Ohio State University Wexner Medical Center, theOhio Agricultural Research and Development Center (OARDC) and the Ohio TechnologyConsortium (OH-TECH), which is an umbrella organization that includes the Ohio AcademicResources Network (OARnet), the Ohio Supercomputer Center and the Ohio Library andInformation Network (OhioLINK). These entities constitute the “primary government” forfinancial reporting purposes. In addition, the financial statements include consolidated financial results for a number of “component units”, which are legally separate entities thatmeet the financial accountability criteria set forth in Governmental Accounting StandardsBoard (GASB) Statement No. 14, The Financial Reporting Entity, as amended by GASB Statement No. 61, The Financial Reporting Entity: Omnibus and Statement No. 80, BlendingRequirements for Certain Component Units—an amendment of GASB Statement No. 14.
The following component units are considered to “exclusively benefit” the university and areshown in a blended presentation with the primary government:
• The OSU Foundation (a fundraising foundation operating exclusively for the benefit of theuniversity)
• OSU Health Plan (a non-profit organization – formerly known as OSU Managed HealthCare Systems -- that administers university health care benefits)
• Oval Limited (captive insurer that provides medical malpractice coverage to universityhospitals and physicians)
The GASB has indicated that, under the amended consolidation standards, the “exclusive benefit” criterion for blending is not met when a component unit provides services to partiesexternal to the primary government. As a result, the university presents the following component units in a discrete presentation:
• OSU Physicians, Inc. (the practice group for physician faculty members of the Collegesof Medicine and Public Health)
• Campus Partners for Community Urban Redevelopment (a non-profit organizationparticipating in the redevelopment of neighborhoods adjacent to the main Columbuscampus)
• Transportation Research Center, Inc. (an automotive research and testing facility in EastLiberty, Ohio)
• Dental Faculty Practice Association (the practice group for faculty members of theCollege of Dentistry)
Condensed financial information for both blended and discretely presented component units is provided in the Notes to the Financial Statements. The university is considered a component

Management’s Discussion & Analysis (Unaudited) - continued
2017 Financial Report 6
unit of the State of Ohio and is included in the State of Ohio’s Comprehensive Annual Financial Report.
About the Financial Statements
The university presents its financial statements in a “business type activity” format, inaccordance with GASB Statement No. 34, Basic Financial Statements – and Management’sDiscussion and Analysis – for State and Local Governments and GASB Statement No. 35, Basic Financial Statements – and Management’s Discussion and Analysis – for PublicColleges and Universities – an amendment of GASB Statement No. 34. In addition to thisMD&A section, the financial statements include a Statement of Net Position, a Statement ofRevenues, Expenses and Other Changes in Net Position, a Statement of Cash Flows andNotes to the Financial Statements. Separate columns are presented for the primary institution (which includes the primary government and the blended component units), discretely presented component units and the total university. Unless otherwise specified, the amountspresented in this MD&A are for the primary institution.
The Statement of Net Position is the university’s balance sheet. It reflects the total assets,deferred outflows, liabilities, deferred inflows and net position (equity) of the university as ofJune 30, 2017, with comparative information as of June 30, 2016. Liabilities due within oneyear, and assets available to pay those liabilities, are classified as current. Other assets and liabilities are classified as non-current. Investment assets are carried at fair value. Capitalassets, which include the university’s land, buildings, improvements, and equipment, areshown net of accumulated depreciation. Net position is grouped in the following categories:
• Net investment in capital assets• Restricted – Nonexpendable• Restricted – Expendable• Unrestricted
In addition to assets, liabilities and net position, the university’s balance sheet includesdeferred outflows of resources and deferred inflows of resources. Deferred outflows are similarto assets and will be recognized as expense in future periods. Deferred inflows are similar to liabilities and will be recognized as revenue (or reductions of expense) in future periods.
The Statement of Revenues, Expenses and Other Changes in Net Position is the university’s income statement. It details how net position has increased (or decreased) during the year ended June 30, 2017, with comparative information for the year ended June 30, 2016. Tuition revenue is shown net of scholarship allowances, patient care revenue is shown net of contractual allowances, charity care and bad debt expense, depreciation is provided for capital assets, and there are required subtotals for net operating income (loss) and net income (loss) before capital contributions and additions to permanent endowments.
It should be noted that the required subtotal for net operating income or loss will generally reflect a “loss” for state-supported colleges and universities. This is primarily due to the way operating and non-operating items are defined under GASB Statement No. 9, Reporting Cash Flows of Proprietary and Nonexpendable Trust Funds and Governmental Entities That Use

Management’s Discussion & Analysis (Unaudited) - continued
7 The Ohio State University
Proprietary Fund Accounting. Operating expenses include virtually all university expenses, except for interest on long-term debt. Operating revenues, however, exclude certain significant revenue streams that the university and other public institutions have traditionally relied upon to fund current operations, including state instructional support, current-use gifts and investment income.
The Statement of Cash Flows details how cash has increased (or decreased) during the year ended June 30, 2017, with comparative information for the year ended June 30, 2016. It breaks out the sources and uses of university cash into the following categories:
• Operating activities• Noncapital financing activities• Capital financing activities• Investing activities
Cash flows associated with the university’s expendable net position appear in the operating and noncapital financing categories. Capital financing activities include payments for capital assets, proceeds from long-term debt and debt repayments. Purchases and sales of investments are reflected as investing activities.
The Notes to the Financial Statements, which follow the financial statements, provide additional details on the numbers in the financial statements. Behind the notes is a section that provides required supplementary information related to pensions and other information on the university’s Long-Term Investment Pool.
Financial Highlights and Key Trends
Total net position for the primary institution increased $571 million in Fiscal Year 2017, primarily due to revenue growth and increases in operating margins for the OSU Health System and strong investment returns. University investments yielded $601 million of net investment income, reflecting increases in fair value. On April 10, 2017, the university entered into a 50-year comprehensive energy management agreement with Ohio State Energy Partners and received a $1.09 billion upfront payment upon settlement on July 6, 2017.
Demand for an Ohio State education remains strong, and student outcomes continue to improve. 66,046 students were enrolled in Autumn 2016, up 862 students compared to Autumn 2015. 94% of the freshmen enrolled in Autumn 2015 returned to OSU in Autumn 2016. Over the past five years, four-year graduation rates have been stable at 59%, and six-year graduation rates have increased from 80% to 84%.
The following sections provide additional details on the university’s 2017 financial results and a look ahead at significant economic conditions that are expected to affect the university in the future.

Management’s Discussion & Analysis (Unaudited) - continued
2017 Financial Report 8
Statement of Net Position
During the year ended June 30, 2017, cash and temporary investment balances increased $259 million, to $2.23 billion, primarily due to strong operating margins at the OSU Health System. Amounts shown as restricted cash consist primarily of unspent proceeds from the General Receipts Bonds, which are being used to fund various capital projects. Restricted cash balances decreased $137 million, to $666 million at June 30, 2017, reflecting application of bond proceeds to capital projects. The Statement of Cash Flows, which is discussed in more detail below, provides additional information on sources and uses of university cash.
Accounts receivable, net of allowances, increased $63 million, to $576 million at June 30, 2017, primarily due to increases in patient care receivables of the Health System.
Summary Statement of Net Position (in thousands)2017 2016 2015
Cash and temporary investments 2,230,609$ 1,971,929$ 1,782,051$ Receivables, inventories, prepaids and other current assets 757,389 709,872 664,402
Total current assets 2,987,998 2,681,801 2,446,453
Restricted cash 666,032 802,707 375,425 Noncurrent notes and pledges receivable 108,073 106,629 118,257 Long-term investment pool 4,253,459 3,616,562 3,659,387 Other long-term investments 143,638 132,971 93,367 Capital assets, net of accumulated depreciation 4,883,584 4,852,433 4,803,242
Total noncurrent assets 10,054,786 9,511,302 9,049,678
Total assets 13,042,784 12,193,103 11,496,131
Deferred outflows 1,012,937 698,125 227,083
Total assets and deferred outflows 14,055,721$ 12,891,228$ 11,723,214$
Accounts payable and accrued expenses 524,754$ 469,216$ 447,364$ Deposits and advance payments for goods and services 223,880 216,372 261,537 Current portion of bonds, notes and lease obligations 651,984 658,418 655,919 Other current liabilities 87,708 94,883 76,788
Total current liabilities 1,488,326 1,438,889 1,441,608
Noncurrent portion of bonds, notes and lease obligations 2,640,142 2,714,842 2,186,090 Net pension liability 3,565,362 2,794,626 2,130,432 Other noncurrent liabilities 366,057 401,708 380,382
Total noncurrent liabilities 6,571,561 5,911,176 4,696,904
Total liabilities 8,059,887 7,350,065 6,138,512
Deferred inflows 471,288 587,150 693,251
Net investment in capital assets 2,259,207 2,282,647 2,340,342 Restricted: Nonexpendable 1,480,440 1,370,064 1,355,560 Expendable 1,195,515 908,953 993,000 Unrestricted 589,384 392,349 202,549
Total net position 5,524,546 4,954,013 4,891,451
Total liabilities, deferred inflows and net position 14,055,721$ 12,891,228$ 11,723,214$
Management’s Discussion & Analysis (Unaudited) - continued
9 The Ohio State University
The fair value of the university’s long-term investment pool increased $637 million, to $4.25 billion at June 30, 2017. The increase is primarily due to a combination of $552 million of net investment income and a $250 million investment of Wexner Medical Center Health System cash in the pool. These increases were partially offset by distributions ($167 million) and expenses ($72 million). The long-term investment pool operates similar to a mutual fund, in that each named fund is assigned a number of shares in the pool. It includes the gifted endowment funds of the university, gifted endowment funds of the OSU Foundation, and operating funds which have been internally designated to function as endowments. The pool is invested in a diversified portfolio of equity and fixed-income securities, partnerships and hedge funds that is intended to provide the long-term growth necessary to preserve the value of these funds, adjusted for inflation, while making distributions to support the university’s mission.
The university has established a securities lending program through its custodian bank for the long-term investment pool. Securities loaned by the university are secured by collateral in the form of cash, equity, U.S. government obligations, and foreign government/private debt. The portion of this collateral that was received in cash totaled $16 million and $28 million at June 30, 2017 and 2016, respectively, and is reflected in the Statement of Net Position as a current asset and a corresponding current liability.
Other long-term investments are non-unitized investments that relate primarily to gift arrangements between donors and the OSU Foundation and long-term investments of operating funds. These investments increased $11 million, to $144 million, at June 30, 2017.
Capital assets, which include the university’s land, buildings, improvements, equipment and library books, grew $31 million, to $4.88 billion at June 30, 2017. The university depreciates its capital assets on a straight-line basis, using estimated useful lives ranging from 5 years (for computer equipment and software) to 100 years (for certain building components such as foundations).
In 2017, the university completed construction of the 116,000 square foot Jameson Crane Sports Medicine Institute. The $38 million comprehensive sports medicine building is a state of art facility and the largest of its kind in the Midwest. The Institute houses 15 inter-disciplinary specialties and 160 sports medicine faculty and staff. Mount Hall underwent a 73,000 square foot, $15 million renovation to house approximately 450 staff from the Office of the Chief Information Officer and Office of Distance Education. Four new aircraft hangars were constructed as part of the $5 million initial phase of a $20 million University Airport enhancement.
Major infrastructure improvements completed in 2017 included $8 million related to the street and bridge maintenance across campus including Defiance Drive, walkways between buildings on West Campus, portions of Neil Avenue, Hagerty Drive, 18th Avenue, Service Annex Drives A-B, Woody Hayes, Herrick Drive, and the Herrick Drive Bridge over the Olentangy River.
In addition, several major construction projects are currently underway or in advanced planning stages, including:

Management’s Discussion & Analysis (Unaudited) - continued
2017 Financial Report 10
• Arts & Science Academic Buildings—The $59 million project will renovate Pomerene,and Oxley Halls to accommodate academic programs. In addition, the Baker Commonsenabling project renovated space to accommodate the Office of Disability Services staffwho relocated from Pomerene. Pomerene and Oxley Halls are slated for completion inthe spring of 2018.
• Covelli Multi-Sport Arena – The $50 million project will construct a new multi-sport arenato house the men’s and women’s varsity volleyball teams, and fencing, wrestling, andgymnastics matches. The project is in the design phase and slated for completion in thespring of 2019.
• Marion Science and Engineering Building – A new $15 million Science and Engineeringbuilding completed in July 2017 replaces an older facility, expands space for theengineering program and enhances the quality of the teaching and research on theMarion regional campus.
• Ohio Stadium Upgrades – The $39 million project will include power upgrades, suiteexpansion and renovation, C-Deck restoration, and a suite and loge addition. Theproject is currently in the design phase and slated for completion for the summer of2018.
• Student Athlete Development Center – The $43 million project will construct a state-of-the-art athletic training center with new weight training and cardio conditioning for use bymost of the university’s sports programs. The project is in the design phase and slatedfor completion the summer of 2018.
• Schottenstein Center-North Expansion and Concourse Renovation – The $32 millionproject will renovate the concourse walls and lighting and include an addition to thenorth end of the facility. The initial phase of the project is slated for completion insummer 2018.
University capital expenditures totaled $415 million in 2017, including $164 million of capital expenditures for the Wexner Medical Center Health System. The university’s estimated future capital commitments, based on contracts and purchase orders, total approximately $262 million at June 30, 2017.
Accounts payable and accrued expenses were up $56 million, to $525 million at June 30, 2017, primarily due to increases in accrued compensation and benefits (up $33 million) and the accrual of a $16 million fee related to the settlement of an interest-rate swap agreement associated with the comprehensive energy management agreement. Deposits and advance payments for goods and services increased $8 million, to $224 million. Increases in advance payments for sponsored programs were partially offset by reduction in unearned sales and service revenues.
University debt, in the form of bonds, notes and capital lease obligations, decreased $81 million, to $3.29 billion at June 30, 2017. The university did not issue any new bonds during 2017.

Management’s Discussion & Analysis (Unaudited) - continued
11 The Ohio State University
The university’s plant debt includes variable rate demand bonds that mature at various dates through 2044. GASB Interpretation 1, Demand Bonds Issued by State and Local Governmental Entities, provides guidance on the statement of net position classification of these bonds. Under GASB Interpretation 1, outstanding principal balances on variable rate demand bonds may be classified as noncurrent liabilities if the issuer has entered into a “take-out agreement” to convert bonds “put” but not resold into some other form of long-term obligation. In the absence of such an agreement, the total outstanding principal balances for these bonds are required to be classified as current liabilities.
Although it is the university’s intent to repay its variable rate demand bonds in accordance with the maturities set forth in the bond offering circulars, the university does not have “take-out agreements” in place per the GASB Interpretation 1 requirements. Accordingly, the university has classified the total outstanding principal balances on its variable rate demand bonds as current liabilities. These obligations totaled $588 million and $596 million at June 30, 2017 and 2016, respectively.
GASB Statement No. 68 requires governmental employers participating in defined benefit pension plans to recognize liabilities for plans whose actuarial liabilities exceed the plan’s net assets. These liabilities are referred to as net pension liabilities. The university participates in two multi-employer cost-sharing retirement systems, OPERS and STRS-Ohio. Under GASB 68, the university is required to record a liability for its proportionate share of the net pension liabilities of the retirement systems. The university’s share of these net pension liabilities increased $771 million, to $3.57 billion at June 30, 2017. Total net pension liabilities increased at OPERS primarily due to a reduction in the discount rate used in the liability calculation (from 8% to 7.5%). Total net pension liabilities increased at STRS-Ohio primarily due to lower-than-projected investment returns. Net deferrals associated with pensions increased $422 million, to $975 milllion at June 30, 2017. These deferrals will be recognized as pension expense in future periods. Total pension expense recognized by the university increased $255 million, to $664 million in 2017. Total pension expense includes $315 million of employer contributions and $349 million in GASB 68 accruals.
It should be noted that, in Ohio, employer contributions to the state’s cost-sharing multi-employer retirement systems are established by statute. These contributions, which are payable to the retirement systems one month in arrears, constitute the full legal claim on the university for pension funding. Although the liabilities recognized under GASB 68 meet the GASB’s definition of a liability in its conceptual framework for accounting standards, they do not represent legal claims on the university’s resources, and there are no cash flows associated with the recognition of net pension liabilities, deferrals and related expense.
Other (non-pension) deferred inflows consist primarily of the unamortized proceeds of the parking service concession arrangement. The parking deferred inflows, which totaled $436 million at June 30, 2017, are being amortized to operating revenue on a straight-line basis over the 50-year life of the agreement. In addition, the deferred inflows include $19 million of deferred gains on debt-related transactions.
Prior-Year Highlights: In 2016, the university issued $600 million in taxable Fixed Rate General Receipts Bonds and $31 million in tax-exempt Fixed Rate General Receipts Bonds.

Management’s Discussion & Analysis (Unaudited) - continued
2017 Financial Report 12
Net pension liabilities increased $664 million, to $2.79 billion, reflecting increases in actuarial liabilities and decreases in fiduciary net position for both STRS-Ohio and OPERS. Cash and temporary investment balances increased $190 million, to $1.97 billion, primarily due to strong operating margins at the OSU Health System. In 2015, the university implemented GASB Statement No. 68, Accounting and Financial Reporting for Pensions. The adoption of the new standard resulted in a $2.16 billion reduction in the university’s opening unrestricted net position. The net pension liability recognized by the university at June 30, 2015 was $2.13 billion. Capital assets grew $310 million, to $4.80 billion, as the university completed several large projects and continued work on the North Residential District Transformation (NRDT).
Statement of Revenues, Expenses and Other Changes in Net Position
Net tuition and fees increased $43 million, to $927 million in 2017, primarily due to a 6% increase in non-resident enrollments and a 5% increase in the non-resident surcharge. Resident enrollments were flat. The university did not increase its undergraduate instructional and mandatory fees for fiscal 2017.
Summary of Revenues, Expenses and Changes in Net Position (in thousands)
2017 2016 2015
Operating Revenues:Tuition and fees, net 927,317$ 884,805$ 850,289$ Grants and contracts 677,361 630,858 657,238 Auxiliary enterprises sales and services, net 309,497 261,761 261,351 OSU Health System sales and services, net 2,853,177 2,625,075 2,357,824 Departmental sales and other operating revenues 204,091 173,882 181,532
Total operating revenues 4,971,443 4,576,381 4,308,234
Operating Expenses:Educational and general 2,488,642 2,359,243 2,238,015 Auxiliary enterprises 313,185 254,137 248,879 OSU Health System 2,595,797 2,251,030 1,970,124 Depreciation 374,615 351,901 335,881
Total operating expenses 5,772,239 5,216,311 4,792,899
Net operating loss (800,796) (639,930) (484,665)
Non-operating revenues (expenses):State share of instruction and line-item appropriations 473,061 456,063 435,824 Gifts - current use 181,212 156,737 163,800 Net investment income (loss) 600,701 (10,513) 173,295 Grants, interest expense and other non-operating (38,854) (11,135) 25,699
Net non-operating revenue 1,216,120 591,152 798,618
Income (loss) before other changes in net position 415,324 (48,778) 313,953
State capital appropriations 68,270 36,381 40,868 Private capital gifts 26,762 10,422 1,688 Additions to permanent endowments 52,458 64,537 62,295 Capital contributions and other changes in net position 7,719 - -
Total other changes in net position 155,209 111,340 104,851
Increase in net position 570,533 62,562 418,804
Net position - beginning of year 4,954,013 4,891,451 6,637,119
Cumulative effect of accounting change - - (2,164,472)
Net position - end of year 5,524,546$ 4,954,013$ 4,891,451$

Management’s Discussion & Analysis (Unaudited) - continued
13 The Ohio State University
Operating grant and contract revenues increased $47 million, to $677 million in 2017. Federal grant and contract revenues were up $11 million, to $324 million, reflecting increases in federal sponsored programs. State grants and contract revenues were up $7 million, to $77 million, reflecting increases in research grants from several state agencies. Private grant and contract revenues increased $27 million, to $254 million, primarily due to increases in grants to the College of Medicine.
Educational and general expenses increased $129 million, or 5%, to $2.49 billion in 2017. Additional details are provided below.
The overall increase in educational and general expense is related to GASB 68 pensionaccruals. These accruals are allocated to functional expense lines in the Statement ofRevenues, Expenses and Other Changes in Net Position, based on pension-eligible salaries.Excluding these accruals, total educational and general expenses were relatively flat, increasing $8 million in 2017. Scholarships and fellowships, net of amounts shown asreductions of tuition and auxiliary revenues, increased $9 million, to $130 million in 2017,reflecting increases in unrestricted (university-funded) student financial aid.
Total auxiliary revenues increased $48 million, to $309 million in 2017, primarily due to anincrease in beds in the North Residential District and additional meal plans sold to second-year students, who are now required to live in the campus dorms. Auxiliary expensesincreased $59 million, to $313 million, primarily due to increases in housing and dining costs.
Health System operating revenues grew $228 million, to $2.85 billion in 2017. Operating expenses (excluding depreciation, interest and transfers) increased $345 million, to $2.60 billion. An in-depth look at the Health System, as presented in their stand-alone financial statements, is provided below.
The Health System operates over 1,300 inpatient beds and serves as a major tertiary and quaternary referral center for Ohio and the Midwest. The Wexner Medical Center delivers superior patient care, quality outcomes, and patient safety and has been recognized by US News and World Report for 25 consecutive years as one of “America’s Best Hospitals” and has seven nationally ranked specialties and is one of only a handful of hospitals in the country ranked in multiple specialties. Less than 1% of hospitals in the country achieved that honor. The Wexner Medical Center was selected by Becker Hospital Review for its 2017 list of “100
Educational and General Expenses (in thousands)2017 2016 2015
Instruction and departmental research 1,006,411$ 994,287$ 940,105$ Separately budgeted research 497,508 444,077 434,624 Public service 175,101 160,281 131,358 Academic support 222,043 207,688 192,140 Student services 108,041 103,784 100,229 Institutional support 254,782 227,157 230,749 Operation and maintenance of plant 94,687 101,007 95,866 Scholarships and fellowships 130,069 120,962 112,944
Total 2,488,642$ 2,359,243$ 2,238,015$

Management’s Discussion & Analysis (Unaudited) - continued
2017 Financial Report 14
Great Hospitals in America” for excellence in patient care and clinical research, leadership in innovations and ranking and awards. The Health System is proud to be the first health system in central Ohio to have a hospital achieve Magnet Recognition, one of the highest honors awarded for nursing excellence. The Ross Heart Hospital, University Hospital, and the Arthur G. James Cancer Hospital and Richard J. Solove Research Institute are all designated Magnethospitals. The Health System works with a strong physician group that provides exceptionalpatient care. Physicians at the Wexner Medical Center were selected by Castle Connollybecause they are among the very best in their specialties.
In fiscal 2017, the Health System continued its expansion strategy by opening Outpatient Care Upper Arlington, The Jameson Crane Sports Medicine Institute, and the Brain and Spine Hospital. The Outpatient Care Upper Arlington facility will provide high quality and convenient health services from disease prevention and primary care to highly specialized women’s health services and beyond. The Jameson Crane Sports Medicine Institute is the Midwest’s largest and most advanced sports medicine facility and is the home of innovation and discovery in helping people improve their athletic performance, recover from injury and prevent future injuries. The new state of the art complex integrates research, teaching, clinical care, and performance training under one roof. The Brain and Spine Hospital is home to central Ohio’s top-ranked Neurology and Neurosurgery program. The new Brain and Spine Hospital combines the talent and resources of doctors and researchers at the Wexner Medical Center’s Neurological Institute in one comprehensive hospital. It includes specialized units for stroke care, neurotrauma and traumatic brain injuries, spinal cord injuries and spine surgery, epilepsy, chronic pain, acute rehabilitation, and neurosurgery.
The largest development project (Medical Center Expansion) in the history of The Ohio State University was completed in fiscal 2015. Included in Medical Center Expansion was the construction of the new Arthur G. James Cancer Hospital and Richard J. Solove Research Institute (“The James”). The new tower is a transformational facility that fosters the collaboration and integration of cancer research and clinical cancer care. The James is the largest cancer hospital in the Midwest and the third largest in the nation. The new 21-level tower opened in December of fiscal year 2015.
In 2017, the Health System continued with the Medical Center mission of "improving people’s lives through innovation in research, education and patient care" and remained financially sound due to solid activity levels and strong expense management. Inpatient admissions increased 3.9% compared to the prior year. Outpatient visits increased 2.3% and total observation patients increased 6.5% over the previous year. Outpatient visits experienced significant growth specific to Surgical, Radiation Oncology, Rehab Services, Radiology, and Chemotherapy. The Health System continued its ambulatory expansion strategy with the opening of the Upper Arlington outpatient facility in Kingsdale and The Jameson Crane Sports Medicine Institute this year. These new locations along with the outpatient rehabilitation program achieved significant growth of 20.7% over the prior year for Ambulatory Services.
The Health System experienced strong surgical volumes in 2017 and was 5.4% above the prior year activity. Service lines contributing to the growth in surgical volumes in 2017 were Cancer, Transplant, Orthopedic Surgery, Trauma/Critical Care, Burn, Ophthalmology, and

Management’s Discussion & Analysis (Unaudited) - continued
15 The Ohio State University
Urology. The growth in surgical volumes contributed to increases in admissions, revenues, and outpatient volumes
Total operating revenues grew $225.1 million, or 8.6% from the prior year. The increases in operating revenues are a result of strong admissions, surgical volumes, and increased outpatient activities. Total operating revenues grew $259.9 million, or 11.0% from 2015 to 2016. The increases from 2015 to 2016 are a result of the additional volumes related to Medical Center Expansion and the new James Cancer Hospital being open for the entire fiscal year and strong revenues related to the Retail Pharmacy.
Approximately 93% of total operating revenues are from patient care activities. Other operating revenues is composed of items such as reference labs, cafeteria operations, rental agreements and other sources. To ensure appropriate access and education for outpatients, the Health System opened the Retail Pharmacy in 2015 due to the increasing complexity and significantly growing number of specialty oral and self-administered pharmaceuticals available for cancer and non-cancer patients. The Retail Pharmacy contributed $92.5 million of operating revenues in 2017, $70.3 million in 2016, and $32.7 million in 2015. To standardize care across the Neonatal Intensive Care Units in central Ohio, the Health System shares other revenue from Nationwide Children’s Hospital management of the unit. The Neonatal Intensive Care Units contributed $16.4 million of operating revenues in 2017, $18.8 million in 2016, and $14.7 million in 2015.
Operating expenses increased $300.2 million, or 12.9% from 2016 to 2017. The increase in salaries and benefits from 2016 to 2017 is reflective of increased salaries and a larger workforce due to the additional volumes related to Brain and Spine Hospital, Jameson Crane Sports Medicine Institute, and Outpatient Care Upper Arlington as well as the continued growth at the James Cancer Hospital. Strong admissions, surgical volumes, and increased outpatient activities as well as higher Retail Pharmacy volumes contributed to the increase in supplies and drugs. The increase in purchased services from 2016 to 2017 is reflective of increased preventative maintenance costs for information technology and medical equipment as well as an increase in franchise fee for the hospitals. The increase in pension expense from 2016 to 2017 is related to the reduction in the discount rate used in the liability calculation and lower-than-projected investment returns.
Income before other changes in Net Position was $215 million in 2017 compared to $248.6 million in 2016. Pension expense was $168.1 million in 2017 compared to $63 million in 2016 reflecting annual accounting under GASB 68. Income before other changes in Net Position for clinical activities was $383.2 million in 2017 compared to $312.3 million in 2016 reflecting strong activities, a strong patient mix and maintaining expenses in line with activities throughout the Health System.
The Health System’s other changes in net position for fiscal year 2017 includes Medical Center Investments of $145.2 million reinvested back into research, education, and programs at the Medical Center. This compares to Medical Center Investments of $125.3 million in 2016 and $136.9 million in 2015. Additionally, other changes in net position include $17.6 million for capital expansion and hospital projects for fiscal year 2017.
Management’s Discussion & Analysis (Unaudited) - continued
2017 Financial Report 16
Revenues and operating expenses of OSU Physicians, Inc. (OSUP), the University’s central practice group for physician faculty members of the College of Medicine and Public Health, continued to grow in 2017. Total consolidated operating revenues increased $9 million, to $496 million, reflecting increases in patient volumes. Total consolidated OSUP expenses (excluding depreciation and interest) increased $3 million to $444 million in 2017. These figures are included in the Discretely Presented Component Units columns of the university’s financial statements.
Total state operating support increased $17 million, to $473 million in 2017. State share of instruction increased $23 million, or 6%, to $385 million. This increase was partially offset by a $6 million decrease in state line-item appropriations, to $88 million in 2017.
State capital appropriations increased $32 million, to $68 million in 2017, reflecting funding for OH-Tech capital projects ($16 million), the Pomerene Oxley Hall renovation ($10 milllion) and the Newark Adena Hall renovation ($3 million).
Total gifts to the university increased $29 million, to $260 million in 2017. Increases in current use and capital gifts were partially offset by a $12 million decrease in endowment gifts. Several colleges and support units received gifts in excess of $1 million in 2017, including Veterinary Medicine, Food Agricultural and Environmental Sciences, the Wexner Center for the Arts, the Comprehensive Cancer Center, the College of Medicine, the College of Arts and Sciences and the Fisher College of Business. Gift receipts from the annual Pelotonia ride increased $1 million, to $28 million in 2017. During 2017, over 267,000 alumni and friends made gifts to the university, up from 246,000 in 2016.
University investments yielded $601 million of net investment income in 2017. The net investment income figure includes $124 million of interest and dividend income and a $477 million net increase in the fair value of university investments.
To start the fiscal year, the Brexit vote impacted world financial markets as the U.S. 10 year-treasury hit a low yield of 1.37% in the flight to quality that ensued. Over the rest of the year, world events and political uncertainty in the U.S. raised concerns about prospects for economic growth. Despite this backdrop, structural low world interest rates combined with low equity market volatility driven by solid corporate earnings and consumer confidence supported strong world equity market investment returns. The All Country World Equity Index returned +19.42% and the S&P500 generated a +17.90% for the fiscal year.
The University’s Long-Term Investment Pool (LTIP) returned +14.5% for the fiscal year ending June 30, 2017. The LTIP outperformed on a relative basis to each of its individual benchmarks for its three major asset classes; global equities, fixed income and real assets. The LTIP is a diversified portfolio of investments designed to provide steady growth in a risk controlled structure.
Interest expense on plant debt increased $27 million, to $121 million in 2017, primarily due to an increase in interest expense related to the Series 2016A and 2016B bonds and a reduction in capitalized interest.

Management’s Discussion & Analysis (Unaudited) - continued
17 The Ohio State University
Prior-Year Highlights: In 2016, OSU Health System operating revenues increased $267 million, to $2.63 billion, reflecting additional volumes related to the Medical Center Expansion and the new James Cancer Hospital (2016 was the first full fiscal year of operations for these facilities). Educational and general expenses increased $121 million, to $2.36 billion. Approximately $64 million of the overall increase in E&G expense was related to GASB 68 pension accruals. University investments yielded an $11 million net investment loss. In 2015, the implementation of GASB 68 reduced beginning net position by $2.16 billion. Excluding the effect of the GASB 68 accounting change, total net position for the primary institution increased $419 million, reflecting revenue growth and increases in operating margins for the OSU Health System and $173 million of net investment income. Other university operating revenues and expenses were relatively flat compared with 2014.
Statement of Cash Flows
University cash and cash equivalents decreased $15 million in 2017. Net cash flows from operating and non-capital financing activities increased $109 million, to $687 million, as growth in receipts from sales and services, grants and contracts and gifts outpaced increases in operating disbursements. Total cash used by capital financing activities was $518 million, reflecting capital expenditures and payments for debt service. Total cash used by investing activities was $184 million, reflecting net purchases of temporary investments.
Economic Factors That Will Affect the Future
In August 2017, university leadership introduced a new strategic plan “to make the next bold leap in Ohio State’s land-grant history of excellence and impact”. The strategic plan sets forth five pillars of focus:
• Teaching and Learning – Ohio State will be an exemplar of the best teaching,demonstrating leadership by adopting innovative, at-scale approaches to teachingand learning to improve student outcomes.
University Cash Flows Summary (in thousands)2017 2016 2015
Net cash flows used in operating activities (100,589)$ (174,888)$ (113,426)$
Net cash flows from noncapital financing activities 787,986 752,926 715,137
Capital appropriations and gifts for capital projects 82,982 46,511 53,092
Proceeds from capital debt 6,430 618,242 300,820
Payments for purchase or construction (414,606) (428,966) (610,776) of capital assets
Principal and interest payments on capital debt and leases, (192,914) (190,501) (146,095) net of federal Build America Bond interest subsidies
Net cash flows used in investing activities (184,111) (301,532) (14,974)
Net increase (decrease) in cash (14,822)$ 321,792$ 183,778$

Management’s Discussion & Analysis (Unaudited) - continued
2017 Financial Report 18
• Access, Affordability and Excellence – Ohio State will further our position as aleading public university offering an excellent, affordable education and promotingeconomic diversity.
• Research and Creative Expression – Ohio State will enhance our position amongthe top national and international public universities in research and creativeexpression, both across the institution and in targeted fields – driving significantadvances for critical societal challenges.
• Academic Health Care – The Ohio State University Wexner Medical Center willcontinue our ascent as a leading academic medical center, pioneering breakthroughhealth care solutions and improving people’s lives.
• Operational Excellence and Resource Stewardship – Ohio State will be anexemplar of best practices in resource stewardship, operational effectiveness, andefficiency and innovation.
The strategic plan reinforces and builds on the priorities set in the 2020 Vision, which President Michael V. Drake established in 2015 to achieve inclusive excellence. Among other goals, the 2020 Vision established financial goals of generating $400 million in support for the academic mission, including $200 million in administrative efficiencies and $200 million in new revenue from sources other than tuition or taxpayers.
The major themes for the university’s 2018 budget are access, affordability and excellence.
The university introduced the Ohio State Tuition Guarantee for new first-year students, which provides incoming undergraduates with more certainty about college costs by setting rates for in-state tuition, mandatory fees, room and board for four years. For incoming freshmen on the Columbus campus, in-state tuition and mandatory fees increased 5.5%, but those rates will not change during a four-year education. Meanwhile, the university continued to freeze in-state tuition and mandatory fees for continuing students, who have not experienced an increase since 2012-13. The Board of Trustees also approved a 6% increase in housing rates and a 3% increase in dining fees.
At the same time, Ohio State has expanded financial aid by committing $25 million to the President’s Affordability Grant Program for 2017-18 and increasing the value of the Land Grant Opportunity Scholarship to cover the full cost of attendance. The President’s Affordability Grants are funded through the university’s administrative efficiency program.
Based on what is now known regarding the university’s financial outlook, university management anticipates that Ohio State will maintain its sound financial position in Fiscal Year 2018. However, the university does face certain financial challenges, including a slowing state economy and uncertainties related to future federal funding for research. Despite these challenges and uncertainties, the university remains committed to executing its long-range

Management’s Discussion & Analysis (Unaudited) - continued
19 The Ohio State University
strategic plan. By doing so, we believe that The Ohio State University will continue its progress towards becoming the world’s preeminent comprehensive public university.
Cautionary Note Regarding Forward-Looking Statements
Certain information provided by the university, including written as outlined above or oral statements made by its representatives, may contain forward-looking statements as defined in the Private Securities Litigation Reform Act of 1995. All statements, other than statements of historical facts, which address activities, events or developments that the university expects or anticipates will or may occur in the future contain forward-looking information.
In reviewing such information, it should be kept in mind that actual results may differ materially from those projected or suggested in such forward-looking information. This forward-looking information is based upon various factors and was derived using various assumptions. The university does not undertake to update forward-looking information contained in this report or elsewhere to reflect actual results, changes in assumptions or changes in other factors affecting such forward-looking information.

2017 Financial Report 20
THE OHIO STATE UNIVERSITYSTATEMENTS OF NET POSITION
June 30, 2017 and June 30, 2016(in thousands)
2017 2016 2017 2016 2017 2016
ASSETS AND DEFERRED OUTFLOWS:Current Assets:
Cash and cash equivalents 584,928$ 463,075$ 125,725$ 87,001$ 710,653$ 550,076$ Temporary investments 1,645,681 1,508,854 9,216 7,050 1,654,897 1,515,904 Accounts receivable, net 575,875 512,631 47,736 52,715 623,611 565,346 Notes receivable - current portion, net 25,231 22,798 84 2,780 25,315 25,578 Pledges receivable - current portion, net 33,718 35,322 - - 33,718 35,322 Accrued interest receivable 20,058 19,295 - - 20,058 19,295 Inventories and prepaid expenses 99,223 111,388 3,628 3,784 102,851 92,316 Investments held under securities lending program 15,949 27,589 - - 15,949 27,589 Amounts due from (to) primary institution (12,665) (19,151) 12,665 19,151 - -
Total Current Assets 2,987,998 2,681,801 199,054 172,481 3,187,052 2,831,426
Noncurrent Assets:Restricted cash 666,032 802,707 - - 666,032 802,707 Notes receivable, net 35,723 41,083 2,664 443 38,387 41,526 Pledges receivable, net 72,350 65,546 - - 72,350 65,546 Long-term investment pool 4,253,459 3,616,562 - - 4,253,459 3,616,562 Other long-term investments 143,638 132,971 1,550 4,766 145,188 137,737 Capital assets, net 4,883,584 4,852,433 122,167 117,965 4,982,987 4,970,398
Total Noncurrent Assets 10,054,786 9,511,302 126,381 123,174 10,158,403 9,634,476
Total Assets 13,042,784 12,193,103 325,435 295,655 13,345,455 12,465,902 Deferred Outflows:Pension 991,559 675,709 155 124 991,714 675,833 Other deferred outflows 21,378 22,416 - - 21,378 22,416
Total Deferred Outflows 1,012,937 698,125 155 124 1,013,092 698,249
Total Assets and Deferred Outflows 14,055,721$ 12,891,228$ 325,590$ 295,779$ 14,358,547$ 13,164,151$
LIABILITIES, DEFERRED INFLOWS AND NET POSITION:Current Liabilities:Accounts payable and accrued expenses 524,754$ 469,216$ 25,204$ 23,116$ 549,958$ 492,332$ Deposits and advance payments for goods and services 223,880 216,372 1,718 23,327 225,598 216,843 Current portion of bonds, notes and leases payable 63,624 61,983 946 811 64,570 62,794 Long-term bonds payable, subject to remarketing 588,360 596,435 - - 588,360 596,435 Liability under securities lending program 15,949 27,589 - - 15,949 27,589 Other current liabilities 93,357 91,977 - 1,980 93,357 93,957 Amounts due to (from) primary institution - current (21,598) (24,683) 21,598 24,683 - -
Total Current Liabilities 1,488,326 1,438,889 49,466 73,917 1,537,792 1,489,950
Noncurrent Liabilities:Bonds, notes and leases payable 2,640,142 2,714,842 15,738 14,735 2,655,880 2,729,577 Net pension liability 3,565,362 2,794,626 382 366 3,565,744 2,794,992 Compensated absences 164,594 159,874 - - 164,594 159,874 Self-insurance accruals 81,239 94,616 - - 81,239 94,616 Amounts due to third-party payors - Health System 38,032 42,745 - - 38,032 42,745 Obligations under annuity and life income agreements 30,473 29,276 - - 30,473 29,276 Refundable advances for Federal Perkins loans 31,714 32,110 - - 31,714 32,110 Other noncurrent liabilities 101,702 113,057 23,566 405 102,504 113,462 Amounts due to (from) primary institution - noncurrent (81,697) (69,970) 81,697 69,970 - -
Total Noncurrent Liabilities 6,571,561 5,911,176 121,383 85,476 6,670,180 5,996,652
Total Liabilities 8,059,887 7,350,065 170,849 159,393 8,207,972 7,486,602
Deferred Inflows:Parking service concession arrangement 435,807 445,439 - - 435,807 445,439 Pension 16,342 122,369 10 7 16,352 122,376 Other deferred inflows 19,139 19,342 - - 19,139 19,342
Total Deferred Inflows 471,288 587,150 10 7 471,298 587,157
Net Position:Net investment in capital assets 2,259,207 2,282,647 105,430 100,068 2,364,637 2,382,715 Restricted: - -
Nonexpendable 1,480,440 1,370,064 - - 1,480,440 1,370,064 Expendable 1,195,515 908,953 - - 1,195,515 908,953
Unrestricted 589,384 392,349 49,301 36,311 638,685 428,660
Total Net Position 5,524,546 4,954,013 154,731 136,379 5,679,277 5,090,392
Total Liabilities, Deferred Inflows and Net Position 14,055,721$ 12,891,228$ 325,590$ 295,779$ 14,358,547$ 13,164,151$
The accompanying notes are an integral part of these financial statements.
Primary Discretely Presented TotalInstitution Component Units University
21 The Ohio State University
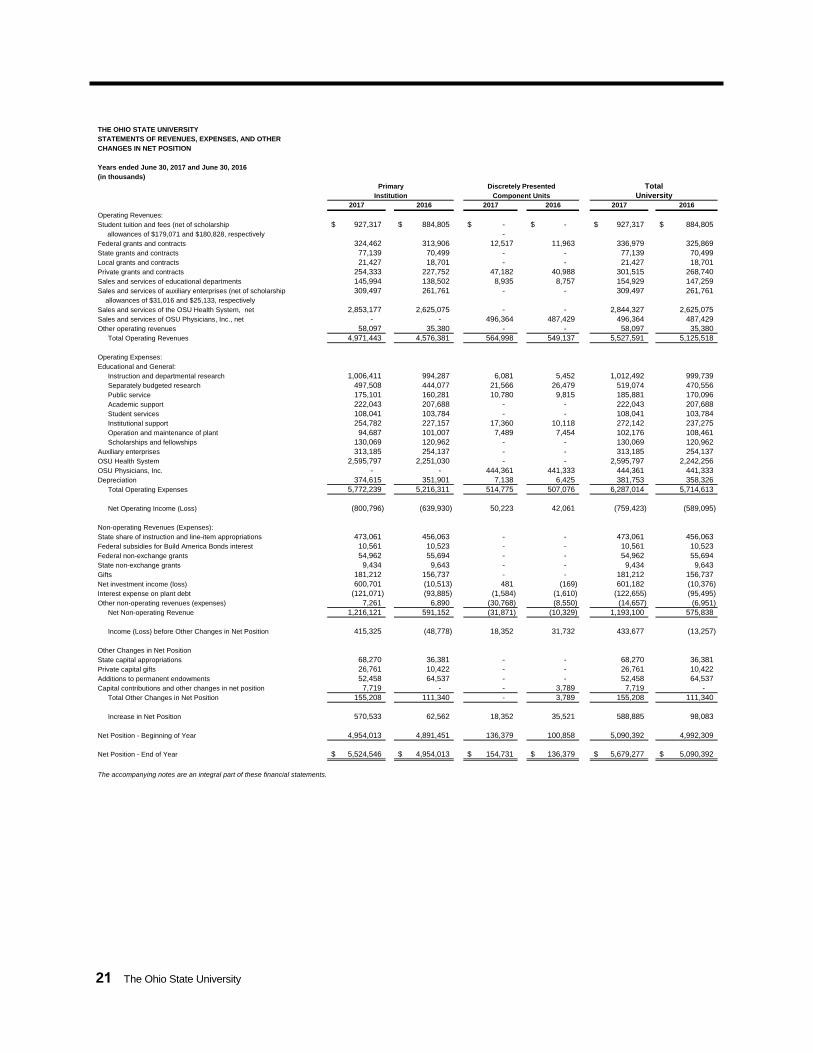
THE OHIO STATE UNIVERSITYSTATEMENTS OF REVENUES, EXPENSES, AND OTHERCHANGES IN NET POSITION
Years ended June 30, 2017 and June 30, 2016(in thousands)
2017 2016 2017 2016 2017 2016
Operating Revenues:Student tuition and fees (net of scholarship 927,317$ 884,805$ -$ -$ 927,317$ 884,805$ allowances of $179,071 and $180,828, respectively - Federal grants and contracts 324,462 313,906 12,517 11,963 336,979 325,869 State grants and contracts 77,139 70,499 - - 77,139 70,499 Local grants and contracts 21,427 18,701 - - 21,427 18,701 Private grants and contracts 254,333 227,752 47,182 40,988 301,515 268,740 Sales and services of educational departments 145,994 138,502 8,935 8,757 154,929 147,259 Sales and services of auxiliary enterprises (net of scholarship 309,497 261,761 - - 309,497 261,761 allowances of $31,016 and $25,133, respectivelySales and services of the OSU Health System, net 2,853,177 2,625,075 - - 2,844,327 2,625,075 Sales and services of OSU Physicians, Inc., net - - 496,364 487,429 496,364 487,429 Other operating revenues 58,097 35,380 - - 58,097 35,380
Total Operating Revenues 4,971,443 4,576,381 564,998 549,137 5,527,591 5,125,518
Operating Expenses:Educational and General:
Instruction and departmental research 1,006,411 994,287 6,081 5,452 1,012,492 999,739 Separately budgeted research 497,508 444,077 21,566 26,479 519,074 470,556 Public service 175,101 160,281 10,780 9,815 185,881 170,096 Academic support 222,043 207,688 - - 222,043 207,688 Student services 108,041 103,784 - - 108,041 103,784 Institutional support 254,782 227,157 17,360 10,118 272,142 237,275 Operation and maintenance of plant 94,687 101,007 7,489 7,454 102,176 108,461 Scholarships and fellowships 130,069 120,962 - - 130,069 120,962
Auxiliary enterprises 313,185 254,137 - - 313,185 254,137 OSU Health System 2,595,797 2,251,030 - - 2,595,797 2,242,256 OSU Physicians, Inc. - - 444,361 441,333 444,361 441,333 Depreciation 374,615 351,901 7,138 6,425 381,753 358,326
Total Operating Expenses 5,772,239 5,216,311 514,775 507,076 6,287,014 5,714,613
Net Operating Income (Loss) (800,796) (639,930) 50,223 42,061 (759,423) (589,095)
Non-operating Revenues (Expenses):State share of instruction and line-item appropriations 473,061 456,063 - - 473,061 456,063 Federal subsidies for Build America Bonds interest 10,561 10,523 - - 10,561 10,523 Federal non-exchange grants 54,962 55,694 - - 54,962 55,694 State non-exchange grants 9,434 9,643 - - 9,434 9,643 Gifts 181,212 156,737 - - 181,212 156,737 Net investment income (loss) 600,701 (10,513) 481 (169) 601,182 (10,376) Interest expense on plant debt (121,071) (93,885) (1,584) (1,610) (122,655) (95,495) Other non-operating revenues (expenses) 7,261 6,890 (30,768) (8,550) (14,657) (6,951)
Net Non-operating Revenue 1,216,121 591,152 (31,871) (10,329) 1,193,100 575,838
Income (Loss) before Other Changes in Net Position 415,325 (48,778) 18,352 31,732 433,677 (13,257)
Other Changes in Net PositionState capital appropriations 68,270 36,381 - - 68,270 36,381 Private capital gifts 26,761 10,422 - - 26,761 10,422 Additions to permanent endowments 52,458 64,537 - - 52,458 64,537 Capital contributions and other changes in net position 7,719 - - 3,789 7,719 -
Total Other Changes in Net Position 155,208 111,340 - 3,789 155,208 111,340
Increase in Net Position 570,533 62,562 18,352 35,521 588,885 98,083
Net Position - Beginning of Year 4,954,013 4,891,451 136,379 100,858 5,090,392 4,992,309
Net Position - End of Year 5,524,546$ 4,954,013$ 154,731$ 136,379$ 5,679,277$ 5,090,392$
The accompanying notes are an integral part of these financial statements.
Primary Discretely Presented TotalInstitution Component Units University

2017 Financial Report 22
THE OHIO STATE UNIVERSITYSTATEMENTS OF CASH FLOWS Years Ended June 30, 2017 and June 30, 2016(in thousands)
Primary Discretely Presented TotalInstitution Component Units University
2017 2016 2017 2016 2017 2016
Cash Flows from Operating Activities:Tuition and fee receipts $ 808,684 $ 795,196 $ - $ - $ 808,684 $ 795,196Grant and contract receipts 688,946 632,073 61,254 73,351 750,200 705,424Receipts for sales and services 3,250,797 2,975,167 517,885 487,945 3,759,832 3,463,112Payments to or on behalf of employees (2,237,758) (2,214,578) (324,012) (306,613) (2,561,770) (2,521,191) University employee benefit payments (595,410) (619,964) (78,703) (76,190) (674,113) (696,154)Payments to vendors for supplies and services (1,941,533) (1,674,593) (108,548) (119,918) (2,050,081) (1,785,737)Payments to students and fellows (121,109) (112,465) - - (121,109) (112,465)Student loans issued (9,305) (7,074) - - (9,305) (7,074)Student loans collected 10,166 10,406 - - 10,166 10,406Student loan interest and fees collected 1,369 2,407 - - 1,369 2,407Other receipts 44,564 38,537 - - 44,564 38,537
Net cash provided (used) by operating activities (100,589) (174,888) 67,876 58,575 (41,563) (107,539)
Cash Flows from Noncapital Financing Activities:State share of instruction and line-item appropriations 473,061 456,063 - - 473,061 456,063Non-exchange grant receipts 64,396 65,337 - - 64,396 65,337Gift receipts for current use 188,579 158,991 - - 188,579 158,991Additions to permanent endowments 52,458 64,537 - - 52,458 64,537Drawdowns of federal direct loan proceeds 322,405 321,661 - - 322,405 321,661Disbursements of federal direct loans to students (323,813) (321,146) - - (323,813) (321,146)Repayment of loans from related organization 667 2,193 - - 667 2,193 Amounts received for annuity and life income funds 2,567 5,913 - - 2,567 5,913 Amounts paid to annuitants and life beneficiaries (1,700) (1,632) - - (1,700) (1,632) Agency funds receipts 4,893 4,626 - - 4,893 4,626
Agency funds disbursements (4,645) (4,412) - - (4,645) (4,412) Other receipts (payments) 9,118 795 (17,169) 2,995 799 (4,984)
Net cash provided (used) by noncapital financing activities 787,986 752,926 (17,169) 2,995 779,667 747,147
Cash Flows from Capital Financing Activities:Proceeds from capital debt 6,430 618,242 150 - 6,580 618,242 State capital appropriations 67,662 36,783 - - 67,662 36,783Gift receipts for capital projects 15,320 9,728 - - 15,320 9,728Payments for purchase or construction of capital assets (414,606) (428,966) (21,254) (44,479) (435,860) (473,445)Proceeds from sale of capital assets - - 9,172 - 9,172 - Principal payments on capital debt and leases (79,528) (94,308) (1,058) (823) (80,586) (95,131) Interest payments on capital debt and leases (124,267) (106,654) (458) (1,610) (124,725) (108,264) Federal subsidies for Build America Bonds interest 10,881 10,461 - - 10,881 10,461
Net cash provided (used) by capital financing activities (518,108) 45,286 (13,448) (46,912) (531,556) (1,626)
Cash Flows from Investing Activities:Net (purchases) sales of temporary investments (137,323) (294,511) (2,166) (159) (139,489) (294,670)Proceeds from sales and maturities of long-term investments 1,866,011 1,578,221 3,215 - 1,869,226 1,578,221Investment income 123,274 95,927 416 (169) 123,690 95,758Purchases of long-term investments (2,036,073) (1,681,169) - (4,030) (2,036,073) (1,685,199)
Net cash provided (used) by investing activities (184,111) (301,532) 1,465 (4,358) (182,646) (305,890)
Net Increase (Decrease) in Cash (14,822) 321,792 38,724 10,300 23,902 332,092
1,265,782 943,990 87,001 76,701 1,352,783 1,020,691 Cash and Cash Equivalents - Beginning of Year
Cash and Cash Equivalents - End of Year $ 1,250,960 $ 1,265,782 $ 125,725 $ 87,001 $ 1,376,685 $ 1,352,783

23 The Ohio State University
THE OHIO STATE UNIVERSITYSTATEMENTS OF CASH FLOWS, Cont'dYears Ended June 30, 2017 and June 30, 2016(in thousands)
Primary Discretely Presented TotalInstitution Component Units University
2017 2016 2017 2016 2017 2016
Reconciliation of Net Operating Loss (Income) to Net Cash Used by Operating Activities: Operating loss (income) $ (800,796) $ (639,930) $ 50,223 $ 42,061 $ (759,423) $ (589,095)Adjustments to reconcile net operating loss (income) to net cash provided (used) by operating activities: Depreciation expense 374,615 351,901 7,138 6,425 381,753 358,326 Impairment and demolition expense - - 1,675 - 1,675 - Changes in assets and liabilities: Accounts receivable, net (52,801) (28,621) 5,044 (3,473) (47,757) (32,094) Notes receivable, net 861 2,783 473 (1,806) 1,334 977 Accrued interest receivable (344) (77) - - (344) (77) Inventories and prepaid expenses 12,165 (28,454) 156 1,852 12,321 (26,602) Amounts due to/from primary institution (15,128) 14,119 2,450 (14,119) (12,678) - Deferred outflows (315,850) (456,724) (31) (84) (315,881) (456,808) Accounts payable and accrued liabilities 57,049 49,653 1,154 3,603 58,203 53,256 Self-insurance accruals (13,377) (13,258) - - (13,377) (13,258) Amounts due to third-party payors - Health System (4,713) (1,423) - - (4,713) (1,423) Deposits and advanced payments 2,932 (26,218) (21,606) 22,385 (18,674) (3,833) Compensated absences 4,720 7,990 - - 4,720 7,990 Refundable advances for Federal Perkins loans (396) (118) - - (396) (118) Net pension obligation 770,736 664,194 16 70 770,752 664,264 Deferred inflows (115,659) (105,897) 2 2 (115,657) (105,895) Other liabilities (4,603) 35,192 21,182 1,659 16,579 36,851
Net cash provided (used) by operating activities $ (100,589) $ (174,888) $ 67,876 $ 58,575 $ (41,563) $ (107,539)
Non Cash Transactions:Construction in Process in Accounts Payable $ 17,442 $ 30,355 $ 3,885 $ - $ 21,327 $ 30,355Stock Gifts 21,723 20,746 - - 21,723 20,746Net Increase (Decrease) in Fair Value of Investments 477,006 (105,312) - - 477,006 (105,312)
The accompanying notes are an integral part of these financial statements.

Notes to Financial Statements – Years Ended June 30, 2017 and 2016 (dollars in thousands)
2017 Financial Report 24
NOTE 1 — SUMMARY OF SIGNIFICANT ACCOUNTING AND REPORTING POLICIES
Organization
The Ohio State University (the “university”) is a land grant institution created in 1870 by the Ohio General Assembly under provisions of the Morrill Act. The university is one of several state-supported universities in Ohio. It is declared by statute to be a body politic and corporate and an instrumentality of the State.
The university is governed by a Board of Trustees which is granted authority under Ohio law to do all things necessary for the proper maintenance and continual successful operation of the university. Trustees are appointed by the governor, with the advice and consent of the state Senate. In 2005, the Ohio General Assembly voted to expand the Board from 11 to 17 members. The standard term for voting members of the Board is nine years. However, as part of the transition to a larger board membership, the additional trustees appointed in 2005 and 2006 will serve terms ranging from four to eight years. The Board also includes two non-voting student trustees who are appointed to two-year terms.
In 2009, the Board appointed its first charter trustee, which expanded the Board to 18 members. A maximum of three charter trustees may be appointed and removed by a vote of the Board. Charter trustees, who must be non-Ohio residents, are appointed to three-year terms and do not have voting privileges.
The Board of Trustees has responsibility for all the university’s financial affairs and assets. The university operates largely on a decentralized basis by delegating this authority to its academic and support departments. The Board must approve the annual budgets for unrestricted academic and support functions, departmental earnings operations and restricted funds operations, but these budgets are managed at the department level.
Basis of Presentation
The accompanying financial statements present the accounts of the following entities, which constitute the primary government for financial reporting purposes:
• The Ohio State University and its hospitals and clinics• Ohio Agricultural Research and Development Center• The Ohio Technology Consortium (OH-TECH)
In addition, these financial statements include component units -- legally separate organizations for which the university is financially accountable. Governmental Accounting Standards Board (GASB) Statement No. 14, The Financial Reporting Entity, as amended by Statement No. 61, The Financial Reporting Entity: Omnibus and Statement No. 80, Blending Requirements for Certain Component Units – an amendment of GASB Statement No. 14., defines financial accountability. The criteria for determining financial accountability include the following circumstances:

Notes to Financial Statements – Years Ended June 30, 2017 and 2016 (dollars in thousands)
• Appointment of a voting majority of an organization’s governing authority and theability of the primary government (i.e. the university) to either impose its will onthat organization or the potential for the organization to provide specific financialbenefits to, or impose specific financial burdens on, the primary government, or;
• An organization is fiscally dependent on the primary government and providesspecific financial benefits to, or imposes specific financial burdens on, the primarygovernment.
The university’s component units and the reasons for their inclusion in the university’s financial statements are described below:
• The Ohio State University Foundation – The fiscal dependency criteria applyto this not-for-profit fundraising organization, which operates exclusively for thebenefit of The Ohio State University.
• OSU Health Plan, Inc. – The university appoints a voting majority of the boardfor this organization, which provides medical benefit plan administration servicesto the university and its faculty and staff.
• Oval Limited – The university holds all of the voting stock of this captiveinsurance entity, which was established by the university to provide medicalmalpractice coverage to physicians in the university’s medical center.
The component units listed above provide services entirely, or almost entirely, to the university or otherwise exclusively, or almost exclusively, benefit the university. Therefore, the transactions and balances for these organizations have been blended with those of the university.
In addition to the blended component units described above, the university’s financial statements include the following discretely presented component units:
• The Ohio State University Physicians, Inc. – The university appoints a votingmajority of the board of the medical practice group for physician faculty membersin the Colleges of Medicine and Public Health.
• Campus Partners for Community Urban Redevelopment, Inc. – This non-profit organization, which participates in the redevelopment of neighborhoodsadjacent to the Columbus campus, is fiscally dependent on the university.
• Transportation Research Center of Ohio, Inc. – The university appoints avoting majority of the board for this automotive research and testing facility in EastLiberty, Ohio.
• Dental Faculty Practice Association, Inc. – The university appoints a votingmajority of the board for the dental practice group for faculty in the College ofDentistry.
Summary financial statement information for the university’s blended and discretely presented component units is provided in Notes 19 and 20. Audited financial statements for the discretely presented component units considered to be material to the university may be obtained from the Office of the Controller. A total university column in the financial statements is provided as
25 The Ohio State University

Notes to Financial Statements – Years Ended June 30, 2017 and 2016 (dollars in thousands)
2017 Financial Report 26
memorandum only for purposes of additional analysis by users. The total university column reflects eliminations of transactions between the primary institution and the discretely component units. These transactions consist primarily of (a) discretionary subsidies and contributions which are presented as either non-operating activities or capital additions at the component unit level and (b) exchanged-based goods and services that support the operations of the entity, which are presented as operating revenues and expenses at the component unit level. The impact of these transactions on the statement of revenues, expenses and other changes in net position was $8,850 and $3,709 for the years ended June 30, 2017 and 2016, respectively.
The university, as a component unit of the State of Ohio, is included as a discrete entity in the State of Ohio’s Comprehensive Annual Financial Report.
Basis of Accounting
The financial statements of the university have been prepared in accordance with accounting principles generally accepted in the United States of America, as prescribed by the GASB. The university is reporting as a special purpose government engaged in business type activities (BTA) on the accrual basis. Business type activities are those that are financed in whole or in part by fees charged to external parties for goods and services. In accordance with BTA reporting, the university presents Management’s Discussion and Analysis; Statements of Net Position; Statements of Revenues, Expenses and Other Changes in Net Position; Statements of Cash Flows; and Notes to the Financial Statements. In the Financial Statements, separate columns are presented for the primary institution (which includes the primary government and the blended component units), discretely presented component units and the total university. The Notes to the Financial Statements include separate disclosures for the primary institution and the discretely presented component units, where relevant and material. Unless otherwise specified, the amounts presented in MD&A are those of the primary institution.
The university’s financial resources are classified for accounting and reporting purposes into the following four net position categories:
• Net investment in capital assets: Capital assets, net of accumulateddepreciation, cash restricted for capital projects and outstanding principalbalances of debt attributable to the acquisition, construction or improvement ofthose assets.
• Restricted - nonexpendable: Amounts subject to externally-imposedstipulations that they be maintained in perpetuity and invested for the purpose ofgenerating present and future income, which may either be expended or addedto the principal by the university. These assets primarily consist of the university’spermanent endowments.
Notes to Financial Statements – Years Ended June 30, 2017 and 2016 (dollars in thousands)
• Restricted - expendable: Amounts whose use is subject to externally-imposedstipulations that can be fulfilled by actions of the university pursuant to thosestipulations or that expire by the passage of time.
• Unrestricted: Amounts which are not subject to externally-imposed stipulations.Substantially all unrestricted balances are internally designated for use byuniversity departments to support working capital needs, to fund relatedacademic or research programs, and to provide for unanticipated shortfalls inrevenues and deviations in enrollment.
Under the university’s decentralized management structure, it is the responsibility of individual departments to determine whether to first apply restricted or unrestricted resources when an expense is incurred for purposes for which both restricted and unrestricted funds are available.
For internal financial management purposes, the university classifies financial resources into funds that reflect the specific activities, objectives or restrictions of the resources.
Cash and Investments
Cash and cash equivalents consist primarily of petty cash, demand deposit accounts, money market accounts, savings accounts and investments with original maturities of ninety days or less at the time of purchase. Such investments consist primarily of U.S. Government obligations, U.S. Agency obligations, repurchase agreements and money market funds. Restricted cash consists of bond proceeds restricted for capital expenditures. For purposes of the Statement of Cash Flows, “cash” is defined as the total of these two line items.
Investments are carried at fair value in accordance with GASB Statement No. 31, Accounting and Financial Reporting for Certain Investments and for External Investment Pools, as amended by GASB Statement No. 72, Fair Value Measurement and Application. The average cost method is used for purposes of determining gains and losses on the sale of investments. The specific identification method is used for purposes of determining gains and losses on the sale of gifted securities.
The university holds investments in limited partnerships, private equity and other investments, which are carried at estimated fair value provided by the management of these limited partnerships. The purpose of this alternative investment class is to increase portfolio diversification and reduce risk due to the low correlation with other asset classes. Investments in these limited partnerships are fair valued based on the university’s proportional share of the net asset value of the total fund. Because these investments are not readily marketable, the estimated value is subject to uncertainty and, therefore, may differ from the value that would have been used had a ready market for the investments existed, and such differences could be material. As of June 30, 2017, the university has made commitments to limited partnerships totaling $1,161,359 that have not yet been funded. These commitments may extend for a maximum of ten years.
Investment income is recognized on an accrual basis. Interest and dividend income is recorded when earned.
27 The Ohio State University

Notes to Financial Statements – Years Ended June 30, 2017 and 2016 (dollars in thousands)
2017 Financial Report 28
Endowment Policy
All endowments are invested in the university’s Long Term Investment Pool, which consists of more than 5,464 Board authorized funds and 260 pending funds. Each named fund is assigned a number of shares in the Long Term Investment Pool based on the value of the gifts, income-to-principal transfers, or transfers of operating funds to that named fund. For donor restricted endowments, the Uniform Prudent Management of Institutional Funds Act (UPMIFA), as adopted in Ohio, permits the university’s Board of Trustees to appropriate an amount of realized and unrealized endowment appreciation as the Board deems prudent. The UPMIFA, as adopted in Ohio, establishes a 5% safe harbor of prudence for funds appropriated for expenditure. Net realized and unrealized appreciation, after the spending rule distributions, is retained in the Long Term Investment Pool, and the associated net position is classified as restricted-expendable, unless otherwise restricted by the donor.
Annual distributions to named funds in the Long Term Investment Pool are computed using the share method of accounting for pooled investments. The annual distribution per share is 4.25% of the average fair value per share of the Long Term Investment Pool over the most recent seven year period. In 2016, the Board of Trustees approved an increase in the distribution rate to 4.5%, effective fiscal year 2017.
At June 30, 2017, the fair value of the university’s gifted endowments is $1,939,582, which is $327,343 above the historical dollar value of $1,612,239. Although the fair value of the gifted endowments in total exceeds the historical cost at June 30, 2017, there are 1,347 named funds that remain underwater. The fair value of these underwater funds at June 30, 2017 is $492,695, which is $47,823 below the historical dollar value of $540,518.
At June 30, 2016, the fair value of the university’s gifted endowments is $1,740,505, which is $183,572 above the historical dollar value of $1,556,933. Although the fair value of the gifted endowments in total exceeds the historical cost at June 30, 2016, there are 2,729 named funds that remain underwater. The fair value of these underwater funds at June 30, 2016 is $822,501, which is $99,527 below the historical dollar value of $922,028.
The depreciation on non-expendable endowment funds is recorded as a reduction to restricted non-expendable net position. Recovery on these funds is recorded as an increase in restricted non-expendable up to the historical value of each fund. Per UPMIFA (§ 1715.53(D)(C), the reporting of such deficiencies does not create an obligation on the part of the endowment fund to restore the fair value of those funds.
Gift Pledges Receivable
The university receives pledges and bequests of financial support from corporations, foundations and individuals. Revenue is recognized when a pledge representing an unconditional promise to pay is received and all eligibility requirements have been met. In the absence of such promise, revenue is recognized when the gift is received. In accordance with GASB Statement No. 33, Accounting and Financial Reporting for Non-exchange Transactions, endowment pledges are not recorded as assets until the related gift is received. An allowance

Notes to Financial Statements – Years Ended June 30, 2017 and 2016 (dollars in thousands)
29 The Ohio State University
for uncollectible pledges receivable is provided based on management’s judgment of potential uncollectible amounts and includes such factors as prior collection history, type of gift and nature of fundraising.
Inventories
The university’s inventories, which consist principally of publications, general stores and other goods for resale by earnings operations, are valued at the lower of moving average cost or market. The inventories of the Health System, which consist principally of pharmaceuticals and operating supplies, are valued at cost on a first-in, first-out basis.
Capital Assets and Collections
Capital assets are long-life assets in the service of the university and include land, buildings, improvements, equipment, software and library books. Capital assets are stated at cost or acquisition value at date of gift. Depreciation of capital assets (excluding land and construction in progress) is provided on a straight-line basis over the following estimated useful lives:
Type of Asset Estimated Useful Life
Improvements other than buildings 20 years Buildings 10 to 100 years Moveable equipment, software and furniture 5 to 15 years Library books 10 years
The university does not capitalize works of art or historical treasures that are held for exhibition, education, research and public service. These collections are neither disposed of for financial gain nor encumbered in any way. Accordingly, such collections are not recognized or capitalized for financial statement purposes.
Advance Payments for Goods and Services
Advance payments for goods and services primarily consist of receipts relating to tuition, room, board, grants, contracts and athletic events received in advance of the services to be provided. Tuition and fees relating to the summer academic term are recorded as revenue in the year to which they pertain. The university will recognize revenue to the extent these services are provided over the coming fiscal year.

Notes to Financial Statements – Years Ended June 30, 2017 and 2016 (dollars in thousands)
2017 Financial Report 30
Derivative Instruments
The university accounts for all derivative instruments on the statement of net position at fair value. Changes in the fair value (i.e., gains or losses) of the university’s interest rate swap investments and futures investments are recorded each period in the statement of revenues, expenses and other changes in net position as a component of other non-operating expense.
Operating and Non-Operating Revenues and Expenses
The university defines operating activities, for purposes of reporting on the Statement of Revenues, Expenses, and Other Changes in Net Position, as those activities that generally result from exchange transactions, such as payments received for providing services and payments made for goods or services received. With the exception of interest expense on long-term indebtedness, substantially all university expenses are considered to be operating expenses. Certain significant revenue streams relied upon for operations are recorded as non-operating revenues, as defined by GASB Statement No. 35, including state appropriations, current-use gifts and net investment income.
Tuition, Room and Board
Student tuition and residence hall fees are presented net of scholarships and fellowships applied to student accounts. Stipends and other payments made directly to students are presented as scholarship and fellowship expense. Fee authorizations provided to graduate teaching, research and administrative associates as part of an employment arrangement are presented in instruction, research and other functional categories of operating expense.
State Support
The university is a state-assisted institution of higher education which receives a student enrollment-based instructional subsidy from the State of Ohio. This subsidy, which is based upon a formula devised by the Ohio Board of Regents, is determined annually and is adjusted to state resources available.
The state also provides line-item appropriations which partially support the current operations of various activities, which include clinical teaching expenditures incurred at The Ohio State University Health System and other health sciences teaching facilities, The Ohio State University Extension, the Ohio Agricultural Research and Development Center, and the Center for Labor Research.
In addition to current operating support, the State of Ohio provides the funding for and constructs major plant facilities on the university’s campuses, and this funding is recorded as state capital appropriations. The funding is obtained from the issuance of revenue bonds by the Ohio Public Facilities Commission (OPFC) which, in turn, initiates the construction and subsequent lease of the facility by the Ohio Board of Regents.
Such facilities are reflected as buildings or construction in progress in the accompanying statement of net position. Neither the obligations for the revenue bonds issued by OPFC nor

Notes to Financial Statements – Years Ended June 30, 2017 and 2016 (dollars in thousands)
the annual debt service charges for principal and interest on the bonds are reflected in the university’s financial statements. Debt service is funded through appropriations to the Ohio Board of Regents by the General Assembly.
These facilities are not pledged as collateral for the revenue bonds. Instead, the bonds are supported by a pledge of monies in the Higher Education Bond Service Fund and future payments to be received by such fund, which is established in the custody of the Treasurer of State.
Government Grants and Contracts
Government grants and contracts normally provide for the recovery of direct and indirect costs and are subject to audit by the appropriate government agency. Federal funds are subject to an annual OMB Uniform Guidance audit. Recovery of related indirect costs is generally recorded at fixed rates negotiated for a period of one to three years.
The university generally considers grants, contracts and non-capital appropriations to be exchange transactions. Under these arrangements, the university provides a bargained-for benefit, typically in the form of instruction, research or public service programs, either directly to the funding entity or to its constituents. The overall scope and nature of these program activities is determined by the level of funding and the requirements set forth by these resource providers.
OSU Health System Revenue
Net patient service revenue represents amounts received and the estimated realizable amounts due from patients and third-party payors for services rendered net of contractual allowances, charity care and bad debt expenses. Revenue received under third-party cost reimbursement agreements (primarily the federal Medicare and Medicaid programs) are subject to examination and retroactive adjustments by the agencies administering the programs. In the normal course of business, the Health System contests certain issues resulting from examination of prior years' reimbursement reports. The accompanying financial statements include provisions for estimated retroactive adjustments arising from such examinations and contested issues. The Health System recognizes settlements of protested adjustments or appeals upon resolution of the matters.
OSU Physicians Revenue
Net patient service revenue represents amounts received and the estimated realizable amounts due from patients and third-party payors for services rendered net of contractual allowances, charity care, self-pay discounts and bad debt expenses. OSU Physicians (OSUP), a discretely presented component unit of the university, provides care to patients under various reimbursable agreements, including governmental and commercial payors (third party payors). These arrangements provide for payment for covered services at agreed-upon rates and under certain fee schedules and various discounts from charges. Provisions have been made in the financial statements for estimated contractual adjustments, representing the difference
31 The Ohio State University
Notes to Financial Statements – Years Ended June 30, 2017 and 2016 (dollars in thousands)
2017 Financial Report 32
between the customary charges for services rendered and related reimbursements, and for administrative adjustments.
Charity Care and Community Benefit
Care is provided to patients regardless of their ability to pay. A patient is classified as charity care in accordance with policies established by the OSU Health System and OSUP. Because collection of amounts determined to qualify as charity care are not pursued, such amounts are written off and not reported as gross patient service revenue. OSU Health System and OSUP maintain records to identify and monitor the level of charity care provided, including the amount of charges foregone for services rendered. Net charity care costs for the OSU Health System for the years ended June 30, 2017 and 2016 are $42,710 and $36,020, respectively, after applying an additional expense of $12,416 and $12,380, respectively, for support received under the Health Care Assurance Program (HCAP). HCAP is administered by the State of Ohio to help hospitals cover a portion of the cost of providing charity care. Charity care costs for OSUP for the years ended June 30, 2017 and 2016 are $9,362 and $6,022, respectively.
Management Estimates
The preparation of financial statements in conformity with accounting principles, generally accepted in the United States of America, requires management to make estimates and assumptions that affect the reported amounts of assets, liabilities, revenues and expenditures during the reporting period. Disclosure of contingent assets and liabilities at the date of the financial statements may also be affected. Actual results could differ from those estimates.
Implementation of GASB Statement No. 72
In fiscal year 2016, the university implemented GASB Statement No. 72, Fair Value Measurement and Application. GASB Statement No. 72 expands the guidance on valuation of university investments and requires new disclosures of fair value measurements grouped by level and allows Net Asset Value (NAV) to be used for valuation of certain investments. In addition, the new standard requires additional disclosures related to investments valued at NAV, including information on unfunded commitments and a general description of redemption terms and related restrictions. These disclosures are provided in Note 3.
Newly Issued Accounting Pronouncements
In June 2015, the GASB issued Statement No. 75, Accounting and Financial Reporting for Postemployment Benefits Other Than Pensions. This standard, which is the companion to Statement 74, establishes new reporting requirements for employers participating in OPEB plans. Similar to Statement 68, it will require employers in cost-sharing, multi-employer plans to record a liability (and related deferrals) for the employer’s pro-rata share of net OPEB liabilities. It also expands disclosure and supplementary reporting requirements for employers participating in OPEB plans. The standard is effective for periods beginning after June 15, 2017 (FY2018).

Notes to Financial Statements – Years Ended June 30, 2017 and 2016 (dollars in thousands)
In March 2016, the GASB issued Statement No. 81, Irrevocable Split-Interest Agreements. This standard requires that a government that receives resources pursuant to an irrevocable split-interest agreement recognize assets, liabilities, and deferred inflows of resources at the inception of the agreement. It also requires that a government recognize assets representing its beneficial interests in irrevocable split-interest agreements that are administered by a third party, if the government controls the present service capacity of the beneficial interests. In general, revenue recognition related to these agreements will be delayed until a specified event occurs (such as the death of the lead beneficiary). This standard is effective for periods beginning after December 15, 2016 (FY2018).
In November 2016, the GASB issued Statement No. 83, Certain Asset Retirement Obligations. This standard establishes criteria for determining the timing and pattern of recognition of a liability and a corresponding deferred outflow of resources for asset retirement obligations. The deferred outflow is recognized as expense over the life of the related asset. The determination of when the liability is incurred is based on the existence of external laws, regulations, contracts, or court judgments, together with the occurrence of an internal event that obligates a government to perform asset retirement activities. Internal obligating events include the occurrence of contamination, placing into use a tangible capital asset that is required to be retired, abandoning a tangible capital asset before use begins, or acquiring a tangible capital asset that has an existing asset retirement obligation. This standard is effective for periods beginning after June 15, 2018 (FY2019).
In January 2017, the GASB issued Statement No. 84, Fiduciary Activities. This standard establishes criteria for identifying and reporting fiduciary activities of all state and local governments. The focus of the criteria generally is whether a government is controlling the assets of the fiduciary activity and the beneficiaries with whom a fiduciary relationship exists. Governments with activities meeting the criteria are required to present these activities in a statement of fiduciary net position and a statement of changes in fiduciary net position. An exception to this requirement is provided for a business-type activity that expects to hold assets in a custodial fund for three months or less. This standard is effective for periods beginning after December 15, 2018 (FY2020).
In March 2017, the GASB issued Statement No. 85, Omnibus 2017. This standard addresses a variety of practice issues identified during implementation and application of certain GASB statements. It provides guidance on blending of component units (confirming limited applicability of blended presentation for BTAs), accounting for goodwill acquired prior to the issuance of GASB 69, accounting for real estate held for investment by insurance entities, clarification of circumstances in which money-market investments may be valued at amortized cost, and various technical corrections related to the implementation of the new OPEB standards. This standard is effective for periods beginning after June 15, 2017 (FY2018).
In May 2017, the GASB issued Statement No. 86, Certain Debt Extinguishment Issues. This standard provides guidance on in-substance defeasance of debt, in which a government uses its existing resources (not the proceeds of refunding debt) to establish an irrevocable trust for the sole purpose of extinguishing debt. The accounting, reporting and disclosures for defeasance transactions, including reporting of gains and losses, generally will be consistent,
33 The Ohio State University

Notes to Financial Statements – Years Ended June 30, 2017 and 2016 (dollars in thousands)
2017 Financial Report 34
regardless of the source of the funds used to defease the debt. This standard is effective for periods beginning after June 15, 2017 (FY2018).
In June 2017, the GASB issued Statement No. 87, Leases. This standard establishes accounting and reporting for leases, based on the foundational principle that all leases are financings of the right to use an underlying asset for a period of time. Lessees will record an intangible right-of-use asset and corresponding lease liability. Lessors will record a lease receivable and a corresponding deferred inflow of resources. The standard provides an exception for short-term leases with a maximum possible term of 12 months or less. This standard is effective for periods beginning after December 15, 2019 (FY2021).
University management is currently assessing the impact that implementation of GASB Statements No. 75, 81, 83, 84, 85, 86 and 87 will have on the university’s financial statements.
Other
The university is exempt from income taxes as an instrumentality of the State of Ohio underInternal Revenue Code §115 and Internal Revenue Service regulations. Any unrelatedbusiness income is taxable.
NOTE 2 — CASH AND CASH EQUIVALENTS
At June 30, 2017, the carrying amount of the primary institution’s cash, cash equivalents and restricted cash is $1,250,960 as compared to bank balances of $1,265,022. The differencesin carrying amount and bank balances are caused by outstanding checks and deposits in transit. Of the bank balances, $53,569 is covered by federal deposit insurance and $1,211,453is uninsured but collateralized by pools of securities pledged by the depository banks and heldin the name of the respective banks.
At June 30, 2016, the carrying amount of the primary institution’s cash, cash equivalents and restricted cash is $1,265,782 as compared to bank balances of $1,324,013. The differencesin carrying amount and bank balances are caused by outstanding checks and deposits in transit. Of the bank balances, $53,280 is covered by federal deposit insurance and $1,270,733is uninsured but collateralized by pools of securities pledged by the depository banks and heldin the name of the respective banks.
At June 30, 2017, the carrying amount of the discretely presented component units’ cash, cash equivalents and restricted cash is $125,725 as compared to bank balances of $122,850. The differences in carrying amount and bank balances are caused by outstanding checks and deposits in transit. Of the bank balances, $5,121 is covered by federal deposit insurance and $117,729 is uninsured but collateralized by pools of securities pledged by the depository banks and held in the name of the respective banks.
At June 30, 2016, the carrying amount of the discretely presented component units’ cash, cash equivalents and restricted cash is $87,001 as compared to bank balances of $79,794. The differences in carrying amount and bank balances are caused by outstanding checks and
Notes to Financial Statements – Years Ended June 30, 2017 and 2016 (dollars in thousands)
35 The Ohio State University
deposits in transit. Of the bank balances, $4,911 is covered by federal deposit insurance and $74,883 is uninsured but collateralized by pools of securities pledged by the depository banks and held in the name of the respective banks.
NOTE 3 — INVESTMENTS
University investments are grouped into three major categories for financial reporting purposes: Temporary Investments, the Long-Term Investment Pool and Other Long-Term Investments.
Temporary Investments are amounts available for current operations. The target is to maximize value while protecting the liquidity of the assets. Temporary Investments include the following instruments with varying maturities: obligations of the U. S. Treasury and other federal agencies and instrumentalities, municipal and state bonds, corporate bonds, certificates of deposit, commercial paper, repurchase agreements, money market funds and mutual funds.
The Long-Term Investment Pool is a unitized investment pool consisting of gifted endowment funds of the university, gifted endowment funds of the OSU Foundation, and quasi-endowment funds which are internally designated funds that are to function as endowments. The Long-Term Investment Pool operates with a long-term investment goal of preserving and maintaining the real purchasing power of the principal while allowing for the generation of a predictable stream of annual distribution. The university’s Board of Trustees approved the following thematic asset classes, allocation ranges and benchmarks for the Long-Term Investment Pool:

Notes to Financial Statements – Years Ended June 30, 2017 and 2016 (dollars in thousands)
2017 Financial Report 36
Asset Class Range Benchmark
Global Equities 40-80% MSCI All Country World Index (ACWI)
Global Credit 10-50% Barclays U.S. Aggregate Bond Index
Real Assets 5-20% U.S. Consumer Price Index (CPI) + 5%
The Global Equities category includes domestic equity, international equity, emerging market equity, hedged funds and private equity. The Global Credit category includes global fixed income and relative value/macro, credit oriented managers and private credit. The Real Assets category includes real estate and infrastructure funds.
Other Long-Term Investments are non-unitized investments that relate primarily to gift arrangements between donors and the OSU Foundation. Included in this category are charitable remainder trust assets invested in mutual funds, OSU Foundation interests in unitrust, gift annuities, annuity trust and pooled income agreements, life insurance policies for which the OSU Foundation has been named owner and beneficiary, and certain real estate investments. Also included in this category are other private equity investments and investments in certain organizations that are affiliated with the OSU Health System.
U. S. Government and Agency securities are invested through trust agreements with banks who keep the securities in their safekeeping accounts at the Federal Reserve Bank in "book entry" form. The banks internally designate the securities as owned by or pledged to the university. Common stocks, corporate bonds and money market instruments are invested through trust agreements with banks who keep the investments in their safekeeping accounts at Northern Trust and BNY Mellon in "book entry" form. The banks internally designate the securities as owned by or pledged to the university.
The cash and cash equivalents amount represents cash held in the Long-Term Investment Pool by various investment managers. Such amounts were generated by gifts received throughout the fiscal year and sales of investments in the Long-Term Investment Pool. Subsequently, the cash and cash equivalents will be used to purchase long-term investments.

Notes to Financial Statements – Years Ended June 30, 2017 and 2016 (dollars in thousands)
37 The Ohio State University
Total university investments by major category for the primary institution at June 30, 2017 and 2016 are as follows:
Temporary Investments $ 1,645,681 $ 1,508,854
Long-Term Investment Pool:Gifted Endowment - University 1,062,321 977,173 Gifted Endowment - OSU Foundation 877,261 763,332 Quasi Endowment - Operating 1,299,779 1,203,959 Quasi Endowment - Designated 1,014,098 672,098
Total Long-Term Investment Pool 4,253,459 3,616,562
Securities Lending Collateral Investments 15,949 27,589
Other Long-Term Investments 143,638 132,971 Total Investments $ 6,058,727 $ 5,285,976
Primary Institution2017 2016

Notes to Financial Statements – Years Ended June 30, 2017 and 2016 (dollars in thousands)
2017 Financial Report 38
Total university investments by investment type for the primary institution at June 30, 2017 are as follows:
U.S. equity $ - $ 214,328 $ - $ - $ 214,328 International equity - 160,680 - - 160,680 Equity mutual funds 84,674 536,226 23,810 - 644,710 U.S. government obligations 162,870 367,909 352 - 531,131 U.S. government agency obligations 130,557 - - - 130,557 Repurchase agreements - - - - - Corporate bonds and notes 1,073,319 - - - 1,073,319 Bond mutual funds 88,106 - 16,831 - 104,937 Foreign government bonds 30,212 - - - 30,212 Real assets 8,347 674,729 25,930 - 709,006 Hedge funds - 1,399,392 - - 1,399,392 Private equity - 588,281 59,047 - 647,328 Commercial paper 46,028 - - - 46,028 Cash and cash equivalents - 311,914 - - 311,914 Other 21,568 - 17,668 - 39,236 Securities Lending Collateral Assets:
Repurchase agreements - - - 10,621 10,621 Variable rate notes - - - 890 890 Commercial paper - - - 1,410 1,410 Certificates of deposit - - - 3,044 3,044 Cash and other adjustments - - - (16) (16)
$ 1,645,681 $ 4,253,459 $ 143,638 $ 15,949 $ 6,058,727
Securities
Long-Term
Primary Institution
Lending Collateral
Other
Investments
Temporary
Investments Investment Pool
Long-Term
Investments Total

Notes to Financial Statements – Years Ended June 30, 2017 and 2016 (dollars in thousands)
39 The Ohio State University
Total university investments by investment type for the primary institution at June 30, 2016 are as follows:
The components of the net investment income and loss for the primary institution are as follows:
U.S. equity $ - $ 366,931 $ - $ - $ 366,931 International equity - 112,199 - - 112,199 Equity mutual funds 81,371 158,936 23,407 - 263,714 U.S. government obligations 167,430 5,094 2,745 - 175,269 U.S. government agency obligations 120,992 - - - 120,992 Repurchase agreements 2,200 - - - 2,200 Corporate bonds and notes 983,399 - 214 - 983,613 Bond mutual funds 83,697 - 17,801 - 101,498 Foreign government bonds 6,819 - - - 6,819 Real assets 10,184 644,415 16,705 - 671,304 Hedge funds - 1,444,636 - - 1,444,636 Private equity - 514,100 56,409 - 570,509 Commercial paper 40,746 - - - 40,746 Cash and cash equivalents - 370,251 - - 370,251 Other 12,016 - 15,690 - 27,706 Securities Lending Collateral Assets:
Repurchase agreements - - - 7,317 7,317 Variable rate notes - - - 17,774 17,774 Commercial paper - - - 521 521 Certificates of deposit - - - - - Cash and other adjustments - - - 1,977 1,977
$ 1,508,854 $ 3,616,562 $ 132,971 $ 27,589 $ 5,285,976
Investments Total
Lending Collateral
Other
Investments
Temporary
Investments Investment Pool
Long-Term
Securities
Long-Term
Primary Institution
Temporary Investments $ 41,653 $ (496) $ 41,157 Long-Term Investment Pool 78,984 472,758 551,742 Other Long-Term Investments 3,058 4,744 7,802
Total 2017 $ 123,695 $ 477,006 $ 600,701
Total 2016 $ 94,799 $ (105,312) $ (10,513)
Interest and
(Decrease)
Net Investment
Dividends of Investments Income (Loss)
Net Increase
in Fair Value

Notes to Financial Statements – Years Ended June 30, 2017 and 2016 (dollars in thousands)
2017 Financial Report 40
Information on Fair Value of Investments
Fair value is defined in the accounting standards as the price that would be received to sell an asset or paid to transfer a liability in an orderly transaction between market participants at the measurement date. Assets and liabilities reported at fair value are organized into a hierarchy based on the levels of inputs observable in the marketplace that are used to measure fair value.
Inputs are used in applying the various valuation techniques and take into account the assumptions that market participants use to make valuation decisions. Inputs may include price information, credit data, liquidity statistics, and other factors specific to the financial instrument. Observable inputs reflect market data obtained from independent sources. In contrast, unobservable inputs reflect the entity’s assumptions about how market participants would value the financial instrument.
A financial instrument’s level within the fair value hierarchy is based on the lowest level of any input that is significant to the fair value measurement. The following describes the hierarchy of inputs used to measure fair value and the primary valuation methodologies used for financial instruments measured at fair value on a recurring basis:
Level 1 – Prices based on unadjusted quoted prices in active markets that are accessible for identical assets or liabilities are classified as Level 1. Directly held equity securities, registered bond and equity mutual funds, and other miscellaneous investments classified in Level 1 are valued using prices quoted in active markets that the custodian and university have the ability to access.
Level 2 – Quoted prices in the markets that are not considered to be active, dealer quotations or alternative pricing sources for similar assets or liabilities for which all significant inputs are observable, either directly or indirectly, are classified as Level 2. Level 2 investments include US government agencies and obligations, corporate bonds, municipal bonds, foreign government bonds, repurchase agreements, commercial paper, and other debt related investments. The evaluated prices may be determined by factors which include, but are not limited to, market quotations, yields, maturities, call features, ratings, institutional size trading in similar groups of securities and developments related to specific securities.
Level 3 – Investments classified as Level 3 have significant unobservable inputs, as they trade infrequently or not at all. The inputs into the determination of fair value of these investments are based upon the best information in the circumstance and may require significant management judgment. Investments included in Level 3 consist primarily of the university’s ownership in real estate, limited partnerships and equity positions in private companies.
Net Asset Value (NAV) – Investments whose fair value is measured at NAV are excluded from the fair value hierarchy. Investments in non-governmental entities that do not have a readily determinable fair value may be valued at NAV if the NAV is determined in accordance with the fair value measurement principles provided by the FASB standards relevant to investment companies. Interest in investment funds with a NAV reported under an alternative basis are reflected as Level 3 investments. Investments measured at NAV consist mainly of non-publicly

Notes to Financial Statements – Years Ended June 30, 2017 and 2016 (dollars in thousands)
41 The Ohio State University
traded mutual funds, hedge funds, private equity, and other alternative funds. These assets are valued by the associated external investment manager/general partner and reviewed by the university using the most recent audited and unaudited financial statements available.
Not Leveled – Cash is not measured at fair value and, thus, is not subject to the fair value disclosure requirements. Cash not subject to such requirements amounted to $76,474 and $179,177 at June 30, 2017 and 2016, respectively.
Investments by fair value category for the primary institution at June 30, 2017 are as follows:
U.S. equity $ 214,328 $ - $ - $ - $ 214,328 International equity 160,680 - - - 160,680 Equity mutual funds 164,075 - - 480,635 644,710 U.S. government obligations (138) 531,269 - - 531,131 U.S. government agency obligations - 130,557 - - 130,557 Corporate bonds and notes - 1,072,324 995 - 1,073,319 Bond mutual funds 104,937 - - - 104,937 Foreign government bonds - 30,212 - - 30,212 Real assets 18,592 - 141,757 548,657 709,006 Hedge funds - - - 1,399,392 1,399,392 Private equity - - 41,084 606,244 647,328 Commercial paper - 46,028 - - 46,028 Cash equivalents 235,440 - - - 235,440 Other - 21,237 17,999 - 39,236 Securities Lending Collateral Assets:
Repurchase agreements - 10,621 - - 10,621 Variable rate notes - 890 - - 890 Commercial paper - 1,410 - - 1,410 Certificates of deposit - 3,044 - - 3,044 Other adjustments - (16) - - (16)
$ 897,914 $ 1,847,576 $ 201,835 $ 3,034,928 $ 5,982,253
Securities not leveled in investment portfolio:Cash $ 76,474 $ - $ - $ - $ 76,474
Primary InstitutionSignificant NAV as
Markets Inputs Inputs Expedient
(Level 1) (Level 2) (Level 3) (NAV) Fair Value
Quoted Prices Significant
in Active Other Observable Unobservable Practical
Total

Notes to Financial Statements – Years Ended June 30, 2017 and 2016 (dollars in thousands)
2017 Financial Report 42
Investments by fair value category for the primary institution at June 30, 2016 are as follows:
U.S. equity $ 366,931 $ - $ - $ - $ 366,931 International equity 112,199 - - - 112,199 Equity mutual funds 104,779 - - 158,935 263,714 U.S. government obligations - 175,269 - - 175,269 U.S. government agency obligations - 120,992 - - 120,992 Repurchase agreements - 2,200 - - 2,200 Corporate bonds and notes - 980,094 3,519 - 983,613 Bond mutual funds 101,498 - - - 101,498 Foreign government bonds - 6,819 - - 6,819 Real assets 15,182 - 125,357 530,765 671,304 Hedge funds - - - 1,444,636 1,444,636 Private equity - - 23,806 546,703 570,509 Commercial paper - 40,746 - - 40,746 Cash equivalents 191,074 - - - 191,074 Other - 11,685 16,021 - 27,706 Securities Lending Collateral Assets:
Repurchase agreements - 7,317 - - 7,317 Variable rate notes - 17,199 575 - 17,774 Commercial paper - 521 - - 521 Certificates of deposit - - - - - Other adjustments - 1,977 - - 1,977
$ 891,663 $ 1,364,819 $ 169,278 $ 2,681,039 $ 5,106,799
Securities not leveled in investment portfolio:Cash $ 179,177 $ - $ - $ - $ 179,177
Primary InstitutionSignificant NAV as
Markets Inputs Inputs Expedient
(Level 1) (Level 2) (Level 3) (NAV) Fair Value
Quoted Prices Significant
in Active Other Observable Unobservable Practical
Total

Notes to Financial Statements – Years Ended June 30, 2017 and 2016 (dollars in thousands)
43 The Ohio State University
Additional Information on Investments Measured at the NAV
Additional information on fair values, unfunded commitments, remaining life and redemption for investments measured at the NAV for the primary institution at June 30, 2017 is as follows:
Additional Risk Disclosures for Investments
GASB Statements No. 3 and 40 require certain additional disclosures related to the liquidity, interest-rate, custodial, credit and foreign currency risks associated with deposits and investments.
Liquidity risk – The university’s private equity and real asset investments are illiquid and subject to redemption restrictions in accordance with their respective governing documents. Such governing documents do not provide for the university to exit these investments until their respective terms have ended.
Interest-rate risk – Interest-rate risk is the risk that changes in interest rates will adversely affect the fair value of an investment. Investments with interest rates that are fixed for longer periods are likely to be subject to more variability in their fair values as a result of future changes in interest rates.
Remaining
Life Redemption Notice Period Redemption Restrictions
Equity mutual funds - $ 480,635 $ - No limit 1 to 30 days None non-public internationalHedge funds - absolute 1,399,392 - No limit 30 to 90 day notice periods Lock-up provisions ranging from none return, credit, long/short equities to 2 years; side pockets on a few funds Private equity - private credit, 606,244 648,769 1-10 years Partnerships ineligible for Not redeemable
buyouts, venture, secondary redemptionReal assets - natural resources, 548,657 224,711 1-10 years Partnerships ineligible for Not redeemable
real estate, intrastructure redemption$ 3,034,928 $ 873,480
Fair Value Commitments
Unfunded

Notes to Financial Statements – Years Ended June 30, 2017 and 2016 (dollars in thousands)
2017 Financial Report 44
The maturities of the university’s interest-bearing investments for the primary institution at June 30, 2017 are as follows:
The maturities of the university’s interest-bearing investments for the primary institution at June 30, 2016 are as follows:
U.S. government obligations $ 531,131 $ 395,780 $ 107,902 $ 27,449 $ - U.S. government agency
obligations 130,557 12,681 55,288 16,468 46,120 Commercial paper 46,028 46,028 - - - Corporate bonds 1,073,319 301,723 661,802 55,156 54,638 Bond mutual funds 104,937 4,862 58,284 28,182 13,609 Other governmental bonds 21,237 4,803 13,216 175 3,043 Foreign governmental bonds 30,212 22,666 7,546 - - Securities Lending Collateral:
Repurchase agreements 10,621 10,621 - - - Certificates of deposit 3,044 3,044 - - - Commercial paper 1,410 1,410 - - - Variable rate notes 890 890 - - -
Total $ 1,953,386 $ 804,508 $ 904,038 $ 127,430 $ 117,410
Fair Value Less than 1 1 to 5 6 to 10
Primary InstitutionInvestment Maturities (in years)
More than 10
U.S. government obligations $ 175,269 $ 18,829 $ 157,613 $ (1,173) $ - U.S. government agency
obligations 120,992 14,980 62,941 17,088 25,983 Repurchase agreements 2,200 2,200 - - - Commercial paper 40,746 40,746 - - - Corporate bonds 983,613 270,225 634,723 35,072 43,593 Bond mutual funds 101,498 (1,011) 66,138 27,106 9,265 Other governmental bonds 11,685 3,237 7,739 - 709 Foreign governmental bonds 6,819 1,726 5,093 - -Securities Lending Collateral:
Repurchase agreements 7,317 7,317 - - - Commercial paper 521 521 - - - Variable rate notes 17,774 17,774 - - -
Total $ 1,468,434 $ 376,544 $ 934,247 $ 78,093 $ 79,550
6 to 10 More than 10
Primary InstitutionInvestment Maturities (in years)
Fair Value Less than 1 1 to 5

Notes to Financial Statements – Years Ended June 30, 2017 and 2016 (dollars in thousands)
45 The Ohio State University
Custodial credit risk – Custodial credit risk is the risk that, in the event of the failure of the custodian, university investments may not be recovered. It is the policy of the university to hold investments in custodial accounts, and the securities are registered solely in the name of the university. All investments are transacted with nationally reputable brokerage firms offering protection by the Securities Investor Protection Corporation.
Credit risk – Credit risk is the risk that an issuer or other counterparty to an investment will not fulfill its obligations to the holder of the investment. Credit quality information – as commonly expressed in terms of the credit ratings issued by nationally recognized statistical rating organizations such as Moody’s Investors Service, Standard & Poor’s, or Fitch Ratings – provides a current depiction of potential variable cash flows and credit risk.
Per GASB Statement No. 40, Deposit and Investment Risk Disclosures, an amendment to GASB Statement No. 3, securities with split ratings, or a different rating assignment, are disclosed using the rating indicative of the greatest degree of risk.
The credit ratings of the university’s interest-bearing investments for the primary institution at June 30, 2017 are as follows:
The credit ratings of the university’s interest-bearing investments for the primary institution at June 30, 2016 are as follows:
U.S. government and agency obligations $ 661,688 $ 4,828 $ 615,608 $ 33,253 $ - $ - $ - $ - $ - $ - $ 7,999 Corporate bonds 1,073,319 74,388 187,093 367,603 328,182 19,966 5,249 - - - 90,838 Bond mutual funds 104,937 69,995 5,424 18,060 8,080 1,474 619 1,272 - - 13 Foreign government bonds 30,212 3,080 2,126 12,724 2,043 - - - - - 10,239 Commercial paper 46,028 - - 10,949 - - - - - - 35,079 Other government bonds 21,237 1,325 9,964 5,259 3,688 - - - - - 1,001 Securities Lending Collateral:
Repurchase agreements 10,621 - - - - - - - - - 10,621 Certificates of deposit 3,044 - - 2,627 - - - - - - 417 Commercial paper 1,410 - - 1,410 - - - - - - - Variable rate notes 890 - 633 257 - - - - - - -
Total $ 1,953,386 $ 153,616 $ 820,848 $ 452,142 $ 341,993 $ 21,440 $ 5,868 $ 1,272 $ - $ - $ 156,207
Primary InstitutionTotal C Not RatedAAA AA A CCBBB BB B CCC
U.S. government and agency obligations $ 296,261 $ 289 $ 292,392 $ 2,518 $ - $ - $ - $ - $ - $ - $ 1,062 Repurchase agreements 2,200 - - - - - - - - - 2,200 Corporate bonds 983,613 61,182 211,662 359,356 291,321 22,258 8,313 238 - - 29,283 Bond mutual funds 101,498 62,906 7,385 16,059 12,540 870 281 1 - 1,320 136 Foreign government bonds 6,819 2,322 2,731 - 1,255 - - - - - 511 Commercial paper 40,746 - - - - - - - - - 40,746 Other government bonds 11,685 - 4,726 5,235 275 - 1,004 - - - 445 Securities Lending Collateral:
Repurchase agreements 7,317 - - - - - - - - - 7,317 Commercial paper 521 521 - - - - - - - - - Variable rate notes 17,774 2,015 6,029 9,730 - - - - - - -
Total $ 1,468,434 $ 129,235 $ 524,925 $ 392,898 $ 305,391 $ 23,128 $ 9,598 $ 239 $ - $ 1,320 $ 81,700
A
Primary InstitutionBBB C Not RatedTotal B CCC CCBBAAAAA

Notes to Financial Statements – Years Ended June 30, 2017 and 2016 (dollars in thousands)
2017 Financial Report 46
Concentration of credit risk – Concentration of credit risk is the risk associated with a lack of diversification, such as having substantial investments in a few individual issuers, thereby exposing the university to greater risks resulting from adverse economic, political, regulatory, geographic or credit developments.
There is no investment in issuers other than U. S. government guaranteed securities that represents five percent or more of investments held at June 30, 2017 and June 30, 2016.
Foreign currency risk – Foreign currency risk is the risk that changes in exchange rates will adversely affect the fair value of an investment or deposit.

Notes to Financial Statements – Years Ended June 30, 2017 and 2016 (dollars in thousands)
47 The Ohio State University
At June 30, 2017, exposure to foreign currency risk for the primary institution is as follows:
Australian dollar $ 1,557 $ 12,026 $ 486 $ - $ - $ 4,054 Bangladeshi taka - 544 - - - - Brazilian real 2,473 7,196 183 - - - Canadian dollar 11,022 4,644 (30) - - - Chilean peso (1) 2,256 - - - - Chinese yuan - 2,225 3 - - - Columbian peso - 1,906 - - - - Czech Republic
koruna - 1,216 - - 2,185 - Danish krone 2,891 341 8 8,543 - - Egyptian pound - 22 - - - - Euro 49,766 45,438 182 4,023 - 96,881 Great Britain pound
sterling 27,369 66,843 114 2,638 - 30,577 Hong Kong dollar 10,858 16,146 17 - - - Hungarian forint - 56 - - - - Indian rupee (5) 4,793 139 - - - Indonesian rupiah (1) 933 141 - - - Israeli shekel - 74 - - - - Japanese yen 28,717 55,177 34 - 15,099 - Kuwaiti dinar - 1,910 - - - - Malaysian ringgit - 1,908 69 - - - Mexican peso (2) 4,767 274 (61) - - New Taiwan dollar (8) 6,438 (174) - - - New Turkish lira - 2,535 232 - - - New Zealand dollar - 27 (289) - - - Norwegian krone 3,505 1,745 50 - - - Pakistan rupee - 4,823 - - - - Peruvian nuevo sol - 6 71 - - - Philippine peso - 1,348 - - - - Polish zloty (7) 1,048 - - - - Qatarian rial - 85 - - - - Romanian new leu - 2,887 - - - - Russian ruble (2) 33 146 - - - Singapore dollar - 7,978 (625) - - - South African rand (4) 5,560 6 - - - South Korean won 3,284 4,839 (183) - - - Sri Lanka rupee - 116 - - - - Swedish krona 773 4,711 273 - - - Swiss franc 18,495 15,004 (262) - - 13,860 Thailand bhat - 3,232 (3) - - - UAE dirham - 1,137 - - - -
Total $ 160,680 $ 293,973 $ 862 $ 15,143 $ 17,284 $ 145,372
Funds
Primary Institution
Common Mutual Mutual Government and HedgeBonds and
Funds Notes BondsFunds
PartnershipsEquity Bond ForeignCorporate
Stock
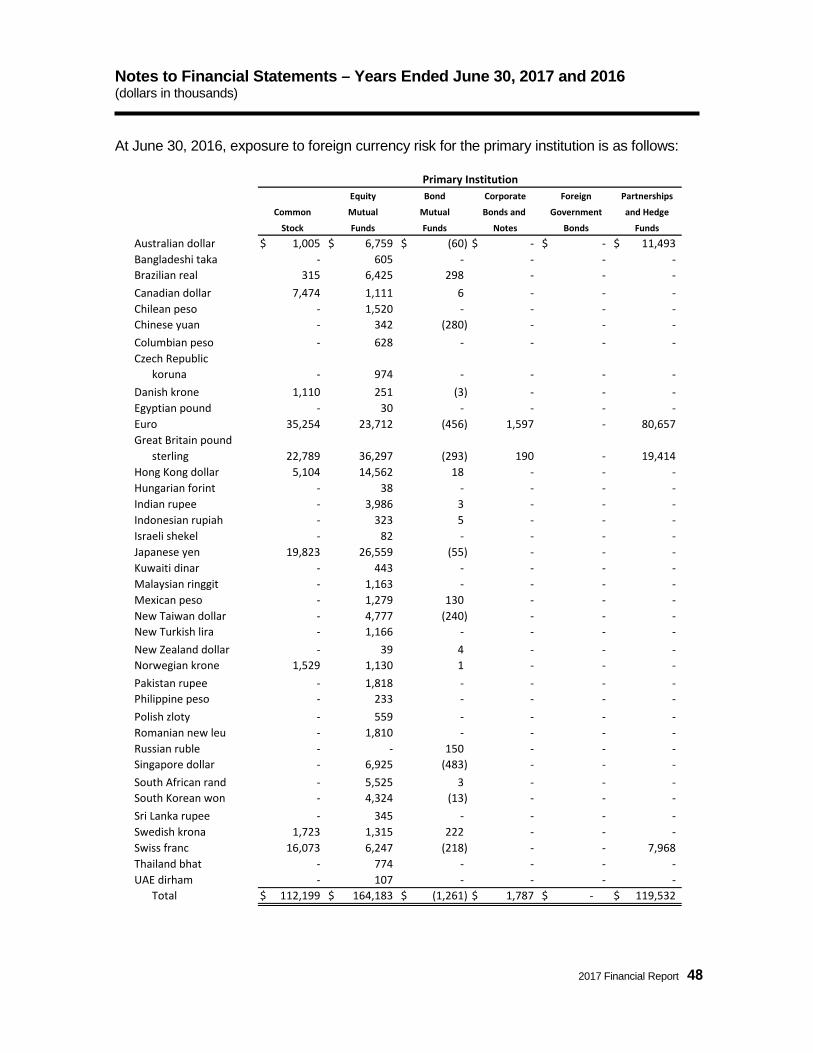
Notes to Financial Statements – Years Ended June 30, 2017 and 2016 (dollars in thousands)
2017 Financial Report 48
At June 30, 2016, exposure to foreign currency risk for the primary institution is as follows:
Australian dollar $ 1,005 $ 6,759 $ (60) $ - $ - $ 11,493 Bangladeshi taka - 605 - - - -Brazilian real 315 6,425 298 - - - Canadian dollar 7,474 1,111 6 - - - Chilean peso - 1,520 - - - - Chinese yuan - 342 (280) - - - Columbian peso - 628 - - - - Czech Republic
koruna - 974 - - - - Danish krone 1,110 251 (3) - - - Egyptian pound - 30 - - - - Euro 35,254 23,712 (456) 1,597 - 80,657 Great Britain pound
sterling 22,789 36,297 (293) 190 - 19,414 Hong Kong dollar 5,104 14,562 18 - - - Hungarian forint - 38 - - - - Indian rupee - 3,986 3 - - - Indonesian rupiah - 323 5 - - - Israeli shekel - 82 - - - - Japanese yen 19,823 26,559 (55) - - - Kuwaiti dinar - 443 - - - - Malaysian ringgit - 1,163 - - - - Mexican peso - 1,279 130 - - - New Taiwan dollar - 4,777 (240) - - - New Turkish lira - 1,166 - - - - New Zealand dollar - 39 4 - - - Norwegian krone 1,529 1,130 1 - - - Pakistan rupee - 1,818 - - - - Philippine peso - 233 - - - - Polish zloty - 559 - - - - Romanian new leu - 1,810 - - - - Russian ruble - - 150 - - - Singapore dollar - 6,925 (483) - - - South African rand - 5,525 3 - - - South Korean won - 4,324 (13) - - - Sri Lanka rupee - 345 - - - - Swedish krona 1,723 1,315 222 - - - Swiss franc 16,073 6,247 (218) - - 7,968 Thailand bhat - 774 - - - - UAE dirham - 107 - - - -
Total $ 112,199 $ 164,183 $ (1,261) $ 1,787 $ - $ 119,532
Corporate Foreign Partnerships
Mutual Mutual Bonds and Government
Stock Funds Funds Notes Bonds Funds
Common and Hedge
Primary InstitutionEquity Bond

Notes to Financial Statements – Years Ended June 30, 2017 and 2016 (dollars in thousands)
49 The Ohio State University
Securities Lending
The university has engaged in a securities lending program through its custodian bank of the Long-Term Investment Pool. Securities loaned at June 30, 2017 were comprised completely of equities, and these loans were secured by collateral in the form of cash, equities, U.S. government obligations, and foreign government/private debt. All loans must be secured by collateral amounting to no less than 102% of the current fair value of domestic securities loaned and no less than 105% of the current fair value of foreign securities loaned.
As of the financial statements’ date, there was no credit risk on securities loaned due to the fair value of the collateral held being greater than the fair value of securities on loan to each individual broker. The university, the custodian, and the borrower each maintain the right to terminate a loan. Upon maturity or termination of a loan agreement, the custodian is contractually obligated to indemnify the university if the borrowers fail to return loaned securities and if liquidation of the collateral is insufficient to replace the value of the securities loaned. Noncash collateral cannot be pledged or sold by the university without a borrower’s default. While earning fees received by the university during the loan period, cash collateral is simultaneously invested in short term, highly liquid securities in order to further increase interest earned while also matching a weighted average maturity of loans which is not to exceed 60 days.
As of June 30, 2017, securities loaned by the university amounted to a fair value of $26,267 and were secured by collateral in the amount of $27,745. The portion of this collateral that was received in cash amounted to $15,949 and is reflected within the university’s statement of net position as a current asset and a corresponding current liability.
As of June 30, 2016, securities loaned by the university amounted to a fair value of $38,166 and were secured by collateral in the amount of $40,139. The portion of this collateral that was received in cash amounted to $27,589 and is reflected within the university’s statement of net position as a current asset and a corresponding current liability.

Notes to Financial Statements – Years Ended June 30, 2017 and 2016 (dollars in thousands)
2017 Financial Report 50
NOTE 4 — ACCOUNTS, NOTES AND PLEDGES RECEIVABLE
Accounts receivable for the primary institution at June 30, 2017 and 2016 consist of the following:
Allowances consist primarily of allowances for doubtful accounts and contractual adjustments of patient receivables of the OSU Health System.
Notes receivable consist primarily of Perkins and health professions loans and are net of an allowance for doubtful accounts of $18,445 and $17,500 at June 30, 2017 and 2016, respectively. Federal capital contributions to the Perkins loan programs represent advances which are ultimately refundable to the federal government.
In accordance with GASB Statement No. 33, Accounting and Reporting for Non-exchange Transactions, the university has recorded $110,849 in non-endowment pledges receivable and a related allowance for doubtful accounts of $4,781 at June 30, 2017. The university recorded $105,671 in non-endowment pledges receivable and a related allowance for doubtful accounts of $4,804 at June 30, 2016.
Accounts receivable for the discretely presented component units at June 30, 2017 and 2016 consist of the following:
Gross patient receivables - OSU Health System $ 1,089,251 $ 1,057,506 Grant and contract receivables 91,684 88,725 Tuition and fees receivable 20,176 19,508 Receivables for departmental and auxiliary sales and services 52,415 47,934 State and federal receivables 9,239 7,223 Other receivables 9,440 409
Total receivables 1,272,205 1,221,305 Less: Allowances 696,330 708,674
Total receivables, net $ 575,875 $ 512,631
2017 2016Primary Institution
Gross patient receivables - OSU Physicians $ 101,787 $ 116,489 Other receivables 13,234 14,693
Total receivables 115,021 131,182 Less: Allowances for doubtful accounts 67,285 78,467
Total receivables, net $ 47,736 $ 52,715
Discretely PresentedComponent Units
2017 2016

Notes to Financial Statements – Years Ended June 30, 2017 and 2016 (dollars in thousands)
51 The Ohio State University
Allowances consist primarily of allowances for doubtful accounts and contractual adjustments of patient receivables of OSU Physicians.
NOTE 5 — CAPITAL ASSETS
Capital assets activity for the primary institution for the year ended June 30, 2017 is summarized as follows:
The increase in construction in progress of $63,155 in fiscal year 2017 represents the amount of capital expenditures for new projects of $318,555, net of assets placed in service of $255,400.
Capital assets not being depreciated:Land $ 85,335 $ 3,474 $ 307 $ 88,502 Intangibles 18,413 - - 18,413 Construction in progress 103,555 63,155 - 166,710
Total non depreciable assets 207,303 66,629 307 273,625
Capital assets being depreciated:Improvements other than buildings 812,055 16,374 - 828,429 Buildings and fixed equipment 6,039,509 183,276 8,246 6,214,539 Movable equipment, furniture and software 1,374,200 138,473 59,928 1,452,745 Library books 183,389 5,109 492 188,006
Total 8,409,153 343,232 68,666 8,683,719 Less: Accumulated depreciation 3,764,023 374,615 64,878 4,073,760
Total depreciable assets, net 4,645,130 (31,383) 3,788 4,609,959 Capital assets, net $ 4,852,433 $ 35,246 $ 4,095 $ 4,883,584
EndingBeginning
Balance Additions Retirements Balance
Primary Institution

Notes to Financial Statements – Years Ended June 30, 2017 and 2016 (dollars in thousands)
2017 Financial Report 52
Capital assets activity for the primary institution for the year ended June 30, 2016 is summarized as follows:
The decrease in construction in progress of $228,791 in fiscal year 2016 represents the amount of capital expenditures for new projects of $349,456, net of assets placed in service of $578,247.
Capital assets activity for the discretely presented component units for the year ended June 30, 2017 is summarized as follows:
Capital assets not being depreciated:Land $ 86,915 $ 3,319 $ 4,899 $ 85,335 Intangibles 18,413 - - 18,413 Construction in progress 332,346 (228,791) - 103,555
Total non depreciable assets 437,674 (225,472) 4,899 207,303
Capital assets being depreciated:Improvements other than buildings 730,346 81,709 - 812,055 Buildings and fixed equipment 5,607,541 441,277 9,309 6,039,509 Movable equipment, furniture and software 1,300,468 109,169 35,437 1,374,200 Library books 177,753 6,165 529 183,389
Total 7,816,108 638,320 45,275 8,409,153 Less: Accumulated depreciation 3,450,540 351,901 38,418 3,764,023
Total depreciable assets, net 4,365,568 286,419 6,857 4,645,130 Capital assets, net $ 4,803,242 $ 60,947 $ 11,756 $ 4,852,433
Primary InstitutionEndingBeginning
Balance Additions Retirements Balance
Capital assets not being depreciated:Land $ 21,122 $ 6,354 $ 1,745 $ 25,731 Intangibles - 52 - 52 Construction in progress 25,491 (10,325) - 15,166
Total non depreciable assets 46,613 (3,919) 1,745 40,949
Capital assets being depreciated:Improvements other than buildings 8,510 5,663 750 13,423 Buildings and fixed equipment 72,366 41,622 11,622 102,366 Movable equipment, furniture and software 50,281 2,611 22,318 30,574 Library books - - - -
Total 131,157 49,896 34,690 146,363 Less: Accumulated depreciation 59,805 7,138 1,798 65,145
Total depreciable assets, net 71,352 42,758 32,892 81,218 Capital assets, net $ 117,965 $ 38,839 $ 34,637 $ 122,167
Discretely Presented Component UnitsEnding
Balance
Beginning
Additions Retirements Balance

Notes to Financial Statements – Years Ended June 30, 2017 and 2016 (dollars in thousands)
53 The Ohio State University
Capital assets activity for the discretely presented component units for the year ended June 30, 2016 is summarized as follows:
NOTE 6 – ACCOUNTS PAYABLE AND ACCRUED EXPENSES
Accounts payable and accrued expenses for the primary institution at June 30, 2017 and 2016consist of the following:
NOTE 7 – DEPOSITS AND ADVANCE PAYMENTS FOR GOODS AND SERVICES
Deposits and advance payments for goods and services for the primary institution at June 30, 2017 and 2016 consist of the following:
Capital assets not being depreciated:Land $ 10,844 $ 20,881 $ 10,603 $ 21,122 Intangibles - - - -Construction in progress 582 24,909 - 25,491
Total non depreciable assets 11,426 45,790 10,603 46,613
Capital assets being depreciated:Improvements other than buildings 8,314 1,625 1,429 8,510 Buildings and fixed equipment 67,551 8,101 3,286 72,366 Movable equipment, furniture and software 48,398 2,662 779 50,281 Library books - - - -
Total 124,263 12,388 5,494 131,157 Less: Accumulated depreciation 55,778 6,425 2,398 59,805
Total depreciable assets, net 68,485 5,963 3,096 71,352 Capital assets, net $ 79,911 $ 51,753 $ 13,699 $ 117,965
Discretely Presented Component UnitsEnding
Balance
Beginning
Additions Retirements Balance
Payables to vendors for supplies and services $ 303,026 $ 333,524 Accrued compensation and benefits 125,049 90,906 Retirement system contributions payable 49,572 45,118 Other accrued expenses 47,107 (332)
Total payables and accrued expenses $ 524,754 $ 469,216
2017 2016Primary Institution

Notes to Financial Statements – Years Ended June 30, 2017 and 2016 (dollars in thousands)
2017 Financial Report 54
NOTE 8 – SELF-INSURANCE ACCRUALS
The university maintains self-insurance programs for professional medical malpractice, employee health insurance and workers’ compensation. Information on each of these programs is provided below.
Medical Malpractice
The university has established trusteed self-insurance funds for professional medical malpractice liability claims with a $4,000 limit per occurrence and $18,000 annual aggregate. The university self-insurance funds have insurance in excess of $4,000 per occurrence through Oval Limited, a blended component unit of the university. Effective July 1, 2016, Oval Limited provides coverage with limits of $85,000 per occurrence and in the aggregate.
Previous coverage levels for Oval Limited are as follows:
Accident Period for Oval
Gross Oval Limit (Occurrence and Annual
Aggregate) 7/1/16 – 6/30/17 $85,000 7/1/15 – 6/30/16 $75,000 7/1/08 – 6/30/15 $55,000 7/1/06 – 6/30/08 $40,000 7/1/05 – 6/30/06 $35,000 7/1/02– 6/30/05 $25,000 7/1/97 – 6/30/02 $15,000 9/30/94 – 6/30/97 $10,000
The limits are in excess of underlying policies with limits of $4,000 per occurrence and $18,000 in the aggregate. A portion of the risks written by Oval Limited to date is reinsured by four reinsurance companies. Oval Limited retains 50% of the first $15,000 of risk and cedes the remainder to Berkley Medical Excess Underwriters (rated A+ by A.M. Best). The next $20,000 is fully ceded to Lexington Insurance Company (rated A by A.M. Best). The next $20,000 is fully ceded to Endurance Specialty Insurance Ltd. (rated A by A.M. Best). Above that, Oval
Current deposits and advance payments:Tuition and fees $ 40,002 $ 40,119 Departmental and auxiliary sales and services 64,546 75,686 Affinity agreements 5,068 7,901 Grant and contract advances 101,307 78,329 Other deposits and advance payments 12,957 14,337
Total current deposits and advance payments $ 223,880 $ 216,372
Other non-current deposits and advance payments: $ 73,289 $ 79,538
2017 2016Primary Institution

Notes to Financial Statements – Years Ended June 30, 2017 and 2016 (dollars in thousands)
55 The Ohio State University
Limited cedes the remaining $20,000 of risk to Medical Protective (rated A++ by A.M. Best). The estimated liability and the related contributions to the trustee fund are based upon an independent actuarial determination as of June 30, 2017. OSUP participates in the university self-insurance fund for professional medical malpractice liability claims.
The university’s estimate of professional malpractice liability includes provisions for known claims and actuarially determined estimates of incurred but not reported claims and incidents. This liability at June 30, 2017 of the anticipated future payments on gross claims is estimated at its present value of $51,626 discounted at an estimated rate of 3.0% (university funds) and an additional $7,297 discounted at an estimated rate of 3.0% (Oval Limited).
Although actual experience upon the ultimate disposition of the claims may vary from this estimate, the self-insurance fund assets of $184,849 (which primarily consist of bond and equity mutual funds, money market funds and U.S. treasury notes) are more than the recorded liability at June 30, 2017, and the surplus of $111,328 is included in unrestricted net position.
At June 30, 2016, the anticipated future payments on gross claims was estimated at its present value of $57,873 discounted at an estimated rate of 3% (university funds) and an additional $26,927 discounted at an estimated rate of 3% (Oval Limited). The self-insurance fund assets of $179,198 (which primarily consist of bond and equity mutual funds, money market funds and U.S. treasury notes) were more than the recorded liability at June 30, 2016, and the surplus of $94,398 was included in unrestricted net position.
Employee Health Insurance
The university is also self-insured for employee health insurance. As of June 30, 2017 and 2016, $35,849 and $39,096, respectively is recorded as a liability relating to both claims received but not paid and estimates of claims incurred but not yet reported.
Workers’ Compensation
Effective January 1, 2013, the university became self-insured for workers’ compensation. As of June 30, 2017 and 2016, respectively, $20,498 and $19,127 are recorded as a liability relating to both claims received but not paid and estimates of claims incurred but not yet reported.

Notes to Financial Statements – Years Ended June 30, 2017 and 2016 (dollars in thousands)
2017 Financial Report 56
Changes in reported self-insurance liabilities for the primary institution since June 30, 2015 result from the following activities:
NOTE 9 — DEBT
The university may finance the construction, renovation and acquisition of certain facilities through the issuance of debt obligations, which may include general receipts bonds, certificates of participation, commercial paper, capital lease obligations and other borrowings. Debt activity for the primary institution for the year ended June 30, 2017 is as follows:
Liability at beginning of fiscal year $ 84,800 $ 98,578 $ 39,096 $ 37,375 $ 19,127 $ 15,308 Current year provision for losses (10,307) (9,128) 325,339 343,904 (11,409) (5,492) Claim payments (970) (4,650) (328,586) (342,183) 12,780 9,311 Balance at fiscal year end $ 73,523 $ 84,800 $ 35,849 $ 39,096 $ 20,498 $ 19,127
Workers' Compensation2017 20162017 2016 2017 2016
Malpractice Health
Notes:WOSU $ 2,303 $ - $ 159 $ 2,144 $ 159 OH Air Quality Note Series A 3,438 - 407 3,031 413 OH Air Quality Note Series B 2,340 - - 2,340 - St. Stephens Church Note 2,802 - 73 2,729 76
General Receipts Bonds - Fixed Rate:2008A, due serially through 2028 110,330 - 15,820 94,510 7,340 2010A, due serially through 2020 117,190 - 38,030 79,160 38,700 2010C, due 2040 654,785 - - 654,785 - 2010D, due serially through 2032 84,625 - - 84,625 - 2011, due 2111 500,000 - - 500,000 - 2012A, due 2030 82,870 - 7,890 74,980 8,230 2012B, due 2033 17,135 - 1,800 15,335 1,820 2014A, due serially through 2044 133,795 - 2,235 131,560 2,315 2016A, due serially through 2111 600,000 - 600,000 - 2016B, due serially through 2030 28,545 - 2,610 25,935 2,680
Special Purpose General Receipts Bonds - Fixed Rate:2013A, due 2043 337,955 - - 337,955
General Receipts Bonds - Variable Rate:1997, due serially through 2027 17,160 - - 17,160 17,160 1999B1, due serially through 2029 10,765 - - 10,765 10,765 2001, due serially through 2032 53,035 - - 53,035 53,035 2003C, due serially through 2031 51,975 - 2,175 49,800 49,800 2005B, due serially through 2035 71,575 - - 71,575 71,575 2008B, due serially through 2028 91,925 - 5,900 86,025 86,025 2010E, due serially through 2035 150,000 - - 150,000 150,000 2014B, due serially through 2044 150,000 - - 150,000 150,000
Capital Lease Obligations 4,547 6,430 2,429 8,548 1,891 3,279,095 6,430 79,528 3,205,997 651,984
Unamortized Bond Premiums 94,165 - 8,036 86,129 - Total outstanding debt $ 3,373,260 $ 6,430 $ 87,564 $ 3,292,126 $ 651,984
Primary InstitutionBeginning CurrentEnding
Balance Additions Reductions Balance Portion

Notes to Financial Statements – Years Ended June 30, 2017 and 2016 (dollars in thousands)
57 The Ohio State University
Debt activity for the primary institution for the year ended June 30, 2016 is as follows:
Debt activity for the discretely presented component units for the year ended June 30, 2017 is as follows:
Notes:WOSU $ 2,462 $ - $ 159 $ 2,303 $ 159 OH Air Quality Note Series A 3,839 - 401 3,438 407 OH Air Quality Note Series B 2,340 - - 2,340 - St. Stephens Church Note 2,871 - 69 2,802 73
General Receipts Bonds - Fixed Rate:2005A, due serially through 2035 36,040 - 36,040 - - 2008A, due serially through 2028 124,165 - 13,835 110,330 7,070 2010A, due serially through 2020 146,040 - 28,850 117,190 38,030 2010C, due 2040 654,785 - - 654,785 - 2010D, due serially through 2032 84,625 - - 84,625 - 2011, due 2111 500,000 - - 500,000 - 2012A, due 2030 90,500 - 7,630 82,870 7,890 2012B, due 2033 18,920 - 1,785 17,135 1,800 2014A, due serially through 2044 135,985 - 2,190 133,795 2,235 2016A, due serially through 2111 - 600,000 - 600,000 - 2016B, due serially through 2030 - 30,875 2,330 28,545 2,610
Special Purpose General Receipts Bonds - Fixed Rate:2013A, due 2043 337,955 - - 337,955 -
General Receipts Bonds - Variable Rate:1997, due serially through 2027 17,160 - - 17,160 17,160 1999B1, due serially through 2029 10,765 - - 10,765 10,765 2001, due serially through 2032 53,035 - - 53,035 53,035 2003C, due serially through 2031 51,975 - - 51,975 51,975 2005B, due serially through 2035 71,575 - - 71,575 71,575 2008B, due serially through 2028 91,925 - - 91,925 91,925 2010E, due serially through 2035 150,000 - - 150,000 150,000 2014B, due serially through 2044 150,000 - - 150,000 150,000
Capital Lease Obligations 6,389 - 1,842 4,547 1,709 2,743,351 630,875 95,131 3,279,095 658,418
Unamortized Bond Premiums 98,658 4,745 9,238 94,165 - Total outstanding debt $ 2,842,009 $ 635,620 $ 104,369 $ 3,373,260 $ 658,418
Primary InstitutionBeginning Ending Current
Balance Additions Reductions Balance Portion
Notes:OSU Physicians - Series 2013 Health Care
Facilities Revenue Bond, due through 2035 $ 13,659 $ - $ 635 $ 13,024 $ 601 OSU Physicians - Term Loan Payable, due 2023 1,887 - 273 1,614 261 Campus Partners - Columbus Foundation Note Payable - 1,979 83 1,896 84 Campus Partners - Edwards TIF Note Payable - 150 - 150 -
Capital Lease Obligations - - - - - Total outstanding debt $ 15,546 $ 2,129 $ 991 $ 16,684 $ 946
Discretely Presented Component UnitsBeginning Ending Current
Balance Additions Reductions Balance Portion

Notes to Financial Statements – Years Ended June 30, 2017 and 2016 (dollars in thousands)
2017 Financial Report 58
Debt activity for the discretely presented component units for the year ended June 30, 2016 is as follows:
Debt obligations are generally callable by the university, bear interest at fixed and variable rates ranging from 0% to 6% and mature at various dates through 2111. Maturities and interest on debt obligations for the next five years and in five-year periods for the primary institution are as follows:
Notes:OSU Physicians - Series 2013 Health Care
Facilities Revenue Bond, due through 2035 $ 14,228 $ - $ 569 $ 13,659 $ 811 OSU Physicians - Term Loan Payable, due 2023 2,136 - 249 1,887 -
Capital Lease Obligations 5 - 5 - - Total outstanding debt $ 16,369 $ - $ 823 $ 15,546 $ 811
Beginning Ending Current
Balance Additions Reductions Balance Portion
Discretely Presented Component Units
2018 $ 651,984 $ 133,483 $ 785,467 2019 49,455 126,190 175,645 2020 36,441 124,307 160,748 2021 34,969 122,654 157,623 2022 36,060 121,084 157,144 2023-2027 191,588 578,941 770,529 2028-2032 150,524 539,178 689,702 2033-2037 103,653 511,595 615,248 2038-2042 790,153 398,346 1,188,499 2043-2047 411,170 235,203 646,373 2048-2052 - 170,600 170,600 2053-2057 250,000 165,540 415,540 2058-2062 120,000 120,000 2063-2067 120,000 120,000 2068-2072 120,000 120,000 2073-2077 120,000 120,000 2078-2082 120,000 120,000 2083-2087 120,000 120,000 2088-2092 120,000 120,000 2093-2097 120,000 120,000 2098-2102 120,000 120,000 2103-2107 120,000 120,000 2108-2112 500,000 96,000 596,000
$ 3,205,997 $ 4,523,121 $ 7,729,118
Primary InstitutionPrincipal Interest Total
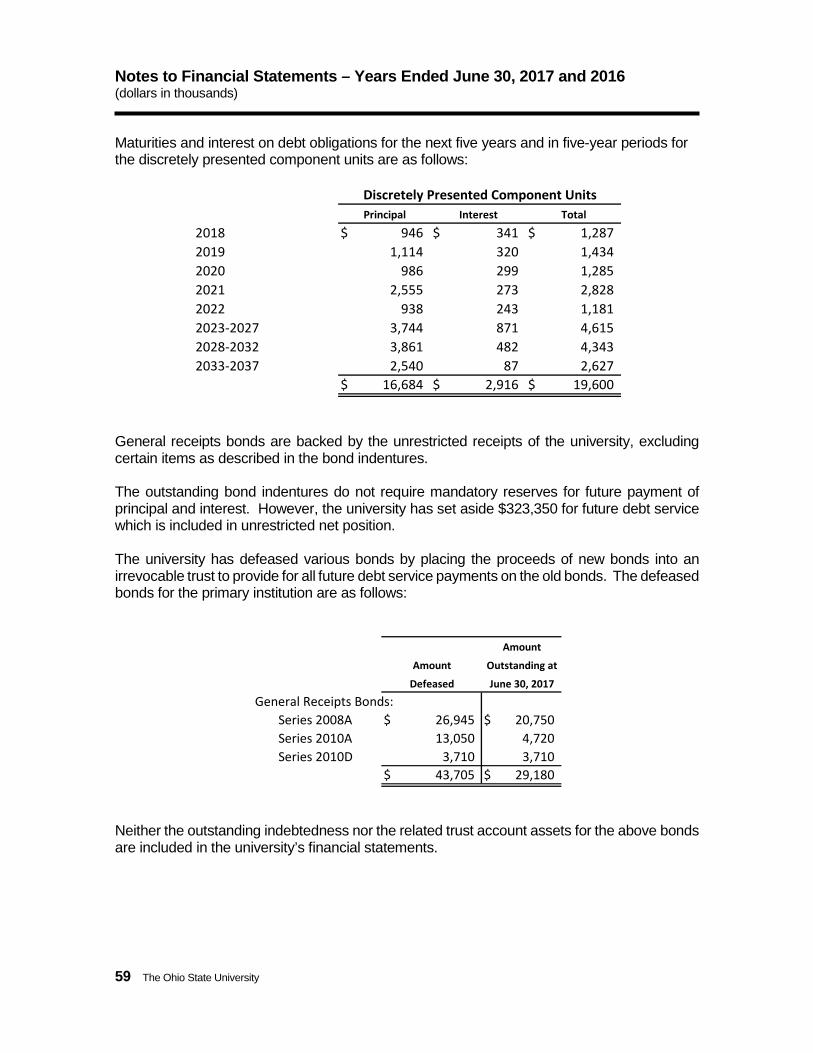
Notes to Financial Statements – Years Ended June 30, 2017 and 2016 (dollars in thousands)
59 The Ohio State University
Maturities and interest on debt obligations for the next five years and in five-year periods for the discretely presented component units are as follows:
General receipts bonds are backed by the unrestricted receipts of the university, excluding certain items as described in the bond indentures.
The outstanding bond indentures do not require mandatory reserves for future payment of principal and interest. However, the university has set aside $323,350 for future debt service which is included in unrestricted net position.
The university has defeased various bonds by placing the proceeds of new bonds into an irrevocable trust to provide for all future debt service payments on the old bonds. The defeased bonds for the primary institution are as follows:
Neither the outstanding indebtedness nor the related trust account assets for the above bonds are included in the university’s financial statements.
2018 $ 946 $ 341 $ 1,287 2019 1,114 320 1,434 2020 986 299 1,285 2021 2,555 273 2,828 2022 938 243 1,181 2023-2027 3,744 871 4,615 2028-2032 3,861 482 4,343 2033-2037 2,540 87 2,627
$ 16,684 $ 2,916 $ 19,600
Discretely Presented Component UnitsTotalPrincipal Interest
General Receipts Bonds:Series 2008A $ 26,945 $ 20,750 Series 2010A 13,050 4,720 Series 2010D 3,710 3,710
$ 43,705 $ 29,180
Defeased June 30, 2017
Amount
Amount
Outstanding at

Notes to Financial Statements – Years Ended June 30, 2017 and 2016 (dollars in thousands)
2017 Financial Report 60
Special-Purpose General Receipts Bonds
In January 2013, the university issued $337,955 of Special Purpose General Receipts Bonds, Series 2013A. These bonds are solely payable from, and secured by, a pledge of the gross revenues of Special Purpose Revenue Facilities. Special Purpose Revenue Facilities are defined in the Series 2013 Supplement as all housing and dining facilities and such auxiliary facilities as shall constitute recreation facilities owned by the university. The bond indenture agreement includes a debt covenant, requiring the university “to set rates, charges and fees in each Fiscal Year so as to cause Special Purpose Pledged Revenues to be in an amount not less than 1.10 times the aggregate debt service for the then-current Fiscal Year on all Special Purpose General Receipts Obligations.” At June 30, 2017, the university is in compliance with this covenant. Condensed financial information for the Special Purpose Revenue Facilities is provided in Note 21.
Variable Rate Demand Bonds
Series 1997, 1999B1, 2001, 2003C, 2005B, 2008B, 2010E and 2014B variable rate demand bonds bear interest at rates based upon yield evaluations at par of comparable securities. The maximum interest rate allowable and the effective average interest rate from issue date to June 30, 2017 are as follows:
At the discretion of the university, the interest rate on the bonds can be converted to a fixed rate. The bonds may be redeemed by the university or sold by the bondholders to a remarketing agent appointed by the university at any time prior to conversion to a fixed rate at a price equal to the principal amount plus accrued interest.
The university’s variable rate demand bonds mature at various dates through 2044. GASB Interpretation No. 1, Demand Bonds Issued by State and Local Governmental Entities, provides guidance on the statement of net position classification of these bonds. Under GASB Interpretation No. 1, outstanding principal balances on variable rate demand bonds may be classified as non-current liabilities if the issuer has entered into a “take-out agreement” to convert bonds “put” but not resold into some other form of long-term obligation. In the absence
Interest Rate Not Effective Average
Series: to Exceed Interest Rate
1997 12% 1.496%1999B1 12% 1.278%2001 12% 1.067%2003C 12% 1.424%2005B 12% 0.975%2008B 12% 0.317%2010E 8% 0.188%2014B not specified 0.306%

Notes to Financial Statements – Years Ended June 30, 2017 and 2016 (dollars in thousands)
61 The Ohio State University
of such an agreement, the total outstanding principal balances for these bonds are required to be classified as current liabilities.
Although it is the university’s intent to repay its variable rate demand bonds in accordance with the maturities set forth in the bond offering circulars, the university does not have “take-out agreements” in place per the GASB Interpretation No. 1 requirements. Accordingly, the university has classified the total outstanding principal balances on its variable rate demand bonds as current liabilities. The obligations totaled $588,360 and $596,435 at June 30, 2017 and 2016, respectively.
Capital Lease Obligations
Some university equipment items and vehicles are financed as capital leases. The original cost and lease obligations related to these capital leases as of June 30, 2017 are $17,523 and $8,548, respectively. The original cost and lease obligations related to these capital leases as of June 30, 2016 are $13,338 and $4,547, respectively.
Capitalization of Interest
Interest incurred during the construction of capital assets is included in the cost of the assetwhen capitalized. Total interest costs incurred for the years ended June 30, 2017 and 2016for the primary institution were $124,240 and $105,619, respectively. Of these amounts,interest of $3,169 and $11,734 was capitalized in the years ended June 30, 2017 and 2016, respectively. The remaining amounts, $121,071 and $93,885 for the years ended June 30,2017 and 2016, respectively, are reported as interest expense in the statement of revenues,expenses and changes in net position.
NOTE 10 — OPERATING LEASES
The university leases various buildings, office space, and equipment under operating leaseagreements. These facilities and equipment are not recorded as assets on the statement ofnet position. The total rental expense under these agreements was $24,836 and $30,152 forthe years ended June 30, 2017 and 2016, respectively.
Future minimum payments for all significant operating leases with initial or remaining terms in excess of one year as of June 30, 2017 are as follows:

Notes to Financial Statements – Years Ended June 30, 2017 and 2016 (dollars in thousands)
2017 Financial Report 62
NOTE 11 — COMPENSATED ABSENCES
University employees earn vacation and sick leave on a monthly basis.
Classified civil service employees may accrue vacation benefits up to a maximum of three years credit. Administrative and professional staff and faculty may accrue vacation benefits up to a maximum of 240 hours. For all classes of employees, any earned but unused vacation benefit is payable upon termination.
Sick leave may be accrued without limit. However, earned but unused sick leave benefits are payable only upon retirement from the university with ten or more years of service with the state. The amount of sick leave benefit payable at retirement is one fourth of the value of the accrued but unused sick leave up to a maximum of 240 hours.
The university accrues sick leave liability for those employees who are currently eligible to receive termination payments as well as other employees who are expected to become eligible to receive such payments. This liability is calculated using the “termination payment method” which is set forth in Appendix C, Example 4 of the GASB Statement No. 16, Accounting for Compensated Absences. Under the termination method, the university calculates a ratio, Sick Leave Termination Cost per Year Worked, that is based on the university’s actual historical experience of sick leave payouts to terminated employees. This ratio is then applied to the total years-of-service for current employees.
Year Ending June 30, 2018 $ 18,870 $ 1,894 2019 17,335 962 2020 16,621 715 2021 14,694 610 2022 14,060 552 2023-2027 50,321 1,576 2028-2032 29,529 124 2033-2037 2,360 - 2038-2042 836 - 2043-2047 1,077 - 2048-2052 1,068 - 2053-2057 1,368 - 2058-2062 1,368 - 2063 and beyond 1,083 -
Total minimum lease payments $ 170,590 $ 6,433
Primary
Institution
Discretely Presented
Component Units

Notes to Financial Statements – Years Ended June 30, 2017 and 2016 (dollars in thousands)
63 The Ohio State University
Certain employees of the university (mostly classified civil service employees) receive compensation time in lieu of overtime pay. Any unused compensation time must be paid to the employee at termination or retirement.
NOTE 12 — OTHER LIABILITIES
Other liability activity for the primary institution for the year ended June 30, 2017 is as follows:
Other liability activity for the primary institution for the year ended June 30, 2016 is as follows:
NOTE 13 – RENTALS UNDER OPERATING LEASES
The university is the lessor of certain land, buildings, office and retail space under operating lease agreements. Future minimum rental income from non-cancelable operating leases for the primary institution as of June 30, 2017 is as follows:
Compensated absences $ 171,012 $ 18,808 $ 12,613 $ 177,207 $ 12,613 Self-insurance accruals 143,023 316,403 329,556 129,870 48,631 Amounts due to third party payors 71,228 23,781 28,483 66,526 28,494 Obligations under life income agreements 33,225 2,567 1,700 34,092 3,619 Refundable advances for Federal Perkins loans 32,110 - 396 31,714 - Other noncurrent liabilities 113,057 - 11,355 101,702 -
$ 563,655 $ 361,559 $ 384,103 $ 541,111 $ 93,357
CurrentPrimary Institution
Beginning EndingBalance PortionAdditions Reductions Balance
Compensated absences $ 166,356 $ 15,794 $ 11,138 $ 171,012 $ 11,138 Self-insurance accruals 151,261 338,595 346,833 143,023 48,407 Amounts due to third party payors 52,811 62,585 44,168 71,228 28,483 Obligations under life income agreements 28,944 7,721 3,440 33,225 3,949 Refundable advances for Federal Perkins loans 32,228 - 118 32,110 - Other noncurrent liabilities 84,140 28,917 - 113,057 -
$ 515,740 $ 453,612 $ 405,697 $ 563,655 $ 91,977
Additions Reductions Balance
Primary Institution
PortionEnding CurrentBeginning
Balance

Notes to Financial Statements – Years Ended June 30, 2017 and 2016 (dollars in thousands)
2017 Financial Report 64
NOTE 14 – OPERATING EXPENSES BY OBJECT
In accordance with requirements set forth by the Ohio Board of Regents, the university reports operating expenses by functional classification on the Statement of Revenues, Expenses and Other Changes in Net Position. Operating expenses by object for the primary institution for the years ended June 30, 2017 and 2016 are summarized as follows:
Year Ending June 30, 2018 $ 4,868 2019 4,263 2020 3,710 2021 2,867 2022 2,449 2023-2027 8,659 2028-2032 3,991 2033-2037 3,043 2038-2042 1,868 2043-2047 158 2048-2052 53
Total minimum future rentals $ 35,929
Instruction $ 888,236 $ 118,175 $ - $ - $ 1,006,411 Separately budgeted research 340,784 156,724 - - 497,508 Public service 104,285 70,816 - - 175,101 Academic support 180,431 41,612 - - 222,043 Student services 84,593 23,448 - - 108,041 Institutional support 124,620 130,162 - - 254,782 Operation and maintenance of plant 35,143 59,544 - - 94,687 Scholarships and fellowships 7,263 1,697 121,109 - 130,069 Auxiliary enterprises 187,806 125,379 - - 313,185 OSU Health System 1,397,568 1,198,229 - - 2,595,797 Depreciation - - - 374,615 374,615
Total operating expenses $ 3,350,729 $ 1,925,786 $ 121,109 $ 374,615 $ 5,772,239
Primary Institution
Services Fellowships Depreciationand and and
Total
Year Ended June 30, 2017
Compensation Supplies Scholarships
Benefits

Notes to Financial Statements – Years Ended June 30, 2017 and 2016 (dollars in thousands)
65 The Ohio State University
NOTE 15 — RETIREMENT PLANS
University employees are covered by one of three retirement systems. The university faculty is covered by the State Teachers Retirement System of Ohio (STRS Ohio). Substantially all other employees are covered by the Public Employees Retirement System of Ohio (OPERS). Employees may opt out of STRS Ohio and OPERS and participate in the Alternative Retirement Plan (ARP) if they meet certain eligibility requirements.
STRS Ohio and OPERS each offer three separate plans: 1) a defined benefit plan, 2) a defined contribution plan and 3) a combined plan. Each of these three options is discussed in greater detail in the following sections.
Defined Benefit Plans
STRS Ohio and OPERS offer statewide cost-sharing multiple-employer defined benefit pension plans. STRS Ohio and OPERS provide retirement and disability benefits, annual cost-of-living adjustments, and death benefits to plan members and beneficiaries. Benefits are established by state statute and are calculated using formulas that include years of service and final average salary as factors. Both STRS Ohio and OPERS issue separate, publicly available financial reports that include financial statements and required supplemental information. These reports may be obtained by contacting the two organizations.
Instruction $ 866,910 $ 127,377 $ - $ - $ 994,287 Separately budgeted research 296,748 147,329 - - 444,077 Public service 90,729 69,552 - - 160,281 Academic support 169,078 38,610 - - 207,688 Student services 78,115 25,669 - - 103,784 Institutional support 117,693 109,464 - - 227,157 Operation and maintenance of plant 32,547 68,460 - - 101,007 Scholarships and fellowships 6,308 2,189 112,465 - 120,962 Auxiliary enterprises 153,389 100,748 - - 254,137 OSU Health System 1,231,265 1,019,765 - - 2,251,030 Depreciation - - - 351,901 351,901
Total operating expenses $ 3,042,782 $ 1,709,163 $ 112,465 $ 351,901 $ 5,216,311
Year Ended June 30, 2016
Total
Scholarships
Depreciation
Primary InstitutionCompensation
and Benefits
Suppliesand
Servicesand
Fellowships
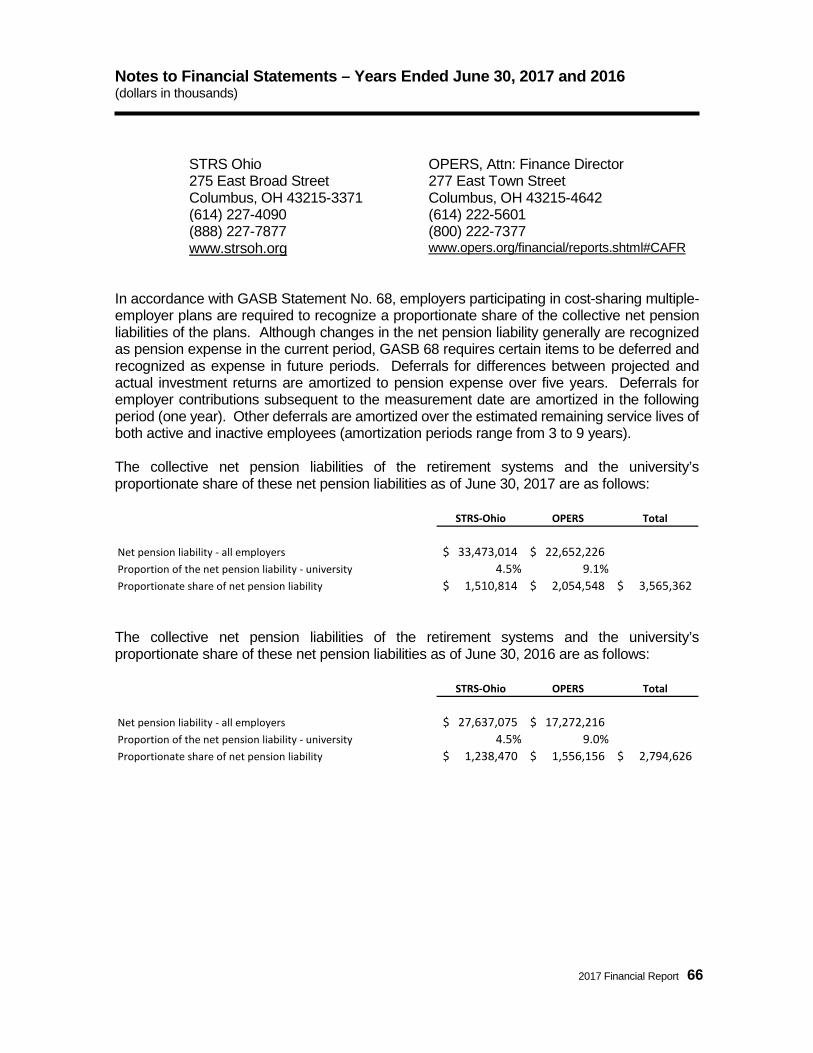
Notes to Financial Statements – Years Ended June 30, 2017 and 2016 (dollars in thousands)
2017 Financial Report 66
STRS Ohio OPERS, Attn: Finance Director 275 East Broad Street 277 East Town Street Columbus, OH 43215-3371 Columbus, OH 43215-4642 (614) 227-4090 (614) 222-5601(888) 227-7877 (800) 222-7377www.strsoh.org www.opers.org/financial/reports.shtml#CAFR
In accordance with GASB Statement No. 68, employers participating in cost-sharing multiple-employer plans are required to recognize a proportionate share of the collective net pension liabilities of the plans. Although changes in the net pension liability generally are recognized as pension expense in the current period, GASB 68 requires certain items to be deferred and recognized as expense in future periods. Deferrals for differences between projected and actual investment returns are amortized to pension expense over five years. Deferrals for employer contributions subsequent to the measurement date are amortized in the following period (one year). Other deferrals are amortized over the estimated remaining service lives of both active and inactive employees (amortization periods range from 3 to 9 years).
The collective net pension liabilities of the retirement systems and the university’s proportionate share of these net pension liabilities as of June 30, 2017 are as follows:
The collective net pension liabilities of the retirement systems and the university’s proportionate share of these net pension liabilities as of June 30, 2016 are as follows:
STRS-Ohio OPERS Total
Net pension liability - all employers 33,473,014$ 22,652,226$ Proportion of the net pension liability - university 4.5% 9.1%Proportionate share of net pension liability 1,510,814$ 2,054,548$ 3,565,362$
STRS-Ohio OPERS Total
Net pension liability - all employers 27,637,075$ 17,272,216$ Proportion of the net pension liability - university 4.5% 9.0%Proportionate share of net pension liability 1,238,470$ 1,556,156$ 2,794,626$

Notes to Financial Statements – Years Ended June 30, 2017 and 2016 (dollars in thousands)
67 The Ohio State University
Deferred outflows of resources and deferred inflows of resources for pensions were related to the following sources as of June 30, 2017:
Deferred outflows of resources and deferred inflows of resources for pensions were related to the following sources as of June 30, 2016:
STRS-Ohio OPERS TotalDeferred Outflows of Resources:Differences between expected and actual experience 61,044$ 3,296$ 64,340$ Changes in assumptions - 329,038 329,038 Net difference between projected and actual earnings 125,438 306,350 431,788 on pension plan investmentsChanges in proportion of university contributions 921 1,163 2,084 University contributions subsequent to the 70,306 94,003 164,309 measurement date Total 257,709$ 733,850$ 991,559$
Deferred Inflows of Resources:Differences between expected and actual experience -$ 16,279$ 16,279$ Changes in proportion of university contributions - 63 63 Total -$ 16,342$ 16,342$
STRS-Ohio OPERS TotalDeferred Outflows of Resources:Differences between expected and actual experience 56,459$ 317$ 56,776$ Net difference between projected and actual earnings - 461,637 461,637 on pension plan investmentsChanges in proportion of university contributions 789 1,343 2,132 University contributions subsequent to the 67,106 88,058 155,164 measurement date Total 124,354$ 551,355$ 675,709$
Deferred Inflows of Resources:Differences between expected and actual experience -$ 33,260$ 33,260$ Net difference between projected and actual earnings 89,069 - 89,069 on pension plan investmentsChanges in proportion of university contributions - 40 40 Total 89,069$ 33,300$ 122,369$

Notes to Financial Statements – Years Ended June 30, 2017 and 2016 (dollars in thousands)
2017 Financial Report 68
Net deferred outflows of resources and deferred inflows of resources related to pensions will be recognized in pension expense during the years ending June 30 as follows:
The following table provides additional details on the pension benefit formulas, contribution requirements and significant assumptions used in the measurement of total pension liabilities for the retirement systems.
STRS-Ohio OPERS Total2018 100,495 352,017 452,512 2019 30,189 266,590 296,779 2020 77,142 108,889 186,031 2021 49,883 (9,353) 40,530 2022 - (277) (277) 2023 and Thereafer - (358) (358) Total 257,709$ 717,508$ 975,217$

Notes to Financial Statements – Years Ended June 30, 2017 and 2016 (dollars in thousands)
69 The Ohio State University
STRS-Ohio OPERS Statutory Authority
Ohio Revised Code Chapter 3307 Ohio Revised Code Chapter 145
Benefit Formula
The annual retirement allowance based on final average salary multiplied by a percentage that varies based on years of service. Effective August 1, 2015, the calculation is 2.2% of final average salary for the five highest years of earnings multiplied by all years of service. Members are eligible to retire at age 60 with five years of qualifying service credit, or at age 55 with 26 years of service, or 31 years of service regardless of age. Eligibility changes will be phased in until August 1, 2026, when retirement eligibility for unreduced benefits will be five years of service credit and age 65, or 35 years of service credit and at least age 60.
Benefits are calculated on the basis of age, final average salary (FAS), and service credit. State and Local members in transition Groups A and B are eligible for retirement benefits at age 60 with 60 contributing months of service credit or at age 55 with 25 or more years of service credit. Group C for State and Local is eligible for retirement at age 57 with 25 years of service or at age 62 with 5 years of service. For Groups A and B, the annual benefit is based on 2.2% of final average salary multiplied by the actual years of service for the first 30 years of service credit and 2.5% for years of service in excess of 30 years. For Group C, the annual benefit applies a factor of 2.2% for the first 35 years and a factor of 2.5% for the years of service in excess of 35. FAS represents the average of the three highest years of earnings over a member’s career for Groups A and B. Group C is based on the average of the five highest years of earnings over a member’s career. The base amount of a member’s pension benefit is locked in upon receipt of the initial benefit payment for calculation of annual cost-of-living adjustment.
Cost-of-Living Adjustments
With certain exceptions, the basic benefit is increased each year by 2% of the original base benefit. For members retiring Aug. 1, 2013, or later, the first 2% is paid on the fifth anniversary of the retirement benefit. In April 2017, STRS-Ohio announced that, effective July 1, 2017, it would indefinitely suspend the annual COLA for all retirees.
Once a benefit recipient retiring under the Traditional Pension Plan has received benefits for 12 months, an annual 3% cost-of-living adjustment is provided on the member’s base benefit.

Notes to Financial Statements – Years Ended June 30, 2017 and 2016 (dollars in thousands)
2017 Financial Report 70
STRS-Ohio OPERS Contribution Rates
Employer and member contribution rates are established by the State Teachers Retirement Board and limited by Chapter 3307 of the Ohio Revised Code. Through June 30, 2016, the employer rate was 14% and the member rate was 13% of covered payroll. The statutory employer rate for fiscal 2017 and subsequent years is 14%. The statutory member contribution rate increased to 14% on July 1, 2016.
Employee and member contribution rates are established by the OPERS Board and limited by Chapter 145 of the Ohio Revised Code. For 2016, employer rates for the State and Local Divisions were 14% of covered payroll (and 18.1% for the Law Enforcement and Public Safety Divisions). Member rates for the State and Local Divisions were 10% of covered payroll (13% for Law Enforcement and 12% for Public Safety).
Measurement Date
June 30, 2016 December 31, 2016
Actuarial Assumptions
Valuation Date: July 1, 2016 Actuarial Cost Method: Individual entry age Investment Rate of Return: 7.75% Inflation: 2.75% Projected Salary Increases: 2.75% - 12.25%Cost-of-Living Adjustments: 2.00%Simple, applied as follows: formembers retiring before August 1,2013, 2% per year; for membersretiring August 1, 2013 or later, 2%COLA commences on fifthanniversary of the retirement date.
Valuation Date: December 31, 2016 Actuarial Cost Method: Individual entry age Investment Rate of Return: 7.5% Inflation: 3.25% Projected Salary Increases: 3.25% - 10.75% Cost-of-Living Adjustments: 3.00% Simple – for those retiring after January 7, 2013, 3.00% Simple through 2018, then 2.15% Simple.
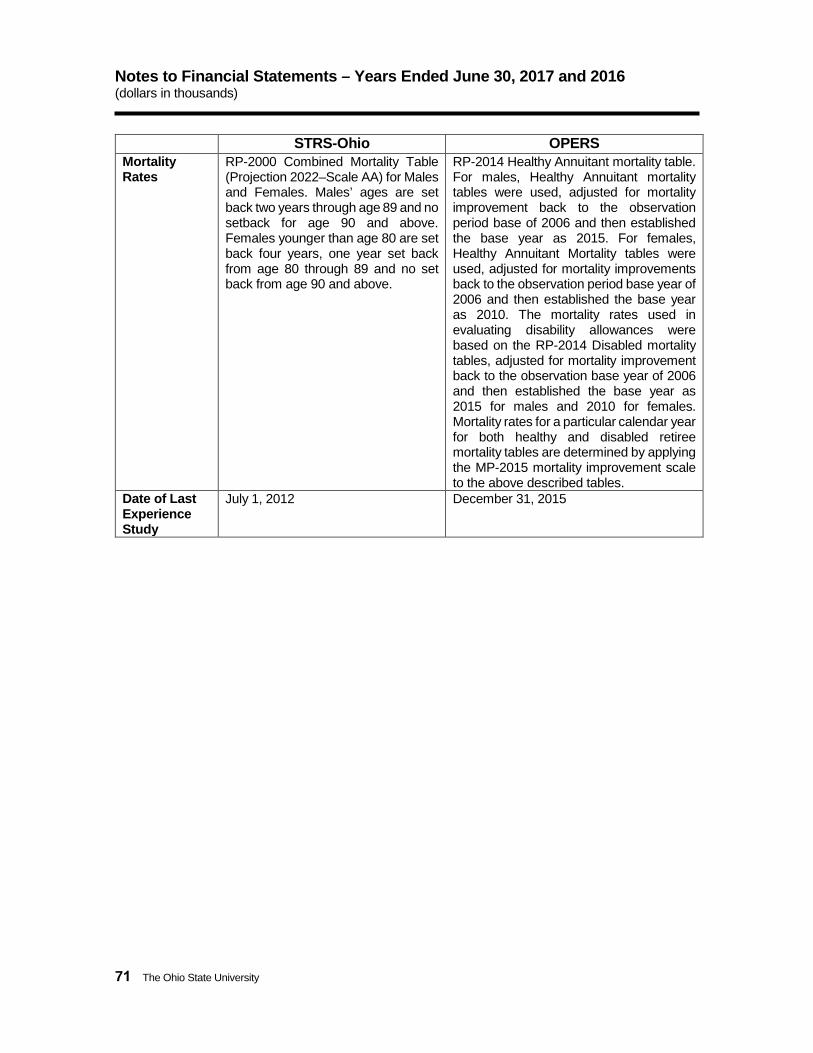
Notes to Financial Statements – Years Ended June 30, 2017 and 2016 (dollars in thousands)
71 The Ohio State University
STRS-Ohio OPERS Mortality Rates
RP-2000 Combined Mortality Table (Projection 2022–Scale AA) for Males and Females. Males’ ages are set back two years through age 89 and no setback for age 90 and above. Females younger than age 80 are set back four years, one year set back from age 80 through 89 and no set back from age 90 and above.
RP-2014 Healthy Annuitant mortality table. For males, Healthy Annuitant mortality tables were used, adjusted for mortality improvement back to the observation period base of 2006 and then established the base year as 2015. For females, Healthy Annuitant Mortality tables were used, adjusted for mortality improvements back to the observation period base year of 2006 and then established the base year as 2010. The mortality rates used in evaluating disability allowances were based on the RP-2014 Disabled mortality tables, adjusted for mortality improvement back to the observation base year of 2006 and then established the base year as 2015 for males and 2010 for females. Mortality rates for a particular calendar year for both healthy and disabled retiree mortality tables are determined by applying the MP-2015 mortality improvement scale to the above described tables.
Date of Last Experience Study
July 1, 2012 December 31, 2015

Notes to Financial Statements – Years Ended June 30, 2017 and 2016 (dollars in thousands)
2017 Financial Report 72
STRS-Ohio OPERS Investment Return Assumptions
The 10 year expected real rate of return on pension plan investments was determined by STRS Ohio’s investment consultant by developing best estimates of expected future real rates of return for each major asset class. The target allocation and long-term expected real rate of return for each major asset class are summarized as follows:
The long term expected rate of return on defined benefit investment assets was determined using a building-block method in which best-estimate ranges of expected future real rates of return are developed for each major asset class. These ranges are combined to produce the long-term expected rate of return by weighting the expected future real rates of return by the target asset allocation percentage, adjusted for inflation. The following table displays the Board-approved asset allocation policy for 2016 and the long-term expected real rates of return:
Long TermTarget Expected
Asset Class Allocation Return*Domestic Equity 31.0% 8.00%International Equity 26.0% 7.85%Alternatives 14.0% 8.00%Fixed Income 18.0% 3.75%Real Estate 10.0% 6.75%Liquidity Reserves 1.0% 3.00% Total 100%
* Returns presented as geometric means
Long TermTarget Expected
Asset Class Allocation Return*Fixed Income 23.0% 2.75%Domestic Equity 20.7% 6.34%Real Estate 10.0% 4.75%Private Equity 10.0% 8.97%International Equity 18.3% 7.95%Other Investments 18.0% 4.92% Total 100.0%
* Returns presented as arithmetic means

Notes to Financial Statements – Years Ended June 30, 2017 and 2016 (dollars in thousands)
STRS-Ohio OPERS Discount Rate The discount rate used to measure
the total pension liability was 7.75% as of June 30, 2016. The projection of cash flows used to determine the discount rate assumes that member and employer contributions will be made at the statutory contribution rates in accordance with the rate increases described above. For this purpose, only employer contributions that are intended to fund benefits of current plan members and their beneficiaries are included. Projected employer contributions that are intended to fund the service costs of future plan members and their beneficiaries, as well as projected contributions from future plan members, are not included. Based on those assumptions, STRS Ohio’s fiduciary net position was projected to be available to make all projected future benefit payments to current plan members as of June 30, 2016. Therefore, the long-term expected rate of return on pension plan investments of 7.75% was applied to all periods of projected benefit payments to determine the total pension liability as of June 30, 2016.
The discount rate used to measure the total pension liability was 7.5% for the Traditional Pension Plan, the Combined Plan and the Member-Directed Plan. The projection of cash flows used to determine the discount rate assumed that contributions from plan members and those of the contributing employers are made at the statutorily required rates. Based on those assumptions, the pension plan’s fiduciary net position was projected to be available to make all projected future benefit payments of current plan members. Therefore, the long-term expected rate of return on pension plan investments was applied to all periods of projected benefit payments to determine the total pension liability.
Sensitivity of Net Pension Liability to Changes in Discount Rate
Changes in Assumptions between Measurement Date and Report Date
In March 2017, the STRS-Ohio Board adopted certain assumption changes, which will impact their annual actuarial valuation prepared as of June 30, 2017. The most significant change is a reduction in the discount rate from 7.75% to 7.45%. Also, in April 2017, the STRS-Ohio Board voted to suspend cost of living adjustments granted on or after July 1, 2017. Although the exact amounts of these changes are not known, they are expected to have a significant impact on net pension liabilities to be reported at June 30, 2018.
Defined Contribution Plans
ARP is a defined contribution pension plan. Full-time administrative and professional staff and faculty may choose enrollment in ARP in lieu of OPERS or STRS Ohio. Classified civil service
73 The Ohio State University
1% Decrease Current Rate 1% Increase(6.75%) (7.75%) (8.75%)
2,007,749$ 1,510,814$ 1,091,620$
1% Decrease Current Rate 1% Increase(6.5%) (7.5%) (8.5%)
3,147,036$ 2,054,548$ 1,144,550$

Notes to Financial Statements – Years Ended June 30, 2017 and 2016 (dollars in thousands)
2017 Financial Report 74
employees hired on or after August 1, 2005 are also eligible to participate in ARP. ARP does not provide disability benefits, annual cost-of-living adjustments, post-retirement health care benefits or death benefits to plan members and beneficiaries. Benefits are entirely dependent on the sum of contributions and investment returns earned by each participant’s choice of investment options.
OPERS also offers a defined contribution plan, the Member-Directed Plan (MD). The MD plan does not provide disability benefits, annual cost-of-living adjustments, post-retirement health care benefits or death benefits to plan members and beneficiaries. Benefits are entirely dependent on the sum of contributions and investment returns earned by each participant’s choice of investment options.
STRS Ohio also offers a defined contribution plan in addition to its long established defined benefit plan. Employer contributions at a rate of 9.5% and all employee contributions are placed in an investment account directed by the employee. Disability benefits are limited to the employee’s account balance. Employees electing the defined contribution plan receive no post-retirement health care benefits.
Combined Plans
STRS Ohio offers a combined plan with features of both a defined contribution plan and a defined benefit plan. In the combined plan, employee contributions are invested in self- directed investments, and the employer contribution is used to fund a reduced defined benefit. Employees electing the combined plan receive post-retirement health care benefits.
OPERS also offers a combined plan. This is a cost-sharing multiple-employer defined benefit plan that has elements of both a defined benefit and defined contribution plan. In the combined plan, employee contributions are invested in self-directed investments, and the employer contribution is used to fund a reduced defined benefit. Employees electing the combined plan receive post-retirement health care benefits. OPERS provides retirement, disability, survivor and post-retirement health benefits to qualifying members of the combined plan.
Summary of Employer Pension Expense
Total pension expense for the year ended June 30, 2017, including employer contributions and accruals associated with recognition of net pension liabilities and related deferrals, is presented below.
Total pension expense for the year ended June 30, 2016, including employer contributions and accruals associated with recognition of net pension liabilities and related deferrals, is presented below.
STRS-Ohio OPERS ARP TotalEmployer Contributions 70,373$ 188,762$ 56,425$ 315,560$ GASB 68 Accruals 49,919 298,941 348,860 Total Pension Expense 120,292$ 487,703$ 56,425$ 664,420$

Notes to Financial Statements – Years Ended June 30, 2017 and 2016 (dollars in thousands)
Pension expense is allocated to institutional functions on the Statement of Revenues, Expenses and Other Changes in Net Position.
Post-Retirement Health Care Benefits
STRS Ohio currently provides access to health care coverage to retirees who participated in the defined benefit or combined plans and their dependents. Coverage under the current program includes hospitalization, physicians’ fees, prescription drugs, and partial reimbursement of monthly Medicare Part B premiums. Pursuant to ORC, STRS Ohio has discretionary authority over how much, if any, of the associated health care costs will be absorbed by STRS Ohio. All benefit recipients pay a portion of the health care costs in the form of monthly premiums. Under ORC, medical costs paid from the funds of STRS Ohio are included in the employer contribution rate. For the fiscal year ended June 30, 2016, STRS Ohio made no allocation of employer contributions for post-employment health care.
OPERS currently provides post-employment health care benefits to retirees with ten or more years of qualifying service credit. These benefits are advance-funded on an actuarially determined basis and are financed through employer contributions and investment earnings. OPERS determines the amount, if any, of the associated health care costs that will be absorbed by OPERS. Under Ohio Revised Code (ORC), funding for medical costs paid from the funds of OPERS is included in the employer contribution rate. For calendar years 2016 and 2017, OPERS allocated 2.0% and 1.0%, respectively, of the employer contribution rate to fund the health care program for retirees.
OSU Physicians Retirement Plan
Retirement benefits are provided for the employees of OSUP through a tax-sheltered 403(b) and 401(a) program administered by an insurance company. OSUP is required to make nondiscretionary contributions of no less than 7.5% under the Interim Retirement Plan; however, some subsidiaries make an additional discretionary contribution of up to 17.5%, for a range of total employer contributions of 7.5% to 25%. Employees are allowed, but not required, to make contributions to the 403(b) plan. OSUP’s share of the cost of these benefits was $4,619 and $3,949 for the years ended June 30, 2017 and 2016, respectively.
Employee contributions were $1,745 and $1,603 for the years ended June 30, 2017 and 2016.
75 The Ohio State University
STRS-Ohio OPERS ARP TotalEmployer Contributions 66,975$ 178,293$ 53,423$ 298,691$ GASB 68 Accruals 11,006 100,197 111,203 Total Pension Expense 77,981$ 278,490$ 53,423$ 409,894$
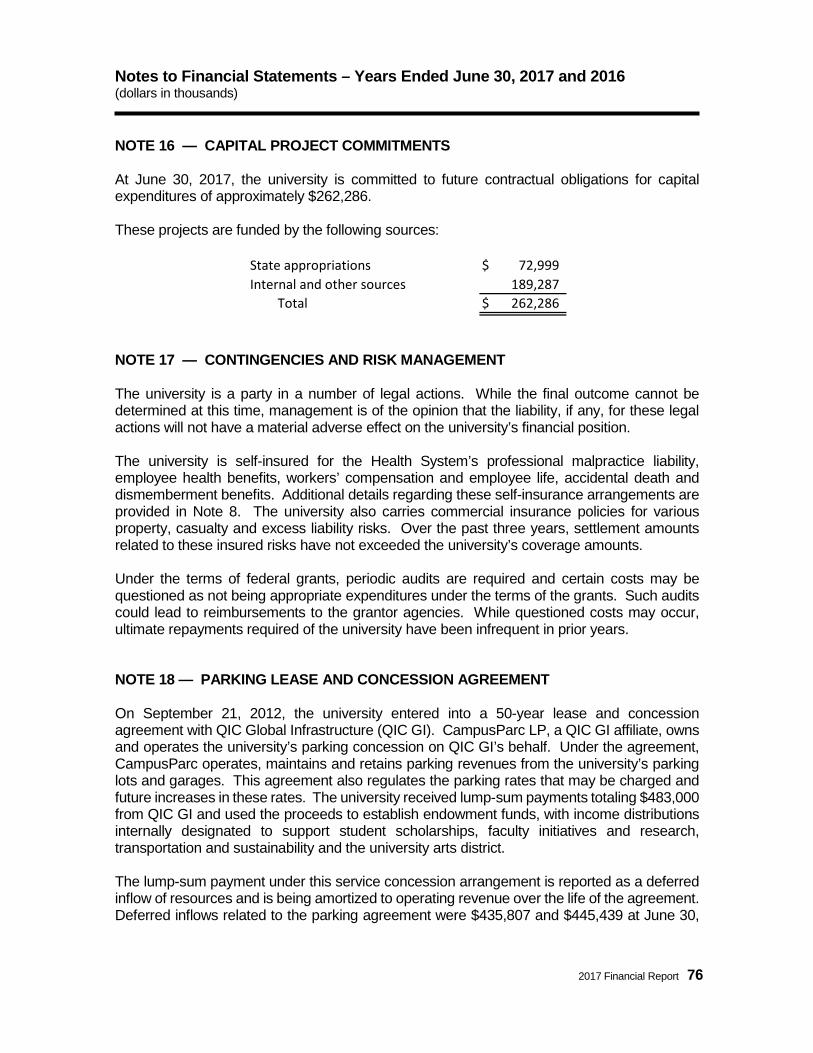
Notes to Financial Statements – Years Ended June 30, 2017 and 2016 (dollars in thousands)
2017 Financial Report 76
NOTE 16 — CAPITAL PROJECT COMMITMENTS
At June 30, 2017, the university is committed to future contractual obligations for capital expenditures of approximately $262,286.
These projects are funded by the following sources:
NOTE 17 — CONTINGENCIES AND RISK MANAGEMENT
The university is a party in a number of legal actions. While the final outcome cannot be determined at this time, management is of the opinion that the liability, if any, for these legal actions will not have a material adverse effect on the university’s financial position.
The university is self-insured for the Health System’s professional malpractice liability, employee health benefits, workers’ compensation and employee life, accidental death and dismemberment benefits. Additional details regarding these self-insurance arrangements are provided in Note 8. The university also carries commercial insurance policies for various property, casualty and excess liability risks. Over the past three years, settlement amounts related to these insured risks have not exceeded the university’s coverage amounts.
Under the terms of federal grants, periodic audits are required and certain costs may be questioned as not being appropriate expenditures under the terms of the grants. Such audits could lead to reimbursements to the grantor agencies. While questioned costs may occur, ultimate repayments required of the university have been infrequent in prior years.
NOTE 18 — PARKING LEASE AND CONCESSION AGREEMENT
On September 21, 2012, the university entered into a 50-year lease and concession agreement with QIC Global Infrastructure (QIC GI). CampusParc LP, a QIC GI affiliate, owns and operates the university’s parking concession on QIC GI’s behalf. Under the agreement, CampusParc operates, maintains and retains parking revenues from the university’s parking lots and garages. This agreement also regulates the parking rates that may be charged and future increases in these rates. The university received lump-sum payments totaling $483,000 from QIC GI and used the proceeds to establish endowment funds, with income distributions internally designated to support student scholarships, faculty initiatives and research, transportation and sustainability and the university arts district.
The lump-sum payment under this service concession arrangement is reported as a deferred inflow of resources and is being amortized to operating revenue over the life of the agreement. Deferred inflows related to the parking agreement were $435,807 and $445,439 at June 30,
State appropriations $ 72,999 Internal and other sources 189,287
Total $ 262,286

Notes to Financial Statements – Years Ended June 30, 2017 and 2016 (dollars in thousands)
77 The Ohio State University
2017 and 2016, respectively. The university reports the parking lots and garages as capital assets with a carrying amount of $124,417 and $124,985 at June 30, 2017 and 2016, respectively.
NOTE 19 – COMBINING INFORMATION FOR BLENDED COMPONENT UNITS
As indicated in the Basis of Presentation in Note 1, the university consolidates certain component units in a blended presentation. Condensed combining financial information for the years ended June 30, 2017 and 2016 is presented below.
Condensed Combining Information – Year Ended June 30, 2017
OSU OSU OvalFoundation Health Plan Limited
Condensed statements of net position: Current assets 47,236$ 6,252$ 50,634$ Capital assets, net 3,271 168 - Other assets 1,002,456 585 - Total assets 1,052,963$ 7,005$ 50,634$
Current liabilities 3,748$ 2,546$ 44$ Noncurrent liabilities 48,025 467 21,895 Amounts payable to the university 1,853 - - Total liabilities 53,626 3,013 21,939
Net investment in capital assets 3,271 - - Restricted: Nonexpendable 824,383 - - Expendable 158,733 - - Unrestricted 12,950 3,992 28,695 Total net position 999,337 3,992 28,695 Total liabilities and net position 1,052,963$ 7,005$ 50,634$

Notes to Financial Statements – Years Ended June 30, 2017 and 2016 (dollars in thousands)
2017 Financial Report 78
OSU OSU OvalFoundation Health Plan Limited
Condensed statements of revenues, expenses and changes in net position: Operating revenues: Other sales, services and rental income 1,885$ 10,730$ 1,406$ Total operating revenues 1,885 10,730 1,406
Operating expenses, excluding depreciation 22,380 10,787 193 Depreciation expense 247 - - Total operating expenses 22,627 10,787 193
Net operating income (loss) (20,742) (57) 1,213
Non-operating revenues and expenses: Gifts for current use 179,912 - - Net investment income (loss) 116,623 - 3,010 Net non-operating revenue (expense) 296,535 - 3,010
Capital contributions and additions to 79,229 - - permanent endowments Transfers from (to) the university (235,448) - -
Change in net position 119,574 (57) 4,223
Beginning net position 879,763 4,049 24,472 Ending net position 999,337$ 3,992$ 28,695$
Condensed statements of cash flows: Net cash provided (used) by: Operating activities (19,578)$ 1,817$ (1,264)$ Noncapital financing activities (6,519) (2,081) - Capital and related financing activities 26,771 (138) - Investing activities 1,195 62 3,023 Net increase (decrease) in cash 1,869 (340) 1,759
Beginning cash and cash equivalents 2,494 5,994 1,758 Ending cash and cash equivalents 4,363$ 5,654$ 3,517$

Notes to Financial Statements – Years Ended June 30, 2017 and 2016 (dollars in thousands)
79 The Ohio State University
Condensed Combining Information – Year Ended June 30, 2016
OSU OSU OvalFoundation Health Plan Limited
Condensed statements of net position: Current assets 47,947$ 6,764$ 51,449$ Capital assets, net 3,518 31 - Other assets 879,169 648 - Amounts receivable from the university - - - Deferred outflows - - - Total assets and deferred outflows 930,634$ 7,443$ 51,449$
Current liabilities 3,881$ 885$ 50$ Noncurrent liabilities 45,442 428 26,927 Amounts payable to the university 1,548 2,081 - Deferred inflows - - - Total liabilities and deferred inflows 50,871 3,394 26,977
Net investment in capital assets 3,518 - - Restricted: Nonexpendable 744,159 - - Expendable 121,124 - - Unrestricted 10,962 4,049 24,472 Total net position 879,763 4,049 24,472 Total liabilities, deferred inflows and net position 930,634$ 7,443$ 51,449$

Notes to Financial Statements – Years Ended June 30, 2017 and 2016 (dollars in thousands)
2017 Financial Report 80
OSU OSU OvalFoundation Health Plan Limited
Condensed statements of revenues, expenses and changes in net position: Operating revenues: Grants and contracts -$ -$ -$ Sales and services of OSU Physicians - - - Other sales, services and rental income 1,846 12,138 759 Other operating - - - Total operating revenues 1,846 12,138 759
Operating expenses, excluding depreciation 22,531 11,581 152 Depreciation expense 247 - - Total operating expenses 22,778 11,581 152
Net operating income (loss) (20,932) 557 607
Non-operating revenues and expenses: Gifts for current use 156,737 - - Net investment income (loss) (12,441) - 502 Interest expense - - - Other non-operating revenue (expense) - - - Net non-operating revenue (expense) 144,296 - 502
Capital contributions and additions to 75,415 - - permanent endowments Transfers from (to) the university (197,297) - -
Change in net position 1,482 557 1,109
Beginning net position 878,281 3,492 23,363 Ending net position 879,763$ 4,049$ 24,472$
Condensed statements of cash flows: Net cash provided (used) by: Operating activities (19,660)$ 39$ 1,198$ Noncapital financing activities 29,991 1,332 - Capital and related financing activities 10,422 104 - Investing activities (21,536) (31) (12,295) Net increase (decrease) in cash (783) 1,444 (11,097)
Beginning cash and cash equivalents 3,276 4,551 12,854 Ending cash and cash equivalents 2,493$ 5,995$ 1,757$

Notes to Financial Statements – Years Ended June 30, 2017 and 2016 (dollars in thousands)
81 The Ohio State University
NOTE 20 – COMBINING INFORMATION FOR DISCRETELY PRESENTED COMPONENT UNITS
As indicated in the Basis of Presentation in Note 1, the university consolidates certain component units in a discrete presentation. Condensed combining financial information for the years ended June 30, 2017 and 2016 is presented below.
Condensed Combining Information – Year Ended June 30, 2017
Transportation DentalOSU Campus Research Faculty
Physicians Partners Center Practice Plan
Condensed statements of net position: Current assets 164,004$ 9,581$ 11,319$ 1,485$ Capital assets, net 24,330 88,410 9,341 86 Other assets 1,602 2,612 - - Amounts receivable from the university 8,663 - 4,002 - Deferred outflows - - 155 - Total assets and deferred outflows 198,599$ 100,603$ 24,817$ 1,571$
Current liabilities 12,719$ 7,370$ 7,724$ 55$ Noncurrent liabilities 13,931 25,373 382 - Amounts payable to the university 19,401 77,894 6,000 - Deferred inflows - - 10 - Total liabilities and deferred inflows 46,051 110,637 14,116 55
Net investment in capital assets 9,640 86,363 9,341 86 Unrestricted 142,908 (96,397) 1,360 1,430 Total net position 152,548 (10,034) 10,701 1,516 Total liabilities, deferred inflows and net position 198,599$ 100,603$ 24,817$ 1,571$

Notes to Financial Statements – Years Ended June 30, 2017 and 2016 (dollars in thousands)
2017 Financial Report 82
Transportation DentalOSU Campus Research Faculty
Physicians Partners Center Practice PlanCondensed statements of revenues, expenses and changes in net position: Operating revenues: Grants and contracts -$ 12,693$ 47,007$ -$ Sales and services of OSU Physicians 496,364 - - - Other sales, services and rental income - - - 8,935 Total operating revenues 496,364 12,693 47,007 8,935
Operating expenses, excluding depreciation 444,362 10,779 46,417 6,079 Depreciation expense 3,740 3,121 250 27 Total operating expenses 448,102 13,900 46,667 6,106
Net operating income (loss) 48,262 (1,207) 340 2,829
Non-operating revenues and expenses: Net investment income (loss) 215 103 163 - Interest expense (369) (1,154) (61) - Other non-operating revenue (expense) (18,605) (9,451) - (2,713) Net non-operating revenue (expense) (18,759) (10,502) 102 (2,713)
Change in net position 29,503 (11,709) 442 116
Beginning net position 123,045 1,675 10,259 1,400
Ending net position 152,548$ (10,034)$ 10,701$ 1,516$
Condensed statements of cash flows: Net cash provided (used) by: Operating activities 58,225$ 6,596$ 174$ 2,883$ Noncapital financing activities (18,604) (1,519) 5,667 (2,714) Capital and related financing activities (5,049) (3,742) (4,587) (70) Investing activities 1,357 39 162 (92) Net increase (decrease) in cash 35,929 1,374 1,416 7
Beginning cash and cash equivalents 79,695 5,975 937 394 Ending cash and cash equivalents 115,624$ 7,349$ 2,353$ 401$
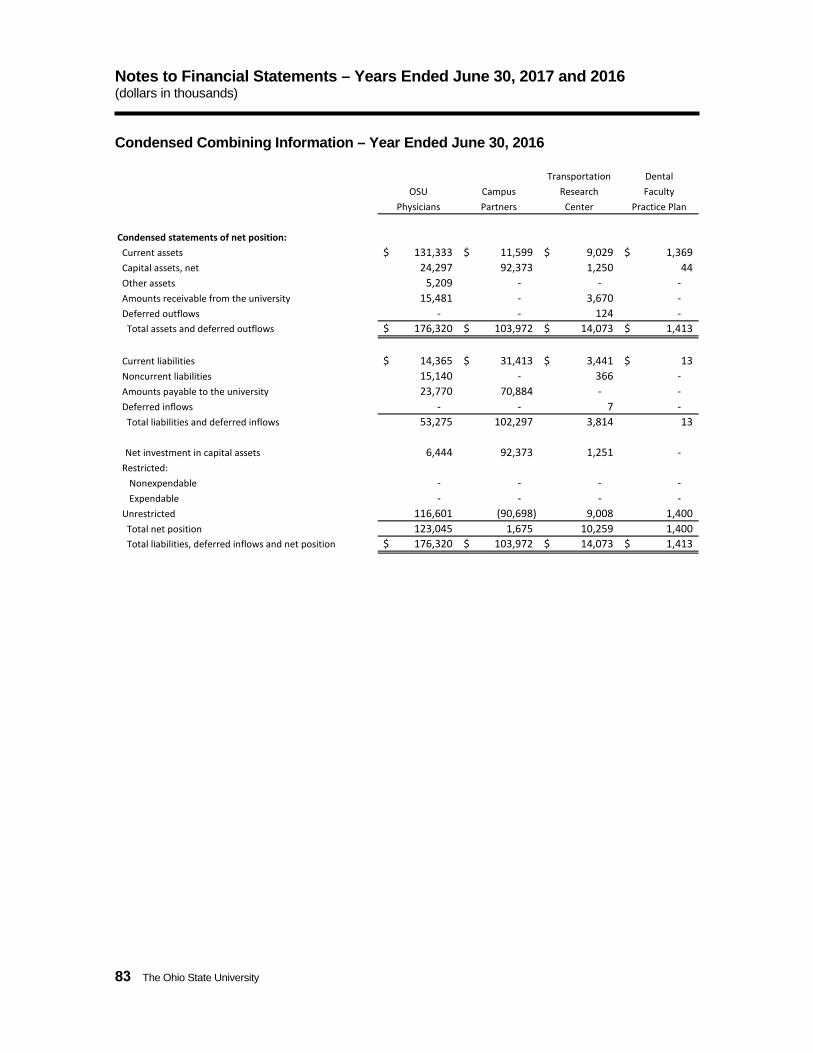
Notes to Financial Statements – Years Ended June 30, 2017 and 2016 (dollars in thousands)
83 The Ohio State University
Condensed Combining Information – Year Ended June 30, 2016
Transportation DentalOSU Campus Research Faculty
Physicians Partners Center Practice Plan
Condensed statements of net position: Current assets 131,333$ 11,599$ 9,029$ 1,369$ Capital assets, net 24,297 92,373 1,250 44 Other assets 5,209 - - - Amounts receivable from the university 15,481 - 3,670 - Deferred outflows - - 124 - Total assets and deferred outflows 176,320$ 103,972$ 14,073$ 1,413$
Current liabilities 14,365$ 31,413$ 3,441$ 13$ Noncurrent liabilities 15,140 - 366 - Amounts payable to the university 23,770 70,884 - - Deferred inflows - - 7 - Total liabilities and deferred inflows 53,275 102,297 3,814 13
Net investment in capital assets 6,444 92,373 1,251 - Restricted: Nonexpendable - - - - Expendable - - - - Unrestricted 116,601 (90,698) 9,008 1,400 Total net position 123,045 1,675 10,259 1,400 Total liabilities, deferred inflows and net position 176,320$ 103,972$ 14,073$ 1,413$

Notes to Financial Statements – Years Ended June 30, 2017 and 2016 (dollars in thousands)
2017 Financial Report 84
Transportation DentalOSU Campus Research Faculty
Physicians Partners Center Practice PlanCondensed statements of revenues, expenses and changes in net position: Operating revenues: Grants and contracts -$ 8,498$ 44,456$ -$ Sales and services of OSU Physicians 487,429 - - - Other sales, services and rental income - - - 8,758 Other operating - - - - Total operating revenues 487,429 8,498 44,456 8,758
Operating expenses, excluding depreciation 441,333 9,816 44,052 5,452 Depreciation expense 4,326 1,821 242 36 Total operating expenses 445,659 11,637 44,294 5,488
Net operating income (loss) 41,770 (3,139) 162 3,270
Non-operating revenues and expenses: Gifts for current use - - - - Net investment income (loss) 76 (91) (154) - Interest expense (395) (1,215) - - Other non-operating revenue (expense) (9,422) 4,044 - (3,172) Net non-operating revenue (expense) (9,741) 2,738 (154) (3,172)
Capital contributions and additions to - 3,789 - - permanent endowments
Change in net position 32,029 3,388 8 98
Beginning net position 91,016 (1,713) 10,251 1,302
Ending net position 123,045$ 1,675$ 10,259$ 1,400$
Condensed statements of cash flows: Net cash provided (used) by: Operating activities 28,792$ 26,882$ (374)$ 3,276$ Noncapital financing activities (9,422) 15,283 306 (3,172) Capital and related financing activities (3,703) (42,232) (977) - Investing activities (4,079) (91) (154) (34) Net increase (decrease) in cash 11,588 (158) (1,199) 70
Beginning cash and cash equivalents 68,107 6,134 2,139 324 Ending cash and cash equivalents 79,695$ 5,976$ 940$ 394$

Notes to Financial Statements – Years Ended June 30, 2017 and 2016 (dollars in thousands)
85 The Ohio State University
NOTE 21 – SEGMENT INFORMATION
A segment is an identifiable activity for which one or more revenue bonds are outstanding. A segment has a specific identifiable revenue stream pledged in support of revenue bonds or other revenue-backed debt and has related expenses, gains, losses, assets and liabilities that can be identified. The university has one segment that meets the GASB reporting requirements.
The Office of Student Life operates student housing, dining and recreational sports facilities on the university’s main and regional campuses. In January 2013, the university issued $337,955 of Special Purpose General Receipts Bonds, Series 2013A. These bonds are solely payable from, and secured by, a pledge of the gross revenues of Special Purpose Revenue Facilities. Special Purpose Revenue Facilities are defined in the Series 2013 Supplement as all housing and dining facilities and such auxiliary facilities as shall constitute recreation facilities owned by the university. Special Purpose Pledged Revenues include all revenues, fees, rentals, rates, charges, insurance proceeds and other moneys derived from the ownership or operation of these facilities. Special Purpose Pledged Revenues totaled $213,564 and $172,002 for the years ended June 30, 2017 and 2016, respectively.
Condensed financial information for the Special Purpose Revenue Facilities, before the elimination of certain intra-university transactions, as of and for the years ended June 30, 2017 and 2016 is as follows:

Notes to Financial Statements – Years Ended June 30, 2017 and 2016 (dollars in thousands)
2017 Financial Report 86
Segment Disclosure Information – Year Ended June 30, 2017 and June 30, 2016
2017 2016Condensed Statement of Net PositionAssets and deferred outflows: Current assets 26,022$ 24,926$ Capital assets 725,840 728,836 Other assets 2,356 35,464 Total assets 754,218$ 789,226$ Liabilities and deferred inflows: Current liabilities 7,365$ 6,943$ Amounts payable to the university 755,890 784,135 Total liabilities 763,255 791,078 Net position:
Net investment in capital assets (27,695) (19,835) Unrestricted 18,658 17,983 Total net position (9,037) (1,852) Total liabilities and net position 754,218$ 789,226$
2017 2016Condensed Statement of Revenues, Expenses and Changes in Net Position Special-purpose pledged revenues - operating 213,564$ 172,002$ Operating expenses, excluding depreciation (141,323) (121,182) Depreciation expense (32,604) (28,110) Operating income 39,637 22,710 Nonoperating revenues, net (32,499) (33,326) Net income (loss) before transfers 7,138 (10,616) Transfers from (to) other university units, net (14,323) 8,366 Increase (decrease) in net position (7,185) (2,250) Beginning net position (1,852) 398 Ending net position (9,037)$ (1,852)$
Condensed Statement of Cash Flows Net cash provided (used) by: Operating activities 533,452$ 402,744$ Capital and related financing activities (565,713) (531,575) Investing activities 180 95 Net increase (decrease) in cash (32,081) (128,736) Beginning cash and cash equivalents 59,242 187,978 Ending cash and cash equivalents 27,161$ 59,242$

Notes to Financial Statements – Years Ended June 30, 2017 and 2016 (dollars in thousands)
87 The Ohio State University
NOTE 22 – SUBSEQUENT EVENTS
On April 10, 2017, the university entered into a 50-year agreement to lease the university’s utility system to Ohio State Energy Partners and grant it the exclusive right to operate the utility system and provide utility services to the Columbus campus. On Ju ly 6 , 2017 , the university received an upfront payment of $1,089,875. The agreement includes the sale of certain utility-related equipment assets, which will be recognized in Fiscal Year 2018. The majority of the remainder of the upfront payment will be recorded as unearned revenues and amortized to revenue on a straight-line basis over the life of the agreement.
Related to this transaction, the university entered into an interest-rate swap agreement with a bank on April 10, 2017 for a notional amount of $397,000 to hedge interest-rate risk prior to the closing of the utility lease and concession agreement. The university terminated the swap on May 26, 2017 and made a $15,713 payment on July 6, 2017. This payment was reflected in the university’s June 30, 2017 financial statements as a non-operating loss and a corresponding current liability.

2017 Financial Report 88
The Ohio State University Required Supplementary Information on GASB 68 Pension Liabilities
Year Ended June 30, 2017 (Unaudited)
The schedule of the university’s proportionate shares of STRS-Ohio and OPERS net pension liabilities are presented below:
The schedule of the university’s contributions to STRS-Ohio and OPERS are presented below:
(dollars in thousands) STRS-Ohio OPERS STRS-Ohio OPERS STRS-Ohio OPERS
4.5% 9.1% 4.5% 9.0% 4.4% 8.8%
1,510,814$ 2,054,548$ 1,238,470$ 1,556,156$ 1,070,914$ 1,059,519$
392,797$ 1,289,346$ 388,309$ 1,236,914$ 381,669$ 1,188,828$
385% 159% 319% 126% 281% 89%
66.8% 77.4% 72.1% 81.2% 74.7% 86.5%
20152016
Plan fiduciary net position as a percentage of the total pension liability
2017
University's proportion of the net pension liability
University's proportionate share of the net pension liability
University's covered payroll
University's proportionate share of the net pension liability as a percentage of its covered payroll
(dollars in thousands) STRS-Ohio OPERS STRS-Ohio OPERS STRS-Ohio OPERS
70,373$ 188,762$ 66,975$ 178,293$ 65,738$ 170,979$
70,373$ 188,762$ 66,975$ 178,293$ 65,738$ 170,979$
-$ -$ -$ -$ -$ -$
412,149$ 1,334,350$ 392,797$ 1,260,366$ 388,309$ 1,208,710$
17.1% 14.1% 17.1% 14.1% 16.9% 14.1%
20152016
Contributions as a percentage of covered payroll
Contractually required contribution
Contributions in relation to the contractually required contribution
Contribution deficiency (excess)
University's covered payroll
2017

The Ohio State University Supplementary Information on the Long-Term Investment Pool
Year Ended June 30, 2017 (Unaudited)
The following section of the financial report provides additional information on the university’s Long-Term Investment Pool, including a summary of changes in market value, investment returns and related expenses. Additional details on university investments, including asset allocations, endowment distribution policies, investment by type and risk disclosures, are provided in Notes 1 and 3 to the Financial Statements.
In 2017, the market value of the university’s Long-Term Investment Pool – which includes gifted endowments, long-term investments of university operating funds and other funds internally designated to function as endowments – increased $637 million, to $4.25 billion at June 30, 2017. The Long-Term Investment Pool activity for 2017 is summarized below:
Long-Term Investment Pool Activity (in thousands)
University Foundation Operating Designated Total
Balance at June 30, 2016 977,173$ 763,332$ 1,203,959$ 672,098$ 3,616,562$
Net Principal: Additions/(Withdrawals) 5,966 49,557 (1,309) 269,850 324,064
Change in Fair Value 120,236 97,309 147,630 107,583 472,758
Income Earned 20,242 16,286 24,852 17,604 78,984
Distributions (42,767) (34,316) (52,604) (36,923) (166,610)
Expenses (18,529) (14,907) (22,749) (16,114) (72,299)
Balance at June 30, 2017 1,062,321$ 877,261$ 1,299,779$ 1,014,098$ 4,253,459$
Gifted Endowments Quasi - Endowments
Net principal additions (withdrawals) for gifted endowments include new endowment gifts and reinvestment of unused endowment distributions. Change in fair value includes realized gains and losses for assets sold during the year and unrealized gains and losses for assets held in the pool at June 30, 2017. Income earned includes interest and dividends and is used primarily to fund distributions. Expenses include investment management expenses ($55 million), University Development related expenses ($16 million) and other investment related expenses ($1 million).
Investment Returns and Expenses:
The investment return for the Long-Term Investment Pool was 14.5% for fiscal year 2017. The annualized investment returns for the three-year and five-year periods were 4.7% and 7.9%, respectively. These returns -- which are net of investment management expenses as defined by Cambridge Associates for its annual survey -- are used for comparison purposes with other endowments and various benchmarks. In addition to the $55 million of investment management expenses, which reduced the pool
89 The Ohio State University
2017 Financial Report 90
by 1.5% in fiscal year 2017, the $16 million of University Development expenses and $1 million of other investment related expenses further reduced the pool by 0.5%.
Additional Information:
For more information on how the Long-Term Investment Pool is invested, please visit the Office of Investments website at: investments.osu.edu.
Additional details on university and foundation endowments, including balances for individual funds, are available on the Office of the Controller’s website at: go.osu.edu/EndowAdmin (click on the “Endowment Descriptions and Balances” link).

See Accompanying Notes to the Schedule of Expenditures of Federal Awards 91
THE OHIO STATE UNIVERSITYSCHEDULE OF EXPENDITURES OF FEDERAL AWARDSFOR THE YEAR ENDED JUNE 30, 2017
CFDA Federal Expenditures
Number Federal Agency Sponsor Expenditures to Subrecipients
Research and Development Cluster —
Funds received directly from the following agencies
Department of Agriculture
10.001 USDA Agricultural Res Service 1,002,212$ -$
10.001 USDA Forest Service 1,787 -
10.025 Animal & Plant Health Inspection Service 132,623 13,475
10.168 Agricultural Marketing Service 54,335 -
10.200 National Institute of Food & Agriculture 10,307 -
10.202 Cooperative Forestry Research 395,680 -
10.203 Pmts to Agricult Exp Station 7,018,227 -
10.207 Animal Health & Disease Research 79,268 -
10.207 National Institute of Food & Agriculture 5,668 -
10.210 National Institute of Food & Agriculture 52,338 -
10.217 National Institute of Food & Agriculture 233,770 164,316
10.219 National Institute of Food & Agriculture (21,043) -
10.250 Economic Res Service 3,864 -
10.290 USDA Office of the Chief Economist 95,150 25,000
10.303 National Institute of Food & Agriculture 385,957 63,348
10.307 National Institute of Food & Agriculture 421,144 -
10.309 National Institute of Food & Agriculture 30,044 -
10.310 National Institute of Food & Agriculture 4,696,459 1,137,740
10.310 US Department of Agriculture 5,426 -
10.311 National Institute of Food & Agriculture 68,176 5,562
10.312 National Institute of Food & Agriculture 1,338,381 662,660
10.329 National Institute of Food & Agriculture 297,021 -
10.RD National Institute of Food & Agriculture 285,063 -
10.500 National Institute of Food & Agriculture 1,507,878 29,681
10.652 USDA Forest Service (4,333) -
10.680 USDA Forest Service 10,059 4,032
10.771 USDA Rural Development 185,924 -
10.902 Natural Resources Conservation Service (61) -
10.903 Natural Resources Conservation Service 65,398 -
10.912 Natural Resources Conservation Service 63,974 -
Total Department of Agriculture Direct Awards 18,420,696 2,105,814
Department of Commerce
11.417 Nat Oceanic & Atmospheric Admin 1,809,256 716,858
11.431 Nat Oceanic & Atmospheric Admin 106,268 -
Total Department of Commerce Direct Awards 1,915,524 716,858
Department of Defense
12.300 Nav Postgraduate School 34,286 -

See Accompanying Notes to the Schedule of Expenditures of Federal Awards 92
THE OHIO STATE UNIVERSITYSCHEDULE OF EXPENDITURES OF FEDERAL AWARDSFOR THE YEAR ENDED JUNE 30, 2017
CFDA Federal Expenditures
Number Federal Agency Sponsor Expenditures to Subrecipients
Research and Development Cluster —
Funds received directly from the following agencies
12.300 Office of Naval Res 2,914,094 16,117
12.351 Defense Threat Reduction Agency 1,168,531 502,273
12.420 Army Medical Res & Materiel Command 6,402 - 12.420 Army Medical Res Acquisition Activity 2,787,572 406,693
12.431 Army 105,548 7,367
12.431 Army Res Office 2,586,598 757,672
12.431 Army Research, Development and Eng Cmd 115,149 -
12.500 Secretary of Defense Historical Office 35,369 -
12.500 Air Force Test Center 13,563 -
12.500 Air Force Research Laboratory 665,008 -
12.500 Army 13,627 -
12.500 Army Corps of Engineers 295,460 27,594
12.500 Army Natick Res, Dev & Eng Ctr 515 -
12.500 Army Medical Res Acquisition Activity 156,662 -
12.500 Nat Geospatial-Intelligence Agcy 267,646 -
12.502 Nat Reconnaissance Office 11,799 -
12.502 Defense Threat Reduction Agency 583,286 527,972
12.632 Army Corps of Engineers 3,693 -
12.75 Uniformed Services Univ Health Sci's - -
12.8 Air Force Office of Scientific Res 3,912,606 840,649
12.8 Air Force Research Laboratory 1,666,101 771,812
12.8 Air Force Academy 563,665 -
12.901 Nat Security Agency 32,856 -
12.91 Defense Advanced Res Projects Agency 258,119 -
Total Department of Defense Direct Awards 18,198,155 3,858,149
Department of Housing and Urban Development
14.506 Dept of Housing & Urban Dev 189,103 43,000
Total Department of Housing and Urban Development Direct Awards 189,103 43,000
Department of the Interior
15.229 Bureau of Land Management 184,213 -
15.232 Bureau of Land Management 106,052 29,358
15.255 Ofc Surface Mining Reclam & Enforcement 37,593 -
15.608 US Fish and Wildlife Service 6,176 -
15.655 US Fish and Wildlife Service 12,408 -
15.657 US Fish and Wildlife Service 14,407 -
15.805 US Geological Survey 68,613 18,669
Total Department of the Interior Direct Awards 429,462 48,027

See Accompanying Notes to the Schedule of Expenditures of Federal Awards 93
THE OHIO STATE UNIVERSITYSCHEDULE OF EXPENDITURES OF FEDERAL AWARDSFOR THE YEAR ENDED JUNE 30, 2017
CFDA Federal Expenditures
Number Federal Agency Sponsor Expenditures to Subrecipients
Research and Development Cluster —
Funds received directly from the following agencies
Department of Labor
17.RD Bureau of Labor Statistics 12,203,816 8,246,257
Total Department of Labor 12,203,816 8,246,257
Department of State
19.040 US Department of State 70,061 -
Total Department of State 70,061 -
Department of Transportation
20.108 Federal Aviation Administration 378,916 -
20.109 Federal Aviation Administration 986,171 2,762
20.514 Federal Transit Administration (267) -
20.701 US Department of Transportation 1,040,878 571,454
20.820 Federal Aviation Administration 32,046 -
20.820 Nat Highway Traffic Safety Admin 640,397 -
Total Department of Transportation Direct Awards 3,078,141 574,216
National Aeronautics and Space Administration
43.001 Goddard Space Flight Center 1,833,668 553,404
43.001 NASA Headquarters 872,491 48,720
43.001 Nat Aeronautics & Space Admin 1,708,374 362,113
43.002 NASA Headquarters 348,432 -
43.002 Nat Aeronautics & Space Admin 7,468 -
43.008 NASA Headquarters 23,218 -
43.008 Nat Aeronautics & Space Admin 234,131 - 43.012 NASA Headquarters 13,412 -
43.012 Nat Aeronautics & Space Admin 54,730 -
43.330 NASA Headquarters 176,402 154,386
Total National Aeronautics and Space Administration Direct Awards 5,272,326 1,118,623
National Endowment for the Humanities45.024 National Endowment For The Arts 2,596 -
45.149 National Endowment For The Humanities (3) -
45.161 National Endowment For The Humanities 2,000 -
45.169 National Endowment For The Humanities 9,124 -
Total National Endowment for the Humanities Direct Awards 13,717 -

See Accompanying Notes to the Schedule of Expenditures of Federal Awards 94
THE OHIO STATE UNIVERSITYSCHEDULE OF EXPENDITURES OF FEDERAL AWARDSFOR THE YEAR ENDED JUNE 30, 2017
CFDA Federal Expenditures
Number Federal Agency Sponsor Expenditures to Subrecipients
Research and Development Cluster —
Funds received directly from the following agencies
National Science Foundation
47.041 NSF Div Chem, Bioeng, Environ, & Trnsp S 1,500,777 -
47.041 NSF Div Civil, Mechanical & Maufact Innv 2,619,332 204,650
47.041 NSF DIV Elect, Comm, & CyberSystems 1,365,391 69,033
47.041 NSF Div Emerging Frontiers 595,073 267,599
47.041 NSF Div Engineering Education&Centers 32,836 -
47.041 NSF Div Info and Intelligent Systems 16,218 -
47.041 NSF Engineering 1,634 -
47.041 NSF Industrial Innovation & Partnerships 641,646 -
47.049 NSF Div Civil, Mechanical & Maufact Innv 151,247 -
47.049 NSF DIV Elect, Comm, & CyberSystems 191,455 69,060 47.049 NSF Div Astronomical Sciences 1,179,261 63,333
47.049 NSF Div Chemistry 1,469,586 116,462
47.049 NSF Div Design &Manufacturing Innovation 73,517 -
47.049 NSF Div Materials Research 4,402,052 405,379
47.049 NSF Div Mathematical Sciences 5,136,591 -
47.049 NSF Div Physics 1,598,598 -
47.050 NSF Div Atmospheric Sciences 272,531 -
47.050 NSF Div Earth Sciences 997,163 199,723
47.050 NSF Div Ocean Sciences 346,444 -
47.050 NSF Div Polar Programs 1,147,063 75,222 47.050 NSF Education & Human Resources 427 -
47.050 NSF Geosciences 235,872 -
47.070 NSF DIV Elect, Comm, & CyberSystems 20,240 -
47.070 NSF Div Info and Intelligent Systems 2,010,957 70,320
47.070 NSF Behavioral & Cognitive Sciences 31,675 -
47.070 NSF Computer & Info Sciences & Eng 102,311 -
47.070 NSF Div Advanced Cyberinfrastructure 1,009,643 15,238
47.070 NSF Div Computing & Communication Fdn 2,227,582 104,256
47.070 NSF Div of Computer & Network Systems 3,087,628 -
47.074 NSF Div Emerging Frontiers 12,752 -
47.074 NSF Biological Infrastructure 1,012,768 -
47.074 NSF Biological Sciences 323 -
47.074 NSF Environmental Biology 996,596 5,448
47.074 NSF Integrative Organismal Biology 1,279,198 22,505
47.074 NSF Molecular & Cellular Biosciences 1,894,744 14,120
47.075 NSF Behavioral & Cognitive Sciences 1,551,743 96,619
47.075 NSF Nat Ctr for Sci and Eng Stats 10,992 -
47.075 NSF Social & Economic Sciences 1,532,602 -
47.075 NSF Social, Behavioral & Economic Res 603,114 23,198
47.075 NSF Social, Behavioral & Economic Sci 27,889 -

See Accompanying Notes to the Schedule of Expenditures of Federal Awards 95
THE OHIO STATE UNIVERSITYSCHEDULE OF EXPENDITURES OF FEDERAL AWARDSFOR THE YEAR ENDED JUNE 30, 2017
CFDA Federal Expenditures
Number Federal Agency Sponsor Expenditures to Subrecipients
Research and Development Cluster —
Funds received directly from the following agencies
47.076 NSF Education & Human Resources 858,592 24,733
47.076 NSF Div Graduate Educ & Res Development 1,697,157 125,759
47.076 NSF Div Human Resource Development 601,405 361,866
47.076 NSF Div of Research on Learning 591,906 8,284
47.076 NSF Div Undergraduate Education 878,248 -
47.078 NSF Div Polar Programs 508,815 3,539
47.079 NSF Engineering 31,960 -
47.079 NSF Ofc of International Science & Eng 183,299 94,182
47.079 NSF Office of Integrative Activities 64,573 -
47.080 NSF Office of Cyberinfrastructure 70,876 -
47.RD NSF Computer & Info Sciences & Eng 206,930 -
47.RD NSF Office of Integrative Activities 610,468 -
47.RD NSF Behavioral & Cognitive Sciences 232,594 -
Total National Science Foundation Direct Awards 47,924,294 2,440,528
Veterans Affairs
64.RD Veterans Affairs 12,410 - 64.RD James A. Haley Veterans' Hospital 4,425 -
Total Veterans Affairs Direct Awards 16,835 -
Environmental Protection Agency
66.RD Environmental Protection Agency 51,479 -
66.509 Environmental Protection Agency 44,965 44,965
66.514 Environmental Protection Agency 7,995 -
Total Environmental Protection Agency Direct Awards 104,439 44,965
Nuclear Regulatory Commission
77.006 Nuclear Regulatory Commission 56,797 -
77.008 Nuclear Regulatory Commission 186,614 -
77.009 Nuclear Regulatory Commission 121,031 -
Total Nuclear Regulatory Commission Direct Awards 364,442 -
Department of Energy
81.049 US Department of Energy 7,940,338 574,371
81.086 US Department of Energy 246,005 -
81.086 Nat Energy Tech Lab 500,449 20,000
81.087 US Department of Energy 1,482,875 458,763
81.089 US Department of Energy 148,016 -

See Accompanying Notes to the Schedule of Expenditures of Federal Awards 96
THE OHIO STATE UNIVERSITYSCHEDULE OF EXPENDITURES OF FEDERAL AWARDSFOR THE YEAR ENDED JUNE 30, 2017
CFDA Federal Expenditures
Number Federal Agency Sponsor Expenditures to Subrecipients
Research and Development Cluster —
Funds received directly from the following agencies
81.089 Nat Energy Tech Lab 2,383,427 183,710
81.112 Nat Nuclear Security Admin 297,767 -
81.117 Nat Energy Tech Lab 164,684 -
81.121 US Department of Energy 1,693,890 525,195
81.135 Advanced Res Projects Agency-Energy 310,005 218,493
81.RD US Department of Energy 175,515 -
81.RD Los Alamos Nat Lab 56,542 -
81.RD Lawrence Berkeley National Laboratory 123,213 -
81.RD Lawrence Livermore National Laboratory (417) -
81.RD Oak Ridge Nat Lab 38,795 -
81.RD Fermi National Accelerator Laboratory 98,123 -
Total Department of Energy Direct Awards 15,659,227 1,980,532
Department of Education
84.015 US Department of Education 560,856 -
84.021 US Department of Education 75,224 -
84.200 US Department of Education 298,716 -
84.220 US Department of Education 238,237 -
84.220 Ofc of Postsecondary Education (22) -
84.229 US Department of Education 172,405 -
84.305 US Department of Education 592,936 192,732
84.305 Institute of Education Sciences 3,684,790 517,784
84.324 Institute of Education Sciences 552,813 46,952
84.325 US Department of Education 209,631 -
84.325 Office of Special Education Programs 51,787 -
84.350 US Department of Education 1,310,732 788,012
84.RD US Department of Education 401 (1,075)
84.407 US Department of Education 508,347 80,526
84.411 US Department of Education 823,088 385,261
Total Department of Education Direct Awards 9,079,941 2,010,192
Department of Health and Human Services
93.061 Centers for Disease Control & Prevention 65,980 -
93.077 National Cancer Institute 3,382,845 320,670
93.103 Food and Drug Administration 14,548 1,356
93.110 Health Resources & Services Admin 744,912 104,747
93.113 Nat Inst of Environ Health Scis 1,492,861 15,037
93.121 Nat Inst of Dental & Craniofacial Res 3,685,298 546,415
93.172 National Human Genome Research Institute 47,415 18,698 93.173 Nat In Deafness&Other Commnctn Disorders 2,939,396 440,132

See Accompanying Notes to the Schedule of Expenditures of Federal Awards 97
THE OHIO STATE UNIVERSITYSCHEDULE OF EXPENDITURES OF FEDERAL AWARDSFOR THE YEAR ENDED JUNE 30, 2017
CFDA Federal Expenditures
Number Federal Agency Sponsor Expenditures to Subrecipients
Research and Development Cluster —
Funds received directly from the following agencies
93.184 Centers for Disease Control & Prevention 334,133 101,671
93.213 Nat Ctr Complementary & Integrative Hlth 108,688 54,627
93.226 Agency for Healthcare Res & Quality 1,896,971 100,659
93.234 Administration for Community Living 134,035 -
93.242 National Institute of Mental Health 3,000,409 256,295
93.247 Health Resources & Services Admin 287,326 56,456
93.262 Centers for Disease Control & Prevention 259,163 -
93.262 Nat Inst Occupational Safety & Health 45,114 -
93.267 Health Resources & Services Admin 132,690 -
93.273 Nat Inst on Alcohol Abuse & Alcoholism 127,950 -
93.279 National Institute on Drug Abuse 1,652,089 67,532
93.286 Nat In Biomedical Imaging&Bioengineering 3,129,079 267,301
93.307 Nat In Minority Hlth & Hlth Disparities 550,059 59,620
93.318 Centers for Disease Control & Prevention 835,642 49,333
93.350 Nat Ctr for Advancing Translational Scis 5,446,984 574,454
93.350 Nat Inst Gen Medical Scis 11,179 -
93.351 Nat Inst of Health, Ofc of the Director 1,153,277 - 93.361 National Institute of Nursing Research 1,998,679 45,704
93.393 National Cancer Institute 11,367,651 2,052,896
93.393 National Institute of Nursing Research 33,795 -
93.394 National Cancer Institute 3,227,005 719,542
93.395 National Cancer Institute 16,365,230 2,006,756
93.396 National Cancer Institute 7,224,661 586,285
93.397 National Cancer Institute 7,579,612 526,902
93.398 National Cancer Institute 3,203,832 -
93.399 National Cancer Institute 397,936 -
93.433 Administration for Community Living 585,211 22,839
93.464 Administration for Community Living 480,280 -
93.510 Health Resources & Services Admin 261,709 -
93.600 Admin Children, Youth, & Families 6,769 -
93.600 US Department of Health & Human Services 6,974 -
93.RD Food and Drug Administration 42,502 -
93.632 Admin Developmental Disabilities 504,836 23,273
93.640 National Institutes of Health 4,024 -
93.640 National Cancer Institute 973,478 -
93.640 National Heart, Lung, and Blood Inst 927,287 319,713
93.640 Nat Inst Neurological Disorders & Stroke 44,536 -
93.640 National Institute on Aging 14,809 -
93.RD Centers for Disease Control & Prevention 283,367 -
93.837 National Heart, Lung, and Blood Inst 12,071,805 1,760,796
93.838 National Heart, Lung, and Blood Inst 2,301,080 24,827
93.839 National Heart, Lung, and Blood Inst 579,650 145,930
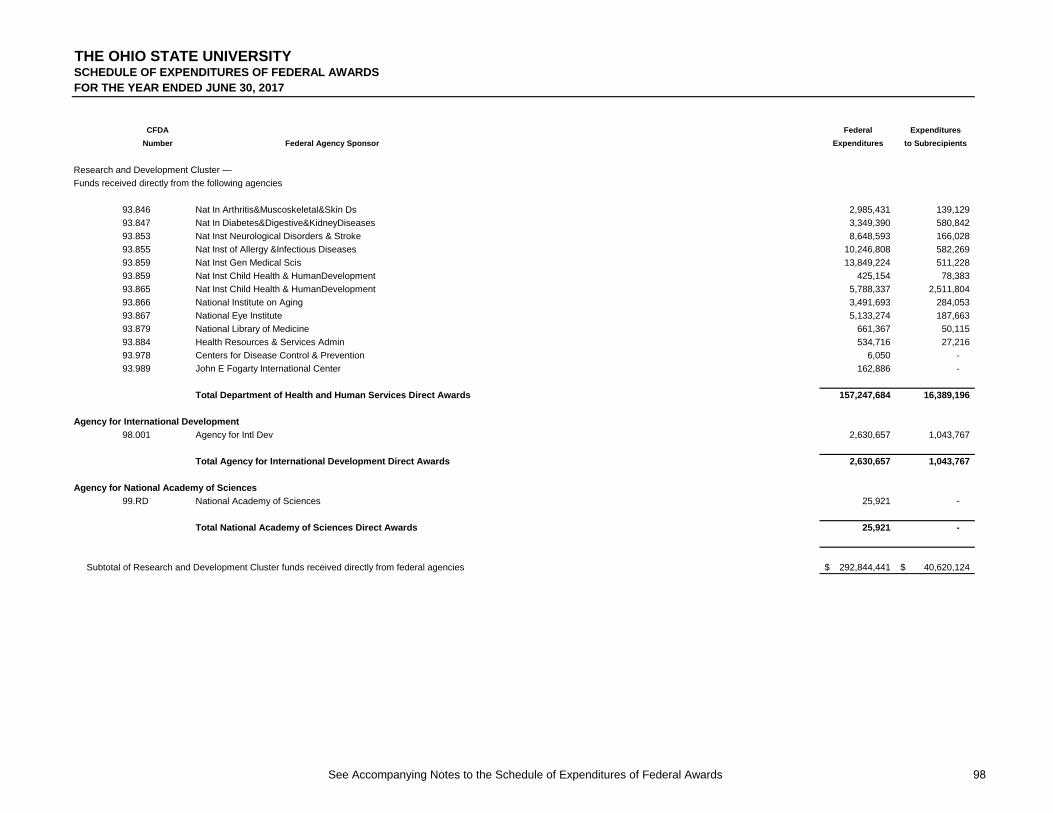
See Accompanying Notes to the Schedule of Expenditures of Federal Awards 98
THE OHIO STATE UNIVERSITYSCHEDULE OF EXPENDITURES OF FEDERAL AWARDSFOR THE YEAR ENDED JUNE 30, 2017
CFDA Federal Expenditures
Number Federal Agency Sponsor Expenditures to Subrecipients
Research and Development Cluster —
Funds received directly from the following agencies
93.846 Nat In Arthritis&Muscoskeletal&Skin Ds 2,985,431 139,129
93.847 Nat In Diabetes&Digestive&KidneyDiseases 3,349,390 580,842
93.853 Nat Inst Neurological Disorders & Stroke 8,648,593 166,028
93.855 Nat Inst of Allergy &Infectious Diseases 10,246,808 582,269
93.859 Nat Inst Gen Medical Scis 13,849,224 511,228
93.859 Nat Inst Child Health & HumanDevelopment 425,154 78,383
93.865 Nat Inst Child Health & HumanDevelopment 5,788,337 2,511,804
93.866 National Institute on Aging 3,491,693 284,053
93.867 National Eye Institute 5,133,274 187,663
93.879 National Library of Medicine 661,367 50,115
93.884 Health Resources & Services Admin 534,716 27,216
93.978 Centers for Disease Control & Prevention 6,050 -
93.989 John E Fogarty International Center 162,886 -
Total Department of Health and Human Services Direct Awards 157,247,684 16,389,196
Agency for International Development
98.001 Agency for Intl Dev 2,630,657 1,043,767
Total Agency for International Development Direct Awards 2,630,657 1,043,767
Agency for National Academy of Sciences
99.RD National Academy of Sciences 25,921 -
Total National Academy of Sciences Direct Awards 25,921 -
Subtotal of Research and Development Cluster funds received directly from federal agencies 292,844,441$ 40,620,124$

See Accompanying Notes to the Schedule of Expenditures of Federal Awards 99
THE OHIO STATE UNIVERSITYSCHEDULE OF EXPENDITURES OF FEDERAL AWARDSFOR THE YEAR ENDED JUNE 30, 2017
CFDA Pass-Through Federal Expenditures
Number Federal Agency Sponsor Pass-Through Sponsor I.D. Number Expenditures to Subrecipients
Research and Development Cluster —
Pass-through from other sources:
Department of Agriculture
10.001 US Department of Agriculture USDA Agricultural Res Service 40040200 110,475$ -$
10.001 USDA Agricultural Res Service Univ of Arkansas 22000239 127,056 -
10.001 Intl Plant Nutrition Institute USDA Agricultural Res Service 40040200 14,836 -
10.001 United Soybean Board USDA Agricultural Res Service 40040200 157,019 -
10.170 Bill & Melinda Gates Fdn USDA Agricultural Res Service 40040200 5,416 -
10.170 Agricultural Marketing Service Ohio Department Of Agriculture 26390000 124,607 -
10.170 Agricultural Marketing Service Refugee Response 20022295 3,678 -
10.200 US Department of Agriculture Ohio Department Of Agriculture 26390000 50,737 -
10.200 National Institute of Food & Agriculture Iowa State Univ 22000047 116,991 -
10.200 National Institute of Food & Agriculture Michigan State Univ 22000044 87,159 -
10.200 National Institute of Food & Agriculture Univ of Maine at Orono 22000048 4,690 -
10.200 National Institute of Food & Agriculture Rutgers Univ 22000003 1,599 -
10.200 National Institute of Food & Agriculture Purdue Univ 22000002 18,723 -
10.200 National Institute of Food & Agriculture Univ of Minnesota 22000067 45,005 -
10.200 National Institute of Food & Agriculture Univ of Wisconsin 22000006 20,451 -
10.217 National Institute of Food & Agriculture Cornell University 22000081 28,725 -
10.217 National Institute of Food & Agriculture Texas A & M Univ 22000053 (2,493) -
10.250 US Department of Agriculture Cornell University 22000081 14,651 -
10.250 USDA Agricultural Res Service Pennsylvania State Univ 22000030 3,548 -
10.253 Economic Res Service Res Triangle Inst 20020058 20,050 -
10.303 National Institute of Food & Agriculture Michigan State Univ 22000044 34,706 -
10.304 National Institute of Food & Agriculture Michigan State Univ 22000044 63,251 -
10.307 National Institute of Food & Agriculture Rutgers Univ 22000003 402 -
10.309 National Institute of Food & Agriculture USDA Agricultural Res Service 40040200 228,496 -
10.309 National Institute of Food & Agriculture Purdue Univ 22000002 18,162 -
10.309 National Institute of Food & Agriculture Univ of Maryland 22000120 (134) -
10.309 National Institute of Food & Agriculture North Carolina State Univ 22000136 188,624 -
10.309 National Institute of Food & Agriculture Univ of Florida 22000108 171,689 -
10.310 National Institute of Food & Agriculture USDA Agricultural Res Service 40040200 4,231 -
10.310 National Institute of Food & Agriculture Iowa State Univ 22000047 142,909 -
10.310 National Institute of Food & Agriculture Michigan State Univ 22000044 23,364 -
10.310 National Institute of Food & Agriculture Univ of Maine at Orono 22000048 78,605 -
10.310 National Institute of Food & Agriculture Purdue Univ 22000002 28,232 -
10.310 National Institute of Food & Agriculture Cornell University 22000081 57,556 -
10.310 National Institute of Food & Agriculture Pennsylvania State Univ 22000030 18,903 -
10.310 National Institute of Food & Agriculture North Carolina State Univ 22000136 1,421 -
10.310 National Institute of Food & Agriculture Univ of California - Davis 22000013 53,172 10,178
10.310 National Institute of Food & Agriculture Kansas State Univ 22000062 354,340 -
10.310 National Institute of Food & Agriculture Univ of Delaware 22000138 121,128 -
10.310 National Institute of Food & Agriculture Univ at Buffalo 22000240 47,468 -
10.310 National Institute of Food & Agriculture South Dakota State University 22000262 69,823 -

See Accompanying Notes to the Schedule of Expenditures of Federal Awards 100
THE OHIO STATE UNIVERSITYSCHEDULE OF EXPENDITURES OF FEDERAL AWARDSFOR THE YEAR ENDED JUNE 30, 2017
CFDA Pass-Through Federal Expenditures
Number Federal Agency Sponsor Pass-Through Sponsor I.D. Number Expenditures to Subrecipients
Research and Development Cluster —
Pass-through from other sources:
10.310 National Institute of Food & Agriculture Univ of Houston 22000092 34,846 -
10.310 National Institute of Food & Agriculture Auburn University 22000266 31,634 -
10.310 National Institute of Food & Agriculture Univ of Missouri 22000073 43,436 -
10.310 National Institute of Food & Agriculture Univ of Nebraska 22000085 31,264 -
10.310 National Institute of Food & Agriculture Colorado State Univ 22000110 59,776 -
10.320 National Institute of Food & Agriculture Oklahoma State University 22000313 12,122 -
10.330 National Institute of Food & Agriculture Univ of Maryland 22000120 19,476 -
10.330 National Institute of Food & Agriculture Univ of Tennessee 22000010 9,147 -
10.500 National Institute of Food & Agriculture Pennsylvania State Univ 22000030 45,022 -
10.500 National Institute of Food & Agriculture Virginia Polytechnic Inst 22000023 3,180 -
10.500 Navy National Institute of Food & Agriculture 40040100 - (23)
10.664 USDA Forest Service OH Dept of Natural Resources 26110000 10,947 -
10.902 Natural Resources Conservation Service The Nature Conservancy 20020999 (867) -
10.912 Natural Resources Conservation Service Ohio Soybean Cncl 20021130 9,975 -
Total Department of Agriculture Pass-Through Awards 2,969,229 10,155
Department of Commerce
11.417 Nat Oceanic & Atmospheric Admin Univ of Wisconsin 22000006 4,812 -
11.417 Nat Oceanic & Atmospheric Admin Univ of Michigan 22000005 844 -
11.419 Nat Oceanic & Atmospheric Admin OH Dept of Natural Resources 26110000 168,027 96,730
11.463 Nat Oceanic & Atmospheric Admin The Nature Conservancy 20020999 2,088 -
11.611 Nat Inst of Standards & Tech OH Development Services Agency 26140000 227,517 -
11.620 Nat Inst of Standards & Tech Edison Welding Inst Inc 10011218 (97) -
Total Department of Commerce Pass-Through Awards 403,191 96,730
Department of Defense
12.225 US Department of Defense Nat Ctr for Manufacturing Sci's 20021452 43,839 -
12.300 Office of Naval Res Univ of California - Santa Barbara 22000315 268,498 -
12.300 Office of Naval Res Univ of Notre Dame 22000140 640,284 -
12.300 Office of Naval Res Duke Univ 22000094 144,961 -
12.330 Office of Naval Res Lorain County Community College 22000199 19,398 -
12.351 Defense Threat Reduction Agency Univ of Nebraska 22000085 97,048 -
12.351 Defense Threat Reduction Agency Univ of California - Santa Barbara 22000315 34,258 -
12.420 Army Medical Res & Materiel Command Arteriocyte, Inc 10020226 31,416 -
12.420 Army Medical Res & Materiel Command Tulane University 22000372 21,377 -
12.420 Army Medical Res Acquisition Activity Purdue Univ 22000002 (189) -
12.420 Army Medical Res Acquisition Activity Johns Hopkins Univ 22000133 3,696 -
12.420 Army Medical Res Acquisition Activity Arteriocyte, Inc 10020226 14,971 -
12.420 Army Medical Res Acquisition Activity Henry M Jackson Fdn 20010473 35,280 -
12.420 Army Medical Res Acquisition Activity Henry M Jackson Fdn for the Advn Mil Med 20012161 5,821 -

See Accompanying Notes to the Schedule of Expenditures of Federal Awards 101
THE OHIO STATE UNIVERSITYSCHEDULE OF EXPENDITURES OF FEDERAL AWARDSFOR THE YEAR ENDED JUNE 30, 2017
CFDA Pass-Through Federal Expenditures
Number Federal Agency Sponsor Pass-Through Sponsor I.D. Number Expenditures to Subrecipients
Research and Development Cluster —
Pass-through from other sources:
12.420 Army Medical Res Acquisition Activity Wake Forest Univ 22000286 187,679 -
12.420 Army Medical Res Acquisition Activity Univ of Louisville 22000299 3,664 - 12.420 Army Medical Res Acquisition Activity Roswell Park Cancer Institute 20021570 19,409 -
12.420 National Institutes of Health Army Medical Res Acquisition Activity 50022700 172,063 -
12.420 US Department of Defense Research Institute at Nationwide Childrn 20010182 (24,586) -
12.431 Army Georgia Inst of Tech 22000189 34,066 -
12.431 Army Res Office Univ of California - Davis 22000013 47,217 -
12.431 Army Res Office Duke Univ 22000094 183,690 -
12.431 Army Res Office Univ of Chicago 22000018 193,997 -
12.431 Army Res Office Univ of California - Los Angeles 22000269 76,207 -
12.431 Army Res Office Georgia Inst of Tech 22000189 43,944 -
12.431 Army Res Office Univ of South Carolina 22000241 21,069 -
12.431 Army Res Office Kent State Univ 22000235 31,908 -
12.431 Army Research, Development and Eng Cmd Cornell University 22000081 90,423 -
12.431 Army Research, Development and Eng Cmd Virginia Polytechnic Inst 22000023 364,611 -
12.431 US Department of Defense Univ of Michigan 22000005 61,634 -
12.RD US Department of Defense Johns Hopkins Univ 22000133 6,088 -
12.RD US Department of Defense Northrop Grumman Corp 10011657 10,188 -
12.RD US Department of Defense High Performance Technologies Inc 10012364 85,408 -
12.RD US Department of Defense Tetra Tech EM Inc. 10011785 48,949 -
12.RD US Department of Defense Engility Corporation 10013615 237,146 -
12.RD US Department of Defense BioFire Defense 10013711 23,834 -
12.RD US Department of Defense BerrieHill Research Corp 10020202 60,656 -
12.RD Air Force BerrieHill Research Corp 10020202 40,966 -
12.RD Air Force PaneraTech Inc. 10013192 (303) -
12.RD Air Force Universal Tech Corp 10011471 37,173 -
12.RD Air Force Infoscitex Corporation 10011833 13,278 -
12.RD Air Force Massachusetts Inst Tech - Lincoln Lab 22000228 132,515 -
12.RD Air Force Leidos, Inc 10013531 144,077 -
12.RD Air Force Hyper Tech Res Inc 10020102 126,810 -
12.RD Air Force Metron, Inc. 10013243 41,512 -
12.RD Air Force Battelle Memorial Inst 20020012 15,437 -
12.RD Air Force TallannQuest 10013547 217,950 -
12.RD Air Force L-3 Communications 10013079 12,864 -
12.RD Air Force Carnegie-Mellon Univ 22000051 5,113 -
12.RD Air Force Materiel Command Leidos, Inc 10013531 160,674 -
12.RD Air Force Materiel Command Aptima, Inc. 10013496 8,428 -
12.RD Air Force Office of Scientific Res Systems Plus, Inc. 10013719 17,042 -
12.RD Air Force Office of Scientific Res Voss Scientific, LLC 10013299 24,538 -
12.RD Air Force Research Laboratory Northrop Grumman Corp 10011657 216,117 -
12.RD Air Force Research Laboratory BerrieHill Research Corp 10020202 214,540 -
12.RD Air Force Research Laboratory Universal Tech Corp 10011471 94,129 -
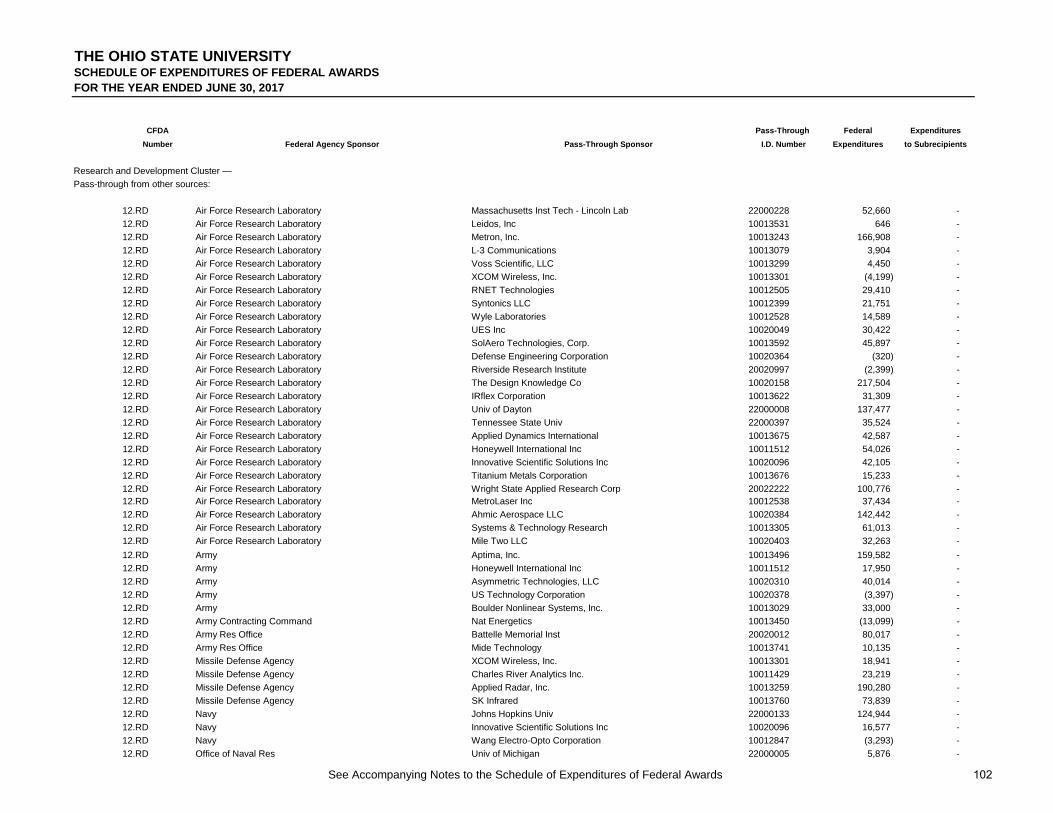
See Accompanying Notes to the Schedule of Expenditures of Federal Awards 102
THE OHIO STATE UNIVERSITYSCHEDULE OF EXPENDITURES OF FEDERAL AWARDSFOR THE YEAR ENDED JUNE 30, 2017
CFDA Pass-Through Federal Expenditures
Number Federal Agency Sponsor Pass-Through Sponsor I.D. Number Expenditures to Subrecipients
Research and Development Cluster —
Pass-through from other sources:
12.RD Air Force Research Laboratory Massachusetts Inst Tech - Lincoln Lab 22000228 52,660 -
12.RD Air Force Research Laboratory Leidos, Inc 10013531 646 -
12.RD Air Force Research Laboratory Metron, Inc. 10013243 166,908 -
12.RD Air Force Research Laboratory L-3 Communications 10013079 3,904 -
12.RD Air Force Research Laboratory Voss Scientific, LLC 10013299 4,450 -
12.RD Air Force Research Laboratory XCOM Wireless, Inc. 10013301 (4,199) -
12.RD Air Force Research Laboratory RNET Technologies 10012505 29,410 -
12.RD Air Force Research Laboratory Syntonics LLC 10012399 21,751 -
12.RD Air Force Research Laboratory Wyle Laboratories 10012528 14,589 -
12.RD Air Force Research Laboratory UES Inc 10020049 30,422 -
12.RD Air Force Research Laboratory SolAero Technologies, Corp. 10013592 45,897 -
12.RD Air Force Research Laboratory Defense Engineering Corporation 10020364 (320) -
12.RD Air Force Research Laboratory Riverside Research Institute 20020997 (2,399) -
12.RD Air Force Research Laboratory The Design Knowledge Co 10020158 217,504 -
12.RD Air Force Research Laboratory IRflex Corporation 10013622 31,309 -
12.RD Air Force Research Laboratory Univ of Dayton 22000008 137,477 -
12.RD Air Force Research Laboratory Tennessee State Univ 22000397 35,524 -
12.RD Air Force Research Laboratory Applied Dynamics International 10013675 42,587 -
12.RD Air Force Research Laboratory Honeywell International Inc 10011512 54,026 -
12.RD Air Force Research Laboratory Innovative Scientific Solutions Inc 10020096 42,105 -
12.RD Air Force Research Laboratory Titanium Metals Corporation 10013676 15,233 -
12.RD Air Force Research Laboratory Wright State Applied Research Corp 20022222 100,776 - 12.RD Air Force Research Laboratory MetroLaser Inc 10012538 37,434 -
12.RD Air Force Research Laboratory Ahmic Aerospace LLC 10020384 142,442 -
12.RD Air Force Research Laboratory Systems & Technology Research 10013305 61,013 -
12.RD Air Force Research Laboratory Mile Two LLC 10020403 32,263 -
12.RD Army Aptima, Inc. 10013496 159,582 -
12.RD Army Honeywell International Inc 10011512 17,950 -
12.RD Army Asymmetric Technologies, LLC 10020310 40,014 -
12.RD Army US Technology Corporation 10020378 (3,397) -
12.RD Army Boulder Nonlinear Systems, Inc. 10013029 33,000 -
12.RD Army Contracting Command Nat Energetics 10013450 (13,099) -
12.RD Army Res Office Battelle Memorial Inst 20020012 80,017 -
12.RD Army Res Office Mide Technology 10013741 10,135 -
12.RD Missile Defense Agency XCOM Wireless, Inc. 10013301 18,941 -
12.RD Missile Defense Agency Charles River Analytics Inc. 10011429 23,219 -
12.RD Missile Defense Agency Applied Radar, Inc. 10013259 190,280 -
12.RD Missile Defense Agency SK Infrared 10013760 73,839 -
12.RD Navy Johns Hopkins Univ 22000133 124,944 -
12.RD Navy Innovative Scientific Solutions Inc 10020096 16,577 -
12.RD Navy Wang Electro-Opto Corporation 10012847 (3,293) -
12.RD Office of Naval Res Univ of Michigan 22000005 5,876 -

See Accompanying Notes to the Schedule of Expenditures of Federal Awards 103
THE OHIO STATE UNIVERSITYSCHEDULE OF EXPENDITURES OF FEDERAL AWARDSFOR THE YEAR ENDED JUNE 30, 2017
CFDA Pass-Through Federal Expenditures
Number Federal Agency Sponsor Pass-Through Sponsor I.D. Number Expenditures to Subrecipients
Research and Development Cluster —
Pass-through from other sources:
12.RD Office of Naval Res Northrop Grumman Corp 10011657 113,908 -
12.RD Office of Naval Res Rolls-Royce North American Technologies 10011861 21,650 -
12.RD Office of Naval Res Scientific Forming Technologies Corp 10020151 15,142 -
12.RD Office of Naval Res Applied Physical Sciences Corp 10013726 15,491 -
12.RD Office of Naval Res BWX Technologies, Inc 10012749 20,251 -
12.RD Defense Advanced Res Projects Agency Northrop Grumman Corp 10011657 (4,353) -
12.RD Defense Advanced Res Projects Agency RNET Technologies 10012505 149,456 -
12.RD Defense Advanced Res Projects Agency Univ of Maryland, Baltimore County 22000393 174,654 -
12.RD Defense Advanced Res Projects Agency Teledyne Scientific & Imaging, LLC 10013456 68,259 -
12.RD Defense Advanced Res Projects Agency Boeing Co, The 10010013 (25,674) -
12.RD Defense Advanced Res Projects Agency QuesTek Innovations 10010852 50,139 -
12.RD Defense Advanced Res Projects Agency Raytheon BBN Technologies 10012357 321,972 -
12.RD Defense Logistics Agency Advanced Technology International 10012322 36,309 -
12.RD Defense Threat Reduction Agency Leidos, Inc 10013531 92,128 -
12.611 US Department of Defense Univ of Michigan 22000005 928,608 -
12.630 Air Force Research Laboratory Dayton Area Graduate Studies Inst 20021372 141,051 -
12.630 Air Force Research Laboratory Univ of Dayton 22000008 73,845 -
12.630 Army Georgia Inst of Tech 22000189 15,245 -
12.630 Army Contracting Command Edison Welding Inst Inc 10011218 5,789 -
12.630 Army Contracting Command UI Labs 20022383 58,692 25,770
12.630 Office of Naval Res Am Lightweight Materials Innovation Inst 20022269 2,736,025 -
12.750 Uniformed Services Univ Health Sci's Henry M Jackson Fdn 20010473 111,669 -
12.750 Uniformed Services Univ Health Sci's Geneva Foundation 20012073 43,326 -
12.800 Air Force Univ of California - Santa Barbara 22000315 40,641 -
12.800 Air Force Office of Scientific Res Cornell University 22000081 11,780 -
12.800 Air Force Office of Scientific Res Univ of Michigan 22000005 97,633 -
12.800 Air Force Office of Scientific Res Univ of Utah 22000145 12,513 -
12.800 Air Force Office of Scientific Res Univ of New Mexico 22000056 107,730 -
12.800 Air Force Office of Scientific Res Florida State Univ 22000070 125,277 -
12.800 Air Force Office of Scientific Res Univ of Central Florida 22010046 143,720 -
12.800 Air Force Office of Scientific Res Indiana Univ 22000012 58,821 -
12.800 Air Force Office of Scientific Res Syracuse University 22000045 113,053 -
12.800 Air Force Research Laboratory Dayton Area Graduate Studies Inst 20021372 48,499 -
12.800 Air Force Research Laboratory Wright State Univ 22000087 38,082 -
12.800 Air Force Research Laboratory Griffiss Institute 20022377 1,504 -
12.800 Air Force Research Laboratory Ohio Aerospace Inst 20021048 341 -
12.910 Defense Advanced Res Projects Agency Univ of Utah 22000145 294,079 -
12.910 Defense Advanced Res Projects Agency Univ of Illinois 22000009 43,532 -
Total Department of Defense Pass-Through Awards 13,251,566 25,770
Department of the Interior

See Accompanying Notes to the Schedule of Expenditures of Federal Awards 104
THE OHIO STATE UNIVERSITYSCHEDULE OF EXPENDITURES OF FEDERAL AWARDSFOR THE YEAR ENDED JUNE 30, 2017
CFDA Pass-Through Federal Expenditures
Number Federal Agency Sponsor Pass-Through Sponsor I.D. Number Expenditures to Subrecipients
Research and Development Cluster —
Pass-through from other sources:
15.232 Bureau of Land Management Univ of Washington 22000212 28,031 -
15.608 US Fish and Wildlife Service Columbus Zoo 24000299 (29) -
15.615 US Fish and Wildlife Service OH Division of Wildlife 26110100 104,682 -
15.622 US Fish and Wildlife Service OH Division of Wildlife 26110100 36,432 -
15.634 US Fish and Wildlife Service OH Division of Wildlife 26110100 999,975 -
15.657 US Fish and Wildlife Service OH Division of Wildlife 26110100 53,834 -
15.662 US Fish and Wildlife Service The Nature Conservancy 20020999 (1,526) -
15.RD US Department of the Interior OH Division of Wildlife 26110100 2,818 -
15.RD Bureau of Land Management USDA Forest Service 40020000 19,047 -
15.805 US Geological Survey Univ of Illinois 22000009 16,932 -
15.820 US Geological Survey Oklahoma State University 22000313 52,819 -
Total Department of the Interior Pass-Through Awards 1,313,015 -
Department of Justice
16.123 Ofc Juvenile Justice & Delinquency Prevn City of Long Beach 24000621 37,500 -
16.575 US Department of Justice Ohio Office of Attorney General 26310000 157,038 -
16.582 Office of Justice Programs Ohio Domestic Violence Network 20022407 5,871 -
16.606 Bureau of Justice Assistance Ohio Dept Rehabilitation & Correction 26160000 36,363 -
Total Department of Justice Pass-Through Awards 236,772 -
Department of Labor
17.261 US Department of Labor OH Dept of Job & Family Services 26630000 9,554 -
17.282 Employment and Training Administration Lorain County Community College 22000199 2,795 -
17.283 US Department of Labor OH Dept of Job & Family Services 26630000 138,545 44,500
17.283 US Department of Labor Wargo-Brock Workforce Dimensions LLC 10020314 65,696 -
17.RD US Department of Labor New Growth Group, LLC 10020372 134,676 -
Total Department of Labor Pass-Through Awards 351,266 44,500
Department of State
19.021 US Department of State Inst of International Education 20021662 25,003 -
19.401 US Department of State Inst of International Education 20021662 114,020 5,556
Total Department of State Pass-Through Awards 139,023 5,556
Department of Transportation
20.701 US Department of Transportation Purdue Univ 22000002 303,380 4,077
20.761 US Department of Transportation Iowa State Univ 22000047 37,247 -
20.RD US Department of Transportation Battelle Memorial Inst 20020012 21,526 -

See Accompanying Notes to the Schedule of Expenditures of Federal Awards 105
THE OHIO STATE UNIVERSITYSCHEDULE OF EXPENDITURES OF FEDERAL AWARDSFOR THE YEAR ENDED JUNE 30, 2017
CFDA Pass-Through Federal Expenditures
Number Federal Agency Sponsor Pass-Through Sponsor I.D. Number Expenditures to Subrecipients
Research and Development Cluster —
Pass-through from other sources:
20.RD Federal Aviation Administration Mitre Corporation 20021725 5,891 -
Total Department of Transportation Pass-Through Awards 368,044 4,077
National Aeronautics and Space Administration43.001 NASA Headquarters Smithsonian Astrophysical Observatory 30060200 15,080 -
43.001 NASA Headquarters Jet Propulsion Lab 33000303 39,314 -
43.001 Nat Aeronautics & Space Admin Univ of Houston 22000092 812 -
43.001 Nat Aeronautics & Space Admin Univ of California - Los Angeles 22000269 280,937 -
43.001 Nat Aeronautics & Space Admin Univ of Washington 22000212 91,115 -
43.001 Nat Aeronautics & Space Admin Arizona State Univ 22000109 28,644 -
43.001 Marshall Space Flight Center Smithsonian Astrophysical Observatory 30060200 9,501 -
43.002 NASA Headquarters Univ of Illinois 22000009 (5,378) -
43.002 Nat Aeronautics & Space Admin Georgia Inst of Tech 22000189 61,744 -
43.003 Nat Aeronautics & Space Admin Nat Space Grant Foundation 20022037 11,142 -
43.008 Nat Aeronautics & Space Admin Ohio Space Grant Consortium 20021298 2,108 -
43.009 Nat Aeronautics & Space Admin Univ of Michigan 22000005 48,002 - 43.RD Nat Aeronautics & Space Admin Univ of Michigan 22000005 116,709 -
43.RD Nat Aeronautics & Space Admin Georgia Inst of Tech 22000189 21,372 -
43.RD Nat Aeronautics & Space Admin Hyper Tech Res Inc 10020102 37,038 -
43.RD Nat Aeronautics & Space Admin Innovative Scientific Solutions Inc 10020096 97,526 -
43.RD Nat Aeronautics & Space Admin Jet Propulsion Lab 33000303 179,867 900
43.RD Nat Aeronautics & Space Admin Micro Cooling Concepts 10013309 316 -
43.RD Nat Aeronautics & Space Admin Vantage Partners, LLC 10013302 250,535 -
43.RD Nat Aeronautics & Space Admin N&R Engineering and Management Svcs Corp 10020244 191 -
43.RD Nat Aeronautics & Space Admin Tech4Imaging LLC 10020227 55,185 -
43.RD NASA Headquarters Hyper Tech Res Inc 10020102 36,291 -
43.RD NASA Headquarters Jet Propulsion Lab 33000303 236,781 28,734
43.RD NASA Headquarters Space Telescope Sci Inst 20021006 206,355 -
43.RD NASA Headquarters ASCA Inc. 10013503 222,658 -
43.RD NASA Headquarters Paragon TEC 10020400 4,260 -
Total National Aeronautics and Space Administration Pass-Through Awards 2,048,105 29,634
Department of National Endowment for the Humanities
45.129 National Endowment For The Humanities OH Humanities Council 26290000 2,000 -
Total Department of National Endowment for the Humanities Pass-Through Awards 2,000 -
National Science Foundation
47.041 NSF Industrial Innovation & Partnerships Ohio Surgical Optics, LLC 10020350 (2,854) -
47.041 NSF Industrial Innovation & Partnerships MARi LLC 10013625 105,884 -

See Accompanying Notes to the Schedule of Expenditures of Federal Awards 106
THE OHIO STATE UNIVERSITYSCHEDULE OF EXPENDITURES OF FEDERAL AWARDSFOR THE YEAR ENDED JUNE 30, 2017
CFDA Pass-Through Federal Expenditures
Number Federal Agency Sponsor Pass-Through Sponsor I.D. Number Expenditures to Subrecipients
Research and Development Cluster —
Pass-through from other sources:
47.041 NSF Industrial Innovation & Partnerships LiveFocus, LLC 10020413 21,768 -
47.041 NSF Div Chem, Bioeng, Environ, & Trnsp S Univ of Minnesota 22000067 56,365 -
47.041 NSF Div Chem, Bioeng, Environ, & Trnsp S Univ of Nebraska 22000085 (94) -
47.041 NSF Div Civil, Mechanical & Maufact Innv Virginia Polytechnic Inst 22000023 3,468 -
47.049 Nat Science Foundation American Physical Society 20021996 1,277 -
47.049 NSF Div Chemistry Univ of Minnesota 22000067 136,716 -
47.049 NSF Div Chemistry Indiana Univ 22000012 51,851 -
47.049 NSF Div Chemistry Univ of California - San Diego 22000288 124,483 -
47.049 NSF Div Chemistry Univ of Connecticut 22000076 59,841 -
47.049 NSF Div Chemistry Worcester Polytechnic Institute 22000351 33,942 -
47.049 NSF Div Mathematical Sciences Univ of California - Davis 22000013 (170) -
47.049 NSF Div Physics Princeton Univ 22000289 216,677 -
47.049 NSF Div Physics Univ of Cincinnati 22000074 46,056 -
47.049 NSF Div Materials Research Univ of California - Santa Barbara 22000315 108,318 -
47.049 NSF Div Materials Research Brown University 22000284 (8,519) -
47.050 NSF Div Ocean Sciences Columbia University 22000135 11,799 -
47.050 NSF Div Atmospheric Sciences Texas A & M Univ 22000053 20,855 -
47.050 NSF Div Polar Programs Univ of Minnesota 22000067 (6,838) -
47.050 NSF Div Polar Programs Univ of Colorado 22000039 132,971 -
47.050 NSF Geosciences Univ of Minnesota 22000067 301,876 -
47.070 NSF Div of Computer & Network Systems Univ of Missouri 22000073 (79) -
47.070 NSF Div of Computer & Network Systems New York University 22000254 93,428 -
47.070 NSF Office of Cyberinfrastructure Univ of Illinois 22000009 201,945 -
47.070 NSF Office of Cyberinfrastructure Washington Univ 22000209 12,552 -
47.070 NSF Office of Integrative Activities Univ of Akron 22000066 2,019 -
47.070 NSF Div Info and Intelligent Systems Univ of Wisconsin 22000006 16,450 -
47.070 NSF Div Info and Intelligent Systems Univ of Notre Dame 22000140 12,013 -
47.070 NSF Div Advanced Cyberinfrastructure Univ of Illinois 22000009 87,107 -
47.074 NSF Environmental Biology Univ of North Carolina 22000146 24,814 -
47.074 NSF Environmental Biology Univ of California - Berkeley 22000294 9,195 -
47.074 NSF Biological Sciences Univ of Florida 22000108 62,661 -
47.074 NSF Biological Sciences Univ of Tennessee 22000010 13,084 -
47.074 NSF Integrative Organismal Biology Univ of Michigan 22000005 104,273 -
47.074 NSF Integrative Organismal Biology Carnegie Institution of Washington 22000354 55,590 -
47.074 NSF Biological Infrastructure Northern Arizona Univ 22000117 18,366 -
47.075 Nat Science Foundation Univ of Colorado 22000039 7,812 -
47.075 NSF Social & Economic Sciences Pennsylvania State Univ 22000030 26,912 -
47.075 NSF Social & Economic Sciences Arizona State Univ 22000109 23,765 -
47.075 NSF Social & Economic Sciences Univ of North Carolina 22000146 15,751 -
47.075 NSF Social, Behavioral & Economic Res Univ of California - Merced 22000385 4,893 -
47.075 NSF Social, Behavioral & Economic Sci Univ of Utah 22000145 8,363 -
47.076 Nat Science Foundation Georgia Inst of Tech 22000189 8,576 -

See Accompanying Notes to the Schedule of Expenditures of Federal Awards 107
THE OHIO STATE UNIVERSITYSCHEDULE OF EXPENDITURES OF FEDERAL AWARDSFOR THE YEAR ENDED JUNE 30, 2017
CFDA Pass-Through Federal Expenditures
Number Federal Agency Sponsor Pass-Through Sponsor I.D. Number Expenditures to Subrecipients
Research and Development Cluster —
Pass-through from other sources:
47.076 NSF Div Human Resource Development American Physical Society 20021996 25,087 -
47.076 NSF Div Human Resource Development North Dakota State Univ 22000263 4,701 -
47.076 NSF Div of Research on Learning Univ of Cincinnati 22000074 87,368 -
47.076 NSF Div of Research on Learning Center of Science and Industry 20021167 36,589 -
47.076 NSF Div of Research on Learning Am Educ Res Assn 20021421 5,112 5,112
47.076 NSF Div of Research on Learning Museum of Science, Boston 20022362 1,200 -
47.076 NSF Div Undergraduate Education Univ of Cincinnati 22000074 94,025 -
47.076 NSF Div Undergraduate Education Bowling Green State University 22000221 68,053 -
47.076 NSF Education & Human Resources National Federation of the Blind 20022130 22,411 -
47.079 NSF Ofc of International Science & Eng Civilian Res & Dev Fdn 20012104 1,800 -
47.080 NSF Office of Cyberinfrastructure Univ of Akron 22000066 2,500 -
47.080 NSF Office of Cyberinfrastructure Univ of Texas at Austin 22000270 98,685 -
47.080 NSF Office of Integrative Activities Univ of Akron 22000066 5,615 -
47.RD NSF Div Human Resource Development American Physical Society 20021996 1,500 -
Total National Science Foundation Pass-Through Awards 2,679,808 5,112
Department of Veterans Affairs
64.302 Veterans Affairs Univ of Pittsburgh 22000036 52,160 -
Total Department of Veterans Affairs Pass-Through Awards 52,160 -
Environmental Protection Agency
66.001 Environmental Protection Agency OH Environ Protection Agency 26340000 18,628 -
66.320 Environmental Protection Agency Res Triangle Inst 20020058 93,688 -
66.320 Environmental Protection Agency Battelle Memorial Inst 20020012 159,172 -
66.436 Environmental Protection Agency Univ of Wisconsin 22000006 20,056 -
66.469 Environmental Protection Agency Univ of Minnesota 22000067 7,574 -
66.469 Environmental Protection Agency Univ of Michigan 22000005 20,674 -
66.469 Environmental Protection Agency OH Environ Protection Agency 26340000 156,110 100,000
66.509 Environmental Protection Agency Univ of Colorado 22000039 54,419 -
Total Environmental Protection Agency Pass-Through Awards 530,321 100,000
Department of Nuclear Regulatory Commission
77.RD Nuclear Regulatory Commission Purdue Univ 22000002 260,653 -
77.RD Nuclear Regulatory Commission Edison Welding Inst Inc 10011218 20,330 -
Total Nuclear Regulatory Commission Pass-Through Awards 280,983 -
Department of Energy
81.000 US Department of Energy Lawrence Berkeley National Laboratory 55080000 313,446 195,439

See Accompanying Notes to the Schedule of Expenditures of Federal Awards 108
THE OHIO STATE UNIVERSITYSCHEDULE OF EXPENDITURES OF FEDERAL AWARDSFOR THE YEAR ENDED JUNE 30, 2017
CFDA Pass-Through Federal Expenditures
Number Federal Agency Sponsor Pass-Through Sponsor I.D. Number Expenditures to Subrecipients
Research and Development Cluster —
Pass-through from other sources:
81.049 US Department of Energy Michigan State Univ 22000044 985 -
81.049 US Department of Energy Cornell University 22000081 6,643 -
81.049 US Department of Energy Univ of Florida 22000108 39,376 -
81.049 US Department of Energy Univ of Michigan 22000005 154,611 -
81.049 US Department of Energy Hyper Tech Res Inc 10020102 132,716 -
81.049 US Department of Energy RNET Technologies 10012505 26,129 -
81.049 US Department of Energy MetroLaser Inc 10012538 280,057 -
81.049 US Department of Energy Tech4Imaging LLC 10020227 199,090 -
81.049 US Department of Energy Lambda Instruments, Inc. 10013169 (11,717) -
81.049 US Department of Energy Engineering Mechanics Corp Of Columbus 10020135 8,607 -
81.049 US Department of Energy Louisiana State University 22000091 171,148 -
81.049 US Department of Energy Techverse, Inc 10013544 55,474 -
81.049 US Department of Energy Global Res & Dev Inc 10020103 130,669 -
81.049 US Department of Energy ITN Energy Systems, Inc 10012614 75,258 -
81.049 US Department of Energy Univ of Arizona 22000116 229,146 -
81.086 US Department of Energy North Carolina State Univ 22000136 169,255 -
81.086 US Department of Energy GE Global Res 10011744 16,349 -
81.086 US Department of Energy US Automotive Material Partnership 10012073 134,428 -
81.086 US Department of Energy Intermolecular 10013655 99,375 -
81.086 US Department of Energy Cummins, Inc 10012608 124,145 -
81.086 US Department of Energy Alcoa Research Laboratories 10011406 11,572 -
81.086 US Department of Energy Florida Intl Univ 22000090 1,231 -
81.087 US Department of Energy Univ of Michigan 22000005 32,673 -
81.087 US Department of Energy Univ of Illinois 22000009 67,972 -
81.087 US Department of Energy PPG Industries 10011723 65,128 -
81.089 Nat Energy Tech Lab Univ of Texas at Austin 22000270 215,032 -
81.089 Nat Energy Tech Lab West Virginia Univ 22000032 196,109 -
81.089 US Department of Energy Univ of Texas at Austin 22000270 103,029 -
81.089 US Department of Energy GE Global Res 10011744 36,775 -
81.089 US Department of Energy Babcock & Wilcox 10010026 (123) -
81.089 US Department of Energy Gas Tech Inst 20021447 13,725 -
81.121 US Department of Energy Univ of Wisconsin 22000006 128,763 -
81.121 US Department of Energy Pennsylvania State Univ 22000030 31,117 -
81.121 US Department of Energy Univ of Tennessee 22000010 83,143 -
81.121 US Department of Energy Georgia Inst of Tech 22000189 159,380 -
81.121 US Department of Energy Univ of Utah 22000145 29,924 -
81.121 US Department of Energy Arizona State Univ 22000109 96,967 -
81.121 US Department of Energy Massachusetts Inst Tech 22000001 32,334 -
81.124 US Department of Energy Univ of Illinois 22000009 237,871 -
81.RD US Department of Energy Hyper Tech Res Inc 10020102 (617) -
81.RD US Department of Energy Lawrence Berkeley National Laboratory 55080000 499,495 -
81.RD US Department of Energy Global Res & Dev Inc 10020103 25,438 -

See Accompanying Notes to the Schedule of Expenditures of Federal Awards 109
THE OHIO STATE UNIVERSITYSCHEDULE OF EXPENDITURES OF FEDERAL AWARDSFOR THE YEAR ENDED JUNE 30, 2017
CFDA Pass-Through Federal Expenditures
Number Federal Agency Sponsor Pass-Through Sponsor I.D. Number Expenditures to Subrecipients
Research and Development Cluster —
Pass-through from other sources:
81.RD US Department of Energy Universities Res Assn Inc 20021485 79,547 -
81.RD US Department of Energy Univ of Idaho 22000016 (28,077) -
81.RD US Department of Energy Battelle Energy Alliance, LLC 20021641 568,467 -
81.RD US Department of Energy UT-Battelle LLC 20021486 110,353 -
81.RD US Department of Energy Brookhaven Sci Assoc, LLC 20021624 159,638 -
81.RD US Department of Energy Oak Ridge Nat Lab 55110000 71,498 -
81.RD US Department of Energy Los Alamos Nat Lab 55050000 73,977 -
81.RD US Department of Energy Lawrence Livermore National Laboratory 55100000 63,817 -
81.RD US Department of Energy UChicago Argonne, LLC 20021718 84,575 -
81.RD US Department of Energy Alliance for Sustainable Energy, LLC 20021831 32,065 -
81.RD US Department of Energy Pacific Northwest National Laboratory 20021070 133,158 -
81.RD US Department of Energy Sandia Corp 10011170 118,022 -
81.RD US Department of Energy Nat Renewable Energy Lab 20020800 67,710 -
81.RD Nat Nuclear Security Admin Lawrence Livermore National Laboratory 55100000 - -
Total Department of Energy Pass-Through Awards 5,956,878 195,439
Department of Education
84.002 US Department of Education OH Dept of Higher Education 26060000 764,476 -
84.004 US Department of Education Indiana Univ 22000012 22,777 -
84.048 US Department of Education OH Dept of Educ 26080000 121,399 -
84.048 US Department of Education Minnesota State Coll and Univs 22000407 3,419 -
84.116 US Department of Education Georgia State University 22000379 193,523 -
84.126 Rehabilitation Services Admin Opp for Ohioans with Disabilities 26120000 51,361 -
84.126 Rehabilitation Services Admin American Institutes for Research 20021736 242,671 -
84.323 US Department of Education OH Dept of Educ 26080000 145,161 -
84.324 US Department of Education Univ of Kansas 22000219 22,049 -
84.325 US Department of Education Salus University 22000322 122,096 -
84.366 US Department of Education OH Dept of Educ 26080000 2,876,713 343,690
84.367 US Department of Education OH Dept of Higher Education 26060000 273,887 -
84.367 US Department of Education Nat Writing Project Corp 20021378 3,143 -
84.RD US Department of Education OH Dept of Educ 26080000 (188,928) (170,868)
84.412 US Department of Education OH Dept of Educ 26080000 56,812 13,398
84.RD Institute of Education Sciences Virtual Learning Technologies 10013543 26,006 -
84.367 US Department of Education OH Dept of Educ 26080000 125,751 73,892
Total Department of Education Pass-Through Awards 4,862,316 260,112
Department of Health and Human Services
93.077 National Cancer Institute Univ of Minnesota 22000067 484,077 -
93.077 National Cancer Institute Univ of North Carolina 22000146 13,303 -
93.080 Centers for Disease Control & Prevention Hemophilia Fdn of Michigan 20021026 30,520 -

See Accompanying Notes to the Schedule of Expenditures of Federal Awards 110
THE OHIO STATE UNIVERSITYSCHEDULE OF EXPENDITURES OF FEDERAL AWARDSFOR THE YEAR ENDED JUNE 30, 2017
CFDA Pass-Through Federal Expenditures
Number Federal Agency Sponsor Pass-Through Sponsor I.D. Number Expenditures to Subrecipients
Research and Development Cluster —
Pass-through from other sources:
93.103 Food and Drug Administration Univ of Florida 22000108 68,875 -
93.104 Substance Abuse &MentalHealthServsAdmin OH Dept of Mental Hlth & Addiction Svcs 26420000 76,036 -
93.110 Health Resources & Services Admin Research Institute at Nationwide Childrn 20010182 10,980 -
93.110 Health Resources & Services Admin Massachusetts General Hospital 20021587 111,197 -
93.110 Maternal & Child Health Bureau Hemophilia Fdn of Michigan 20021026 31,826 -
93.113 Nat Inst of Environ Health Scis Tulane University 22000372 47,896 -
93.113 Nat Inst of Environ Health Scis Univ of Louisville 22000299 7,404 -
93.113 Nat Inst of Environ Health Scis Univ of Kentucky 22000143 44,642 -
93.117 Health Resources & Services Admin Acad Consort Integrative Med & Health 20022292 14,357 -
93.121 Nat Inst of Dental & Craniofacial Res Univ of Florida 22000108 11,876 -
93.121 Nat Inst of Dental & Craniofacial Res Johns Hopkins Univ 22000133 1,963 -
93.121 Nat Inst of Dental & Craniofacial Res Univ of California - Los Angeles 22000269 92,324 -
93.121 Nat Inst of Dental & Craniofacial Res New York University 22000254 58,797 -
93.121 Nat Inst of Dental & Craniofacial Res UT-Battelle LLC 20021486 330,683 -
93.121 Nat Inst of Dental & Craniofacial Res LSU Health Sciences Center 22000381 254,730 -
93.121 Nat Inst of Dental & Craniofacial Res Univ of Alabama at Birmingham 22000207 158,706 -
93.136 Centers for Disease Control & Prevention Research Institute at Nationwide Childrn 20010182 36,748 -
93.136 Centers for Disease Control & Prevention OH Dept of Health 26090000 19,390 -
93.145 Health Resources & Services Admin Univ of Illinois 22000009 186,396 -
93.172 National Human Genome Research Institute Univ of Michigan 22000005 109,090 -
93.172 National Human Genome Research Institute Univ of North Carolina 22000146 63,003 -
93.172 National Human Genome Research Institute Fred Hutchinson Cancer Research Center 20021734 17,630 -
93.173 Nat In Deafness&Other Commnctn Disorders Univ of Wisconsin 22000006 (165) -
93.173 Nat In Deafness&Other Commnctn Disorders Univ of California - Davis 22000013 14,329 -
93.173 Nat In Deafness&Other Commnctn Disorders Research Institute at Nationwide Childrn 20010182 104,261 7,440
93.173 Nat In Deafness&Other Commnctn Disorders Florida State Univ 22000070 169,919 -
93.173 Nat In Deafness&Other Commnctn Disorders Univ of Pittsburgh 22000036 227,972 -
93.173 Nat In Deafness&Other Commnctn Disorders Oregon Health and Science University 22000252 103,092 -
93.213 Nat Ctr Complementary & Integrative Hlth Research Institute at Nationwide Childrn 20010182 22,708 -
93.226 Agency for Healthcare Res & Quality Washington Univ 22000209 1,834 -
93.226 Agency for Healthcare Res & Quality Case Western Reserve Univ 22000238 11,653 -
93.226 Agency for Healthcare Res & Quality AcademyHealth 20022065 8,577 -
93.226 Agency for Healthcare Res & Quality Univ of California - San Francisco 22000317 11,777 -
93.242 National Institute of Mental Health Univ of South Carolina 22000241 19,014 -
93.242 National Institute of Mental Health Univ of Washington 22000212 9,795 -
93.242 National Institute of Mental Health Univ of North Carolina 22000146 66,951 -
93.242 National Institute of Mental Health Emory Univ 22000295 115,042 -
93.242 National Institute of Mental Health Kitware, Inc 10012569 17,706 -
93.242 National Institute of Mental Health Univ of Massachusetts - Worcester 22000318 55,931 -
93.242 National Institute of Mental Health McMaster University 22010057 12,173 -
93.242 National Institute of Mental Health Univ of Oregon 22000308 100,567 -
93.242 National Institute of Mental Health Univ of Pennsylvania 22000195 71,782 -

See Accompanying Notes to the Schedule of Expenditures of Federal Awards 111
THE OHIO STATE UNIVERSITYSCHEDULE OF EXPENDITURES OF FEDERAL AWARDSFOR THE YEAR ENDED JUNE 30, 2017
CFDA Pass-Through Federal Expenditures
Number Federal Agency Sponsor Pass-Through Sponsor I.D. Number Expenditures to Subrecipients
Research and Development Cluster —
Pass-through from other sources:
93.243 Substance Abuse &MentalHealthServsAdmin OH Dept of Mental Hlth & Addiction Svcs 26420000 60,499 -
93.243 Substance Abuse &MentalHealthServsAdmin Hoh Indian Tribe 24000612 92,193 -
93.243 Substance Abuse &MentalHealthServsAdmin Miami Univ 22000049 17,731 -
93.262 Centers for Disease Control & Prevention Univ of Wisconsin 22000006 58,937 -
93.262 Nat Inst Occupational Safety & Health Univ of Michigan 22000005 2,579 -
93.262 Nat Inst Occupational Safety & Health Univ of Louisville 22000299 80,988 -
93.262 Nat Inst Occupational Safety & Health Univ of Kentucky 22000143 (187) -
93.273 Nat Inst on Alcohol Abuse & Alcoholism Pennsylvania State Univ 22000030 24,222 -
93.273 Nat Inst on Alcohol Abuse & Alcoholism Pacific Inst for Research and Evaluation 20021888 50,259 -
93.279 National Institute on Drug Abuse Pacific Inst for Research and Evaluation 20021888 84,738 -
93.279 National Institute on Drug Abuse Dartmouth College 22000234 97,907 -
93.279 National Institute on Drug Abuse Univ of Memphis 22000325 7,022 -
93.283 Centers for Disease Control & Prevention Ohio University 22000130 3,543 -
93.286 Nat In Biomedical Imaging&Bioengineering Univ of Memphis 22000325 175,636 -
93.286 Nat In Biomedical Imaging&Bioengineering Wayne State Univ 22000034 43,796 -
93.286 Nat In Biomedical Imaging&Bioengineering Cold Spring Harbor Laboratory 20022320 106,331 -
93.307 Nat In Minority Hlth & Hlth Disparities Case Western Reserve Univ 22000238 46,980 -
93.307 Nat In Minority Hlth & Hlth Disparities Rice University 22000231 52,069 -
93.310 Nat Ctr for Advancing Translational Scis Univ of Florida 22000108 335,447 -
93.310 Nat Ctr for Advancing Translational Scis Univ of Louisville 22000299 165,211 -
93.310 Nat Inst of Health, Ofc of the Director New York University 22000254 20,635 -
93.310 Nat In Diabetes&Digestive&KidneyDiseases Univ of Florida 22000108 77,435 -
93.325 Centers for Disease Control & Prevention Univ of Louisville 22000299 59,763 -
93.35 Nat Ctr for Advancing Translational Scis EXCMR, Ltd. 10020229 13,142 -
93.35 Nat Ctr for Advancing Translational Scis Vanderbilt Univ 22000296 10,691 -
93.35 National Institutes of Health Wake Forest Univ 22000286 10,050 -
93.361 National Institute of Nursing Research Vidatak, LLC 10013342 188,677 -
93.361 National Institute of Nursing Research MetalloPharm, LLC 10020354 102,108 -
93.393 National Cancer Institute Univ of Arkansas 22000239 13,726 -
93.393 National Cancer Institute Univ of Michigan 22000005 958 -
93.393 National Cancer Institute Roswell Park Cancer Institute 20021570 32,241 -
93.393 National Cancer Institute Univ of Utah 22000145 6,652 -
93.393 National Cancer Institute Univ of Washington 22000212 56,173 -
93.393 National Cancer Institute Washington Univ 22000209 5,043 -
93.393 National Cancer Institute Fred Hutchinson Cancer Research Center 20021734 400,763 -
93.393 National Cancer Institute Univ of Pennsylvania 22000195 (3) -
93.393 National Cancer Institute Rice University 22000231 1,373 -
93.393 National Cancer Institute Icahn School of Medicine at Mount Sinai 22010031 (56) -
93.393 National Cancer Institute Georgetown Univ 22000339 (503) -
93.393 National Cancer Institute Thomas Jefferson Univ 22010026 (795) -
93.393 National Cancer Institute Univ of Miami 22000255 (1,561) -
93.393 National Cancer Institute Kaiser Permanente 20021732 435 -

See Accompanying Notes to the Schedule of Expenditures of Federal Awards 112
THE OHIO STATE UNIVERSITYSCHEDULE OF EXPENDITURES OF FEDERAL AWARDSFOR THE YEAR ENDED JUNE 30, 2017
CFDA Pass-Through Federal Expenditures
Number Federal Agency Sponsor Pass-Through Sponsor I.D. Number Expenditures to Subrecipients
Research and Development Cluster —
Pass-through from other sources:
93.393 National Cancer Institute Nat Opinion Res Ctr 20020932 29,379 -
93.394 National Cancer Institute Univ of Louisville 22000299 3,656 -
93.394 National Cancer Institute Hyper Tech Res Inc 10020102 146,691 -
93.394 National Cancer Institute Columbia University 22000135 29,142 -
93.394 National Cancer Institute Washington Univ 22000209 1,155,089 -
93.394 National Cancer Institute West Virginia Univ 22000032 28,216 -
93.394 National Cancer Institute Case Western Reserve Univ 22000238 159,183 -
93.394 National Cancer Institute Luna Innovations Inc 10012514 49,971 -
93.394 National Cancer Institute Univ of Texas M D Anderson Cancer Center 22010039 155,278 -
93.394 National Cancer Institute ImCare BioTech 10013526 4,038 -
93.394 National Cancer Institute City of Hope 20021701 49,581 -
93.395 National Cancer Institute Michigan State Univ 22000044 11,217 -
93.395 National Cancer Institute Univ of Minnesota 22000067 (40,919) -
93.395 National Cancer Institute Univ of Maryland 22000120 6,764 -
93.395 National Cancer Institute Univ of Michigan 22000005 (275) -
93.395 National Cancer Institute Univ of California - Los Angeles 22000269 91,549 -
93.395 National Cancer Institute Univ of California - San Diego 22000288 776,575 -
93.395 National Cancer Institute Univ of Akron 22000066 12,626 -
93.395 National Cancer Institute Univ of North Carolina 22000146 53,486 -
93.395 National Cancer Institute North Dakota State Univ 22000263 33,456 -
93.395 National Cancer Institute West Virginia Univ 22000032 16,436 -
93.395 National Cancer Institute Univ of Kentucky 22000143 47,130 -
93.395 National Cancer Institute Fred Hutchinson Cancer Research Center 20021734 9,007 -
93.395 National Cancer Institute Oregon Health and Science University 22000252 11,988 -
93.395 National Cancer Institute Case Western Reserve Univ 22000238 5,478 -
93.395 National Cancer Institute Emory Univ 22000295 119,008 -
93.395 National Cancer Institute Icahn School of Medicine at Mount Sinai 22010031 24,191 -
93.395 National Cancer Institute Georgetown Univ 22000339 4,120 -
93.395 National Cancer Institute City of Hope 20021701 401,432 -
93.395 National Cancer Institute John Wayne Cancer Inst 20021377 2,483 -
93.395 National Cancer Institute Brigham & Women's Hosp Inc 20021152 58,536 -
93.395 National Cancer Institute Am Coll of Radiology 20020917 1,268,911 -
93.395 National Cancer Institute Stanford Univ 22000142 291,469 -
93.395 National Cancer Institute Mayo Fdn for Medical Educ & Res 20010289 287,120 -
93.395 National Cancer Institute The EMMES Corp 10012757 (1,673) -
93.395 National Cancer Institute NRG Oncology 20022229 78,132 -
93.395 National Cancer Institute Dana-Farber Cancer Inst 20021438 75,100 -
93.395 National Cancer Institute Univ of Texas Hlth Sci Ctr - San Antonio 22000330 657,077 175,588
93.395 National Cancer Institute The Children's Hospital of Philadelphia 20020015 92,794 -
93.395 National Cancer Institute Corvida Medical 10013472 3,036 -
93.395 National Cancer Institute Harvard Univ 22000169 12,651 -
93.396 National Cancer Institute Univ of Arizona 22000116 167,318 -

See Accompanying Notes to the Schedule of Expenditures of Federal Awards 113
THE OHIO STATE UNIVERSITYSCHEDULE OF EXPENDITURES OF FEDERAL AWARDSFOR THE YEAR ENDED JUNE 30, 2017
CFDA Pass-Through Federal Expenditures
Number Federal Agency Sponsor Pass-Through Sponsor I.D. Number Expenditures to Subrecipients
Research and Development Cluster —
Pass-through from other sources:
93.396 National Cancer Institute Univ of Kentucky 22000143 87,644 -
93.396 National Cancer Institute Stanford Univ 22000142 187,383 -
93.396 National Cancer Institute Tufts Medical Ctr 20021543 236,930 -
93.397 National Cancer Institute Columbia University 22000135 1,226 -
93.397 National Cancer Institute Univ of Kentucky 22000143 140,507 -
93.397 National Cancer Institute Univ of Texas Southwestern Med Ctr 22000316 15,045 -
93.397 National Cancer Institute SARC 20022185 332,416 -
93.397 National Institutes of Health Wake Forest Univ 22000286 2,000 -
93.398 National Cancer Institute OhioHealth Research and Innovation Inst 20022301 2,431 -
93.424 Centers for Disease Control & Prevention OH Dept of Health 26090000 89,561 -
93.424 Centers for Disease Control & Prevention OH Dept of Aging 26280000 8,129 -
93.424 Centers for Disease Control & Prevention Assn State and Territorial Hlth Ofcls 20021937 5,226 -
93.433 Administration for Community Living Univ of Minnesota 22000067 17,148 -
93.506 Ctrs for Medicare & Medicaid Services OH Dept of Medicaid 26680000 15,461 -
93.516 Health Resources & Services Admin Univ of Illinois 22000009 83,041 -
93.516 Health Resources & Services Admin Columbia University 22000135 1,490 -
93.524 Centers for Disease Control & Prevention OH Dept of Aging 26280000 14,977 -
93.524 Centers for Disease Control & Prevention Nat Assn of Chronic Disease Directors 20021838 18,213 -
93.590 Administration for Children and Families OH Children's Trust Fund 26230100 117,759 -
93.600 Administration for Children and Families OH Dept of Educ 26080000 24,997 -
93.600 US Department of Health & Human Services OH Dept of Health 26090000 (5,831) -
93.600 Public Health Service Nat Marrow Donor Prog 20021576 4,228 -
93.600 Agency for Healthcare Res & Quality Truven Health Analytics 10030250 71,059 -
93.601 Administration for Community Living Lewin Group (The) 10013752 59,608 43,520
93.601 Biomed Advanced Res & Dev Authority AtoxBio 10030325 3,960 -
93.624 Ctrs for Medicare & Medicaid Services OH Dept of Medicaid 26680000 108,978 -
93.630 Administration for Children and Families Wright State Univ 22000087 6,471 -
93.630 US Department of Health & Human Services OH Developmental Disabilities Plng Cncl 26430100 31,145 -
93.630 US Department of Health & Human Services Central State University 22000111 12,118 -
93.640 National Institutes of Health Univ of Florida 22000108 95,086 -
93.640 National Institutes of Health MetalloPharm, LLC 10020354 (1,758) -
93.640 National Institutes of Health Univ of Texas Hlth Sci Ctr - San Antonio 22000330 13,000 -
93.640 National Institutes of Health Alliance for Clinical Trials in Oncology 20022076 (2,285) -
93.640 National Institutes of Health Viocare, Inc. 10013075 49,864 -
93.640 National Institutes of Health Ball State Univ 22000218 4,578 -
93.640 National Cancer Institute Univ of Houston 22000092 85,213 -
93.640 National Cancer Institute Leidos, Inc 10013531 276,100 90,870
93.640 National Cancer Institute City of Hope 20021701 26,214 -
93.640 National Cancer Institute Brigham & Women's Hosp Inc 20021152 169,250 -
93.640 National Cancer Institute Eastern Cooperative Oncology Group 20021810 (4,891) -
93.640 National Cancer Institute The Univ of Oklahoma Health Scis Ctr 22000349 (3,080) -
93.640 National Cancer Institute ECOG-ACRIN Cancer Research Group 20022288 18,205 -
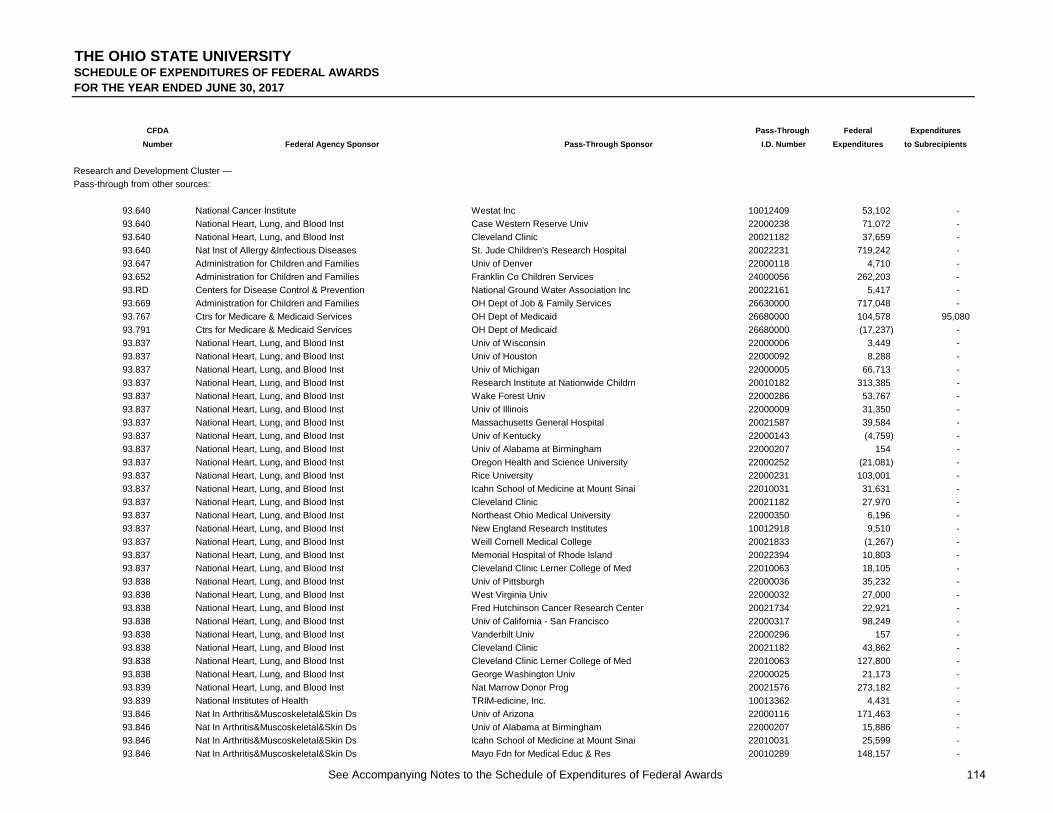
See Accompanying Notes to the Schedule of Expenditures of Federal Awards 114
THE OHIO STATE UNIVERSITYSCHEDULE OF EXPENDITURES OF FEDERAL AWARDSFOR THE YEAR ENDED JUNE 30, 2017
CFDA Pass-Through Federal Expenditures
Number Federal Agency Sponsor Pass-Through Sponsor I.D. Number Expenditures to Subrecipients
Research and Development Cluster —
Pass-through from other sources:
93.640 National Cancer Institute Westat Inc 10012409 53,102 -
93.640 National Heart, Lung, and Blood Inst Case Western Reserve Univ 22000238 71,072 -
93.640 National Heart, Lung, and Blood Inst Cleveland Clinic 20021182 37,659 -
93.640 Nat Inst of Allergy &Infectious Diseases St. Jude Children's Research Hospital 20022231 719,242 -
93.647 Administration for Children and Families Univ of Denver 22000118 4,710 -
93.652 Administration for Children and Families Franklin Co Children Services 24000056 262,203 -
93.RD Centers for Disease Control & Prevention National Ground Water Association Inc 20022161 5,417 -
93.669 Administration for Children and Families OH Dept of Job & Family Services 26630000 717,048 -
93.767 Ctrs for Medicare & Medicaid Services OH Dept of Medicaid 26680000 104,578 95,080
93.791 Ctrs for Medicare & Medicaid Services OH Dept of Medicaid 26680000 (17,237) -
93.837 National Heart, Lung, and Blood Inst Univ of Wisconsin 22000006 3,449 -
93.837 National Heart, Lung, and Blood Inst Univ of Houston 22000092 8,288 -
93.837 National Heart, Lung, and Blood Inst Univ of Michigan 22000005 66,713 -
93.837 National Heart, Lung, and Blood Inst Research Institute at Nationwide Childrn 20010182 313,385 -
93.837 National Heart, Lung, and Blood Inst Wake Forest Univ 22000286 53,767 -
93.837 National Heart, Lung, and Blood Inst Univ of Illinois 22000009 31,350 -
93.837 National Heart, Lung, and Blood Inst Massachusetts General Hospital 20021587 39,584 -
93.837 National Heart, Lung, and Blood Inst Univ of Kentucky 22000143 (4,759) -
93.837 National Heart, Lung, and Blood Inst Univ of Alabama at Birmingham 22000207 154 -
93.837 National Heart, Lung, and Blood Inst Oregon Health and Science University 22000252 (21,081) -
93.837 National Heart, Lung, and Blood Inst Rice University 22000231 103,001 -
93.837 National Heart, Lung, and Blood Inst Icahn School of Medicine at Mount Sinai 22010031 31,631 -
93.837 National Heart, Lung, and Blood Inst Cleveland Clinic 20021182 27,970 -
93.837 National Heart, Lung, and Blood Inst Northeast Ohio Medical University 22000350 6,196 -
93.837 National Heart, Lung, and Blood Inst New England Research Institutes 10012918 9,510 -
93.837 National Heart, Lung, and Blood Inst Weill Cornell Medical College 20021833 (1,267) -
93.837 National Heart, Lung, and Blood Inst Memorial Hospital of Rhode Island 20022394 10,803 -
93.837 National Heart, Lung, and Blood Inst Cleveland Clinic Lerner College of Med 22010063 18,105 -
93.838 National Heart, Lung, and Blood Inst Univ of Pittsburgh 22000036 35,232 -
93.838 National Heart, Lung, and Blood Inst West Virginia Univ 22000032 27,000 -
93.838 National Heart, Lung, and Blood Inst Fred Hutchinson Cancer Research Center 20021734 22,921 -
93.838 National Heart, Lung, and Blood Inst Univ of California - San Francisco 22000317 98,249 -
93.838 National Heart, Lung, and Blood Inst Vanderbilt Univ 22000296 157 -
93.838 National Heart, Lung, and Blood Inst Cleveland Clinic 20021182 43,862 -
93.838 National Heart, Lung, and Blood Inst Cleveland Clinic Lerner College of Med 22010063 127,800 -
93.838 National Heart, Lung, and Blood Inst George Washington Univ 22000025 21,173 -
93.839 National Heart, Lung, and Blood Inst Nat Marrow Donor Prog 20021576 273,182 -
93.839 National Institutes of Health TRIM-edicine, Inc. 10013362 4,431 -
93.846 Nat In Arthritis&Muscoskeletal&Skin Ds Univ of Arizona 22000116 171,463 -
93.846 Nat In Arthritis&Muscoskeletal&Skin Ds Univ of Alabama at Birmingham 22000207 15,886 -
93.846 Nat In Arthritis&Muscoskeletal&Skin Ds Icahn School of Medicine at Mount Sinai 22010031 25,599 -
93.846 Nat In Arthritis&Muscoskeletal&Skin Ds Mayo Fdn for Medical Educ & Res 20010289 148,157 -

See Accompanying Notes to the Schedule of Expenditures of Federal Awards 115
THE OHIO STATE UNIVERSITYSCHEDULE OF EXPENDITURES OF FEDERAL AWARDSFOR THE YEAR ENDED JUNE 30, 2017
CFDA Pass-Through Federal Expenditures
Number Federal Agency Sponsor Pass-Through Sponsor I.D. Number Expenditures to Subrecipients
Research and Development Cluster —
Pass-through from other sources:
93.846 Nat In Arthritis&Muscoskeletal&Skin Ds Children's Mercy Hospitals and Clinics 20021968 (3,475) (2,758)
93.846 Nat In Arthritis&Muscoskeletal&Skin Ds Northwestern University 22000041 138,436 -
93.846 Nat In Arthritis&Muscoskeletal&Skin Ds Cleveland Clinic Fdn 20010421 4,450 -
93.846 Nat In Arthritis&Muscoskeletal&Skin Ds Cincinnati Children's Hos Med Ctr 20021628 15 -
93.847 Nat In Diabetes&Digestive&KidneyDiseases Research Institute at Nationwide Childrn 20010182 66,418 -
93.847 Nat In Diabetes&Digestive&KidneyDiseases Univ of Louisville 22000299 1,690 -
93.847 Nat In Diabetes&Digestive&KidneyDiseases Columbia University 22000135 70,344 -
93.847 Nat In Diabetes&Digestive&KidneyDiseases Case Western Reserve Univ 22000238 9,949 -
93.847 Nat In Diabetes&Digestive&KidneyDiseases Univ of Texas Southwestern Med Ctr 22000316 124,434 -
93.847 Nat In Diabetes&Digestive&KidneyDiseases Minneapolis Medical Research Foundation 20012090 49,648 -
93.847 Nat In Diabetes&Digestive&KidneyDiseases Medical College of Wisconsin 22010058 5,390 -
93.847 Nat In Diabetes&Digestive&KidneyDiseases Baylor College of Medicine 22000361 25,814 -
93.847 Nat In Diabetes&Digestive&KidneyDiseases Univ of South Florida 22000123 83 -
93.847 Nat In Diabetes&Digestive&KidneyDiseases Augusta Univ 22000402 64,182 -
93.847 Nat In Diabetes&Digestive&KidneyDiseases Univ of Virginia 22000203 16,619 -
93.853 Nat Inst Neurological Disorders & Stroke Univ of Minnesota 22000067 290 -
93.853 Nat Inst Neurological Disorders & Stroke Univ of Michigan 22000005 213,500 4,700
93.853 Nat Inst Neurological Disorders & Stroke Research Institute at Nationwide Childrn 20010182 82 -
93.853 Nat Inst Neurological Disorders & Stroke Indiana Univ 22000012 135,651 -
93.853 Nat Inst Neurological Disorders & Stroke Univ of California - San Diego 22000288 132,249 -
93.853 Nat Inst Neurological Disorders & Stroke Univ of Cincinnati 22000074 33,751 -
93.853 Nat Inst Neurological Disorders & Stroke Columbia University 22000135 28,690 -
93.853 Nat Inst Neurological Disorders & Stroke Massachusetts General Hospital 20021587 247,995 -
93.853 Nat Inst Neurological Disorders & Stroke Univ of California - San Francisco 22000317 14,488 -
93.853 Nat Inst Neurological Disorders & Stroke Mayo Fdn for Medical Educ & Res 20010289 4,576 -
93.853 Nat Inst Neurological Disorders & Stroke Northwestern University 22000041 20,251 -
93.853 Nat Inst Neurological Disorders & Stroke Baylor College of Medicine 22000361 81,457 -
93.853 Nat Inst Neurological Disorders & Stroke Beth Israel Deaconess Medical Center 10011582 5,924 -
93.853 Nat Inst Neurological Disorders & Stroke Univ of Rochester 22000193 35,416 -
93.853 Nat Inst Neurological Disorders & Stroke Radikal Therapeutics 10013565 (8,803) -
93.853 Nat Inst Neurological Disorders & Stroke Marquette Univ 22000403 25,286 -
93.855 Nat Inst of Allergy &Infectious Diseases Kansas State Univ 22000062 171,965 -
93.855 Nat Inst of Allergy &Infectious Diseases Univ of Michigan 22000005 12,644 -
93.855 Nat Inst of Allergy &Infectious Diseases Duke Univ 22000094 14,657 -
93.855 Nat Inst of Allergy &Infectious Diseases Research Institute at Nationwide Childrn 20010182 896,708 -
93.855 Nat Inst of Allergy &Infectious Diseases Univ of Louisville 22000299 29,298 -
93.855 Nat Inst of Allergy &Infectious Diseases Indiana Univ 22000012 17,075 -
93.855 Nat Inst of Allergy &Infectious Diseases Univ of Washington 22000212 180,689 -
93.855 Nat Inst of Allergy &Infectious Diseases Columbia University 22000135 226,883 -
93.855 Nat Inst of Allergy &Infectious Diseases Univ of North Carolina 22000146 199,104 -
93.855 Nat Inst of Allergy &Infectious Diseases Univ of Pittsburgh 22000036 931,342 -
93.855 Nat Inst of Allergy &Infectious Diseases Univ of California - San Francisco 22000317 7,325 -

See Accompanying Notes to the Schedule of Expenditures of Federal Awards 116
THE OHIO STATE UNIVERSITYSCHEDULE OF EXPENDITURES OF FEDERAL AWARDSFOR THE YEAR ENDED JUNE 30, 2017
CFDA Pass-Through Federal Expenditures
Number Federal Agency Sponsor Pass-Through Sponsor I.D. Number Expenditures to Subrecipients
Research and Development Cluster —
Pass-through from other sources:
93.855 Nat Inst of Allergy &Infectious Diseases Univ of Massachusetts - Worcester 22000318 24,256 -
93.855 Nat Inst of Allergy &Infectious Diseases Icahn School of Medicine at Mount Sinai 22010031 92,217 -
93.855 Nat Inst of Allergy &Infectious Diseases Brigham & Women's Hosp Inc 20021152 699,411 -
93.855 Nat Inst of Allergy &Infectious Diseases Inst for Clinical Research Inc 20022020 10,083 -
93.855 Nat Inst of Allergy &Infectious Diseases Albert Einstein College of Medicine Inc 20022344 58,021 -
93.855 Nat Inst of Allergy &Infectious Diseases Forsyth Institute 20022165 956 -
93.855 Nat Inst of Allergy &Infectious Diseases Sorrento Therapeutics 10013453 58,154 -
93.855 Nat Inst of Allergy &Infectious Diseases ChromoLogic LLC 10013482 379 -
93.855 Nat Inst of Allergy &Infectious Diseases Yeshiva Univ 22000331 (48) -
93.855 Nat Inst of Allergy &Infectious Diseases Benaroya Research Institute 20022216 33,812 -
93.855 Nat Inst of Allergy &Infectious Diseases Stellenbosch Univ 22010115 7,305 -
93.855 Nat Inst of Allergy &Infectious Diseases Hospital for Sick Children 20022313 67,498 -
93.855 Nat Inst of Allergy &Infectious Diseases Tufts University 22000343 10,349 -
93.855 Nat Inst of Allergy &Infectious Diseases Family Health Intl 20022342 68,054 -
93.855 Nat Inst of Allergy &Infectious Diseases Meharry Medical College 22000213 48,136 -
93.855 Nat Inst of Health, Ofc of the Director Albert Einstein College of Medicine Inc 20022344 16,803 -
93.855 National Cancer Institute Fred Hutchinson Cancer Research Center 20021734 (19,504) -
93.856 Nat Inst of Allergy &Infectious Diseases North Carolina State Univ 22000136 45,546 -
93.856 Nat Inst of Allergy &Infectious Diseases Univ of North Carolina 22000146 10,478 -
93.859 Nat Inst Gen Medical Scis Iowa State Univ 22000047 13,333 -
93.859 Nat Inst Gen Medical Scis Rutgers Univ 22000003 61,121 -
93.859 Nat Inst Gen Medical Scis Univ of California - Davis 22000013 9,651 -
93.859 Nat Inst Gen Medical Scis Florida State Univ 22000070 10,518 -
93.859 Nat Inst Gen Medical Scis New York University 22000254 244,604 -
93.859 Nat Inst Gen Medical Scis Univ of Pittsburgh 22000036 59,596 -
93.859 Nat Inst Gen Medical Scis Oregon Health and Science University 22000252 27,693 -
93.859 Nat Inst Gen Medical Scis Univ of Texas Hlth Sci Ctr - San Antonio 22000330 65,237 -
93.859 Nat Inst Gen Medical Scis Cleveland Clinic 20021182 35,827 -
93.859 Nat Inst Gen Medical Scis The Scripps Research Institute 20021352 192,412 -
93.859 Nat Inst Gen Medical Scis NeuroWave Systems Inc. 10020303 56,428 -
93.859 Nat Inst Gen Medical Scis Northeastern Univ 22000329 56,788 -
93.865 Nat Inst Child Health & HumanDevelopment Pennsylvania State Univ 22000030 53,650 -
93.865 Nat Inst Child Health & HumanDevelopment Virginia Polytechnic Inst 22000023 242,585 24,790
93.865 Nat Inst Child Health & HumanDevelopment Research Institute at Nationwide Childrn 20010182 344,070 -
93.865 Nat Inst Child Health & HumanDevelopment Univ of Utah 22000145 7,517 -
93.865 Nat Inst Child Health & HumanDevelopment Univ of Connecticut 22000076 66,959 -
93.865 Nat Inst Child Health & HumanDevelopment Univ of Colorado 22000039 12,921 -
93.865 Nat Inst Child Health & HumanDevelopment Univ of North Carolina 22000146 123,566 -
93.865 Nat Inst Child Health & HumanDevelopment Bowling Green State University 22000221 66,013 -
93.865 Nat Inst Child Health & HumanDevelopment Univ of Texas at Austin 22000270 236,191 -
93.865 Nat Inst Child Health & HumanDevelopment Univ of Pittsburgh 22000036 7,661 -
93.865 Nat Inst Child Health & HumanDevelopment Univ of Kansas 22000219 95,481 -
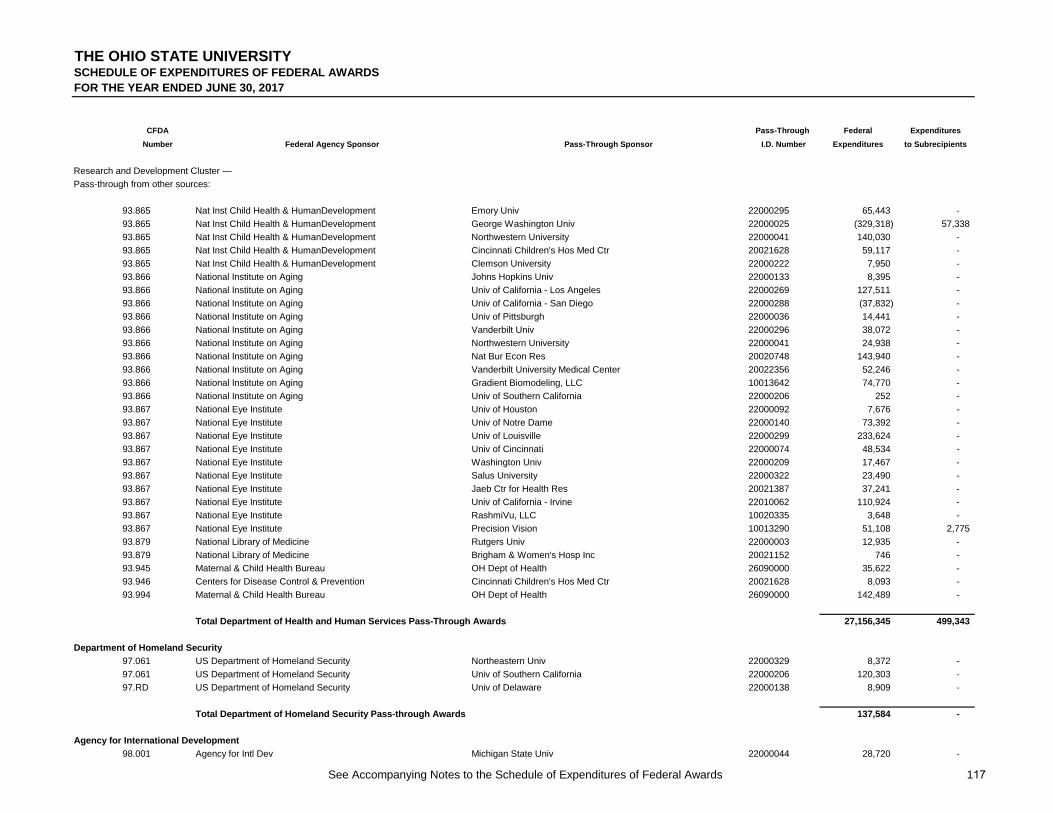
See Accompanying Notes to the Schedule of Expenditures of Federal Awards 117
THE OHIO STATE UNIVERSITYSCHEDULE OF EXPENDITURES OF FEDERAL AWARDSFOR THE YEAR ENDED JUNE 30, 2017
CFDA Pass-Through Federal Expenditures
Number Federal Agency Sponsor Pass-Through Sponsor I.D. Number Expenditures to Subrecipients
Research and Development Cluster —
Pass-through from other sources:
93.865 Nat Inst Child Health & HumanDevelopment Emory Univ 22000295 65,443 -
93.865 Nat Inst Child Health & HumanDevelopment George Washington Univ 22000025 (329,318) 57,338
93.865 Nat Inst Child Health & HumanDevelopment Northwestern University 22000041 140,030 -
93.865 Nat Inst Child Health & HumanDevelopment Cincinnati Children's Hos Med Ctr 20021628 59,117 -
93.865 Nat Inst Child Health & HumanDevelopment Clemson University 22000222 7,950 -
93.866 National Institute on Aging Johns Hopkins Univ 22000133 8,395 -
93.866 National Institute on Aging Univ of California - Los Angeles 22000269 127,511 -
93.866 National Institute on Aging Univ of California - San Diego 22000288 (37,832) -
93.866 National Institute on Aging Univ of Pittsburgh 22000036 14,441 -
93.866 National Institute on Aging Vanderbilt Univ 22000296 38,072 -
93.866 National Institute on Aging Northwestern University 22000041 24,938 -
93.866 National Institute on Aging Nat Bur Econ Res 20020748 143,940 -
93.866 National Institute on Aging Vanderbilt University Medical Center 20022356 52,246 -
93.866 National Institute on Aging Gradient Biomodeling, LLC 10013642 74,770 -
93.866 National Institute on Aging Univ of Southern California 22000206 252 -
93.867 National Eye Institute Univ of Houston 22000092 7,676 -
93.867 National Eye Institute Univ of Notre Dame 22000140 73,392 -
93.867 National Eye Institute Univ of Louisville 22000299 233,624 -
93.867 National Eye Institute Univ of Cincinnati 22000074 48,534 -
93.867 National Eye Institute Washington Univ 22000209 17,467 -
93.867 National Eye Institute Salus University 22000322 23,490 -
93.867 National Eye Institute Jaeb Ctr for Health Res 20021387 37,241 -
93.867 National Eye Institute Univ of California - Irvine 22010062 110,924 -
93.867 National Eye Institute RashmiVu, LLC 10020335 3,648 -
93.867 National Eye Institute Precision Vision 10013290 51,108 2,775
93.879 National Library of Medicine Rutgers Univ 22000003 12,935 -
93.879 National Library of Medicine Brigham & Women's Hosp Inc 20021152 746 -
93.945 Maternal & Child Health Bureau OH Dept of Health 26090000 35,622 -
93.946 Centers for Disease Control & Prevention Cincinnati Children's Hos Med Ctr 20021628 8,093 -
93.994 Maternal & Child Health Bureau OH Dept of Health 26090000 142,489 -
Total Department of Health and Human Services Pass-Through Awards 27,156,345 499,343
Department of Homeland Security
97.061 US Department of Homeland Security Northeastern Univ 22000329 8,372 -
97.061 US Department of Homeland Security Univ of Southern California 22000206 120,303 -
97.RD US Department of Homeland Security Univ of Delaware 22000138 8,909 -
Total Department of Homeland Security Pass-through Awards 137,584 -
Agency for International Development
98.001 Agency for Intl Dev Michigan State Univ 22000044 28,720 -

See Accompanying Notes to the Schedule of Expenditures of Federal Awards 118
THE OHIO STATE UNIVERSITYSCHEDULE OF EXPENDITURES OF FEDERAL AWARDSFOR THE YEAR ENDED JUNE 30, 2017
CFDA Pass-Through Federal Expenditures
Number Federal Agency Sponsor Pass-Through Sponsor I.D. Number Expenditures to Subrecipients
Research and Development Cluster —
Pass-through from other sources:
98.001 Agency for Intl Dev Purdue Univ 22000002 15,686 1,825
98.001 Agency for Intl Dev Univ of California - Davis 22000013 239,793 92,081
98.001 Agency for Intl Dev Virginia Polytechnic Inst 22000023 369,949 238,673
98.001 Agency for Intl Dev Research Institute at Nationwide Childrn 20010182 18,411 -
98.001 Agency for Intl Dev National Academy of Sciences 31020000 35,838 -
98.011 Agency for Intl Dev Purdue Univ 22000002 31,144 -
Total Agency for International Development Pass-Through Awards 739,541 332,579
Subtotal pass-through from other sources 63,478,147$ 1,609,007$
Total Research and Development Cluster 356,322,588$ 42,229,131$

See Accompanying Notes to the Schedule of Expenditures of Federal Awards 119
THE OHIO STATE UNIVERSITYSCHEDULE OF EXPENDITURES OF FEDERAL AWARDSFOR THE YEAR ENDED JUNE 30, 2017
CFDA Federal Expenditures
Number Federal Agency Sponsor Expenditures to Subrecipients
Student Financial Aid Cluster ─Funds received directly from the following federal agencies:
Department of Education
84.007 Supplemental Education Opportunity Grant 1,199,192$ -$
84.033 Federal Workstudy Program 2,958,522 -
84.038 Perkins Loans outstanding balance at 7/1/2016 34,012,317 -
84.038 Perkins Loans advances during fiscal year 6,647,276 -
84.038 Perkins adminstrative cost allowance and collection costs 316,600
84.063 Pell Grant Program 50,657,693 -
84.268 Direct Lending subsidized student advances during fiscal year 2017 68,661,907 -
84.268 Direct Lending unsubsidized student advances during fiscal year 2017 192,159,820 -
84.268 Direct Lending parent (undergraduate) advances during fiscal year 2017 52,100,662 -
84.268 Direct Lending parent (graduate) advances during fiscal year 2017 34,890,908 -
84.379 Teacher Ed Assistance for College and Higher Ed Grants 67,088
Total Department of Education Direct Awards 443,671,985 -
Department of Health and Human Services
93.264 Nursing Faculty Loans outstanding balance at 7/1/2016 541,183 -
93.264 Nursing Faculty Loans advances during fiscal year 191,048 -
93.342 Health Professions Student Loans outstanding balance at 7/1/2016 15,859,429 -
93.342 Health Professions Student Loans advances during fiscal year 2,481,947 -
93.342 Primary Care Loans, outstanding balance at 7/1/2016 1,196,937 -
93.342 Disadvantaged Student Loans outstanding balance at 7/1/2016 254,430 -
93.364 Nursing Student Loans outstanding balance at 7/1/2016 1,345,300 -
93.364 Nursing Student Loans advances during fiscal year 103,354 -
93.408 ARRA Nursing Faculty Loan outstanding balance at 7/1/2016 16,914 -
Total Department of Health and Human Services Direct Awards 21,990,542 -
Subtotal Student Financial Aid Cluster 465,662,527$ -$
Economic Development Cluster ─Funds received directly from the following federal agencies:
Department of Commerce
11.307 Econ Dev Admin 2,429,975$ 15,887$
Total Department of Commerce Direct Awards 2,429,975 15,887
Subtotal Economic Development Cluster 2,429,975$ 15,887$
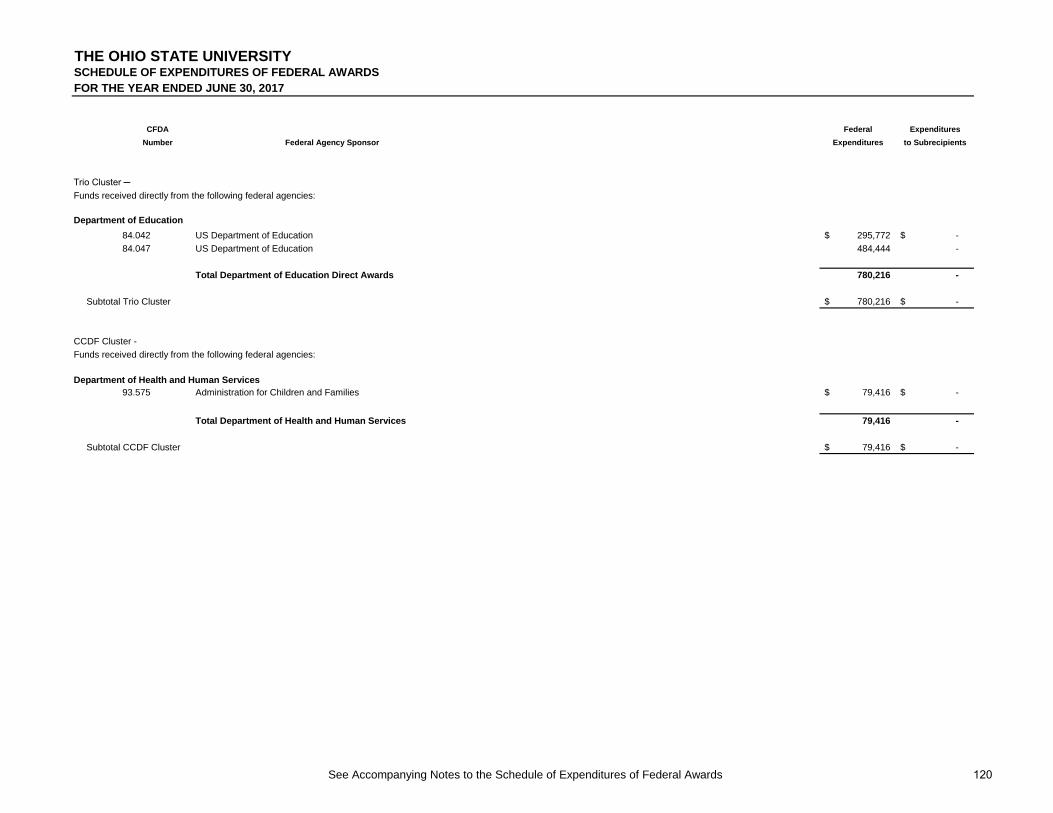
See Accompanying Notes to the Schedule of Expenditures of Federal Awards 120
THE OHIO STATE UNIVERSITYSCHEDULE OF EXPENDITURES OF FEDERAL AWARDSFOR THE YEAR ENDED JUNE 30, 2017
CFDA Federal Expenditures
Number Federal Agency Sponsor Expenditures to Subrecipients
Trio Cluster ─Funds received directly from the following federal agencies:
Department of Education
84.042 US Department of Education 295,772$ -$
84.047 US Department of Education 484,444 -
Total Department of Education Direct Awards 780,216 -
Subtotal Trio Cluster 780,216$ -$
CCDF Cluster -
Funds received directly from the following federal agencies:
Department of Health and Human Services93.575 Administration for Children and Families 79,416$ -$
Total Department of Health and Human Services 79,416 -
Subtotal CCDF Cluster 79,416$ -$

See Accompanying Notes to the Schedule of Expenditures of Federal Awards 121
THE OHIO STATE UNIVERSITYSCHEDULE OF EXPENDITURES OF FEDERAL AWARDSFOR THE YEAR ENDED JUNE 30, 2017
CFDA Pass-Through Federal Expenditures
Number Federal Agency Sponsor Pass-Through Sponsor I.D. Number Expenditures to Subrecipients
Supplemental Nutrition Assistance Program (SNAP) Cluster ─Pass throughs from other sources:
Department of Agriculture
10.561 USDA Food and Nutrition Service OH Dept of Job & Family Services 26630000 8,532,317$ 465,010$
Total Department of Agriculture Pass-Through Awards 8,532,317 465,010
Subtotal Supplemental Nutrition Assistance Program (SNAP) Cluster 8,532,317$ 465,010$
Community Development Block Grant (CDBG) Entitlements Grants Cluster ─Pass throughs from other sources:
Department of Housing and Urban Development
14.218 Department of Housing & Urban Dev City of Columbus 24000306 4,809$ -$
14.218 Department of Housing & Urban Dev Cleveland Dept of Community Development 24000528 27,230 -
14.218 Department of Housing & Urban Dev City of Dayton 24000572 27,653 -
14.218 Department of Housing & Urban Dev Franklin Co Board of Commissioners 24000576 22,604 -
Total Department of Housing and Urban Development Pass-Through Awards 82,296 -
Subtotal Community Development Block Grant (CDBG) Entitlements Grants Cluster 82,296$ -$
Fish and Wildlife Cluster ─Pass throughs from other sources:
Department of the Interior
15.605 US Fish and Wildlife Service OH Division of Wildlife 26110100 1,509,365$ 47,381$
15.611 US Fish and Wildlife Service OH Division of Wildlife 26110100 345,961 -
15.611 US Department of the Interior OH Division of Wildlife 26110100 540,509 -
886,470 -
Total Department of the Interior Pass-Through Awards 2,395,835 47,381
Subtotal Fish and Wildlife Cluster 2,395,835$ 47,381$
Workforce Innovation and Opportunities Act (WIOA) Cluster ─Pass throughs from other sources:
Department of Labor
17.258 US Department of Labor Central Ohio Workforce Investment Corp 20021603 2,835$ -$
17.258 US Department of Labor OH Dept of Job & Family Services 26630000 48,285 -
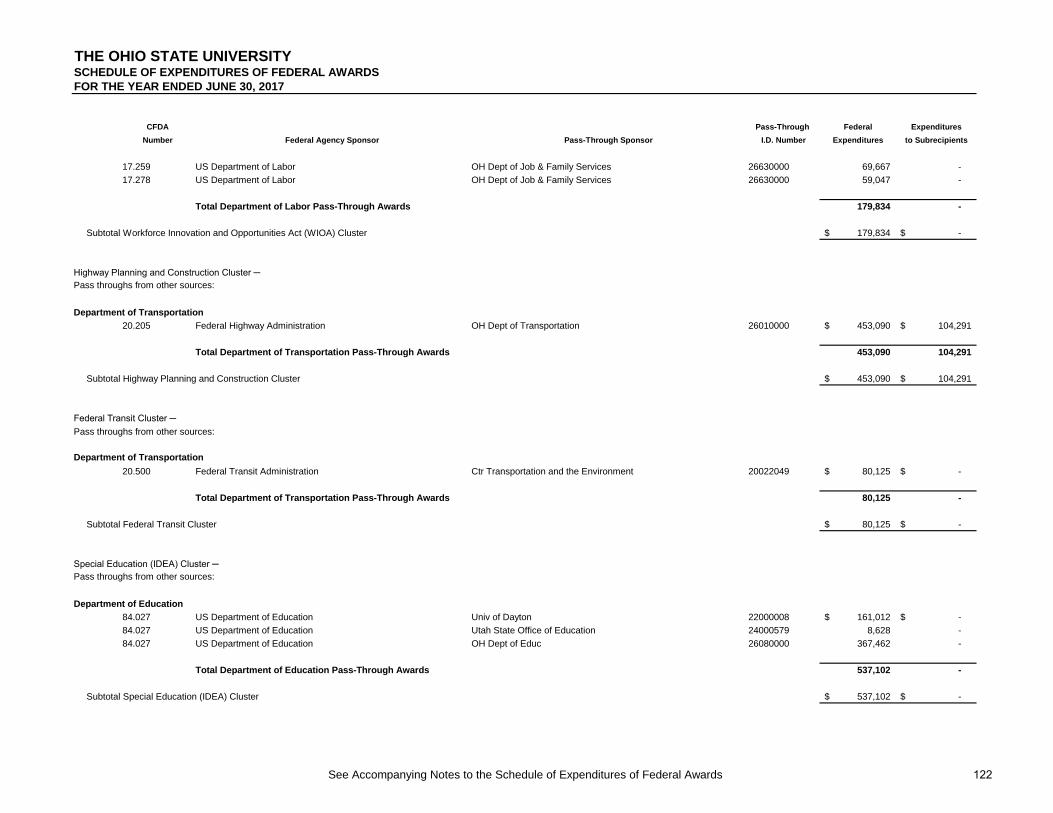
See Accompanying Notes to the Schedule of Expenditures of Federal Awards 122
THE OHIO STATE UNIVERSITYSCHEDULE OF EXPENDITURES OF FEDERAL AWARDSFOR THE YEAR ENDED JUNE 30, 2017
CFDA Pass-Through Federal Expenditures
Number Federal Agency Sponsor Pass-Through Sponsor I.D. Number Expenditures to Subrecipients
17.259 US Department of Labor OH Dept of Job & Family Services 26630000 69,667 -
17.278 US Department of Labor OH Dept of Job & Family Services 26630000 59,047 -
Total Department of Labor Pass-Through Awards 179,834 -
Subtotal Workforce Innovation and Opportunities Act (WIOA) Cluster 179,834$ -$
Highway Planning and Construction Cluster ─Pass throughs from other sources:
Department of Transportation
20.205 Federal Highway Administration OH Dept of Transportation 26010000 453,090$ 104,291$
Total Department of Transportation Pass-Through Awards 453,090 104,291
Subtotal Highway Planning and Construction Cluster 453,090$ 104,291$
Federal Transit Cluster ─Pass throughs from other sources:
Department of Transportation
20.500 Federal Transit Administration Ctr Transportation and the Environment 20022049 80,125$ -$
Total Department of Transportation Pass-Through Awards 80,125 -
Subtotal Federal Transit Cluster 80,125$ -$
Special Education (IDEA) Cluster ─Pass throughs from other sources:
Department of Education
84.027 US Department of Education Univ of Dayton 22000008 161,012$ -$
84.027 US Department of Education Utah State Office of Education 24000579 8,628 -
84.027 US Department of Education OH Dept of Educ 26080000 367,462 -
Total Department of Education Pass-Through Awards 537,102 -
Subtotal Special Education (IDEA) Cluster 537,102$ -$

See Accompanying Notes to the Schedule of Expenditures of Federal Awards 123
THE OHIO STATE UNIVERSITYSCHEDULE OF EXPENDITURES OF FEDERAL AWARDSFOR THE YEAR ENDED JUNE 30, 2017
CFDA Pass-Through Federal Expenditures
Number Federal Agency Sponsor Pass-Through Sponsor I.D. Number Expenditures to Subrecipients
Temporary Assistance for Needy Families (TANF) Cluster ─Pass throughs from other sources:
Department of Health and Human Services
93.558 Administration for Children and Families After-School All-Stars Ohio 20022119 10,598$ - 93.558 Administration for Children and Families Butler County Board of Commissioners 24000522 241,622 -
93.558 Administration for Children and Families OH Gov Ofc Faith-Based & Comm Initiative 26000003 254,698 -
Total Department of Health and Human Services Pass-Through Awards 506,918 -
Subtotal Temporary Assistance for Need Families (TANF) Grants Cluster 506,918$ -$
Medicaid Cluster -
Pass throughs from other sources:
Department of Health and Human Services
93.778 Ctrs for Medicare & Medicaid Cincinnati Children's Hos Med Ctr 20021628 164,212$ -$
93.778 Ctrs for Medicare & Medicaid OH Dept of Medicaid 26680000 20,226,254 12,974,652
Total Department of Health and Human Services Pass-Through Awards 20,390,466 12,974,652
Subtotal Medicaid Cluster 20,390,466$ 12,974,652$
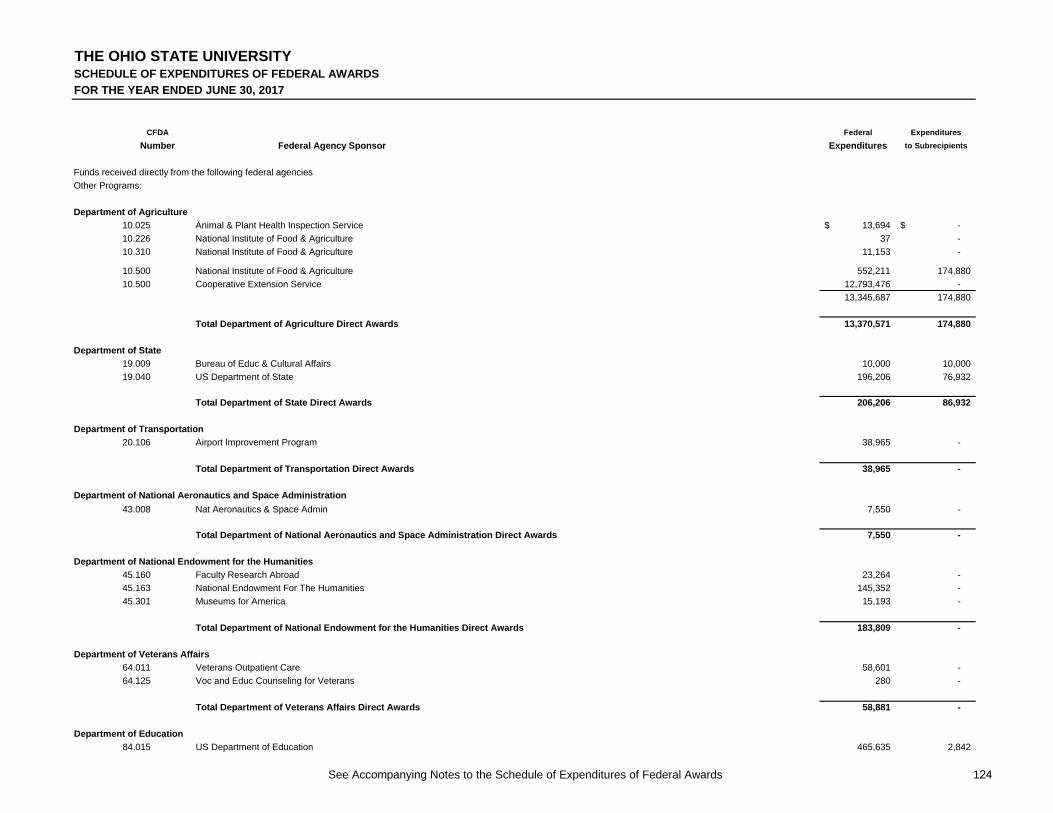
See Accompanying Notes to the Schedule of Expenditures of Federal Awards 124
THE OHIO STATE UNIVERSITYSCHEDULE OF EXPENDITURES OF FEDERAL AWARDS
FOR THE YEAR ENDED JUNE 30, 2017
CFDA Federal Expenditures
Number Federal Agency Sponsor Expenditures to Subrecipients
Funds received directly from the following federal agencies
Other Programs:
Department of Agriculture
10.025 Animal & Plant Health Inspection Service 13,694$ -$
10.226 National Institute of Food & Agriculture 37 -
10.310 National Institute of Food & Agriculture 11,153 -
10.500 National Institute of Food & Agriculture 552,211 174,880
10.500 Cooperative Extension Service 12,793,476 -
13,345,687 174,880
Total Department of Agriculture Direct Awards 13,370,571 174,880
Department of State
19.009 Bureau of Educ & Cultural Affairs 10,000 10,000
19.040 US Department of State 196,206 76,932
Total Department of State Direct Awards 206,206 86,932
Department of Transportation
20.106 Airport Improvement Program 38,965 -
Total Department of Transportation Direct Awards 38,965 -
Department of National Aeronautics and Space Administration
43.008 Nat Aeronautics & Space Admin 7,550 -
Total Department of National Aeronautics and Space Administration Direct Awards 7,550 -
Department of National Endowment for the Humanities
45.160 Faculty Research Abroad 23,264 -
45.163 National Endowment For The Humanities 145,352 -
45.301 Museums for America 15,193 -
Total Department of National Endowment for the Humanities Direct Awards 183,809 -
Department of Veterans Affairs
64.011 Veterans Outpatient Care 58,601 -
64.125 Voc and Educ Counseling for Veterans 280 -
Total Department of Veterans Affairs Direct Awards 58,881 -
Department of Education
84.015 US Department of Education 465,635 2,842

See Accompanying Notes to the Schedule of Expenditures of Federal Awards 125
THE OHIO STATE UNIVERSITYSCHEDULE OF EXPENDITURES OF FEDERAL AWARDS
FOR THE YEAR ENDED JUNE 30, 2017
CFDA Federal Expenditures
Number Federal Agency Sponsor Expenditures to Subrecipients
Funds received directly from the following federal agencies
Other Programs:
84.022 Student Research Abroad 70,660 -
84.325 US Department of Education 236,752 -
84.327 US Department of Education 282,826 88,761
Total Department of Education Direct Awards 1,055,873 91,603
Department of Health and Human Services
93.600 Administration for Children and Families 3,212,479 100,550
93.667 Social Services Block Grant 181,870 -
Total Department of Health and Human Services Direct Awards 3,394,349 100,550
Department of Homeland Security
97.U01 Department of Homeland Security 25,597 -
Total Department of Homeland Security Direct Awards 25,597 -
Subtotal funds received directly from federal agencies 18,341,801$ 453,965$

See Accompanying Notes to the Schedule of Expenditures of Federal Awards 126
THE OHIO STATE UNIVERSITYSCHEDULE OF EXPENDITURES OF FEDERAL AWARDSFOR THE YEAR ENDED JUNE 30, 2017
CFDA Pass-Through Federal Expenditures
Number Federal Agency Sponsor Pass-Through Sponsor I.D. Number Expenditures to Subrecipients
Pass-through from other sources:
Other Programs:
Department of Agriculture
10.170 Agricultural Marketing Service Ohio Department Of Agriculture 26390000 21,776$ -$
10.215 National Institute of Food & Agriculture Univ of Minnesota 22000067 62,736 -
10.303 National Institute of Food & Agriculture Univ of Illinois 22000009 (100) -
10.310 National Institute of Food & Agriculture Univ of Wisconsin 22000006 6,773 -
10.319 National Institute of Food & Agriculture Cornell University 22000081 70,793 -
10.329 National Institute of Food & Agriculture Univ of Minnesota 22000067 1,020 -
10.329 National Institute of Food & Agriculture Univ of Illinois 22000009 9,319 -
10,339 -
10.331 National Institute of Food & Agriculture Wholesome Wave 20022283 53,427 -
10.500 National Institute of Food & Agriculture Univ of Nebraska 22000085 38,963 33,855
10.500 National Institute of Food & Agriculture Kansas State Univ 22000062 25,382 -
10.500 National Institute of Food & Agriculture Michigan State Univ 22000044 25,712 -
90,057 33,855
10.558 US Department of Agriculture OH Dept of Educ 26080000 61,923 -
10.558 Child and Adult Care Food Program OH Dept of Educ 109,295 -
171,218 -
10.574 US Department of Agriculture OH Dept of Educ 26080000 (50) -
10.575 US Department of Agriculture Cuyahoga County Board of Health 24000524 7,478 -
10.664 USDA Forest Service OH Dept of Natural Resources 26110000 28,873 -
10.680 USDA Forest Service Purdue Univ 22000002 5,996 -
10.902 Natural Resources Conservation Service The Nature Conservancy 20020999 25,900 -
10.912 Natural Resources Conservation Service Nat Fish & Wildlife Fdn 20021134 141,947 32,321
Total Department of Agriculture Pass-Through Awards 697,163 66,176
Department of Defense
12.330 Office of Naval Res Am Lightweight Materials Innovation Inst 20022269 37,468 -
12.500 Army OH Nat Guard 26330100 18,106 -
12.611 Office of Economic Adjustment Univ of Michigan 22000005 106,083 -
Total Department of Defense Pass-Through Awards 161,657 -
Department of Housing and Urban Development
14.700 Dept of Housing & Urban Dev Cleveland Dept of Community Development 24000528 58,378 -
Total Department of Housing and Urban Development Pass-Through Awards 58,378 -
Department of Fish and Wildlife Service
15.720 US Fish and Wildlife Service OH Dept of Natural Resources 26110000 52,210 -

See Accompanying Notes to the Schedule of Expenditures of Federal Awards 127
THE OHIO STATE UNIVERSITYSCHEDULE OF EXPENDITURES OF FEDERAL AWARDSFOR THE YEAR ENDED JUNE 30, 2017
CFDA Pass-Through Federal Expenditures
Number Federal Agency Sponsor Pass-Through Sponsor I.D. Number Expenditures to Subrecipients
Pass-through from other sources:
Other Programs:
Total Department of Fish and Wildlife Service Pass-Through Awards 52,210 -
Department of Justice
16.575 US Department of Justice Ohio Office of Attorney General 26310000 453,381 -
16.726 US Department of Justice National 4-H Council 20021037 243,018 -
16.738 US Department of Justice Board of Commisioners of Franklin County, OH 2,322 -
16.740 US Department of Justice Univ of South Florida 22000123 9,666 -
Total Department of Justice Pass-Through Awards 708,387 -
Department of State
19.009 Bureau of Educ & Cultural Affairs Intl Res and Exchanges Board 20021194 151,512 -
Total Department of State Pass-through Awards 151,512 -
National Endowment for the Humanities
45.024 Grants to Organizations and Individuals Wexner Center Foundation 90,000 -
45.129 National Endowment For The Humanities OH Humanities Council 26290000 1,978 -
45.310 Institute Of Museum And Library Services State Library Board 26040000 1,599,860 -
Total National Endowment for the Humanities Pass-Through Awards 1,691,838 -
Department of Small Business Administration
59.037 Small Business Administration OH Development Services Agency 26140000 202,460 10,000
Total Department of Commerce Pass-Through Awards 202,460 10,000
Department of Energy
81.550 US Department of Energy Pacific Northwest National Laboratory 20021070 7,188 -
Total Department of Energy Pass-Through Awards 7,188 -
Department of Education
84.367 US Department of Education OH Dept of Higher Education 26060000 113,447 - 84.367 US Department of Education Nat Writing Project Corp 20021378 5,841 -
Total Department of Education Pass-Through Awards 119,288 -
Department of Health and Human Services
93.086 Admin Children, Youth, & Families OH Dept of Job & Family Services 26630000 34,177 -
93.135 Centers for Disease Control & Prevention Case Western Reserve Univ 22000238 12,762 -

See Accompanying Notes to the Schedule of Expenditures of Federal Awards 128
THE OHIO STATE UNIVERSITYSCHEDULE OF EXPENDITURES OF FEDERAL AWARDSFOR THE YEAR ENDED JUNE 30, 2017
CFDA Pass-Through Federal Expenditures
Number Federal Agency Sponsor Pass-Through Sponsor I.D. Number Expenditures to Subrecipients
Pass-through from other sources:
Other Programs:
93.243 Substance Abuse &MentalHealthServsAdmin OH Dept of Mental Hlth & Addiction Svcs 26420000 (35) -
93.566 Refugee and Entrant Assistance OH Dept of Job & Family Services 1,750,104 -
93.738 Centers for Disease Control & Prevention Cuyahoga County Board of Health 24000524 5,277 -
93.757 Centers for Disease Control & Prevention OH Dept of Health 26090000 17,388 -
93.817 Hospital Preparedness Program Ebola Preparedness and Resp Univ of Iowa 100,000 -
93.879 National Library of Medicine Univ of Iowa 22000137 3,749 -
93.912 Health Resources & Services Admin Trinity Hospital Twin City 20021726 (31) -
93.958 Substance Abuse &MentalHealthServsAdmin New Horizons Mental Health Services 20022382 85,606 -
Total Department of Health and Human Services Pass-Through Awards 2,008,996 -
Agency for International Development
98.001 Agency for Intl Dev Michigan State Univ 22000044 29,454 -
Total Agency for International Development Pass-Through Awards 29,454 -
Subtotal pass-through from other sources 5,888,532 76,176
Total Federal Expenditures 882,663,037$ 56,366,493$

THE OHIO STATE UNIVERSITY NOTES TO SCHEDULE OF EXPENDITURES OF FEDERAL AWARDS FOR THE YEAR ENDED JUNE 30, 2017
129
1. Summary of Significant Accounting Policies
Basis of Presentation
The accompanying schedule of expenditures of federal awards (“the schedule”) includes thefederal grant activity for the year ended June 30, 2017 for the following entities, which constitutethe primary institution for financial reporting purposes:
• The Ohio State University and its hospitals and clinics• Ohio Agricultural Research and Development Center• The Ohio Technology Consortium (OH-TECH)
In addition, the following university blended component units are included in the university’s financial statements and schedule of expenditures of federal awards:
• The Ohio State University Foundation• OSU Health Plan, Inc.• Oval Limited
In addition to the blended component units above, the university’s financial statements and schedule of expenditures of federal awards include the following discretely presented component units:
• The Ohio State University Physicians, Inc.• Campus Partners for Community Urban Redevelopment, Inc.• Transportation Research Center of Ohio, Inc.• Dental Faculty Practice Association, Inc.
The schedule has been prepared on the accrual basis in accordance with accounting principles generally accepted in the United States of America for state-assisted colleges and universities. Negative amounts represent current year adjustments of amounts reported in prior years. CFDA and pass-through entity numbers are included when available. The information in the schedule is presented in accordance with the requirements of Title 2 of the U.S. Code of Federal Regulations, Part 200, Uniform Administrative Requirements, Cost Principles, and Audit Requirements for Federal Awards (Uniform Guidance). Therefore, some amounts presented in this schedule may differ from amounts presented in, or used in the preparation of, the basic financial statements. Because the schedule presents only a selected portion of the operations of the university, it is not intended to and does not present the financial position, changes in net position, or cash flows of the university.
2. Reimbursement of Facilities and Administrative Costs and Uniform Guidance
On June 15, 2017, the U. S. Department of Health & Human Services (DHHS) approved apreviously established provisional rate for the year ended June 30, 2017 and establishedpredetermined facilities and administrative cost recovery rates through June 30, 2020. Thefacilities and administrative cost rate structure, including the rates submitted within thecertificate, is as follows:

THE OHIO STATE UNIVERSITY NOTES TO SCHEDULE OF EXPENDITURES OF FEDERAL AWARDS FOR THE YEAR ENDED JUNE 30, 2017
130
The university applies its predetermined approved facilities and administrative cost recovery rate when charging indirect costs to federal awards rather than the 10% de minimis cost rate as described in Section 200.414 of the Uniform Guidance.
3. Federal Direct Loan Program
Under the William D. Ford Federal Direct Loan Program, students and parents borrow fundsdirectly from the federal government; the university is responsible for verifying student eligibility,electronically transmitting the loan records to the federal processor and distributing the loanfunds directly to the student account or parent borrower. The amount of new loans to theuniversity’s students and parents during the fiscal year ended June 30, 2017 is shown in theschedule.
The university is responsible only for the performance of certain administrative duties withrespect to the Federal Direct Loan Program and, accordingly, these loans are not included inthe university's basic financial statements. It is not practical to determine the balance of loansoutstanding under these programs at June 30, 2017.
4. University-Administered Loan Programs with Continuing Compliance Requirements
The federal loan programs listed below are administered directly by the university, and balancesand transactions related to these programs are included in the university’s financial statements.The amount of loans outstanding at the beginning of the fiscal year and loans made during theyear are included in the federal expenditures presented in the schedule. The balances of loansoutstanding as of June 30, 2017 are as follows:
Rate Type FY17 FY18 FY19 FY20
Organized Research
On campus 54.0% 55.0% 56.0% 56.0%
Off campus 26.0% 26.0% 26.0% 26.0%
Instruction
On campus 52.0% 52.0% 52.0% 52.0%
Off campus 26.0% 26.0% 26.0% 26.0%
Other Sponsored Activities
On campus 30.5% 30.5% 30.5% 30.5%
Off campus 26.0% 26.0% 26.0% 26.0%
Negotiated Rate

THE OHIO STATE UNIVERSITY NOTES TO SCHEDULE OF EXPENDITURES OF FEDERAL AWARDS FOR THE YEAR ENDED JUNE 30, 2017
131
CFDANumber
Department of EducationFederal Perkins Program 84.038 $ 36,094,017
36,094,017
Department of Health and Human ServicesHealth Professions Student Loan Program 93.342
Dentistry 7,256,695 Optometry 1,892,038 Medicine 96,738 Pharmacy 915,305 Veterinary 5,041,557
Primary Care Loan Program 93.342Medicine 797,326
Loans to Disadvantaged Student Program 93.342Dentistry 97,637 Optometry 24,683 Medicine 72,724 Veterinary 4,693
16,199,396
Nursing Student Loan Program 93.364 1,137,901
ARRA - Nursing Faculty Loan Program 93.408 14,822
Nursing Faculty Loan Program 93.264 681,355
Total Federal Loans Outstanding $ 54,127,491
balance atJune 30, 2017
Outstanding

132
Report of Independent Auditors on Internal Control over Financial Reporting and on Compliance and Other Matters Based on an Audit of Financial Statements Performed
in Accordance with Government Auditing Standards To the Board of Trustees of The Ohio State University Columbus, Ohio:
We have audited, in accordance with auditing standards generally accepted in the United States of America and the standards applicable to financial audits contained in Government Auditing Standards issued by the Comptroller General of the United States, the financial statements of the primary institution and of the aggregate discretely presented component units, which collectively comprise The Ohio State University (the “University”), as of and for the year ended June 30, 2017, appearing on pages 20 to 23, which consist of the statement of net position, the related statements of revenues, expenses and other changes in net position and of cash flows for the year then ended, and the related notes to the financial statements, which collectively comprise the University’s basic financial statements, and have issued our report thereon dated November 6, 2017. The University is a component unit of the State of Ohio.
Internal Control Over Financial Reporting
In planning and performing our audit of the financial statements, we considered the University’s internal control over financial reporting (“internal control”) to determine the audit procedures that are appropriate in the circumstances for the purpose of expressing our opinions on the financial statements, but not for the purpose of expressing an opinion on the effectiveness of the University’s internal control. Accordingly, we do not express an opinion on the effectiveness of the University’s internal control. A deficiency in internal control exists when the design or operation of a control does not allow management or employees, in the normal course of performing their assigned functions, to prevent, or detect and correct, misstatements on a timely basis. A material weakness is a deficiency, or a combination of deficiencies, in internal control such that there is a reasonable possibility that a material misstatement of the entity's financial statements will not be prevented, or detected and corrected on a timely basis. A significant deficiency is a deficiency, or a combination of deficiencies, in internal control that is less severe than a material weakness, yet important enough to merit attention by those charged with governance. Our consideration of internal control was for the limited purpose described in the first paragraph of this section and was not designed to identify all deficiencies in internal control that might be material weaknesses or significant deficiencies. Given these limitations, during our audit we did not identify any deficiencies in internal control that we consider to be material weaknesses. However, material weaknesses may exist that have not been identified. We did identify a certain deficiency in internal control described in the accompanying schedule of findings and questioned costs and management’s views and corrective action plan as item 2017-001, that we consider to be a significant deficiency.
PricewaterhouseCoopers, LLP, 41 South High Street, Suite 2500 Columbus, OH 43215 T: (614) 225-8700, F: (614)224-1044, www.pwc.com/us
133
The University’s Response to Finding The University’s response to the finding identified in our audit is described in the accompanying management’s corrective action plan. The University’s response was not subjected to the auditing procedures applied in the audit of the financial statements and, accordingly, we express no opinion on it.
Compliance and Other Matters
As part of obtaining reasonable assurance about whether the University’s basic financial statements are free from material misstatement, we performed tests of its compliance with certain provisions of laws, regulations, contracts and grant agreements, noncompliance with which could have a direct and material effect on the determination of financial statement amounts. However, providing an opinion on compliance with those provisions was not an objective of our audit, and accordingly, we do not express such an opinion. The results of our tests disclosed no instances of noncompliance or other matters that are required to be reported under Government Auditing Standards.
Purpose of this Report
The purpose of this report is solely to describe the scope of our testing of internal control and compliance and the results of that testing, and not to provide an opinion on the effectiveness of the University’s internal control or on compliance. This report is an integral part of an audit performed in accordance with Government Auditing Standards in considering the University’s internal control and compliance. Accordingly, this communication is not suitable for any other purpose.
November 6, 2017

134
PricewaterhouseCoopers, LLP, 41 South High Street, Suite 2500 Columbus, OH 43215T: (614) 225-8700, F: (614) 224-1044, www.pwc.com/us
Report of Independent Auditors on Compliance with Requirements That Could Have a Direct and Material Effect on Each Major Program and on Internal
Control Over Compliance in Accordance with the Uniform Guidance
To Board of Trustees of The Ohio State University Columbus, Ohio:
Report on Compliance for Each Major Federal Program
We have audited The Ohio State University’s (the “University”) compliance with the types of compliance requirements described in the OMB Compliance Supplement that could have a direct and material effect on each of the University’s major federal programs for the year ended June 30, 2017. The University’s major federal programs are identified in the summary of auditor’s results section of the accompanying schedule of findings and questioned costs.
Management’s Responsibility
Management is responsible for compliance with federal statutes, regulations, and the terms and conditions of its federal awards applicable to its federal programs.
Auditors’ Responsibility
Our responsibility is to express an opinion on compliance for each of the University’s major federal programs based on our audit of the types of compliance requirements referred to above. We conducted our audit of compliance in accordance with auditing standards generally accepted in the United States of America; the standards applicable to financial audits contained in Government Auditing Standards, issued by the Comptroller General of the United States; and the audit requirements of Title 2 U.S. Code of Federal Regulations Part 200, Uniform Administrative Requirements, Cost Principles, and Audit Requirements for Federal Awards (Uniform Guidance). Those standards and the Uniform Guidance require that we plan and perform the audit to obtain reasonable assurance about whether noncompliance with the types of compliance requirements referred to above that could have a direct and material effect on a major federal program occurred. An audit includes examining, on a test basis, evidence about the University’s compliance with those requirements and performing such other procedures as we considered necessary in the circumstances.
We believe that our audit provides a reasonable basis for our opinion on compliance for each major federal program. However, our audit does not provide a legal determination of the University’s compliance.

135
Opinion on Each Major Federal Program
In our opinion, The Ohio State University complied, in all material respects, with the types of compliance requirements referred to above that could have a direct and material effect on each of its major federal programs for the year ended June 30, 2017.
Report on Internal Control Over Compliance
Management of The Ohio State University is responsible for establishing and maintaining effective internal control over compliance with the types of compliance requirements referred to above. In planning and performing our audit of compliance, we considered the University’s internal control over compliance with the types of requirements that could have a direct and material effect on each major federal program to determine the auditing procedures that are appropriate in the circumstances for the purpose of expressing an opinion on compliance for each major federal program and to test and report on internal control over compliance in accordance with the Uniform Guidance, but not for the purpose of expressing an opinion on the effectiveness of internal control over compliance. Accordingly, we do not express an opinion on the effectiveness of the University's internal control over compliance.
A deficiency in internal control over compliance exists when the design or operation of a control over compliance does not allow management or employees, in the normal course of performing their assigned functions, to prevent, or detect and correct, noncompliance with a type of compliance requirement of a federal program on a timely basis. A material weakness in internal control over compliance is a deficiency, or combination of deficiencies, in internal control over compliance, such that there is a reasonable possibility that material noncompliance with a type of compliance requirement of a federal program will not be prevented, or detected and corrected, on a timely basis. A significant deficiency in internal control over compliance is a deficiency, or a combination of deficiencies, in internal control over compliance with a type of compliance requirement of a federal program that is less severe than a material weakness in internal control over compliance, yet important enough to merit attention by those charged with governance.
Our consideration of internal control over compliance was for the limited purpose described in the first paragraph of this section and was not designed to identify all deficiencies in internal control over compliance that might be material weaknesses or significant deficiencies. We did not identify any deficiencies in internal control over compliance that we consider to be material weaknesses. However, material weaknesses may exist that have not been identified.
The purpose of this report on internal control over compliance is solely to describe the scope of our testing of internal control over compliance and the results of that testing based on the requirements of the Uniform Guidance. Accordingly, this report is not suitable for any other purpose.
December 15, 2017

THE OHIO STATE UNIVERSITY SCHEDULE OF FINDINGS AND QUESTIONED COSTS FOR THE YEAR ENDED JUNE 30, 2017
136
Section I – Summary of Auditor’s Results
(d)(1)(i) Type of Financial Statement Opinion Unmodified
(d)(1)(ii) Were there any material weaknesses in internal control reported at the financial statement level (GAGAS)?
No
(d)(1)(ii) Were there any significant deficiencies in internal control reported at the financial statement level (GAGAS)?
Yes
(d)(1)(iii) Was there any reported material noncompliance at the financial statement level (GAGAS)?
No
(d)(1)(iv) Were there any material weaknesses in internal control reported for major federal programs?
No
(d)(1)(iv) Were there any significant deficiencies in internal control reported for major federal programs?
None identified
(d)(1)(v) Type of Major Programs’ Compliance Opinion
Unmodified
(d)(1)(vi) Are there any reportable findings under 2 CFR § 200.516(a)?
No
(d)(1)(vii) Major Programs (list): Refer to the listing below
(d)(1)(viii) Dollar Threshold: Type A\B Programs Type A: > $ 3,000,000 Type B: > $ 750,000
(d)(1)(ix) Low Risk Auditee under 2 CFR §200.520? Yes
Major programs (list):
# CFDA Number(s) Name of Federal Program or Cluster
1 Various Research and Development Cluster
2 Various Student Financial Assistance Cluster
3 10.500 Cooperative Extension Service
4 93.600 Administration for Children and Families
5 45.310 Institute of Museum and Library Services
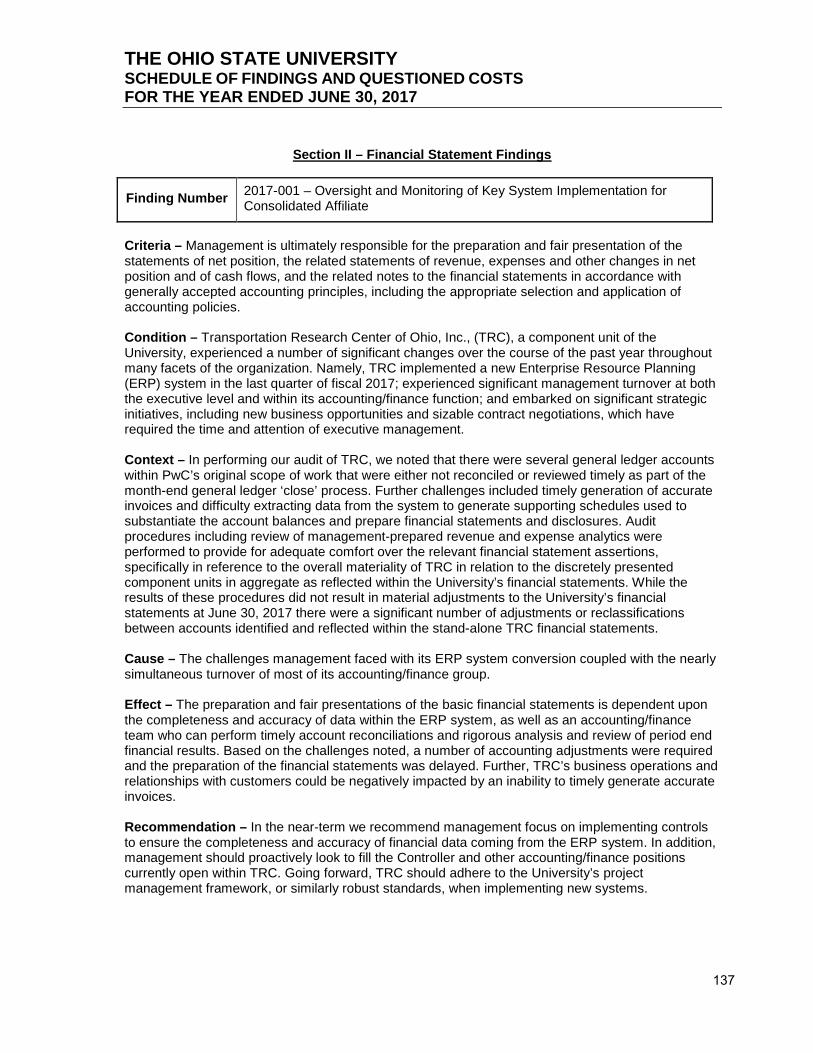
THE OHIO STATE UNIVERSITY SCHEDULE OF FINDINGS AND QUESTIONED COSTS FOR THE YEAR ENDED JUNE 30, 2017
137
Section II – Financial Statement Findings
Finding Number 2017-001 – Oversight and Monitoring of Key System Implementation for Consolidated Affiliate
Criteria – Management is ultimately responsible for the preparation and fair presentation of the statements of net position, the related statements of revenue, expenses and other changes in net position and of cash flows, and the related notes to the financial statements in accordance with generally accepted accounting principles, including the appropriate selection and application of accounting policies.
Condition – Transportation Research Center of Ohio, Inc., (TRC), a component unit of the University, experienced a number of significant changes over the course of the past year throughout many facets of the organization. Namely, TRC implemented a new Enterprise Resource Planning (ERP) system in the last quarter of fiscal 2017; experienced significant management turnover at both the executive level and within its accounting/finance function; and embarked on significant strategic initiatives, including new business opportunities and sizable contract negotiations, which have required the time and attention of executive management.
Context – In performing our audit of TRC, we noted that there were several general ledger accounts within PwC’s original scope of work that were either not reconciled or reviewed timely as part of the month-end general ledger ‘close’ process. Further challenges included timely generation of accurate invoices and difficulty extracting data from the system to generate supporting schedules used to substantiate the account balances and prepare financial statements and disclosures. Audit procedures including review of management-prepared revenue and expense analytics were performed to provide for adequate comfort over the relevant financial statement assertions, specifically in reference to the overall materiality of TRC in relation to the discretely presented component units in aggregate as reflected within the University’s financial statements. While the results of these procedures did not result in material adjustments to the University’s financial statements at June 30, 2017 there were a significant number of adjustments or reclassifications between accounts identified and reflected within the stand-alone TRC financial statements.
Cause – The challenges management faced with its ERP system conversion coupled with the nearly simultaneous turnover of most of its accounting/finance group.
Effect – The preparation and fair presentations of the basic financial statements is dependent upon the completeness and accuracy of data within the ERP system, as well as an accounting/finance team who can perform timely account reconciliations and rigorous analysis and review of period end financial results. Based on the challenges noted, a number of accounting adjustments were required and the preparation of the financial statements was delayed. Further, TRC’s business operations and relationships with customers could be negatively impacted by an inability to timely generate accurate invoices.
Recommendation – In the near-term we recommend management focus on implementing controls to ensure the completeness and accuracy of financial data coming from the ERP system. In addition, management should proactively look to fill the Controller and other accounting/finance positions currently open within TRC. Going forward, TRC should adhere to the University’s project management framework, or similarly robust standards, when implementing new systems.

THE OHIO STATE UNIVERSITY SCHEDULE OF FINDINGS AND QUESTIONED COSTS FOR THE YEAR ENDED JUNE 30, 2017
138
Section III – Federal Award Findings and Questioned Costs
There are no findings and/or questioned costs related to federal awards to be reported.

THE OHIO STATE UNIVERSITY SUMMARY OF PRIOR YEAR AUDIT FINDINGS FOR THE YEAR ENDED JUNE 30, 2017
There were no findings and/or questioned costs related to federal awards reported in the prior year.
139

Office of the Controller 2030 Blankenship Hall
901 Woody Hayes Drive Columbus, OH 43210 Phone (614) 688-1647
Fax (614) 688-3572
December 12, 2017
Re: Corrective Action Plan
1. Name of the contact person responsible for corrective actions planned:
Thomas F. Ewing Director of Financial Reporting The Ohio State University 2020 Blankenship Hall 901 Woody Hayes Drive Columbus, OH 43210 Phone: 614-688-3113 E-mail: [email protected]
2. Corrective actions planned:
Finding Number 2017-001 - Oversight and Monitoring of Key System Implementation for Consolidated Affiliate
Views of responsible officials and planned corrective actions - We agree with the recommendation.
TRC is working with a third-party consultant to analyze the current state of the system and implement the needed functionality. The University’s Office of Business and Finance will monitor the effectiveness of the system implementation corrections and internal control implementation to ensure the completeness and accuracy of financial data. TRC’s senior leadership team, in coordination with TRC’s Board of Directors, is evaluating the finance department. In addition, TRC’s board of directors is managing the executive search for a permanent Chief Financial Officer, who will in turn hire a Controller.
3. Anticipated completion date:
The first phase of remediation will include manual analysis and posting of monthly revenue recognition entries, to ensure complete and accurate financial statements for FY2018. Anticipated completion date for this phase is June 30, 2018. The second phase of remediation will include a reimplementation of the ERP system, to begin in July 2018. Anticipated completion date for this phase is December 31, 2018.
140