the ofsurvey design - open knowledge repository · conducting the interview 178 ... 6.9...
TRANSCRIPT

A User’s Guide for Managing Surveys, Interpreting Results, andInfluencing Respondents
PowerSurveyDesign
THE
OF
GIUSEPPE IAROSSI
Pub
lic D
iscl
osur
e A
utho
rized
Pub
lic D
iscl
osur
e A
utho
rized
Pub
lic D
iscl
osur
e A
utho
rized
Pub
lic D
iscl
osur
e A
utho
rized


ThePower
ofSurveyDesign
ThePower
ofSurveyDesign
Giuseppe Iarossi
THE WORLD BANKWashington, D.C.
A User’s Guide for Managing Surveys, Interpreting Results, and Influencing Respondents

© 2006 The International Bank for Reconstruction and Development / The World Bank1818 H Street, NWWashington, DC 20433Telephone 202-473-1000Internet www.worldbank.orgE-mail [email protected]
All rights reserved.
1 2 3 4 09 08 07 06
The findings, interpretations, and conclusions expressed herein are those of the author(s)and do not necessarily reflect the views of the Board of Executive Directors of the WorldBank or the governments they represent.
The World Bank does not guarantee the accuracy of the data included in this work. Theboundaries, colors, denominations, and other information shown on any map in this workdo not imply any judgment on the part of the World Bank concerning the legal status ofany territory or the endorsement or acceptance of such boundaries.
Rights and PermissionsThe material in this work is copyrighted. Copying and/or transmitting portions or all ofthis work without permission may be a violation of applicable law. The World Bank en-courages dissemination of its work and will normally grant permission promptly.
For permission to photocopy or reprint any part of this work, please send a request withcomplete information to the Copyright Clearance Center, Inc., 222 Rosewood Drive,Danvers, MA 01923, USA, telephone 978-750-8400, fax 978-750-4470,www.copyright.com.
All other queries on rights and licenses, including subsidiary rights, should be addressed to the Office of the Publisher, World Bank, 1818 H Street NW,Washington, DC 20433, USA, fax 202-522-2422, e-mail [email protected].
ISBN 0-8213-6392-1EAN 978-0-8213-6392-8e-ISBN 0-8213-6393-Xe-ISBN-13 978-0-8213-6393-5DOI 10.1596/978-0-8213-6392-8
Library of Congress Cataloging-in-Publication Data
Iarossi, Giuseppe.The power of survey design : a user’s guide for managing surveys, interpreting
results, and influencing respondents / Giuseppe Iarossi.p. cm.
Includes bibliographical references and index.ISBN-13: 978-0-8213-6392-8ISBN-10: 0-8213-6392-11. Social surveys—Methodology. 2. Questionnaires—Methodology. I. Title.
HM538.I37 2006300.72'3—dc22
2005044618

To my father, Antonio, and my mother, Esterina Civetta


Foreword xiAcknowledgments xiiiAbbreviations and Acronyms xv
Chapter 1. Taking A Closer Look at Survey Implementation 1
Chapter 2.Survey Management: An Overview 9
Overall Program Design 10Questionnaire Design, Pilot, and Data Entry Form 10Survey Firm Selection 12The Sample 18Training 20Fieldwork and Data Quality Control 20
Chapter 3.How Easy It Is to Ask the Wrong Question 27
Practical Guidelines in Questionnaire Designs 29Question Wording 29Question Style 44Question Type 49Question Sequence 74Questionnaire Length 78Questionnaire Layout 80Translation 85Pre-Test 86
Chapter 4.A Practical Approach to Sampling 95
Determining the Sample Size in Simple Random Sampling 96Determining the Sample Size in Stratified Sampling 99How to Carry Out Systematic Sampling 104How to Carry Out the Probability Proportional to Size Selection
Method 107How to Deal with Population Frame Problems 110Impact of Mergers, Acquisitions, and Separations on Sampling
Weights 115Weight Adjustments and Poststratification 120Sampling in Practice: How to Maximize the Sample Representativeness
while Minimizing the Survey Cost through the Use of Poststratification 129
Table of Contents

Chapter 5. Respondent’s Psychology and Survey Participation 147
Factors Affecting Participation 147Training 159Practical Training Tips 163Securing Participation 164Conducting the Interview 178
Chapter 6. Why Data Management Is Important 187
Coding 188Editing 189Electronic Data Entry 191Cleaning 195
References 219
AppendixesAppendix 1. Perception Questions in the Investment Climate
Survey Core Questionnaire 229
Appendix 2. Objective Questions Used for Parametric Estimation of Survey Firm Fixed Effect 231
Appendix 3. Parametric Results of Survey Firm Fixed Effects on Objective Questions 23
Appendix 4. Table of zα/2 Distribution Corresponding to Different Levels of Confidence α
251Appendix 5. Table of Random Numbers
253Appendix 6. Information Disclosed in Survey
Introductions
Appendix 7. Minimum Fieldwork Log Data 25
Boxes1.1 One Poll, Multiple Interpretations 52.1 Criteria to Look at When Selecting a Survey Firm 122.2 Key Actors and Their Functions in a Typical Investment Climate
Survey 152.3 Responsibilities Must be Clearly Identified in the Interview Cycle 23.1 List of Questionnaire Problems for Pre-Test Expert Review 914.1 The Sampling Unit in Business Surveys 974.2 Advising a Mayor 1004.3 Why it is Important to Use Weights with Stratified Sampling 1214.4 Using SAS to Draw Samples 1426.1 How to Assign Questionnaire IDs 193
vi Contents
3
5
2 94
1

Figures2.1 Who Is Asking What? 172.2 Gantt Charts Illustrate Timing of Survey Activities 243.1 Levels of Education of IC Survey Respondents 303.2 A One-word Change Has a Significant Impact on Response 313.3 Response Rate Distribution When the Order of Alternatives is
Reversed 33.4 Affirmative Questions Reduce Requests for Clarifications 413.5 Double-Barreled Questions Increase Requests for Clarifications 433.6 Response Rate Effect of Long Repetitive Lists among Consecutive
Questions 453.7 Interviews Conducted by Government Agencies Decrease Reports of
Corruption 523.8 Index of Memory Error by Mode of Interview 553.9 Accuracy of Recall Decreases Over Time 593.10 Effect of Time on Underreporting Hospitalization 603.11 Respondents Answering “Don’t Know” Increases with Option to Opt
Out 623.12 Impact of Numeric Scales on Response Patterns 633.13 Negative or Positive Words Influence Respondents Differently 683.14 Event Contamination: Closed-Question Format Is Unable to Detect
External Shocks 743.15 Relationship Between Questionnaire Length and Response Rate 793.16 Effect of Unclear Terms on Survey Results 883.17 Unclear Terms Take Longer to Answer 893.18 Percentage of Problems Identified by Different Pre-Test Methods 905.1 Factors Affecting Survey Participation 1485.2 Survey Participation By Length of Interview 1515.3 Interview Length Has an Insignificant Effect on Participation 1525.4 Index of Response Error by Interviewer Characteristics 1605.5 Effects of Interviewer Training on Quality and Quantity of Data 1625.6 Effects of Quantity of Arguments on Persuasion 1665.7 Effects of Quality Arguments on Persuasion 1675.8 Effects of Quantity and Quality of Arguments on Persuasion When
Respondent’s Saliency is High 1685.9 Active Participation Rate of Initially Reluctant Respondents 1765.10 Response Accuracy with Standardized and Flexible Interviewing
Styles 1815.11 Probing Styles 1846.1 Difference Among NA, NP, REF, DK, and Zero 1906.2 Blurred Discrimination between Zero or Not Applicable
Affects Data Accuracy 1986.3 Respondent’s Cognitive Effort by Question Type 2006.4 Ostensibly Innocuous Questions Can Produce Inconsistent
Answers 2026.5 Question Flows 2066.6 Question Structure 207
Contents vii
5

6.7 Inconsistent Answers 1 2076.8 Inconsistent Answers 2 2086.9 Inconsistent Answers 3 2086.10 Questions on Export 2106.11 Question Structure 2106.12 Question Inconsistencies 2116.13 Remote Questions Used for Cross-Checks 2116.14 Cleaning 2126.15 Questions Asked to Different Respondents 2136.16 Distribution of Answers to Questions XV.11 (Q15.11), XV.12
(Q15.12), and VI.11 (Q6.11) before Cleaning 2136.17 Distribution of Answers to Q15.12 when Q15.11 = “No” 2146.18 Distribution of Answers between XV.11 (Q15.11) and XV.12
(Q15.12) after Cleaning. 2166.19 Distribution of Answers Among XV.11 (Q15.11), XV.12 (Q15.12),
and VI.11 (Q6.11) after Cleaning. 217
Tables1.1 Attitudes and Ambiguities toward Democracy in Latin America
(Percent of Respondents) 21.2 Same Question (Leading to) Different Answers 32.1 Share of Survey Cost in Household Surveys 192.2. Weekly Reports Enable Managers to Monitor Progress 253.1 Reported Behavior Using Low and High Category Ranges 343.2 Interviews Conducted by Government Agencies and International
Private Firms Affect Survey Responses 513.3 Accuracy is Higher for Open-Ended Questions 523.4 As Frequency of Event Decreases, Use of Episode Enumeration
Increases 563.5 Higher Event Frequency Has a Negative Effect on Accuracy 573.6 Response Time and Episode Enumeration Have a Positive Effect on
Accuracy 583.7 Perceived Percentage Values Associated with Descriptive Words 663.8 Interviews Conducted by Government Agencies and International
Private Firms Reduce Probability of Rating Major Constraints 693.9 Open- and Closed-Question Formats Generate Different
Responses 724.1 Weight Adjustments for Noncoverage 1114.2 Kish’s Selection Grid 1144.3 Frame Accuracy and Sampling Weights: The Case of Mergers,
Acquisitions, and Separations in Establishment Surveys 1164.4 Sample Design: Stratified Sample Random Sampling 1234.5 Weight Adjustments Components for Stratum A 1264.6 Weight Adjustments Components for All Strata 1274.7 Estimation of Final Weights 1284.8 Population Distribution by Sector, Region, and Size 130
viii Contents

4.9 Sample Size Requirements for 90 Percent Confidence Interval 1314.10 Stratification and Required Sample Size for 90 Percent Confidence
and 5 Percent Error 1334.11 Employment Contribution by Sector and Location 1354.12 Target Population (Four Regions and Five Sectors) and Required
Sample 1364.13 Final Target Population (Four Regions and Four Sectors) and
Required Sample Size 1364.14 Expected Sample Sizes and Levels of Statistical Significance 1374.15 Stratification by Sector and Location 1394.16 Sample, Replacements, and Total Elements to Draw 1414.17 Final Sample and Weights 1444.18 Poststratification by Ownership 1456.1 Distribution of Consistent and Inconsistent Answers 2036.2 Multiplicity of Inconsistent Answers 204A3.1 Survey Firm Fixed Effect on “Unofficial Payments to Get Things
Done” 234A3.2 Survey Firm Fixed Effect on “Gifts Expected as Percent Value of
Government Contracts” 235A3.3 Firm Survey Fixed Effect on “Estimated Percent of Total Sales
Declared for Tax Purposes” 236A3.4 Firm Survey Fixed Effects on “Percent of Senior Management’s Time
Dealing With Government” 237A3.5 Firm Survey Fixed Effects on “Total Days Spent With Officials from
Tax Inspectorate” 238A3.6 Firm Survey Fixed Effects on “Days on Average to Claim Imports
from Customs” 239A3.7 Firm Survey Fixed Effects on “Days on Average to Clear Customs for
Exports” 240A3.8 Firm Survey Fixed Effects on “Optimal Level of Employment Compared
to Current Level (%)” 241A3.9 Firm Survey Fixed Effects on “Days of Power Outages/Surges from
Public Grid” 242A3.10 Firm Survey Fixed Effects on “Days of Insufficient Water
Supply” 243A3.11 Firm Survey Fixed Effects on “Days of Unavailable Mainline
Telephone Service” 244A3.12 Firm Survey Fixed Effects on “Percent of Sales Lost Due to Power
Outages/Surges” 245A3.13 Firm Survey Fixed Effects on “Percent of Sales Lost Due to
Insufficient Water Supply Last Year” 246A3.14 Firm Survey Fixed Effects on “Percent of Sales Lost Due to Unavailable
Telephone Service Last Year” 247A3.15 Firm Survey Fixed Effects on “Percentage of Average Cargo Value
Lost in Transit” 248
Contents ix


The vast majority of data used for economic research, analysis, and pol-icy design comes from surveys—surveys of households, firms, schools,hospitals, and market participants. In today’s world it is easy to go on-line and download all kinds of data—infant mortality rates, trends ininflation, poverty levels, degree of inequality, growth rates of investmentand GDP. Most users of these data do not think very much about wherethey come from. But they should. Take what seems a fairly straight-forward piece of information, such as the amount of gross investmentin China in 2004: the real answer to this question is all of the expendi-ture or effort households, firms, and the government made during theyear to increase or enhance the value of the land, buildings, and machin-ery that can be used to produce goods and services. It would be extra-ordinarily costly—probably impossible—to actually count all thisactivity. So, in practice researchers, officials, and market participants willrely on an estimate that is derived from surveys of households and firms.The accuracy of the estimate will depend on how well the survey is done.
This innovative book is both a “how-to” about carrying out high-quality surveys, especially in the challenging environment of develop-ing countries; and a “user’s guide” for anyone who uses statistical datafor any purpose. Reading this book will provide users of data with awealth of insight into what kinds of problems or biases to look for indifferent data sources, based on the underlying survey approaches thatwere used to generate the data. In that sense the book is an invaluable“skeptic’s guide to data.”
For the producer of data through surveys, Giuseppe Iarossi has writ-ten a straightforward, practical guide to survey design and implemen-tation. This guide is based on his years of experience implementingsurveys of firms in a variety of institutional settings in Africa, East Asia,and South Asia. It is a readable guide that covers such issues as writingquestionnaires, training enumerators, testing different wordings ofquestions, sample selection, data entry, and data cleaning.
Foreword
xi

Users of data can skip certain sections that go into technical detail.But the broad storyline of the book is something that should be ab-sorbed by anyone who works with statistical data. Just as anyone whovisits a sausage factory never feels quite the same way again about eat-ing a sausage, readers of this book will never quite feel the same aboutdata that is just handed to them. The book will teach you how difficultit often is to come up with reliable estimates of important social andeconomic facts, and thus encourage you to approach all estimates withsensible caution.
David DollarChina Country DirectorWorld Bank
xii The Power of Survey Design

xiii
I owe a considerable intellectual debt to all researchers and practi-tioners of survey methods referenced throughout this work. I couldhave not written this book had I not benefited from the extensive ex-perience of my colleagues working on Investment Climate Surveys atthe World Bank, to which I am very grateful. In particular I wish tothank Rita Almeida, Demba Ba, Sergiy Biletsky, Amanda Carlier,George Clarke, Linda Cotton, Antonie De Wilde, Simeon Djankov,David Dollar, Pablo Fajnzylber, Ana Fernandes, Aurora Ferrari,Alvaro Gonzalez, Mona Haddad, Luke Haggarty, Mary Hallward-Driemeier, Sriyani Hulugalle, Philip Keefer, Thomas Kenyon, VeselinKuntchev, Sergio Kurlat, Esperanza Lasagabaster, Ying Li, SyedMahmood, Jean Michel Marchat, Melanie Mbuyi, Taye Mengistae,Jorge Meza, Hisaaki Mitsui, John Nasir, Axel Peuker, IsmailRadwan, Vijaya Ramachandran, Menhaz Safavian, Federica Saliola,Hyak Sargsian, Luis Serven, Stefka Slavova, Andrew Stone, MonaSur, Giovanni Tanzillo, Tilahun Temesgen, Son Thanh Tran, ColinXu, Yutaka Yoshino, and Albert Zeufack. I am thankful to AbuzarAsra, Gemma Estrada, V.N. Ghanathurai, Rana Hasan KanokpanLao-Araya, and Ernesto Pernia from the Asian Development Bank. Iam also grateful to local consultants and government officials inBangladesh, Brazil, Costa Rica, Ethiopia, Guyana, India, Indonesia,Malawi, Malaysia, the Philippines, the Republic of Korea, Sri Lanka,Thailand, and Vietnam with whom I have worked over the years. Iam indebted to Mary Hallward-Driemeir, Phil Keefer, YusufMohammed, Federica Saliola, Giovanni Tanzillo, and VeselinKuntchev for useful comments on early drafts. Rina Bonfield, PollyMeans, Hedy Sladovich, and Tourya Tourougui provided invaluableeditorial assistance. The most important sources of moral support inthe completion of this work have been my wife, Izabella, and mybrother, Nicola, to whom I offer my warmest gratitude. I thankfully
Acknowledgments

acknowledge financial support from the Bank Netherlands Partner-ship Program and the World Bank Private Sector Development Groupof the Africa Region. All mistakes remain mine.
The views expressed here are entirely those of the author and do notnecessarily represent the views of the World Bank, its executive direc-tors, or the countries they represent. My hope is that this work will helpenhance the accuracy of the data collected in Investment ClimateSurveys and in turn improve the policy advice to developing countrieson their path toward poverty reduction.
xiv Acknowledgments

xv
ACS Association for Survey ComputingBEEPS II Business Environment and Enterprise Performance
Survey IIBOSS brief, objective, simple, and specificDCF discounted cash flowDK don’t knowHQ headquartersIC Productivity and Investment Climate SurveysID identifierLCU local currencyLSMS Living Standards and Measurement StudyNA not applicableNP not providedNPV net present valuePPS probability proportional to sizeREF refuse to answerROE return on equity SAS Statistical Analysis System SRS simple random samplingTOR terms of referenceUNDP United Nations Development Programme
Abbreviations and Acronyms


When I was a student in graduate school, I wasoften intrigued by the ambiguity of survey re-
sults. Whether it was politics, the economy, or even human behavior it wascommon to find contradicting results, sometimes from the same survey.Little has changed since then. A Latinobarometro poll in 2004 showedthat while a clear majority (63 percent) in Latin America would neversupport a military government, 55 percent would not mind a nonde-mocratic government if it solved economic problems (see table 1.1).
Years have passed since I was finally able to solve this puzzle. If wewere to conduct a survey today and ask, “Are you in favor of financialincentives for poor countries?” very likely many respondents would beinclined to answer yes. Yet the result of this poll would be different ifthe question were “Are you in favor of subsidies for poor countries?”Experiments have proven that a single word, incentives or subsidies, cansway the outcome of a poll.
The way a question is worded can often lead the respondent towardone answer or another. And this effect can be significant, in the order ofup to 30 percent change in attitude. Hence, the cause of survey inconsis-tencies does not rest, as I originally thought, on the respondents, butrather on the question designer. Respondents are not irrational. Ques-tionnaire designers, on the contrary, are often either skillful enough (orinexperienced enough) to exploit or to understand, respectively, themany “tricks” of the survey business. I tried one of these tricks myselfwhile teaching a class on survey methodology at the Johns Hopkins Uni-versity. On the first day of class, I randomly split the students into twogroups and asked each member of the groups to answer the same ques-tion, worded differently (see table 1.2). My covert intention was to leadstudents of the first group toward answer A and students of the secondgroup toward answer B. From this simple experiment, I learned how easyit is to influence respondents.
Chapter 1
Taking A Closer Look at Survey Implementation
1

Response artifacts are not limited to question wording. The interna-tional comparison of survey results is today a common occurrence.When this comparison happens, however, it is important to consider theway the survey is implemented in each country and how this might af-fect each country’s survey results. For example, we are all aware thatunderreporting occurs when questions on corruption or taxes are askedby a government official. Therefore, if we wish to obtain a meaningfulinternational comparison of these phenomena, we must investigate andcontrol any such survey fixed effect. Survey results are often used, com-
2 The Power of Survey Design
Table 1.1
Attitudes and Ambiguities toward Democracy in Latin America (Percent of Respondents)
Under No Circumstances Wouldn’t Mind a Would Support a Nondemocratic Government If
Military Government It Solved Economic Problems
Costa Rica 89 42
Panama 77 56
Dominican Republic 74 62
Uruguay 72 33
Venezuela, R.B. de 71 48
Nicaragua 70 70
Ecuador 69 49
Bolovia 67 49
Argentina 64 46
Chile 64 45
Mexico 60 67
Colombia 58 64
Brazil 56 54
Guatemala 54 57
El Salvador 48 56
Honduras 47 70
Peru 47 64
Paraguay 41 75
Latin America 63 55
Source: The Economist 2004.

bined, and presented without due attention to the methodology em-ployed in the data collection. People do not pay attention to who isasking the question or how the question is asked and hence they com-bine different answers. Unless these fixed effects are properly identifiedand corrected, survey results might be misleading. Contrary to whatTransparency International reports, for example, El Salvador appearsto be more corrupt than China if we simply combine data from the In-vestment Climate Surveys in these two countries. Once we account forthe underreporting, because the survey in China was conducted by gov-ernment officials, the adjusted ranking of El Salvador and China corre-sponds to that of Transparency International.1
And this is the goal of this book: to show the host of survey fixedeffects that play a subtle but critical role on survey results. This workis presented in manuscript form and is directed to two audiences: thosewho use survey data (the majority) and those who produce survey data.The former group should read the chapter on questionnaire design (chap-ter 3) and the last section of the chapter on sampling (chapter 4). Toooften survey results are loosely presented as representative of the broadpopulation, while the subset of the population they really represent is not
Taking A Closer Look at Survey Implementation 3
Table 1.2
Same Question (Leading to) Different Answers
Group 1 Group 2
With which of the following statements do you agree most?
Source: Author.
1 See http://www.transparency.org/cpi/2004/cpi2004.en.html, retrieved on June 13,2005.
a. Democracy is the best form of government
preferable to any other kind of government
b. An authoritarian government is preferable to a
democratically elected government
a. Democracy is the only system of government in
any circumstance
b. In some limited circumstances and for a short pe-
riod of time, a nondemocratic government could
be temporarily installed if it solves deep eco-
nomic and/or political crises.

clearly identified and the levels of precision and confidence are not al-ways disclosed.
For those directly involved in the production of survey data, thiswork is a unique and concise source of information on all the steps ofsurvey implementation from planning to data cleaning. Although writ-ten with an eye on business surveys, and in particular the InvestmentClimate Surveys conducted by the World Bank and other internationalfinancial institutions, anyone who manages surveys will find this bookextremely useful.
Chapter 2 on survey management provides an overview of the mainorganizational hurdles that must be addressed when planning a survey.The chapter on training (chapter 5) includes an interesting discussion onone of the most difficult tasks for the interviewer, convincing the re-spondent to participate in the survey. It highlights the psychological fac-tors contributing to the decision to participate. Finally, the chapter ondata cleaning (chapter 6) is, to my knowledge, the first attempt to pre-sent, in a systematic way, a methodology aimed at improving data ac-curacy after the field work has been completed.
Whether we like it or not surveys are part of our life. Even the inhab-itants of the most remote village are affected by surveys as long as theycare about inflation because price changes are monitored through sur-veys. After reading the chapter on questionnaire design, you will be ableto detect how skillful question designers can lure respondents toward oneanswer and you will be more cautious in pooling results from differentsurveys. Additionally, you will acquire a critical eye in interpreting re-sults from polls reported in the media.
4 The Power of Survey Design

Taking A Closer Look at Survey Implementation 5
Box 1.1
One Poll, Multiple Interpretations
On January 19, 2005, BBC News published the results of a world poll following the U.S. elections. The high-
light of the poll was that “More than half of people surveyed in a BBC World Service poll say the reelection
of U.S. President George W. Bush has made the world more dangerous.” According to the results of this poll,
“only 3 countries out of 21 polled believed the world was now safer” (see box table 1.1.1).
Box Table 1.1.1
BBC World Poll Results
Question: As you may know, George Bush has been reelected as president of the United States. Do you think
this is positive or negative for peace and security in the world? (percent respondents)
Country Positive Negative No Effect Either Way Don’t Know/NA
Argentina 8 79 4 9
Australia 31 61 5 3
Brazil 17 78 3 2
Canada 26 67 2 5
Chile 19 62 6 13
China 27 56 5 12
France 13 75 4 7
Germany 14 77 8 2
Great Britain 29 64 4 4
India 62 27 2 8
Indonesia 21 68 5 6
Italy 34 54 3 9
Japan 15 39 31 15
Korea, Rep. of 36 54 7 3
Lebanon 23 64 9 4
Mexico 4 58 28 10
Philippines 63 30 2 5
Poland 44 27 7 23
Russian Federation 16 39 32 13
South Africa 35 57 3 5
Turkey 6 82 6 7
United States 56 39 1 4
Total 27 57
(continued)

6 The Power of Survey Design
Are these results really true? Two basic questions should be asked: Do these countries represent the world
community? Do the people interviewed represent the world population?
To determine whether this sample is representative of the world, the sample of countries should have been
random. Nowhere in the article, or in the methodology, does it appear as though the sample of 21 countries
was randomly chosen from among the world’s 191 countries.
Even assuming that the selection was random, we next need to ask ourselves the following question: What
level of confidence have we obtained from these results? A sample of 21 elements in a population of 191 gives
a level of precision of +/−20 percent (at 95 percent confidence). This implies that the true share of respon-
dents with negative attitude could be anywhere between 37 percent and 77 percent. Similarly, the true share
with positive attitude could be anywhere between 7 percent and 47 percent. Because the two confidence in-
tervals overlap, we cannot conclude that the observed difference in attitude is statistically significant.
Although the poll is not representative of the countries in the word, it can be argued that it is representa-
tive of the world population. If we follow this argument, however, we need to weight each country by its
share of the world population. It would not be correct to give China, with a population of 1.2 billion inhabi-
tants, the same weight as Lebanon, with 5 million inhabitants. By weighting the results of the poll, we can see
that the difference between negative and positive perceptions persists, even if at a lower level, with 49 percent
of respondents having a negative attitude versus 36 percent having a positive attitude.
There is, however, another interesting survey fixed effect to keep in mind. From the methodology, it ap-
pears that, in some countries, the survey has been conducted by phone while in others it was conducted
through a face-to-face interview. To the extent that the question asked is considered sensitive by the respon-
dents, the mode of interview can influence answers. In particular, we would expect that the nonresponse rate
in the face-to-face interviews would be higher than in the phone survey. If we look at the data from the BBC
poll, this is exactly what happened. In the face-to-face surveys, the share of nonresponse is double (20%) that
of the phone survey. Such a high nonresponse rate might have an impact on the results of the survey itself,
unless it is assumed that the distribution of nonresponses in each mode is the same (but this is a strong as-
sumption given the sensitivity of the question). Hence, if we look at the survey results by mode of interview,
we can see that, if the survey is conducted by face-to-face interview, then the difference between positive and
negative attitude vanishes. Hence, it appears that the results of the survey are dependent on the mode of in-
terview (see box table 1.1.2 and box figure 1.1.1). Not a conclusive result for a world opinion poll.
Box 1.1 (continued)

Taking A Closer Look at Survey Implementation 7
Box 1.1 (continued)
Box Table 1.1.2
BBC Polls by Mode of Interview and Weighted Results
No DK/ Population Positive NegativeCountry Positive Negative Effect NA (thousands) Weight Weighted Weighted
Face to Face
Argentina 8 79 4 9 38,377 0.018 0.14 1.43
Brazil 17 78 3 2 176,596 0.083 1.41 6.48
Chile 19 62 6 13 15,774 0.007 0.14 0.46
India 62 27 2 8 1,064,399 0.501 31.05 13.52
Indonesia 21 68 5 6 214,471 0.101 2.12 6.86
Japan 15 39 31 15 127,210 0.060 0.90 2.33
Korea, Rep. of 36 54 7 3 47,912 0.023 0.81 1.22
Lebanon 23 64 9 4 4,498 0.002 0.05 0.14
Mexico 4 58 28 10 102,291 0.048 0.19 2.79
Philippines 63 30 2 5 81,503 0.038 2.42 1.15
Poland 44 27 7 23 38,195 0.018 0.79 0.49
Russian Federation 16 39 32 13 143,425 0.067 1.08 2.63
Turkey 6 82 6 7 70,712 0.033 0.20 2.73
Total face to face 26 54 11 9 41 42
Phone
Australia 31 61 5 3 19,890 0.010 0.32 0.63
Canada 26 67 2 5 31,630 0.016 0.42 1.09
China 27 56 5 12 1,288,400 0.666 17.97 37.28
France 13 75 4 7 59,725 0.031 0.40 2.31
Germany 14 77 8 2 82,551 0.043 0.60 3.28
Great Britain 29 64 4 4 59,280 0.031 0.89 1.96
Italy 34 54 3 9 57,646 0.030 1.01 1.61
South Africa 35 57 3 5 45,294 0.023 0.82 1.33
United States 56 39 1 4 291,044 0.150 8.42 5.86
Total phone 29 61 4 6 31 55
Source: Author’s calculations.

8 The Power of Survey Design
Box 1.1 (continued)
Box Figure 1.1.1.
Poll Results by Survey Mode
0
10
20
30
40
50
60
Phone Face to faceInterview mode
% respondents (all countries)
Positive attitudeNegative attitude
Results are weighted by population.Source: Author’s calculations.
Source: BBC World Poll data were retrieved on January 25, 2005, from http://news.bbc.co.uk/1/hi/world/americas/4185205.stm#.

Careful planning is vital to the timely completion ofany project, yet the task of planning and manag-
ing a survey is subject to everything from cultural vicissitudes toweather conditions (Warwick and Lininger 1975). Given the endlessnumber of factors (cultural, economic, ethnic, linguistic, political, psy-chological, sociological, and religious) that influence the implementa-tion of any survey, managing such a project is as much art as science.Hence, the survey manager must have experience in survey implemen-tation and a clear understanding of the objectives of the study.1 As inall projects, the survey manager must plan, organize, lead, and controlthe development of the survey (Weeks 2003).
Throughout the survey process technical and organizational deci-sions must blend the theoretically desirable with the practically feasi-ble (Moser and Kalton 1971). Within this realm the survey manager isresponsible for the following:
• Preparing the overall survey program;• Designing the questionnaire and data entry form;• Conducting the pilot;• Selecting the survey firm2 and defining the financial arrangements;• Drawing the sample;• Training the interviewers; and• Monitoring the fieldwork and developing data quality control
procedures.
Often there is thetemptation to skip on[survey] preparation inorder to move to the fieldtoo rapidly. Thistemptation should beavoided.
—Ghislaine Delaine and others,“The Social Dimensions of
Adjustment Integrated Survey”
Chapter 2
Survey Management: An Overview
9
1 We assume the survey manager to be a single individual. Although it is possible for ateam of staff to take on this role, this is less desirable. Given the functional links amongthe key steps of any survey, there are obvious externalities that favor a single individualto be the survey manager. Furthermore, a clearly identified and experienced survey man-ager can ensure that the survey adequately covers policy issues of interest to the data users(Delaine and others 1991).2 The survey firm is contracted to do the fieldwork and enter the data.

The chronological sequence and overlap of each activity as well astheir functional links must be carefully synchronized. After one step iscompleted, going back will compromise the next step and, thus, eitherthe timely conclusion of the survey, the accuracy of the results, or both.The survey manager is generally assisted in these tasks by a statisticianand a data processing coordinator, but the manager remains responsi-ble for overseeing the collection of accurate information in a timelymanner and within budget (Delaine and others 1991). A good surveymanager has the ability to anticipate possible sources of error (inter-viewing, wording of questions, editing, and coding) and delays (natio-nal or seasonal holidays, weather conditions, religious festivities, orsample frame inaccuracy) (Moser and Kalton 1971).
Overall Program Design
The early stages of a survey should include a careful review of the liter-ature and talks with experts in the country. This helps conceptualizepotential problems. Similarly, a review of previous survey work and dis-cussions with local survey practitioners will help determine what ap-proach works best, what hypotheses have been tested, and which questionitems are best suited for the specific survey (Warwick and Lininger 1975).This stage also includes an assessment of the survey infrastructure, a care-ful search for potential partners in implementing the fieldwork and spon-soring the survey initiative, and finally the design of plans for datagathering and entry, reports, presentations, and dissemination.3
Questionnaire Design, Pilot, and Data Entry Form
After the research objectives have been identified, the difficult challengeof translating them into a well-conceptualized and methodologicallysound questionnaire begins (Warwick and Lininger 1975). In Invest-ment Climate Surveys4 the core5 questionnaire represents the starting
10 The Power of Survey Design
3 It is good practice to address issues of data entry software and coding from the very be-ginning, although a more detailed discussion and implementation of these issues comesonly after the questionnaire is finalized.4 Productivity and Investment Climate Surveys, or Investment Climate Surveys, in short,are business surveys conducted by the World Bank. These surveys identify key features ofthe business climate that foster productivity in a way that allows regional and subregionalbenchmarking (World Bank 2003).5 The core questionnaire is a set of standard questions implemented across countries toenable international benchmarking. Retrieved on June 13, 2005, from http://www.ifc.org/ifcext/economics.nsf/Content/IC-SurveyMethodology.
point. The development of the questionnaire starts soon after generalplans have been drawn and ends just days before the start of the field-work. Focus groups can identify concerns and experiences of the targetpopulation, as well as evaluate questions and clarify definitions (Gower1993). The initial questionnaire is usually revised many times.
The pilot test in the field is a critical component of questionnaire de-sign. Similarly, the training sessions for enumerators should be consid-ered the last step of questionnaire design, because it often helps identifyproblems with wording and translation.
As soon as the questionnaire has been finalized, it must be immedi-ately coded and the data entry form developed.6 A variety of data entrysoftware programs are available, some at no charge.7 A well-designeddata entry form will have two basic characteristics. First, it will havean interface that is a replica of the paper questionnaire. Second, it willinclude a number of built-in consistency checks to disallow invalid en-tries. The development of a data entry form is a delicate and complexprocess. A number of intricate cross-references and checks must be in-cluded, which requires a professional programmer. It remains the sur-vey manager’s task to determine and identify which, and to whatextent, within- and cross-question consistencies should be embedded inthe form.8 The inclusion of too many or too stringent consistencychecks will make data entry almost impossible, even when there are errors that can be easily corrected. Conversely, a lax system of consis-tency checks will defeat the purpose of the data entry form. A delicatebalance between these two alternatives must be found.
Once completed the data entry form must be tested, if possible be-fore the beginning of the fieldwork. Testing is of critical importanceand attempts to short cut this step could result in delays at later stagesof the survey.9 In the World Fertility Survey, more than 80 percent of
Survey Management: An Overview 11
6 Coding a questionnaire stands for assigning a name to each variable in the question-naire corresponding to each field in the data set.7 A variety of commercially available software programs (Microsoft Access©, SPSS©, andso on) can be purchased, depending on the desired level of sophistication. Simpler butequally effective data entry programs can be downloaded for free from the U.S. Centersfor Disease Control and Prevention (www.cdc.gov/epiinfo/) or the U.S. Census Bureau(www.census.gov/ipc/www/imps/index.html). Additionally, the U.K. Association for Sur-vey Computing (ACS) has links to software that can be used for data capture and the dif-ferent stages of survey implementation (http://www.asc.org.uk/Register/index.htm).8 The complexity of the form automatically excludes the use of simple software such asMicrosoft Excel©. Excel is data management software and, therefore, not appropriatefor this purpose.9 Form development and testing generally takes two to four weeks.

all errors found at the first check were due to specification errors andprogramming errors (Rattenbury 1980).
Survey Firm Selection
Depending on the intricacy of the questionnaire and the complexityof the sample elements, the selection of a survey firm is one of themost difficult and critical tasks. It affects both the timing of the sur-vey and the quality of the data collected. The survey infrastructure isusually difficult to assess in developing countries and an informed se-lection usually involves evaluating a wide range of factors, from thegeographic distribution of local offices to the number of personalcomputers owned (box 2.1). An experienced survey manager caneasily infer the technical ability of a prospective firm (Grosh andMuñoz 1996) from the quality of written documents, such as surveymanuals and recently implemented questionnaires, as well as fromthe complexity of surveys completed over the past two to three yearsand those planned in the near future.10
12 The Power of Survey Design
Box 2.1
Criteria to Look at When Selecting a Survey Firm
Experience
Questionnaire
How difficult is the content?
How coherent is the content?
How good is the formatting?
How much time does the interview last?
How are sensitive and memory questions addressed?
Sampling
What is the unit of observation?
How difficult is to interview the respondent?
10 Opinion polls and market research surveys are much easier to administer than the typical Investment Climate Survey.

Survey Management: An Overview 13
How large was the sample?
Was the sample nationwide?
Fieldwork
What was the ratio of supervisors to enumerators?
How many reinterviews were conducted?
How good were the supervisor and enumerator manuals?
What was the nonresponse rate due to refusal?
Data management
What kind of data quality assurance did they adopt?
What type of data entry software did they use?
How did they organize data editing and checking?
Resources
Personnel
How many people are on staff in relevant positions (supervisors,
interviewers, data entry, programmers)?
What is their level of education?
What is their age range?
How much experience do they have?
Do staff who worked in previous complex surveys still work there?
Equipment
Do they have offices throughout the country?
Do they have computer capabilities?
What software do they use?
Do they have their own e-mail accounts?
Client orientation
What is their data access policy?
What is their reputation?
What are their business affiliations?
Source: Based on Grosh and Muñoz 1996.
Box 2.1 (continued)

Another important factor to consider in the selection process is theorganization of the fieldwork. The collection of high-quality data in atimely manner depends on how well field operations are organized. Co-ordinating and timing the interactions of tens if not hundreds of peopleat different levels and stages of the survey becomes a vital and yet com-plex task. The way the prospective implementing agency deals withstaffing, scheduling, and coordinating simultaneous activities shouldtherefore be given the appropriate weight in the selection process(Weeks 2003). A survey in which each individual is clearly identified asa part of a team, in which all members are clear about their responsi-bilities and accountabilities, and in which a well-organized structure fa-cilitates the flow of information and quickly resolves possible conflictsand doubts will definitely have a positive impact on the timing andquality of the data collection process. Key actors in a typical InvestmentClimate Survey and their functional relationship are shown in box 2.2.
As in all other steps, the procurement process requires a great dealof attention to details. Even when a highly recommended and seem-ingly well-qualified agency exists less noticeable factors should informthe selection process:
• How unexpected problems are anticipated and addressed;• What steps are taken to ensure quality;• Which approach is used to handle the expected bias associated
with sensitive questions;• What strategies are adopted to elicit participation; and• Which characteristics interviewers and supervisors have (in terms
of age, education, experience, and occupation).11
The terms of reference (TOR) developed by the survey manager pro-vides guidance on the “technical” requirements of competing proposals.Inadequate TORs have frequently been a source of error in contractingout the fieldwork (Grosh and Muñoz 1996). Thus it is preferable to fol-low a two-stage strategy. Initially, the TOR should indicate the projectobjectives and provide a copy of the draft questionnaire as well as adescription of the basic minimum data quality requirements. Biddersshould be left free to formulate a detailed methodology to achieve thesurvey objectives. Given the cultural, political, religious, and ethniccharacteristics of each country, it is not advisable to apply the same
14 The Power of Survey Design
11 See chapter 5 for a more detailed treatment of the interviewer’s characteristics.

Survey Management: An Overview 15
Box 2.2
Key Actors and Their Functions in a Typical Investment Climate Survey
• The survey director generally is the head of the agency in charge of the fieldwork. He or she provides
professional leadership, coordinates with the survey manager on organizational and financial issues,
and provides support to survey implementation especially through community awareness.
• The survey manager coordinates with the survey director on more technical aspects of the survey
work. He or she helps in designing the sample, plans and supervises the field operation procedures,
and contributes to the training session. He or she will also oversee the field supervisors and the data
manager (Grosh and Muñoz 1996).
• The supervisors assign respondents to interviewers, coordinate their assignments, and ensure that they
work efficiently. It is part of the supervisors’ responsibilities to monitor and review the quality of the
fieldwork, to conduct unannounced field interviews, and to make call-backs as deemed necessary
while personally visiting some respondents. Supervisors must review the quality of completed ques-
tionnaires, ensuring that interviewers’ writing is legible and skip patterns are followed. Unreasonable
answers must be flagged and returned to the interviewer for correction, if necessary, through an addi-
tional visit. Finally, supervisors facilitate the exchange of information between survey manager and
interviewers, make sure that all instructions from the central office are relayed to field workers, and
Survey director
I1
Survey manager
Data managerSupervisor A
I2 I3
Supervisor B
I1 I2 I3
Supervisor C
I1 I2 I3 Data entrypersonnel
Interviewers
Box Figure 2.2.1.
Typical Organizational Structure of Fieldwork
(continued)

16 The Power of Survey Design
ensure that the central office is regularly updated on the progress of data collection (Grosh and
Muñoz 1996).
• Interviewers set up appointments with the sampled respondents and conduct the interviews follow-
ing the rules, techniques, and protocols highlighted during the training sessions and indicated in the
survey materials. They re-interview respondents, when necessary, to rectify incorrect or incomplete
entries.
• The data entry manager, along with the survey manager, designs the data entry quality control
protocol and oversees the development of the data entry form. He or she supervises data entry
personnel and liaisons with the field manager.
• Data entry staff code and key-punch electronically the questionnaires completed in the field.
Source: Author’s creation.
Box 2.2 (continued)
methodology in every country. Thus, for instance, in Indonesia itappears unnecessary to require call-backs given that standard practicecalls for each form to be signed and stamped by the respondent. Once asurvey firm has been selected, a second more detailed and comprehen-sive TOR should be agreed on among the parties.
An often-overlooked criterion in the procurement process refers to thepotential measurement error associated with each type of implementingagency. The type of agency conducting the fieldwork—governmentagency or a private survey company—can have a different effect on dataaccuracy depending on the kind of question asked. Sensitive questionsabout bribes, for instance, are consistently underreported when the in-terviewer is a government employee.12 Although the magnitude of thebias varies depending on the specific question, the impact of the under-reporting appears to be in the order of 0.3 to 0.6 standard deviationswhen a government agency is conducting the survey.13 Nonetheless thesurvey manager should not rush to the conclusion that private surveycompanies are always to be preferred. As a matter of fact, the same datashows that using government officers as interviewers has a positiveeffect on data accuracy by reducing measurement errors for nonsen-
12 A more detailed description of this phenomenon is presented in chapter 3, on ques-tionnaire design, in the discussion on sensitive questions and subjective questions.13 See appendixes 2 and 3 for a description of questions and a complete set of regressionsresults.

sitive questions. The manager’s estimates of sales growth were moreaccurate14 when government officials conducted the interview. This isnot surprising, because statistical officers generally are better trainedand more experienced in conducting business interviews. The magni-tude of the underreporting (measured in terms of standard deviations)of corruption questions when government officials conduct the inter-views appears similar to the magnitude of accounting data inaccuracywhen the survey is fielded by a private firm (see figure 2.1).15
Over the years, the financial resources needed to conduct a firm-levelsurvey in developing countries have varied. Once again a number ofcountry-specific factors apply, each having a different impact on thesurvey budget: a 7-page questionnaire will be priced differently than a20-page instrument, travel costs are unlikely to be the same in Braziland in Eritrea, and survey experts are harder to find and more expen-sive in Africa than in East Asia.
Survey Management: An Overview 17
14 The absolute value of the error was more than 17 percent for a private company andclose to 1.5 percent for a government agency.15 Data accuracy is measured as deviation between the manager’s reported value of salesgrowth last year and the same values calculated from company books.
Figure 2.1.
Who Is Asking What?Reporting Differences When A Government Official, Rather Than a Private Firm, Asks Sensitive Questions
Source: Author’s calculations.
0.3
–0.33–0.4
–0.2
0
0.2
0.4
Standard deviation
Overreportingon sales question
Underreportingon corruption question
PrivateFirm
GovernmentAgency

Household surveys experience shows that 70 to 90 percent of thetotal survey cost goes to field implementation, while personnel andtravel represent the two most important cost categories (table 2.1).Particular attention must also be paid to the internal composition ofthese two items. Determining the appropriate salary levels across differ-ent professional categories is always problematic. The survey job requiresmonths of intense work and it is unrealistic to assume that this can bedone without appropriate incentives, particularly for the interviewers.Travel costs, including per diems, will also be a source of resentment ifnot appropriately estimated. This is clearly a country-specific problem.Nonetheless, accurate planning in terms of the estimated number ofvisits necessary to complete an interview is essential.
Survey managers must use creativity, diplomatic skills, and expertiseto find a solution that is tailored to the country characteristics whilebeing fair to all parties (Grosh and Muñoz 1996). An issue that occa-sionally surfaces is not only the appropriate rate of pay, but also the rela-tive merits of paying interviewers on a piece rate or by the hour.Supporters of piece rate payment point out the strong economic incen-tive for field staff and the more efficient use of time. Hourly wage advo-cates criticize the former approach for providing an incentive to preferquantity over quality and to “fabricate” answers (Warwick and Lininger1975). A combination of the two approaches might be the best solution.In this case, for each completed questionnaire, a flat rate would be paid,augmented by variable components, mainly related to travel costs andper diem expenses, with a decreasing weight when the number of visitsreaches a predetermined limit. It remains in the survey manger’s interestto relate the cost of the survey to the quality of the data collected, andthe final rate agreed with the implementing agency should reflect this.
The Sample
Soon after the decision to undertake the survey has been reached, anumber of critical decisions must be taken regarding the following:
• The identification of the sample unit;• The localization of the population list;• The design of the sampling procedure; and• The determination of the sample size.
Preparations to draw the sample should start at the earliest possibletime given how difficult and time-consuming it is in many developing
18 The Power of Survey Design

Survey Management: An Overview 19
Table 2.1
Share of Survey Cost in Household Surveys
Percentage Weight of Accounting Categories
Personnel Transport Equipment Consumables Other Sample Size
Angola 63 22 10 1 4 6,000
Botswana 79 0a 10 4 7 7,000
Eritrea 64 0a 28 5 3 4,000
Kenya 62 23 3 5 7 7,000
Lesotho 75 5 6 2 12 7,500
Madagascar 31 7 33 13 16 6,500
Malawi 32 17 24 22 5 6,000
Mozambique 61 12 3 12 11
Somalia 44 18 5 1 33 2,200
South Africa 69 24 2 4 2 30,000
Swaziland 30 4 2 1 63 4,500
Tanzania 78 13 2 1 7 3,000
Zambia 82 5 2 6 5 8,000
Overall 63 15 7 6 9 7,054
Percentage Weight of Survey Activities
Preparation Implementation Data Processing Reporting
Angola — 84 6 10
Botswana 10 59 22 9
Kenya — 94 3 4
Lesotho — 73 19 9
Madagascar 0 79 3 18
Malawi 5 63 16 16
South Africa 1 93 3 3
Swaziland 63 23 8 6
Tanzania 23 72 4 1
Zambia 0 92 6 1
Overall 7 81 6 6
Source: Keogh 2003.Note: Data refers to household surveys. — = Not classified.a. Amount included in the personnel costs.

countries to identify a reliable sampling frame. At the end of the field-work, the estimated weights must be adjusted to account for frame prob-lems and nonresponse.
Training
When everything is ready for the start of the fieldwork, training shouldtake place. No matter how complex the questionnaire is, and given theaverage interviewer’s quality in developing countries, training remainsfundamental to ensure a consistent interpretation and implementationof questions. The survey manager, having extensive experience and aclear understanding of the analytical objective of each question, is thebest person to conduct the training. In this process, training manualsare particularly useful, containing detailed information on the generalpurpose of the survey, instructions on the conduct of the interviews, de-tailed explanations of the questions, and references to the methodologyfor recording answers.
Fieldwork and Data Quality Control
The fieldwork is the most time-consuming part of the survey. Althoughthe interview cycle itself must be clearly defined and responsibilitiesclearly identified (box 2.3), the more complex the questionnaire, themore difficult it is to estimate the exact timing of survey completion.
A host of factors influence the chronological implementation of thesurvey. Apart from some obvious “objective” features such as the lengthof the questionnaire, the size and composition of the sample, and thenumber of interviewers, a host of other intangible factors, some quitesubtle, come into play. For example, how well a questionnaire is de-signed will definitely impact the timing of the interview. The appropri-ate use of skipping patterns and the clarity of definitions and sentenceswill not only speed up the interview process but also ensure accuratedata. The quality of the interviewers, and more generally of the surveyfirm, is another factor influencing the timely completion of the survey.Interviewers with an unambiguous understanding of the questions, withexperience in similar surveys, and with the ability to establish a clearrelationship of trust with the respondents will foster higher coopera-tion and complete the interviews in a shorter period of time. Similarly,if the fieldwork is thoroughly organized, delays are minimized. Theaccuracy of the population list is yet another factor. If the list is up to
20 The Power of Survey Design

Box 2.3
Responsibilities Must be Clearly Identified in the Interview Cycle
Verification of existence of establishment
Letter of invitationReplacement
Nonexisting orout of scope Existing
Rectified byinterviewer
Errors andomissions
Centraloffice
Interviewer
Follow-up call
Nonacceptance
AcceptanceAdditional attempts
by interviewerand/or senior staff
Appointment
Interviewcompleted
Questionnaire editedby interviewer
Supervisor check
Survey manager
Data manager
Data entry
Box Figure 2.3.1.
Typical Interview Cycle
date, time will not be wasted in locating respondents that relocated orestablishments that no longer operate. Last but not least the predeter-mined level of response rate considered acceptable will also impact theduration of the survey. A survey with 50 percent of item nonresponsewill no doubt be completed faster than a survey with 90 percent of allquestions appropriately answered.
The beginning of the fieldwork marks the start of a number of head-quarter (HQ) activities coordinated by the survey manager. As soon asinterviewers are in the field, the survey manager should start planningfor quality control and data cleaning. While the development of a response rate control program is relatively fast, the development of acleaning program takes longer. The response rate control must proceedalmost contemporaneously to the fieldwork and should be used to feedback instructions to the field manager about how to improve the qual-ity of the data collection process. To achieve this efficiently, data mustbe sent back to HQ in batches at regular intervals. Data cleaning, onthe other hand, should start during the fieldwork but can only be com-pleted after the end of the collection process.16
One critical aspect of the survey manager’s job is to anticipate po-tential bottlenecks and take remedial actions before they compromisethe timely completion of the whole project. No matter how many fac-tors have been taken into account in the preparatory stage of the sur-vey, the experienced survey manager must be on the lookout for the
22 The Power of Survey Design
The central office should be responsible for the verification of the existence of establishments and for
delivering the introductory letter. The interviewer should first approach the respondent with a personal visit
to secure participation. Additional coaching, if necessary, to convince reluctant respondents should be
handled by the supervisor or survey director. The replacement of ineligible respondents must be carried out
according to specific sampling procedures agreed on with the survey manager. The supervisor’s role is to
manage the fieldwork and to check the quality of the interviews. The completed and verified questionnaire is
transferred to the data entry manager whose team will code and enter it in electronic form.
Source: Author’s creation.
Box 2.3 (continued)
16 Depending on the length of the questionnaire and the degree of accuracy of the clean-ing protocol, the development of the cleaning program can take from three to six weeks.

unexpected. Two useful tools are at the survey manager’s disposal—one for monitoring the design of the whole project, the other to super-vise the progress of the fieldwork.
A first tool used in planning and managing the timing of a survey isthe Gantt Chart (see figure 2.2). Defined as a graphic representation ofthe sequence and link of activities, it can be used to detect slacks and thecritical path of the whole project.17 This chart is a useful tool in identi-fying what options are available if problems occur during the implemen-tation of the survey. For example, if the survey is behind schedule, thefollowing alternatives could be employed to make up time (Weeks2003):
• Start earlier critical path activities by overlapping with predecessoractivities.
• Shorten the duration of critical path activities by (1) adding re-sources if they are resource-driven, or (2) internalizing the loss(that is, lower quality) if not resource driven. This approach worksbest if employed on earlier activities.
• Move resources from noncritical to critical path activities.
The second tool designed to aid field supervision is the weekly re-port (table 2.2). This simple form allows the survey manager toeffectively monitor the progress of interviews from invitation to com-pletion and to estimate a number of fieldwork performance indica-tors, such as cooperation rate, response rate, coverage rate, refusalrate, and completion rate.
Survey Management: An Overview 23
17 The critical path is the series of activities that determines the duration of the project. Slackis the amount of time that an activity can be delayed without delaying the project comple-tion date. By definition, the critical path has zero slack (Project Management Institute 2000).

Figure 2.2.
Gantt Charts Illustrate Timing of Survey Activities
24 The Power of Survey Design
ID Task Name Duration Sep '04 Oct '04 Dec '04 Jan '05 Feb '05 Mar '05 Apr '05 MNov '04
Split
1
2
3
4
5
6
7
8
9
10
11
12
13
14
15
16
17
18
19
20
21
22
23
24
25
26
27
28
29
1. Questionnaire design
Develop draft instruments
Review & revise draft
Pilot
Translate
Finalize
2. Procurement
Draft TOR
Receive Proposals
Review, Negotiate
3. Sample design
Sample design
Identify frame problem
Adjust sampling weight
4. Manual
Develop draft manuals
Review and finalize
5. Data Entry Form
Develop
Test & Finalize
6. Training
Develop Training program
Hold training sessions
7. FIELD WORK
Interviews
Data entry operations
8. HQ activities
Response rate control
Cleaning
64 days
10 days
10 days
5 days
5 days
1 day
43 days
1 day
21 days
21 days
138 days
21 days
25 days
2 days
20 days
15 days
5 days
20 days
15 days
5 days
10 days
5 days
5 days
85 days
80 days
80 days
80 days
75 days
15 days
22 29 5 12 19 26 3 10 17 24 31 7 14 21 28 5 12 19 26 2 9 16 23 30 6 13 20 27 06 13 20 27 3 10 17 24 1
Progress
Task
Summary
Project Summary
Milestone
External Milestone
Deadline
External Tasks
Source: Author’s creation.

Table 2.2.
Weekly Reports Enable Managers to Monitor Progress
Form FormTarget Out of Non- Total Agreed to Partially Fully Forms Forms Sample
Supervisors Sample Refusalsa Scope contactb Samplec Visited Participate Completed Completed Validated Entered Left
Supervisor 1 133 8 2 0 143 78 56 39 22 18 16 115
Supervisor 2 100 3 9 0 112 76 58 53 51 41 40 59
Supervisor 3 130 1 10 0 141 94 78 56 53 50 47 80
Supervisor 4 299 0 25 0 324 207 164 161 157 111 99 188
Supervisor 5 73 0 1 0 74 28 23 47 31 21 15 52
Supervisor 6 265 5 50 0 320 202 140 118 75 74 63 191
Total 1,000 17 97 0 1,114 685 519 474 389 315 280 685
Source: Author.a. No more attempts.b. Nonexisting, moved outside study area, wrong address.c. Target sample + Replacements (refusals + out of scope + noncontacts).
NonresponseRespondents


Improving question design is one of the easiest, mostcost-effective steps that can be taken to improve the
quality of survey data” (Fowler 1995, vii), yet it is frequently one of themost disregarded. While many people focus a lot of attention on sam-pling where the discussion of errors often deals with few percentagepoints, “experiments suggest that the potential range of errors involvedin sensitive or vague opinion questions may be twenty or thirty per-centage points” (Warwick and Lininger 1975, 126).
Although there is no formal theory on the wording of a question, ageneral principle exists to substantially improve its design. That is, twobasic rules make a good question: relevance and accuracy.
Relevance is achieved when the questionnaire designer is inti-mately familiar with the questions, knows exactly the questions’ ob-jectives, and the type of information needed. To enhance accuracy,the wording, style, type, and sequence of questions must motivate therespondent and aid recall. “Cooperation will be highest [. . .] whenthe questionnaire is interesting and when it avoids items difficult toanswer, time-consuming, [or] embarrassing” (Warwick and Lininger1975, 127). A question is relevant if the information generated is ap-propriate for the purpose of the study. The objective of the questiondefines the information that is needed and models the words to beused. Sometimes this task is easy, for example, when asking the re-spondent’s age. Other seemingly simple tasks, such as estimating therespondent’s level of income is trickier. Hence, the questionnaire de-signer must force the analysts to be very specific about what theywant to measure and why. “Until researchers decide specificallywhat their goals are it is impossible to write an ideal question”(Fowler 1995, 11).
A question is accurate if it collects the information sought in a reli-able and valid manner. It serves no purpose to ask the respondent about
The goal is to havedifferences in answersreflect differences in wherepeople stand on the issues,rather than differences ontheir interpretations of thequestions.
—Floyd Fowler,Improving Survey Questionnaires:
Design and Evaluation
Chapter 3
How Easy It Is to Ask the Wrong Question
27
“
Relevance
Accuracy

something he or she does not understand clearly or that is too far in thepast to remember correctly; doing so generates inaccurate information.As discussed later, respondents rarely admit ignorance. Rather, for a number of different reasons (the desire to be helpful or not appear ignorant), they tend to answer any question, even if they are not in-formed or barely understand the matter at hand. Because surveys querya variety of respondents, the questionnaire designer must always posethese questions only to people who are able to provide an accurate answer (Moser and Kalton 1971).
It is not always easy to determine whether the respondent has suffi-cient information to provide an accurate answer. The questionnaire de-signer should not fall into the trap of thinking easier questions givemore accurate answers. This is especially true for opinion questions.By asking opinions on the budget deficit, for instance, we can notdistinguish between whether the policy is wrong or the respondent isuninformed. Opinion questions require a validity check to screen “in-formed” respondents. This is accomplished by resorting to data onmeasurable behavior available from other sources (Moser and Kalton1971) (that is, asking the current level of budget deficit) or by askingsimilar questions in different parts of the questionnaire to check theconsistency of answers.1
Finally, unless the respondent is willing to provide an answer, ask-ing the right question to the right respondents still may not produce thedesired outcome. In most surveys, respondents are not obliged to par-ticipate and are generally reluctant to do so.
Many forces motivate people to participate in a survey: an interestin the topic, a desire to be helpful, a belief of the importance of thesurvey, a feeling of duty. . . . Other forces influence people to refuse:difficulty in understanding the questions, fear of strangers, the feel-ing of one’s time being vested, difficulty in recalling information,and embarrassment at personal questions. (Plateck, Pierre-Pierre,and Stevens 1985, 17)
The way the survey is presented, how difficult the questionnaire is,and how sensitive questions are addressed influences the willingness ofa prospective respondent to participate.2
28 The Power of Survey Design
1 This second approach is the hardest to implement and not recommended.2 Issues of survey participation are addressed in the section on survey interview (chapter 5).
Willingness

Practical Guidelines in Questionnaire Design
Constructing effective questions is an art in which field experience,along with a basic knowledge of linguistic and cognitive psychologyplays a critical role (Peterson 2000). Although practitioners have de-veloped techniques to help assess the level of readability and difficultyof questions, the ability to design a question cannot be learned from abook.3 There is no substitute for experience of personally piloting andconducting interviews.
“A good rule to remember in designing questions [. . .] is that the re-spondent has probably not thought about these questions at the levelof detail required by the survey” (Warwick and Lininger 1975, 158).When developing a question, the designer should first of all put himself“in the position of the typical, or rather the least educated, respondent”(Moser and Kalton 1971, 320). He or she must have a sense of the cog-nitive abilities of respondents and design the questions accordingly.Hence, while South Asia and East Asia are the regions with the highestshare of businessmen with university training, in Sub-Saharan Africaless than half of the businessmen hold a university degree. SimilarlySub-Saharan Africa and Latin America are the only regions where ap-proximately 10 percent of businessmen have not completed secondaryeducation (figure 3.1).
Last but not least the mode of the interview4 must also be taken intoaccount when designing questions. The same word may generate con-fusion if spoken but be unambiguous if written. Homophonic wordsmight elicit different interpretations in oral interviews, whereas in somelanguages different intonations of the same word will educe a com-pletely different meaning (Peterson 2000).5
Question Wording
A number of studies have irrefutably shown that changing even a singleword in a question can significantly alter the response distribution andaccuracy. Three decades ago Loftus and Zanni (1975) reported the
How Easy It Is to Ask the Wrong Question 29
3 See Homan, Hewitt, and Linder 1994; Stevens, Stevens, and Stevens 1992; Gallagherand Thompson 1981; McConnell 1983.4 Possible modes include face-to-face, telephone, and mail interviews.5 The survey mode has a clear effect on a number of survey issues well beyond wording.Table 1 in Tourangeau and Smith (1996) shows survey mode effects on sensitive topics.

results of two experiments in which a short movie is shown to two in-dependent groups followed by a series of questions, some referring toevents not even present in the movie. Figure 3.2 shows how changingone word for another—one group was asked, “Did you see the brokenlight?” the other group was asked, “Did you see a broken light?”—has a significant impact on the response distribution. In the mind of therespondent, “a” increases uncertainty about the existence of the eventand consequently boosts (by more than half) the number of non-responses. By contrast, “the” leads the respondent to infer the presenceof an event, even if the event is nonexisting, hence encouraging falserecognitions.
Because of the unique needs of each question, there is no universallyaccepted theory on question wording. There is, however, a generalagreement on what constitutes good and bad questions. Four criteriashould be followed when wording any question: it must be brief, objec-tive, simple, and specific (or BOSS).
30 The Power of Survey Design
Figure 3.1.
Levels of Education of IC Survey Respondents
0
10
20
EAsia ECA LAC SAsia SSA
No secondary schoolSecondary schoolVocational trainingSome universityGraduate & postgraduate degree
77%70%
59%
82%
44%
Percent of respondents with level of education
Source: Author’s calculations.Note: EAsia = East Asia; ECA = Europe and Central Asia; LAC = Latin America and the Caribbean; SAsia = South Asia; SSA = Sub-Saharan Africa.

Be Brief
All practitioners would agree that “unless a question is relevant to theresearch being conducted, it should not be included in a question-naire. Likewise, unless a word is relevant to a question, it should notbe included in the question” (Peterson 2000, 52). Questions shouldbe short. Longer questions quickly become more complex and con-fusing for the respondent as well as the interviewer. Presser and Zhao(1992) show how a shorter question helps the interviewer do a betterjob by decreasing the tendency to misread it. Furthermore, the com-plexity of a long question is magnified by the intricacy of the subjectmatter covered.
As a rule of thumb, a question should not exceed 20 words (Payne1951) and should not have more than three commas (Peterson 2000);however, brevity should not only be judged on physical appearance butalso on contextual simplicity. In this sense, brevity means asking onequestion at a time. The designer must avoid the use of hidden questions,that is, questions that implicitly determine their relevance on anotherquestion. So asking “what interest rate are you paying on your loan?”implies the hidden question of “having a loan.” More reliable data can
How Easy It Is to Ask the Wrong Question 31
Figure 3.2.
A One-word Change Has a Significant Impact on Response
0
20
40
60
True event False positive Don't know
Percentage of responses
Did you see a broken light?Did you see the broken light?
Source: Loftus and Zanni 1975.

be collected if we ask the questions separately: Do you have a loan?What interest rate are you paying? (Foddy 1993).
While brief questions are simpler, a question that is too short mayalso generate confusion. So the issue of brevity is not to reduce thelength of a question by itself, but to choose the shortest way to pose thequestion without jeopardizing the intended meaning (see example 3.1).Likewise, a complex topic should not be phrased in one single questionin the interest of brevity. This will only magnify its complexity and re-sult in inaccurate answers.
The exception to the brevity requirement involves questions probingmemory or sensitive topics. Experiments show that longer questionsprovide more accurate answers when memory or sensitive topics arecovered (Peterson 2000).
Be Objective
“Nonobjective questions share a common characteristic: they tend tosuggest an answer” (Peterson 2000, 57). The questionnaire designershould pay close attention to the neutrality of the words, because thequestion’s objectivity can be subtly violated unintentionally. Hence heor she must be aware of the following:
Avoid leading questions. Leading questions are those questions that—by their content, structure, or wording—push the respondent in the di-rection of a certain answer by implication or suggestion (Warwick andLininger 1975). So, for instance, a question that begins “Shouldn’tsomething be done about . . . ?” leads to a positive answer. Similarly,when a question suggests only some of the alternatives, it leads in thedirection of those alternatives, particularly if the respondent is not sureor does not understand the question properly (see example 3.2).
The set of response options have been proven to influence the answersgiven by the respondent in at least three different scenarios. First, failureto give equal weight to all options has the effect of suggesting what theusual or expected answers should be. Schwarz and others (1985) showedthat compared with the true distribution on television viewing, respon-dents who were given a set of low-range categories to chose from weremore likely to underreport. Similarly, respondents who were given a setof high-range categories did overreport television viewing (table 3.1).
Second, the actual set of options offered act as a source of informa-tion. This happens because respondents are reluctant to go beyond thelist to avoid reporting behaviors that might appear unusual in the con-text of the range offered, or because respondents follow the easier path
32 The Power of Survey Design
Response options

How Easy It Is to Ask the Wrong Question 33
Example 3.1
Does Brevity Mean Short?
Brevity in this case is achieved at the expense of clarity.
Original question: How frequently does your consignment arrive late at the gateway port and final destination
in comparison with your planned schedule?
Gateway port Final destination
Average delay in the last year (days) (days)
Maximum delay in the last year (days) (days)
This question is extremely complex for a number of reasons:
a) it combines 4 different questions in one sentence. Generally, questions in table format are easy towrite but extremely difficult to administer in a survey;
b) part of the question is not even included in the main text (average and longest delay);c) it uses a general term, “frequently.” Questions need to be specific; since we expect an answer in days
we are to ask for “days”;d) There is no clear time reference. When? How long ago? Over what time period?e) It assumes that the respondent experienced such an event. Filtering is missing.
A better way to ask this question(s) is:
Revised question:
In the last year, did you experience delays in delivering your goods from the factories to the gateway port? Yes / No
If yes, what is the average and maximum number of days that your export shipments arrived late
at the gateway port in comparison with your planned schedule?
Gateway port
Average delay in the last year (days)
Maximum delay in the last year (days)
In the last year, did you experience delays in delivering your goods from the gateway port
to the final destination? Yes / No
If yes, what are the average and maximum number of days that your export shipments arrived late
at the final destination in comparison with your planned schedule?
Final destination
Average delay in the last year (days)
Maximum delay in the last year (days)

34 The Power of Survey Design
Example 3.2
Can I Ask You a (Leading) Question?
“How well is the Prime Minister managing monetary policy?”
1. Extremely well 2. Very well 3. Pretty well 4. Well 5. Not so well
This question has three elements that are designed to lead the respondent toward a favorable answer:
(1) The explicit inclusion of the word “well” in the main text of the question has the concealed intent of
pulling the respondent toward a positive attitude. This is even more so if he or she is not aware of the
event asked (see point 3).
(2) The range of options provided is not balanced, with all the choices referring to a different degree of
positive attitude. Even the least favorable option rates the Prime Minister conduct of monetary pol-
icy as “not so well.” A more balanced rating would include “Poor,” “Very poor,” and “Extremely
poor.”
(3) Finally there is no opt-out option (Don’t Know). Because it is easier to influence the un-informed
respondent, this is another way to lead him or her toward one of the “well” options reported.
Table 3.1
Reported Behavior Using Low and High Category Ranges
Percentage of Estimated TV Usage
Hours True Distributiona Low Category High Category
up to 0.5 0 11.5
0.5 to 1 19.2 26.9
1 to 1.5 15.4 26.9 70.4
1.5 to 2 46.2 26.9
2 to 2.5 0 7.7
2.5 to 3 19.2 22.2
3 to 3.5 0 0 7.4
3.5 to 4 0 0
4.5 + 0 0
Mean 3.7 2.8 3.7
a Answers to an open-ended question.Source: Schwarz and others 1985.
� �� �

of answering closed questions rather than recalling specific information(Foddy 1993). Third, the actual list of options provided will influencethe respondent. Options that appear at the beginning of a long list seemto have a higher likelihood of being selected, which is known as the pri-macy effect (figure 3.3). Research on the primacy effect appears toshow that this phenomenon is inversely correlated with the respon-dents’ level of education (Krosnick and Alwin 1987). Furthermore, theinterview’s mode also plays a critical role. When the list of options areread to the respondents, there is evidence that that respondents tend tofavor the ones they hear last (known as the recency effect). Conversely,when the respondent reads the list himself or herself (that is, whenusing show cards), the primacy effect seems to dominate (Foddy 1993).
Another case of a nonobjective leading question occurs when someinformation is withheld from the respondent. This would be case ofasking “Are you in favor of a new road that would reduce rush hourtraffic by 50 percent?” without mentioning that the road would be fi-nanced with a new tax (Peterson 2000). Finally, leading questions might
How Easy It Is to Ask the Wrong Question 35
Figure 3.3.
Response rate distribution when the order of alternatives is reversed
Percentage choosing three most important items
Source: Krosnick and Alwin 1987.
0
20
40
60Standard orderReverse order
Order of listing
Withholding information

generate the so-called “politeness or courtesy bias,” when respondents,in their desire to be well-mannered toward the interviewer, might leantoward an answer that they think will please the interviewer (Plateck,Pierre-Pierre, and Stevens 1985).6 This bias can be mitigated by usinglead-in statements on both desirable and undesirable events, that is,“Many believe that . . . while others think that. . . . What is your opin-ion?” (Warwick and Lininger 1975).
Avoid loaded questions. Loaded questions bias answers through emo-tionally charged words, stereotypes, or prestige images such as “fair,”“honest,” “experienced,” “colonialism,” and so on. “Do you work?”is an example of a simple but emotionally charged question. Sometimethis effect is more subtle. To describe the same phenomenon—for ex-ample, government help—the words “welfare” or “subsidy” are usedif we refer to something we oppose, but the word “incentives” is usedif we refer to something we favor (Browne and Keeley 2001). The“question designer must be continually on the alert for options whicheither flatter the respondent’s self image or injure his pride” (Warwickand Lininger 1975, 144), because these options are a clever way to pushthe respondent in the desired direction.
Be wary of built-in assumptions. Generally speaking, questions shouldnot take for granted that the respondent has familiarity with or carriesout the activity asked in the question (Moser and Kalton 1971). Theneed for this awareness is even greater if the question refers to specificissues such as immigration laws or trade policy. Such questions couldembarrass or annoy respondents who might claim knowledge theydon’t have so that they do not look ignorant or the respondents mightrefuse to continue with the interview (Plateck, Pierre-Pierre, and Stevens1985). In these cases, filters should be used.
In fairness to some practitioners, it must be said that there are ex-ceptional cases in which not using leading or loaded questions wouldbias the results. When you ask people whether they engage in certaindisapproved practices (that is, paying bribes), they tend to lie and sayno. However, if you provide more background information on thesensitive behavior7 and then ask directly when, where, and how often
36 The Power of Survey Design
6 This phenomenon is not limited to leading questions: it can very well occur with loadedquestions.7 This to reduce the threatening nature of the question (see section on sensitive questionslater in this chapter).
Politeness bias
brides are paid, it is more likely that respondents will answer truthfully(Warwick and Lininger 1975).
Be Simple
The questionnaire designer should use language and terminology that ex-ploits the simplest words and phrases. He or she should do the following:
Use words and expressions that are simple, direct, and familiar to all
respondents. He or she must refrain from adopting “consider, initi-ate, purchase, or state,” and use instead “think, start, buy, or say.” Heor she should not ask “Is it your opinion . . . ?” but simply “Do youthink . . . ?” Similarly, the designer should refrain from employingslang expressions, because not everybody understands these expres-sions in the same way, if at all. It is not sufficient to ensure that all re-spondents understand the words used, it is necessary that they allunderstand the words in the same way (Moser and Kalton 1971). Takefor instance the apparently simple and familiar expressions “majority”and “minority.” What percentage value would you associate to thesetwo commonly used expressions? Scipione (1995) asked this of a groupof respondents and discovered that the average values associated withmajority and minority were, respectively, 56.50 and 24.12 percent.8
Avoid technical jargons or concepts that are common only to those
with specific and specialized training. The problem with technicalterms, such as return on equity (ROE), discounted cash flow (DCF),and net present value (NPV), is determining whether the respondentunderstands the question or simply provides an answer in order not toappear ignorant. Furthermore, it is difficult to know whether the inter-pretation of the technical term is the same across respondents. There-fore, in these instances, if a technical term must be used and there is nosimple correspondent concept, the technical term must be explained before the question is asked. Doing so may prevent the respondent frommentally framing the answer to the question based on his or her owninterpretation of the technical term (Plateck, Pierre-Pierre, and Stevens1985). After the respondent has framed the answer in his or her mindhe or she will not listen to the definition provided afterward.
Adopt the same definitions throughout the form. If respondents areto answer accurately, the same definitions should be applied consistently
How Easy It Is to Ask the Wrong Question 37
8 With a wide standard deviation of 18.55 and 20.63, respectively. More examples areprovided in table 3.7.

across all respondents. This is the only way their answers can be ag-gregated and compared not only within a country but also across re-gions. Although most practitioners agree with this predicament (thatis, consistency in terminology), not all realize this also means avoidingthe use of different terms with the same meaning. Unfortunately, weoccasionally find that different definitions are used interchangeably tomean the same thing, such as when the same unit of investigation (theestablishment) in a business survey is referred to as establishment,plant, factory, company, mother-company, firm, enterprise, or outlet(see example 3.3).9
If different terms are meant to indicate the same thing, then the ques-tionnaire designer should use one term consistently throughout thewhole document. Failure to do so will inevitably generate confusion inthe respondents. If different terms do have different meanings, then allthe definitions must be clearly explained in the questionnaire. This avoidspossible confusion among respondents and ensures that the respondentanswers questions on the basis of a consistent definition. Failing to takethis into account in the questionnaire design is a major source of error(Fowler 1995).
When definitions are complex, it can become difficult to communicatea common definition to all respondents. In this case, it may be preferableto divide the single complex definition into a series of simple compo-nents. Hence, when asking for the geographic distribution of exports, itmight be easier, and more accurate, for respondents to indicate the spe-cific country of destination rather than the region (see example 3.4).
This approach has a number of benefits. First, it makes the questionunambiguous because it is not necessary to communicate a commoncomplex definition. Second, it makes the respondent’s task easier be-cause he or she does not have to add up or use the assigned definitionto give an answer. Finally, this approach will provide the researcherwith user-friendly data.
Avoid negative or double negative expressions. Double negatives notonly generate cognitive complexity but also lead the respondent towardone answer. Suppose we ask a respondent whether he or she agrees ornot with the following statement: “I am not satisfied with my job.”
38 The Power of Survey Design
9 Others examples of different terms used with the same meaning are (1) product, mainproduct, main product line, most important activity, leading product, main line; (2) work-force, employees, workers; and (3) loan, term loan, line of credit, overdraft.

Disagreeing with this statement of not been satisfied is a complex wayof saying that he or she is satisfied (Fowler 1995). Similarly if we ask“You are going to do X, aren’t you?” we imply the expectation of a yesanswer. Conversely, if we ask “Aren’t you going to do X?” we implythe expectation of a no answer (Foddy 1993). Experiments show thataffirmative questions that are equivalent to superfluous negative ques-tions take less time to answer (−7 percent) and prompt fewer requestsfor repetition or clarifications (−6 percent) (figure 3.4).
Simplicity is achieved when the level of cognitive effort the respon-dent is called on to perform in answering the question is minimized.This is not to say that difficult questions cannot be asked. Answers to
How Easy It Is to Ask the Wrong Question 39
Example 3.3
To Whom Are We Talking?
Q 87 We have heard that establishments are sometimes required to make gifts or informal payments to public officials to“get things done” with regard to customs, taxes, licenses, regulations, services, etc . . .Would you say this is true:
Always .............. 1Mostly .............. 2
Frequently .............. 3Sometimes .............. 4
Seldom .............. 5Never .............. 6
Refuse ............ 99NA .......... 100
Q 88 On average, what percent of annual sales value would such informal expenses cost to a typical firm like yours? __________%
Q 89 Recognizing the difficulties many enterprises face in fully complying with taxes and regulations, what % of totalsales would you estimate the typical establishment in your area of activity reports for tax purposes? __________%
Q 90 Has your company been inspected or by or required to attend meetings with officials of national government,provincial, or municipal authority agencies during last 12 months?
Yes .......... 1Go to Q90bNo .......... 2Skip to Q91
This real case example shows how four different terms referring to the same unit of investigation (the estab-lishment) are used interchangeably in four consecutive questions.
Note: Words in bold italic type emphasized here only; not on survey form.

complex questions can be obtained from surveys, but their accuracywill depend on the ability of the designer to match the level of cogni-tive complexity of the question with the respondent’s level of cognitiveability.
Be Specific
Being specific means asking precise questions. Vague queries will gen-erate vague answers or, as is often the case in business surveys, will gen-erate a sense of frustration in the respondent and lead to a perceptionthat the study is not legitimate. Elite respondents do not like oversim-plification of complex issues and when this happens they tend to askdetailed questions putting the interviewer in a difficult or embarrassingposition (Zuckerman 1972).
The questionnaire designer should avoid items that are too general,too complex, or too ambiguous. Indefinite words used in everyday con-
40 The Power of Survey Design
Example 3.4
Is Hong Kong Part of China?
X9. Please provide information on the percentage distribution of your plant’s exports by destination regions:
Percent of annual exports of Which year did your plant export
your plant per year to this region for the first time?
Regions of export 2001 2000 Year
a. West Europe _____ % _____ % _____
b. East Europe _____ % _____ % _____
c. North America (USA & Canada) _____ % _____ % _____
d. Russia & Former Soviet Union countries _____ % _____ % _____
e. China _____ % _____ % _____
f. Rest of Asia (excluding China) _____ % _____ % _____
g. Others specify _____ % _____ % _____
TOTAL 100% 100%
This example shows how difficult it is for the respondent to answer the question in the way presented.
Exports to Hong Kong should be included in “China” or in “Rest of Asia”? Unclear definitions generate
inaccurate answers.
Indefinite words

versation such as often, occasionally, usually, regularly, generally, rarely,normally or good, bad, approve, disapprove, agree, disagree, like, dis-like should also be avoided because they lack an appropriate objectivedimension. For one person often may mean once a day, for anotheronce a year (Warwick and Lininger 1975). The more general the ques-tion the wider the range of interpretations it invites (Converse andPresser 1986). If you ask “What kind of car do you have?” you shouldnot be surprised to hear “a foreign car,” or “a four-wheel-drive car,”or “a sports car,” or even “a very nice car.”
Particular attention should be placed on the usage of words that implygreat specificity, such as ever, always, and never. The meaning of thesewords extends the time horizon of the questions to the utmost limit andthus might render meaningless any answer because of its (almost) com-plete invariance. It might be legitimate to use these expressions when thephenomenon is rare or when respondents tend to answer randomly oruntruthfully (Peterson 2000).
Abbreviations should equally be avoided. Using MNC10 can causeconfusion for the respondents who might assume a different meaning
How Easy It Is to Ask the Wrong Question 41
Figure 3.4.
Affirmative Questions Reduce Requests for Clarifications
0
4
8
12Requests for clarifications (percent)
Affirmative questionNegative questionSource: Bassili and Scott 1996.
10 Instead of Multi-National Corporations or Manila National Company.
Abbreviations

than intended by the interviewer. The use of abbreviations may alsogenerate confusion for the interviewers, especially when interpersonalrelations are tense. Abbreviations should be spelled out clearly unlessthey are common to all respondents or have already been defined in thequestionnaire (Plateck, Pierre-Pierre, and Stevens 1985).
In closed-ended questions, the selection of answer alternatives, in it-self, could become a source of confusion for the respondent unless theyare mutually exclusive and collectively exhaustive (Peterson 2000). Thisapparently simple requirement is sometimes overlooked (example 3.5)and it is occasionally hard to fulfill. In some instances, in fact, the set ofpossible alternatives is too broad and their “neutral” classification ingroups hard to determine.11
Another typical example of ambiguity is generated by double-barreledquestions, that is, questions covering two or more issues at once. Thesequestions cause uncertainty and confusion, particularly when both partsof the question apply to the respondent in different ways, and they usu-ally require additional explanations (figure 3.5) As a consequence, theymust be avoided. These type of questions should be divided into twoquestions or the choices provided for answering should cover all pos-sible answer combinations.
Finally, in evaluating the appropriate level of specificity to apply ina question, the designer should not ignore the ability of the respon-dent to answer. While it is important to ask specific questions, it is
42 The Power of Survey Design
Example 3.5
Are You from New Delhi or from India?
III.4 Do you expect to make a substantial increase in investment in order to increase capacity or improve quality?
code: Yes=1; No=2; Firm is closing=3
In 2003 �In 2003–2005 �
In this example the question includes two options not mutually exclusive. Hence if one respondent intends
to invest in 2003 and in 2004 while another intends to invest only in 2003, they will both answer YES to
both questions and we will not be able to discriminate among them.
11 In this case, one possible solution is to adopt an open-ended question.
Answer alternatives
Double-barreled questions
Ability to answer

equally essential to give the respondent an answer task that he or shecan perform (Fowler 1995), as in example 3.6. It is very likely thatthe respondent knows the village where he or she sells his or her prod-ucts, but at the same time, he or she might have no idea of its currentpopulation.
How Easy It Is to Ask the Wrong Question 43
Figure 3.5.
Double-Barreled Questions Increase Requests forClarifications
0
4
8
16
12
Requests for clarifications (percent)
Single barrelDouble barrelSource: Bassili and Scott 1996.Note: For single barrel, the answer is the average of two simple questions (author’s calculations).
Example 3.6
Can You Tell Me How Many People Live in Pisa?
Sales and Supplies
13. a) What percent of your establishment’s sales are:
i) sold domestically
a) to towns with 50,000 inhabitants or more ____%
b) to towns with < 50,000 inhabitants ____%
ii) exported directly ____%
iii) exported indirectly (through a distributor) ____%
TOTAL = 100%

Question Style
Unless respondents clearly understand a question, they will not be ableto provide meaningful answers (Peterson 2000). Hence two fundamen-tal concerns must be in the designer’s mind when developing any ques-tion: will respondents be able to understand the question and will theybe able to answer it? A well-understood question will not only increasethe accuracy of the answers, but also their frequency. Two characteris-tics have a direct impact on these abilities: legibility and relevance.
Use Legible Questions
Ask questions that read well. This implies that conditional clauses, qual-ifications, and all other less important information must come ahead ofthe key content of the question. This placement prevents the respon-dent from jumping to an answer before the full question has been laidout. Likewise, punctuation should loosely follow proper grammaticalrules and be more tailored to the flow of ideas stemming from the ques-tion. Thus, clarity is more important that grammatical correctness. Thisallows the interviewer to pause at the right time and place during thequestioning. Similarly, words that need to be emphasized during theinterview must be properly identified in the questionnaire and inter-viewers must be trained to recognize the identifiers. Finally, all wordsshould be spelled out (Warwick and Lininger 1975).
Questions should not be formulated in a complex structure. Ques-tions organized in a table format may appear well designed, and theygive the impression of being easy to answer. However, they are ex-tremely difficult to administer in a face-to-face interview and they puta big burden on the respondent’s memory.
Similarly, the longer the list of questions the lower the quality of thedata. “It is possible that respondents and/or interviewers recognize the‘production line’ character of this survey strategy and that this promotescarelessness in the way questions are asked and answered” (Andrews1984, 431).12 Two types of errors can result from this behavior: acqui-escence bias and position bias.
Acquiescence bias is the tendency of respondents to choose a certainresponse category regardless of the item’s content. For example, in ques-tions with “agree-disagree,” “yes-no,” “0–5,” and so on, respondentscontinually check “agree,” “yes,” or “2” even when the content of the
44 The Power of Survey Design
12 Further experimental evidence has shown that these types of questions generate ahigher tendency for the interviewer to misread them (Presser and Zhao 1992).
Acquiescence bias

question is reversed. This is particularly true when a long sequence ofquestions in exactly the same order13 is asked. This approach infringesconventional conversational norms and can easily become boring and ir-ritating, pushing the respondent to answer mechanically without think-ing carefully about the individual alternatives (Plateck, Pierre-Pierre, andStevens 1985). When repetitive questions need to be asked, data accu-racy can be improved by using show cards. Figure 3.6 illustrates how theadoption of show cards reduces the probability of obtaining the sameanswer (answering mechanically) among consecutive questions. Whenshow cards are not used, evidence shows that consecutive questions areanswered more mechanically (the probability of obtaining the same an-swer is higher). This effect appears to pick up when the list contains
How Easy It Is to Ask the Wrong Question 45
Figure 3.6.
Response Rate Effect of Long Repetitive Lists
0.2
0.3
0.4
0.5
0.6
0.7
1–2 2–3 3–4 4–5 5–6 6–7 7–8 8–9 9–10
10–11
11–12
12–13
13–14
14–15
15–16
Probability of identical answer among consecutive questions
Position in the listSource: World Bank Investment Climate Surveys 2003 (author’s calculations).
Without show card
With show card
13 For example, questions like (1) How big of a problem is Telecommunication? (2) Howbig of a problem is Electricity? (3) How big of a problem is Transportation?

more than four repetitive questions. Using show cards instead helpseliminate this “contagion” effect, although only up to a point: when thelist reaches 10 items the same “mechanical” effect reappears.14
One proposed solution to this bias is to give specific content to eachresponse option. So instead of asking, “Do you agree or disagree thatyour current company is efficient in delivering packages?” you mightwant to ask, “Do you think that your current company is efficient orinefficient in delivering packages?” (Moser and Kalton 1971; Warwickand Lininger 1975). Yet a different possible strategy is to have twoforms of the questionnaire in which the order of the alternatives is re-versed or to have as many forms as the possible combinations of alter-natives (Warwick and Lininger 1975).15
In other cases, when the respondent is asked to select from a list ofalternative answers, their choice may be affected by the order in whichthe alternatives are presented rather than true relevance to the respon-dent. When a set of alternatives is ordered, such as a set of numericalvariables, respondents may consistently lean toward the middle, right,or left irrespective of the meaning of the order. Experiments haveshown that the alternatives presented at the beginning or at the end arefavored (Moser and Kalton 1971; see also figure 3.3). This phenome-non is more likely to occur when the list of alternatives is long, so thebest solution is to use a short list of alternatives (no more than eight)or to elicit a response from each individual alternative. If it is not pos-sible to reduce the list of alternatives, another useful approach is the filter-unfolding method. With this technique, major categories are firstpresented to the respondent. Then on the basis of his or her choice, aset of more specific alternatives are shown or the interviewer moves onto the next major category (example 3.7). This method optimizes theuse of time by focusing only on the choices perceived by the respondentas most relevant. A less efficient solution is to use separate versions ofthe questionnaire, allowing each alternative to appear in a given posi-tion with equal frequency or use different show cards in which the orderof the alternatives is different to make its position neutral.16
46 The Power of Survey Design
14 This figure is based on question 18 of the Investment Climate Surveys’ core question-naire (see appendix 1 for exact wording of the question). Data refer to pooled answersfrom Bangladesh2002, Brazil2003, Cambodia2003, China2002, Ethiopia2002, Hon-duras2003, India2002, Kenya2003, Nicaragua2003, Nigeria2001, Pakistan2002,Peru2002, Philippines2002, Tanzania2003, and Uganda2003.15 Avoid, however, using different orders within the same form. This could be mislead-ing for the interviewer and the respondent.16 The last two alternatives carry a higher risk of error during data entering and coding.
Position bias

How Easy It Is to Ask the Wrong Question 47
Example 3.7
Filter-Unfolding Method
In this example, instead of asking questions d(1)–d(7), the interviewer first asks question d and only if the
response is a 3 or 4 are options d(1)–(7) asked. Question d works as a filter for the more detailed questions
d(1)–(7). This approach saves time and maintains focus during the interview.
V.2. Please tell us if any of the following issues are a problem for the operation and growth of your business. If an issue
poses a problem, please judge its severity as an obstacle on a four-point scale where:
0 = No obstacle 1 = Minor obstacle 2 = Moderate obstacle 3 = Major obstacle 4 = Very severe obstacle
No Problem Degree of Obstacle
a. Telecommunications 0 1 2 3 4
b. Electricity 0 1 2 3 4
c. Transportation 0 1 2 3 4
d. Access to land for expansion/relocation 0 1 2 3 4
1) Procurement process 0 1 2 3 4
2) Cost of land 0 1 2 3 4
3) Availability of infrastructure 0 1 2 3 4
4) Disputed ownership 0 1 2 3 4
5) Small size of land ownership 0 1 2 3 4
6) Government ownership of land 0 1 2 3 4
7) Others (please specify ______________________) 0 1 2 3 4
e. Tax rates 0 1 2 3 4
f. Tax administration 0 1 2 3 4
g. Customs and trade regulations 0 1 2 3 4
h. Labor regulations 0 1 2 3 4
1) Minimum wages 0 1 2 3 4
2) Mandatory non-salary benefits 0 1 2 3 4
3) Restrictions on employment of local staff 0 1 2 3 4
4) Visa/work permit for foreign staff 0 1 2 3 4
5) Hiring and firing regulations 0 1 2 3 4
6) Labor dispute settlement 0 1 2 3 4
7) Others (please specify ______________________) 0 1 2 3 4
i. Skills and education of available workers 0 1 2 3 4
j. Business licensing and operating permits 0 1 2 3 4
1) Constructing operational facilities 0 1 2 3 4
2) Fire department 0 1 2 3 4
3) Environmental clearance 0 1 2 3 4
4) Intellectual property, trademark registration 0 1 2 3 4
5) Company registration 0 1 2 3 4
6) Others (please specify ______________________) 0 1 2 3 4
�
�
�

Use Relevant Questions
Ask questions applicable to all respondents. Few things are more irritat-ing than to be asked a question that is not applicable like “where did youcomplete your doctorate?” or “how many children do you have?” This iseven more frustrating when elites are interviewed. As a matter of fact,while ordinary respondents are more willing to discuss issues about whichthey have little information, elites are quickly irritated if the topic of thequestions is not of interest to them (Zuckerman 1972). Inapplicable ques-tions are not only irritating but also potentially misleading. The individualwho is not a parent may still give a positive answer to save embarrassmentor simply to oblige the interviewer (known as false positives) (Warwickand Lininger 1975). One solution is to add proper lead-in questions anddevise various skip patterns, filters, or conditional questions.
Hypothetical questions, especially, should be avoided. People cannotreliably forecast their future behavior in a hypothetical scenario. Thus,the questionnaire designer should make careful use of this style of ques-tioning. First, it is advisable to ask a question related to a hypotheticalsituation only of those who have already experienced the phenomenon inthe past. For example, ask “Would you like to live in an apartment or ina house?” only of those who have lived in both. Otherwise you run therisk of picking up the answers of those who would like to try new things.Second, the designer should be wary of asking hypothetical questions inwhich the answer is obvious, such as “Would you like a reduction ofmetro fares?” In this case, answers are biased because the respondent isasked to get something for nothing (Moser and Kalton 1971).17
48 The Power of Survey Design
Example 3.7 (continued)
k. Access to financing (e.g., collateral) 0 1 2 3 4
l. Cost of financing (e.g., interest rates) 0 1 2 3 4
m. Economic policy uncertainty 0 1 2 3 4
n. Macroeconomic instability (inflation, exchange rate) 0 1 2 3 4
o. Corruption 0 1 2 3 4
p. Crime, theft and disorder 0 1 2 3 4
q. Anticompetitive practices 0 1 2 3 4
Source: Author’s creation.
17 Or, put differently, the question is not objective.
Hypothetical questions

Use Painless Questions
Finally, the question asked should require the least possible effort to beanswered. As the level of cognitive complexity of the question increases,the respondent is more likely to reply “I don’t know” or, worse, in-accurately. If the researcher suspects that the respondent might not becandid in his or her answer, the researcher should not ask the questionin the traditional way but rather adopt alternative strategies to elicit atruthful answer (Peterson 2000).
Question Type
Avoid Sensitive Questions
A sensitive question refers to a behavior that, when answered truthfully,is judged by society as undesirable or illegal, or when the question itselfis perceived by the respondent as an invasion of privacy. Sensitive ques-tions should be avoided. Two types of respondent’s behavior canthreaten the accuracy of answers to sensitive questions: nonresponseand response error. Respondents might refuse to answer sensitive ques-tions, thus biasing the results because “the very persons with the mostsensitive information to report may be the least likely to report it”(Tourangeau and Smith 1996, 276). Likewise, research on responseaccuracy has shown that respondents are prone to distort answers inways that will make them look better (known as social desirabilitybias). Responses on illegal or immoral behavior, such as corruption, areconsistently underreported not because respondents have forgottenthem but rather because the behavior does not conform to social norms(Fowler 1995).
When compared internationally, sensitive questions are subject to an-other often overlooked source of potential measurement error associatedwith the type of survey firm conducting the interviews. The survey liter-ature clearly identifies the interviewer’s sponsoring agency as a potentialsource of measurement bias. Moreover, research has demonstrated thatsensitive questions are answered more or less candidly depending on theperson conducting the interviews. Evidence from the Investment ClimateSurveys not only confirms this, but also it allows the estimation of suchbias. The type of agency conducting the fieldwork—government agency,a private local survey company, or a private international survey firm—has a different effect on data accuracy depending on the sensitivity ofquestion asked. Sensitive questions on corruption and taxation show a
How Easy It Is to Ask the Wrong Question 49
Survey firm bias

different pattern than questions on red tape. Not surprisingly, when theinterviewer is a government employee, sensitive questions on bribesand sales are consistently underreported.18 Although the magnitude ofthe bias varies depending on the specific question, the impact of un-derreporting appears to be up to 60 percent of one standard deviation(table 3.2). This phenomenon is present also with questions on the per-ception of corruption.19 Hence, respondents interviewed by a govern-ment employee are 13 percent less likely to rate corruption as a majorconcern (figure 3.7). On the contrary, when the same objective sensitivequestions are asked by an international survey firm, no underreportingeffect appears in the data. Again only the perception question on cor-ruption shows the same magnitude of underreporting (11%).
When questions on red tape are asked, however, whether the surveyfirm is a government agency or an international company, a similar pat-tern of under- or overreporting appears in the answers. Such a biasseems even higher for the latter than for the former (table 3.2).
When designing and analyzing survey data, it is important to keep inmind that people may vary in what they consider sensitive. Questionson apparently nonsensitive issues, such as questions on infrastructure,are subject to the same measurement bias discussed above. When theinterview is conducted by a government employee, respondents tend tounderreport such constraints, although the impact is most of the timerelatively small (table 3.2).
When sensitive questions are asked, two major forces operate to pro-duce a distortion in the reported answer: the desire to avoid responsesthat could pose a threat and the tendency of respondents not too lookbad (Fowler 1995). A number of different steps can be taken to mini-mize these forces. First, the level of detail of the question can be tailoredto address sensitivity concerns. It might be easier for respondents toprovide answers in categories or percentages rather than in absolutevalues. When following this approach, however, the questionnaire de-signer should be aware of the fact that changing the format of the ques-tion has an impact not only on response rate but also on responseaccuracy. Peterson and Kerin (1980) have shown that while the refusalrate for an open-ended question on income was higher (8%) than that
50 The Power of Survey Design
18 Compared with a private local survey company.19 See appendix 2 for exact wording of objective questions and appendix 3 presents theparametric results. Appendix 1 reports the perception questions. All questions are fromthe “core” questionnaire of the World Bank Investment Climate Surveys.
Strategies to minimize bias

Table 3.2
Interviews Conducted by Government Agencies and International Private Firms Affect Survey Responses
Government Agency International Private Firm
Effect on Effect onStandard Standard
Coefficient Deviation Coefficient Deviation
CORRUPTION
Unofficial payments to get things done (% sales) −1.854** −0.33 ns
Gifts expected as % value government contracts −1.974** −0.41 ns
Estimated % of total sales declared for tax purposes −17.854** −0.60 ns
RED TAPE
% of management’s time dealing with gov’t officials −0.709* −0.05 −6.256** −0.43
Total days spent with officials from tax inspectorate 2.307** 0.13 4.803** 0.26
Days on average to claim imports from customs ns −4.150** −0.34
Days on average to clear customs for exports 1.815** 0.22 ns
Optimal level of employment (% of current level) 2.769** 0.06 30.147** 0.64
INFRASTRUCTURE
Days of power outages from public grid −31.998** −0.49 −16.366** −0.25
Days of insufficient water supply −2.673** −0.05 ns
Days of unavailable mainline telephone service −3.69** −0.12 ns
% of sales lost because of power outages −0.229* −0.03 ns
% of sales lost because of insufficient water supply 0.653** 0.08 ns
% of sales lost because of unavailable telephone service −0.844** −0.15 ns
% of average cargo value lost in transit −0.176* −0.04 −1.629** −0.33
Source: World Bank Investment Climate Surveys 2003. (Author’s calculations.)Note: See appendix 2 and 3 for description of questions and a compete set of regression results. Results are in comparison with private localsurvey company.ns = Not significant.* Significant at 5%.
** Significant at 1%.

52 The Power of Survey Design
Figure 3.7.
Interviews Conducted by Government Agencies Decrease Reports of Corruption
Private local firm Government agency
48%
35%
Corruption as asevere constraint
Corruption as asevere constraint
Source: Author’s calculations.
Table 3.3
Accuracy is Higher for Open-Ended Questions
Percent of Respondents
Open-Ended Closed-Ended Question Question
Overreported 26.7 29.7
Accurate 47.4 43.8
Underreported 25.9 26.5
Actual-reported 0.93 0.70
correlation coefficienta
Source: Peterson and Kerin 1980.a. Using midpoint of range category.
on a closed-ended question (2%) the quality of the answers to narra-tive questions was higher (table 3.3).
Second, as mentioned earlier, the length of the question itself can alsomitigate the threatening nature of the topic. Longer questions seem tohave a positive impact on the accuracy of sensitive questions on behav-ior, while the opposite appears true for attitudinal questions (Sudnam

and Bradburn 1974). A similar approach is to moderate the extent towhich respondents feel that their answers will be used to put them in anegative light. With this strategy, the question is asked in a way to ex-plain to the respondent that there are various reasons why people be-have in one way or the other so that he or she feels more relaxed inproviding an unbiased answer to the sensitive topic. In other cases, itmight be appropriate to ensure the confidentiality of responses and com-municate effectively that protection measures are in place. This impliesthat no association between respondents and answers should be apparentduring the interview, that sensitive questions should be asked only whenthe respondent is alone with the interviewer, and that, if they exist, spe-cific laws protecting the confidentiality of answers should be mentionedand clearly stated in the questionnaire. Explaining the appropriateness ofthe question to the research objectives of the survey is yet another way toreduce resistance in respondents (Fowler 1995). Sometime respondentsconsider a question sensitive because they don’t see the link between thegoal of the survey and the question itself, or they don’t see the usefulnessof their answer. Likewise there are instances in which it is advisable to usewords that imply the same sensitive behavior by others. Finally, anotherpossible way of dealing with sensitive questions is to put the threateningtopic in a list of less threatening topics or to use a randomized responsetechnique (Plateck, Pierre-Pierre, and Stevens 1985).20
In business surveys, the inclination not to disclose information con-sidered critical to the business activity should be taken into account whendeveloping a survey instrument. Questions on taxes, profits, and namesof suppliers or clients could be the subject of distorted answers or out-right refusal. Conversely, questions on bribes are generally answered, un-less the admission of this behavior is in itself condition for criminalprosecution. This was the case in Ethiopia where, although it was notpossible to ask the amount of bribes paid by entrepreneurs, because thiswould have guaranteed jail time, 60 percent of the respondents were stillwilling to discuss how big of a problem corruption was. The pre-test iscritical in detecting the respondent’s reaction to a delicate question.
How Easy It Is to Ask the Wrong Question 53
20 With this technique, the respondent chooses to answer either the sensitive question ora nonsensitive question. The process of choosing uses a random mechanism. The inter-viewer is not aware whether the respondent is answering the sensitive question or thenonsensitive statement. In this way, we expect the respondent to be more truthful. At thesame time, the probability of selection of each statement must be known so that it is pos-sible to calculate the aggregate value of the sensitive question as a weighted average ofthe probability of selection of each statement (See Moser and Kalton 1971, 328).

Memory Questions
Retrospective questions are those questions drawing on long-term mem-ory. Although past events are not really forgotten, their recall might bevery memory intensive and therefore incorrectly reported. How manyof us can remember the exact number of days we were sick two yearsago? Or how many classmates we had the first year of high school? Re-call questions should hence be avoided.
Because “little is known about how time-related information is men-tally encoded, stored, and retrieved [and] the effect of mood or motiveson memory” (Peterson 2000, 93) retrospective questions are subject to“recall bias.” Survey research has identified three types of memoryerrors: respondents might forget the recalled events (omission), mightrecall events that did not occur (commission), or might correctly reportevents but place them at the wrong time (telescoping) (Gaskell, Wright,and O’Muircheartaigh 2000).21
Behavioral frequency questions such as “How many times last year didyou visit a doctor?” are a common occurrence in many surveys. Becausefrequency questions rely heavily on the respondent’s mnemonic ability,they require a deep understanding of the cognitive process behind it.Questions that ask respondents to recall events in the past are an in-creasing source of error the farther back in time the event is locatedand the less important the event was in the respondent’s life. Researchshows that recall errors are associated with the interview mode andthat there is always a trade-off between the accuracy of the event re-ported and the length of time of the event recalled (Fowler 1995). Asone would expect, self-administered questionnaires appear more vulner-able to these errors than face-to-face interviews (figure 3.8) (Sudnam andBradburn 1974).
How far back in time can a question go without seriously compro-mising the accuracy of the data collected? This depends on three fac-tors: the saliency of the event, its frequency, and how the question isdesigned. More relevant events will be recalled more accurately. Un-fortunately, the reality is that “contrary to what many researchers [. . .]might think (or desire!) much of what is investigated is not significantto study participants. Thus, the container size of toothpaste used in
54 The Power of Survey Design
21 Telescoping can be “backward” if the event is reported to happen before it actuallydid, or “forward” if the event is reported to happen after it actually did. Telescoping oc-curs when the memory of the past event is so detailed that the respondent mistakenlyblends recency with clarity (Bradburn, Rips, and Shevell 1987).
Recurring event

1991 is probably long forgotten” (Peterson 2000, 20). Three factors in-fluence the saliency of the event: the emotion generated by the event,the marking of a turning point, and its financial impact on the respon-dent’s life (Auriat 1993).
In addition to saliency, another factor influencing the cognitive abili-ties of the respondent is the frequency of the event to be recalled. Re-spondents use different protocols to answer frequency questions: episodeenumeration, rule-based estimation, availability estimation, automaticestimation, and various combinations of these protocols.22 In decidingwhich protocol to use, respondents balance the level of accuracy theyfeel must be achieved with the level of effort required by the cognitiveprocess itself. Empirical evidence shows that the accuracy of recall canbe improved if episode enumeration is adopted. However, respondentswill use episode enumeration only if there are not too many events torecall (Burton and Blair 1991). Because more distant events are harder
How Easy It Is to Ask the Wrong Question 55
Figure 3.8.
Index of Memory Error by Mode of Interview
Old Events (14+ weeks old)
Recent Events (0–2 weeks old)
Events aretelescoped
Events areomitted
Self-administered
interview
Face-to-faceinterviews
Source: Sudnam and Bradburn 1974.
0
22 Episode enumeration implies recalling and counting the occurrences of the event; rule-based estimation involves the use of some sort of rule, such as decomposing the time pe-riod in shorter time periods or in subdomains; availability estimation involves estimationon the basis of the ease of recalling; and automatic estimation involves resorting to somesort of innate or normative sense of frequency (for example, once a week).

to locate and to retrieve, the longer the time frame, the fewer respondentswill adopt episode enumeration (Blair and Burton 1987).
While the questionnaire designer cannot change the frequency ofthe event, he or she can adjust the wording of the question to facilitatethe use of episode enumeration. The National Crime Survey and theNational Health Survey improved the accuracy of data by askingabout six-month reporting instead of one year (Fowler 1995). Butwhat time period would most likely promote the adoption of episodeenumeration? Blair and Burton (1987) show that respondents are lessinclined to use episode enumeration if the event happens more than10 times during the reference period (table 3.4). Consistent with thisresult, Burton and Blair (1991) show that when holding the time ref-erence constant an increase in the number of events within that pe-riod appears to be associated with a decrease in the accuracy ofresponses (table 3.5). This demonstrates that it is not time reference
56 The Power of Survey Design
Table 3.4
As Frequency of Event Decreases, Use of Episode Enumeration Increases
Percentage of Respondents Using
Episode OtherEnumeration Enumeration
Frequency of event1 100 02 68 323 93 74–5 63 376–10 15 8511–25 0 10026–100 0 100100+ 0 100
Time frame2 weeks 56 442 months 25 756 months 4 96
Source: Blair and Burton 1991.

that increases accuracy but rather the number of events to be recalled.Thus, the time referenced in the question should cover approximately10 episodes of the event to be recalled. For example, if there are fivepower outages every week, the question should ask how many poweroutages have there been in two weeks.
The wording of the question has also an impact on the ease of recall.One way to stimulate recall is to ask a long, rather than short question.This means adding an introduction that helps the respondent to put hisor her state of mind in the time period of the event recalled. A secondapproach is to ask multiple questions or to ask questions that trigger as-sociations with the event recalled (called a landmark). These method-ologies have been proven to facilitate recall because the respondent isasked to dig into his or her memory (Fowler 1995). Furthermore, it hasbeen shown that communicating to respondents the importance of theaccuracy of their answer has a positive effect. Thus, using specificphrases like “please take your time to answer this question,” or “theaccuracy of this question is particularly important,” or “please takeat least 30 seconds to think about this question before answering” hasa positive impact on the accuracy of responses (table 3.6) (Burton andBlair 1991). Similarly, asking “how often” as opposed to “how manytimes” might discourage episode enumeration in favor of rule-basedestimation (Blair and Burton 1987). Finally, if the recall question asksthe respondent to provide a list, it is desirable to provide him or herwith a comprehensive and mutually exclusive list of events (Moserand Kalton 1971).
How Easy It Is to Ask the Wrong Question 57
Table 3.5
Higher Event Frequency Has a Negative Effect on Accuracy
Correlation BetweenNumber of Events Reported and
Reportedc Recorded Data
Checksa 16.3 34%
ATMb 4.2 67%
Source: Burton and Blair 1991.a. Number of checks written.b. Number of ATM withdrawals.c. Average value over a 3-week period.

While the questionnaire designer can, to some extent, improve the ac-curacy of the recall through a careful question design, there are cases inwhich his or her ability is severely limited. This happens when the pastevent to be recalled is unique, such as “How many employees did youhave when you started your business?” In this case, the questionnairedesigner cannot adjust the time reference of the question to facilitate re-call nor can episode enumeration be encouraged. In this case, accuracyrests solely on the recall ability of the respondent. Saliency remains theonly critical factor to which the designer must appeal. A number of ex-periments have attempted to determine the accuracy of such a recall. Afirst experiment shows that between 10 and 20 percent of details are ir-retrievable after only one year, and as much as 60 percent can be lostafter four years. In any case, even salient events are very hard to accessand retrieve after 10 years (figure 3.9) (Sudnam, Bradburn, and Schwarz1996). Even higher nonresponse rates were reported in a study carriedout by the U.S. National Center for Health Statistics. That study showsthe percentage of underreporting errors is more than 40 percent afterjust one year (figure 3.10)
Subjective (or Objective) Questions
“Subjective phenomena are those that, in principle, can be directlyknown, if at all, only by the persons themselves. [. . .] Objective phe-nomena are those that can be known by evidence that is, in principle,directly accessible to an external observer” (Duncan, Fishhoff, and
58 The Power of Survey Design
Table 3.6
Response Time and Episode Enumeration Have a Positive Effect on Accuracy
Correlation No. of RespondentsBetween Reported Using Episode
Time Given and Recorded Data Enumeration
10–20 seconds 0.58 60%
35–50 seconds 0.81 80%
70 seconds 0.86 84%
unspecified 0.46
Source: Burton and Blair 1991.
Unique event

Turner 1984, vol. 1, 8). Subjective questions are questions tailored tomeasure people’s subjective states (that is, their opinions, knowledge,feelings, and perceptions).23
One of the most popular ways of asking a subjective question is touse rating scales, that is, a single, well-defined continuum in which theanswer is expected to be placed (see example 3.8) When employingthis type of questions two issues must be addressed: how many scale
How Easy It Is to Ask the Wrong Question 59
Figure 3.9.
Accuracy of Recall Decreases Over Time
0
20
40
60
80
100
1 2 3 4 5 6 7 8 9 10 11 12 13
Retention period (years)
Correct recall (percent)
Source: Sudnam, Bradburn, and Schwarz 1996.
Teachers’ names
Classmates’ names
Street names
Events’ critical details
23 That is why they are often referred to as perception or opinion questions.
Rating scales

60 The Power of Survey Design
Figure 3.10.
Effect of Time on Underreporting Hospitalization
Source: Foddy 1993.
Percentage underreported hospitalization
40
30
20
10
00–2.5 2.5–4.5 4.5–7 7–9 9–11.5 11.5–13
Time elapsed since hospitalization (months)
Example 3.8
Rating Scales in Subjective (or Perception) Questions
Q.42 To what extent do you agree with this statement? “I am confident that the legal system will uphold
my contract and property rights in business disputes.”
Strongly Disagree in Tend to Tend to Agree in StronglyDisagree Most Cases Disagree Agree Most Cases Agree
1 2 3 4 5 6
categories should be used, and what words or numbers should be asso-ciated with each scale category.
There is no consensus in the literature on the optimal number of cat-egories to use. Using too few categories gives less-refined informationwhile using too many categories makes the question very hard to ad-minister (Fowler 1995). The choice of scale frequency must be guided

by the mode of the interview, the respondent’s ability to interpret thecategories, and the research goal.24 Although some scales adopt up to12 categories, experiments show that it is preferable to use between5 and 9 categories (Cox 1980; Finn 1972; Leigh and Martin 1987;Miller 1956). Related to this is the decision whether to adopt a middlecategory. Here again no one choice fits all. It is not clear whether the pres-ence or exclusion of a midpoint improves data quality (Andrews 1984).The content and the analytical purpose of the question will determinethe optimal choice. If a neutral answer is a possibility, a midpoint shouldbe included. If the researcher wants the respondent to take one side orthe other, an even number of categories can force the respondent awayfrom the middle alternative (Peterson 2000). The researcher, however,should be extremely careful in the latter case. Forcing respondents tochoose an alternative with which they are not familiar has little ana-lytical value and introduces bias into the data.
More important, the questionnaire designer must ensure that the scalecategories are sufficient to discriminate between and “indifferent” re-sponse and “no opinion” answers. As example 3.9 shows, allowing re-spondents to “opt out” if they lack the required information (option B)improves the quality of the data because it avoids the risk that respon-dents with no opinion on the subject might otherwise select the middlealternative.
How Easy It Is to Ask the Wrong Question 61
Example 3.9
Do You Agree or Disagree with “The Government is Providing Good Services”?
A. _________ _________ _________ _________ _________
Strongly Neither Agree Strongly
Agree Nor Disagree Disagree
B. _________ _________ _________ _________ _________ _________
Strongly Neither Agree Strongly No Knowledge
Agree Nor Disagree Disagree or No opinion
24 In telephone interviews and in self-administered surveys, it is advisable to adopt alower number of categories. The same is true if we interview a child rather than an adult.If, on the other hand, there is reason to believe that respondents are homogeneous, ahigher frequency of categories should be adopted (Peterson 2000).

Figure 3.11.
Respondents Answering “Don’t Know” Increases withOption to Opt Out
0
20
40Percent
Filtered formStandard formSource: Peterson 2000.
An experiment conducted by Peterson (2000) demonstrated thatmore than 20 percent of respondents venture an answer although theywould have chosen “don’t know” if given the option (figure 3.11).
Once the optimal number of categories has been determined, thereare numerous ways respondents can be asked to assign answers to a po-sition on a continuum. Generally adjectives (that is, good, fair, poor)or numbers25 (that is, 1, 2, 3) are used. The ongoing debate is whetherto use one approach or the other, and whether to label all categories inthe continuum or only some of them. What seems an apparently triv-ial task can have a substantial effect on the data collected. As a matterof fact, far from being “neutral measurement devices,” the responsecategories offered are used by respondents to interpret the question andtherefore can influence the answers. Thus, asking the same question butusing an 11-point rating scale from 0 to 10 or from −5 to +5 can gen-erate different results (figure 3.12).
62 The Power of Survey Design
25 Peterson (2000) reports a number of different verbal stimuli most commonly used:comparison stimuli (much more . . . much less), endorsement stimuli (definitely true . . .definitely not true), frequency stimuli (always . . . never), influence stimuli (major prob-lems . . . minor problems), and intensity stimuli (strongly agree . . . strongly disagree).

Accordingly, Schwarz and others (1991) conclude that scales intendedto measure bipolar concepts should use negative to positive values,while scales intended to measure the intensity (or absence of intensity)of a single attribute should use zero to positive values. In general, evi-dence shows that adjectives are better because they improve consis-tency of interpretation (Wildt and Mazis 1978), and because it mightgenerate cognitive complexity in the respondent, it is not preferable tolabel all categories. It is preferable to label only the extreme values andthe middle point (Andrews 1984).
A second approach used by researchers in designing qualitative ques-tions is the use of rank ordering. Respondents are asked to compare ob-jects on some dimension. They are provided with a list of items andasked (1) to rank all of them from most to least important; (2) to iden-tify the most (second, third) important; or (3) to rate each of the itemsusing some scale. The first task is the easiest only if the list is short (fourto five items). The second one is preferable if the list is long, but it
How Easy It Is to Ask the Wrong Question 63
Figure 3.12.
Impact of Numeric Scales on Response Patterns
0
5
15
25
35
Percentage of respondents
Source: Schwarz and others 1991.
–5 to +5 scale0 to 10 scale
–5 –4 –3 –2 –1 0 +1 +2 +3 +4 +50 21 3 4 5 6 7 8 9 10
Rank ordering

becomes difficult if the list grows too long (more than 10 items). Thethird alternative is the easiest to perform and provides more informa-tion, but it is the most time-consuming (Fowler 1995).
If the goal of a question is to measure respondents’ feelings aboutpolicies or ideas, then the agree-disagree format is probably the best op-tion. Respondents will agree or disagree if their opinion falls within areasonable distance from the point where they see the statement’s opin-ion is located. Sometimes this type of question is employed to spreadthe responses along a continuum, differing from the previous categoryin that the continuum is simply bipolar (Fowler 1995).26 Attentionshould nonetheless be paid when developing this type of question. First,the designer must ensure that the contextual environment is appropri-ate for this format. Cognitive complexity is increased when we asksomeone whether they agree or disagree with the statement “My healthis good” instead of asking directly “How do you rate your health?Good, Fair, or Poor.” Second, the designer must ensure that the word-ing of the question is unequivocal so that disagreeing can be interpretedunambiguously. If a person disagrees with “I am sometimes depressed,”we don’t know whether he or she is never depressed or always de-pressed. Finally, the designer must not overlook the tendency amongless-educated respondents toward acquiescence, that is, to consistentlyanswer “agree” even when they don’t know whether they do or don’t(Fowler 1995).
The questionnaire designer should pay particular attention to thistype of question because it is very easy to be misled by its apparent sim-plicity. Suppose we ask a respondent whether he or she agrees with anincrease in taxes to improve parks. The respondent’s role, implied bythis type of question, is to figure out whether the policy alternative isclose enough to his or her views to “agree” with the statement. This,however, is based on a subtle but critical assumption: that the respon-dent has some general opinion about this specific issue. The risk of thisquestion is that if the respondent has no opinion about this issue, buthe or she is generally opposed to raising taxes for any reason, then heor she will “disagree,” in effect answering a different question (Fowler
64 The Power of Survey Design
26 Sometime four categories are used, such as strongly agree, agree, disagree, strongly dis-agree. In many cases, however, the answers are usually analyzed in two response cate-gories, so such questions do not yield much more information. Some researchers alsoconsider a question so worded as emotionally charged, violating the objectivity rule ofgood question design (Fowler 1995).
Agree-disagree format

1995). This violates the fourth criteria of good question design, speci-ficity: respondents should all answer the same question. Put differently,
Respondents read meaning into the question and answer in termsof some general predisposition toward the [issue. . . .] Whenpeople rely on such a predisposition they are showing ideologicalor constrained attitudes, since they are using general attitudes tosupply responses to specific questions. (Smith 1984, 223)
Consequently extraordinary care must be taken when designing andinterpreting subjective questions. There is no doubt that questions ofthis type are easy to administer and easy to answer. Their response ratein Investment Climate Surveys tops 99 percent. However, what is easyto get is not necessarily easy to use. Researchers should be wary thatsubjective questions have the following three analytical limitations:
Plausibility of the answers. A key feature of these questions is thatthere are no right or wrong answers independent of what respondentstell. While we can, to some extent, measure errors in reporting the per-centages of sales that went to bribes, there is no way to assess theaccuracy of answers on a six-point scale on the severity of corruption.There is, in fact, no objective standard against which to measure therightness of that answer (Fowler 1995).
Comparability of the responses. No matter whether we use adjectivesor numbers to define the continuum, different respondents may inter-pret the same categories differently. Hence, when Scipione (1995) con-ducted an experiment in which a group of respondents were asked whatvalue each associated to “majority,” the answers ranged from 38 per-cent to 76 percent with a mean value of 57 percent (table 3.7).
Furthermore, the researcher cannot be sure that the same answerfrom different respondents has the same weight, or that the same replyto different questions by the same respondent has the same meaning.In other words, there is no guarantee that “agree” from one respondentis different from “strongly agree” from another respondent. If we askrespondents to rate their social standing on a 1 to 10 scale, we cannotconcluded that those rated 9 are three times as high as those rated 3(Fowler 1995). Finally, the analyst should not “confuse the ‘extremity’of judgments with the ‘importance’ of topics for respondents and withthe ‘certainty’ or ‘sureness’ of their responses” (Foddy 1993, 160). Inanswering these types of questions, people put their perceptions up
How Easy It Is to Ask the Wrong Question 65
Limitations of subjective questions

against a self-imposed standard unknown to the analyst rather than anobjective standard. What one respondent perceives as “good” may beconsidered only “fair” or even “poor” by another (Fowler 1995). Thisis because opinions on virtually any issue are often many sided, withcultural, moral, religious, legal, medical, professional, or even geogra-phic dimensions. So an inhabitant of Canada will have different percep-tions on what constitutes a cold winter from an inhabitant of Indonesia.During a pilot test in Ethiopia in December 2001, I interviewed themanager of the St. George’s Beer factory. He was extremely interestedin our project and he answered many questions, often looking at hislaptop to provide the most accurate information. When I asked himabout the severity of corruption in Ethiopia, he told me that corruptionwas a minor problem. Given the previous discussions I had had withother managers and experts in that country, his answer surprised me.Later on during the interview I found out why he rated corruption as
66 The Power of Survey Design
Table 3.7
Perceived Percentage Values Associated with Descriptive Words
StandardExpression % Value Deviation
An overwhelming majority 74 19
A substantial majority 67 20
A large majority 62 21
A majority 57 19
A large minority 41 21
A substantial minority 32 16
A minority 24 21
Most 69 21
Hardly anyone 12 20
Much more than 33 22
Somewhat more than 31 25
Somewhat less than 30 25
Much less than 26 13
A slight change 20 28
Source: Scipione 1995.

minor. He had just moved from Nigeria where corruption was ram-pant. To him the level of corruption in Ethiopia was low because heused a different standard of reference: Nigeria’s corruption level. Thispractically meant that in his mind the question I asked him was “Howdo you rate corruption in Ethiopia compared to Nigeria?”27 “If re-spondents adopt different perspectives when answering a question, itcan be argued that they are not answering the same question. If thishappens, the answers that they give cannot be meaningfully compared”(Foddy 1993, 79). All this implies that,
answers to questions about subjective states are always relative[and] never absolute. The kinds of statements that are justified,based on answers to these kinds of questions, are comparative. It isappropriate to say that Group A reports more positive feelings thanGroup B. It is appropriate to say that the population reports morepositive feelings today than it did a year ago. It is not appropriate[. . .] to say that people gave the president a positive rating [or] thatthey are satisfied with their schools. (Fowler 1995, 72–73)
Reliability of the respondent. Questions based on the subjective as-sessment of the event are subject to idiosyncratic factors, such as the re-spondent’s mood at the time of the interview, the wording of thequestion, or even external events that might cause the respondent topresent only one aspect of his or her reaction to the object of the ques-tion (Dexter 1970; Narayan and Krosnick 1996). Words that appearto be the same to researchers often are not so from the point of viewof the respondent. When respondents were asked, “Do you think thatone should generally forbid the use of salt?” or “Do you think thatone should generally allow the use of salt?” 62 percent of respondentssided in favor of forbidding it and 79 percent in favor of not allow-ing it (Hippler and Schwarz 1986). See figure 3.13 for an analogousexample.
Similarly, using words like “dealing with drug addiction” rather than“drug rehabilitation” elicits a more active stance on the issue (Rasinski1989).28 Different words might stimulate different feelings and generatedifferent reactions. In 1940 Cantril and Wilks showed that the percent-
How Easy It Is to Ask the Wrong Question 67
27 This example is additional proof that using the same rating scale to compare answersacross countries creates serious methodological problems.28 This is one of the reasons why enumerators should read the question exactly as it isstated in the questionnaire.

age of people supporting U.S. involvement in World War II almost dou-bled if the word “Hitler” appeared in the question.29 Half a century later,following a controversial opinion poll commissioned by the EuropeanUnion, the European Commission stated that “it would change this un-fortunate perception by asking the question differently in future”30 (TheEconomist 2003, 8).
An external factor that can “influence” answers to subjective questionsis, once again, the affiliation of the interviewer. Perception questions ap-pear to be more subject to this bias than objective questions. Further-more and contrary to what happens with objective questions, thismeasurement error is more evident if the interview is conducted by aninternational survey firm than by a government agency. Evidence fromthe Investment Climate Surveys shows that, on average, compared to aprivate local survey agency respondents interviewed by an international
68 The Power of Survey Design
Figure 3.13.
Negative or Positive Words Influence Respondents Differently
0
20
40
60
Restrictive response Permissive response
Source: Schuman and Presser 1981.
Percent of responses
NO toallowing
YES toforbidding
YES toallowing
NO toforbidding
29 Thirteen percent in favor without “Hitler” and 22 percent in favor with the word“Hitler.”30 Italics added by the author.

survey firm are 10 percent less likely to rate any bottlenecks as a majorconstraint. A similar bias, although lower in magnitude (4%), is pres-ent when a government agency is conducting the interviews (table 3.8).The presence of this different fixed effect makes the international com-parison of perception questions much harder.
How Easy It Is to Ask the Wrong Question 69
Table 3.8
Interviews Conducted by Government Agencies and International Private Firms ReduceProbability of Rating Major Constraints
Government InternationalAgency Private Firm
A. Telecommunications 2% −5%
B. Electricity 0% −14%
C. Transportation 0% −12%
D. Access to Land 6% −3%
E. Tax Rates 1% −9%
F. Tax Administration 3% 0%
G. Customs and Trade Regulations −4% −8%
H. Labor Regulations 0% −10%
I. Skills and Education of Available Workers 2% −8%
J. Business Licensing and Operating Permits 3% −3%
K. Access to Financing (e.g., collateral) −9% −13%
L. Cost of Financing (e.g., interest rates) −16% −18%
M. Economic and Regulatory Policy Uncertainty −12% −12%
N. Macroeconomic Instability (inflation, exchange rate) −1% 0%
O. Corruption −13% −11%
P. Crime, theft, and disorder −18% −17%
Q. Anticompetitive or informal practices −12% −27%
R. Legal system/conflict resolution −2% −17%
Average effect −4% −10%
Source: Calculations based on World Bank Investment Climate Surveys 2003.Note: 0% change means no significant difference; negative sign means less likely; positive sign means more likely.All results presented are significant at 1% or 5%.Results are in comparison with the results of the interview being conducted by a private local survey agency.Results for international private firms refer only to East Europe and Central Asian countries.The exact wording of the questions is presented in appendix 1.

One approach researchers have come up with to address the funda-mental problem of subjective questions, and their inability to providequantitative measures that can be compared across individuals, is to usemagnitude estimation. With this technique, the respondent is asked torate a phenomenon by comparing it with another phenomenon forwhich a rating has already been assigned. For example, one such ques-tion for a physician would be as follows:
Suppose we want to compare the amount of work involved in asplenectomy with the amount of work involved in a tonsillectomy.If we assume that the amount of work involved in a splenectomy is 10, what number would you assign to the work involved in atonsillectomy?
This approach produces more reliable responses because it introducesan objective point of reference for respondents to rate the phenomenon.However, this technique has its limitations. First, it cannot be used formany of the subjective states that researchers want to measure. Second,the respondents must be able to understand the technique itself, a taskthat requires a certain level of cognitive ability. And, finally, it takes a fairamount of training by respondents, which is time-consuming. As a re-sult, this approach is not commonly used in surveys (Fowler 1995).
The best solution is to move away from subjective questions. In somecases, this is easier than it may seem. Consider, for example, the sub-jective question in example 3.10.
The question is better addressed by the corresponding objectivequestion in example 3.11.
70 The Power of Survey Design
Example 3.10
Subjective Question
Business-Government Relations
34. How would you generally rate the efficiency of government in delivering services (e.g., public utilities,
public transportation, security, education, and health). Would you rate it as (read 1–6)?
1. Very inefficient 4. Somewhat efficient
2. Inefficient 5. Efficient
3. Somewhat inefficient 6. Very efficient
Source: Investment Climate Surveys.

When a subjective question is the only way to ask a question, the re-searcher should refrain from rushing into the analysis without first look-ing at the possible factors that might influence the respondent. Thus, itis important for the same subjective issue to be addressed from differentangles. The presence of inconsistencies among answers to subjectivequestions by the same respondent remains the only critical source ofinformation on their “quality.”
Narrative Questions
What characterizes a narrative or open-ended question is the freedomenjoyed by respondents to answer with their own words. Because open-ended questions do not force respondents into a set of predeterminedanswers, this is the only type of inquiry that allows them maximumspontaneity of expression. Furthermore, not being influenced by pre-determined alternatives allows the researcher to identify the respon-dent’s level of knowledge and information, the salience of the event, thestrength of his or her feelings, and his or her motivational influenceswhile avoiding format effects (Foddy 1993).
Open-ended questions have their own set of drawbacks. They takemore time and effort than closed questions. As a consequence, they havea higher refusal rate and a higher cost per completed questionnaire. Sec-ondly, the freedom they give to respondents generates a higher vari-ability of answers. “Because of different word choices, verbal skills, andthe like, study participants seldom give identical answers, even thoughthey may be saying essentially the same thing” (Peterson 2000, 33). Theassociated diversity of answers results in a great variety of interpreta-tions making the analysis extremely labor intensive (Peterson 2000).Finally, narrative questions rely more heavily on the interviewer’s abilityand experience. The more expansive and complex the respondent’sanswer (verbosity effect) the more important the interviewer’s ability
How Easy It Is to Ask the Wrong Question 71
Example 3.11
Objective Question
H3. What is the share of government officials that deliver efficient services (e.g., public utilities, public
transportation, security, education, and health)?
________%
Source: Investment Climate Surveys.

to probe and the greater the risk that only those aspects of the responsethat the interviewer considers interesting and relevant will be reported(Warwick and Lininger 1975).
There is nevertheless a general agreement among all practitioners—both those for and against open-ended questions—that the open for-mat of a question generates a different distribution of results from aclosed version (table 3.9), although there seems to be no evidence thatone form is preferable to the other (Foddy 1993).
72 The Power of Survey Design
Table 3.9
Open- and Closed-Question Formats Generate Different Responses
Most important thing for children to learn to prepare for life (percentage of respondents).
Answer Closed Format Open Format
1 To obey 19.0 2.4
2 To be well liked or popular 0.2 0.0
3 To think for themselves 61.5 4.6
4 To work hard 4.8 1.3
5 To help others in need 12.6 0.9
6 To be self-reliant 6.1
7 To be responsible 5.2
8 To have self-respect 4.1
9 To have respect for others 6.7
10 To have self-discipline 3.5
11 To be honest 7.4
12 To have other moral qualities 3.0
13 To be religious 5.4
14 To love others 2.0
15 To get an education 12.8
16 To learn a trade of job skill 0.9
17 To get along with others 5.0
18 Multiple answers not classifiable 16.1
19 Other 0.0 9.3
20 DK 0.0 1.3
21 NA 1.8 2.0
Source: Schuman and Presser 1979.Note: DK = don’t know; NA = not available.

In an open-ended format, the respondent puts forward a set of in-formation (the answer to the question) and an “expert” filters out therelevant answer on the basis of some detailed instructions (stimuli). Inthe closed format, the expert provides the “stimuli” and the respondentfilters the information to extract the relevant answer. The decision toadopt a closed or open question is fundamentally a decision about whowill interpret the information and extract the relevant answer. Giventhe same set of “stimuli” and the same set of information, using eitherof the two formats leads to the same relevant answer. Should the twoformats lead to different answers the difference is attributable only tothe agent who performs the interpretation of the information set. It isreasonable to assume that for a given set of stimuli the best agent to in-terpret the set of information provided by the respondent is the re-spondent himself or herself. This consideration, along with the benefitshighlighted earlier and the realization that respondents might volun-tarily or involuntarily not reveal all relevant information for the expertto extract the right answer, provides justification for a well-designedclosed format over the open format.
Because it is not always possible or feasible to construct a well-designed closed question, narrative questions retain an important rolein survey research. When information about a potentially complicatedphenomenon is sought, when the range of possible alternatives is so ex-tensive that it is practically impossible to list them,31 or when the pos-sible answers cannot be reduced to few words, the use of open-endedquestions is recommended. If knowledge is being measured, then a nar-rative question is better than a multiple choice question, because in thelatter case some correct answers may occur by chance. Similarly, whenthe reasoning behind a behavior or preference is of interest, the bestway too learn it is through the respondent’s own words (Fowler 1995).In other cases, when there is reason to suspect that external eventsmight affect the respondent’s answers, open questions should be used.So when asked about the most important problem facing the countryfollowing the 1977 winter storm, which generated a worry about foodshortages, the closed question was unable to detect this shift in publicopinion (figure 3.14) (Schuman and Presser 1979).
Finally, it is good practice to use narrative questions during the pilottest to ascertain how the respondent reacts to the question, to identifythe optimal set of response categories, and to determine whether the
How Easy It Is to Ask the Wrong Question 73
31 As mentioned earlier, good closed question design requires that the list of alternativesbe exhaustive and mutually exclusive (Peterson 2000).
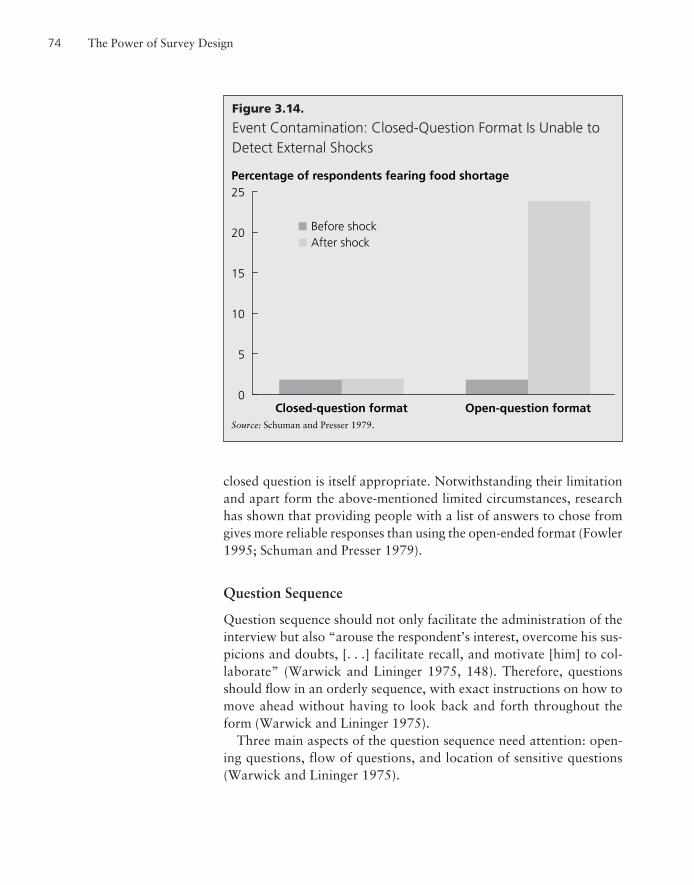
closed question is itself appropriate. Notwithstanding their limitationand apart form the above-mentioned limited circumstances, researchhas shown that providing people with a list of answers to chose fromgives more reliable responses than using the open-ended format (Fowler1995; Schuman and Presser 1979).
Question Sequence
Question sequence should not only facilitate the administration of theinterview but also “arouse the respondent’s interest, overcome his sus-picions and doubts, [. . .] facilitate recall, and motivate [him] to col-laborate” (Warwick and Lininger 1975, 148). Therefore, questionsshould flow in an orderly sequence, with exact instructions on how tomove ahead without having to look back and forth throughout theform (Warwick and Lininger 1975).
Three main aspects of the question sequence need attention: open-ing questions, flow of questions, and location of sensitive questions(Warwick and Lininger 1975).
74 The Power of Survey Design
Figure 3.14.
Event Contamination: Closed-Question Format Is Unable toDetect External Shocks
0
5
15
20
10
25
Closed-question format Open-question formatSource: Schuman and Presser 1979.
Percentage of respondents fearing food shortage
Before shockAfter shock

Opening Questions
At the start of an interview, respondents are a bit suspicious about thestudy and unsure about their role as informants. Thus, the first ques-tions should be easy, pleasant, and interesting. It should allow them tobuild up confidence in the survey’s objective, stimulate their interestand participation, and eliminate any doubt that they may have aboutbeing able to answer questions (so-called motivation and confidencebuilding). Good opening questions are conversational and encouragethe respondent to express himself or herself in positive terms, while re-maining within the purpose of the study (Warwick and Lininger 1975).Questions such as “What do you do in your free time?” or “Whichschool do your kids attend?” are irrelevant to the purpose of a businesssurvey, might immediately generate suspicion, and should be avoided.A much better opening is “Can you tell me a little bit about your com-pany?” In any question originating from the interviewer, even the mostconversational one, the respondent must be able to see the relationshipbetween the question asked and the purpose of the study. This is theonly way to build and keep trust.
Question Flow
The sequence of questions in the body of the form should be tuned toa good flow of ideas and to the logical reasoning of the respondent.Once a general topic has been addressed, all related questions shouldcome up before a second topic is raised. Similarly, if a long list of eventsis asked, each with dependent questions, it might be confusing for therespondents to go back and forth to each event to provide additionaldetails each time.32
It is a good practice, especially in business surveys, not only to startwith a narrative question but also to add open questions at regularintervals throughout the form. Elites “resent being encased in thestraightjacket of standardized questions” (Zuckerman 1972, 167) andfeel particularly frustrated if they perceive that the response alternativesdo not accurately address their key concern (Dexter 1970).
How Easy It Is to Ask the Wrong Question 75
32 In this case, however, the designer must keep in mind that the respondent might un-derstand the structure of the question itself and modify his or her answer to avoid the de-pendent questions to speed up the interview. For this reason, it is suggested to ask themain questions in their entirety first and then proceed with the dependent questions(Atkinson 1971; Moser and Kalton 1971; Plateck, Pierre-Pierre, Stevens 1985).

Illogical jumps or an abrupt change of topic should also be avoidedbecause it will create confusion, and possibly frustrate the respondentand compromise the accuracy of the data. It is good practice to dividethe survey subject in different topics linked in the interview by transi-tional explanations, such as “Okay, let’s now move to . . .” or “Allright, I am now going to ask you a few questions on. . . .” These tran-sitions play a critical role in the sequencing of questions in both intro-ducing a new topic and showing how a new topic relates to the purposeof the study. More important, transitional phrases help respondentsforesee what type of questions they are going to be asked. This willfocus their minds and help them relax. Furthermore, transitional ex-planations exert a positive psychological effect on respondent by givinga sense that we are moving toward the end of the interview (Atkinson1971). Finally, the use of bridging remarks, such as “You mentionedearlier that . . . ,” should be encouraged because it shows that the inter-viewer is attentive and interested in what the respondent has to say.
The order of questions can also be used to aid individual’s memoryor to gradually introduce respondents to unpleasant or embarrassingtopics.33 For example, questions on awareness of a program shouldprecede questions on their use. Questions with a common reference period should be grouped together, with the most recent period com-ing first (Warwick and Lininger 1975). Easier questions should beasked at the beginning or the end of the interview.
Filter questions and conditional questions should be used to guidethe interviewer and exclude respondents from a question sequence thatdoes not apply to them. It is time-consuming and annoying for a re-spondent to be asked “How many days did it take you to export yourgoods?” if he or she does not export at all. Filter questions are moreefficient, and therefore should be preferred over conditional questions.They allow us to discriminate between “not applicable” and “non-response.” As a matter of fact a “not applicable” response to the ques-tion “If you have a loan, what is the interest rate?” could mean that therespondent does not have a loan or that he or she simply does not payinterest on an existing loan.
76 The Power of Survey Design
33 To some extent, the actual order of questions might affect respondents. Although theliterature is split on this issue (Benton and Daly 1991; McAllister and Wattenberg 1995;McClendon and O’Brien 1988; Sigelman 1981), it seems that “question order effectsoccur only when a prior question establishes a response set to a subsequent question; thatis, that the order effects are selective or conditional on the substance of specific ques-tions” (Crespi and Morris 1984, 580).

The importance of filter questions cannot be stressed enough, especiallyfor attitude or knowledge questions. Respondents are reluctant to admitignorance. They are open to offering opinions not only on subjects theyknow little about, but also on fictitious information presented as fact.
Gallup [. . .] finds that while 96 percent [of respondents] had anopinion on the importance of a balanced budget, 25 percent didnot know whether the budget was currently balanced, 8 percentwrongly thought that it was balanced, 40 percent knew it was un-balanced but didn’t know by how much, 25 percent knew it wasunbalanced but overestimated or underestimated the amount by15 percent or more, and 3 percent knew it was unbalanced andknew the approximate level. (Smith 1984, 221)
When asked about a fictitious “Public Affairs Act” one-third of re-spondents volunteered an answer in a form without a filter (Bishop,Oldendick, Tuchfarber, and Bennett 1980; Bishop, Tuchfarber, andOldendick 1986) Filters are extremely important because they canscreen out from 5 to 45 percent of responses, depending on the word-ing of the filter and how familiar or emotive the issue covered is(Bishop, Oldendick, and Tuchfarber 1983).34
Location of Sensitive Questions
While all agree that sensitive questions should not come at the begin-ning of the interview, when the main goal of the interviewer is to gaintrust from the respondent, the belief that these questions should not beplaced at the end is not unanimous either. Some practitioners in factfavor the “hit-and-run” method, in which as many sensitive questionsas possible are asked toward the end of the interview until the respon-dent becomes unwilling to continue.35 This method shows a poor under-standing of the psychology of the interview process and leaves therespondent with negative attitudes toward the study (Warwick andLininger 1975). In the worst case, the respondent may reject the wholeinterview and ask the interviewer to hand over the questionnaire.
Sensitive questions should be introduced only at a point of the inter-view at which the respondent is likely to have developed confidence in
How Easy It Is to Ask the Wrong Question 77
34 Examples of filters include the following: “Do you have an opinion on this or not?”“Have you been interested enough in this to favor one side over the other?” “Have youthought much about this?” and “Where do you stand on this issue, or haven’t youthought much about it?” (Bishop, Oldendick, and Tuchfarber 1983).35 See Moser and Kalton (1971, 346).
the purpose of the study and trust in the interviewer. They should beplaced where they are least likely to be sensitive, such as where the topicbeing discussed is the most appropriate. Finally, to mitigate the per-ceived threatening nature of sensitive questions it is good practice to in-troduce them gradually by a series of warm-up questions (Warwick andLininger 1975).
Questionnaire Length
While the literature investigates extensively the relationship betweenquestion length and data accuracy, few authors have analyzed the effectof questionnaire length on data quality. A review of the literature byBogen (1996) finds no clear association between questionnaire length andsurvey participation. While she blames a lack of experimental researchon this issue, she points out that the existing evidence does not lead to theassertion of a negative relationship between questionnaire length and re-sponse rate. Most of the papers reviewed in this article refer to mail andtelephone interviews and, in the few papers on face-to-face interviews,the average interview length is one hour. For longer interviews, likeInvestment Climate Surveys interviews, which can run between one andtwo hours, very little experimental research can be found.
As discussed in chapter five, the existing literature suggests that sur-vey participation is only marginally associated with questionnairelength. Evidence form the Investment Climate Surveys confirms thatquestionnaire length36 has no impact on response rate (figure 3.15).37
78 The Power of Survey Design
36 The number of pages is only an imperfect measure of questionnaire length. The reallength is a function of three components: the length of individual questions, the numberof questions, and the format of questions included in the form. A questionnaire of only10 questions, but with each of them in a table format, is more difficult and time-consuming than a questionnaire with the same amount of information asked in a sequenceof questions with appropriate skip patterns. To account for this, we “standardized” the def-inition of questionnaire length by counting the words of each questionnaire and calcu-lating the number of pages, assuming 422 words per page. All figures and analyses in thisbook assume this standardized definition.37 The response rate is calculated as the percentage of “core” questions answered to controlfor question effect. A copy of the core questionnaire used in the investment climate surveysis available at: http://www.ifc.org/ifcext/economics.nsf/Content/IC-SurveyMethodology.Countries included in the figure are: Bangladesh2002, Brazil2003, Cambodia2003,China2002, Ecuador, Ethiopia2002, Honduras2003, India2000, Kenya2003, Kyrgyzstan2003, Moldova2003, Nicaragua2003, Nigeria2001, Peru2002, Philippines2002,Poland2003, Tajikistan2003, Tanzania2003, Uganda2003, Uzbekistan2003. The dataon Investment Climate Surveys used throughout this book are available online at thefollowing URL: http://iresearch.worldbank.org/ics/jsp/index.jsp.

Questionnaire length has a significant impact on data accuracy.Longer questionnaires put an unfair burden on the time and memoryof the respondent and will inevitably result in higher response errors.Although respondents may not appear to refuse to answer a question,they may provide any answer to complete the interview more quickly,hence providing biased information. The problem is that we cannotcontrol for this bias.
Sudnam and Bradburn (1974) suspected that interviews over twohours might endanger response accuracy. They affirm that fatigue doesnot jeopardize data quality in interviews up to one-and-a-half hourslong, while pointing out that “a fatigue factor [. . .] could become aserious problem in interviews lasting more that two hours” (Sudnamand Bradburn 1974, 90). Andrews (1984) also found a similar associ-ation by demonstrating that on a questionnaire with up to 348 items“better data quality comes from items that fell in the 26th to 100th po-sitions” (432).
How Easy It Is to Ask the Wrong Question 79
Figure 3.15.
Relationship Between Questionnaire Length and Response Rate
Ecuador
India
ChinaEurope andCentral Asia
Bangladesh
Peru
Cambodia
Nigeria
Philippines
Tanzania
Ethiopia
Uganda
Honduras
Nicaragua
Brazil
Kenya
70
75
80
85
90
10 15 20 25 30
Questionnaire length (pages)
Core questions answered (percent)
Source: World Bank Investment Climate Survey 2003.

Notwithstanding this evidence it is hard to determine the optimallength of a questionnaire. In face-to-face interviews there is a generalagreement that the interview should take no longer than 45 to 60 minutes.38 After 75 minutes, the managers manifest clear signs offatigue (uncomfortable on the chair, watching the clock, lookingaround the room, asking more often for the question to be repeated).Data from the Investment Climate Surveys also seems to confirm thatdata accuracy starts to suffer when the questionnaire reaches 20 pages.Allowing for the fact that only part of the whole Investment ClimateSurveys questionnaire is administered through a formal face-to-face interview,39 evidence seems to show that in general face-to-faceinterviews should not exceed 14 pages (or approximately one-and-a-half hours).40
Questionnaire Layout
Often not enough attention is paid to the physical layout of the ques-tionnaire, which results in a greater likelihood of errors by interview-ers, editors, coders, key operators, and ultimately respondents.
A common reason for poor layout is the desire to fit all of the ques-tions in a single page, even if the type has been reduced to minis-cule proportions and the items crammed together. [. . .] Thoughsuch forms mean savings on paper and printing expenses, they areultimately wasteful if they reduce the quality of the informationobtained. (Warwick and Lininger 1975, 151)
A number of principles should be followed to ensure that the ques-tionnaire is convenient for the interviewer and respondent, as well aseasy to identify, code, and store.
80 The Power of Survey Design
38 See Rea and Parker 1997.39 The Investment Climate Surveys questionnaire is usually divided into two parts. The firstis administered through a face-to-face interview with the chief executive officer or managerof the selected establishment. The second part is to be filled in by the accountant and humanresources manager under the supervision of the interviewer, and requires referencing booksand records. Although the questionnaire length is measured for the whole questionnaire,the time to complete the face-to-face interview refers only to the first part.40 In determining the actual length of the interview, the survey manager should keep inmind that a host of other factors beyond the questionnaire length play a role, not the leastbeing the interviewer’s ability.

Identification
Each form should contain one or more unique identifying numbers as-signed in advance and marked on each questionnaire. It is good practiceto have the same number assigned to each sample unit be the identifierof its paper questionnaire as well (Warwick and Lininger 1975).
Numbering
Questions should be numbered sequentially throughout the instrumentwithout omissions or repetitions. Even if the questionnaire is dividedin sections or parts it is preferable to use progressive numbers through-out the form.
Space
Sufficient space between questions should be left to facilitate question-naire administration. Saving space will ultimately be uneconomical if itcompromises data accuracy. It is advisable to print only on one side ofthe page and to leave enough space for notes from interviewers, editors,or coders on both sides of the questions. To facilitate data entering, it isgood practice to align the answer boxes to the margin of the pages. If itis not practical to do so (that is, when questions are of varying length)then it might be appropriate to use a table format in which questions arespread across the page in an orderly fashion allowing the justification ofanswer categories (example 3.12). Finally, if it is not feasible to placethe answer boxes next to the question it is advisable to use dotted linesto connect them (Plateck, Pierre-Pierre, and Stevens 1985).
Open-ended questions should have sufficient space for the expectedaverage answer length. For questions that need to be coded at a laterstage, “For Official Use Only” space should be clearly allowed in thequestionnaire.
Instructions
Instructions are critical both for the administration of the form as wellas for the collection of accurate data. Two types of information mustbe readily distinguishable in the questionnaire: questions to be read andinstructions to be followed.
One effective way to eliminate confusion between instructions andquestions is to use different formats or to put one of them in a box. So,for instance, all verbatim questions can be typed in regular font whileinstructions are typed in capital letters. Instructions should be placed
How Easy It Is to Ask the Wrong Question 81

82 The Power of Survey Design
Example 3.12
Questionnaire Layout
Language Education
11. WHAT IS THE LANGUAGE . . . FIRST
LEARNED IN CHILDHOOD AND STILL
UNDERSTANDS? (Mark all that apply)
English............................................�
French ............................................�
Other ..............................................�
12. CAN . . . SPEAK ENGLISH OR FRENCH
WELL ENOUGH TO CONDUCT A CON-
VERSATION?
NO—Neither English nor French ...�
YES—English only..........................� Go to 14
YES—French only...........................�
YES—Both English and French.......� Go to 13
13. IN GENERAL, WHICH OF THESE TWO
LANGUAGES DOES . . . PREFER TO SPEAK?
English ........................................�
French.........................................�
Neither........................................�
Don’t know.................................�
No preference..............................�
14. WHAT LANGUAGE DOES . . . SPEAK MOST
OFTEN AT HOME? (Mark all that apply)
English ........................................�
French.........................................�
Other ..........................................�
15. HAS . . . (EVER) ATTENDED A UNIVER-
SITY, COMMUNITY COLLEGE, OR
OTHER POSTSECONDARY INSTITUTION
AS A FULL-TIME STUDENT?
Yes � No � Go to 20
16. WHAT IS THE HIGHEST LEVEL OF
EDUCATION . . . COMPLETED?
Enter code
If code 99 Go to 20
17. IN WHAT YEAR WAS . . . ’S LAST DEGREE,
DIPLOMA, OR CERTIFICATE GRANTED?
1 9 Year
18. IN WHICH PROVINCE, TERRITORY, OR
OTHER COUNTRY WAS THIS DEGREE,
DIPLOMA, OR CERTIFICATE GRANTED?
Enter code
19. WHAT WAS . . . ’S MAJOR FIELD OF
STUDY?
Enter code
20. HAS . . . LIVED IN ANY OTHER PROVINCE,
TERRITORY, OR OTHER COUNTRY SINCE
JUNE 1, 1976?
Yes � No � Go to 48

How Easy It Is to Ask the Wrong Question 83
Example 3.12 (continued)
Migration History
21. IN WHICH PROVINCE, TERRITORY, OR
OTHER COUNTRY DID . . . LIVE ON
JUNE 1, 1976?
Enter code
22. TO WHICH PROVINCE, TERRITORY, OR
OTHER COUNTRY DID . . . FIRST MOVE
AFTER JUNE 1, 1976?
Enter code
23. WHEN DID . . . MAKE THIS MOVE?
Mo. Yr.
24. TO WHICH PROVINCE, TERRITORY, OR
OTHER COUNTRY DID . . . MOVE NEXT?
Enter code
If code 99 (No other moves) go to 34
25. WHEN DID . . . MAKE THIS MOVE?
Mo. Yr.
26. TO WHICH PROVINCE, TERRITORY, OR
OTHER COUNTRY DID . . . MOVE NEXT?
Enter code
If code 99 (No other moves) go to 34
27. WHEN DID . . . MAKE THIS MOVE?
Mo. Yr.
Source: Plateck, Pierre-Pierre, and Stevens 1985.
28. TO WHICH PROVINCE, TERRITORY, OR
OTHER COUNTRY DID . . . MOVE NEXT?
Enter code
If code 99 (No other moves) go to 34
29. WHEN DID . . . MAKE THIS MOVE?
Mo. Yr.
30. TO WHICH PROVINCE, TERRITORY, OR
OTHER COUNTRY DID . . . MOVE NEXT?
Enter code
If code 99 (No other moves) go to 34
31. WHEN DID . . . MAKE THIS MOVE?
Mo. Yr.
32. TO WHICH PROVINCE, TERRITORY, OR
OTHER COUNTRY DID . . . MOVE NEXT?
Enter code
If code 99 (No other moves) go to 34
33. WHEN DID . . . MAKE THIS MOVE?
Mo. Yr.
.

directly above the question concerned or the section of the question-naire to which they apply. It is not advisable to put instructions at thebeginning of the questionnaire or in the manuals (Plateck, Pierre-Pierre,and Stevens 1985).
Fonts and Formats
Given that the same question can educe different meanings if differentwords are emphasized (see example 3.13), critical words should beunderlined or printed in bold to ensure uniform emphasis by inter-viewers and uniform interpretations by respondents.
Similarly, when the time reference changes from one question to thenext, it is particularly important to ensure uniformity of interpretation.Using bold when asking “In the last two weeks, how many . . .” focusesthe respondent’s attention on the new time reference (Plateck, Pierre-Pierre, and Stevens 1985).
In a multicultural survey in which each question is printed first in onelanguage and then in the second language, it is good practice to use twodifferent fonts for each language throughout the questionnaire(Plateck, Pierre-Pierre, and Stevens 1985).41
Symbols
Symbols such as circles, arrows, boxes, triangles, and asterisks, as wellas different colors or shades are excellent visual tools and should be used
84 The Power of Survey Design
Example 3.13
Different Emphasis Implies Different Answers to the Same Question
ImpliedOvert Emphasis on Emphasis on Possible Replies
Why did you buy this book? ➝ motivation (gift, self interest)
Why did you buy this book? ➝ person (self, other)
Why did you buy this book? ➝ action (rent, borrow)
Why did you buy this book? ➝ object (other book, magazine)
Source: Peterson, 2000.
41 Alternatively, the questionnaire could be printed double-sided with each side havingthe same questions but in different languages. When more than two languages are used,it is advisable to use separate forms for each language.

not only to guide the interviewer and respondent throughout the form,but also to facilitate the work of supervisors and key operators. Thequestionnaire can be designed in such a way that each type of answerhas an associated type of symbol. So, for instance, arrows might helpidentify the skipping pattern, a circle might be used whenever a checkmark is called for, and a box whenever numbers are called for (see pre-vious example 3.12) (Plateck, Pierre-Pierre, and Stevens 1985).42
Similarly, if the questionnaire is divided into two parts, it has beenproven useful to have the two parts printed on two different papercolors.
Translation
Surveys are often conducted in multiethnic and multilinguistic societies.Thus, asking the same question in countries (or regions) with differentcultures, traditions, beliefs, and languages becomes even harder and thesolutions are more complex.
Three major concerns are raised by comparative research. The firstis whether one concept has the same meaning in different cultures. So,for instance, the concept of illegal party contribution might have dif-ferent meanings in the United States and the Philippines. Second, evenif the same concept has the same meaning in different cultures, it doesnot imply that the same indicator of that concept would apply to all ofthe meanings. The notion of political activity is the same in the UnitedStates and Europe, but the pattern of activities is different for eachcountry. The third concern refers to the analytical value of the infor-mation collected. A well-translated identical indicator can still gener-ate a nonequivalent response pattern across cultures. This happenswhen different response styles occur in different cultures. So, for in-stance, if acquiescence is more common among small companies, thenappropriate controls should be introduced to avoid the fact that ap-parent differences across countries actually reflect differences in thestrata’s composition (Warwick and Lininger 1975).
The implication is that translation in the local language should notbe seen as simple “transliteration” of the words. Rather it should be atransformation of the instrument to “conceptual equivalence” (Hunt,Crane, and Wahlke 1964). In other words, it is essential that the trans-
How Easy It Is to Ask the Wrong Question 85
42 This helps not only in the data-collection phase but also in the data-checking stage ofthe survey.

lation convey a consistent message in different cultures. So if we wantto measure “unlawful party contribution to political parties,” we can-not use the same measurement for the United States and the Philippines,because in the latter no laws forbid such contributions. A technique toensure good translation quality is the so-called back translation as out-lined in the following four steps:
Step 1. The questionnaire is first translated from language A to lan-guage B.
Step 2. The translated version is then translated back from B into A bya different translator.
Step 3. The two versions of the questionnaire, original and back trans-lated, are then compared and discrepancies clarified and corrected.
Step 4. The revised translated version is translated back into A again forcomparison, and this process keeps going until there are no more in-consistencies between the two versions (Warwick and Lininger 1975).
During this translation process, it is useful to treat the pre-test as anadditional tool for checking the translated version of the question-naire. A lot of the problems of designing a cross-cultural study can beaddressed
if the investigators take to the field early in the study and allowample time and resources for pre-testing the research instrument.The day when a single questionnaire is designed in the UnitedStates or Europe and sent to ‘hired hands’ in other countries ishopefully over. (Warwick and Lininger 1975, 167)
This brings us to the last step of questionnaire design: pre-testing.
Pre-Test
Armchair discussions cannot replace direct contact with the populationbeing analyzed (Warwick and Lininger 1975).
It is all too easy to think that one can draft a perfectly worded ques-tionnaire while sitting in an office. In fact, it is very difficult toimagine all the possible interpretations and the variety of answersrespondents may give, or the different circumstances or conditionswhich may alter the sense of the questions. (Plateck, Pierre-Pierre,and Stevens 1985, 21)
86 The Power of Survey Design

By the time the form reaches the pre-test stage all issues of wording,style, content, layout, and language should be resolved. The pilot rep-resents the first “live” test of the instrument, as well as the last step inthe finalization of the questions. No matter how experienced the ques-tionnaire designer is, any attempt to shortcut this step will seriouslyjeopardize the accuracy of the data about to be collected. Time con-straints should not come at the expense of this essential last step in thedesign of the questionnaire (Moser and Kalton 1971).
As discussed previously in this chapter, good question design requiresclarity in the terminology adopted. “Survey questions [. . .] should meanthe same thing to all respondents, and they should mean the same thingto respondent as well as to the researcher” (Fowler 1992, 218). Thepilot test represents the only opportunity to verify this and the data col-lected will ultimately reflect any poorly defined question or concept.When asked “How many servings of eggs do you eat in a typical day?”some 33 percent of respondents interpreted one serving as one egg and47 percent of them interpreted one serving as two eggs. Therefore,when the meaning of “servings” was clarified, the number of respon-dents reporting two eggs went from 15 to 62 percent (figure 3.16).
Bassili and Scott (1996) and Fowler (1992) show that clearer ques-tions reduce both the time to answer as well as the requests for clarifi-cations, thus reducing the time to complete the interview (figure 3.17).
The pre-testing of a questionnaire can be conducted following threedifferent methods: conventional, behavioral, and cognitive.
The conventional method involves a small number of interviews fol-lowed by a debriefing in which experiences are shared and problemsidentified.43 The behavioral pre-test involves structured interviewsmonitored by an expert whose role is to identify and code problems. Inthe cognitive pilot, the respondent is asked to report everything thatcomes to his or her mind while or after answering the questions. Pre-liminary experimental results show that each method serves a differentpurpose. The behavioral and conventional methods are more appro-priate for detecting problems with both the respondent and the inter-viewer, whereas the cognitive method assesses the analytical accuracyof the answers by evaluating the questions from the point of view of theeffort required to answer. Conventional and cognitive pre-tests alsoperform well in identifying semantic problems.
How Easy It Is to Ask the Wrong Question 87
43 This methodology is efficient if the investigator designs effective debriefing questionsfor both the interviewer and the respondent and if he or she is able to determine whichinformation is not relevant (Campanelli, Martin, and Rothgeb 1991).
Pre-test methods

Figure 3.16.
Effect of Unclear Terms on Survey Results
0 20 40 60 80 100
Percentage of responses
Original question Revised question
Did exercise
0
1
2–6
7
Dayseatingbutter
Eggseaten
1
2
3+
Doctorvisits
0
1–2
3+
Originalquestiona
Unclear termin originalquestion Clarification in revised question
Have you done any exercise?
Exercise Walking included
Days per weekyou have butter?
Butter Margarine excluded
How manyservings of eggs?
Serving Number of eggs
Times you have visited a doctor?
Visit See a doctor, or see a nurse, or see a medical assistant, or receiving medical advice, prescription or test results
Source: Fowler 1992.a. Meaning of question. For exact question wording see reference.
88 The Power of Survey Design

In addition to these three field methods, there is a fourth method inwhich expert designers review the questionnaire in the office. This hasproven beneficial, particularly for the identification of problems relatedto the analytical value of the questions (figure 3.18) (Presser and Blair1994). Biemer and Lyberg (2003) present a useful list of coding categoriesthat experts can use in their assessment of the questionnaire (box 3.1).
The purpose of the pre-test is threefold:
• To evaluate the adequacy of the questionnaire,44
• To estimate the length of the interview, and• To determine the quality of the interviewers.
It is not easy to determine a priori the warning signs of design defects.Many different situations can occur during an interview leading to a great variety of answers to any single question. In general, too manyanswers at one extreme may indicate a leading question. Too many“don’t know” or requests for clarifications definitely indicate vaguequestions, questions using uncommon words, or questions going out-
How Easy It Is to Ask the Wrong Question 89
Figure 3.17.
Unclear Terms Take Longer to Answer
0
2
4
6
8Seconds to answer
Single barrelDouble barrelSource: Bassili and Scott 1996.Note: For single barrel, the answer is the average of two simple questions (author’s calculations).
44 Occasionally, the pilot can also be used to evaluate different wording of the same ques-tion. In this case, however, the survey manager must ensure that the alternative versionsof the question are tested by the same interviewer on two equivalent random sample ofrespondents (Moser and Kalton 1971).
Pre-test goals

side the respondent’s experience. If respondents add qualifications totheir answer, the question needs to be clarified. If many refuse to answeror answer in the same way, the question must be reworded, reposi-tioned, or cut out altogether (Moser and Kalton 1971).
Following is a checklist of concerns regarding the questionnaire thatthe designer should address during the pilot:45
• Do respondents understand what the survey is all about?• Do they feel comfortable answering questions?• Is the wording clear?• Is the time reference clear to respondents?• Are the response categories compatible with the respondent’s ex-
perience?
90 The Power of Survey Design
Figure 3.18.
Percentage of Problems Identified by DifferentPre-Test Methods
0
20
40
60
80
Conventional Behavior Cognitive Expert
Percentage of problems
Pretest methodSource: Presser and Blair 1994.Note: Weighted averages of all trials, author’s calculations.
SemanticRespondentInterviewerAnalysis
45 A systematic approach to rate questions during the pilot has been suggested by Fowler(1995, 116–124).

How Easy It Is to Ask the Wrong Question 91
Box 3.1
List of Questionnaire Problems for Pre-Test Expert Review
1. PROBLEMS WITH READING: Determine whether it is difficult for the interviewers to read the
question uniformly to all respondents.
1a – WHAT TO READ: Interviewers may have difficulty determining what parts of the question are
to be read.
1b – MISSING INFORMATION: Information the interviewer needs to administer the question is not
contained in the question.
1c – HOW TO READ: Question is not fully scripted and therefore difficult to read.
2. PROBLEMS WITH INSTRUCTIONS: Look for problems with any introductions, instructions, or
explanations from the respondent’s point of view.
2a – CONFLICTING OR INACCURATE INSTRUCTIONS, introductions, or explanations.
2b – COMPLICATED INSTRUCTIONS, introductions, or explanations.
3. PROBLEMS WITH ITEM CLARITY: Identify problems related to communicating the intent or
meaning of the question to the respondent.
3a – WORDING: The question is lengthy, awkward, ungrammatical, or contains complicated syntax.
3b – TECHNICAL TERMS are undefined, unclear, or complex.
3c – VAGUE: The question is vague because there are multiple ways in which to interpret it or to de-
termine what is to be included and excluded.
3d – REFERENCE PERIODS are missing, not well specified, or are in conflict.
4. PROBLEMS WITH ASSUMPTIONS: Determine whether there are problems with assumptions made
or the underlying logic.
4a – INAPPROPRIATE ASSUMPTIONS are made about the respondent or his/her living situation.
4b – ASSUMES CONSTANT behavior: The question inappropriately assumes a constant pattern of
behavior or experience for situations that in fact vary.
4c – DOUBLE-BARRELED question that contains multiple implicit questions.
5. PROBLEMS WITH KNOWLEDGE/MEMORY: Check whether respondents are likely to not know
or have trouble remembering information.
5a – KNOWLEDGE: The respondent is unlikely to know the answer.
5b – An ATTITUDE that is asked about may not exist.
5c – RECALL failure.
5d – COMPUTATION or calculation problem.

• Which items require respondents to think hard before they answer?• What cognitive processes do they adopt to answer difficult
questions?• Which items seem to produce irritation, embarrassment, or
confusion?• Are there any items that respondents consider comical?• Does the style of the question generate bias?• Are the answers we get what we really want for the purpose of
the study?• Is there enough variability in the answers received?• Are there local expressions that should be incorporated into the
items to avoid ambiguity?• Is the questionnaire too long?• In the eye of the respondent, have any other important issues been
overlooked in the questionnaire?
Many of those issues are hard to judge so it is important for experi-enced staff with a profound understanding of the analytical purpose ofeach question to participate in the pre-test. Take for instance the fol-lowing question:
92 The Power of Survey Design
Box 3.1 (continued)
6. PROBLEMS WITH SENSITIVITY/BIAS: Assess questions for sensitive nature or wording, and
for bias.
6a – SENSITIVE CONTENT: The question is on a topic that people will generally be uncomfortable
talking about.
6b – A SOCIALLY ACCEPTABLE response is implied.
7. PROBLEMS WITH RESPONSE CATEGORIES: Assess the adequacy of the range of responses to
be recorded.
7a – OPEN-ENDED QUESTIONS that are inappropriate or difficult.
7b – MISMATCH between question and answer categories.
7c – TECHNICAL TERMS are undefined, unclear, or complex
7d – VAGUE response categories.
7e – OVERLAPPING response categories.
7f – MISSING response categories.
7g – ILLOGICAL ORDER of response categories.
Source: Biemer and Lyberg 2003.

The goal of this question was to get an estimate of capital vintage inthe establishment and relate it to both technological progress and pro-ductivity improvement. For this question to be of analytical value, theanswer should be based on the market value of the machinery, not on its book value. Unfortunately a cognitive evaluation of this questionduring a pre-test has shown that the answers provided were based onthe physical number of the machinery. Even when the question was re-worded to clearly indicate that the market value of machinery shouldhave been referenced, the respondents had so much difficulty answer-ing it that they would purely guess an answer.
The pilot is also an excellent opportunity to test both the convenienceof the form and the ability of interviewers.46 Some of the questions thatthe survey manger should consider addressing during the pilot to assessthe convenience of the instrument are as follows:
• Is the questionnaire easy to administer?• Do filters and skip patterns work properly?• Are instructions clear?47
• Are transitions from question to question smooth?
Similarly, some of the issues relevant to assess the interviewer’s abilityare as follows:
• How does he or she read the questions?• How does he or she behave in difficult situations?
How Easy It Is to Ask the Wrong Question 93
Example 3.14
Pre-Testing Helps Determine Whether Question Goals Are Met
What share of your plant machinery and equipment is:
a. <5 years old _____%
b. 5–10 years old _____%
c. 10–20 years old _____%
d. >20 years old _____%
46 Although it is not feasible to have all potential interviewers participate in the pre-test,the survey manager’s experience with the pre-test can serve as a first step in establishingan expectation on the average level of interviewers. This will help him or her bettertailor the training.47 A useful technique to test the usefulness of instructions, paraphrasing, is suggested byGower (1993). “Respondents are asked to repeat the question in their own words, or toexplain the meaning of terms and concepts [. . .] used.”
• How does he or she handle questionnaire instructions?• How does he or she explain concepts not clear to the respondent?• How does he or she probe and record answers?
The size of the pre-test is more a matter of convenience and availabil-ity than the result of a random selection process. Generally it should becarried out in 15 to 25 establishments. Although firms of different sizesshould be included in the test, the selection of respondents is more pur-posive than random. It is not necessary to visit establishments in differ-ent locations or industries unless there are reasons to believe that regionalor sectoral differences in the interpretation of questions might exist.
Because it is difficult for one individual to carry out a good interviewand observe and take notes on how to improve the instrument, it isgood practice for the survey manager or an expert to accompany theinterviewer during the pre-test. The expert will then observe the inter-viewer’s behavior and the respondent’s reactions, and will perform acognitive assessment of the most challenging questions. To better per-form these tasks, it is advisable to focus only on a subset of the ques-tions on each pre-test and to apply what has been learned in previouspilots to subsequent interviews. With all the information gathered dur-ing the pre-test the questionnaire is then finalized.48
94 The Power of Survey Design
48 At this stage, the form is almost ready to be administered. A few useful comments andmodifications could come up during the training, especially if the instrument is translatedinto the local language.
If proper sampling procedures are followed, in a matterof days, an opinion poll conducted on approximately
1,000 individuals can be reasonably taken as a measure of public opin-ion for a population as large as China’s. This is the power of sampling,its ability to approximate from a small group the characteristics of thewhole population within a know margin of error.
Different methods of respondents’ selection can be employed whenconducting a survey, that is, interviewing experts, the typical respondent,or a group of respondents. Because only part of the population is sam-pled, the estimated parameters are subject to a sampling error. Samplingerror is a measure of “how closely we can reproduce from a sample theresults that would be obtained if we should take a complete count or cen-sus” (Hansen, Hurwitz, and Madow 1953, 10).
The ability to estimate and reduce this error depends on how thesample is selected. If the researcher knows what chances each popula-tion member has to be included in the sample, he can use statisticaltheory to estimate the properties of the survey statistics. On the contrary,when the selection of respondents is based on personal judgment, it isnot possible to have an objective measure of the reliability of the sam-ple results (Kalton 1983). This is not to say that there is no room forsubjective judgment in probability sampling. Rather, subjective judg-ment plays an important role in sample design as long as the final se-lection of the sample elements is left to a random process (Hansen,Hurwitz, and Madow 1953).
Volumes have been written on probability sampling. Hence, far frombeing a discussion on sampling techniques, what follows is a short reviewof how to determine the sample size using four of the most commonlyused sampling procedures: simple random sampling (SRS), stratified ran-dom sampling, systematic sampling, and probability proportional to size(PPS) sampling. Particular attention is dedicated to how to deal with
The major strength ofprobability sampling is thatthe probability selectionmechanism permits thedevelopment of statisticaltheory to examine theproperties of sampleestimators. [. . .] Theweakness of allnonprobability methods isthat no such theoreticaldevelopment is possible; as aconsequence, nonprobabilitysamples can be assessed onlyby subjective valuation.
—Graham Kalton,Introduction to Survey Sampling
Chapter 4
A Practical Approach to Sampling
95
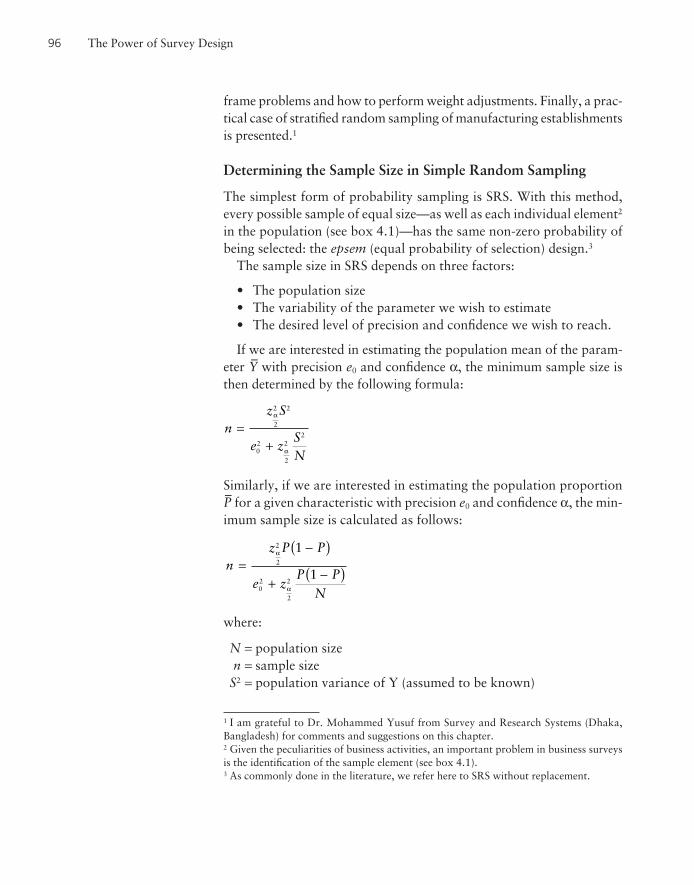
frame problems and how to perform weight adjustments. Finally, a prac-tical case of stratified random sampling of manufacturing establishmentsis presented.1
Determining the Sample Size in Simple Random Sampling
The simplest form of probability sampling is SRS. With this method,every possible sample of equal size—as well as each individual element2
in the population (see box 4.1)—has the same non-zero probability ofbeing selected: the epsem (equal probability of selection) design.3
The sample size in SRS depends on three factors:
• The population size• The variability of the parameter we wish to estimate• The desired level of precision and confidence we wish to reach.
If we are interested in estimating the population mean of the param-eter Y
–with precision e0 and confidence α, the minimum sample size is
then determined by the following formula:
Similarly, if we are interested in estimating the population proportionP–
for a given characteristic with precision e0 and confidence α, the min-imum sample size is calculated as follows:
where:
N = population sizen = sample sizeS2 = population variance of Y (assumed to be known)
nz P P
e zP P
N
=−( )
+−( )
α
α
2
2
02
2
2
1
1
nz S
e zSN
=+
α
α
2
2 2
02
2
22
96 The Power of Survey Design
1 I am grateful to Dr. Mohammed Yusuf from Survey and Research Systems (Dhaka,Bangladesh) for comments and suggestions on this chapter.2 Given the peculiarities of business activities, an important problem in business surveysis the identification of the sample element (see box 4.1).3 As commonly done in the literature, we refer here to SRS without replacement.

A Practical Approach to Sampling 97
Box 4.1
The Sampling Unit in Business Surveys
Contrary to household surveys in which the identification of the sampling unit is easier (that is, husband,
wife, and so on), in surveys of business activities this task is complicated by the fact that there is an array of
business forms, from small family-owned stores to large international corporations. So, when designing a
sample of formal manufacturing activities, what is the best unit of analysis? Is it the establishment, the fac-
tory, the plant, the company, the enterprise, or the firm? Theoretical motivations related to the purpose of the
study and the desired level of homogeneity, as well as practical considerations on the availability and accu-
racy of the data, will dictate the answer.
While this identification is not an issue for small entities, large businesses often include different legal struc-
tures, operational structures, and ownership structures. They produce different goods, in different locations,
at different scales. The resulting heterogeneity in the structure of each sampling unit makes it impossible to
have an internationally recognized standardization. Nonetheless, from a theoretical point of view, two types
of statistical units are generally identified. One corresponds to the level where financial decisions are made
and the other corresponds to the level where production decisions are taken. If the primary interest of the re-
searcher is the behavior related to resource allocation, then the former level is the appropriate unit of investi-
gation (the firm in box figure 4.1.1).
Box Figure 4.1.1.
Unit of Analysis in a Business Survey
F I R M
EstablishmentA
EstablishmentB
Productionline 1
Productionline 2
Managerialresponsibility
Operationalresponsibility
Productiondecisions
Financialdecisions
EstablishmentC
Source: Author’s creation.
(continued)

P = population proportion of Y (assumed to be known)e0 = desired level of precisionα = desired level of confidence (that is, for instance, 95%)
zα/2 = z distribution corresponding to α level of confidence4
With SRS, the population mean and population proportion as well asthe corresponding variances are estimated as follows:
Parameter Estimated Sample Mean Sample Variance
Population Mean
Population Proportion5
var pf
np p( ) = −( )
−−( )1
11p
y
n
ii
n
= =∑
1Py
n
ii
N
= =∑
1
Yy
N
ii
N
= =∑
1 var yf
ns( ) = −( )1
2yy
n
ii
N
= =∑
1
98 The Power of Survey Design
When, on the contrary, decisions on the purchase of factors of production are of analytical interest, then
the latter level of analysis should be adopted. Furthermore, within this level, two sublevels can be identified.
The level at which managerial decisions are made regarding the whole production process and the level of
single product operation. When the object of analysis is the overall managerial responsibility, then the es-
tablishment is the appropriate level of investigation. If the technological characteristics of a single produc-
tion process are of interest, then the individual production line is the appropriate unit of reference
(Nijhowne 1995).
From a practical point of view, while it is relatively easy to acquire firm data to analyze financial deci-
sions, it is much harder to collect information on individual product lines. Although records are kept to sup-
port management decisions, it is quite unlikely to find the same level of detail at all levels of production lines
in any business unit. The only way to gather these data is for the researcher to reconstruct them from aggre-
gate values, a process that results in an inevitable loss of accuracy (Colledge 1995).
Box 4.1 (continued)
4 See appendix 4 for values of the zα/2 corresponding to different levels of confidence.5 Where yi = 1 or yi = 0 if the ith element has the desired characteristic or not, respectively.

where the variance of the sample elements is given by the following:
and is the sampling fraction and, in SRS, the probability of
inclusion.Finally, the weight of each element is as follows:
An example of SRS is presented in Box 4.2.
Determining the Sample Size in Stratified Sampling
The efficiency of the sample design can be improved by exploiting anyavailable information on the population under study. In particular, whensome population characteristics related to the variable estimated areknown, this information can be used to divide the whole population intogroups or strata, each sampled separately.6 This process of stratificationincreases the efficiency of the design the greater the homogeneity of theelements belonging to the same group. This homogeneity, however, mustrefer to the characteristic that is being estimated, not to the variable usedto identify the strata (Hansen, Hurwitz, and Madow 1953).
In stratified sampling, three different methods can be followed (Kish1965; Sukhatme, Sukhatme, and Sukhatme 1984).
Method 1. Equal Allocation
The sample size is allocated equally among strata:
where:
H = number of stratah = stratum, with h = 1,2,3, . . . h . . . H
nh = stratum sample sizeno = desired sample size
nnHh
o=
ω i fNn
= =−1
fnN
=
sn
y yii
n2 2
1
11
=−
−( )=∑
A Practical Approach to Sampling 99
6 See the Productivity and Investment Climate Surveys (PICS): Implementation Manual(World Bank 2003, 18–22) for information about how to identify strata in InvestmentClimate Surveys.

100 The Power of Survey Design
Box 4.2
Advising a Mayor
Suppose you are an advisor to a mayor. An opinion poll conducted by a prominent newspaper of 400 resi-
dents shows that 54 percent of residents are in favor of a new development program. Because elections are
approaching and the mayor wishes to run for reelection, would you advise him to support the project in his
political campaign?
The mean result from the poll (54%) is not sufficient to ensure that the majority of residents support this
project. We need to determine the implied level of confidence and precision of the poll results. Basically, we
need to work backward from the equation used to determine the sample size with proportions under SRS,
calculating the implied error e0 for a given α.
Because we want to be certain of our results, we can assume that the level of confidence is 95 percent. The
implied error is then given by the following:
Assuming the population of resident voters is 650,000, the implied error is 6.4 percent. This means that
we cannot be sure that the majority of the residents support this project, because the true proportion of the
residents in favor of the project falls between 49.1 percent and 58.9 percent.
Suppose the mayor wants to know whether he should put this project on his reelection campaign. He asks
you to conduct an opinion poll to determine the true proportion of the city population for or against it.
How would you arrive at the answer?
We need three pieces of information to determine the sample size. First, we need the target population,
which we know is 650,000 resident voters. Second, we need the level of error and desired confidence. Because
the major wants to be reasonably certain, we set the error at +/− 3 percent, and the level of confidence at
95 percent. Finally, we need the variance of the true proportion. To be on the safe side, we can assume that the
residents are equally split between supporters and opponents. This implies the maximum variance possible. In
other words, we assume the worst possible scenario. This implies that we will select the highest sample size for
the desired level of precision and confidence.
eN n z P P
n N=
−( ) × × × −( )
×
α2
2 1
nz P P
e zP P
N
=−
+ −
α
α
2
2
02
2
2
1
1
( )
( )

Method 2. Proportionate Allocation
The sample size is allocated proportionally to the size of each stratum:
where:Nh population size of the hth stratum and
Method 3. Optimum Allocation
The sample size is allocated among strata to reach the desired precisionat the minimum cost or to reach the maximum precision for a given cost.In this case, depending on the level of precision desired or amount of re-source available, four different cases can be envisaged:
Case 1. Given a desired sample size, no, and assuming that the unit costacross strata is the same,7 the optimum allocation nh across strata is de-termined by the following formula:
n nW S
W Sh o
h h
h hh
H=
=∑
1
N Nhh
H
=−∑
1
n nNNh o
h=
A Practical Approach to Sampling 101
The required sample size is then given by the equation on proportions. That is
Hence, you need to conduct a survey of 1,065 residents to be able to determine with 95 percent confi-
dence what they think about this project within a 3 percent margin of error. If the survey results show that
at least 54 percent of respondents are in favor of the project, we can be sure that most residents are in favor
of the project and we can advise the major to support it during his campaign.
nz P P
e zP P
N
=× × −( )
+ × × −( ) =× ×α
α
2
2
02
2
2
21
11 96 0 5 1. . −−( )+ × × −( ) =
0 5
0 03 1 960 5 1 0 5
650000
3 8416
2 2
.
. .. .
. ××
+ ×=0 25
0 009 3 84160 25
650000
1065.
. ..
Box 4.2 (continued)
7 Cost per unit in the hth stratum ch is constant across strata:
C c n c n cnh h hh
H
h
H
= = ===∑∑ .
11

known as “Neyman” allocation, where:
Case 2. Given the desired level of precision, eo, and assuming that theunit cost across strata is the same, the optimum sample size for each stra-tum is determined by the following formula:
and the total minimum sample size required is given by:
where:
Case 3. Given the amount of resources available to conduct the survey,Co, and assuming that the unit cost across strata is variable,8 the opti-mum allocation of each nh is determined by the following formula:
n
CW S
c
W S ch
oh h
h
h h hh
H=
=∑
1
Vez
o0
2
2
=
α
nW S
VN
W S
h hh
H
h hh
Hmin =
+
=
=
∑
∑1
2
02
1
1
nW S W S
VN
W Sh
h h h hh
H
hh
H
h
=+
=
=
∑
∑1
01
21
SN
y yh
h
ih hi
Nh2 2
1
11
=−
−( )=∑ stratum variance
WNNh
h= stratum weight
102 The Power of Survey Design
8 Cost per unit in the hth stratum ch is different across strata:
C c nh hh
H
==∑
1

and the total sample size is as follows:
Case 4. Given the desired level of precision, eo, and assuming that theunit cost across strata is variable, the required sample size in each stra-tum is determined by the following formula:
and the total minimum sample size required is as follows:
With stratification, the mean and variance are estimated as follows:
Parameter Estimated Sample Mean Sample Variance
Population mean
Population proportion
where the exact formula for the variance depends on how the elementswithin the strata are sampled. If SRS is used within each stratum, thenthe variance formula becomes (1) for the sample mean:
where:
sn
y yh
h
ih hi
nh
2 2
1
11
=−
−( )=∑ .
var y Wf
nsh
h
Hh
h
h( ) = −
=
∑ 2
1
21
var varp W phh
H
h( ) = ( )=∑ 2
1p W ph h
h
H
( ) ==∑
1
var vary W yh hh
H
( ) = ( )=∑ 2
1
y W yh hh
H
==∑
1
n
W S
cW S c
VN
W S
h h
h
h h hh
H
h
H
o h h
min .=⋅
+
==∑∑
∑11
21
nW S
c
W S c
VN
W Sh
h h
h
h h h
o h hh
H= ⋅
+
∑∑=
12
1
n
CW S
c
W S c
oh h
hh
H
h h hh
H==
=
∑
∑1
1
A Practical Approach to Sampling 103

or (2) for the sample proportion:
where:
and y = 1 or y = 0 if the sample unit has the characteristic
of interest or not.
In stratified sampling, the probability of inclusion depends on the allocation method adopted:
Method 1. In Equal Allocation
Method 2. In Proportionate Allocation
Method 3. In Optimum Allocation
and the weights are calculated as usual as ω = f−1.
How to Carry Out Systematic Sampling
Systematic sampling consists of selecting units at fixed intervals through-out the frame (or stratum) after a random start. Given a populationsize, N, and a desired sample size, n, systematic sampling consists of
(1) determining the sample interval (2) selecting a random
number (RN) from 1 to k9; and (3) choosing all possible elements be-longing to positions RN, RN + k, RN + 2k, . . . , RN + (n − 1)k.
kNn
= ;
fnNh
h
h
=
fnNh =
fn
HNh
h
=
pynh
ih
hi
nh
==∑
1
,
var p Wf
np ph
h
h
h h( ) = −−
−( )∑ 21
11
104 The Power of Survey Design
9 A table of random numbers is reproduced in appendix 5. This table can be used fromany point in any direction (vertically, horizontally, diagonally) to get the series of ran-dom numbers needed.

Conceptually, with systematic sampling, we subdivide the popula-tion in an n × k matrix:
1 2 3 . . . k
1 y1 y2 y3 . . . yk
2 yk+1 yk+2 yk+3 . . . y2k
. . . . . . . . . . . . . . . . . .
. . . . . . . . . . . . . . . . . .
n y(n−1)k+1 y(n−1)k+2 y(n−1)k+3 . . . ynk
and then select the sample corresponding to the column number equalto the drawn RN.
Steps in Systematic Sampling
Suppose we have the following population frame:Obs. 1 2 3 4 5 6 7 8 9
Y 5 9 12 10 7 5 9 11 10
Step 1. Given N = 9 and n = 3, determine k = = 3.
Step 2. Divide the observations in the population in a n × k matrix.
Step 3. Select a RN between 1 and k = 3, suppose RN = 2 = k.
Step 4. Select the sample corresponding to column two and includepopulation elements in position 2, 5, and 8, hence obtaining the sample.
obs Y
2 9
5 7
8 11
The order in which units (elements) are listed is critical in systematicsampling. If the population includes homogeneous elements, the sam-pler should position homogeneous units across rows (not columns) inthe n × k matrix described before. This creates strata composed of nrows, and systematic sampling will be equivalent to a proportional strat-ified sampling. One can also observe that forming the n × k matrix isequivalent to dividing the population into k clusters represented bythe columns of the matrix. Hence, while listing the elements in the
n1 2 34 5 67 8 9
� ��� ���
Nn
= 93
A Practical Approach to Sampling 105
k

population, a sampler should attempt to distribute each patch or typeof homogeneous units as far as possible uniformly among the clusters,that is, the columns of the matrix.
It is possible that the population size, N, is not an exact multiple of n,so that N = n × k + r where r is less than k. There are two possible waysto handle the situation. First, select r sample units at random from thepopulation and drop them before creating the n × k matrix and thenproceed from step 3 onward. Second, a more precise method would beto form the matrix with all n × k + r units so that r columns within then × k matrix would have n + 1 units, while the remaining n − r columnswould have n units. Next, select one column at random, as in step 3, andproceed onward as usual. A similar procedure can be used in situationsin which N = n × k − r. The step described is equivalent to consideringthe list of N = n × k + r or N = n × k − r units as circular and after a ran-dom number (RN) is selected elements in position RN, 2 RN, 3 RN, andso on are selected achieving a sample of n, n + 1 or n − 1 units.10
In systematic sampling, the mean is calculated as follows:
because it is an epsem design.Estimating the variance in systematic sampling poses challenging prob-
lems. In practice, assuming the order of elements is random,11 the vari-ance is computed as follows:
where s2 is the variance as calculated in SRS.The variance in stratified systematic sampling is computed as follows:
var yf
nW sh h
h
H
( ) = −( )=∑1
2
1
var yf
ns( ) = −( )1
2
yy
n
ii
n
= =∑
1
106 The Power of Survey Design
10 Kish (1965) presents a number of other methods to deal with this problem. We refrainfrom addressing them here because, in general, one additional observation in a sampleof an Investment Climate Survey presents no implementation problem.11 Kish (1965) presents alternative formulas when the SRS requirement is not met.

The probability of inclusion for each element is as follows:
and the weight is:
w = f −1 = k and wh = f −1h = kh in stratified SRS.
How to Carry Out the Probability Proportional to SizeSelection Method
The PPS selection method is used when we follow a two-stage samplingprocedure and are faced with clusters of unequal size, and if we wish tohave control over the total sample size, n, and the number of clusters in-cluded in the sample while keeping an epsem design. With PPS, each el-ement in the frame will be selected with a PPS of the cluster to which itbelongs.
Steps in Sample Design
Step 1. Given a population, N, choose the desired sample size n.
Step 2. Choose either the number of clusters a to include in the sam-ple or the number of cluster elements b to include in the sample, wheren = a × b.
Step 3. Draw a RN from 1 to N with replacement.
Step 4. Select the cluster that has the cumulative sum that first exceedsthe RN.
Step 5. Sample b elements in that cluster using SRS, systematic sam-pling, stratified sampling, or cluster sampling.
Step 6. Repeat steps 3 to 5 a times.12
Because PPS is an epsem design, the mean is estimated as follows:
yy
n
ii
n
= =∑
1
fk
= 1
A Practical Approach to Sampling 107
12 Note that the same cluster can be selected multiple times because the RN drawing iswith replacement. So, if a cluster is selected k times, k × b elements will be drawn fromthat cluster.

While the variance is calculated as follows:
where:
The probability of inclusion is given by the following:
where:
Bα = cluster sizea = number of cluster included in sampleb = number of cluster elements included in the sample.
Finally the weight is as follows:
An alternative method13 consists of selecting clusters with PPS withoutreplacement and then sample elements are drawn within selected clustersat random (SRS). This procedure preserves the characteristics of epsemdesign and it is implemented in the following steps.
Steps in Sample Design
Step 1. Given a population, N, choose the desired sample size n.
Step 2. Choose the number of clusters a to be included in the sampleand the number of elements b to be included in the sample clusters,where n = a × b.
w fNBaB b
= =−1 α
α
.
faBN
bB
= α
α
sa
y y
yy
b
a jj
a
j
j
b
22
1
1
11
=−
−( )
=
=
=
∑
∑ ββ (cluster saample mean).
var yf
asa( ) = −1
2
108 The Power of Survey Design
13 I owe the inclusion of this method to Dr. Yusuf.

Step 3. Let i designate a cluster in the population, with a total of Aclusters in the population. Furthermore, let j indicate a sample elementwithin a cluster with a total of Bi units or elements in the ith cluster.
Thus, = N.
Step 4. List the clusters and cumulated clusters’ sizes Bi as follows:
Step 5. Compute interval of selection where a is the number ofclusters to be selected.
Step 6. Select an RN with 0 < RN ≤ I.
Step 7. Systematically select a clusters with cumulated Ci (i = 1, 2, . . . .a) containing the selection vector elements RN, RN+I, RN+2I, . . . .RN+ (a − 1)I.
Step 8. Select b sample elements in each selected cluster using SRS, sys-tematic sampling, stratified sampling, or cluster sampling.
Note that a cluster may be selected more than once only if its size islarger than the interval of selection I. The procedure, however, retainsepsem characteristics of the sample. A refined standard practice is to se-lect the clusters with sizes larger than the interval of selection I automat
ically (that is, with probability 1) and attach weight to the
sample elements selected from such clusters.If a selected cluster has less than b sample elements, say l, all elements
of the cluster are selected and the remainder (b − l) elements are selectedfrom the adjacent (serially/geographically) cluster. PPS selection (with-out replacement) is an epsem selection with weight w for all sample el-ements given by the following:
The estimate of the population mean is as follows:
yy
n
tt
n
= =∑
1 .
wNn
= .
wbBi
= 1x
I = Na
BB B C B CB B B C B C etc.
1
2
=+ = + =+ + = + =
C1
1 2 1 2
1 2 3 2 3 3, aandB B B B C B CA 3 A A1 2 3+ + + + = + + =. . . . . . . .
Bii
A
∑
A Practical Approach to Sampling 109

The estimate of the variance of the sample mean y– is given by the fol-lowing:
where:
How to Deal with Population Frame Problems
The accuracy of any sampling procedure rests not only on the correctapplication of the relevant theoretical model, but also, and critically, onthe accuracy of the frame. The perfect frame in which each unit is listedexhaustively and uniquely and in which no foreign elements appear is arare event. Often frames are riddled with problems. Identifying and cor-recting them remains an important part of sampling.
Frame problems are important because they affect the underlyingprobability of inclusion of the sample units, thus tainting the originalsample design and original weights. Hence, the weights assigned toeach element at the design stage must be recalibrated at the estimationstage if frame problems occur.14 Kish (1965) identifies four categoriesof problems that can be attributed to faulty frames:
Problem 1. Noncoverage
Some population elements might not be included in the list. This canhappen because frames are inadequate or incomplete (Kalton 1983). Inbusiness surveys, it is often the case in developing nations that frames areout of date, thus failing to include all elements of the target population.
yy
bi
iji
b
= =∑
1 (cluster sample mean).
sa
y ya ii
a2 2
1
11
=−( ) −( )
=∑
var yf
asa( ) = −( )1
2
110 The Power of Survey Design
14 In addition to frame problems, survey nonresponse has an added impact on the weights;this needs to be taken into account when analyzing the data. The literature has developeda number of different procedures to adjust weights for both unit nonresponse and item non-response. While a discussion on adjustments for unit nonresponse is presented in the nextsection, methodologies to handle item nonresponse go beyond the scope of these notes.

Solutions at the Design Stage
Solution 1. Redefine the target population to exclude the missing ele-ments. This solution is acceptable only when the excluded group is a verysmall proportion of the target population (Kalton 1983).
Solution 2. Add supplementary frames in which the missing elementsare included. This solution is preferable to solution 1 although it mightgenerate another problem, duplication. This problem however is less per-vasive and can be easily handled (see below) (Kalton 1983).
Solution 3. Adopt a linking procedure to attach missing elements toexisting elements in a clear, practical, and unique manner. Hence, whenthe existing element is drawn, all linked elements are also selected. Thissolution has the same drawbacks as a cluster sampling (Kish 1965).
Solution at the Estimation Stage
Solution 1. Poststratification uses stratification weights after thecompletion of the survey. This method allows the adjustments ofweights in a way more respondent to the actual population (table 4.1)Poststratification weight adjustment is particularly useful in the event ofan outdated frame list. Hence, for example, if an establishment listed assmall at the design stage is (after the survey) discovered to belong to adifferent size category, it is essential to adjust the weights accordinglywith a procedure similar to poststratification.
A Practical Approach to Sampling 111
Table 4.1
Weight Adjustments for Noncoverage
Design Poststratification
Design Final Adjustment WeightPopulation Sample Weight Population Factor Adjusted
Strata N nh w=p−1 Nps wps=Nps/Nh wjps=w*wps
A 5,000 250 20 ? 1.4 28
B 15,000 500 30 ? 1.4 42
Total 20,000 28,000
Source: Author’s calculations.

Problem 2. Duplicates
Sometimes, especially when the frame is constructed as the combinationof different frames, some elements may appear more than once. This hasan impact on the probability of inclusion and thus needs to be taken intoaccount.
Solutions at the Design Stage
Solution 1. Adopt a unique identification method. That is first deter-mine a precise order for each separate listing (the first most important,the second, and so on). Then for each element in the first list eliminateduplicates appearing in the subsequent lists (Kish 1965).
Solution 2. Adjust the sample of subsequent lists. Draw an indepen-dent sample from each list. Then check and eliminate in the sample ofany subsequent lists the elements that appear in the full previous lists(Kish 1965).
Solution at the Estimation Stage
Solution 1. Use weight adjustment. Reestimate the weights of the du-plicate listing to account for their higher probability of inclusion. If, forinstance, two independent samples A and B are drawn from two listswith probability fa and fb, all A sample elements that appear also in theB list should have a weight f = fa × fb (Kish 1965).15
Problem 3. Blanks or Foreign Elements
Blanks are frame elements without corresponding population elements,while foreign elements are units that belong to the frame but are outsidethe scope of the survey (Kalton 1983). In business surveys, this might bea company that went out of business but is still listed in the frame, or itcould be a company that is operating in an industry outside the researchinterest.
Solutions at the Design Stage
Solution 1. Ignore the selected element. The implication of this is thatthe total sample at the end of the survey will be lower than the desiredsize. As a consequence, if it is possible to estimate the proportion γ ofblanks and foreign elements in the frame, the sample size must be ad-justed as follows:
112 The Power of Survey Design
15 And, similarly, all B sample elements that appear in the A list.

One common mistake in this case is to replace the blank or foreignelement with the element next to it. This practice should be avoided be-cause it is nonrandom and assigns a higher probability of inclusion tothe elements next to the blanks and foreign (Kalton 1983).
Solution 2. Conduct a two-stage selection. In the first stage, a screen-ing interview is conducted to determine whether the sampled elementsexist and meet the objective of the study. Then a second selection is per-formed to determine a subsample of eligible elements. This approach isappropriate when only a small fraction of the population is of interest(Kalton 1983).
Problem 4. Clustering
Sometimes a listing of elements might include some clusters. In businesssurveys, this happens when a frame of establishments also includes firms(groups of establishments).
Solutions at the Design Stage
Solution 1. Take all elements in the cluster. This solution has the ad-vantage of being easily applicable. With this approach, each cluster ele-ment will have a probability of inclusion equal to the probability ofselection of the cluster itself. Hence, no reweighting is necessary. Thismethod presents two disadvantages:
• It generates higher variance the larger is the cluster and the higheris the intraclass correlation.
• It could generate response contamination if units in the same clus-ter are influenced by the other element’s responses. This is partic-ularly true for attitude questions.
Solution 2. Take only one element in the cluster. This subsamplingprocedure eliminates the above disadvantages, but carries its owndrawbacks. First, it is harder to implement, and second, it changes theprobability of selection of the elements and thus requires reweighting.The first drawback relates to which rule should be followed in the selec-tion of the single cluster element. To avoid selection bias, it is importantfor a random procedure be adopted. Kalton (1983) argues that it is un-realistic to rely exclusively on the interviewer’s ability and willingness to
′ =−( )nn
1 γ.
A Practical Approach to Sampling 113

apply a random process (that is, a table of random numbers). He or shemight inadvertently misapply this method and select the respondent onthe basis of his or her availability instead, without the researcher beingable to check the procedure adopted. To avoid this bias, a widely usedmethod is the Kish selection grid (table 4.2). This is an objective andcheckable procedure to select one respondent in a cluster while keepingequal probability of selection among the cluster’s elements. With thismethod, all eligible establishments in the cluster are first ordered on thebasis of some clear, precise, and objective measure (such as total sales,number of employees, and so on). In each questionnaire a table is printedinstructing the interviewer to select the respondent corresponding to aspecific position in the ordered list. In this way, the interviewer has nocontrol over the selection process. The randomness is introduced by thefact that different tables are printed on different questionnaires, each as-signing a different probability of selection and giving an overall equalprobability of selection for all elements (Kalton 1983).16 So, for instance,if the interviewer has a form with table C printed on it, when he or sheencounters a cluster with four eligible respondents, he or she will selectthe second element in the ordered list (table 4.2).
114 The Power of Survey Design
Table 4.2
Kish’s Selection Grid
Number of If Questionnaire Contains Table
Establishments A B C D E F G H
in Cluster Then Select the Establishment in Position
1 1 1 1 1 1 1 1 1
2 1 1 1 1 2 2 2 2
3 1 1 1 2 2 3 3 3
4 1 1 2 2 3 3 4 4
Share of questionnaires
containing each table 17% 8% 8% 17% 17% 8% 8% 17%
Source: Kish 1965.
16 As an alternative method, instead of printing the grid on each questionnaire, it can beprinted on a number of letters given at random to interviewers.

The adoption of this procedure changes the probability of inclusionof the cluster elements. Hence, at the estimation stage, the weightsmust be recalibrated. The probability of inclusion of element i is de-pendent not only on the probability of selection of the cluster but alsoon the total number of elements in the cluster. So the new probabilityis as follows:
where:
fc = probability of selecting the clusterfa = probability of selecting one unit a in the cluster of A elements.
The weight of ath element is thus:
Impact of Mergers, Acquisitions, and Separations on Sampling Weights
In business surveys, frame problems are particularly frequent becauseestablishments continuously change industry, form, and structure mak-ing the maintenance of an up-to-date listing extremely difficult. Hence,the sample designer must be particularly careful in identifying andhandling missing, blanks, duplicates, or clusters. In fact, what appearsto be a nonexisting establishment, in reality, could be a new establish-ment (or firm). The fact that establishments merge or split might givethe false appearance of blanks and duplicates. If not properly handled,these phenomena might taint the underlying weights assigned at thedesign stage.
Three general scenarios can happen: mergers, acquisitions, and sep-arations. In mergers and acquisitions two establishments,17 A and B,form a new establishment, C. Hence, A and B no longer exist and thenew establishment C incorporates the assets and liabilities of both Aand B. In these situations, depending on how up to date the frame is,
ω = =−fNAn
1 .
f f fnN Ac a= × = × 1
A Practical Approach to Sampling 115
17 In this discussion, we assume the establishment to be the unit of analysis as defined inbox 4.1.

different selection criteria should be adopted (see table 4.3). If theframe contains only one of the two original establishments, A or B, thenew establishment C can be included in the sample (linking methodol-ogy) without any weight adjustments. On the contrary, if a combina-tion of any of the two original establishments is in the frame—A and
116 The Power of Survey Design
Table 4.3
Frame Accuracy and Sampling Weights: The Case of Mergers, Acquisitions, andSeparations in Establishment Surveys
In the Event of: The Frame The Sample Unit WeightPhenomenon Includes: Designer Can: Adjustments
Source: Author’s creation.Note: Assuming a stratified simple random sampling of size nh in a population of Nh with corresponding weightsw=Nh/nh.a. This is preferable.b. This alternative is less desirable, because it implies C having a zero probability of selection.c. If the cluster has three elements, then wi=3Nh/nh.n.a. = not applicable.
Merger
Acquisition
Separations
A or B
A and B
A and C or
B and C
A and B
and C
A
A and B
A and C
A and B and C
Select C
Select C
Either treat A=blank (or B=blanka)
or select C
Either treat A=blank and B=blanka
or select C
Treat A as a
cluster:
Either treat A=blankb
or treat A as a cluster
Same as in example above, with C=B
Either treat A=blanka
or treat A as cluster
wa=wb=wc=Nh/nh
wc=Nh/2nh
n.a.
wc=Nh/2nh
n.a.
wc=Nh/3nh
wi=2Nh/nhc
wi=Nh/nh
n.a.
wi 2Nh/nh for i≠B or
2Nh/3nh for i=B
wi Nh/nh for i≠B
Nh/2nh for i=B
n.a.
wi=2Nh/3nh
wi=Nh/2nh
Select one of 2
Select all 2
Select one of 2
Select all 2
Select one of 2
Select all 2
�C
B
A
AB
C
CA
B
��
�
�
��
��
�
�

B, A and C, or B and C—then different selection criteria can beadopted, having a different impact on the unit weight. Thus if both Aand B are present in the listing, then C (the new establishment) must be
selected and the unit weight of C must be modified to , because Chad twice the probability of selection:18
where fC is the probability of selection of C.If A and C or B and C are included in the frame, then the designer has
two alternatives. One is to consider A (or B respectively) as blank. Thisis acceptable because C is present itself in the list and hence has a non-zero probability of selection, while A (or B) no longer exist and can beconsidered as frame problems (blank). No weight adjustment is neces-sary in this case. Alternatively, although A or B is randomly selected, thedesigner can choose to include C (the new establishment) in the sample(linking methodology discussed above). In this case, however, we needto adjust the sampling weight for C because it has twice the probability
of selection. Thus, the weight for C becomes as discussed
above. The decision on the approach to follow must be made before thesample is drawn. In fact, in our last example, if C is randomly drawnand either A or B are also in the frame, the weight of C will depend onwhether we consider A (or B) as blank, irrespective of whether they areactually drawn. For simplicity of calculation, it is recommended to con-sider A or B as blanks. In this scenario in fact C will have the sameweight as all other elements in the stratum and no weight adjustmentis needed.
The last case within mergers and acquisitions is when all three ele-ments, A, B, and C, are in the frame. Once again, the same logic applies.If we adopt (a priori) the policy of considering A and B as blanks, no ad-justment is necessary. If C is selected, then it is part of the sample, whileif A and/or B are drawn, they are dropped. Alternatively, if A and/or Bare selected and we link them to C (hence C is included in the sample although not directly selected), then we need to adjust the ωC because C
ωCh
h
Nn
=2
f f fnN
nN
nNC A B
h
h
h
h
h
h
= + = + = 2
Nn
h
h2
A Practical Approach to Sampling 117
18 Recall that the weight is the inverse of the probability of selection.
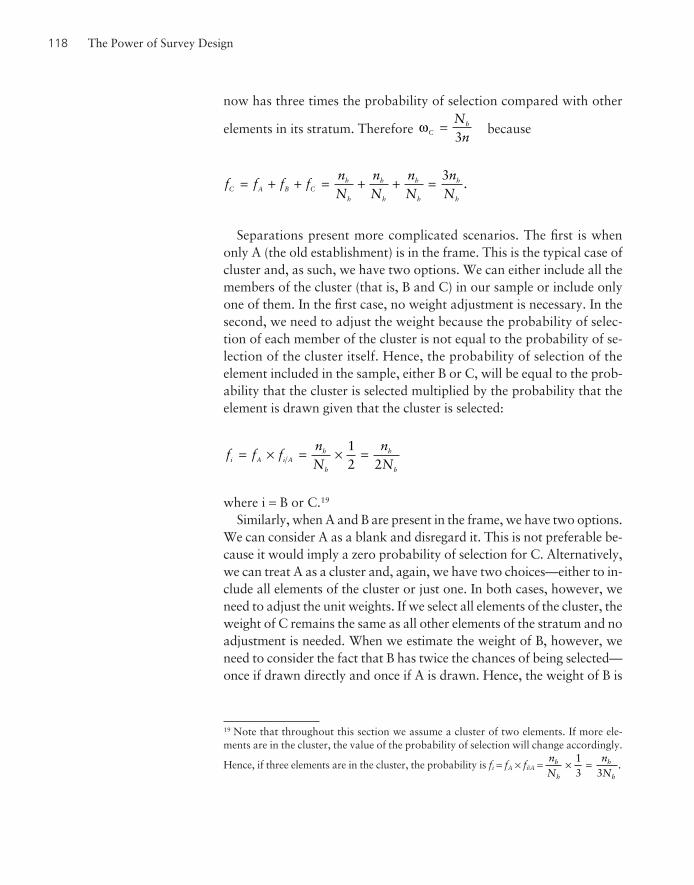
now has three times the probability of selection compared with other
elements in its stratum. Therefore because
Separations present more complicated scenarios. The first is whenonly A (the old establishment) is in the frame. This is the typical case ofcluster and, as such, we have two options. We can either include all themembers of the cluster (that is, B and C) in our sample or include onlyone of them. In the first case, no weight adjustment is necessary. In thesecond, we need to adjust the weight because the probability of selec-tion of each member of the cluster is not equal to the probability of se-lection of the cluster itself. Hence, the probability of selection of theelement included in the sample, either B or C, will be equal to the prob-ability that the cluster is selected multiplied by the probability that theelement is drawn given that the cluster is selected:
where i = B or C.19
Similarly, when A and B are present in the frame, we have two options.We can consider A as a blank and disregard it. This is not preferable be-cause it would imply a zero probability of selection for C. Alternatively,we can treat A as a cluster and, again, we have two choices—either to in-clude all elements of the cluster or just one. In both cases, however, weneed to adjust the unit weights. If we select all elements of the cluster, theweight of C remains the same as all other elements of the stratum and noadjustment is needed. When we estimate the weight of B, however, weneed to consider the fact that B has twice the chances of being selected—once if drawn directly and once if A is drawn. Hence, the weight of B is
f f fnN
nNi A i A
h
h
h
h
= × = × =12 2
f f f fnN
nN
nN
nNC A B C
h
h
h
h
h
h
h
h
= + + = + + = 3.
ωChNn
=3
118 The Power of Survey Design
19 Note that throughout this section we assume a cluster of two elements. If more ele-ments are in the cluster, the value of the probability of selection will change accordingly.
Hence, if three elements are in the cluster, the probability is fi = fA × fi|A =nN
nN
h
h
h
h
× =13 3
.

the inverse of the sum of the probability of A (the cluster) being selectedand the probability of B itself being selected is:
Conversely, if we select only one of the elements of the cluster, thenthe weight of the chosen element must be adjusted accordingly. If this
chosen cluster element is C, then the weight is because its
probability of selection is as follows:
If, however, the element drawn is B, then the unit weight of B is
because its probability of selection will depend on both A
being drawn and B itself being drawn:
Finally, if all three elements A, B, and C are in the frame, we havetwo options. We can treat A as a blank or treat A as a cluster. The firstoption is preferable because it will not taint the weights of the other el-ements and does not involve any weight adjustments. The second op-tion has two alternatives: we can select just one element of the clusteror all of them. If we chose only one, its weight will be estimated as theinverse of the following:
If we chose all elements of the cluster, then the weight of each of themis simply the inverse of the following:
for i = B or C.
f f fnN
nN
nNi A i
h
h
h
h
h
h
= + = + = 2
f f f fnN
nN
nNi A i A i
h
h
h
h
h
h
= × + = × + =12
32
.
f f f fnN
nN
nNB A B A B
h
h
h
h
h
h
= × + = × + =12
32
.
ωBh
h
Nn
= 23
f f fnN
nNC A C A
h
h
h
h
= × = × =12 2
.
ωCh
h
Nn
= 2
f f fnN
nN
nNB A B
h
h
h
h
h
h
= + = + = 2.
A Practical Approach to Sampling 119
Weight Adjustments and Poststratification
While it is not necessary to use weighted results with SRS and other epsemmethods, when stratified random sampling is adopted, results must beweighted if population parameters need to be estimated (box 4.3). In thiscase, sampling weights estimated at the design stage (called designweights) must be corrected to compensate for unit nonresponse andframe problems. Both of these phenomena can have a significant im-pact on the final sampling weights and must to be taken into accountat the end of the fieldwork.
Suppose the sampling strategy in a business survey is a stratified SRSwith proportional allocation. The strata are determined using sector (gar-ments and textiles), size (small, medium, and large), and location (northand south). Furthermore, as part of the sample design, some strata werecollapsed and large establishments were selected with certainty. The sam-ple structure and the estimated weights are summarized in table 4.4. Thedesign weights are estimated as the inverse of the probability of selection:
After the data collection is completed, the design weights need to beadjusted before the analysis can commence. The true weights (w) are ob-tained by multiplying the design weights (wDES) by an adjustment fac-tor for unit nonresponse (wRES) and an adjustment factor for frameproblems (wFP):
The unit nonresponse adjustment factor is calculated by estimating theproportion of the total sample that participated to the survey. Hence,
where:
nrh = number of respondents who participated in the survey and belong
to stratum h20
nh = number of sampled elements in stratum h at the design stage
wnnNR
h
hr
= .
w w w wDES NR FP= ∗ ∗ .
ωh hh
h
h
h
fnN
Nn
= =
=−
−
1
1
.
120 The Power of Survey Design
20 Note that this number includes all respondents to the survey, even those who are sam-pled in a different stratum than h (because if inaccurate classification) but belong to h.

A Practical Approach to Sampling 121
Box 4.3
Why it is Important to Use Weights with Stratified Sampling
Suppose the car company you work for wants to issue a warranty on transmissions. You are asked to estimate
the cost of such a warranty. To do so, you need to estimate at what mileage, on average, cars require transmis-
sion repair. Assume you have the list of car owners shown in box table 4.3.1, and your budget allows you to
sample nine elements. The true value, unknown to you and that you need to estimate, is 60,120 miles.
The first choice at your disposal is to follow a simple random sampling (SRS) methodology. From the
nine samples, you obtain an average value of 56,767 miles.
Nonetheless you have reason to believe from previous discussions with mechanics that transmissions
require repair earlier if the car is driven in rural areas than if it is driven in urban locations. Luckily your list
includes this information. You decide to sample the nine elements using stratified random sampling. Because
you suspect that in rural areas the variance of the parameter you want to estimate (repair mileage) is twice
as high as in urban locations, you decide to sample more cars in rural stratum (6) than in the urban stratum (3),
as described in box table 4.3.2.
Box Table 4.3.1
List of Car Owners
Repair Mileage Repair MileageCar ID (unknown) Location Car ID (unknown) Location
1 85,900 Rural 11 31,500 Urban
2 99,500 Rural 12 48,600 Urban
3 82,100 Rural 13 45,500 Urban
4 70,000 Rural 14 38,500 Urban
5 74,100 Rural 15 49,000 Urban
6 77,000 Rural 16 42,000 Urban
7 68,500 Rural 17 45,500 Urban
8 94,500 Rural 18 35,000 Urban
9 69,700 Rural 19 42,000 Urban
10 65,200 Rural 20 38,500 Urban
Average 60,120Source: Author’s creation.
(continued)

Estimating the adjustment factor for frame problems is more complex. Asmentioned earlier, four main categories of frame problems might occur:noncoverage, duplicates, blanks or foreign elements, and clustering.While blanks and foreign elements are dealt with at the design stage, clus-tering and duplicates have an impact on the weights of the individual sam-pling unit.21 Noncoverage, on the contrary, is a source of bias for the
122 The Power of Survey Design
With stratification, you can still estimate the mileage repair value by simple average over all nine observations.
The value obtained is 66,422, which is even less accurate than the value obtained using SRS. Hence, while using
the simple average with stratification improves the estimate of the parameter within each stratum, it biases its
estimate of the whole population. To obtain a more accurate estimate than SRS, we must use the weights. If
we do that we obtain a value of 60,317, which is closer to the true population than SRS (box table 4.3.2).
Box 4.3 (continued)
Box Table 4.3.2
Results Using Simple Random Sampling and Stratified Sampling
Simple Random Sampling Stratified Random Sampling
Repair RepairCar ID Mileage Stratum Car ID Mileage Weight
3 82,100 Rural 1 85,900 1.67
4 70,000 3 82,100 1.67
6 77,000 4 70,000 1.67
10 65,200 5 74,100 1.67
12 48,600 8 94,500 1.67
13 45,500 10 65,200 1.67
16 42,000 Urban 14 38,500 3.33
19 42,000 15 49,000 3.33
20 38,500 20 38,500 3.33
Average Simple average Weighted average
56,767 66,422 60,317
Source: Author’s creation.
21 The implications for weight adjustment have already been discussed in the text as wellas in table 4.3, so we are not including them again in this example.

Table 4.4
Sample Design: Stratified Sample Random Sampling
Stratum Sample Replace- Total Probability DesignStratum Stratification Criteria Size Size ments Sample of Selection Weight
Sector Size Location N0h n0
h Rh nh=n0h+Rh ps w=ps−1
A Garments Small North 1,000 76 24 100 0.10000 10.00
B Garments Small South 2,000 164 36 200 0.10000 10.00
C Garments Medium North 2,000 182 18 200 0.10000 10.00
D Garments Medium South 600 82 13 95 0.15833 6.32
E Garments Large North 200 200 0 200 1.00000 1.00
F Garments Large South 180 180 0 180 1.00000 1.00
G Textiles Small & Med. North 2,200 81 46 127 0.05773 17.32
H Textiles Small & Med. South 1,800 95 25 120 0.06667 15.00
I Textiles Large North 300 300 0 300 1.00000 1.00
K Textiles Large South 220 220 0 220 1.00000 1.00
Source: Author’s creation.

whole stratum. Two main noncoverage problems can take place: inaccu-rate coverage or incomplete coverage. Inaccurate coverage arises when anestablishment is listed in the frame but no longer exists. Incomplete cov-erage occurs when the frame is not updated and some establishments thatshould be listed in a specific stratum are instead listed in another stratum,with both strata included in the sample stratification. The adjustment fac-tor for frame problems (wFP) depends on both of these factors, and its es-timation is not trivial. The fact that an establishment cannot be locateddoes not necessarily mean that it went out of business. It is possible, forexample, that it moved to a different location within the study area, inwhich cases it should be included in the weight adjustments. The field-work can provide extremely useful information for their estimation.
This step (the estimation of the adjustment factor from frame prob-lems) requires the estimation of three parameters: (1) the proportion ofunits pout
h that are present in each stratum h but should not be because(a) they do not exist or exist outside the target population, noos
h ,22 or(b) they belong to other strata in the sample, nin
h ⇒ i; (2) the proportionof units that belong to h but are found in any of the other strata i ≠ h ofour target population, pin
i ⇒ h; and (3) the net rate of growth of each stra-tum since last update, gh. After these three values are determined, the ad-justment factor for frame problems is estimated as follows:
where:
While gh must be estimated on the basis of prior knowledge,23 andthe estimation of pout
h is pretty straightforward, pini ⇒ h is complicated
N N g p p N
pn
hPS
h h hout
i hin
ii h
hout h
oo
= × + −( ) +
=
⇒≠∑1
ssh iin
h
hoos
h
h iin
h
hoos
h iin
i
nn
nn
nn
p p
p
+ = + = +⇒ ⇒⇒
⇒⇒
⇒≠
≠
=∑∑h
ini hin
i h
ii h
n
n.
wNNFP
hPS
h
=
124 The Power of Survey Design
22 That is, they do not belong to any of the strata in our sample.23 Because we are interested in the net growth rate of the stratum, an analysis of the dynamicsof the population under study over the past few years might provide useful information.

A Practical Approach to Sampling 125
by the fact that units belonging to one stratum can appear in any otherstrata surveyed. This requires an accurate recording of what happensduring the fieldwork to properly reclassify the units and obtain correctweights.24
As an illustration of this methodology, let us assume for simplicitythat we have only the first three strata of table 4.4. After the fieldworkis completed, records indicate that (in stratum A) 85 establishments par-ticipated, 5 refused, and 10 were inaccurately classified (4 out of scopeand 6 belonging to other strata in the sample). Furthermore, because offrame inaccuracy, 60 establishments belong to stratum A, but they havebeen sampled in strata B and C as shown in table 4.5. Let us also assumea similar pattern for strata B and C, so that at the end of the fieldworkthe results are as shown in table 4.6.
After this is done, the final weights can be estimated as describedabove. Hence, for stratum A, the final weight is estimated as follows:
All other weights are shown in table 4.7.
w w w wDES NR FP= × × = × × =10 0 69 1 25 8 62. . .
wnnNR
h
hr
= =+ +
=10085 30 30
0 69.
wNNFP
APS
A
= = =12501000
1 25.
N N g p p NAPS
A A Aout
i Ain
ii A
= × + −( ) + = × +⇒≠∑1 1000 1 0.005 0 10−( ) +.
pn
ni Ain
i Ain
i A
ii A
⇒
⇒≠
≠
= = ++
=∑∑
30 30200 200
0 15.
pnnA
out Aout
A
= =+ +( ) =
4 1 5100
0 10.
24 To this end, appendix 7 reports the minimum amount of information to collect duringthe fieldwork to facilitate both weight adjustment and the compilation of figure 2.3 pre-sented at the end of chapter 2.
Example
+ 0.15 × 2000 = 1250

Table 4.5
Weight Adjustment Components for Stratum A
Inaccurate Incomplete Share of
From Stratum Sample Out of To Other Other Growth
Stratum Size Size Respondents Refusals Scope Strata Strata OOS INh—>i INi—>h Rate
N0h n0 nref noos nin
h—>i nini—>h poos
h pinh—>i pin
i—>h gh
A 1,000 100 85 5 4 to B 1 from B 30 0.04 0.06 0.15 0.05
to C 5 from C 30
B 1,000 200 to A 30
to C
C 1,000 200 to A 30
to B
Source: Author’s creation.

Table 4.6
Weight Adjustment Components for All Strata
Inaccurate Incomplete Share of
From Stratum Sample Out of To Other Other Growth
Stratum Size Size Respondents Refusals Scope Strata Strata OOS INh—>i INi—>h Rate
N0h n0 nref noos nin
h—>i nini—>h poos
h pinh—>i pin
i—>h gh
A 1,000 100 85 5 4 to B 1 from B 30 0.04 0.06 0.15 0.05
to C 5 from C 30
B 1,000 200 145 5 10 to A 30 from A 1 0.05 0.20 0.003 0.08
to C 10 from C 0
C 1,000 200 160 10 0 to A 30 from A 5 0.0 0.15 0.05 0.03
to B 0 from C 10
76 = 76
Source: Author’s creation.

Table 4.7
Estimation of Final Weights
Response FrameStratum Sample Share Share Growth Poststratification Design Adjustment Problem Final
Stratum Size Size of Out of In Rate Population Weight Factor Adj Factor Weight
N0h n0 pout
h pinh gh NPS wdes wres wfp w
A 1,000 100 0.10 0.15 0.05 1,250 10 0.69 1.25 8.621
B 1,000 200 0.25 0.003 0.08 840 5 1.37 0.84 5.753
C 1,000 200 0.15 0.05 0.03 1,030 5 1.14 1.03 5.886
Source: Author’s creation.

A Practical Approach to Sampling 129
Sampling in Practice: How to Maximize the SampleRepresentativeness while Minimizing the Survey Cost throughthe Use of Poststratification
A common challenge when designing a survey is the desire to analyzemany characteristics of the population.25 Because of budget and timeconstraints, it is not possible to guarantee a certain level of precisionand confidence for all of these dimensions. What this practical exampleproposes is to address this problem through the careful choice of keystrata in drawing the sample and the use of poststratification. Thesetechniques allow for a degree of redesigning of the sample distribution,after the survey is completed, to maintain a predetermined level of pre-cision for different dimensions of analysis within the fixed sample size.
Let us assume that we have obtained or compiled data on the popu-lation of manufacturing establishments. The frame list includes the fol-lowing: (1) sector of activity, (2) location—region, and (3) size—numberof employees. The population distribution is presented in table 4.8.Sampling can be designed in the following six steps.
Steps in Sampling Design
Step 1. Determine the sampling parameters. The size and compositionof the sample will depend on three factors:
• The objective of the study,26
• The available budget, and• The desired level of precision and confidence.
Let’s assume that we want to compare characteristics of the Invest-ment Climate environment across locations, as well as estimate the de-terminants of firm productivity across sectors. Let’s further supposethat the available budget allows for a sample size of approximately 850establishments. Finally, let’s assume that we wish to reach a level of sta-tistical significance corresponding to 90 percent confidence and 5 per-cent precision.27
25 In an Investment Climate Survey, it is often of interest to analyze the business climateacross location, size of firms, sector, export orientation, foreign ownership, and so on.26 The objective of the study will determine the size of the target population and the char-acteristic of analysis.27 The parameters we wish to estimate are proportions, thus we use the correspondingformula described in the SRS methodology.

130 The Power of Survey Design
Step 2. Divide the population in strata and estimate different samplingschemes. Given that the characteristics of interest are location and sec-tor, we need to stratify the population by each of them separately.Afterward, using table 4.9, we can determine the minimum sample sizeneeded to reach the desired level of statistical significance.
In our example, let’s start with a stratification by sector. Because thepopulation includes 21 sectors, we will have 21 strata (table 4.8). Giventhe desired level significance, we can use table 4.9 to calculate the min-
Table 4.8
Population Distribution by Sector, Region, and Size
By Region
Central North 490
Highland 250
Mekong River Delta 1,361
North East 661
North West 78
Red River Delta 3,705
South East 5,466
Southern Central Coastal 746
Grand Total 12,757
By Size
Small 9,355
Medium 3,086
Large 316
Grand Total 12,757
By Sector
1 Apparel 1,070
2 Basic metals 235
3 Chemical & chemical products 588
4 Electrical machinery 238
5 Electronics 134
6 Food & beverage 2,348
7 Furniture 727
8 Leather products 370
9 Machinery and equipment 400
10 Medical equipment 53
11 Metal products 1,182
12 Motor vehicles 208
13 Nonmetallic mineral products 1,220
14 Other transport equipment 366
15 Paper 599
16 Publishing 438
17 Rubber & plastic products 766
18 Textiles 611
19 Tobacco 24
20 Wood & wood products 904
21 Other (unclassified) 276
Grand Total 12,757
Source: Author’s calculations.

Table 4.9
Sample Size Requirements for 90 Percent Confidence Interval
SIZE OF POPULATION
50 100 200 300 500 750 1,000 2,000 3,000 5,000 10,000 100,000 1,000,000
MINIMUM SAMPLE SIZE NEEDED
10.0% 29 41 52 57 61 64 65 67 68 69 69 70 70
7.5% 36 55 77 88 99 106 110 117 119 121 122 124 124
7.0% 37 59 83 97 111 120 125 133 136 138 140 142 142
6.5% 38 62 90 106 124 135 142 152 156 160 162 165 165
6.0% 40 66 98 118 140 154 162 177 182 186 190 193 194
5.5% 41 70 107 130 158 176 187 207 214 220 225 230 230
5.0% 42 74 116 145 179 203 218 245 255 264 271 278 279
4.0% 45 81 137 178 233 276 304 358 380 401 418 434 436
3.0% 47 89 159 216 304 381 437 558 616 671 719 769 774
2.0% 49 95 179 256 389 524 635 931 1,102 1,292 1,484 1,713 1,740
1.0% 50 99 194 288 467 677 875 1,554 2,097 2,912 4,108 6,518 6,924
Source: Author’s calculations.Note: Assumes highest level of variance within the population.
DES
IRED
LEV
EL O
F PR
ECIS
ION

132 The Power of Survey Design
imum sample size for each stratum. Assuming for the moment that thereare no budget constraints, if we aim for a sample representative of all21 sectors, we would need a sample of 3,436 elements, out of a popu-lation of 12,575. Similarly, if our target is a sample representative of allof the regions in the country, we would need a sample of 1,526 units(table 4.10).
Unfortunately, budget constraints rarely allow such a freedom. Tomeet our budget constraint of approximately 850 units, we can adoptone, or a combination, of the following two strategies:
• Merge strata28 so that we shrink the overall number of strata, or• Eliminate strata from our population frame.
Each of these strategies has its disadvantages. While combining stratamight compromise the meaningfulness of sectoral comparisons, remov-ing strata lessens the representativeness of the sample at the nationallevel. The best approach is probably a combination of the two. Somestrata are merged while others are kept in the stratification. This ap-proach has the advantage of allowing both national as well as sectoralanalysis while keeping the sample size at a reasonable level.
The sample designer must weigh the benefits and costs of these ap-proaches. Assuming we decide to follow the second strategy, we must de-cide which sectors and/or locations to keep in the target population.29 Inreaching this decision, a number of factors must be taken into account,including the following:
• The importance of these sectors within the objective of the study. Ifthe purpose of the study is to estimate productivity by focusing onthe most important sectors, then the least important sectors withinmanufacturing should be dropped.
• The distribution of firms by other relevant dimensions (for ex-ample, location, size, ownership, and so on). To the extent thatother dimensions are of analytical interest, the sectors included inthe target population should include these dimensions. More specif-ically, if we wish to estimate the impact of Investment Climate vari-
28 The sample designer should remember that the definition of strata is dependent on itsanalytical purpose. Hence, strata can be combined if appropriate to the purpose of study.29 In our case, only sector appears to be the binding constraint. After we eliminate someof the sectors in our target population, the total population in terms of location and own-ership will also decrease. Hence the corresponding sample sizes will go below or fall nearthe 800 mark.

Table 4.10
Stratification and Required Sample Size for 90 PercentConfidence and 5 Percent Error
By Sector Population Required Sample
Apparel 1,070 221
Basic metals 235 128
Chemical & chemical products 588 189
Electrical machinery 238 128
Electronics 134 91
Food & beverage 2,348 249
Furniture 727 202
Leather products 370 159
Machinery and equipment 400 164
Medical equipment 53 45
Metal products 1,182 226
Motor vehicles 208 119
Nonmetallic mineral products 1,220 227
Other transport equipment 366 158
Paper 599 190
Publishing 438 170
Rubber & plastic products 766 204
Textiles 611 191
Tobacco 24 22
Wood & wood products 904 213
Other (unclassified) 276 139
Total 12,757 3,436
By Region Population Required Sample
Central North 490 178
Highland 250 132
Mekong River Delta 1,361 231
North East 661 196
North West 78 61
Red River Delta 3,705 259
South East 5,466 265
Southern Central Coastal 746 203
Total 12,757 1,526
Source: Author’s calculations.

134 The Power of Survey Design
ables on firm performance in different locations, then the sectorsincluded in the target population must be present in these locations.
• The ability to perform international comparisons at the sectorallevel. If in the comparator countries some sectors have alreadybeen covered, then the same sectors must be included in the tar-get population.
• The required sample size and replacements. Because of nonresponseand frame problems, a number of elements to draw from the popu-lation frame must be higher than the actual desired sample size.
Although it would be impractical to show all possible scenarios, let’ssuppose we decide to adopt employment contribution as selection crite-rion. As table 4.11 shows, it appears that Mekong River Delta, Red RiverDelta, South East, and Southern Central Coastal are the most importantlocations, covering close to 90 percent of employment. Similarly apparel,food and beverages, leather products, nonmetallic mineral products, andtextiles are the sectors with the highest concentration of employment(close to 70%).
If we limit our target population to these four regions and five sectors,we can reestimate the minimum required sample size (table 4.12). Whilethe stratification by location is within budget, the minimum requiredsample size by sector does not meet our budget constraint. Unless we canfind additional funds, we need once again to trim the number of strata(or to combine some of them) until we reach a sample size within bud-get, while we remain satisfied with the sectoral and location coverage.
Step 3. Reconcile and select the strata sampling strategy to implementin the field. Suppose we have decided to keep the four most important lo-cations, as well as four out of the five of the sectors previously identified.Our final target population is presented in table 4.13.30 The next ques-tion is which stratification to implement in the field out of the two pos-sible alternatives—sector or location. This choice is important becausethe stratification criteria implemented in the field is the only one forwhich we can directly control the level of statistical significance desired.31
30 Although the employment contribution of nonmetallic products is slightly higher thantextiles, the decision to keep the latter might be determined by other considerations, suchas the ability to use textiles in international comparisons.31 The other stratification, which we will reconstruct at the end of the fieldwork (see step 6),will have a level of significance determined indirectly by the number of elements that fallin that stratification.

If we were to implement a stratification by sector the expected sam-ple distribution by location would be as shown in table 4.14. Becausewe would randomly select elements within each sector, the expecteddistribution of our sampled elements by location will be approximatelyproportional to the underlying population distribution. Consequently,because we cannot directly control the number of elements that will fallin each of the location strata, the expected levels of precision by locationwill slightly differ from the desired levels of 5 percent.
Table 4.11
Employment Contribution by Sector and Location
By Sector
Apparel 17%
Basic metals 1%
Chemical & chemical products 3%
Electrical machinery 3%
Electronics 1%
Food & beverage 15%
Furniture 5%
Leather products 19%
Machinery and equipment 2%
Medical equipment 0%
Metal products 3%
Motor vehicles 1%
Nonmetallic mineral products 8%
Other transport equipment 3%
Paper 2%
Publishing 1%
Rubber & plastic products 4%
Textiles 7%
Tobacco 1%
Wood & wood products 4%
Other (unclassified) 2%
By Location
Central North 3%
Highland 1%
Mekong River Delta 7%
North East 5%
North West 0%
Red River Delta 24%
South East 52%
Southern Central Coastal 7%
Source: Author’s calculations.
A Practical Approach to Sampling 135

136 The Power of Survey Design
Table 4.13
Final Target Population (Four Regions and Four Sectors) and Required Sample Size
Stratification by Location
Required Sample
Mekong River Delta 195
Red River Delta 197
South East 219
Southern Central Coastal 120
Stratification by Sector
Required Sample
Apparel 219
Food & beverage 245
Leather products 157
Textiles 184
Source: Author’s calculations.
Table 4.12
Target Population (Four Regions and Five Sectors) and Required Sample
Region SouthernMekong Red River South Central Required
Sector River Delta Delta East Coastal Total Sample
Apparel 45 280 650 50 1,025 219
Food & beverage 817 374 699 152 2,042 245
Leather products 13 83 256 7 359 157
Nonmetallic mineral 153 315 444 65 977 217
Textiles 28 222 270 23 543 184
Grand Total 1,056 1,274 2,319 297 4,946 1,023
Required Sample 221 229 249 144 842 total
Source: Author’s calculations.
Similarly, if we were to implement stratification by location, the ex-pected sample distribution by sector is also shown in table 4.14.
At this point, if we are satisfied with the expected levels of precision,we can proceed to the next step and implement the stratification bysector (or location). If, however, we want to increase the expected levelof precision of, say, the stratification by location, we have two options:
• We can oversample some sector strata to increase the number ofelements that would fall in the desired locations.

• We can perform an additional stratification and directly control thenumber of observations in each new stratum.
In most cases, the first option is hard to implement. Because distribu-tions are often skewed the required oversample could be high.32 For in-stance, if we want to obtain more observations in Southern CentralCoastal, we could oversample the sector that has the highest concentra-tion in that location (food). This approach, however, will not guaranteethe desired location sample size of 120 unless we increase the sample sizefor food dramatically, which would have obvious implications for ourbudget.33
A Practical Approach to Sampling 137
Table 4.14
Expected Sample Sizes and Levels of Statistical Significance
When Sectoral Stratification is Implemented
Required Expected Sample Expected Level ofSamplea Distribution Precisionb
Mekong River Delta 213 123 7.0%
Red River Delta 216 216 5.0%
South East 243 427 3.6%
Southern Central Coastal 127 40 12.0%
When Location Stratification is Implemented
Required Expected Sample Expected Level ofSamplea Distribution Precisionb
Apparel 219 185 5.60%
Food & beverage 245 451 3.50%
Leather products 157 59 10%
Textiles 184 104 7.40%
Source: Author’s calculations.a. To reach 5 percent precision.b. Keeping the 90 percent level of confidence.
32 Recall that with this approach we oversample only the sector strata. Consequently, wehave only an indirect control on the desired level of precision for location.33 To ensure a sample of 120 in the Southern Central Coastal, we need to increase thesample size of food by more than 700 percent (that is, we need to sample 1,600 elementsinstead of 245).

The second option is more viable. It consists in performing an addi-tional stratification and then assigning a number of elements withineach double-strata to approach a desired level of precision for both sec-tor and location. For example, let’s assume we first stratify by sector andthen stratify each sector by location as shown in table 4.15. We nowhave 16 strata. When assigning the sample elements to each sector stra-tum, we can now directly control the total number of elements in eachsector-location stratum. This does not violate sampling protocol as longas the final selection of each individual element within each stratum remains random. Hence, in apparel, instead of selecting randomly219 elements (which would give us the random distribution describedin table 4.15, column 7), we can now directly assign the 219 elementsto each of the four locations within apparel. To approach the desireddistribution within each location, our goal is to assign more observa-tions to Mekong River Delta and Southern Central Coastal while re-ducing the sample size in South East.34 The final sample distribution isshown in the final column of table 4.15.35
The reassignment of sample units in the second stratification is not al-ways easy. Note that, in our case, we oversampled the second sector toget as close as possible to the desired level of precision at the locationlevel while meeting all the other constraints. Our final sample increasedto 850 elements distributed in 16 strata (final column of table 4.15). Theexpected level of precision for location increases now to 6.1 percent inSouthern Central Coastal (down from 12 percent), 5.7 percent inMekong River Delta, and 4 percent in South East.
A similar approach can be followed if we have other dimensions (forexample, size) for which we wish to ensure a level of precision ex ante.Suppose we are concerned that large firms might be underrepresented inthe final sample because of their skewed distribution. If this is the case,we can envisage two situations:
• We are satisfied with the expected level of precision of location, butwe are concerned about the expected precision by size alone. Then
138 The Power of Survey Design
34 Note that in Red River Delta, because the number of observations in the sector strati-fication is exactly equal to the expected number of observations by location, we leave thesample size as it is.35 Note that although we have some flexibility in reassigning observations between strata,we still have a number of constraints to meet, including the availability of replacements.In textiles, for example, even if we wish to reduce the sample size for the South-East, wecannot increase any other location because we would run out of replacements.

Table 4.15
Stratification by Sector and Location
First Level of Stratification Second Level of Stratification
Expected Sample Size in Case of Direct
Random Selection Imputation Strata within the Whole of Sample No. Sector Population Sample Location Population Sector Size
(1) (2) (3) (4) (5) (6) (7) (8)
1 Mekong River Delta 45 10 30
2Apparel 1,025 219
Red River Delta 280 60 60
3 South East 650 139 103
4 Southern Central Coastal 50 11 26
5 Mekong River Delta 817 98 118
6Food & beverage 2,042 245
Red River Delta 374 45 45
7 South East 699 84 68
8 Southern Central Coastal 152 18 59
9 Mekong River Delta 13 6 8
10Leather products 359 157
Red River Delta 83 36 36
11 South East 256 112 109
12 Southern Central Coastal 7 3 4
13 Mekong River Delta 28 10 17
14Textiles 543 184
Red River Delta 222 75 75
15 South East 270 92 78
16 Southern Central Coastal 23 8 14
806 807 850
Source: Author’s calculations.Note: Values might not add up exactly because of rounding.

140 The Power of Survey Design
we can use size as the dimension for the second stratification, ex-actly as shown above.
• We are concerned about the expected level of precision of both lo-cation and size. In this case, we should first estimate the expectedlevel of precision by sector corresponding to a double stratificationlocation-size. If this is satisfactory, then we proceed with the loca-tion-size stratification as shown above, disregarding sector. If wecannot exclude sector from the stratification, then we need to adda third level of stratification and follow the same methodology aspresented above.
Step 4. Implement the sampling strategy. After the sample strategy hasbeen finalized, the actual number of elements to be drawn from the un-derlying population will have to be adjusted to take into account twomain factors:
• The accuracy of the population frame, and• The expected nonresponse rate.
Often the available frame lists are old and inaccurate. Furthermore,not all selected respondents will participate in the survey. For these rea-sons an estimated inaccuracy rate and refusal rate must be incorporatedin the calculation of the final number of elements to be drawn in eachstratum. Assuming an average inaccuracy rate of 5 percent and a re-fusal rate of 50 percent (equally distributed across strata), then the totalnumber of elements to be drawn must be adjusted accordingly (seetable 4.16).36
After the total number of elements has been determined, the elementsmust be drawn from the population frame randomly and in one draw(see box 4.4). The sample and replacements must be selected at thesame time to ensure that each element within each stratum has the sameprobability of selection. During the fieldwork, the order in which theinterviews are conducted is important. First, all the elements in the sam-ple must be interviewed. Then each of the respondents that does notexist (frame problem) or refuses to participate (nonresponse) has to besubstituted in the exact order in which they appear in the drawing.
36 Note that in the first strata, because the estimated number of sample + replacements isslightly higher than the population, all the elements of the strata will be included in thesample. It is nevertheless important to sample them, because the order of interviewing iscritical.

Table 4.16
Sample, Replacements, and Total Elements to Draw
First Level of Stratification Second Level of Stratification
Strata Population Total No. of No. Sector Location Population Adjusteda Sample Replacements Elements to Draw
1 Mekong River Delta 45 43 30 13 43
2Apparel
Red River Delta 280 279 60 30 90
3 South East 650 649 103 52 155
4 Southern Central Coastal 50 49 26 13 39
5 Mekong River Delta 817 816 118 59 177
6Food & beverage
Red River Delta 374 373 45 23 68
7 South East 699 698 68 34 102
8 Southern Central Coastal 152 151 59 30 89
9 Mekong River Delta 13 12 8 4 12
10Leather products
Red River Delta 83 82 36 18 54
11 South East 256 255 109 55 164
12 Southern Central Coastal 7 6 4 2 6
13 Mekong River Delta 28 27 17 9 26
14Textiles
Red River Delta 222 221 75 38 113
15 South East 270 269 78 39 117
16 Southern Central Coastal 23 22 14 7 21
850 423 1,273
Source: Author’s calculations.a Note the adjustment is only for frame problems (inaccuracy of listing).

142 The Power of Survey Design
Box 4.4
Using SAS to Draw Samples
Modern computing technology has made it easy to perform the actual drawing of sample elements. As for
other software programs, SAS has simple commands to randomly select sample elements for a variety of
sample designs: simple random sampling (SRS), stratified sampling, systematic sampling, and probability
proportional to size (PPS).
(1) Simple random sampling. Assume the population frame is stored in the file “frame” and we wish to
draw an SRS of n = 12 elements. The commands needed in SAS are as follows:
proc surveyselect data=frame method=srs n=12 out=sampleSRS;
run;
(2) Stratified sampling. Suppose we have designed a stratification and the file “frame” contains a strata
variable (industry). We can then perform the following:
(a) Equal allocation with n = 4 in each stratum
proc surveyselect data=frame method=srs n=4 out=sampleESTSRS;
strata industry;
run;
(b) Proportionate allocation with a common rate of 20 percent in each stratum
proc surveyselect data=frame method=srs rate=.20
seed=1953 out=samplePSTR;
strata industry;
run;
(c) Disproportionate allocation with a n1 = 3, n2 = 5, and n3 = 4:
proc surveyselect data=frame method=srs n=(3,5,4) out=sampleDSTSRS;
strata industry;
run;
(3) Systematic sampling. Suppose we wish to draw a systematic sample with a sampling rate of one-
quarter. In SAS, the commands to use are as follows:
proc surveyselect data=frame method=sys samrate=0.25 out=samplePPS;
run;
(4) Probability proportional to size. Suppose you wish to obtain a sample with PPS allocation, with n = 9
and ‘labor’ being the size variable. The SAS commands are as follows:
proc surveyselect data=frame method=pps n=9 out=samplePPS;
size labor;
run;

Hence if, say, strata 1 include 30 sample elements and 13 replacements,if respondent number 3 refuses to participate, he or she will have to besubstituted with element number 31 and so on. It is now obvious howimportant it is to accurately estimate the inaccuracy and nonresponserate before the drawing of the elements. After the list of drawn ele-ments is exhausted, we cannot draw additional elements from the origi-nal population frame without changing the probability of selection ofthe elements, making the calculation of weights extremely difficult.
Step 5. Estimate the weights. After the sample size has been determined,the weights can be estimated (design weights), as shown in table 4.17.37
At the end of the fieldwork these design weights must be adjusted as de-scribed above to obtain the final weights.
Step 6. Perform the poststratification. In our example, the finalweights refer to the double stratification, sector-location. With respectto these two dimensions, we can make statistically significant inferencesat any time without any further adjustment. However, if we wish tomake statistically significant inferences with respect to dimensions notexpressly included in the sample design, we need to “poststratify” thesample distribution and estimate the corresponding sample weights.
Poststratification means stratifying after the fieldwork has been com-pleted. To poststratify we need to know the population of the dimensionof interest. Let’s assume that we want to poststratify our population byownership status—foreign direct investment (FDI) and private. For eachstratum, we need to identify the population and the sample correspond-ing to the new dimension and then estimate the weights in the usual way.Table 4.18 shows the distribution of strata (32) with the relevant infor-mation on population, sample, and weights. These new weights can nowbe used to make statistically significant inferences on ownership status ofour target population.
A Practical Approach to Sampling 143
37 The weights are the inverse of the probability of selection (w=N/n, where N=popula-tion and n=sample within each stratum).

Table 4.17
Final Sample and Weights
Strata Original Final Design Final FinalNo. Sector Location Population Populationa Sample Weight Sample Weights
1 Mekong River Delta 45 45 30 1.500 30 1.500
2Apparel
Red River Delta 280 280 60 4.667 60 4.667
3 South East 650 650 103 6.311 103 6.311
4 Southern Central Coastal 50 50 26 1.923 26 1.923
5 Mekong River Delta 817 817 118 6.924 118 6.924
6Food & beverage
Red River Delta 374 374 45 8.311 45 8.311
7 South East 699 699 68 10.279 68 10.279
8 Southern Central Coastal 152 152 59 2.576 59 2.576
9 Mekong River Delta 13 13 8 1.625 8 1.625
10Leather products
Red River Delta 83 83 36 2.306 36 2.306
11 South East 256 256 109 2.349 109 2.349
12 Southern Central Coastal 7 7 4 1.750 4 1.750
13 Mekong River Delta 28 28 17 1.647 17 1.647
14Textiles
Red River Delta 222 222 75 2.960 75 2.960
15 South East 270 270 78 3.462 78 3.462
16 Southern Central Coastal 23 23 14 1.643 14 1.643
Source: Author’s calculations.a. This adjustment must include both frame problems because of inaccuracy and expected growth rate of stratum.

Table 4.18
Poststratification by Ownership
Sample Design Poststratification
Strata Final Final Final PostNo. Sector Location Population Sample Weight Strata Population Sample Weights
1 Mekong River 45 30 1.500 Private 35 25 1.400
2 Delta FDI 10 5 2.000
3 Red River 280 60 4.667 Private 220 50 4.400
4Apparel
Delta FDI 60 10 6.000
5 South East 650 103 6.311 Private 510 80 6.375
6 FDI 140 23 6.087
7 Southern 50 26 1.923 Private 35 25 1.400
8 Central Coastal FDI 15 1 15.000
9 Mekong River 817 118 6.924 Private 615 84 7.321
10 Delta FDI 202 34 5.941
11 Red River 374 45 8.311 Private 194 39 4.974
12Food & beverage
Delta FDI 180 6 30.000
13 South East 699 68 10.279 Private 618 59 10.475
14 FDI 81 9 9.000
15 Southern 152 59 2.576 Private 102 25 4.080
16 Central Coastal FDI 50 34 1.471
17 Mekong River 13 8 1.625 Private 13 8 1.625
18 Delta FDI 0 0 —
19 Red River 83 36 2.306 Private 75 29 2.586
20Leather products
Delta FDI 8 7 1.143
21 South East 256 109 2.349 Private 220 57 3.860
22 FDI 36 52 0.692
23 Southern 7 4 1.750 Private 7 4 1.750
24 Central Coastal FDI 0 0 —(continued)

Table 4.18 (continued)
Poststratification by Ownership
Sample Design Poststratification
Strata Final Final Final PostNo. Sector Location Population Sample Weight Strata Population Sample Weights
25 Mekong River 28 17 1.647 Private 28 17 1.647
26 Delta FDI 0 0 —
27 Red River 222 75 2.960 Private 188 61 3.082
28Textiles
Delta FDI 34 14 2.429
29 South East 270 78 3.462 Private 220 66 3.333
30 FDI 50 12 4.167
31 Southern 23 14 1.643 Private 23 14 1.643
32 Central Coastal FDI 0 0 —
Source: Author’s calculations.Note: FDI = Foreign direct investment. — = Not applicable.

It would be too simplistic to assume that the success ofa survey interview rests solely on the interaction be-
tween respondent and interviewer and on the ability of the latter to re-cruit the former. The survey interview is the end result of many factors,visible and not, interacting well before the interviewer and the respon-dent meet. It is the role of the survey manager to understand these fac-tors, analyze them, determine the most influential in each environment,and coach interviewers about how to handle them to ensure the high-est level of survey participation.
Factors Affecting Participation
Three broad factors contribute to the success of any survey interview:the social environment, the survey design, and the respondent’s state ofmind (figure 5.1). Their interaction generates positive and negativeforces toward the survey interview that will ultimately have an impacton the quantity and quality of the data collected.
Social Environment
Two sociodemographic factors present in the social environment influ-ence survey participation: social responsibility and social cohesion. Thesefactors characterize the environment in which the survey takes place. Thesense of social responsibility felt by the manager who is approachedwith the request for a survey interview, as well as the perceived legiti-macy of social institutions and of the survey itself, will determine his orher predisposition toward the study (Groves, Cialdini, and Couper1992). What motivates a business person in Germany is very likely dif-ferent from what motivates a business person in Ethiopia. Under-standing the extent to which these factors operate will determine theappropriate strategy.
Unfortunately, only rarelydo interviewer recruitsreceive training [. . .] inmaximizing the odds of a‘yes’ over all contacts.Instead, they are trained instock descriptors of thesurvey leading to the firstquestion of the interview.
—R. M. Groves, R. B. Cialdinia,and M. P. Couper,
“Understanding the Decision toParticipate in a Survey”
Reduc[ing] interviewing toa set of techniques is [. . .]like reducing courtship to aformula.
—Lewis A. Dexter,Elite and Specialized Interviewing
Chapter 5
Respondent’s Psychology and Survey Participation
147

Survey Design
Survey design calls for a number of different choices regarding the sur-vey methodology, the unit of investigation, and the interviewer’s char-acteristics,1 all of which have a different bearing on strategies to elicit
148 The Power of Survey Design
Figure 5.1.
Factors Affecting Survey Participation
Social environment(social responsibility and social cohesion)
Mode of contactRespondent selectionLength of questionnaireTopic
AgeGenderIncomeHealthEducationExperience
ReciprocationConsistencySocial validationAuthorityScarcityLiking
AngerHappinessSadness
Environment
AppearanceExperienceExpectationsMood
Method
Respondent
Physicalenvironment
Interviewer
Compliance
Helping
Opinionchange
Survey participation
Intrinsic features of argument
Extrinsic features of argument
Respondent psychologySurvey design
Source: Author’s creation.
1 Groves, Cialdini, and Couper (1992) also identify location as a factor. Contrary toother surveys (for example, household surveys), the physical location of the interview haslittle relevance in business surveys. In fact, they are generally conducted during businesshours in the offices of the establishment being interviewed. Only worker surveys (occa-sionally conducted as part of an Investment Climate Survey) might be influenced by thelocation and the presence of other people.
participation. Major attributes of survey methodology that have an im-pact on survey participation are the mode of initial contact, the personwho makes the initial contact, the length of the interview, and the topicof the survey. Different strategies have been employed by survey prac-titioners as a mode of initial contact to foster participation. They in-volve the use of advance letters, the payment of incentives, the offer ofbrochures or other scripts, and the timing of contact (Groves, Cialdini,and Couper 1992). It is not clear whether the use of advance letters hasa positive impact on participation. Dillman, Gallegos, and Frey (1976)show that these letters improve responses, while Singer, Van Hoewyk,and Maher (2000) find no significant impact. What is evident from theliterature (Goyder 1985; Heberlein and Baumgartner 1978) is that thenumber of times the respondent is contacted has a significant impacton his or her decision to participate. As a consequence, the use of ad-vance letters to introduce the respondent to the upcoming business sur-vey and to base its legitimacy should be encouraged, but it should notreplace a personal visit by the interviewer. Introductory letters shouldbe used only to provide advance notice and build the legitimacy of thestudy. Introductory letters should not request participation; this taskshould be left to a personal contact. The letter should be brief. It shouldmake reference to the sponsors (to build legitimacy) and include contactnames and phone numbers. It should also highlight the purpose of thesurvey (to arouse interest), while mentioning its unique characteristicsand practical benefits.2 While the letter should be addressed to the mostsenior executive in the company, it is unlikely, especially in large firms,that the company president will grant an interview. He or she might del-egate another well-qualified executive to answer on his or her behalf(Kincaid and Bright 1957). The letter may indicate that an interviewerwill follow up with a call to schedule an appointment. When schedulingthe appointment, avoid expanding on the survey’s description because itis more difficult to elicit participation on the phone (Atkinson 1971).
As expected, the payment of incentives does have a positive effecton participation (James and Bolstein 1992; Singer, Van Hoewyk, andMaher 1998; Singer, Van Hoewyk, and Maher 2000; Willimack,
Respondent’s Psychology and Survey Participation 149
2 Other issues, such as confidentiality concerns, anonymity, sampling, and length are bet-ter addressed in the face-to-face visit by the interviewer. Sobal (1984) conducted an in-teresting review of the information disclosed in 78 survey introductions used in mailedquestionnaires by members of the American Association of Opinion Research. Heshowed that although the majority of the introductory statements contain informationon the research organization, the study director’s name, and the research topic, less thanhalf of them mentioned the sponsor and issues of confidentiality (see appendix 6).
Advance Letters
Incentives

Schuman, Pennell, and Lepkowski 1995). The impact is small—5 percentadditional participation in face-to-face interviews—and has been proveneffective only on the first visit (Willimack and others 1995). Although thepayment of monetary incentives does not appear to bias data quality(Singer, Van Hoewyk, and Maher 2000; Willimack and others 1995), theactual payment of money poses ethical and practical problems.3 Further-more, the payment of incentives has been proven to be counterproductiveif participation is not secured on the first visit (James and Bolstein 1990;Willimack and others 1995). In business surveys, such as the InvestmentClimate Surveys, it is advisable to use nonmonetary incentives, such asbrochures and other scripts, which highlight the practical benefits of thesurvey to the individual respondent and emphasize the use of the data col-lected and the impact of previous studies (Gower 1993).
Finally, the timing of the interview is another factor to keep in mindwhen scheduling visits. Tax time, religious holidays, vacation time, andperiods of economic downturn might make the interviewer’s task evenharder and could have a discouraging effect on the participation rate.
The correct identification of the person of first contact is also criticalfor the success of participation. It is important that the selection of therespondent be based on two criteria: the person who is eligible to answerthe questions and the person who has the authority to direct other re-spondents to participate (Groves, Cialdini, and Couper 1992).4
The length of the questionnaire is another factor occasionally pre-sented as influencing the success of the interview, because it is taken as anindicator of the burden posed on the respondent (Groves, Cialdini, andCouper 1992). As pointed out in chapter 3, however, there is no clear em-pirical evidence that the survey length is a factor influencing participa-tion. An experiment conducted on 700 respondents clearly showed that
150 The Power of Survey Design
3 These problems relate to who should receive the incentive and how large it should be.Should all participants receive it or only those who first refuse to participate? This deci-sion might have an impact on the sample composition (see Singer, Van Hoewyk, andMaher 2000). Is the actual payment of a monetary incentive allowed by the rules gov-erning the funding of the study? How large should the optimal incentive be consideringthe socioeconomic characteristics of the respondents? All these are problems to which itis hard to find an answer, and the existing literature does not provide much help. Whatappears to be evident is the fact that the relationship between amount of monetary in-centive and survey participation is nonlinear (figure 5.2), because after a certain thresh-old the incentive becomes, in the mind of the respondent, compensation for servicerendered. This generates a host of additional problems for determining the appropriatefee to pay to elicit participation (Godwin 1979; James and Bolstein 1992).4 In an Investment Climate Survey, first the manager is approached and then the accoun-tant, and not the other way around. This way only one person needs to be convinced.
Timing
Contact Person
Questionnaire Length

the expected length of the interview had only a marginal and insignificantimpact on participation (figure 5.3) (Sharp and Frankel 1983).
One of the most common reasons cited to justify refusal to participateis the respondent’s impression that his or her time is wasted (“I am toobusy,” “I don’t have time for this”).5 Although in a very limited num-ber of cases time constraints are the true reason for refusals,6 this pop-ular justification is less related to the length of the questionnaire andmore to the objective of the study. Because the arguments presented didnot pique sufficient interest, the respondent replies that lack of time isthe reason that he or she will not participate. The actual length of thequestionnaire in itself is not truly a deterrent for survey participation,rather it is an excuse offered by a respondent who would not participateeven if the questionnaire was one page long. In addition to experimen-tal results, there is enough anecdotal evidence to support that, with the
Respondent’s Psychology and Survey Participation 151
Figure 5.2.
Survey Participation By Amount of Incentive
40
50
60
70
80
No incentive $5 $10 $20 $40 $50a
Response rate (percent)
Cash incentiveSource: James and Bolstein 1992.a. Incentive promised.
5 Another reason is not being interested (Couper 1997).6 This is the case in Investment Climate Surveys, because the interview does not neces-sarily need to take place at the moment of first contact but rather at the respondent’s mostconvenient time.

right strategy, respondents will take part in the study regardless of itslength. In Malaysia and Brazil, although the Investment Climate Surveyquestionnaire was particularly long, it was completed through multipleinterviews. Questionnaire length is used as an excuse to avoid partici-pation rather than as a reason for refusal. In the Philippines, one largesampled company first refused to participate, stating the length of thequestionnaire as the reason for declining. Later, although the question-naire was not modified, the company reversed its decision after a friendpleaded for their participation.7 In general, the replacement rate of par-
152 The Power of Survey Design
Figure 5.3.
Interview Length Has an Insignificant Effect on Participation
0
20
40
60Percentage of participants
Completedinterviews
Refusals beforelength wasdisclosed
Refusals afterlength wasdisclosed
Long interviewShort interview
Source: Sharp and Frankel 1983. Note: Long interview is 1.25 hours; short is 25 minutes.
7 Dexter (1970) points out in this case that, if a third party is used to convince reluctantrespondents, it is important that the third party requests cooperation as a favor and re-frains from going into the details of the study. This is to prevent any misinterpretationon the part of the intermediary affecting the interview.

ticipants attributed to refusal to participate is not larger than that forother reasons (for example, out of business, wrong address, out ofscope, and so on).
As discussed earlier, questionnaire length affects response accuracymore than it affects survey participation. While in a few circumstancesrespondents decline to participate if they expect the interview to taketoo long, when they do participate, fatigue will hamper the accuracy ofthe information provided in a long interview. It is undisputed that alonger questionnaire leads to a higher risk of collecting inaccurate dataand to longer completion times (Andrews 1984; Sudnam and Bradburn1974). Experience shows that the survey instrument should not involveface-to-face interviews longer than one-and-a-half hours.8
The topic of the study also influences the success of the interview. Thetopic should be relevant to the purpose of the study, should not stimu-late a sense of fear or hostility from the respondent, should not addresspersonal issues, and should not give the sense of pursuing business se-crets.9 This last point is often raised when financial information is askedin the questionnaire. Many interviewers point out the reluctance of firmsto share their true financial information, if any at all. A review of the lit-erature by DeLameter (1982) shows no consistent evidence that the topiccovered or specific sensitive questions have an influence on the decisionto participate. The only effect of sensitive questions appears to be under-reporting. My experience confirms DeLameter’s findings. Although thespecific country environment and the size of the sampled firm dictatehow much financial information may be legitimately asked, if issues ofconfidentiality are appropriately guaranteed and the use of the infor-mation sought appropriately explained and understood, firms are morewilling to share their financial data. Confidentiality assurances fosterparticipation. However, the survey manager must be aware that theseassurances have a limited effect, while the critical factor remains thetrust in the integrity of the collecting agency (Singer, Mathiowetz, andCouper 1993). Furthermore, confidentiality assurances should be in-cluded only if sensitive questions are asked and should be tailored to thelevel of sensitivity of the questions. In fact, elaborate assurances of con-fidentiality might be counterproductive if used indiscriminately (Singer,Hippler, and Schwarz 1992; Singer, Von Thurn, and Miller 1995).
Respondent’s Psychology and Survey Participation 153
8 Corresponding approximately to either 13 double-spaced pages, size 12 font, or 879 words.9 For instance, asking specific names of clients and suppliers might generate a sense ofhostility and could be seen as unrelated to the purpose of the study.
Topic

A number of a respondent’s characteristics have also been addressed inthe literature as factors influencing survey participation. Age, gender, in-come, health status, education, geographic location, previous experience,and survey fatigue are all factors that have been considered. Although anumber of these factors have been associated with survey participation(DeMaio 1980; Fowler and Mangione 1990), research evidence is mixedand the causal relationship is uncertain. More than causal factors, thesecharacteristics determine the predisposition of respondents toward sur-vey participation (Groves, Cialdini and Couper 1992). Psychological fac-tors are critical components in motivating the respondent to participate.A first motive is the desire for self-expression. People often derive satis-faction from expressing their own opinion on topics of personal inter-ests. Business people are often vocal about the problems they face in theiractivities, so this positive force should be taken into account by the inter-viewer to motivate the respondent to participate. Occasionally, feelingsof altruism to help the interviewer with his or her task and the grati-fication from the performance of the respondent’s role may representpositive forces stirring the respondent toward participation. There are,however, also negative forces in the respondent’s mind that work againstsurvey participation. Fear, apparent invasion of privacy, resentment to-ward the interviewer and sponsor, or threatening topics can all compro-mise survey participation (Warwick and Lininger 1975). It is the role ofthe survey manager, and even more so of the interviewer and survey firm,to understand what factors motivate or deter each respondent and howto address these factors in each circumstance. The interviewer must beaware that even positive feelings might generate bias. So, for instance,he or she must be able to understand whether a feeling of altruismmight generate a courtesy bias in the respondent’s behavior.
The physical environment in which the survey takes place also plays arole. In Investment Climate Surveys, the most important environmentalfactor having clear effect on the interviewing climate is the attitude of thebusiness community toward surveys. In general, the business communityis hostile to these type of studies for a number of valid reasons. The ma-jority of managers see surveys as useless exercises that distract them fromthe more pressing issues of running their company without any clear pos-itive impact on their business. This feeling is magnified if the sampled es-tablishment is experiencing a downturn, if a number of (similar) surveysare being conducted more or less simultaneously, if the same sponsor hasconducted other surveys in the recent past, or if the sponsor generatesa hostile sentiment. The survey manager needs to investigate these fac-
154 The Power of Survey Design

tors while preparing for the fieldwork. Months before the interviewsstart, the survey manager must establish contacts with the business com-munity to gather their support for the study and legitimate this endeavor.Here the list of potential partners depends on the particular country en-vironment and on the selected survey firm.10 Their role is to familiarizethe associations’ members and the business community, in general, withthe study; foster participation; and support the implementing agencyin its task. Eliciting cooperation from the business community is one ofthe hardest tasks, yet it is critical in fostering survey participation.
The interviewer remains the most important factor in motivatingthe respondent to participate and in ensuring the collection of qual-ity data. As a consequence, observable characteristics and psychologicalfactors play a fundamental role in the way he or she carries out the tasks.Brenner (1982) reports three basic sources of interviewer biases: back-ground characteristics (such as age, education, socioeconomic status, race,religion), psychological factors (such as perceptions, attitudes, motives,expectations), and behavioral factors (such as experience, knowledge ofinterviewing techniques).
The interviewer’s appearance and experience will have an impact onparticipation. Sociodemographic attributes (race, age, gender, and so on)determine the first impression the respondent will make of the interviewerat the moment of first contact, while experience (skills, confidence, andso on) will inform how the interviewer handles difficult situations andarouses the respondent’s interest (Groves, Cialdini, and Couper 1992).Often students or part-time interviewers are hired to conduct a survey.While the decision to employ part-time interviewers must be weighedagainst the expected duration of the survey, the survey manager shoulduse extreme caution in relying heavily on students. Their relative youthmight create problems in getting answers from senior executives. Fur-thermore, students in particular disciplines might even be unwilling to fol-low a structured interviewing methodology, which requires them to askquestions exactly as written. Finally, because of holidays, classes, exam-inations, and so on, students tend to be less reliable in their ability tocomplete a project (Dexter 1970; Warwick and Lininger 1975).
Further empirical evidence shows that interviewer expectations andmood have an influence on survey participation and data accuracy.Interviewers who expect the study to be difficult show a modest but
Respondent’s Psychology and Survey Participation 155
10 Potential partners are the Chambers of Commerce, industrial associations, businessinstitutes, and so on.

consistent effect on response rate (Singer and Kohnke-Aguirre 1979).11
It is thus important for the success of the survey not simply to train allinterviewers but rather to understand the psychological forces that mo-tivate them to participate in the survey. Many of the reasons that pushthe respondent to cooperate also play a role in the interviewer’s decisionto participate, such as intellectual curiosity and identification withbroader social concerns. Other factors play an even more specific role,such as the desire to improve their skills and knowledge and career ad-vancement. Nevertheless, there are negative forces that also could weakenthe interviewer’s motivation toward the survey. In addition to the obvi-ous dissatisfaction with the level of pay and the field supervision, fatigue,fear, difficult travel conditions, and frustration in locating respondentsare the most common inhibitors (Warwick and Lininger 1975). It is thesurvey manager’s job to identify these inhibitors and take the necessarysteps to correct them.
Respondent’s Psychology
The third broad factor that contributes to the success of an interview isthe respondent’s state of mind. This is admittedly one of the most diffi-cult factors to gauge ahead of the actual interview. A successful inter-viewer must possess the ability to identify in the first few minutes ofinteraction which factors play a leading role in the respondent’s psycho-logical predisposition toward the survey and adopt the correspondingmost appropriate persuasion strategy.
Cialdini (1985) identifies six major social norms that work in any per-son’s mind when deciding whether to yield to a request for interview: re-ciprocation, consistency, social proof, authority, scarcity, and liking. Therule of reciprocation states that any person feels obliged to return favors,gifts, invitations, and the like received by another person.12 This feelingplays a role in survey methodology when accepting the request for inter-view is seen as repayment for a payment, gift, or favor. This norm is thepsychological basis of offering incentives to prospective participants. Psy-chologists also identify an innate sense of consistency in people: once aperson takes an uncoerced stand on an issue he or she acts in conformitywith that resolution. Otherwise, he or she risks appearing illogical, irra-
156 The Power of Survey Design
11 Estimated by the authors to be around 8 percent.12 This rule appears to be stronger than that of liking, described later. Therefore, thisnorm would work even if the person giving the gift is not liked by the receiver (Cialdini1985).

tional, or unstable. This psychological norm constitutes the basis ofawarding participants with certificates of commendation.13 They gener-ate a sense of commitment in the prospective respondent that can be usedby the interviewer to elicit compliance (to show consistency).14 The feel-ing of social proof pushes people to adopt the same beliefs and behaviorsof others because they consider correct what other people think to beright. Thus, the wider the survey participation is the more likely it is thatrespondents who are sensitive to this particular norm will cooperate.
The sense of authority is yet another factor that often plays a role inthe respondent’s mind. People are more likely to concede to a requestfor an interview if it comes from a legitimate authority (in the respon-dent’s mind). This is why it is important to have the right sponsor. Thegovernment is generally perceived as a legitimate authority and is gen-erally more successful in gaining access.15 Scarcity is another social normthat might play a role in encouraging participation. Sometimes respon-dents are more likely to comply with the request if they see it as a lim-ited opportunity. This strategy assigns more value and weight to surveyparticipation and might play a role in the decision to cooperate.
Liking is that psychological norm that pushes people to comply withrequests from people who they know and like. Apart from the (obvious)physical attractiveness, other factors influence liking and thus compli-ance. Respondents are more willing to comply with requests from peoplewho are similar to them, people who praise them, people who are famil-iar to them, and people with whom they like to be associated.
Many researchers argue that people have an innate sense of altruismthat predisposes them to help others in need (helping norm). An appealto this feeling of predisposition is generally used, explicitly or implic-itly, to increase participation. This norm, however, is influenced by the
Respondent’s Psychology and Survey Participation 157
13 This practice is not common, though, probably because it is not appreciated for its psy-chological impact.14 Any of these feelings could also work to the detriment of participation. On one occa-sion, I recall the respondent was not impressed by the sponsorship of the survey becausehe had some negative feelings against the sponsor and he decided not to cooperate to beconsistent with this belief. Knowing this is still extremely valuable to the interviewer, whocan appropriately focus on those aspects of the survey (including other sponsors, if avail-able) that conform to the respondent’s consistency norm.15 As mentioned earlier, the selection of the survey firm has a particular impact on the will-ingness of respondents to share information about sensitive topics. Thus, while hiring thenational statistical office will make it easier to collect accounting information, a higher re-fusal rate can be expected for sensitive questions, such as tax evasion and informal pay-ments to government officials.

emotional state of the respondent at the time of the request. Therefore,the respondent’s mood needs to be taken into account when he or she isapproached. While anger will have a detrimental impact on participa-tion, happiness will have the opposite effect. Sadness has an ambiguousimpact depending on how the cost and benefits of the survey are per-ceived by the respondent (Groves, Cialdini, and Couper 1992).
Finally, even the best arguments put forward by the best interviewercan fall on deaf ears if the topic is not meaningful to the respondent.Evidence shows that the best strategy to elicit opinion change is to fitthe level of sophistication of the arguments put forward to the respon-dent’s perceived saliency of the survey objective. If the purpose of thestudy is of high relevance to the respondent, a highly sophisticated in-troduction should be used to ensure participation.16 If, on the contrary,the study objectives are of low personal relevance to the respondent, amore heuristic approach should be followed and the persuasion strategyshould focus on extrinsic features of the study, such as the authority ofthe sponsor and the credibility of the implementing agency (Petty andCacioppo 1984).
All this leads to the conclusion that “influences on the decision to par-ticipate vary over individuals” (Groves and McGonagle 2001, 252) and,therefore, there is no single opening statement or single argument thatensures the highest level of participation in all circumstances. Failed at-tempts to identify an optimal single script for eliciting participation haveclearly demonstrated this finding (Dillman, Gallegas, and Frey 1976). Onthe contrary, the best persuasion strategy is tailoring, that is, “the use ofdifferent dress, physical behaviors, words, and strategies of persuasionfor different sample persons” (Groves, Cialdini, and Couper 1992, 487).Empirical evidence shows the effectiveness of tailoring. Morton-Williams(1991) showed that interviewers using a prepared script got a higher re-fusal rate than those allowed to tailor. To achieve a higher participationrate, interviewers should adapt their initial approach to the specific situa-tion they face, and the respondent’s reaction to the initial statementshould dictate their choices of subsequent strategies (Atkinson 1971;Groves and Couper 1996; Groves, Cialdini, and Couper 1992).
158 The Power of Survey Design
16 The interviewer should emphasize intrinsic characteristics such as the sample repre-sentativeness, the sophistication of the analysis and its goals, and the international per-spective of the study. Although the high saliency of the topic implies a lower incentiveeffect (Groves, Singer, and Corning, 2000), this should not push the interviewer to be-lieve that he or she can quickly move to the interview with minimal introduction.

Training
Well-designed questionnaires and experienced interviewers are undoubt-edly the two most important ingredients affecting the quality of the datacollected. Yet, while the former can be easily achieved (although oftenoverlooked), interviewers’ quality is the single most difficult aspect tohandle. Even the best-designed question will gather inaccurate informa-tion if the interviewer reads it, probes it, or records it incorrectly.
Age, experience, and education are the interviewers’ three most im-portant attributes in business surveys. Although age and experience areto some extent coupled, the interviewer’s age is important not as muchfor the ability to conduct the interview (here experience plays a largerrole) but rather, and critically, for the ability to secure participation. Thenorm of liking plays a role in the decision to participate in surveys: re-spondents are more prone to comply with a request when it comes frompeople they like. Similarity plays a role in triggering this. The more sim-ilar the person making the request, the more likely the respondent is toaccept it (Cialdini 1985). In business surveys, the respondent is generallya middle-age entrepreneur; employing young interviewers, no matterhow experienced, can automatically precludes this compliance norm (thelarger the company, the more evident the phenomenon). Experience inthe field shows that entrepreneurs, especially in larger firms, do not lendlegitimacy to studies presented by young interviewers. However, in busi-ness surveys, age plays an undisputed role on yet another critical norm.Because age is the physical attribute that first appears to the respondent,even before any other norm can be appealed to, the appearance of ayoung interviewer has an immediate negative impact on the sense of le-gitimacy of the study. It has a consequent detrimental effect on the lik-ing norm and, ultimately, on the willingness to participate.
Experience more than age has an impact on data quality. It is not sur-prising that inexperienced interviewers show a higher response errorthan young interviewers (figure 5.4) (Sudnam and Bradburn 1974). Fur-thermore, experience plays a critical role in securing participation—anexperienced interviewer has a larger set of persuasive strategies that heor she can tailor to each interview situation (Groves and Couper 1996).
Depending on the complexity of the questions asked and defini-tions adopted in the form, education plays a relevant role. Fowler andMangione (1990) have pointed out that it is an illusion to hope thatinterviewers will open training manuals in the course of an interview.Education will reduce the necessity to consult manuals and, conse-
Respondent’s Psychology and Survey Participation 159
Interviewer Characteristics

quently, will improve data quantity and quality. Furthermore, be-cause one of the interviewer’s most important tasks is to probe whenthe respondent fails to meet the question’s objective, having a clearunderstanding of the objective of each question will help the inter-viewer decide when, where, and how much probing is appropriate(Martin and Abelson 1984). Lastly, although nobody expects inter-viewers to be experts in every subject covered, when financial data arecollected in business surveys, the practice of employing interviewerswith accounting backgrounds should be encouraged.
There is no doubt that training has a positive impact on both thequality of the responses recorded and on the quantity of the interviewscompleted. More than half a century ago researchers were testing theeffect of training on data quality. The U.S. Census Bureau conductedan experiment in which the same questionnaire was administered bytwo separate groups of interviewers, one group receiving 5 hours oftraining and the second group 16 hours. On all questions, the firstgroup of interviewers showed a consistently higher error rate (13% of
160 The Power of Survey Design
Figure 5.4.
Index of Response Error by Interviewer Characteristics
0
0.1
0.2
0.3
0.4
0.5Index of response error
<21
Source: Sudnam and Bradburn 1974.
Age
13–15 16 17+ With Without
Education (years) Experience
21–24 25–34 35–44
Training

nonresponse and nonacceptable answers), which was almost doublethe rate of the trained group.17
More recently, experimental research has shown that the usefulness oftraining is a function of the complexity of the questionnaire. While the re-sponse rate of simple questions is not statistically different betweentrained and untrained interviewers, the positive effect of training appearsevident when the structure of the questionnaire is more complex and,thus, demands more interaction. The more the interviewer is required togive instructions, to probe, and to give explanations, the more effective istraining in ensuring a higher and more accurate data collection. Billiet andLoosveldt (1988) report the results of an experiment in which trainedinterviewers outperformed untrained interviewers18 in terms of reading,probing, and getting answers even on sensitive topics (figure 5.5).
Given the particular complexity of most business surveys, there is noideal interviewer who can be employed without any training. While it isnot uncommon for survey firms to promise to employ dozens of inter-viewers, an extremely small proportion of these interviewers would becapable of understanding and handling such a complex instrument as theInvestment Climate questionnaire without appropriate preparation. Thisis where training conducted by an experienced survey manager with aprofound understanding of the questionnaire and survey situations playsa crucial role. The selection of interviewers should be tailored to the dis-tinct objectives of the survey. It is extremely hard to know when thismatch between interviewers’ capabilities and survey objectives has beenmade, apart from warning signs that stem from poor interviewers. Rec-ognizing that a successful interview is not just a matter of techniques but also of intuition and ability, it is possible to identify a priori someinterviewer characteristics that will make a difference (Warwick andLininger 1975). However, only after an intense training and face-to-face mock interviews will the survey manager have a better feel of theability of prospective interviewers to handle business surveys.19
Respondent’s Psychology and Survey Participation 161
17 Survey Research Center, University of Michigan (1951). Field Methods in SampleInterview Surveys. Survey Research Center, University of Michigan, Ann Arbor, Michi-gan. As reported in Moser and Kalton 1971, 290.18 In this experiment, trained interviewers received extensive training while untrained inter-viewers received only elementary instructions. Furthermore, to control for other inde-pendent characteristics, all interviewers were female and had a minimum of experience.19 The complexity of the typical Investment Climate Survey precludes the use of simplertraining techniques, such as on-the-job training, in which interviewers follow a more ex-perienced interviewer to learn the techniques, or they learn the technique by reading ded-icated material. Conversely, a formal training session of up to one week should be heldand conducted by the survey manager.
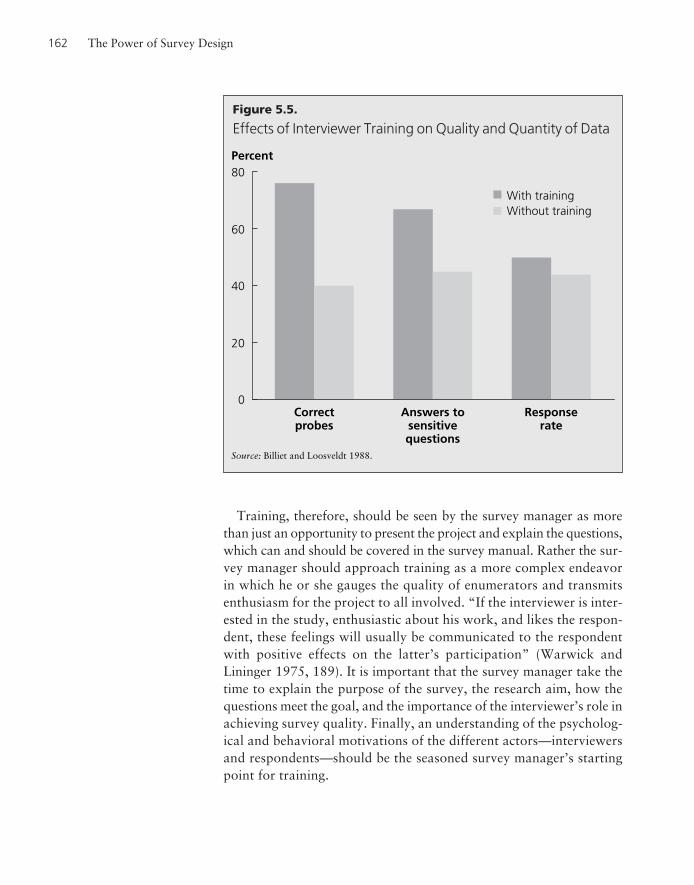
Training, therefore, should be seen by the survey manager as morethan just an opportunity to present the project and explain the questions,which can and should be covered in the survey manual. Rather the sur-vey manager should approach training as a more complex endeavorin which he or she gauges the quality of enumerators and transmitsenthusiasm for the project to all involved. “If the interviewer is inter-ested in the study, enthusiastic about his work, and likes the respon-dent, these feelings will usually be communicated to the respondentwith positive effects on the latter’s participation” (Warwick andLininger 1975, 189). It is important that the survey manager take thetime to explain the purpose of the survey, the research aim, how thequestions meet the goal, and the importance of the interviewer’s role inachieving survey quality. Finally, an understanding of the psycholog-ical and behavioral motivations of the different actors—interviewersand respondents—should be the seasoned survey manager’s startingpoint for training.
162 The Power of Survey Design
Figure 5.5.
Effects of Interviewer Training on Quality and Quantity of Data
0
20
40
60
80
Correctprobes
Answers tosensitivequestions
Responserate
Percent
With trainingWithout training
Source: Billiet and Loosveldt 1988.

Practical Training Tips
Although high refusal rates might compromise the composition of thesample,20 the typical training session dedicates little, if any, attention tobehavioral rules and suggestions about how to handle initial contacts.As in many other surveys, the most common complaint from Invest-ment Climate Survey interviewers is the difficulty of securing partici-pation; however, few guidelines covering this important aspect of dataaccuracy are addressed during training. What follows is an attempt todescribe a set of behavioral rules and social skills for training prospec-tive interviewers.
Interviewer DOs and DON’Ts
Be prepared. Any interview requires a lot of preliminary preparation.You must study the survey materials and learn the questionnaire byheart. You must become familiar with the procedures and be ready toprovide information and give answers. You must be organized (Morton-Williams 1991).21
Be likeable. Present yourself as a friendly but professional person.Before you can sell the survey, you must sell yourself. If appropriate,make friendly comments about things you see (that is, trophies, and soon). At all times you must be polite and respectful, especially if the re-spondent is rude. Never be patronizing (Morton-Williams 1991).
Be positive. Use positive verbs and expressions. Show you’re happyto conduct the survey and highlight the positive aspects of the survey.People are naturally predisposed to dislike people who are negative(Cialdini 1985).
Be responsive to the specific situation you’re facing. If the respondentis busy, annoyed, upset, or in bad mood, apologize and offer to comeback on a different date. Give the information that is requested in aform that the respondent can understand (Morton-Williams 1991).
Be neutral. Show interest and appreciation for the respondent’s answers,but do not volunteer any personal information and never share opinionswith him or her.22 Personal information might influence the respondent
Respondent’s Psychology and Survey Participation 163
20 This phenomenon is particularly important in business surveys. Because there are notmany large companies, the refusal of even a few might jeopardize the representativenessof the sample (Kincaid and Bright 1957).21 The psychological norm of consistency works against the unprepared interviewer. Anuntrained interviewer gives the impression that what he or she is doing is not important,and thus the respondent would not participate in an unimportant event.

who is trying to please the interviewer, might exacerbate the differencesbetween interviewer and respondent, and might establish a personalrather than professional interview style. If the respondent asks personalquestions, answer by stressing your professional characteristics and ex-periences. Furthermore, any feedback given to the respondent must notinclude any evaluation or judgment on the part of the interviewer. Evensimple expressions of surprise, doubt, or disbelief amount to a leadingquestion (Atkinson 1971; Dexter 1970; Fowler and Mangione 1990).
Do not lie. Answer questions truthfully while pointing out the positiveaspects of the response.
Do not threaten the respondent. Keep a polite distance. Always askif you can enter the room or if you can sit down. Don’t mention legalobligations to participate (Morton-Williams 1991).
Do not rush. If the respondent is busy, be prepared to leave and comeback at a more convenient time. Don’t rush the respondent into partici-pation until you are absolutely sure he or she is on board. Similarly, if youdon’t feel well, either physically or psychologically, or if you are stressed,postpone the interview. There is a good chance you will have a lower re-sponse rate if you press on with the interview (Morton-Williams 1991).
Do not ignore respondent’s questions and expressions of reluctance.You must be observant and vigilant. You must be ready to answer anyquestion or concern he or she might have and handle any expressionsof reluctance appropriately (Atkinson 1971; Morton-Williams 1991).In the unlikely event in which he or she asks you a detailed technicalquestion for which you don’t have an answer, you should apologizeand ensure the respondent that the supervisor will contact him or herto address the concern.
Securing Participation
Initial Contact
Timing and location. The interview should be set up at a time and loca-tion that is most convenient for the respondent. Generally, this is during
164 The Power of Survey Design
22 Presser, Blair, and Triplett (1992) go on to say that not only the interviewer’s beliefsbut also the known opinion of the sponsoring agency might influence the undecidedrespondent.

regular office hours at the offices of the establishment being surveyed.The interviewer should assume that the respondent is not too busy toconduct the scheduled interview and should make arrangements toreturn at a more convenient time only if the respondent suggests it(Warwick and Lininger 1975). Similarly, if the interview goes too longand the respondent suggests to cut it short, the interviewer should set upthe next meeting before he or she leaves or, if only few questions are left,should attempt to conclude the interview.
First impression. The interviewer’s sociodemographic characteristicsexert a lot of psychological influence on the respondent’s first impressionand on his or her decision to participate. Age, sex, appearance, religiousbelief, and class difference might affect the communication process dur-ing the interview or even the decision to take part in the study. Thesesociocultural factors must be taken into account in the preparation of sur-vey interviews. The interviewer’s actual appearance is the most immedi-ate clue of his or her background. The interviewer should dress in a simpleand inconspicuous manner, reflecting the characteristics of the respondentand of the environment in which the interview takes place. The inter-viewer should avoid displaying aspects of personal appearance that mightevoke strong reactions from the respondent and should also avoid wear-ing particular clothing or accessories that associate him or her to a par-ticular social group or cause (Warwick and Lininger 1975).
Establish and maintain interaction. There is no one single right wayto introduce a survey. Each interviewer should develop and practice hisor her own introductory statement until it comes naturally in accor-dance with the following general rules:
• Opening remarks. The interviewer should appear relaxed and con-fident.23 The interviewer should introduce himself or herself byname, explain why he or she is there, and identify the organizationhe or she represents. The interviewer should wear an official iden-tification card and display his or her credentials to avoid raisingsuspicions about the study (Warwick and Lininger 1975). Some
Respondent’s Psychology and Survey Participation 165
23 This implies that the interviewer needs to prepare and practice the introductory statementahead of time; he or she must always keep eye contact, organize the papers and documentsin advance, and speak clearly and at a normal speed. At the same time, the interviewer mustobserve what is happening in the surroundings, what is the reaction and the mood of therespondent. Basically he or she needs to start “tailoring” (Morton-Williams 1991).

practitioners suggest adding, when the circumstance warrants it,positive comments about things seen in the office, thus appealing tothe norm of liking (Dexter 1970; Morton-Williams 1991).
• Explaining the study. Soon after the introductory remarks end,the interviewer should explain the purpose of the study. Inter-viewers should not assume that the respondent is aware of the sur-vey even if an advance letter has been sent. At this stage, it is veryimportant to dispel any misconceptions. The respondent mightmisinterpret the reason for the visit and assume that it is relatedto business activity. If he or she agrees to the survey under thismisconception, the interviewer should not be surprised to find therespondent justifiably annoyed when he or she realizes the truepurpose of the visit (Atkinson 1971).
Three factors have been proven to affect persuasion: the quan-tity of the arguments presented, the quality of the arguments, andthe relevance of the topic to the respondent. Research on attitudechange shows that the number of arguments (quantity) presentedhas an impact on respondent attitudes only if saliency is low (fig-ure 5.6). Conversely, the quality of the arguments has a positiveimpact on respondents only if personal involvement is high (fig-ure 5.7) When respondents show high involvement, argument
166 The Power of Survey Design
Figure 5.6.
Effects of Quantity of Arguments on Persuasion
Postcommunication attitude
Source: Petty and Cacioppo 1984.
3 arguments
9 arguments
Lowinvolvement
Highinvolvement
Favorable
Unfavorable

quality has a much stronger effect on persuasion, while weak ar-guments might be counterproductive. At the same time, whensaliency is low, the quantity of the arguments appears to be effec-tive, while their quality has no significant persuasive effect (figure5.8) (Petty and Cacioppo 1984).
These few minutes of introduction will determine the climateof the entire interview. Hence, this time is extremely important andit must be used to pique the respondent’s interest and eliminate anydoubt in his or her mind. Three main points should be high-lighted in the interviewer’s speech: (1) the purpose of the inter-view and the sponsoring agencies; (2) the practical benefits ofparticipation for the individual respondent; and (3) the confiden-tiality of the information collected.24 It is definitely useful to showsome results from similar surveys in other countries, ideally in ashort brochure, and to show clippings from local newspapers.While being careful not to reveal more details than needed, inter-viewers should be prepared to modify their introduction to fit theunfolding interaction with the respondent. It is a good idea to be
Respondent’s Psychology and Survey Participation 167
Figure 5.7.
Effects of Quality of Arguments on Persuasion
Postcommunication attitude
Source: Petty and Cacioppo 1984.
Weak arguments
Strong arguments
Lowinvolvement
Highinvolvement
Favorable
Unfavorable
24 Some practitioners suggest to add, and show, a confidentiality statement on the backof the ID cards. (Atkinson 1971).

ready to provide additional information about the sample compo-sition, how the particular respondent has been selected, and theanalysis of the data collected. None of these topics, however,should be discussed at length until the interviewer detects whichargument the respondent is most sensitive to. Hopefully, after thisbrief introduction, the respondent will begin to engage, so that theinterviewer can determine where the respondent stands. Through-out the interaction, the interviewer should not use the words study,research, or paper. These terms reduce the sense of usefulness ofthe interview in the eye of the respondent. Typically, entrepreneursare not interested in research; they value practical analysis.
Tailoring. Following the introductory statement, successful interviewersadapt their approach to the respondent’s verbal and physical behavior.Each respondent’s reaction should dictate the interviewer’s choice of sub-sequent statements and strategies. Successful tailoring requires the inter-viewer (1) to have a variety of cues, phrases, and descriptors at his or herdisposal to use in any situation; (2) to be able to interpret the respon-dent’s words and behavior; and (3) to apply the appropriate techniquesin response. However, for the interviewer to successfully apply tailoring,he or she needs to keep the conversation going without abrupt interrup-
168 The Power of Survey Design
Figure 5.8.
Effects of Quantity and Quality of Arguments on Persuasion
Postcommunication attitude
Source: Petty and Cacioppo 1984.
Weak arguments
Strong arguments
3 arguments 6 arguments
Favorable
Unfavorable
Weak arguments
Strong arguments
3 arguments 6 arguments
Low saliency High saliency

tions or untimely requests for participation. Thus, “maintaining inter-action is the means to achieve maximum benefits from tailoring, for thelonger the conversation is in progress, the more cues the interviewer willbe able to obtain” (Groves and Couper 1996, 68).
Dealing with Reluctance
There are three strategies that can be employed to preempt expressionof reluctance to survey participation: (1) understanding the respon-dent’s psychology and tailoring the interviewer’s reaction to it; (2) high-lighting the practical aspects and the benefits of participating in thesurvey; and (3) reassuring the respondent and acting in a nonthreaten-ing manner. Reluctance can occur at any point of the initial contact andcan be manifested not only verbally but also with specific behaviors (forexample, breaking eye contact, looking over your shoulders, lookingaway, looking at a watch, going through documents, and so on). Thesuccessful interviewer needs to adapt and adjust his or her own strategyto the unfolding situation. Thus, he or she needs to be able to interpretwhat is happening and select the appropriate response. The first pre-requisite of a good interviewer is to have considerable and accurate per-ception skills. According to Morton-Williams (1991), interviewersmust be able to accomplish the following:
• Watch for signs of suspicion, fear, or reluctance;• Observe cues;• Listen to what the respondent says and how he or she talks;• Tailor his or her approach to the unfolding situation;• Address expressions of reluctance directly; and• Be ready to change strategy.
Gauging Respondent’s Psychology
As in any social interaction, the psychology of the people involved playsa critical role. Understanding and using the following basic psycholog-ical rules of compliance is a key to a successful interview:
• Consistency norm. If the interviewer is able to identify any of therespondent’s commitments, which can be related to the surveyobjectives or sponsors, he or she can leverage this psychologicalnorm to gain cooperation. For instance, if the respondent hintsthat he or she is involved in initiatives or associations aimed at im-proving the business environment, the delivery of public services,and so on, then the survey can be presented as a means to achieve
Respondent’s Psychology and Survey Participation 169

this goal. The key is to determine the respondent’s commitments.Once this is established, the experienced interviewer can link therespondent’s commitment to the objective of the survey for thepurpose of securing participation.
• Social proof. If the respondent asks, “Who else is involved?” this in-dicates that he or she is sensitive to social validation. If other peopleare participating, he or she will be more likely to participate as well.In this situation, the interviewer must be ready to provide informa-tion on the sample distribution as well as to explain how the size ofthe sample will give more weight to the results and the policy impli-cations resulting from the survey. Two characteristics of this normplay a key role. First, this norm is triggered by uncertainty. Second,this norm can be best exploited by appealing to people similarto the respondents (Cialdini 1985). Successful interviewers need toappreciate and be ready to exploit this psychological norm.
• Scarcity. Because people value more opportunities when they areless available, the interviewer can appeal to this norm with suchexpressions as “Only a select number of entrepreneurs will takepart in this survey” or “Only few days are left to complete thesurvey.” The interviewer should emphasize not only the uniqueopportunity offered to the respondent to complete the survey andto have his or her opinion count and heard (Groves, Cialdini, andCouper 1992) but also the opportunity to use the sponsors of thesurvey as the vehicle through which his or her opinions and con-cerns will inform policy creation. Two factors can be employed toenhance this feeling. First, experiments show that the value of ascarce item is even greater if it is first made available and then be-comes more scarce. Second, competition with others toward ascarce item makes it even more valuable (Cialdini 1985).
• Authority. If the respondent asks, “Who is behind this?” he or sheis sensitive to the authority norm. The interviewer should honestlyanswer who is sponsoring the study.25 Generally, the sponsoringinstitutions are mentioned in the letter of invitation and the inter-viewer should highlight those that most likely will foster higherparticipation from the individual respondent. It is not necessary tomention the funding arrangements or all agencies and institutions
170 The Power of Survey Design
25 Note that identifying the appropriate psychological norm at play is not always easy. Ifthe respondent asks, “Who is behind this?” or “Who else is behind this?” a differentnorm might be at play (authority and social proof, respectively).

involved in the study (Warwick and Lininger 1975). Appearancehas also proven to play a role within this norm. Interviewers wear-ing their official dress (that is, Government Statistical Office staff)will elicit a sense of authority. Similarly, titles are perceived as sym-bols of authority and, if and when appropriate, should be men-tioned to elicit participation (Cialdini 1985).
• Liking. Different factors have been associated with this norm:similarities in interests, background, or even dress increase thelikelihood of compliance. Because everyone likes people whopraise them, being complimentary can affect liking. Praiseshould not be detailed but rather simple and general and shouldalways be honest, because respondents who feel manipulatedwill react negatively. Finally, familiarity produced by pleasurablecontacts and cooperation toward a common goal are powerfulcauses of liking (Cialdini 1985).
Handling Practical Problems26
It is always possible that respondents will come up with a number of ex-cuses and reasons to avoid participation. The interviewer should beaware of these excuses and have strategies in place to deal with them.The respondent’s reply to a request for an interview could be as follows:
• “I am too busy.” “I don’t have time for this.” In this case, if the re-spondent has a few minutes available, it might be a good idea topresent the objectives of the study and engage the respondent. Be-fore leaving, it is also advisable to leave a letter27 explaining the studyand schedule the next appointment. A second visit emphasizes theimportance of the interview. If the respondent is making excuses toavoid the interview, it is possible that he or she is not interested. Inthis case, an alternate strategy to arouse the respondent’s interestmust be employed (Warwick and Lininger 1975).
Respondent’s Psychology and Survey Participation 171
26 In what follows, we make more specific reference to the Investment Climate Surveys.27 This letter is different from the advance letter sent by mail, whose goal was to arouse therespondent’s interest to persuade him or her to voluntarily participate in the survey. Thiscover letter, instead, should be an expanded version of the introductory letter sent to re-spondents ahead of the beginning of the fieldwork. It should be concise and include the fol-lowing elements: (1) purpose of data collection and how survey results are likely to be ofbenefit to the respondent, (2) assurance of confidentiality of data collected, (3) identifica-tion of institutions and agencies involved in the data collection, (4) identification of who isresponsible for the survey and who is carrying it out, and (5) the names and contacts of thesurvey director and other officers from the sponsoring agencies.

• “I am not interested.” In this situation, the interviewer shouldmaintain his or her composure and try to identify the exact rea-son for the rejection. If the respondent does not have any specificobjection, it might be possible to convince him or her to partici-pate by asking about a specific problem he or she is facing at workand changing his or her stance by employing the consistency norm.If the respondent has a specific objection, such as confidentiality,the interviewer should be ready and able to address the specificconcern and proceed with the interview. Avoid general debatesabout the study (Warwick and Lininger 1975). If this strategyfails, however, and the interviewer realizes that the respondentis genuinely not interested, it is best to avoid pursuing an inter-view. Experiments have shown that respondents not interestedin the survey, but later recruited, provide less accurate answers(Couper 1997).
• “Do I have to do this?” Here, as always, honesty is required.The interviewer should mention that the respondent is under nolegal obligation to participate. However, he or she should stressthat the respondent’s participation, because of a random selectionprocess, is important in reaching the goal of the study. The inter-viewer should stress the potential benefits of participation and theweight of the sponsoring institutions (Warwick and Lininger 1975).The interviewer should stress that this is a chance for the respon-dent to have his or her say, to make a contribution (Morton-Williams 1991), and to speak for himself or herself as well as forother entrepreneurs.
• “How long is it going to take?” The interviewer should stress thatthe actual length of the interview depends a lot on the respondent.If he or she is interested in a given topic, and is spending more timeon it than other respondents, then the interview could take longer.The interviewer must honestly provide an approximate amount oftime based on the estimation during the pilot.
• “What benefit do I get?” This is probably the most frequent ob-jection and the interviewer should be well prepared to address itmethodically. While it is unethical to promise specific benefits(such as a financial benefit) stemming from any survey, the inter-viewer should be ready to indicate the practical usefulness of thesurvey to identify problems faced by the business communityand to help the government address these problems to improvethe investment climate.
172 The Power of Survey Design

• “What is this survey about?” “What is it for?” First, the inter-viewer should reassure the respondent (“I will be happy to presentyou with the details”). Then the interviewer should apologize ifthe respondent did not receive the advance letter, should providethe respondent with a copy of the letter, and should relay the intro-ductory statement.
• “Why does it have to be me?” “I don’t know enough about this.” Ifthis response is given, the interviewer needs to put the respondent atease. The interviewer needs to be reassuring by stressing that every-one’s view is important, not only the views of the well-informed, andthat no one else can replace him or her in the study (Morton-Williams 1991). The interviewer should also stress the relativeweight of his or her opinion within the sample composition.
• “Can you come another time?” The interviewer should apologizefor the bad timing and show his or her willingness to come at a moreconvenient time. The interviewer should schedule a new appoint-ment before leaving. If the respondent is available after a shortperiod of time, the interviewer might consider waiting for his or herreturn instead of rescheduling a new appointment.
• “This is a very sensitive question.” The interviewer should stressthe confidentiality statement and should be prepared to present inmore detail the steps taken to ensure it. The interviewer shouldstress the anonymity of the form, that is, show that no names ap-pear on the form and that no questions on names, addresses, orclients are included in the questionnaire. The interviewer can con-fidently add that no firm has ever been identified in an InvestmentClimate Survey. Finally, the interviewer can add that the respon-dent is not expected to answer all questions.
• “What kind of questions are you going to ask?” With this obser-vation, the respondent shows a sense of fear for the role he or sheis supposed to play. The interviewer should put him or her at easeby providing examples of questions he or she will be asked. Thiscould be a good opportunity to begin the interview.28
• “I have done it before without any benefit.” Handling situa-tions in which the respondent questions the value of the survey isamong the most difficult tasks for the interviewer. Here, ratherthan stress the good things about the survey, it is preferable tostress its new and practical aspects. Very likely the respondent
Respondent’s Psychology and Survey Participation 173
28 Recall that the interview should start with easy questions (see chapter 3).

associates a survey to some previous negative experience. So thebest strategy would be to point out what makes this survey dif-ferent from the ones before. Stress the new technique employed(such as productivity analysis) and show the practical impact(newspaper articles, clippings from other countries). Make surenot to promise things the survey cannot deliver.
Similarly, the interviewer can be faced with the following situationalcircumstances:
• Respondent is away. It is feasible for the manager to miss theappointment because of force majeure. In this case, the interviewershould give a minimal explanation about the survey and schedule anew appointment in the next few days. It is recommended not to giveextensive explanations or to attempt to convince people to partici-pate other than the selected respondent. Secondhand explanationsof the purpose of the survey are generally not effective in elicitingparticipation. Unfortunately, sometimes the manager’s absence is anindication that he or she is avoiding participation. In this case, theinterviewer should attempt to win the support of other senior staff(Atkinson 1971).
• Respondent is unresponsive. This is an attempt by the respondentto undermine the interviewer’s role as a petitioner for an interview.In this situation, the interviewer might feel the need to fill the silencewith additional information or, worse, with a request for interview(Morton-Williams 1991). The best strategy is to engage the re-spondent by asking him or her direct and obvious questions relatedto the purpose of the study (such as “What is the biggest problemyou are facing right now?”).29
• Respondent is hyperresponsive. When interviewing elites, it is quitepossible that the respondent will subject the interviewer to a con-tinuous series of questions to determine his or her level of compe-tence and commitment. In more extreme cases, the respondentmight attempt to undermine the interviewer’s confidence (for ex-ample, making negative comments on the survey, being aggressive).In these circumstances, the best strategy is for the interviewer torespond positively, smile, and point out the unique features of thesurvey, keeping in mind that the respondent is just testing his or her
174 The Power of Survey Design
29 As mentioned earlier, the greatest interviewer’s asset is his or her ability to tailor. Thus,if unresponsiveness is an expression of reluctance because of the current mood, the beststrategy is to apologize for the bad timing and come back at a later date.

abilities. The interviewer should provide answers to the respon-dent’s questions, remembering that the study is backed by the spon-soring agencies. Nobody expects the interviewer to be an expert onevery topic. If a question is technical, the interviewer should assurethe respondent that he or she will be contacted by the central officewith an answer. Paying particular attention during training willhelp the interviewer handle these situations (Zuckerman 1972).
• Refusal. In any survey, there are always respondents who wish notto be interviewed. Assessing when this is the case requires consider-able judgment on the part of the interviewer. Sometimes the refusalis a veiled request for additional assurances. In other cases, it indi-cates a real desire not to be interviewed. In the latter circumstance,the respondent’s wish must be respected and the interviewer mustpolitely leave without any debate. This will also facilitate a secondattempt by more senior staff (Warwick and Lininger 1975). Inter-viewers should remember that (1) the majority of respondents willbe happy to participate, (2) some respondents will be a bit reluctant,(3) a few respondents will need more convincing, and (4) a tiny pro-portion of respondents will always refuse no matter what (Morton-Williams 1991). Evidence shows that expressions of reluctance canbe overcome (figure 5.9). Interviewers should realize that they can-not reach a 100 percent success rate. Even the best interviewers receive refusals. If the interviewer has a bad day, he or she should(1) take a day off, (2) think of the pleasant interviews he or she hasconducted, (3) talk to a supervisor, and (4) remember that he or sheis not alone in this endeavor (Morton-Williams 1991).
• Tandem interviewing. It is a good practice to have two interview-ers conduct the interview. This has the advantage of smoothingthe interview process—with one interviewer asking questions andthe other recording the answers—thus avoiding interruptions in theconversation, increasing the accuracy of the data collected, andsaving the respondent’s time. Conversely, the practice of havingan additional respondent present during the interview should beavoided. Although it might appear that the presence of a secondrespondent is a source of supplementary information, in practice,this works to the detriment of the interview. According to Kincaidand Bright,
For one thing, where the difference in ranks [is] considerable,either there [is] complete silence on the part of the subordi-
Respondent’s Psychology and Survey Participation 175

nate or the superior waste[s] time asking the subordinateviews on matters about which [he has] expressed himself.[. . .] In cases where the rank of the two respondents [is]about equal, time [is] wasted by the respondent’s tendencyto end a statement by seeking confirmation from each other.(1957, 310)
Nevertheless, if the interviewer cannot avoid having a second re-spondent present, he or she should be aware that the presence of a thirdparty will have a different impact on data quality depending on the typeof question asked. When asking factual questions, the presence of athird party is less of a problem and occasionally could be beneficial.However, when opinion and knowledge questions are asked, the pres-ence of additional respondents makes the interview more complex be-cause it becomes more difficult to avoid having the additionalrespondent help or educate the selected respondent. In these circum-
176 The Power of Survey Design
Figure 5.9.
Active Participation Rate of Initially Reluctant Respondents
0
10
20
Too busy Not interested
Source: Couper 1997.
30Percent
RecruitedRefused
(Reason of initial reluctance)

stances, the presence of a third party should be handled carefully. Theinterviewer should record only the replies of the respondent and pre-empt interruptions by tactfully asking the other person to hold his orher views for the moment while expressing that he or she is interestedin hearing them after the interview. It is essential in this situation to as-sign a specific role to the third party, otherwise he or she might adoptone that will disrupt the interview (Atkinson 1971).
• Exaggeration. Occasionally it is possible that the respondentmight want to impress the interviewer with a false image of him-self or herself. In these cases, the interviewer should clearly indi-cate to the respondent that he or she is not impressed by suchexaggeration. The interviewer should express that anything the re-spondent says is fine with him or her as long as it is the respon-dent’s honest opinion (Atkinson 1971).
• Untrue response. If the interviewer feels that the respondent is notanswering truthfully, he or she should ask the question again usinga preamble such as “Sorry, let me check, I am not sure whether Imade clear what we are asking here.” The tone used should give thesense that the question asked is not of any special significance andthat the respondent can modify his or her answers (Atkinson 1971).
• Masked willingness to cooperate. If the interviewer senses fromthe facetiousness of the respondent’s answers that the respondentis not really interested in participating, the interviewer shouldstress the seriousness of the task and emphasize that he or she isinterested only in meaningful answers. The respondent shouldtake his or her role seriously. However, if the respondent does nottake the role seriously, the interviewer should attempt to find outwhy the respondent is not interested and use all his or her skills tochange the respondent’s mind. If everything fails, the interviewershould not continue the interview (Atkinson 1971).
A related, but less problematic issue, is the amount of inter-ruptions considered acceptable (for example, phone calls receivedduring the interview). In these circumstances, the interviewershould convey to the respondent that his or her undivided atten-tion is needed and, if the respondent cannot completely avoid in-terruptions, he or she should tactfully attempt to reduce them toa minimum.
• Handing out the questionnaire. Occasionally, respondents ask toread the questions directly on a blank form during the interview.This request, although apparently simple and harmless, should be
Respondent’s Psychology and Survey Participation 177

resisted. By directly reading the questionnaire, the respondentmight be influenced by the presence and order of alternatives. Heor she might “educate” himself or herself on the flow of answersand carefully select specific answers to avoid having to answeradditional questions (Atkinson 1971). If the respondent insists onhaving a blank copy of the form, it is preferable to give him or hera copy of the form with only the questions (without any skippingpattern or set of alternatives).
Conducting the Interview
Interview Style
The interviewer’s job is not only to communicate the questions to therespondent but also to convey the framework in which he or she for-mulates the answers. At the beginning of any interview, the respondentis not sure what role he or she is supposed to play. The respondent isnot clear if he or she has to play a task-oriented role in which he or sheis required to respond adequately and accurately, or a conversationalrole in which he or she tries to relate to the interviewer by conformingto the interviewer’s apparent opinions or by attempting to make a goodimpression on the interviewer. During the brief social interaction of aninterview, the style employed by the interviewer has an impact on howthe respondent perceives his or her role and, consequently, this has animpact on the accuracy of the data collected.
With a formal style, the interviewer clarifies that the respondent’srole is to provide accurate information without engaging in irrelevantconversation with the interviewer. With a socioemotional style, the re-spondent is given the impression that he or she is not called upon toprovide accurate information because any answer is warmly received.This style allows the interviewer more freedom in conducting the inter-view but also brings a greater risk for data quality. The interviewer can,voluntarily or involuntarily, (1) communicate opinions to the respon-dent, (2) assume the respondent has particular opinions and thus posethe question directively, and (3) infer the respondent’s answer from pre-vious information. Thus, socioemotional style carries a higher responseeffect, particularly when the topic is not salient, the question is sensi-tive, and the set of response alternatives might generate a sense of ac-quiescence. Respondent’s education also appears to be related to thequality of reporting. A personal style seems to be more appropriate for
178 The Power of Survey Design

respondents with little education, while an impersonal approach resultsin more accurate data among respondents with higher education. Ac-cordingly, in business surveys, it is advisable to follow a formal stylethroughout the interview even if the respondent is more oriented to-ward a socioemotional style (Dexter 1970; Dijkstra and van der Zouwen1987; Martin 1984; Morton-Williams 1991).
We must recognize that the interviewer is called on to perform twodistinct roles in his or her interaction with the respondent. The inter-viewer needs to be a neutral communicator but also a persuader. Unlessthe interviewer can convince the respondent to participate, there will beno opportunity to act as a neutral communicator. Therefore, during theintroductory stage, when the interviewer needs to secure participation,it might be preferable to adopt a more relaxed, more social approach inwhich the interviewer relates to the prospective respondent’s concernsand mood. It is important, however, that the interviewer appropriatelycommunicate the change in style before the interview begins.30 This isnecessary because it is not clear whether the respondent can make thisdistinction himself or herself (Martin 1984).
Respondent’s Role
After the introductory phase is finished and before the questioning be-gins, it is important to communicate to the respondent how to performhis or her role as information provider and explain the setting in whichhe or she will be asked to provide information. Martin (1984) identifiesfive different ways in which the respondent sees an interview: (1) as anintimate conversation, (2) as a citizen referendum, (3) as a form-fillingexercise, (4) as a test, or (5) as a subterfuge. It is feasible to assume thateach of these possible interpretations might influence the respondent’sanswers to some if not all of the questions. For example, a managermight personally be against corruption but have to practice it to run hisor her business. It is therefore important to ensure that the respondentunderstands the point of view he or she needs to assume when answer-ing the questions.
Asking the Questions
There is a lot of debate in the literature about which interviewing methodprovides the most accurate answers: standardized or flexible. With
Respondent’s Psychology and Survey Participation 179
30 This can be easily accomplished by providing the respondent with a set of directionsabout how to perform his or her role.

the former, the interviewer is required to read each question exactly asit is written and leave any interpretation to the respondent. Supportersof the flexible approach argue that the standardized method underminesthe validity of the answers because each respondent might have a differ-ent interpretation of the same question. Therefore, they argue, inter-viewers should engage the respondent with a conversational style inwhich they are free to use their own words to convey the same meaningof the question to each respondent. The debate on standardization is fu-elled by the fact that, no matter how much people try, it is impossible todesign questions that are always clear and have the same meaning for allrespondents. Although a number of steps can and should be taken to re-duce this risk to a minimum, it is always possible that somewhere in thequestionnaire some respondent might not clearly understand a question,a concept, or a definition. When this happens, no matter what the inter-viewer does or does not do, there is going to be some degree of mea-surement error (Fowler and Mangione 1990).
The debate between standardized and flexible interviewing techniquethus transforms into a debate between which measurement error—respondent or interviewer—is smaller. Obviously, the existence of sucha debate demonstrates that there is no conclusive evidence on which ap-proach is superior. There is plenty of empirical evidence showing thateven a single word in a question can significantly change the pattern ofanswers. However, it is not possible to conclude that the validity of thedata is always improved by standardization, when the respondent isunsure of the true meaning of the question he or she is answering.31
When the respondent is so confused that he or she requests a clarifica-tion, it is reasonable to assume that a well-trained interviewer will bethe best tool to reduce measurement errors.
These opposing theories have merits and the best solution is somewherein the middle. As a general rule, the interviewer should ask the questionin a natural tone exactly as it is written in the questionnaire, including allalternatives.32 In exceptional circumstances, when the respondent cannotunderstand the question even after it has been read a second time, andonly if the respondent asks for an explanation, the interviewer should be
180 The Power of Survey Design
31 We would not be measuring the phenomenon we wish to measure, but rather the phe-nomenon the respondent thinks we want to measure. In this circumstance, the best solution would be a nonresponse. However, even this is hard to enforce given the respon-dent’s propensity to provide any answer.32 To phrase the question conversationally, it is important for the interviewer to learn andeven memorize part of the questionnaire (Atkinson 1971).

given greater freedom to ask the question using different words, as longas the meaning of the question remains the same and the explanation isprovided nondirectively.33 This mixed approach improves the quality ofthe data collected. In an experiment conducted by Schober and Conrad(1997), the authors show that the response accuracy was close with bothmethodologies, standardized and flexible, if the questions were easy to un-derstand. However, the flexible approach proved much better in the eventof a complex question (figure 5.10). This approach works only if two con-ditions are met: first, the questionnaire is properly designed for a stan-dardized interview; and, second, the interviewers receive a comprehensiveand detailed training.
The main reasons pulling an interviewer away from standardizationare related to questionnaire design. If the question is hard to read, if theconcept of the question is hard to grasp, or if the style of the question isnot conversational, the interviewer will attempt to phrase the questionusing his or her own words to facilitate the respondent’s job (Fowler andMangione 1990). Interviewers move away from standardization because
Respondent’s Psychology and Survey Participation 181
Figure 5.10.
Response Accuracy with Standardized and Flexible Interviewing Styles
0
20
40
60
80
100
Easy question Difficult question
Level of accuracy (percent)
Source: Schober and Conrad 1997.
FlexibleStandardized
33 See the next point on how to conduct probing.

of their genuine desire to make it easier for the respondent to answer thequestions and, as a result, to get more accurate information. Similarly,given that even the most experienced interviewers often are unaware ofthe risks of this deviation, an appropriate training session in standard-ized interviewing is equally necessary. By showing the effects of questionrewording on data accuracy, this session will emphasize that—whenrespondents provide inadequate replies—interviewers should not actdirectively and should not add unrelated information to the questionasked. The training session should demonstrate that doing so could com-promise the accuracy of the answers.
Probing
One important aspect of the interview process is how to behave whenthe respondent provides an inadequate answer, that is, an answer thatis partial, irrelevant, inaccurate, or nonresponsive. Probing is the actionof asking the respondent to provide clarifications or additional infor-mation. Understanding how to probe is among the most difficult of theinterviewer’s tasks for two reasons. First, it is difficult because it mustbe performed in a nondirective way. During an interview, it is possiblefor the interviewer to inadvertently rephrase a question in a way thatmight lead or educate the respondent.34 Second, it is difficult because itis not always obvious when the respondent’s answer requires a probe.Interviewers must be careful not to overprobe because this might annoythe respondent or make him or her feel obliged to provide an answerat any price. Conversely, bias can be introduced by failing to probe. Thisis more likely to occur with open-ended questions and “don’t know”answers. Open-ended questions are hard to probe because the inter-viewer needs to assess whether the question has been answered andwhether the answer is complete and accurate. Similarly, a “don’t know”answer can simultaneously be a legitimate answer and a temporary re-sponse, giving the respondent more time to think about the real answer.It can even be a sign that the respondent is unsure whether the answeris what the interviewer expects (Fowler and Mangione 1990).
Although there are no rules about how much probing is appropriateand decisions are left to the interviewer’s discretion, few practitioners
182 The Power of Survey Design
34 “A directive probe is one that increases the likelihood of one answer over others. [. . .]any probe that can be answered with a ‘yes’ or ‘no’ is directive. In addition, any probethat lists or mentions some possible answers, but excludes others, is also directive be-cause it increases the likelihood that the mentioned answers will be chosen” (Fowler andMangione 1990, 40).

recognize that not all questions should be probed similarly. Atkinson(1971) identifies two styles of probing that correspond to two types ofquestions: factual questions and opinion or knowledge questions. Inboth cases, when the respondent does not understand the question onfirst reading, the question must be read a second time exactly as it isstated. After this second attempt, if the question is still not understoodor the answer is incomplete, the interviewer is allowed greater freedom inprobing factual events. The interviewer can rephrase the question usinghis or her own words within the terms of reference of the instructions pro-vided during the training and in the survey materials. The interviewer canalso use open nondirective expressions, as well as the “zeroing in” tech-nique35 to elicit more precise answers. Finally, if an accurate figure is notavailable, the interviewer can settle for the best estimate the respondentcan provide.
On the other hand, after the second reading of an opinion or knowl-edge question, a more rigid probing style must be followed because, inthis circumstance, it is much easier for the interviewer to lead or educatethe respondent by slightly changing the wording of the question. In thesecircumstances, the interviewer should encourage additional informationfrom the respondent only by using neutral expressions, such as “Can youtell me more about that?” “Can you explain a bit more what you meanwith (. . .)?” “Which of these would be the closest to describe the wayyou feel?” or “Are there other (explanations/methods/cases)?” It is not agood idea to summarize the respondent’s answer nor to wait in silencefor more information. The first approach might generate bias becauseof the different ways that interviewers summarize, while the secondapproach could be misinterpreted by the respondent (figure 5.11) (Moserand Kalton 1971).
Prompting
Prompting means suggesting various answers36 so that the meaning ofthe question is precisely defined and the respondent can easily providehis or her answer. Prompting is particularly useful when the questionhas a wide range of meanings and the researcher does not wish to use
Respondent’s Psychology and Survey Participation 183
35 With this method, after the respondent provides a general idea of where the answerlies, the interviewer follows up with a nondirective question to further narrow the rangeof his answer (Fowler and Mangione 1990).36 This is the case of a question with a list of precoded answers among which the re-spondent has to choose one (running prompt) or provide a reply for each item (individualprompt) (Atkinson 1971).

an open-ended question or when answering requires a high degree ofeffort on the part of the respondent. Because prompting basicallyamounts to suggesting answers, it should be used only when asked forin the survey form (Atkinson 1971).
Providing Instruction and Feedback
Instructions are added into the survey form to help the respondent per-form the task accurately. They must be short and clear, and must be readby the interviewer before the question is asked. Instructions ask respon-dents to think carefully before answering, to take their time before pro-
184 The Power of Survey Design
Figure 5.11.
Probing Styles
Repeat question exactly as written
If the respondent does not understand
Go to next question
If the respondent does not understand
Factual question Opinion orknowledge question
If the respondent does not understand
Source: Based on Atkinson 1971.
(1) Reword within terms of reference
(2) Use open questions or “zeroing in” technique to elicit precise answer
(3) Ask for best estimate
Use standard probe:
(1) “Can you tell me more about that?”
(2) “Can you explain a bit more what you mean by…?”
(3) “Which of these would be closest to the way you feel?”
(4) “Are there other explanations/methods/cases?”
(5) “Give me your best estimate.”

viding an answer, or remind them that accurate and complete answersare needed.37 Feedback is used to let the respondent know how well heor she is performing his or her job. Feedback must be nondirective andcan include such expressions as “Thank you for your frankness,” “Weare interested in details like this,” or “You answered quickly. Sometimesit is easy to forget all the details. Can you think again about it one moretime?” (Kalton and Schuman 1982).
Ending the Interview
When the interview is completed, the interviewer should always thankthe respondent for his or her participation. Before leaving, the inter-viewer should make sure that he or she has answered all of the respon-dent’s questions. The interviewer should obtain permission to contactthe respondent again to verify items if omissions or inconsistencies arediscovered and require clarification (Atkinson 1971).
Respondent’s Psychology and Survey Participation 185
37 If the form is self-administered, instructions must be highlighted in bold. Respondents,in fact, tend not to read instructions, or they refer to them only when they think they needhelp (Gower 1993).


Does zero really mean zero? A timely delivery ofquality survey data requires accurate data manage-
ment. Contrary to what many believe, planning for data entry should startimmediately after the decision to implement a survey has been made. Asa matter of fact, data management begins with the questionnaire design.In particular, the physical layout of the form must meet a number of dataentry requirements such as the following:
• Questions should not be crowded to save space• Check boxes and coding boxes should be located next to the rele-
vant question• Precoded answers should always appear alongside the relevant
answers• Open-ended questions should provide enough space for the
response• The answering pattern should be uniform, preferably from top
to bottom• “For official use” should be clearly identified for questions that
need to be coded after enumeration in the field office
While designing the questionnaire, it is thus necessary for the surveymanager to interact extensively with the data manager because he orshe will have
[A]n especially sharp eye for flaws in the definition of units ofobservation, skip patterns, etc. Likewise the analysts who havehelped to write the questions should help the data manager de-termine the appropriate range of consistency checks. (Grosh andMuñoz 1996, 127)
Furthermore, it is advisable to provide the data manager with sometraining.
It needs to be stronglyemphasized that cleaning of[. . .] survey data is not atrivial task: it hasfrequently proved inpractice to be the mosttime-consuming of all dataprocessing tasks in surveys.
—United Nations,National Household Survey
Capability Programme
Chapter 6
Why Data Management Is Important
187

in substantive aspects of the survey. This should include not onlyappreciation of the goals of the survey and the methodology beingused but also thorough understanding of the questionnaire and theinterviewing methods. This can be gained by attending the inter-viewer training sessions. (Rattenbury 1980, 10)
To ensure the collection of accurate data in a timely manner, fourfundamental procedures must be implemented:
• Coding• Editing• Electronic Data Entry• Cleaning
Coding
Coding is the process of summarizing survey answers into meaningfulcategories to identify patterns (Moser and Kalton 1971). Coding in-volves two steps: defining a coding frame and assigning correspondingvalues. Basically, coding frames identify the categories of answers. Thistask is easy when answers have a simple pattern, such as yes/no ques-tions,1 but it can become quite complex and cumbersome when therange of possible answers for a given question is large, for example,“How do you acquire technology innovation?” In this case, critical de-cisions must made about how to classify potential answers. The level ofdepth of the classification should reflect the analytical purpose of thequestion, while keeping in mind the respondent’s ability to use the cho-sen categories. If the classification adopted is not clear to the respondent,he or she might simply refuse to answer or provide a biased response.2
This reaction demonstrates that “the construction of the coding framesis not a task to be delegated to routine clerks; it has to be done by some-body fully in touch with the purpose of the survey and the way theresults are to be used” (Moser and Kalton 1971, 417).
The assignment of numeric labels to questionnaire entries is of criti-cal importance for the accuracy of data entry. To the largest extent pos-sible, numeric labels should be preassigned and clearly appear next to
188 The Power of Survey Design
1 While is not advantageous to indicate it for every entry on the paper questionnaire,the reader should be reminded that the coding for all questions also includes NA (notapplicable), DK (don’t know), and REF (refuse to answer).2 In this task the survey manager’s experience and the outcome of the pretest might be of great help. It is also good practice to always include “Others (specify)” as a residualcategory.

each question to facilitate data entry. Open-ended questions should notbe coded during the interview. This exercise is time-consuming and,more importantly, introduces new sources of bias in the data (UnitedNations 1982). It is also important that questions with answers in thesame range be coded in the same way and in the same order through-out the instrument.
Of critical importance in this process is the distinction between NA(not applicable), NP (not provided), DK (don’t know), and REF (refuseto answer). Experience clearly shows that data entry errors and confu-sion among answers can be avoided if negative three-digit numbers areused to identify the aforementioned values in the data set.
Finally, all answer alternatives should be uniquely coded. Sometimesit might seem that slight variations in answers do not need to be codeddifferently. Practitioners might be under the false impression that “spacecan be saved by combining several questions into one code. However,such false economy can result in loss of valuable information, and cer-tainly increases the risk of making errors” (United Nations 1982, 13). Atypical case in point is the distinction between NA and NP. Whilemany agree that there is a substantial difference in the informationprovided by NA, DK, and REF, some practitioners believe that NAand NP basically provide the same type of information. Quite to thecontrary, NA and NP provide different information and should beclearly discriminated in the assignment of codes. As figure 6.1 shows,NP indicates that a particular event does not exist, while NA impliesthe existence of the event, although it is not “used” by the respondent(for example, although an available bank provides loans, the respon-dent does not have one).
Editing
Editing is the process through which the completed questionnaire is re-viewed to detect and correct errors. It is a task conducted both by theenumerator at the end of each interview and by the supervisor in the fieldoffice. Although routine in its nature,
anyone who has ever glanced through a completed questionnaire re-turned from the field will be aware of the absolute necessity for care-ful editing. Even the best interviewers are liable to make errors, omitto ask questions or to record answers and, when the field staff isinexperienced, editing assumes a crucial role. (Moser and Kalton1971, 411)
Why Data Management Is Important 189

The process of editing consists of checking that the information col-lected is complete, accurate, and consistent.
Completeness implies confirming that all relevant questions have beenasked and have a recorded answer. Because it is possible for the inter-viewer to recall an answer that he or she forgot to record during theinterview, editing should be carried out soon after the end of the interviewand before the next interview begins. Completeness does not mean thatall questions must be asked and must have a recorded answer. As a mat-ter of fact, it is likely that not all questions will apply to all respondentsand that, even if a question is applicable, not all respondents will be ableor willing to provide an answer. Therefore, the presence of blanks in thequestionnaire does not necessarily imply incompleteness. There is no
190 The Power of Survey Design
Figure 6.1.
Difference Among NA, NP, REF, DK, and Zero
Event
(value) (zero)
Applicable Not applicable
Know Don’t know
Answer No answer
Exists Not exist
If the event applies, the answer could be zero or some other value
Source: Author’s creation.Note: NA = not applicable; NP = not provided; DK = don’t know; and REF = refuse to answer.
The event we intend to measure might exist or not exist
If it exists, the respondent might be willing or not to answer
If the respondent is willing to answer, he might know or not the answer
If the respondent knows the answer, the event could apply or not
NP
REF
DK
NA

reason to fill in a survey with NA entries when the questions are not rel-evant to the particular respondent and should be skipped.
Accuracy implies checking that all recorded answers are easily iden-tified. The tension of the interview might cause the interviewer to fail toclearly mark relevant answers or to mark more than one option. Whenarithmetic is needed to arrive at an answer, accuracy means checking thecalculation performed in the field. Finally, checking for accuracy ofopen-ended questions means that each question is answered in a legiblemanner and that the codes assigned are correct and uniform.
Consistency implies checking that all logical relations between ques-tions are respected. If an establishment does not import goods, ananswer should not be recorded for a question asking for the majorcountry of import, no matter where in the questionnaire this questionis located. Here, a critical role is held by the skipping pattern. Staffchecking for consistency must pay special attention to the existence ofquestions having inverted scale within the same questionnaire to ensurethat the interviewer recorded the correct answer. Finally, consistencyimplies that the interviewers have interpreted the questions in a uni-form way. Occasionally, during the editing stage, different interpreta-tions of questions emerge, which need to be appropriately rectified(Moser and Kalton 1971).
All completed questionnaires must be edited and, even when this taskis performed by the supervisor, the interviewer’s assistance is crucial inunderstanding how to correct invalid entries. It is advisable to keep alog file of errors encountered for each interviewer because many mis-takes are interviewer specific. When an incorrect entry cannot be cor-rected and the question is important, the interviewer should go back tothe respondent for clarifications.
Electronic Data Entry
The benefits of adopting a data entry software form to obtain an elec-tronic version of the paper data are clear to all those involved in sur-veys and do not need to be repeated here. What is not clear to all is theamount of time it takes to develop and test such a form. In the LivingStandards and Measurement Study (LSMS)3 experience, it usually takes“six to eight weeks for the complete preparation and testing of the data
Why Data Management Is Important 191
3 LSMS household surveys stands for Living Standards and Measurement Study and rep-resents household surveys regularly conducted by the World Bank in developing coun-tries. See http://www.worldbank.org/lsms/ for more details.

entry program” (Moser and Kalton 1971, 128). In the Investment Cli-mate Survey experience, given that the questionnaire is shorter and thestructural relationship between records is simpler than the typicalLSMS, approximately four weeks should be allocated to develop andtest an entry form.
The development of an entry form starts with the selection of a soft-ware package. There are a number of packages that can be used forthis purpose, some of which are freeware.4 Each package has differentfeatures and different characteristics. The decision on the most ap-propriate package to adopt should be based on the survey firm’s cur-rent practices and available hardware, as well as the know-how in thesurvey country. It is not practical to adopt Microsoft Access© in acountry where few people know how to use it or where the availablehardware will not support it.5
Although the decision about which software to adopt should be leftto the survey firm, the survey manager must ensure that the data entryform adopted meets the following minimum number of requirementsto guarantee accurate data entry:
• Unique identifier. The form must require each record to have aunique identifier (ID) before any data can be entered (see box 6.1).It is good practice to use numeric values as identifiers.
• Variable name. The form must require each field (variable) tohave a clearly defined and unique name. When variable names arewell constructed, it is possible to identify the question correspond-ing to the variable name immediately without even looking at thequestionnaire. It is good practice to have variable names start witha letter.6
192 The Power of Survey Design
4 See footnote 7 in chapter 2.5 When conducting multicountry surveys, there is some debate among practitionersabout whether is it preferable to develop the data entry form centrally or to decentral-ize this process in the field. The former alternative seems preferable for at least three rea-sons. First, each survey firm might already be using a different software. Second, evenif this is not the case, it might be still preferable to increase the survey firm’s capabilityby subcontracting this task to a local provider. Third, the use of a software for whichthere are locally trained people will be extremely useful when problems arise while usingthe application.6 A number of software programs have such a requirement.
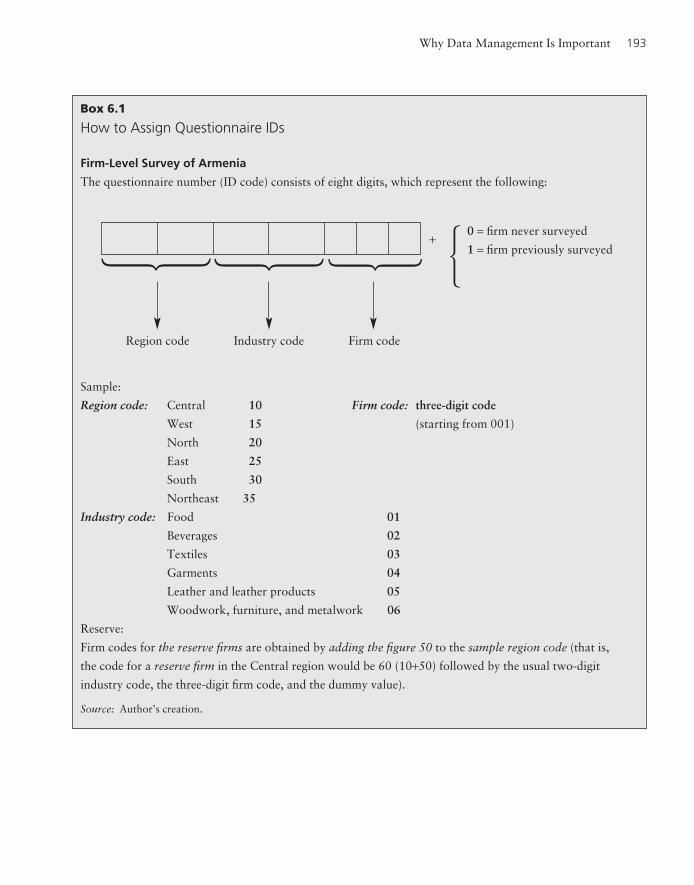
Why Data Management Is Important 193
Box 6.1
How to Assign Questionnaire IDs
Firm-Level Survey of Armenia
The questionnaire number (ID code) consists of eight digits, which represent the following:
Sample:
Region code: Central 10 Firm code: three-digit code
West 15 (starting from 001)
North 20
East 25
South 30
Northeast 35
Industry code: Food 01
Beverages 02
Textiles 03
Garments 04
Leather and leather products 05
Woodwork, furniture, and metalwork 06
Reserve:
Firm codes for the reserve firms are obtained by adding the figure 50 to the sample region code (that is,
the code for a reserve firm in the Central region would be 60 (10+50) followed by the usual two-digit
industry code, the three-digit firm code, and the dummy value).
Source: Author’s creation.
�
Region code
� �Industry code Firm code
�+0 = firm never surveyed
1 = firm previously surveyed

• Quality control. The form must allow each record entered to bethe object of three types of automatic quality control checks:• Range checks. Every variable in the questionnaire must have a
range check. For instance, when the question is a percentage,values outside the 0–100 range must be disallowed. Similarly,if the numeric value for yes is 1 and no is 2, all yes/no questionsmust disallow other values.7
• Logical checks. These checks verify that the skipping patternshave been respected and that answers to interrelated questionsare consistent (Grosh and Muñoz 1996). Thus, for instance, ifthe establishment interviewed does not have a loan, no answershould be recorded for the amount or composition of collat-eral. Similarly, if the establishment manufactured output in aspecific year, then values for production, sales, and inventoriesneed to be answered in a consistent manner.
• Reliability checks. These checks verify that answers provided arecoherent. This is the case, for example, for a multicomponentquestion whose sum must equal 100, or whose sum must beequal to the total provided in another question (for example,workforce composition and total workforce).
• Data output and dictionary file. Finally, the software used must beable to output the data in a format that is compatible with othersoftware and, more important, that can produce a dictionary file.With the development of technology, it is easy to convert virtuallyany file from one format to another. However, not many softwareprograms can produce dictionary files,8 which are critical to mak-ing data user friendly.
Anyone who has been involved in the development of an entry formwould agree that “setting up the boundaries for the range checks onsome numeric variables is an art” (Grosh and Muñoz 1996, 131).While, in many cases, it is easy to identify the restrictions on each check(range, consistency, and reliability), in every questionnaire there areinstances where this task becomes more laborious. Because there is no
194 The Power of Survey Design
7 The form developer should keep in mind that the legal codes for NA, DK, and REF willapply to all questions, thus should be consistently allowed throughout the data entryform. Similarly, because it is impossible to check text, the use of string as answers shouldbe reduced to the absolute minimum.8 A dictionary file contains the basic documentation of the variables in the data file. Itspecifies, for each variable, the name, its description (label), its type (string and numeric),its value range (categorical or continuous), and its record length.

universally valid rule, the checks embedded in the data entry formshould (1) highlight possible erroneous values and (2) allow for thepossibility of being overwritten by the supervisor after an appropri-ate examination of the paper copy of the questionnaire.
Another major concern to be addressed when developing a dataentry form refers to the level of depth of the embedded controls. Toofew checks allow incorrect entries to be accepted, while too stringentcontrols might stall the data entry and delivery process. Here, again, nouniversal rule exists given the peculiar characteristic of each question-naire. It becomes the job of the survey manager to strike a difficult bal-ance between these two competing choices, aided only by experienceand a profound understanding of the questions’ objectives.
It is good practice to test the form ahead of the start of the fieldworkto avoid unnecessary delays in data delivery. A useful approach in test-ing the form is the “trace sample” in which “a small sample of fictitiouscases that represent a wide range of situations” is used (United Nations1982, 54).
Finally, to minimize errors while speeding up data entry, the screenlayout of the data entry form should faithfully reproduce the physicallayout of the questionnaire. Each questionnaire page should corre-spond to each data entry screen. The data entry operator should nothave to switch screens for data that appear on the same questionnairepage or vice versa.
Cleaning
After the recorded data have been reviewed by the interviewer, editedby the supervisor, and entered electronically as previously described,the data files are sent to the central office for the last but not least im-portant step, cleaning.
Cleaning represents the set of final editing and imputation proce-dures used to enhance data quality and prepare data for analysis.Cleaning is an essential part of the survey operations and, at the sametime, an extremely delicate process. Because editing and imputationamount to altering the actual responses recorded in the field, inaccu-rate cleaning can seriously compromise the validity of the data in thefollowing ways:
• Significantly change the data collected• Introduce errors in the final data• Destroy evidence of poor-quality data
Why Data Management Is Important 195

Nevertheless, if conducted properly, cleaning can achieve the following:
• Improve or, at the least, retain the quality of the data collected• Make the data more user friendly for analysis• Increase the credibility of the data collected
It is absolutely essential to use experienced staff in cleaning any data,especially when this step is completed in the absence of the completedpaper questionnaire (United Nations 1982).
The methodology adopted in the Investment Climate Surveys whenestablishment survey data sets are cleaned follows two guiding principles:
• The sanctity of the data collected is paramount. Values are replaced(edited or imputed) only if an error can be detected “beyond anyreasonable doubt.” When in doubt, it is best to let the data usersdecide how to treat potential invalid entries. With this approach,we don’t destroy evidence of poor data and we don’t introduceerrors in the data.9
• Extensive imputation is not allowed. As Fellegi and Holt (1976, 17)rightly pointed out, “one should, whenever possible, avoid ‘manu-facturing’ data instead of collecting it.” Hence, if errors occur in5 percent or more of the reported values, no action is taken andthe data are returned to the field office for additional checkingand, if necessary, follow-up interviews. This is done to avoid sig-nificantly changing the data collected.
Practical Steps in Cleaning Survey Data
In practice, Investment Climate Survey data sets are cleaned in three steps:
Step 1. Verification of structural stability. The first set of checks referto the structural composition of the data file(s) and its correspondenceto the questionnaire. These controls are conducted to ensure that thefollowing is accomplished:
• The data file(s) contain all the sections of the questionnaire• Each record has a unique ID
196 The Power of Survey Design
9 This principle has a clear implication for the treatment of outliers. Erroneous entries andoutliers are two completely different phenomena requiring two completely different ap-proaches. While the treatment of errors is described in these pages, outliers are numbersthat fall within the possible range of values, although they are unusual in their magnitude.Being unusual, however, does not imply being wrong “beyond any reasonable doubt.” Asa consequence, the treatment of outliers is left to the data users’ discretion and justification.

• The IDs used correspond to the selected sample• Each variable has a unique label• Each label in the data corresponds to the labels in the paper
questionnaire• All variables in the data set appear in the questionnaire and
vice versa• The preassigned codes are entered correctly, including preassigned
string variables• Unique codes are used for not applicable (NA), don’t know (DK),
refuse to answer (REF), and not provided (NP)• The dictionary file is available• The coding frame is available
Particular attention must be paid to two values: NA and 0 (zero). Oc-casionally, 0 is used both as a numeric value and as NA (in violation ofwhat was described previously and illustrated in figure 6.1). The accu-rate discrimination between these two entries is not a trivial task and,if this problem is not detected and corrected early, it can have seriousconsequences on the quality of the final data (figure 6.2).10
Step 2. Identification of invalid entries. The second step is intended todetect invalid entries through a set of rules similar, although more strin-gent, to the ones used in the development of the data entry form. A datapoint can be invalid for two reasons: either because the value itself is er-roneous (that is, out of range), or because, even when correct, the inter-nal consistency with another question is invalid (that is, an establishmentthat classifies itself as an exporter while reporting 0 percent of output asexports). Therefore, there are two levels of controls that need to be putin place: a first level referring to each question taken individually and asecond level referring to consistency across questions.11
Step 3. Editing and imputation. Finally those entries deemed invalidare “corrected” through editing or imputation or by simply flagging
Why Data Management Is Important 197
10 It is feasible, although not common, to have a zero acquisition cost for a generatorwhen public agencies provide grants to facilitate the development of particular industriesor locations. Such is the case with the United Nations Development Programme projectfor “Revitalization of microhydro electric generator in Sirnarasa village” in Indonesia,available at http://www.undp.org/sgp/cty/ASIA_PACIFIC/INDONESIA/pfs272.htm.11 Because it is possible that internal consistency checks involve questions located in sep-arate sections of the questionnaire, the data checkers must have a thorough understand-ing of the structure of the questionnaire (see example 6.3).

them and requesting the assistance of the field office. The correction ofinvalid entries takes place in three stages:
• Quantification of erroneous entries. A frequency distribution of theinvalid entries is generated, and if the pattern of erroneous valuessuggests problems at the data entry stage,12 no action is taken otherthan referring back the problem to the field office for clarificationand amendment.
• Correction of typographical errors. If the inspection of erroneousdata clearly (that is, beyond any reasonable doubt) highlights typo-graphical errors, they are promptly edited. By scrutinizing inter-linked questions, typographical errors can more easily be detected.
• Reconciliation of internally consistent errors. The final and by farthe most difficult stage in the cleaning process is the investigationof internal inconsistencies among individually correct questions.Because situational and methodological factors often contributeto these inconsistencies, it becomes extremely challenging to
198 The Power of Survey Design
Figure 6.2.
Blurred Discrimination between Zero or Not Applicable Affects Data Accuracy
0
1,000
2,000
3,000
Without zeros With zeros
Cost of generator in Indonesia (thousands of Rupiah)
Source: World Bank Investment Climate Surveys 2003.Note: “Without zeros” refers to data, using zero as an indicator of no data and “not applicable.”
12 This is the case when the 5 percent rule is violated, or when a common error is detectedin percentage questions (that is, entering both 0.02 and 2 percent in the same question).

establish a general rule for data consistency checks. Because ofthe endless possible combinations of response artifacts affect-ing response consistency (see example 6.1 which shows how oneapparently simple question can be answered inconsistently in25 different ways), and because of the multiplicity of interpreta-tion that a question can elicit in the field, scrutiny of the answersto a survey question often reveals a much more subtle and diffi-cult set of interpretations than originally supposed. “Changes inwording that might seems trivial at first glance may prove on fur-ther analysis to imply subtle and significant changes in meaning”(Martin and Abelson 1984, 287). Consequently, the resolutionof internal inconsistencies can only be achieved through a de-tailed investigation of the distribution of correct and incorrect an-swers together with the construct of the relevant questions and thesurvey methodology adopted, making this task complex and time-consuming. While up to this step cleaning simply involved the iden-tification of the consequences of response artifacts by means ofstatistical processes, this final step of data cleaning involves theapplication of cognitive models aimed at identifying the causes ofthese errors. Hence, data cleaners performing this task must beaware of all potential response artifacts (social desirability bias,order effect, position effect, sensitive bias, recall bias, and so on)because they all have an impact on internal consistency.
That said, when situational and methodological factors cannot be usedto explain the apparent inconsistency among questions, the cleaningstrategy in Investment Climate Surveys is based on the probability of errorestimated on the level of difficulty of the interlinked questions. Becauseanswering easier questions requires lower cognitive effort than answeringdifficult ones, when the choice must be made between two individuallycorrect but, when cross-checked, inconsistent answers to questions of dif-ferent levels of difficulty, holding methodological and situational factorsconstant, the answer to the most difficult question (that is, the more spe-cific question) is assumed to be more reliable. So, for example, if therespondent answers no to the question “Do you use any software?” butprovides the answer “Netsoft XW version 5.3, release 4” to the sub-sequent question “Which software do you use?” after ascertaining theexistence of Netsoft XW version 5.3, release 4 in the survey country, wecan assume the more specific question to be correct. In applying this prin-ciple, each question is rated according to the cognitive effort it requires to
Why Data Management Is Important 199

be answered. As a general rule, easier questions are assumed to be yes/noquestions, other binomial precoded questions (for example, male/female),and opinion questions (for example, poor/good). Higher cognitive effortis expected when the respondent is asked to provide percentages, chooseamong a list of alternatives, or indicate a length of time. Finally, the mostdifficult questions are those for which the respondent has to fill in values(that is, accounting questions), recall events in the past, or reply to sensi-tive questions13 (figure 6.3; also see example 6.3).
Contrary to what many believe, cleaning data sets does not neces-sarily entail the removal of all invalid and inconsistent values. In fact,apart from instances in which it is not possible to do so, there are cir-cumstances when it is not desirable to eliminate inconsistencies. The
200 The Power of Survey Design
Figure 6.3.
Respondent’s Cognitive Effort by Question Type
Low
High
Yes/No
Binomial: Male/Female
Opinion: Poor…Good
Listing: 1. North 2. South 3. East
Data: Percent
_______: Fill in blanks
Memory: When/where
Sensitive: Corruption
Source: Author’s creation.
13 This is a relative rating scale subject to methodological factors related to questionnairedesign. Hence, a yes/no question referring to a sensitive topic (Do you pay bribes?) wouldnot fit this classification.

ability of the data cleaner to correct invalid entries depends, to a largeextent, on how well the questionnaire has been designed, how accu-rately the data are recorded, and how far back in time the survey hasbeen completed (see example 6.4). No amount of cleaning can correctbadly designed questionnaires and substitute for proper data entryforms short of fabricating answers. Cleaning might also require goingback to the survey firm and to the completed paper questionnaire.14
Furthermore, there are circumstances in which cleaning inconsisten-cies among questions would not only be inappropriate but would ac-tually result in diluting data accuracy. Few practitioners recognize thatnot all inconsistencies are flaws in the data. On the contrary, there is aparticular set of inconsistencies that is a useful source of informationfor the data analyst and, hence, should be kept in the original data set.These are the inconsistencies involving attitude questions. Managersthat rate corruption as a very severe problem, while reporting that theypay a lower amount of bribes than those rating corruption as just se-vere, are not necessarily behaving inconsistently because a host offactors might trigger this attitude-behavior. One possible explana-tion of this apparent attitude-behavior inconsistency is the fact thatmanagers perceiving corruption as most pervasive are more reluctantto pay bribes. When attitude questions are part of the inconsistency,it becomes impossible for any data cleaner to assess the direction ofthe inconsistency and to properly clean it, because in addition to theusual situational and methodological factors, psychological mech-anisms play a critical role in the way respondents provide answers.Because no data cleaner has access to the respondent’s state of mindat the time of the interview, no cleaning technique can be reasonablyapplied.
Practical Examples in Cleaning Internal Inconsistencies
Following are a number of actual examples, which are presented tofamiliarize the reader with the cleaning procedure applied in Invest-ment Climate Surveys. For simplicity, we assume that NA, REF, andDK have already been analyzed and replaced with blanks. As men-tioned earlier, the reader should remember that, to safeguard the in-tegrity of the data, the methodology highlighted in the followingpages is applied only if inconsistencies do not exceed 5 percent of thereported answers.
Why Data Management Is Important 201
14 It is important that cleaning starts before the fieldwork is completed.

Example 6.1. Multiplicity of inconsistent answers.Example 6.1. refers to the two questions shown in figure 6.4.The expectation is that the value reported on question 6 (Q6) will be
equal to the sum of the components of question 7 (Q7): .
Table 6.1 shows the distribution of consistent and inconsistent answers.While the values on the diagonal represent consistent answers (95 percentof cases), a small proportion of answers are inconsistent. So, for instance,there are eight establishments answering 0 to Q6 and 1 to Q7. A furtherinvestigation shows that inconsistent answers are reported in 25 differentways (table 6.2). So, for instance, three establishments answer inconsis-tently by reporting 0 to Q6 and 1 to Q7.1 (see row a), while five respon-dents answer inconsistently by reporting 1 to Q7.2 (see row b).
In resolving these inconsistencies, two factors played a role. First, thequestion’s design: Q6 clearly asks for “additional” plants/factories, whileQ7 does not, enabling the data cleaner to better resolve cases in whichthe difference between the two answers is 1.15 Second, an analysis of thepattern of inconsistencies by interviewer revealed that the distributionof inconsistent answers was not equally distributed among all inter-viewers. On the contrary, few interviewers consistently misinterpretedQ7 by including in its answer the establishment where the interviewtook place. These considerations enabled the data cleaner to eliminateall inconsistencies.
Q Q ii
6 71
4
==∑
202 The Power of Survey Design
Figure 6.4.
Ostensibly Innocuous Questions Can Produce Inconsistent Answers
Q.6. How many additional plants/factories are under [KG]’s control? __________ (number)
[A plant or factory is defined as a manufacturing facility that is geographically distinct from other
facilities. A production line does not, by itself constitute a plant or factory.]
Q7. How many are located:
1. In your metropolitan area: ________ (number)
2. In this district (other than in Q.7.1): ________ (number)
3. In this country(other than in Q.7.1 and Q.7.2): ________ (number)
4. In other countries: ________ (number)
15 This is an example of methodological factors influencing data cleaning.

Why Data Management Is Important 203
Table 6.1
Distribution of Consistent and Inconsistent Answers
Answers toSum of Components of Question 7
Question 6 0 1 2 3 4 5 6 7 8 9 10 11 12 13 15 18 20 24 30 33 44
0 479 8
1 95 2 4 1
2 4 45 1 1 9
3 18 1 1 5
4 6 1 1 2
5 3 1 1
6 2 5
7 9 1
8 2 1
10 1
11 1 1
12 1
22 1
Source: Author’s calculations.Note: Values on the diagonal are consistent answers.
Consistent answers
In the cleaning process of this question, some inconsistencies are ad-mittedly easier to tackle than others. Thus, it was easier to determinethe following:
• In the majority of cases, when the difference between Q6 andQ7 was only 1, the respondents excluded the establishment wherethe interview took place from Q6 but not Q7. This is, in part, sup-ported by the fact that while Q6 specifically indicates “additional”plants/factories in its wording, Q7 does not, giving the impres-sion that it refers to all plants/factories. This consideration helpedresolve inconsistencies in rows a, b, c, d, g, and n.
• In a number of instances, it was also evident that the respondent(and the interviewer) did not pay attention to the exclusive na-ture of each component of Q7 (that is, establishments includedin Q7.1 should not be included in Q7.2). This consideration

Table 6.2
Multiplicity of Inconsistent Answers
Sum ofAnswer to Components Number ofQuestion 6 of Question 7 Q7.1 Q7.2 Q7.3 Q7.4 Cases
0 11 3 (a)
1 5 (b)
12
1 1 1 (c)1 1 1 (d)
3 1 1 1 4 (e)
6 2 2 2 1 (f)
2
11 1 (g)
1 3 (h)
3 1 2 1 (i)
5 1 2 2 1 (j)
6 2 2 2 9 (k)
6 1 2 3 1 (l)
3 7 1 3 3 1 (m)
9 3 3 3 5 (n)
7 1 3 3 1 (o)
4 8 1 3 4 1 (p)
12 4 4 4 2 (q)
511 1 5 5 1 (r)
15 5 5 5 1 (s)
6 18 6 6 6 5 (t)
7 13 3 3 7 1 (u)
8 24 8 8 8 1 (v)
1120 10 10 1 (w)
33 11 11 11 1 (y)
22 44 20 2 22 1 (z)
Source: Author’s calculations.
204 The Power of Survey Design
Individul Answers to

enabled the solution of inconsistencies in rows e, i, j, k, l, m, n,p, q, r, s, t, u, v, and y.
• Although row f clearly shows the same inconsistent behavior asseen in the second bullet, even correcting this error would noteliminate the inconsistency because Q6=1 and Q7=2. Given thatQ6 specifically asks for additional plants/factories, while Q7 doesnot, it appears more likely that the respondent did include the es-tablishment where the interview took place in Q7; thus, Q7 waschanged from 2 to 1.
• In row w, it was impossible to detect any direction of inconsistencybecause the respondent seems to answer some question consistentlyand others inconsistently. Given the cross-consistency/inconsistencywithin the same respondent, no cleaning was possible.
Example 6.2. Questionnaire structure complexity.Example 6.2 shows that a complex questionnaire structure makes it
difficult not only for the interviewer to properly conduct the interview(by accurately following the skipping pattern), but also for the datacleaner to untangle the inconsistency of answers. The actual questionsare presented in figure 6.5.
Q16 is a filter question asking whether the firm has ever applied fora bank loan. If the respondent chooses yes, he is asked Q17–Q27; if no,the interviewer will go directly to Q28. Meanwhile, Q29–Q31 arebased on the assumption that the respondent’s latest loan applicationwas rejected, thus implying that he or she has already answered yes toQ16. In other words, Q17–Q27 and Q29–Q31 are linked to yes inQ16, while Q28 is linked to no in Q16. The questionnaire structure forthis example is shown in figure 6.6.
The survey data show that the skipping pattern’s complexity takesa toll on respondents. As a result, the following inconsistencies appearin the data:
• Some respondents replied no to Q16, while answering some of thequestions in Q17–Q27 (five cases) or in Q29–Q31 (three cases)(see figure 6.7).
• Other establishments replied yes to Q16 but still responded toQ28 (20 cases) (see figure 6.8).
• Other respondents did not answer Q16 but answered Q17–Q27/Q29–Q31 (seven cases) and Q28 (three cases) (figure 6.9).
When attempting to clean these inconsistencies, the questionnaire de-sign must be taken into account, particularly the presence or absence of
Why Data Management Is Important 205

206 The Power of Survey Design
Figure 6.5.
Question Flows
S3Q16
S3Q18
S3Q19
S3Q20
S3Q21d
S3Q17
S3Q21aS3Q21b
S3Q21e
S3Q21c
S3Q16
S3Q23
S3Q24
S3Q25
S3Q30a
S3Q31b
S3Q26
S3Q27
S3Q28aS3Q28bS3Q28c
S3Q28dS3Q28eS3Q28fS3Q28gS3Q28h
S3Q29aS3Q29bS3Q29cS3Q29d
S3Q28i
S3Q28j
SECTION III: FINANCE
16. Has your firm ever applied for a bank loan?
Yes............…......1No ..................…2
IF NO, GO TO QUESTION 28
17. Do you currently have a bank loan?Yes...........….......1No .....................2
IF NO, GO TO QUESTION 27
18. How many bank loans do you have? NUMBER
19. When was the latest loan approved? YEAR
20. Did the most recent loan require collateral or deposit of some sort?
Yes...........….......1No .....................2
21. If yes, what share of the collateral was:
a) Land and Buildings? b) Machinery? c) Intangible Assets (accounts receivable,
inventory)? d) Personal assets of owner/manager?e) Other
TOTAL
22. What was the approximate value of collateral required as a percentage of the loan value? PERCENT
23. What was the loan’s approximate annual cost/rate of interest? PERCENT
24. What is the period of the latest loan?YEARS
25. How much is the principal of your latest loan? TZS
26. How long did it take to get the loan from the time when you applied for it? WEEKS
27. Would your firm like to borrow more than it is able to at the current interest rate (is this firm constrained?)
Yes............…......1No ..................…2
28. If you have never applied for a bank loan, did you decide not to for any of the following reasons?
(Multiple YES answers are possible) (1-Yes, 2-No)
a. Collateral requirements too stringent b. Don’t want to incur debt c. Application procedures for bank loans
too cumbersome d. Don’t need one e. Didn’t think I’d get one f. Interest rate is too high g. Already heavily indebted h. Corruption in the allocation of bank
credit i. May create complications with tax
authorities j. Other (specify____________________)
29. If your latest application for a loan was rejected, were the following reasons given to you when it was turned down?
(Multiple YES answers are possible) (1-Yes, 2-No)
a. Lack of collateral b. Incompleteness of application c. Perceived lack of feasibility of project d. Other (specify___________________)
30. When was the application rejected? YEAR
31. How long did it take the bank to reject the application from the time of submission? WEEKS
100%
Source: Investment Climate Surveys.

Figure 6.6.
Question Structure
s3q16
Y N
q17
q27
q29 q28
Source: Author’s creation.
Figure 6.7.
Inconsistent Answers (1)
q31
s3q16
Y N
q17
q27
q29 q28
Source: Author’s creation.
n = 5
n = 3

208 The Power of Survey Design
Figure 6.9.
Inconsistent Answers (3)
s3q16
q17
q27
q28
Source: Author’s creation.
?
n =
3n =
7
Y N
Figure 6.8.
Inconsistent Answers (2)
s3q16
Y N
q17
q29 q28
Source: Author’s creation.
n = 20

skipping patterns as well as the complexity of the question flow. Thecleaning strategy in this case was as follows:
• When Q16 is missing, yes was imputed if any one question inQ18–Q26 was answered. Q27 was not included in the consistencycheck, because it is not clearly linked to Q16 (the desire of a firmto borrow more has nothing to do with the loans it has or has everhad). Furthermore, yes was also imputed in Q16 when Q17 wasanswered with yes (but not when Q17 had an answer of no) (threechanges).
• Q16 was imputed with yes when respondents did not answerQ28 but answered some of the questions in Q17–Q27/Q29–Q31(one change).
• Because a skipping pattern between Q17–Q27 and Q29–Q31 wasmissing, the inconsistencies could not be resolved when respondentsanswered both Q17–Q27/Q29–Q31 and Q28. As a consequence,these inconsistencies were retained.
Example 6.3. Cross-check inconsistencies with remote questions.Example 6.3 illustrates how the data cleaner may have to resort to
questions located in different parts of the questionnaire to resolve in-consistent answers. This case refers to questions intended to establishthe export orientation of the establishment (figure 6.10).
Question III.4 (q304) asks whether the establishment exports (yes/no).Q.III.5 (q305) is a filter question asking whether it exported directly ornot. Q.III.6 (q306) and Q.III.7 (q307) ask more detailed information onexporting. The questionnaire structure is presented in figure 6.11.
If the respondent answers no to Q.III.4, then he or she should skipto Q.III.8, whereas if the answer is yes, then Q.III.5–7 should also beanswered. However, 136 inconsistent cases emerged from the datawhere respondents answered no to Q.III.4 but answered at least onequestion in Q.III.5–7 (figure 6.12).
In an attempt to solve some of these inconsistencies, other questionson export orientation were used as cross-checks. See figure 6.13 for alist of questions.
All inconsistencies were resolved as follows (see figure 6.14):
• The 4 observations answering Q.III.6 were changed to yes in Q.III.4.• The 10 observations reporting yes in Q.III.5 were changed to yes
in Q.III.4.• The 1 observation answering Q.III.6 was changed to yes in Q.III5.
Why Data Management Is Important 209

210 The Power of Survey Design
Figure 6.11.
Question Structure
q304
Y N
q305
Y N
q308
q306 q307
Source: Author’s creation.
Figure 6.10.
Questions on Export
Codes: Yes=1, No=2
Codes: Yes=1, No=2
Codes: Yes=1, No=2q308
q304
q305
III.4 Were any of the products of this establishment exported last year?
(If answer for question III.4 is NO, then go to question III. 8)
III.5 If yes, did you export directly last year?
III.6 If you export, what was the year when your business first exported? Year
III.7 If “yes” to question number III.4, please answer the following with respect to customer to which you made your largest exports last year.
a) What percent of your total exports did you ship to this customer last year? %b) For how many years have you done business with this customer? c) Where is this customer based?
Codes: 1=North America, 2=European Union, 3=Other European, 4=Middle East, 5=Central Asia, 6=South Asia, 7=Other Asia, 8=Other
III.8 Would you rather sell in an export market than in a domestic market?
Source: Investment Climate Surveys.
q306
q307aq307b
q307c

Why Data Management Is Important 211
Figure 6.12.
Question Inconsistencies
q304
Y N
q305
Y N
q306
Source: Author’s calculations.
125
4
10
1
Figure 6.13.
Remote Questions Used for Cross-Checks
X. 7. What percent of annual sales has been sold to
a. other divisions of your company....
b. other companies domestically........
c. abroad (exports).............................
Total
X. 8. What percent of your plant’s sales revenue was from exports during the fiscal year of …? (NA for non-exporters)
Direct Export....................................
Indirect Export (through distributor)
2001 2000
qx06a1 % qx06a2 %
qx06b1 % qx06b2 %
qx06c1 % qx06c2 %
100% 100%
2001
qx08a1 %
qx08b1 %
100%
2000
qx08a2 %
qx08b2 %
100%
1999
qx08a3 %
qx08b3 %
100%Source: Investment Climate Surveys.

• The 125 no responses in Q.III.5 were dropped because this wassimply an erroneous data entry (the presence of an explicit filterallowed us to make this change).
Example 6.4. Limitations of cleaning.Example 6.4 demonstrates the role and limitations of data cleaning.
This actual case is an instructive example because it shows the importanceof (1) the design of the question, (2) the existence of accurate data entrysoftware, (3) the limitations faced by the data cleaner, and (4) the detri-mental impact on data quality of using one entry with multiple meanings.
In a survey conducted in Asia, the same question was asked in twodifferent parts of the form, to two different respondents, in two differ-ent formats (one with a filter and one without a filter). The actual ques-tions are shown in figure 6.15.
Being an objective question for which both respondents are pre-sumed to have information, we would expect that in all instances whenXV.11=yes the corresponding answers for XV.12 and VI.11 would bepositive. Similarly, all respondents that replied no to XV.11 shouldhave reported only NA to XV.12 and VI.11.
212 The Power of Survey Design
Figure 6.14.
Cleaning
q304
Y N
q305
Y N
q306
Source: Author’s creation.
4
1
10
2

Why Data Management Is Important 213
Figure 6.15.
Questions Asked to Different Respondents
Respondent A
VI.11. What percent of your workforce is unionized? ___%
Respondent B
XV.11. Are any of your employees members of a trade union? Yes / No
XV.12. What percentage of your plant’s employees belong to a trade union? ___%Source: Investment Climate Surveys.
Figure 6.16.
Distribution of Answers to Questions XV.11 (Q15.11), XV.12(Q15.12), and VI.11 (Q6.11) before Cleaning
Inconsistentvalues
Yesn=65
Non=898
Q15.11
Q15.12
Q6.11
n=3
n=18
zero positive n.a.
61
47
1
–
Q15.12
Q6.11
n=462
n=866
zero
431
32
5
–
positive n.a.
Source: Author’s calculations.Note: n.a.=not applicable
The actual response pattern is presented in figure 6.16. The dataclearly show some inconsistencies with respect to XV.11 and XV.12and XV.11 and VI.11.
Before looking at this specific questions, a general problem often re-curring in this data set was identified: the interchangeable use of 0 (zeros)

and NA. As mentioned earlier, this makes the cleaning process (as wellas the analysis) extremely difficult and often impossible.
Regarding the consistency between XV.11 and XV.12, thanks toproper question design, we were able to distinguish and drop zeros inXV.12 when XV.11 was no and were replaced with NA. We did thisbecause answering no to XV.11 implies skipping XV.12.
The next step was to identify inconsistent answers across questions.As figure 6.17 shows, of all the respondents reporting not havingunionized workers (XV.11=no) an unusually high number (n=431) didreport a positive percentage of unionized workers (XV.12>0). A closeexamination of XV.12, when XV.11=no, revealed that almost all an-swers were 2. Given that throughout the form 2 was used as a numericcode for no, there was the suspicion that, for some unknown reason,2 really meant no (a value that would have been consistent with thelinked question). This suspicion was confirmed by the field surveymanager. Thus, the final decision to replace 2 with NA was taken.Although everyone involved in the cleaning agreed that the 2s reallymeant no, there was always the possibility that some of the 2s couldreally mean that 2 percent of the workforce was unionized. In an at-
214 The Power of Survey Design
Figure 6.17.
Distribution of Answers to Q15.12 when Q15.11 = “No”
0
5
10
400
500
0 1 2 58 100
Values of Q15.12
Frequency
462
426
Source: Author’s calculations.

tempt to save some of these values, VI.11 was used to validate XV.12.Consequently, the decision was taken to keep 2 in XV.12 when 2 alsoappeared in VI.11. Nonetheless, in all instances in which XV.12 was2, VI.11 was missing. This fact further confirmed our presumptionthat 2 really meant no.
After dropping all 2s, three observations still showed inconsistencybetween XV.12 and VI.11. Because the percentage of inconsistent ques-tions was below the 5 percent mark, the usual cleaning methodologywas applied with no being replaced by yes in VI.11 in the three in-stances in which XV.12 had a positive legal value.
Three observations showed another inconsistency, because the respondent answered yes to XV.11 but then reported 0 percent inXV.12. In this case, the cleaning should have been straightforwardhad we not had too many zeros throughout the form. Because a per-centage question is given priority over a simple yes/no question, thestandard practice would have been to replace no with yes in XV.11.In this specific case, however, because zeros were used throughoutthe form to indicate NA, it was not clear whether these three zerosreally meant zero (and thus were inconsistent) or NA (and thus werelegal values). This demonstrates the importance of making a cleardistinction between zeros and NA to clean the data. Again VI.11 wasused as a source of validation. Because the corresponding values ofVI.11 were also NA, and the changes accounted for less than 5 per-cent of the observations, the final decision was taken to interpret thezeros as NA.
At the end of the first round of cleaning, inconsistencies betweenXV.11 and XV.12 were eliminated as shown in figure 6.18.
Inconsistencies, however, were still present between XV.11 andVI.11. Although these two questions were asked to two different re-spondents in two different parts of the form, because the question wasobjective in nature and general in value, we would expect consistencyamong answers. Unfortunately, this was not the case for 5 percent ofthe answers. In 18 cases, the manager reported not having unionizedworkers (VI.11=0 percent), while the accountant reported having themin XV.11. Similarly, 32 managers reported having unionized workersin VI.11, while the accountant (or human resources manager) reportednot having them in XV.11.
Previously, with XV.11 and XV.12, we could cross-check the ques-tions to clean inconsistencies; however, in this case, it was much harderto be reasonably sure to perform any cleaning. Although we were aware
Why Data Management Is Important 215

of the fact that a high percentage of answers were coded as zeros, whilemeaning missing, it was impossible to distinguish which case was which.Because two different answers were coded with the same value, anycleaning effort was impossible. The absence of a well-structured questionnot only makes the collection of accurate answers difficult, but alsomakes the cleaning of inconsistencies impossible. Hence, we were unableto correct any of the inconsistencies among VI.11, XV.11, and XV.12.
At the end of the cleaning process, the number of inconsistent valueswas reduced, but not all of the inconsistencies could be reasonablyeliminated (figure 6.19). It is left to the analyst to make the final deci-sion about how to deal with the existing inconsistencies.
216 The Power of Survey Design
Figure 6.18.Distribution of Answers between XV.11 (Q15.11) and XV.12 (Q15.12)after Cleaning. A Good Question Design Helps Eliminate Inconsistencies.
Yesn=70
Non=898
Q15.11
Q15.12 –
zero positive n.a.
66 4 Q15.12 –
zero
– 893
positive n.a.
Source: Author’s calculations.Note: n.a.=not applicable

Why Data Management Is Important 217
Figure 6.19.Distribution of Answers Among XV.11 (Q15.11), XV.12 (Q15.12), and VI.11 (Q6.11) after Cleaning. Some inconsistencies still remain because of incorrect questionnaire design anddifferent respondents.
Inconsistencies
Yesn=70
Non=893
Q15.11
Q15.12
Q6.11
–
21
zero positive n.a.
66
49
4
–
Q15.12
Q6.11
–
863
zero
–
30
893
–
positive n.a.
Source: Author’s calculations.Note: n.a.=not applicable


Andrews, F. M. 1984. “Construct Validity and Error Components ofSurvey Measures: A Structural Modeling Approach.” Public Opin-ion Quarterly 48 (2): 409–42.
Atkinson, Jean. 1971. Handbook For Interviewers. Office of Popula-tion Census and Surveys, Social Survey Division. Her Majesty’sStationery Office. London.
Auriat, Nadia. 1993. “My Wife Knows Best: A Comparison of EventDating Accuracy Between the Wife, the Husband, the Couple, andthe Belgium Population Register.” Public Opinion Quarterly 57 (2):165–90.
Bassili, J. N., and B. S. Scott. 1996. “ Response Latency as a Signal toQuestion Problems in Survey Research.” Public Opinion Quarterly60 (3): 390–99.
Benton, J. Edwin, and John L. Daly. 1991. “A Question Order Effectin a Local Government Survey.” Public Opinion Quarterly 55 (4):640–42.
Biemer, Paul P., and Lars E. Lyberg. 2003. Introduction to SurveyQuality. New Jersey: John Wiley & Sons.
Billiet, J., and G. Loosveldt. 1988. “Improvements of the Quality ofResponses to Factual Survey Questions by Interviewer Training.”Public Opinion Quarterly 52: 190–211.
Bishop, George F., Robert W. Oldendick, and Alfred J. Tuchfarber. 1983.“Effects of Filter Questions in Public Opinion Surveys.” Public Opin-ion Quarterly 47 (4): 528–546.
Bishop, George F., Robert W. Oldendick, Alfred J. Tuchfarber, andStephen E. Bennett. 1980. “Pseudo-Opinions on Public Affairs.”Public Opinion Quarterly 44 (2): 198–209.
Bishop, George F., Alfred J. Tuchfarber, and Robert W. Oldendick.1986. “Opinions on Fictitious Issues: The Pressure to AnswerSurvey Questions.” Public Opinion Quarterly 50 (2): 240–50.
References
219

Blair, E., and S. Burton. 1987. “Cognitive Processes Used by SurveyRespondents to Answer Behavioral Frequency Questions.” TheJournal of Consumer Research 14 (2): 280–88.
Bogen, K. 1996. “The Effect of Questionnaire Length on ResponseRates—A Review of the Literature.” U.S. Bureau of Census,Washington, DC.
Bradburn, N. M., L. J. Rips, and S. K. Shevell. 1987. “Answering Auto-biographical Questions: The Impact of Memory and Inference onSurveys.” Science 236: 157–61.
Brenner, Michael. 1982. “Response-effects of ‘Role-restricted’ Char-acteristics of the Interviewer.” In Response Behavior in the Survey-interview, ed. W. Dijkstra and J. van der Zouwen, 131–65. NewYork: Academic Press Inc.
Browne, M. N., and S. M. Keeley. 2001. Asking the Right Questions.Upper Saddle River, NJ: Prentice-Hall, Inc.
Burton, S., and E. Blair. 1991. “Task Conditions, Response Formu-lation Processes, and Response Accuracy for Behavioral Fre-quency Questions in Surveys” Public Opinion Quarterly 55 (1):50–79.
Campanelli, Pamela C., Elisabeth A. Martin, and Jennifer M. Rothgeb.1991. “The Use of Respondent and Interviewer Debriefing Studiesas a Way to Study Response Errors in Survey Data.” The Statistician40 (3), Special Issue: Survey Design, Methodology and Analysis (2):253–64.
Cantril, Hadley S., and S. Wilks. 1940. “Problems and Techniques:Experiments in the Wording of Questions.” Public Opinion Quar-terly 4 (2): 330–338.
Cialdini, Robert. 1985. Influence: Science and Practice. Glenview, IL:Scott, Foresman and Company.
Colledge, Michael. 1995. “Frames and Business Registers: an Over-view.” In Business Survey Methods, ed. Brenda Cox, David Binder,Nanjamma Chinnappa, Andres Christianson, Michael Colledge, andPhillip Kott. New York: John Wiley & Sons.
Converse, Jean M., and Stanley Presser. 1986. Survey Questions: Hand-crafting the Standardized Questionnaire. Sage University Papers,Series on Quantitative Applications in the Social Sciences, Series no.07-063. Sage Publications, Newbury Park, CA.
Couper, M. 1997. “Survey Introductions and Data Quality.” PublicOpinion Quarterly 61 (2): 317–38.
220 The Power of Survey Design

Cox, E. P. 1980. “The Optimal Number of Response Alternatives fora Scale: a Review.” Journal of Marketing Research 17(November):407–22.
Crespi, Irving, and Dwight Morris. 1984. “Question Order Effect andthe Measurement of Candidate Preference in the 1982 ConnecticutElections.” Public Opinion Quarterly 48 (3): 578–91.
Delaine, Ghislaine, and others. 1991. “The Social Dimensions of Adjust-ment Integrated Survey: A Survey to Measure Poverty and Under-stand the Effects of Policy Change on Households.” SDA WorkingPaper, no. 14. Social Dimensions of Adjustment Program, WorldBank, Washington, DC.
DeLameter, John. 1982. “Response-Effects of Question Content.” InResponse Behavior in the Survey-interview, ed. W. Dijkstra and J. van der Zouwen, 13–48. New York: Academic Press Inc.
DeMaio, T. 1980. “Refusals: Who, Where and Why.” Public OpinionQuarterly 44 (2): 223–33.
Dexter, Lewis Anthony. 1970. Elite and Specialized Interviewing.Evanston, IL: Northwestern University Press.
Dijkstra, W., and J. van der Zouwen. 1987. “Styles of Interviewing andthe Social Context of the Survey-Interview.” In Social InformationProcessing and Survey Methodology, ed. H. Hippler, N. Schwarz,and S. Sudman, 200–11. New York: Springer-Verlag.
Dillman, D. A., J. G. Gallegos, and J. H. Frey. 1976. “Reducing Re-fusal Rates in Telephone Interviews.” Public Opinion Quarterly40 (1): 66–78.
Duncan, O. D., B. Fishhoff, and C. Turner. 1984. “Introduction.” In Sur-veying Subjective Phenomena, ed. Charles F. Turner and ElizabethMartin, vol. 1, 1–21. New York: Russell Sage Foundation.
Economist, The. 2003. “The World This Week.” November 8–14, 8.———. 2004. “Democracy’s Low-Level Equilibrium.” August 14,
2004, 35–36.Fellegi, I. P., and D. Holt. 1976. “A Systematic Approach to Automatic
Edit and Imputation.” Journal of the American Statistical Associ-ation 71 (353): 17–35.
Finn, R. H. 1972. “Effects of Some Variations in Rating Scale Charac-teristics on the Means and Reliabilities of Ratings.” Educationaland Psychological Measurement 32: 255–65.
Foddy, William. 1993. Constructing Questions for Interviews andQuestionnaires. Cambridge, UK: Cambridge University Press.
References 221

Fowler, F. J. 1992. “How Unclear Terms Affect Survey Data.” PublicOpinion Quarterly 56 (2): 218–31.
———. 1995. Improving Survey Questions: Design and Evaluation.Applied Social Research Methods Series, vol. 38. Thousand Oaks,CA: Sage Publications.
Fowler, F. J., and T. W. Mangione. 1990. Standardized Survey Inter-viewing. Applied Social Research Methods Series, vol. 18. New-bury Park, CA: Sage Publications.
Gallagher, Daniel J., and G. Rodney Thompson. 1981. “A ReadabilityAnalysis of Selected Introductory Economics Textbooks.” Journalof Economic Education 12 (2): 60–63.
Gaskell, G. D., Daniel B. Wright, and Colm A. O’Muircheartaigh.2000. “Telescoping of Landmark Events: Implications for SurveyResearch.” Public Opinion Quarterly 64 (1): 77–89.
Godwin, R. K. 1979. “The Consequences of Large Monetary Incentivesin Mail Surveys of Elites.” Public Opinion Quarterly 43 (3): 378–87.
Gower, Allen. 1993. “Questionnaire Design for Establishment Sur-veys.” In Proceedings of the International Conference on Estab-lishment Surveys. American Statistical Association, Buffalo, NewYork, June 27–30.
Goyder, J. 1985. “Face-to-Face Interviews and Mailed Questionnaires:The Net Difference in Response Rate.” Public Opinion Quarterly49: 234–52.
Grosh, Margaret E., and Juan Muñoz. 1996. A Manual for Planningand Implementing the Living Standard Measurement Study Sur-vey. Working Paper, no. 126. World Bank, Washington, DC.
Groves, R. M., R. B. Cialdini, and M. P. Couper. 1992. “Understand-ing the Decision to Participate in a Survey.” Public Opinion Quar-terly 56: 475–95.
Groves, R. M., and M. P. Couper. 1996. “Contact-Level Influences onCooperation in Face-to-Face Surveys.” Journal of Official Statis-tics 12 (1): 63–83.
Groves, R. M., and K. A. McGonagle. 2001. “A Theory-Guided Inter-viewer Training Protocol Regarding Survey participation.” Jour-nal of Official Statistics 17 (2): 249–65.
Groves, R. M., E. Singer, and A. Corning. 2000. “Leverage-SaliencyTheory of Survey Participation.” Public Opinion Quarterly 64 (3):299–308.
Hansen, M., W. Hurwitz, and W. Madow. 1953. Sample Survey Meth-ods and Theory, vol. 1. New York: John Wiley and Sons.
222 The Power of Survey Design

Heberlein, T. A., and R. Baumgartner. 1978. “Factors Affecting Re-sponse Rates to Mailed Questionnaires: A Quantitative Analysis ofthe Published Literature.” American Sociological Review 43 (4):447–62.
Hippler, Hans-J., and Norbert Schwarz. 1986. “Not Forbidding Isn’tAllowing: The Cognitive Basis of the Forbid-Allow Asymmetry.”Public Opinion Quarterly 50 (1): 87–96.
Homan, S., M. Hewitt, and J. Linder. 1994. “The Development andValidation of a Formula for Measuring Single-Sentence Test ItemReadability.” Journal of Educational Measurement 31: 349–58.
Hunt, William H., Wilder W. Crane, and John C. Wahlke. 1964. “Inter-viewing Political Elites in Cross-Cultural Comparative Research.”The American Journal of Sociology 70 (1): 59–68.
James, J., and R. Bolstein. 1990. “The Effect of Monetary Incentives andFollow-Up Mailings on the Response Rate and Response Quality inMail Surveys.” Public Opinion Quarterly 54 (3): 346–61.
———. 1992. “Large Monetary Incentives and Their Effect on MailSurvey Response Rates.” Public Opinion Quarterly 56 (4): 442–53.
Kalton, G. 1983. Introduction to Survey Sampling. Newbury Park, CA:Sage Publications.
Kalton, G., and H. Schuman. 1982. “The Effect of the Question on Sur-vey Responses: A Review.” Journal of the Royal Statistical Society.Series A (General) 145 (1): 42–73.
Keogh, Erica. 2003. “Developing a Framework for Budgeting for House-hold Surveys in Developing Countries.” Chapter 14 in HouseholdSurveys in Developing and Transition Countries: Design, Implemen-tation and Analysis, ed. United Nations Statistics Division. Availableonline at http://unstats.un.org/unsd/HHsurveys/part1_new.htm.
Kincaid, Harry, and Margaret Bright. 1957. “Interviewing the BusinessElite.” The American Journal of Sociology 63 (3): 301–11.
Kish, Leslie. 1965. Survey Sampling. New York: John Wiley & Sons.Krosnick, J. A., and D. F. Alwin. 1987. “An Evaluation of a Cognitive
Theory of Response-Order Effects in Survey Measurement.” Pub-lic Opinion Quarterly 51 (2): 201–19.
Leigh, J. H., and C. R. Martin. 1987. “Don’t Know Item Nonresponsein a Telephone Survey: Effects of Question Form and RespondentCharacteristics.” Journal of Marketing Research 24: 418–24.
Loftus, E. F., and G. Zanni. 1975. “Eyewitness Testimony: The Influenceof the Wording of a Question.” Bulletin of the Psychonomic Society5 (1): 86–88.
References 223

Martin, E. 1984. “The Role of the Respondent.” In Surveying Subjec-tive Phenomena, ed. Charles F. Turner and E. Martin, vol. 1,257–78. New York: Russell Sage Foundation.
Martin, E., and R. Abelson. 1984. “The Question-and-Answer Process.”In Surveying Subjective Phenomena, ed. Charles F. Turner andElizabeth Martin, vol. 1, 279–301. New York: Russell SageFoundation.
McAllister, Ian, and Martin P. Wattenberg. 1995. “Measuring Levelsof Party Identification: Does Question Order Matter?” PublicOpinion Quarterly 59 (2): 259–68.
McClendon, McKee J., and David J. O’Brien. 1988. “Question-OrderEffects on the Determinants of Subjective Well-Being.” PublicOpinion Quarterly 52 (3): 351–64.
McConnell, Campbell. 1983. “Readability: Blind Faith in Numbers?”Journal of Economic Education 14 (1): 65–71.
Miller, G. A. 1956. “The Magical Number Seven, Plus or Minus Two:Some Limits on Our capacity for Processing Information.” ThePsychological Review 63: 81–97.
Morton-Williams, Jean. 1991. “Obtaining Co-Operation in Surveys:The Development of a Social Skills Approach to Interviewer Train-ing in Introducing Surveys.” Working Paper, no. 3. Joint Centrefor Survey Methods, London.
Moser, C. A., and G. Kalton. 1971. Survey Methods in Social Investi-gation. London: Heinemann Educational Book Limited.
Narayan, S., and J. A. Krosnick. 1996. “Education Moderates SomeResponse Effects in Attitude Measurement.” Public OpinionQuarterly 60 (1): 58–88.
Nijhowne, Shaila. 1995. “Defining and Classifying Statistical Units.” InBusiness Survey Methods, ed. Brenda Cox, David Binder, NanjammaChinnappa, Andres Christianson, Michael Colledge, and PhillipKott. New York: John Wiley & Sons.
Payne, S. L. B. 1951. The Art of Asking Questions. Studies in PublicOpinion, no. 3. Princeton: Princeton University Press.
Peterson, Robert A. 2000. Constructing Effective Questionnaires.Thousand Oaks, CA: Sage Publications.
Peterson, Robert A., and Roger Kerin. 1980. “Household IncomeData Reports in Mail Surveys.” Journal of Business Research 8:301–13.
Petty, R. E., and J. T. Cacioppo. 1984. “The Effects of Involvement onResponse to Argument Quantity and Quality: Central and Periph-
224 The Power of Survey Design

eral Routes to Persuasion.” Journal of Personality and Social Psy-chology 46 (1): 69–81.
Plateck, R., F. K. Pierre-Pierre, and P. Stevens. 1985. Development andDesign of Survey Questionnaires. Statistics Canada. Census andHousehold Survey Methods Division. Ottawa.
Presser, S., and J. Blair. 1994. “Survey Pretesting: Do Different MethodsProduce Different Results?” Public Opinion Quarterly 24: 73–104.
Presser, S., J. Blair, and T. Triplett. 1992. “Survey Sponsorship, Re-sponse Rate, and Response Effects.” Social Science Quarterly 73 (3):699–702.
Presser, S., and S. Zhao. 1992. “Attributed of Questions and Interview-ers as Correlates of Interviewing Performance.” Public OpinionQuarterly 56 (2): 236–40.
Project Management Institute, Inc. 2000. A Guide to the Project Man-agement Body of Knowledge (PMBOK Guide). Newtown Square,PA: PMI.
Rasinski, Kenneth A. 1989. “The Effect of Question Wording on Pub-lic Support for Government Spending.” Public Opinion Quarterly53 (3): 388–95.
Rattenbury, Judith. 1980. “Survey Data Processing: Expectations andReality.” Mimeo. Paper presented at the World Fertility SurveyConference, London, July 7–11.
Rea, Louis M., and Richard A. Parker. 1997. Designing and Conduct-ing Survey Research: A Comprehensive Guide. San Francisco:Jossey-Bass.
Schober, M. F., and F. G. Conrad. 1997. “Does Conversational Inter-viewing Reduce Survey Measurement Error?” Public OpinionQuarterly 61: 576–602.
Schuman, H., and S. Presser. 1981. Questions and Answers in AttitudeSurveys. New York: Academic Press.
———. 1979. “The Open and Closed Question.” American Sociolog-ical Review 44 (5): 692–712.
Schwarz, N., H. Hippler, B. Duetsch, and F. Strack. 1985. “ResponseScales: Effects of Category Range on Reported Behavior and Com-parative Judgments.” Public Opinion Quarterly 49 (3): 388–95.
Schwarz, N., B. Knauper, H. Hippler, E. Noelle-Neumann, and L. Clark.1991. “Rating Scales.” Public Opinion Quarterly 55 (5): 570–82.
Scipione, Paul A. 1995. “The Value of Words: Numerical PerceptionsAssociated with Descriptive Words and Phrases in MarketingReports.” Journal of Advertising Research 35: 36–43.
References 225

Sharp, L. M., and J. Frankel. 1983. “Respondent Burden: A Test of SomeCommon Assumptions.” Public Opinion Quarterly 47 (1): 36–53.
Sigelman, Lee. 1981. “Question-Order Effects on Presidential Popu-larity.” Public Opinion Quarterly 45 (2): 199–207.
Singer, E., H. Hippler, and N. Schwarz. 1992. “Confidentiality Assur-ances in Surveys: Reassurance or Threat?” International Journal ofPublic Opinion Research 4 (3): 256–68.
Singer, E., and L. Kohnke-Aguirre. 1979. “Interviewer Expectation Ef-fects: A Replication and Extension.” Public Opinion Quarterly 43(2): 245–60.
Singer, E., N. A. Mathiowetz, and M. P. Couper. 1993. “The Impactof Privacy and Confidentiality Concerns on Survey Participation.”Public Opinion Quarterly 57 (4): 465–82.
Singer, E., J. Van Hoewyk, and M. Maher. 1998. “Does the Paymentof Incentives Create Expectation Effects?” Public Opinion Quar-terly 62 (2): 152–64.
Singer, E., J. Van Hoewyk, and M. Maher. 2000. “Experiments withIncentives in Telephone Surveys” Public Opinion Quarterly 64 (2):171–88.
Singer, E., D. R. Von Thurn, E. R. Miller. 1995. “Confidentiality As-surances and Response: A Quantitative Review of the Experimen-tal Literature.” Public Opinion Quarterly 59 (1): 66–77.
Smith, T. M. 1984. “Nonattitudes: A Review and Evaluation.” In Sur-veying Subjective Phenomena, ed. Charles F. Turner and ElizabethMartin, vol. 2, 215–55. New York: Russell Sage Foundation.
Sobal, J. 1984. “The Content of Survey Introductions and the Provisionof Informed Consent.” Public Opinion Quarterly 48 (4): 788–93.
Stevens, Kevin T., Kathleen C. Stevens, and William P. Stevens. 1992.“Measuring the Readability of Business Writing: The Cloze Proce-dure Versus Readability Formulas.” The Journal of Business Com-munication 29 (4): 367–82.
Sudnam, S., and N. M. Bradburn. 1974. Response Effects in Surveys:a Review and Synthesis. Chicago: Aldine Publishing Company.
Sudnam, S., N. M. Bradburn, and N. Schwarz. 1996. Thinking AboutAnswers: The Application of Cognitive Processes to Survey Method-ology. San Francisco: Jossey-Bass.
Sukhatme, P. V., B. V. Sukhatme, and S. Sukhatme. 1984. SamplingTheory of Surveys with Applications, 3rd ed. Ames, IA: Iowa StateUniversity Press.
226 The Power of Survey Design

Tourangeau, Roger, and Tom W. Smith. 1996. “Asking Sensitive Ques-tions: the Impact of Data Collection Mode, Question Format, andQuestion Context.” Public Opinion Quarterly 60 (2): 275–304.
United Nations. 1982. National Household Survey Capability Programme—Survey data processing: A Review of Issues and Pro-cedures. New York: United Nations, Department of Technical Co-operation for Development and Statistical Office.
Warwick, D. P., and C. A. Lininger. 1975. The Sample Survey: Theoryand Practice. New York: McGraw-Hill.
Weeks, Michael F. 2003. “An Introduction to Survey Management.”A two-day short course sponsored by the Joint Program in SurveyMethodology. Presented at The Inn and Conference Center, Adel-phi, Maryland, December 8–9.
Wildt, A. R., and M. B. Mazis. 1978. “Determinants of Scale Response:Label Versus Position.” Journal of Marketing Research 15: 261–67.
Willimack, D., H. Schuman, B. Pennell, and J. Lepkowski. 1995. “Effectsof a Prepaid Nonmonetary Incentive on Response Rates and Re-sponse Quality in a Face-to-Face Survey.” Public Opinion Quarterly59 (1): 78–92.
World Bank, Private Sector Investment Climate Unit. 2003. Productiv-ity and Investment Climate Surveys (PICS): Implementation Man-ual. Washington, DC: World Bank.
Zuckerman, H. 1972. “Interviewing an Ultra-Elite.” Public OpinionQuarterly 36 (2): 159–75.
References 227


Q18. Please tell us if any of the following issues are a problem for theoperation and growth of your business. If an issue poses a problem,please judge its severity as an obstacle on a four-point scale where:
0 = No obstacle 1 = Minor obstacle 2 = Moderate obstacle3 = Major obstacle 4 = Very severe obstacle
Appendix 1
Perception Questions in the InvestmentClimate Survey Core Questionnaire
229
No Degree ofProblem Obstacle
A. Telecommunications 0 1 2 3 4
B. Electricity 0 1 2 3 4
C. Transportation 0 1 2 3 4
D. Access to Land 0 1 2 3 4
E. Tax Rates 0 1 2 3 4
F. Tax Administration 0 1 2 3 4
G. Customs and Trade Regulations 0 1 2 3 4
H. Labor Regulations 0 1 2 3 4
I. Skills and Education of Available Workers 0 1 2 3 4
J. Business Licensing and Operating Permits 0 1 2 3 4
K. Access to Financing (e.g., collateral) 0 1 2 3 4
L. Cost of Financing (e.g., interest rates) 0 1 2 3 4
M. Economic and Regulatory Policy Uncertainty 0 1 2 3 4
N. Macroeconomic Instability (inflation, exchange rate) 0 1 2 3 4
O. Corruption 0 1 2 3 4
P. Crime, Theft, and Disorder 0 1 2 3 4
Q. Anticompetitive or Informal Practices 0 1 2 3 4
R. Legal System/Conflict Resolution 0 1 2 3 4


Corruption
39. We’ve heard that establishments are sometimes required tomake gifts or informal payments to public officials to “get thingsdone” with regard to customs, taxes, licenses, regulations, serv-ices, etc. On average, what percent of annual sales value wouldsuch expenses cost a typical firm like yours? _____ %
43. When establishments in your industry do business with the gov-ernment, how much of the contract value is typically expected ingifts or informal payments to secure the contract? ________ %
41. Recognizing the difficulties many enterprises face in fully com-plying with taxes and regulations, what percentage of total saleswould you estimate the typical establishment in your area ofactivity reports for tax purposes? ______ %
Red Tape
38. In a typical week, what percentage of senior management’s timeis spent in dealing with requirements imposed by governmentregulations (e.g., taxes, customs, labor regulations, licensing, andregistration), including dealings with officials, completing forms,etc.? ________ %
42. On average, how many days last year were spent in inspectionsand mandatory meetings with officials of each of the followingagencies in the context of regulation of your business? And whatwere the costs associated with these interactions?
(a) Tax inspectorate: total days spent in inspections, requiredmeetings with officials.
Appendix 2
Objective Questions Used for ParametricEstimation of Survey Firm Fixed Effect
231

36. (a) If you import, what was the average and the longest numberof days in the last year that it took from the time your goods ar-rived in their point of entry (e.g., port, airport) until the time youcould claim them from customs?
_____ days on average NA (we don’t import)
36. (b) If you export, what was the average and the longest numberof days in the last year that it took from the time your goods ar-rived in their point of exit (e.g., port, airport) until the time theyclear customs?
_____ days on average NA (we don’t export)
37. If you could change the number of regular full-time workers youcurrently employ without any restrictions (i.e., without seekingpermission, making severance payments, etc.), what would beyour optimal level of employment as a percent of your existingworkforce? _______ %
(Note: 90% implies you would reduce your workforce by 10%,110% means you want to expand by 10%.)
Infrastructure
19. During how many days last year did your establishment experiencethe following service interruptions, how long did they last, andwhat percent of your total sales value was lost last year due to:
Value Days (% sales)
(a) power outages or surges from _____ ____ NAthe public grid?
(b) insufficient water supply? _____ ____ NA(c) unavailable mainline _____ ____ NA
telephone service?
22. What percentage of the value of your average cargo consignmentis lost while in transit because of breakage, theft, or spoilage?_____ % of consignment value
The full core questionnaire is available at http://www.ifc.org/ifcext/economics.nsf/Content/IC-SurveyMethodology.
232 The Power of Survey Design

The results presented in this appendix are based on data from theInvestment Climate Surveys from the following countries: Albania2002, Algeria2002, Armenia2002, Azerbaijan2002, Bangladesh2002,Belarus2002, Bosnia Herzegovina2002, Bulgaria2002, Bulgaria2004,Cambodia2003, China2002, Croatia2002, Czech2002, Ecuador2003,Egypt2004, El Salvador2003, Eritrea2002, Estonia2002, FYROM2002, Georgia2002, Guatemala2003, Honduras2003, Hungary2002,Indonesia2003, Kazakhstan2002, Kenya2003, Kosovo2003, Kyrgyzstan2002, Kyrgyzstan2003, Latvia2002, Lithuania2002, Lithuania2004,Moldova2002, Moldova2003, Montenegro2003, Nicaragua2003,Pakistan2002, Philippines2003, Poland2002, Poland2003, Romania2002, Russia2002, Serbia2001, Serbia2003, Slovakia2002, Slovenia2002, South Africa2003, Sri Lanka2004, Tajikistan2002, Tajikistan2003, Tanzania2003, Turkey2002, Uganda2003, Ukraine2002,Uzbekistan2002, Uzbekistan2003, Vietnam2005, Yugoslavia2002,Zambia2002.
See appendix 2 for the list of questions.
These data are available online at http://iresearch.worldbank.org/ics/jsp/index.jsp.
Appendix 3
Parametric Results of Survey Firm FixedEffects on Objective Questions
233

234 The Power of Survey Design
Table A3.1
Survey Firm Fixed Effect on “Unofficial Payments to Get Things Done”
Unofficial Payments to Get Things Done (% annual sales)
Government Agency −1.579 −1.811 −1.869 −1.858 −1.854
(12.77)** (13.84)** (14.19)** (14.02)** (13.90)**
Private Int’l. Survey Firm −0.214 −0.176 −0.214 −0.221 −0.204
(1.74) (1.42) (1.73) (1.79) (1.65)
Europe & Central Asia −1.703 −2.076 −2.094 −2.164 −2.177
(10.19)** (11.77)** (11.83)** (12.15)** (12.19)**
Latin America & Caribbean 2.560 2.216 2.188 2.072 2.075
(13.12)** (10.93)** (10.76)** (10.10)** (10.12)**
Middle East & North Africa 5.112 4.976 5.015 4.883 4.879
(21.54)** (20.87)** (20.97)** (20.45)** (20.42)**
South Asia −0.666 −0.903 −0.851 −0.836 −0.870
(5.60)** (7.31)** (6.85)** (6.74)** (6.91)**
Sub-Saharan Africa −2.222 −2.524 −2.627 −2.570 −2.643
(13.36)** (14.47)** (14.93)** (14.53)** (14.88)**
Foreign Firm −0.324 −0.102
(3.31)** (0.99)
Exporter −0.391 −0.124
(4.79)** (1.40)
Small 0.162 0.177
(1.75) (1.90)
Medium −0.561 −0.519
(4.66)** (4.26)**
Large −0.375 −0.325
(3.00)** (2.54)*
Very large −0.774 −0.704
(6.93)** (5.93)**
Constant 3.398 3.781 3.864 4.005 4.019
(27.49)** (27.74)** (28.07)** (26.17)** (26.17)**
Observations 15153 14951 14790 14774 14635
R-squared 0.09 0.10 0.10 0.10 0.10
Note: Absolute value of t statistics in parentheses.*significant at 5 percent; **significant at 1 percent.All independent variables are dummies. Private local survey company is the omitted category.

Parametric Results of Survey Firm Fixed Effects on Objective Questions 235
Table A3.2
Survey Firm Fixed Effect on “Gifts Expected as Percent Value of Government Contracts”
Gifts Expected as Percent Value of Government Contracts
Government Agency −3.059 −3.025 −3.063 −3.115 −3.109
(14.41)** (12.66)** (12.85)** (12.81)** (12.78)**
Private Int’l. Survey Firm −0.009 0.047 0.023 −0.021 0.029
(0.04) (0.22) (0.11) (0.10) (0.14)
Europe & Central Asia −2.523 −2.572 −2.533 −2.510 −2.538
(8.93)** (8.36)** (8.27)** (8.16)** (8.25)**
Latin America & Caribbean 2.221 2.196 2.232 2.043 2.025
(9.90)** (8.62)** (8.79)** (7.92)** (7.85)**
Middle East & North Africa −0.406 −0.491 −0.428 −0.670 −0.722
(2.28)* (2.72)** (2.37)* (3.69)** (3.95)**
South Asia −0.364 −0.408 −0.244 −0.202 −0.227
(1.63) (1.69) (1.01) (0.82) (0.91)
Sub-Saharan Africa −1.790 −1.772 −1.770 −1.866 −1.912
(6.97)** (6.24)** (6.22)** (6.50)** (6.63)**
Foreign Firm −0.470 −0.305
(3.63)** (2.26)*
Exporter −0.488 −0.262
(4.55)** (2.23)*
Small 0.968 0.994
(8.06)** (8.25)**
Medium 0.469 0.566
(2.98)** (3.54)**
Large 0.318 0.450
(1.98)* (2.74)**
Very large −0.288 −0.098
(1.93) (0.62)
Constant 4.326 4.391 4.402 3.954 3.979
(21.79)** (18.88)** (18.97)** (16.10)** (16.19)**
Observations 15578 15371 15263 15124 15041
R-squared 0.11 0.11 0.12 0.12 0.12
Note: Absolute value of t statistics in parentheses.*significant at 5 percent; **significant at 1 percent.All independent variables are dummies. Private local survey company is the omitted category.

236 The Power of Survey Design
Table A3.3
Firm Survey Fixed Effect on “Estimated Percent of Total Sales Declared for Tax Purposes”
Estimated Percent of Total Sales Declared for Tax Purposes
Government Agency −25.712 −16.960 −17.415 −17.868 −17.854
(18.58)** (11.09)** (11.38)** (11.31)** (11.27)**
Private Int’l. Survey Firm −0.830 −0.870 −0.714 −0.790 −0.813
(0.76) (0.80) (0.65) (0.73) (0.74)
Europe & Central Asia 10.342 19.375 19.273 18.927 19.087
(7.04)** (11.99)** (11.99)** (11.68)** (11.72)**
Latin America & Caribbean 6.084 15.110 15.100 13.903 14.100
(5.01)** (10.87)** (10.93)** (9.73)** (9.81)**
Middle East & North Africa 27.113 27.396 27.685 26.763 26.831
(19.88)** (20.12)** (20.32)** (19.30)** (19.27)**
South Asia 51.922 52.122 53.023 52.463 52.661
(18.80)** (18.98)** (19.31)** (18.45)** (18.50)**
Sub-Saharan Africa 2.983 11.591 11.939 11.464 11.273
(1.88) (6.78)** (6.96)** (6.59)** (6.43)**
Foreign Firm 0.490 1.510
(0.50) (1.44)
Exporter −1.820 −1.252
(2.33)* (1.44)
Small 3.409 3.488
(4.58)** (4.66)**
Medium 2.877 2.943
(2.76)** (2.78)**
Large 1.511 1.677
(1.32) (1.43)
Very large −3.040 −2.836
(2.67)** (2.32)*
Constant 47.290 38.240 38.518 37.325 37.138
(42.92)** (29.44)** (29.90)** (27.74)** (27.46)**
Observations 7840 7694 7653 7402 7375
R-squared 0.16 0.17 0.17 0.18 0.18
Note: Absolute value of t statistics in parentheses.*significant at 5 percent; **significant at 1 percent.All independent variables are dummies. Private local survey company is the omitted category.

Parametric Results of Survey Firm Fixed Effects on Objective Questions 237
Table A3.4
Firm Survey Fixed Effects on “Percent of Senior Management’s Time Dealing With Government”
Percent of Senior Management’s Time Dealing With Government Regulations
Government Agency 0.667 −1.072 −1.087 −0.667 −0.709
(2.88)** (3.98)** (4.01)** (2.40)* (2.53)*
Private Int’l. Survey Firm −6.294 −6.378 −6.290 −6.215 −6.256
(19.06)** (19.17)** (18.99)** (19.08)** (19.18)**
Europe & Central Asia 1.693 −1.189 −1.167 0.318 0.473
(4.44)** (2.83)** (2.78)** (0.75) (1.11)
Latin America & Caribbean −2.745 −5.654 −5.619 −4.652 −4.520
(8.66)** (15.64)** (15.52)** (12.65)** (12.19)**
Middle East & North Africa −2.316 −3.452 −3.376 −2.398 −2.056
(4.42)** (6.44)** (6.32)** (4.54)** (3.81)**
South Asia −3.321 −5.576 −5.763 −5.316 −5.261
(13.51)** (19.94)** (20.53)** (18.73)** (18.09)**
Sub-Saharan Africa −3.408 −6.032 −5.911 −4.642 −4.659
(11.07)** (17.71)** (17.28)** (13.33)** (13.23)**
Foreign Firm 0.801 0.582
(3.57)** (2.45)*
Exporter 0.176 −0.427
(0.95) (2.10)*
Small 1.710 1.721
(8.00)** (8.00)**
Medium 2.274 2.347
(8.34)** (8.46)**
Large 2.382 2.473
(8.54)** (8.65)**
Very large 1.848 1.894
(7.24)** (7.01)**
Constant 11.634 14.477 14.464 11.681 11.543
(49.97)** (49.55)** (49.33)** (34.24)** (33.49)**
Observations 24163 22521 22190 21051 20703
R-squared 0.04 0.06 0.05 0.05 0.05
Note: Absolute value of t statistics in parentheses.*significant at 5 percent; **significant at 1 percent.All independent variables are dummies. Private local survey company is the omitted category.

238 The Power of Survey Design
Table A3.5
Firm Survey Fixed Effects on “Total Days Spent with Officials from Tax Inspectorate”
Total Days Spent with Officials from Tax Inspectorate
Government Agency 3.736 1.662 1.923 2.420 2.307
(12.68)** (4.31)** (4.94)** (6.24)** (5.87)**
Private Int’l. Survey Firm 4.675 4.622 4.714 4.872 4.803
(7.69)** (7.45)** (7.58)** (8.03)** (7.90)**
Europe & Central Asia −0.927 −3.490 −3.388 −1.859 −1.752
(2.19)* (6.75)** (6.53)** (3.55)** (3.30)**
Latin America & Caribbean −0.550 −3.195 −3.040 −1.303 −1.252
(1.42) (6.59)** (6.25)** (2.61)** (2.48)*
Middle East & North Africa −1.185 −1.647 −1.788 −0.806 −0.628
(2.86)** (3.83)** (4.16)** (1.88) (1.45)
South Asia −3.927 −5.229 −5.283 −4.646 −4.368
(13.07)** (15.39)** (15.42)** (13.69)** (12.48)**
Sub-Saharan Africa −0.065 −2.473 −2.138 −0.927 −0.969
(0.18) (5.66)** (4.87)** (2.06)* (2.13)*
Foreign Firm 1.533 0.904
(5.07)** (2.77)**
Exporter 0.849 −0.444
(3.41)** (1.63)
Small 0.819 0.900
(2.55)* (2.77)**
Medium 2.006 2.087
(5.18)** (5.27)**
Large 2.854 2.904
(7.32)** (7.21)**
Very large 3.885 3.913
(10.52)** (9.89)**
Constant 5.354 7.829 7.645 4.863 4.762
(18.19)** (18.80)** (18.16)** (9.32)** (9.02)**
Observations 15982 14740 14502 13895 13615
R-squared 0.04 0.04 0.04 0.05 0.05
Note: Absolute value of t statistics in parentheses.*significant at 5 percent; **significant at 1%.All independent variables are dummies. Private local survey company is the omitted category.

Parametric Results of Survey Firm Fixed Effects on Objective Questions 239
Table A3.6
Firm Survey Fixed Effects on “Days on Average to Claim Imports from Customs”
Days on Average to Claim Imports from Customs
Government Agency 1.372 0.513 0.406 −0.162 0.114
(3.31)** (0.95) (0.74) (0.29) (0.20)
Private Int’l. Survey Firm −5.077 −4.526 −4.770 −4.702 −4.150
(4.00)** (3.50)** (3.68)** (3.57)** (3.17)**
Europe & Central Asia 2.991 0.444 0.724 −0.499 −0.735
(2.27)* (0.32) (0.51) (0.34) (0.51)
Latin America & Caribbean 4.169 1.925 2.200 1.422 1.462
(8.08)** (2.86)** (3.24)** (1.97)* (2.01)*
Middle East & North Africa 2.842 1.250 1.903 1.334 1.071
(7.72)** (3.12)** (4.60)** (3.09)** (2.39)*
South Asia 3.292 0.877 1.748 1.527 1.192
(7.48)** (1.54) (3.05)** (2.54)* (1.95)
Sub-Saharan Africa 3.944 1.938 1.745 1.456 1.111
(8.03)** (3.10)** (2.76)** (2.20)* (1.66)
Foreign Firm −2.583 −2.341
(9.51)** (7.91)**
Exporter −2.088 −1.665
(8.54)** (6.19)**
Small −0.654 −0.473
(1.32) (0.95)
Medium −1.621 −1.089
(3.00)** (1.99)*
Large −1.942 −1.104
(3.68)** (2.06)*
Very large −2.430 −1.326
(4.85)** (2.56)*
Constant 5.845 8.675 8.655 10.187 10.810
(13.80)** (14.30)** (14.04)** (13.03)** (13.62)**
Observations 9735 9072 8726 8297 8003
R-squared 0.05 0.06 0.06 0.06 0.07
Note: Absolute value of t statistics in parentheses.*significant at 5 percent; **significant at 1 percent.All independent variables are dummies. Private local survey company is the omitted category.

240 The Power of Survey Design
Table A3.7
Firm Survey Fixed Effects on “Days on Average to Clear Customs for Exports”
Days on Average to Clear Customs for Exports
Government Agency 2.054 2.074 1.939 1.548 1.815
(6.65)** (4.97)** (4.47)** (3.56)** (4.04)**
Private Int’l. Survey Firm −1.462 −1.108 −1.444 −1.383 −1.080
(1.09) (0.81) (1.04) (1.01) (0.79)
Europe & Central Asia 0.630 −0.694 0.129 −0.689 −0.454
(0.46) (0.48) (0.09) (0.48) (0.31)
Latin America & Caribbean 1.634 0.480 1.063 0.503 0.740
(4.21)** (0.93) (1.98)* (0.92) (1.31)
Middle East & North Africa −1.931 −3.247 −2.524 −2.623 −2.821
(6.28)** (9.78)** (7.18)** (7.57)** (7.67)**
South Asia 2.825 1.355 2.254 2.286 2.203
(9.11)** (3.27)** (5.22)** (5.33)** (4.92)**
Sub-Saharan Africa 1.452 0.374 0.737 0.332 0.527
(3.36)** (0.69) (1.31) (0.59) (0.91)
Foreign Firm −2.135 −2.023
(9.61)** (8.40)**
Exporter −1.147 −0.929
(5.54)** (4.25)**
Small −0.184 −0.052
(0.41) (0.11)
Medium −0.254 −0.034
(0.54) (0.07)
Large −0.816 −0.473
(1.77) (1.01)
Very large −0.823 −0.311
(1.87) (0.69)
Constant 3.570 5.200 4.989 5.240 5.821
(11.43)** (11.26)** (10.33)** (8.39)** (8.98)**
Observations 8499 7691 7313 6903 6583
R-squared 0.03 0.05 0.04 0.05 0.06
Note: Absolute value of t statistics in parentheses.*significant at 5 percent; **significant at 1 percent.All independent variables are dummies. Private local survey company is the omitted category.
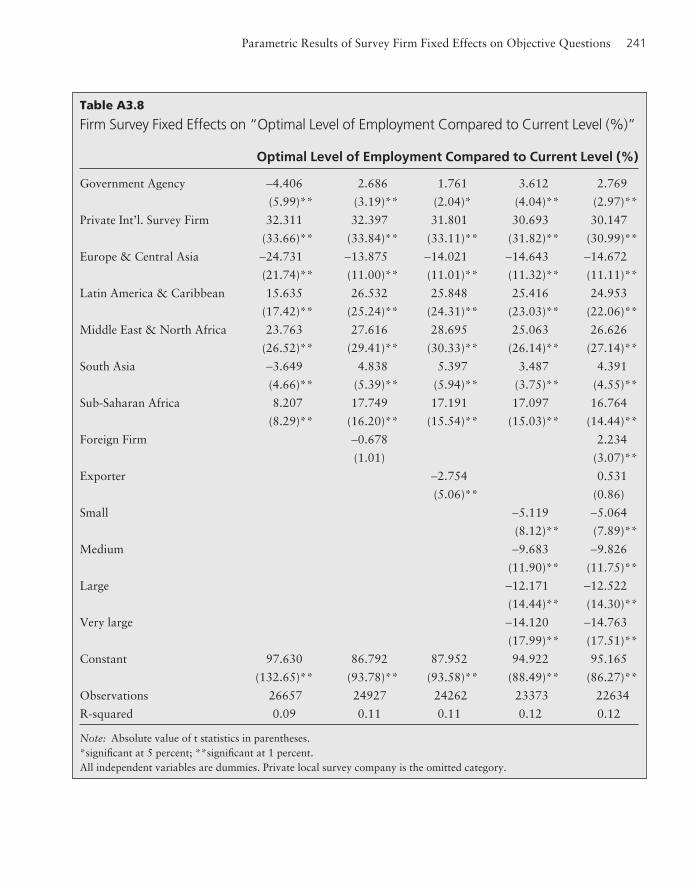
Parametric Results of Survey Firm Fixed Effects on Objective Questions 241
Table A3.8
Firm Survey Fixed Effects on “Optimal Level of Employment Compared to Current Level (%)”
Optimal Level of Employment Compared to Current Level (%)
Government Agency −4.406 2.686 1.761 3.612 2.769
(5.99)** (3.19)** (2.04)* (4.04)** (2.97)**
Private Int’l. Survey Firm 32.311 32.397 31.801 30.693 30.147
(33.66)** (33.84)** (33.11)** (31.82)** (30.99)**
Europe & Central Asia −24.731 −13.875 −14.021 −14.643 −14.672
(21.74)** (11.00)** (11.01)** (11.32)** (11.11)**
Latin America & Caribbean 15.635 26.532 25.848 25.416 24.953
(17.42)** (25.24)** (24.31)** (23.03)** (22.06)**
Middle East & North Africa 23.763 27.616 28.695 25.063 26.626
(26.52)** (29.41)** (30.33)** (26.14)** (27.14)**
South Asia −3.649 4.838 5.397 3.487 4.391
(4.66)** (5.39)** (5.94)** (3.75)** (4.55)**
Sub-Saharan Africa 8.207 17.749 17.191 17.097 16.764
(8.29)** (16.20)** (15.54)** (15.03)** (14.44)**
Foreign Firm −0.678 2.234
(1.01) (3.07)**
Exporter −2.754 0.531
(5.06)** (0.86)
Small −5.119 −5.064
(8.12)** (7.89)**
Medium −9.683 −9.826
(11.90)** (11.75)**
Large −12.171 −12.522
(14.44)** (14.30)**
Very large −14.120 −14.763
(17.99)** (17.51)**
Constant 97.630 86.792 87.952 94.922 95.165
(132.65)** (93.78)** (93.58)** (88.49)** (86.27)**
Observations 26657 24927 24262 23373 22634
R-squared 0.09 0.11 0.11 0.12 0.12
Note: Absolute value of t statistics in parentheses.*significant at 5 percent; **significant at 1 percent.All independent variables are dummies. Private local survey company is the omitted category.

242 The Power of Survey Design
Table A3.9
Firm Survey Fixed Effects on “Days of Power Outages/Surges from Public Grid”
Days of Power Outages/Surges from Public Grid
Government Agency −22.998 −32.970 −33.039 −32.984 −31.998
(24.25)** (25.21)** (25.10)** (24.69)** (23.86)**
Private Int’l. Survey Firm −16.348 −16.200 −16.319 −16.471 −16.366
(18.49)** (17.75)** (17.92)** (17.98)** (17.84)**
Europe & Central Asia 5.191 −5.488 −5.307 −5.673 −5.009
(4.51)** (3.60)** (3.47)** (3.66)** (3.23)**
Latin America & Caribbean −9.723 −20.354 −20.187 −20.089 −19.381
(10.34)** (14.95)** (14.79)** (14.34)** (13.80)**
Middle East & North Africa 22.942 22.224 22.364 22.419 22.046
(24.83)** (20.86)** (20.83)** (20.66)** (20.22)**
South Asia 31.075 27.727 28.925 28.193 28.412
(30.74)** (23.97)** (24.59)** (24.02)** (23.78)**
Sub-Saharan Africa 15.523 5.547 5.318 5.490 5.918
(13.64)** (3.73)** (3.55)** (3.60)** (3.87)**
Foreign Firms −1.420 −0.590
(2.00)* (0.78)
Exporter −2.097 −1.638
(3.72)** (2.64)**
Small −2.364 −2.245
(3.81)** (3.61)**
Medium −3.313 −3.072
(4.04)** (3.69)**
Large −2.530 −1.974
(2.91)** (2.23)*
Very large −2.877 −2.091
(3.57)** (2.44)*
Constant 20.774 31.527 31.667 33.528 32.966
(25.36)** (24.60)** (24.57)** (24.56)** (24.06)**
Observations 20343 18830 18650 18383 18229
R-squared 0.11 0.11 0.11 0.11 0.11
Note: Absolute value of t statistics in parentheses.*significant at 5 percent; **significant at 1 percent.All independent variables are dummies. Private local survey company is the omitted category.

Parametric Results of Survey Firm Fixed Effects on Objective Questions 243
Table A3.10
Firm Survey Fixed Effects on “Days of Insufficient Water Supply”
Days of Insufficient Water Supply
Government Agency −0.713 −2.372 −2.542 −2.907 −2.673
(0.99) (2.40)* (2.55)* (2.89)** (2.64)**
Private Int’l. Survey Firm 1.255 1.466 1.267 1.106 1.264
(1.73) (1.94) (1.68) (1.46) (1.67)
Europe & Central Asia 1.610 −1.621 −1.372 −2.288 −2.242
(1.69) (1.24) (1.04) (1.72) (1.68)
Latin America & Caribbean 3.386 0.228 0.417 −0.259 −0.144
(4.32)** (0.19) (0.35) (0.21) (0.12)
Middle East & North Africa 15.652 14.062 14.606 14.215 14.253
(17.26)** (13.71)** (14.11)** (13.67)** (13.63)**
South Asia 5.883 3.685 4.172 4.018 3.839
(8.33)** (4.09)** (4.56)** (4.39)** (4.15)**
Sub-Saharan Africa 18.382 15.486 15.271 15.113 15.001
(18.12)** (11.64)** (11.37)** (11.12)** (10.97)**
Foreign Firm −2.040 −1.432
(3.48)** (2.31)*
Exporter −1.035 0.019
(2.22)* (0.04)
Small −2.004 −2.063
(3.79)** (3.90)**
Medium −3.260 −3.243
(4.74)** (4.67)**
Large −3.020 −3.047
(4.22)** (4.16)**
Very large −3.606 −3.359
(5.44)** (4.77)**
Constant 2.505 5.843 5.686 8.339 8.354
(3.67)** (5.24)** (5.02)** (6.84)** (6.82)**
Observations 19064 17670 17493 17365 17222
R-squared 0.03 0.03 0.03 0.03 0.03
Note: Absolute value of t statistics in parentheses.*significant at 5 percent; **significant at 1 percent.All independent variables are dummies. Private local survey company is the omitted category.

244 The Power of Survey Design
Table A3.11
Firm Survey Fixed Effects on “Days of Unavailable Mainline Telephone Service”
Days of Unavailable Mainline Telephone Service
Government Agency −4.001 −3.671 −3.557 −3.855 −3.690
(3.91)** (3.46)** (3.36)** (3.61)** (3.46)**
Private Int’l. Survey Firm 0.076 0.009 0.087 0.135 0.067
(0.15) (0.02) (0.16) (0.26) (0.13)
Europe & Central Asia −1.497 −1.418 −1.426 −1.598 −1.383
(1.37) (1.27) (1.28) (1.43) (1.24)
Latin America & Caribbean −2.038 −1.982 −1.960 −2.261 −2.067
(2.00)* (1.90) (1.89) (2.16)* (1.97)*
Middle East & North Africa 20.298 20.143 19.896 20.322 20.328
(24.37)** (22.60)** (22.14)** (22.62)** (22.44)**
South Asia 4.969 4.710 4.624 4.277 4.327
(8.17)** (6.99)** (6.77)** (6.29)** (6.29)**
Sub-Saharan Africa 12.854 12.712 12.290 12.389 12.222
(12.05)** (11.67)** (11.30)** (11.30)** (11.13)**
Foreign Firm 0.649 0.812
(1.57) (1.87)
Exporter −0.381 −0.725
(1.12) (1.96)
Small 0.235 0.273
(0.64) (0.74)
Medium 0.531 0.625
(1.09) (1.27)
Large 1.045 1.112
(2.04)* (2.12)*
Very large 0.363 0.496
(0.76) (0.98)
Constant 5.165 5.053 5.169 4.939 4.772
(5.26)** (5.02)** (5.17)** (4.81)** (4.64)**
Observations 17355 16700 16516 16426 16295
R-squared 0.06 0.06 0.06 0.06 0.06
Note: Absolute value of t statistics in parentheses.*significant at 5 percent; **significant at 1 percent.All independent variables are dummies. Private local survey company is the omitted category.

Parametric Results of Survey Firm Fixed Effects on Objective Questions 245
Table A3.12
Firm Survey Fixed Effects on “Percent of Sales Lost Due to Power Outages/Surges”
Percent of Sales Lost Due to Power Outages/Surges
Government Agency −0.083 −0.212 −0.213 −0.242 −0.229
(1.09) (2.37)* (2.35)* (2.62)** (2.43)*
Private Int’l. Survey Firm 0.091 0.096 0.074 −0.004 −0.013
(0.39) (0.41) (0.32) (0.02) (0.06)
Europe & Central Asia 0.674 0.492 0.548 0.350 0.386
(5.57)** (3.65)** (4.08)** (2.57)* (2.80)**
Latin America & Caribbean 0.468 0.292 0.350 0.162 0.200
(4.83)** (2.59)** (3.11)** (1.38) (1.68)
Middle East & North Africa 1.464 1.412 1.440 1.234 1.260
(15.00)** (14.08)** (14.47)** (12.04)** (12.09)**
South Asia 1.984 1.841 1.917 1.724 1.783
(24.20)** (19.55)** (20.36)** (17.99)** (17.91)**
Sub-Saharan Africa 0.615 0.485 0.525 0.341 0.341
(5.98)** (4.33)** (4.67)** (2.94)** (2.90)**
Foreign Firm −0.165 0.106
(1.91) (1.11)
Exporter −0.367 −0.136
(5.38)** (1.75)
Small −0.164 −0.173
(1.94) (2.02)*
Medium −0.631 −0.639
(6.11)** (6.07)**
Large −0.675 −0.681
(6.51)** (6.38)**
Very large −0.890 −0.874
(9.01)** (8.36)**
Constant 1.390 1.580 1.585 2.062 2.049
(18.15)** (16.38)** (16.41)** (17.34)** (16.94)**
Observations 14413 13821 13587 12293 12019
R-squared 0.06 0.06 0.06 0.06 0.06
Note: Absolute value of t statistics in parentheses.*significant at 5 percent; **significant at 1 percent.All independent variables are dummies. Private local survey company is the omitted category.

246 The Power of Survey Design
Table A3.13
Firm Survey Fixed Effects on “Percent of Sales Lost Due to Insufficient Water Supply Last Year”
Percent of Sales Lost Due to Insufficient Water Supply Last Year
Government Agency 1.016 0.575 0.573 0.665 0.653
(4.96)** (2.37)* (2.34)* (2.64)** (2.59)**
Private Int’l. Survey Firm 0.191 0.173 0.197 0.140 0.149
(0.58) (0.52) (0.59) (0.42) (0.44)
Europe & Central Asia −0.486 −0.963 −0.930 −0.856 −0.881
(2.73)** (4.37)** (4.25)** (3.83)** (3.91)**
Latin America & Caribbean 0.068 −0.407 −0.373 −0.383 −0.402
(0.38) (1.84) (1.70) (1.70) (1.77)
Middle East & North Africa −0.986 −1.030 −0.968 −1.073 −1.046
(6.02)** (6.10)** (5.60)** (6.22)** (5.96)**
South Asia 0.000 0.000 0.000 0.000 0.000
(.) (.) (.) (.) (.)
Sub-Saharan Africa −0.861 −1.307 −1.315 −1.194 −1.243
(3.43)** (4.62)** (4.61)** (4.08)** (4.22)**
Foreign Firm −0.295 −0.235
(1.57) (1.15)
Exporter 0.044 0.264
(0.34) (1.86)
Small 0.194 0.164
(1.38) (1.15)
Medium 0.125 0.089
(0.71) (0.50)
Large −0.037 −0.098
(0.20) (0.51)
Very large −0.383 −0.461
(2.05)* (2.27)*
Constant 0.987 1.481 1.421 1.342 1.361
(6.64)** (7.49)** (7.24)** (6.42)** (6.43)**
Observations 2281 2191 2172 2164 2153
R-squared 0.04 0.04 0.04 0.05 0.05
Note: Absolute value of t statistics in parentheses.*significant at 5 percent; **significant at 1 percent.All independent variables are dummies. Private local survey company is the omitted category.

Parametric Results of Survey Firm Fixed Effects on Objective Questions 247
Table A3.14
Firm Survey Fixed Effects on “Percent of Sales Lost Due to Unavailable Telephone Service Last Year”
Percent of Sales Lost Due to Unavailable Telephone ServiceLast Year
Government Agency −1.068 −1.081 −1.029 −0.852 −0.844
(4.62)** (4.67)** (4.44)** (3.48)** (3.42)**
Private Int’l. Survey Firm −0.157 −0.147 −0.158 −0.273 −0.276
(0.48) (0.46) (0.49) (0.84) (0.85)
Europe & Central Asia −1.557 −1.583 −1.532 −1.430 −1.420
(9.09)** (9.13)** (8.92)** (7.99)** (7.75)**
Latin America & Caribbean −0.768 −0.793 −0.754 −0.699 −0.691
(4.64)** (4.73)** (4.55)** (3.87)** (3.76)**
Middle East & North Africa 0.000 0.000 0.000 0.000 0.000
(.) (.) (.) (.) (.)
South Asia 0.000 0.000 0.000 0.000 0.000
(.) (.) (.) (.) (.)
Sub-Saharan Africa −1.798 −1.805 −1.725 −1.519 −1.511
(7.98)** (8.01)** (7.53)** (6.28)** (6.18)**
Foreign Firm −0.162 0.043
(0.96) (0.24)
Exporter −0.216 −0.013
(1.73) (0.09)
Small 0.187 0.186
(1.06) (1.05)
Medium −0.323 −0.325
(1.58) (1.57)
Large −0.383 −0.386
(1.83) (1.80)
Very large −0.456 −0.463
(2.21)* (2.07)*
Constant 2.028 2.065 2.057 2.035 2.028
(14.36)** (14.10)** (14.47)** (12.15)** (11.93)**
Observations 1685 1685 1685 1677 1677
R-squared 0.06 0.07 0.07 0.08 0.08
Note: Absolute value of t statistics in parentheses.*significant at 5 percent; **significant at 1 percent.All independent variables are dummies. Private local survey company is the omitted category.

248 The Power of Survey Design
Table A3.15
Firm Survey Fixed Effects on “Percentage of Average Cargo Value Lost in Transit”
Percentage of Average Cargo Value Lost in Transit
Government Agency −0.080 −0.203 −0.183 −0.191 −0.176
(1.12) (2.85)** (2.56)* (2.59)** (2.37)*
Private Int’l. Survey Firm −2.051 −1.623 −1.629 −1.628 −1.629
(14.06)** (12.77)** (12.80)** (12.71)** (12.71)**
Europe & Central Asia 1.477 0.871 0.908 0.913 0.905
(14.58)** (8.92)** (9.31)** (9.16)** (9.02)**
Latin America & Caribbean 0.194 −0.091 −0.064 −0.040 −0.056
(2.41)* (1.12) (0.79) (0.47) (0.66)
Middle East & North Africa 0.317 0.075 0.098 0.093 0.066
(4.29)** (1.13) (1.48) (1.33) (0.94)
South Asia 0.075 −0.107 −0.102 −0.075 −0.115
(0.84) (1.28) (1.21) (0.87) (1.30)
Sub-Saharan Africa 0.204 0.000 −0.013 0.020 −0.008
(2.47)* (0.00) (0.17) (0.24) (0.09)
Foreign Firm −0.143 −0.181
(2.45)* (2.77)**
Exporter 0.089 0.153
(1.88) (2.86)**
Small 0.046 0.037
(0.75) (0.60)
Medium −0.003 −0.020
(0.04) (0.27)
Large 0.064 0.041
(0.86) (0.54)
Very large 0.003 −0.039
(0.04) (0.52)
Constant 0.941 1.132 1.074 1.060 1.075
(13.55)** (15.43)** (14.66)** (12.00)** (12.09)**
Observations 17335 15924 15783 14712 14477
R-squared 0.02 0.02 0.02 0.02 0.02
Note: Absolute value of t statistics in parentheses.*significant at 5 percent; **significant at 1 percent.All independent variables are dummies. Private local survey company is the omitted category.

Appendix 4
Table of zα/2 Distribution Corresponding toDifferent Levels of Confidence α
249
α zα/2 α zα/2 α zα/2 α zα/2
68.3% 1 86.4% 1.49 94.0% 1.88 97.7% 2.27
68.8% 1.01 86.6% 1.5 94.1% 1.89 97.7% 2.28
69.2% 1.02 86.9% 1.51 94.3% 1.90 97.8% 2.29
69.7% 1.03 87.1% 1.52 94.4% 1.91 97.9% 2.30
70.2% 1.04 87.4% 1.53 94.5% 1.92 97.9% 2.31
70.6% 1.05 87.6% 1.54 94.6% 1.93 98.0% 2.32
71.1% 1.06 87.9% 1.55 94.8% 1.94 98.0% 2.33
71.5% 1.07 88.1% 1.56 94.9% 1.95 98.1% 2.34
72.0% 1.08 88.4% 1.57 95.0% 1.96 98.1% 2.35
72.4% 1.09 88.6% 1.58 95.1% 1.97 98.2% 2.36
72.9% 1.1 88.8% 1.59 95.2% 1.98 98.2% 2.37
73.3% 1.11 89.0% 1.60 95.3% 1.99 98.3% 2.38
73.7% 1.12 89.3% 1.61 95.4% 2.00 98.3% 2.39
74.2% 1.13 89.5% 1.62 95.6% 2.01 98.4% 2.40
74.6% 1.14 89.7% 1.63 95.7% 2.02 98.4% 2.41
75.0% 1.15 89.9% 1.64 95.8% 2.03 98.4% 2.42
75.4% 1.16 90.1% 1.65 95.9% 2.04 98.5% 2.43
75.8% 1.17 90.3% 1.66 96.0% 2.05 98.5% 2.44
76.2% 1.18 90.5% 1.67 96.1% 2.06 98.6% 2.45
76.6% 1.19 90.7% 1.68 96.2% 2.07 98.6% 2.46
77.0% 1.2 90.9% 1.69 96.2% 2.08 98.6% 2.47
77.4% 1.21 91.1% 1.70 96.3% 2.09 98.7% 2.48
77.8% 1.22 91.3% 1.71 96.4% 2.10 98.7% 2.49
78.1% 1.23 91.5% 1.72 96.5% 2.11 98.8% 2.50
78.5% 1.24 91.6% 1.73 96.6% 2.12 98.8% 2.51

250 The Power of Survey Design
α zα/2 α zα/2 α zα/2 α zα/2
82.3% 1.35 91.8% 1.74 96.7% 2.13 98.8% 2.52
82.6% 1.36 92.0% 1.75 96.8% 2.14 98.9% 2.53
82.9% 1.37 92.2% 1.76 96.8% 2.15 98.9% 2.54
83.2% 1.38 92.3% 1.77 96.9% 2.16 98.9% 2.55
83.5% 1.39 92.5% 1.78 97.0% 2.17 99.0% 2.56
83.8% 1.4 92.7% 1.79 97.1% 2.18 99.0% 2.57
84.1% 1.41 92.8% 1.80 97.1% 2.19 99.0% 2.58
84.4% 1.42 93.0% 1.81 97.2% 2.20 99.0% 2.59
84.7% 1.43 93.1% 1.82 97.3% 2.21 99.1% 2.60
85.0% 1.44 93.3% 1.83 97.4% 2.22 99.1% 2.61
85.3% 1.45 93.4% 1.84 97.4% 2.23
85.6% 1.46 93.6% 1.85 97.5% 2.24
85.8% 1.47 93.7% 1.86 97.6% 2.25
86.1% 1.48 93.9% 1.87 97.6% 2.26
Source: Rea and Parker 1997.

Appendix 5
Table of Random Numbers
251
7766 8840 8661 9670 7875 2977 2194 1237 6611 5342
7481 5371 1661 5913 3302 2595 9237 0318 4626 3786
0588 2012 1045 8022 3870 9411 2202 0837 7487 4904
0579 7695 6900 4870 6014 5311 0657 0626 6031 0674
7998 7098 9794 5599 4404 7589 6950 6403 9668 1789
5509 7915 1156 6588 0816 9695 3317 6045 8131 5046
7919 1649 9908 8001 5635 4142 7258 2039 3353 8526
2870 1206 7102 3450 3016 8358 3998 8401 2785 1735
5444 5359 3444 4993 6175 1987 3493 8516 1879 6594
9369 3143 9393 7739 7240 6632 9086 6588 4119 3686
2494 6541 6464 9513 4697 4312 8602 7950 6790 1419
0407 6701 5903 2737 8320 1782 1180 4608 3268 6026
6724 6338 7653 2914 0247 7031 2088 2431 1465 2335
6906 9051 4894 8977 4166 5460 6695 4673 7659 2005
6656 2091 6148 9173 9880 9694 4509 9321 9040 0301
3648 0201 8894 2008 0764 0884 2641 2554 4365 8224
6293 8557 1206 0788 2237 0384 8069 9329 2234 6788
9401 557 7198 4726 5899 7211 6993 2246 7252 7562
5294 1897 8249 7684 8683 0527 5327 1640 9434 8186
2743 7839 7117 1672 4337 6073 8341 3132 6105 3789
4600 1971 6306 7527 0157 5961 8670 3335 5477 8138
2958 0144 3962 8316 9746 3127 2743 6766 3508 8634
1931 8079 6347 8056 0071 0617 4970 2675 5543 4684
0252 3123 7412 1662 2119 7663 3343 1716 9600 4250
0600 1363 5737 5183 4558 2101 0289 8807 7432 2187
7184 7511 6759 5868 5882 3186 572 6780 0717 2777
5303 1777 7720 3326 1776 3497 2738 9829 4887 9410

252 The Power of Survey Design
4694 3749 8090 7967 6811 505 4648 8041 9757 6185
8419 1226 6768 2864 3548 3254 8389 5906 2664 4831
7148 5893 906 1180 1738 4855 8443 1915 7249 2935
8950 2714 2008 8494 1097 4638 6323 8662 4332 1552
7931 1476 3638 4119 1930 5546 4686 5007 1026 6696
5050 4902 7768 5939 2570 5703 6062 6720 5565 8794
2456 9038 3484 8709 2590 4033 8477 0657 7875 0600
2116 5291 9382 8136 4527 7955 4223 6178 7026 0420
0193 8067 9122 7735 1245 2806 0333 8267 1504 4244
3838 2705 9429 3924 9273 1294 9710 1580 4041 0520
9087 6103 9635 9027 1197 3679 9198 4046 1803 7159
4849 8586 6334 892 3783 8668 0896 3808 2683 7869
4503 3955 5137 8928 4668 4722 0701 5000 0536 7813
1471 6670 3756 6138 5505 2347 9451 8565 9249 8731
0210 5175 242 4484 5118 1807 1996 9551 6277 1873
3893 889 7898 7729 5549 5555 2251 4253 2664 8323
1756 9782 0237 2753 6799 9267 3463 8867 8475 2270
3095 8249 0420 0891 1146 6260 9657 2475 4158 4325
9616 7652 8895 4913 2182 8584 1901 0364 7491 5092
0122 0438 4559 9192 5320 8675 1812 3015 4428 2273
4411 3822 8231 0146 0589 3644 1407 2580 8004 0677
2687 1533 9055 7113 9331 0730 2159 7141 7703 4704
4910 3376 7024 3533 1969 4117 6048 7872 2123 4424
Source: Kish 1965.

Appendix 6
Information Disclosed in Survey Introductions
253
Percent
1 Research organization 85.9
2 Study director’s name 82.1
3 Research topic 80.8
4 Sponsor 44.9
5 Confidentiality 42.3
6 Anonymity 25.6
7 Purpose 25.6
8 Future data use 24.4
9 Sampling technique 20.5
10 Survey length 12.8
11 Participation voluntary 10.3
12 Sample size 3.8
13 Consent signature 3.8
Source: Sobal 1984.


Appendix 7
Minimum Field Work Log Data
255
Super- PostID Strata visor Visits Non Response Response Stratification
1st REF = Refuse AGR=agree to participate (final strata)
2nd OOS = Out of scope F1 = Form partially completed
3rd NC = No Contact FF = Form fully completed
FV = Form validated
FE = Form entered
1 A JM 12–Dec OOS A
2 A JM 13–Dec AGR C
3 B JM 14–Dec AGR B
4 B GI 13–Dec REF AGR B
5 C GI 14–Dec F1 A
6 C GI 14–Dec FF C
…. …. …. …. …. …. ….
…. …. …. …. …. …. ….
…. …. …. …. …. …. ….
…. …. …. …. …. …. ….

Aability to answer, 42–43absence, 174accuracy, 52–53, 57, 191, 198
questionnaire length and, 79standardized vs flexible questioning, 181time and, 59
acquiescence bias, 44–45acquisitions, 115–119actors and functions, 14, 15–16agency type, 16–17agree-disagree format, 64–65altruism, respondents’ participation, 157–158answers
alternative, 42distribution of, 213, 214, 216, 217
assumptions, built-in, 36–37authority, 157, 170–171
Bback translation, 86benefits, 172, 173–174bias
minimizing, 50survey firm, 49–50
bipolar concepts, 63blanks, 112–113, 122business surveys, 53
unit of analysis, 97–98busy response, 171
Ccargo, lost in transit, 248categories, number of, 61–62checks, 194cleaning, 195–201, 212
inconsistencies, 201–217internal inconsistencies, 201–217limitations of, 212–216steps, 196–201
closed-ended questions, 42, 52, 73external shocks, 74responses, 72
clustering, 113–115codes, unique, 197
coding, 188–189, 190cognitive ability, 55–56cognitive effort, by question type, 200comparability of responses, 65–67completeness, 190–191complexity, 44conditional questions, 76confidence level, 6
zα/2 distribution, 249–250 consistency, 11, 191, 198–201
checks, 197norm, 169–170
contact, initial, 164–168contact person, respondents’ participation, 150content, 173continuity, 76corruption, 3
questions, 231cost, 17–20
poststratification and, 129coverage, inaccurate or incomplete, 124customs
days to claim imports, 239days to clear for exports, 240
Ddata
invalid, 200management, 187–217output, 194quality control, 20–24sanctity of, 196
data entry, 187 electronic, 191–195manager, 16staff, 16
data entry form, 11testing, 11–12software, 11
data manager, 187–188definitions, 37–40depth, embedded controls, 195descriptive words, perceived percentage values associated
with, 66dictionary file, 194
Index
257

discrimination, blurred, 198double-barreled questions, 42, 43duplicates, 112
Eediting, 189–191, 197–198
final, 195employment
contribution, 135optimal level vs current level, 241
episode enumeration, 55–56, 58epsem methods, 96, 106–109, 120equal allocation, 99, 104errors, 196, 198
estimation and reduction, 95internally consistent, reconciliation of, 198–201
eventsfrequency, 56–57recall, 54–55unique, 58
exaggeration, 177explaining the study, 166–167external factors, 68external shocks, 74
Fface-to-face interviews, 6, 7–8
length, 80feedback, 184–185fieldwork, 20
log data, minimum, 255organization, 14, 15
filtering, 73filter questions, 76–77filter-unfolding method, 46, 47–48first impression, 165fonts and formats, questionnaire layout, 84foreign elements, 112–113, 122frames
problems, 110–115supplementary, 111
GGannt Chart, 23, 24gifts expected as % value of government contracts, 235government regulations, percentage of management time
dealing with, 237government surveys, vs private, 69
Hhelping norm, respondents’ participation, 157–158hyperresponsive, 174–175
hypothetical questions, 48
Iidentification
questionnaire layout, 81unique method, 112
ignorance, 77ignoring questions, 164ignoring selected elements, 112–113importance, 173imputation, 197–198
extensive, 196inaccuracy or incompleteness, 124incentives, 149–150, 151inconsistencies
answers, 207–208consistencies and, 204cross-check, 209–212distribution, 203examples, 201–217internal, 199–201mulitplicity, 202–205
individual variation, respondents’ participation, 158infrastructure, 232instructions, 184–185
questionnaire layout, 81, 84interaction, establishing and maintaining, 165–168interest, lack of, 172interpretation, 5–6interview
agency, 51conducting, 178–185cycle, 21ending, 185feedback, 184–185instruction, 184–185length, 151–153, 172mode, 6, 7–8, 29probing, 182–183, 184process, 20prompting, 183–184question asking, 179–182respondents’ participation, 151–153standardized vs flexible, 180–181style, 178–179tandem, 175–178
interviewer, 16, 20, 22ability, 71–72, 93–94age, 159characteristics, 159–160emphasis, 158error response and, 160
258 Index

experience, 159paying, 18respondents’ participation, 155–156role, 178selection, 161tips, 163–164training, 160–162
introduction, 165–167information disclosed, 253
introductory letter, 22invalid entries, 197Investment Climate Survey, questionnaire, 229
Jjargon, 37
KKish’s selection grid, 114
Llabels, 188–189layout, screen and data entry form, 195leading questions, 32, 34legibility, 44letters, 22, 149, 171likeableness, 163liking, 171
respondents’ participation, 157linking procedure, 111lists, long and repetitive, 45–46loaded questions, 36location, 164–165logical checks, 194
Mmagnitude estimation, 70mayor, advising, sample size, 100–101memory
error index, 55questions, 54–58
mergers, 115–119monitoring, 23, 25
NNA, 197, 198narrative questions, 71–74negative expressions, 38–39neutrality, 163–164noncoverage, 110, 111, 122, 124nonresponse, 110
adjustment factor, 120, 122numbering, questionnaire layout, 81
numeric scales, response pattern and, 63
Oobjective questions, 58–65
example, 71parametric estimation of survey firm fixed effect, 231parametric results of survey firm fixed effects,
233–248objectivity, 32–33open-ended questions, 52, 71–73
external shocks, 74responses, 72
opening questions, 75opening remarks, 165–166opinion, 28, 77
change, 158polls, 95
optimum allocation, 101, 104opt out option, 62outliers, 196overreporting, 17
Pparaphrasing, 93participation
factors affecting, 147–158 securing, 164–168
pay rate, 18perception questions, 60–61
Investment Climate Survey, 229persuasion
quantity and quality of arguments, 168quantity of arguments and, 166–167
physical environment, respondents’ participation, 154–155pilot test. See pre-testplanning, 9, 163plausibility of answers, 65politeness bias, 36population
accuracy, 20, 22target, 111, 136
population distribution, 130strata, 130, 132
population frame problems, 110solutions, 111–115
position bias legibility, 44complexity, 44repetitive lists, 456
positiveness, 163poststratification, 111, 120–129, 143, 145–146
sample, 144
Index 259

power outagesdays of, 242sales lost due to, 245
preparation, 9, 163pre-test, 11, 86–94, 195
checklist, 90, 92goals, 89, 93methods, 87, 90questionnaire problems list, 91–92size, 94
probability proportional to size (PPS) sampling, 95, 142procedure, 107–110
probability sampling, 95–96probing, 182–183, 184problems, practical, 171–178
letter, 171program design, 10prompting, 183–184proportionate allocation, 101, 104
Qquality control, 22, 194questionnaire
accuracy, 27–28complexity, 205design, 10–11, 29, 200distributing, 177–178examples, 82–84features, 20fonts and formats, 84guidelines, 29identification, 81instructions, 81, 84layout, 80–85length, 78–80, 150–151numbering, 81open-ended, 52, 71–74 opening, 75perception, 60–61, 229problems, list for pre-test review, 91–92respondents’ participation, 150–151space, 81symbols, 84–85
questions affirmative, 41asking, 179–182closed-ended, 42, 52, 73, 74complexity, 44design, 1–2, 3, 27–94export, 210flow, 75–77, 206leading, 32, 34
legibility, 44length, 31–32, 33loaded, 36memory, 54–58narrative, 71–74objective, 32–33, 58–65, 71, 231, 233–248order, 76–77painless, 49recall and, 57red tape, 231–232 relevant, 48remote 209, 211repetitive lists, 45sensitive, 49, 52–53, 77–78sequence, 74–78simplicity, 37–39specificity, 39–43structure, 207, 210style, 44–49 subjective, 58–71type, 49–74understanding, 44wording, 27, 29–31, 42–43, 57
Rrandomness, clustering and, 114random numbers, table of, 251–252random sampling, sample size, 96, 98–99range checks, 194rank ordering, 63–64rating scales, 59–61
categories, 61recall
accuracy, 59bias, 54stimulating, 57
recurring events, 54–55red tape, questions, 231–232 refusal, 175
rates, 163reliability
checks, 194of respondent, 67–69
reluctance, 164, 169, 176, 177remote questions, 209, 211representation, 6, 129respondents, 28
absence, 174association with answers, 53bias and, 50characteristics, 154cognitive effort, 200
260 Index

different, 213education level, 29, 35hyperresponsive, 174–175participation, factors affecting, 147–158 psychology, 147–185psychology, gauging, 169–171refusal, 175reliability, 67–69role, 179second, 175–178selection, 95state of mind, 156–158survey design, 148–156unresponsive, 174willingness, 28
response artifacts, 2–3nonresponse, 110options, 32, 35time, 58truthful, 164, 177
response rate, 22, 35control program, 22questionnaire length and, 78–79
responsibility, 21, 172responsiveness, 163rushing, 164
Ssalaries, 18sales, percentage declared for tax purposes, 236saliency of event, 55sample, adjustment, 112sample size, 131, 133, 134, 137
example, 100–101sampling
approach, 95–146design, steps, 129maximizing representativeness, minimizing cost,
129–146parameters, 129procedures, 95–96 strategy, implementation, 140structure and weights, 120–122unit, 97–98weights, mergers, acquisitions, and separations and,
115–119scarcity, 170
respondents’ participation, 157selection
Kish’s grid, 114two-stage, 113
self-administered surveys, 185categories, 61
sensitive questions, 49, 52–53location of, 77–78
sensitivity, 173separations, 115,–119sequence of activities, 10, 23, 24simple random sampling (SRS), 95, 96, 98–99, 120–128,
142example, 125 stratified random sampling vs, 122
skipping pattern, 20, 205–206, 209social environment, respondents’ participation and, 147social norms, respondents’ participation, 156–157social proof, 170
respondents’ participation, 157space, questionnaire layout, 81sponsorship, respondents’ participation, 157SRS. See simple random sampling statistics, 95strata, 130, 132, 143stratification, 133–140
first and second level, 139, 141stratified random sampling
example, 123sample size, 99–104simple random sampling vs, 122
structural stability, verification, 196–197style, 178–179subjective question, 58–65
example, 70limitations, 65–71rating scales, 60
supervision, 23, 25supervisor, 15–16, 22, 189survey
design, respondents’ participation and, 148–156methodology, 149multicountry, 192results, comparison, 2
survey director, 15survey firm
bias, 49–50criteria, 12–13government vs private, 51, 52selection, 12, 14
survey management, 4, 9–25survey manager, 9–10, 15, 18, 20, 22–23, 187–188
pre-test, 94symbols, questionnaire layout, 84–85systematic sampling, procedure, 104–107
Index 261

Ttailoring, 168–178tandem interviewing, 175–178target population, 136
defining, 111taxes, percentage of sales declared for, 236tax inspectorate, days spent with officials, 238telephone survey, 6, 7–8
categories, 61telephone service
days unavailable, 244sales lost due to, 247
telescoping, 54terms
consistency, 37–40negative or positive, 68of reference (TOR), 14,16unclear, 88–89
testing. See pretesttime, 171, 172, 173
constraints, respondents’, 151–153timing, 23, 164–165
respondents’ participation, 150tools, 23, 24, 25topic, 174
respondents’ participation, 153training, 20
respondents’ participation, 159–162tips, 163–164
translation, 85–86technique, 86
transliteration, 85–86truthfulness, 164, 177typographical errors, correction, 198
Uunderreporting, 3, 17
time and, 60unique identifier (ID), 192, 193unit of analysis, 97–98unofficial payments to get things done, 234unresponsive, 174unwillingness, 177
Vvariability of answers, 71variable name, 192verbal stimuli, 62
Wwater supply
insufficient, days of, 243sales lost due to, 246
weighting, 120–122 adjustment, 112, 120–129estimating, 143final, 128, 144
withholding information, 35–36words. See terms
Zzero, 197, 198
262 Index


“Are you in favor of financial incentives for poor countries?” If this question wereasked in a survey many people would be inclined to agree. But the result would bedifferent if the question asked were “Are you in favor of subsidies for poor coun-tries?” Changing one word can change the answer to basically the same question.
The wording of survey questions can have a dramatic effect on responses—often as much as a 30 percent swing. This means that a skilled questionnaire designer can“demonstrate” popular support (or nonsupport) by wording questions in a mannerthat tends to produce responses that align with his or her desired objective.
Skewed responses are not limited to the wording of questions. Comparing surveyresults across international boundaries is a common occurrence, but this is oftendone without considering and controlling for such factors as who is asking the ques-tion. For example, underreporting will always occur if a government official asksquestions about taxes and corruption.
Written both for those who manage surveys and those who use their results, ThePower of Survey Design not only reveals the multitude of survey design factors thatplay subtle but crucial roles in the accuracy of survey data and therefore can tainttheir interpretation, but also offers a guide to the steps involved in administering asurvey and convincing potential respondents to participate. Finally, a chapter on datacleaning offers a unique method for improving the accuracy of data after the survey’scompletion.
A master of his craft, Giuseppe Iarossi has drawn on his extensive experience in the field to produce a wonderfully useful volume on how to do and
work with surveys of industrial firms.Kenneth L. Sokoloff
University of California, Los Angeles
Just as anyone who visits a sausage factory never feels quite the same again about eating a sausage, readers of this book will never feel quite
the same about data that is handed to them.From the foreword by David Dollar
China Country DirectorThe World Bank
ISBN 0-8213-6392-1