the of biological vol. 269, no. 20, 14396-14401, 1994 1994 ... · exercise induces rapid increases...
TRANSCRIPT

THE JOURNAL OF BIOLOGICAL CHEMISTRY 0 1994 by The American Society for Biochemistry and Molecular Biology, Inc
Vol. 269, No. 20, Issue of May 20, pp. 14396-14401, 1994 Printed in U.S.A.
Exercise Induces Rapid Increases in GLUT4 Expression, Glucose Transport Capacity, and Insulin-stimulated Glycogen Storage in Muscle*
(Received for publication, January 3, 1994, and in revised form, February 22, 1994)
Jian-Ming RenS, Clay F. SemenkovichO, Eric A. Gulve, Jiaping Gao, and John 0. Holloszfl From the Departments of Medicine and Cell Biology and Physiology, Washington University School of Medicine, St. Louis, Missouri 63110
GLUT4 glucose transporter content and glucose trans- port capacity are closely correlated in skeletal muscle. In this study, we tested the hypothesis that a rapid in- crease in GLUT4 expression occurs as part of the early adaptive response of muscle to exercise and serves to enhance glycogen storage. Rats exercised by swimming had a *-fold increase in GLUT4 mRNA and a 50% in- crease in GLUT4 protein expression in epitrochlearis muscle 16 h after one prolonged exercise session. After a 2nd day of exercise, muscle GLUT4 protein was in- creased further to +-fold while there was no additional increase in GLUT4 -A. Muscle hexokinase activity also doubled in response to 2 days of exercise. Glucose transport activity maximally stimulated with insulin, contractions, or hypoxia was increased roughly in pro- portion to the adaptive increase in GLUT4 protein in epitrochlearis muscles. Treatment with insulin prior to subcellular fractionation of muscle resulted in a -2-fold greater increase in GLUT4 content of a plasma mem- brane fraction in the 2-day swimmers than in controls. When epitrochlearis muscles were incubated with glu- cose and insulin, glycogen accumulation over 3 h was twice as great in muscles from 2-day swimmers as in control muscles. Our results show that a rapid increase in GLUT4 expression is an early adaptive response of muscle to exercise. This adaptation appears to be medi- ated by pretranslational mechanisms. We hypothesize that the physiological role of this adaptation is to en- hance replenishment of muscle glycogen stores.
Stimulation of glucose transport by insulin in its target tis- sues is largely mediated by translocation of glucose transporters from intracellular sites into the plasma membrane (1-6). In skeletal muscle, glucose transport is also stimulated by con- tractile activity that, like insulin, induces a translocation of glu- cose transporters into the plasma membrane (7,8). Two isoforms of the facilitative glucose transporter family, GLUT4 and GLUT1, are expressed in skeletal muscle (9-11). Available evi- dence indicates that it is the GLUT4 isoform that is translocated by the actions of insulin and contractions (8,121. The less abun-
*This research was supported by National Institutes of Health Grants DK18986 (to J. 0. H.) and HL47436 (to C. F. S.). The costs of publication of this article were defrayed in part by the payment of page charges. This article must therefore be hereby marked “uduertisement” in accordance with 18 U.S.C. Section 1734 solely to indicate this fact.
AGO0078 from the National Institutes of Health. Current address: $ Supported by Institutional National Research Service Award
Miles, Inc., 400 Morgan Ln., West Haven, CT 06516. 8 Established Investigator of the American Heart Association.
sity School of Medicine, Campus Box 8113, 4566 Scott, St. Louis, MO 1 To whom correspondence should be addressed: Washington Univer-
63110.
dant GLUT1 isoform appears to be located primarily in the plasma membrane and to play a role in basal, but not insulin or contraction-stimulated, glucose transport (9, 11). The GLUT4 protein content of skeletal muscles varies markedly between fiber types (10, 13, 14). There is a close correlation between muscle GLUT4 protein concentration and maximally stimu- lated glucose transport (13, 15). Furthermore, GLUT4 protein concentration and maximally stimulated glucose transport ac- tivity vary in parallel in response to different adaptive stimuli (15-19). This relationship suggests that a muscle’s GLUT4 con- tent determines its capacity for stimulated glucose transport when the signaling pathways that mediate the stimulation of glucose transport by insulin and exercise are intact.
A major stimulus that induces an adaptive increase in GLUT4 in muscle is exercise. This adaptation has been shown to occur in response to 6- to 12-week-long programs of running or swim- ming (16,17,20-23). Such relatively long training periods were used because of the common belief that the adaptation of skel- etal muscle to exercise is a relatively slow process. However, if an adaptation is to have survival value, it must occur rapidly enough to improve the organism’s ability to deal with the en- vironmental change responsible for the adaptive response. An adaptation that takes 6 weeks to occur would generally be an irrelevant response to a sudden environmental change that ne- cessitates a sustained increase in physical activity. One purpose of this study was to test the hypothesis that the adaptive in- crease in GLUT4 occurs rapidly in response to an adequate ex- ercise stimulus. Our results show that this hypothesis is correct and provide evidence that exercise increases GLUT4 expression at the pretranslational level. A second purpose was to obtain information regarding the biological role ofthis adaptation. Our findings suggest that this adaptation functions to enhance the ability to replenish muscle glycogen stores.
EXPERIMENTAL PROCEDURES M~terials-3-0-[~H1Methyl-~-glucose, [14Clmannitol, and ‘251-labeled
anti-rabbit IgG were from ICN Radiochemicals. [32P1CTP was obtained from DuPont NEN. GLUT4 cDNA and polyclonal antibody F349 against the GLUT4 protein were kindly given to us by Dr. Mike Mueckler of Washington University School of Medicine. Reagents for SDS-polyac- rylamide gel electrophoresis were obtained from Bio-Rad. Reagents for isolation of mRNAwere obtained from Promega. All other reagents were purchased from Sigma.
Animals and Exercise Program-Female specific pathogen-free rats weighing -100 g were obtained from Sasco and maintained on a diet of Purina chow and water. The rats were accustomed to swimming for 10 midday for 2 days, and then they were exercised using a modification of the procedure of Ploug et al. (16) in which they swam in water maintained at -34 “C for two 3-h-long bouts separated by a 45-min-long rest period, during which the rats were kept warm and given food and water. Some rats performed this exercise program once (I-day exercise group), and others were exercised a second time, using the same pro- tocol, after a 16-h rest period (2-day exercise group). Approximately 16 h after the last bout of exercise, which is long enough to permit the
14396

GLUT4 Expression in Muscle after Exercise acute effect of exercise on insulin responsiveness to wear off (24), exer- cised and control rats were anesthetized with an intraperitoneal injec- tion of pentobarbital, 5 mg/100 g of body weight, and the epitrochlearis muscles were dissected out. The epitrochlearis is a small, thin forelimb muscle weighing -15 mg in 100-g rats that is suitable for measurement of glucose transport activity in vitro (25). The anesthetized rats were killed by exsanguination. This research was approved by the Animal Studies Committee of Washington University.
Measurement of GLUT4 and P-Actin mRNA-Total RNA from ep- itrochlearis muscles was isolated as described by Chomczynski and Sacchi (26). The integrity of samples was verified by analysis of 28 and 18 S ribosomal subunits on denaturing agarose gels, and all samples assayed had 260:280 absorbance ratios of greater than 1.8. Message levels were determined by solution hybridizatiodRNase protection us- ing in vitro transcribed rat GLUT4 antisense and rat p-actin riboprobes as previously described by Ren et al. (19). Each assay was performed under conditions of probe excess. Picograms of message were deter- mined by comparing hybrid counts in unknown samples with those generated by a series of sense cRNAstandards followed by correction for the size difference between the probe and the mature message.
Measurement of Immunoreactive GLUT4 Protein-Epitrochlearis muscles were homogenized in ice-cold 250 mM sucrose containing 1 mM EDTA and 20 mM Hepes pH 7.4, and GLUT4 immunoreactivity was measured on whole homogenates as previously described (27). Briefly, an aliquot of the homogenate containing 50 pg of protein was solubilized in Laemmli sample buffer (28), subjected to SDS-polyacrylamide gel electrophoresis, and electrophoretically transferred to a nitrocellulose paper. Glucose transporter protein was detected with a rabbit poly- clonal antibody (F349), directed against the C terminus of GLUT4, followed by '251-labeled goat anti-rabbit IgG. Immunoreactivity was quantitated by counting radioactivity in the immunolabeled bands with correction for background radiolabeling in each lane. Results were cor- rected for pooled standards loaded on each gel to allow direct compari- son of counts from different blots. The same procedure was used to measure GLUT4 immunoreactivity in the plasma membrane fraction (see below) except that 3 pg of protein was used.
Measurement of Enzyme Activities-Aliquots of the same epitrochle- aris muscle homogenates that were used for Western blot analysis of GLUT4 protein content were used for measurement of hexokinase ac- tivity by the method of Uyeda and Racker (29) and citrate synthase activity as described by Srere (30). Glycogen synthase activity was measured in portions of the epitrochlearis muscles that were used to measure the rate of glycogen accumulation (see below). Total glycogen synthase activity and synthase I activity were determined as previously described (31).
Muscle Incubations-Epitrochlearis muscles to be used for measure- ment of insulin-stimulated glucose transport activity were placed in 2 ml of oxygenated Krebs-Henseleit bicarbonate buffer (KHB)' containing 8 mM glucose, 32 mM mannitol, 0.1% radioimmunoassay grade bovine serum albumin, and 2 milliunitdml insulin and incubated with shaking at 35 "C for 30 min. Control muscles were incubated under the same conditions without insulin. The gas phase in the flasks was 95% 0,, 5% CO,. Some muscles were stimulated to contract for 10 min (see below) and were then incubated for an additional 20 min with or without 2 milliunits/ml insulin. For evaluation of the effect of hypoxia, muscles were placed in KHB containing 8 mM glucose and 32 mM mannitol that had been pregassed with 95% N,, 5% CO, and incubated with shaking a t 35 "C for 60 min; the gas phase in the flasks was 95% N,, 5% CO,. Muscles that were used for measurement of glycogen accumulation were incubated with shaking at 35 "C for 30, 120, or 180 min in KHB containing 8 mM glucose and 100 microunits/ml insulin. Glycogen was measured with the amyloglucosidase method (32).
Electrical Stimulation of Epitrochlearis Muscles-Isolated epitroch- leans muscles were attached to a vertical Lucite rod containing two platinum electrodes and immersed in KHB containing 8 mM glucose, 32 mM mannitol, and either 2 milliunits/ml insulin or no insulin. The muscles were electrically stimulated to produce ten 10-s-long tetanic contractions over a 10-min period as previously described (33). This protocol elicits a maximal effect of contractions on glucose transport. Muscles exposed to insulin during the contractile activity were trans- ferred to flasks and incubated for an additional 20 min in the presence of 2 milliunits/ml insulin. The effect of contractions on glucose transport activity persists long enough to permit its measurement under the conditions of this experiment.
Measurement of Glucose Dunsport Activity-After the initial incuba-
The abbreviations used are: KHB, Krebs-Henseleit bicarbonate buffer; 2-DG, 2-deoxy-~-glucose; MG, methyl-D-glucose.
14397
FIG. 1. Specificity of the GLUT4 riboprobe. In vitro transcribed sense GLUT4 cRNA (100 pg), total RNA (10 and 25 pg) from rat ep- itrochlearis muscle, and tRNA(25 pg) were hybridized with a uniformly labeled GLUT4 riboprobe, treated with ribonucleases, and protected fragments visualized by autoradiography after electrophoresis on an 8 M urea, 6% polyacrylamide gel. The left arrow indicates the predicted size of the riboprobe alone and the right arrow the position of protected fragments. Lane 1, end-labeled HaeIII-digested 4x174 size standards; lane 2, antisense GLUT4 probe alone; lane 3, probe + sense cRNA; lane 4, probe + 10 pg of rat muscle RNA, lane 5, probe + 25 pg of rat muscle RNA; lane 6, probe + tRNA.
tion period, the muscles were transferred to flasks containing 2 ml of KHB with 40 mM mannitol and incubated with shaking for 10 min a t 29 "C to remove glucose. In one series of experiments glucose transport activity was measured with the glucose analog 2-deoxy-~-glucose (2-DG) as previously described (13). Briefly, the muscles were incubated for 20 min a t 29 "C in 1.5 ml of KHB containing 8 mM 2-de0xy-[1,2-~H]glucose (190 pCi/mmol) and 32 mM [U-'4C]mannitol (3.9 pCi/mmol), and if in- sulin was present in the previous incubations, it was also present dur- ing the transport assay. In another set of experiments, glucose transport activity was measured using 3-O-methyl-~-glucose (MG) as previously described (25). Muscles were incubated for 10 min a t 29 "C in 1.5 ml of KHB containing 8 mM 3-0-L3H1MG (300 pCi/mmol), 32 mM [U-'4C]man- nitol(3.9 pCi/mmol), and insulin if it was present during the previous incubations. The gas phase in the flasks was 95% 0,, 5% CO,.
Plasma Membrane Preparation-The increase in GLUT4 protein in the plasma membrane in response to a maximally effective insulin stimulus was compared in 2-day swimmers and sedentary controls. The rats were anesthetized with sodium pentobarbital, and the forelimb muscles from one side were dissected out. The rats were then given an infusion of insulin a t a rate of 30 milliunitsikg of body weighffmin for 30 min, via a catheter in a jugular vein, using a Harvard Apparatus infu- sion pump. This insulin infusion protocol results in a plasma insulin concentration of -2500 microunits/ml.2 To prevent hypoglycemia, glu- cose was infused along with the insulin at a rate of 20 mgkg of body weighffmin. The muscles from the other forelimb were then dissected out. Approximately 0.7 g of muscle was obtained from each limb and trimmed of fat, blood vessels, nerves, and connective tissue. Muscles were then immersed in ice-cold buffer containing 100 mM Tris, 0.2 mM EDTA, and 255 mM sucrose, pH 7.6, minced, and homogenized for 60 s with a Tekmar homogenizer set a t 10,000 rpm. The homogenate was centrifuged for 20 min at 48,000 x g, and the pellet was used to prepare a plasma membrane fraction as described by Hirshman et al. (12). The plasma membrane fraction was suspended in 250 mM sucrose, 20 mM Hepes and stored at -80 "C for subsequent determination of protein concentration, marker enzyme levels, and GLUT4 protein immunore- activity. Protein was measured using a bicinchoninic acid assay kit. Potassium-stimulated para-nitrophenylphosphatase activity was meas- ured as described by Ploug et al. (16) and used as a marker for the plasma membrane.
Statistical Analyses-Results are expressed as mean 2 S.E. The sig- nificance of differences between two groups was assessed using Stu- dent's unpaired t test. For multiple comparisons, significance was evaluated by analysis of variance. A Newman-Keul's post hoc test was used to locate significant mean differences.
RESULTS Effects of Exercise on GLUT4 mRNA Concentration in Ep-
itrochlearis Muscles-The abundance of GLUT4 mRNA was determined by RNase protection. To verify the specificity of the GLUT4 riboprobe, protection assays were performed using in vitro transcribed sense RNA, tRNA, and muscle RNA, the prod- ucts were analyzed by gel electrophoresis. As shown in Fig. 1, a protected fragment of the predicted size (551 nucleotides) was
J. Gao, unpublished results.
14398 GLUT4 Expression in
0 1 2
G L U T 4 - - - - .IC
C 0 .- c 1 ' * L e c L
'E 2000 4 + T
0 1 2 Days
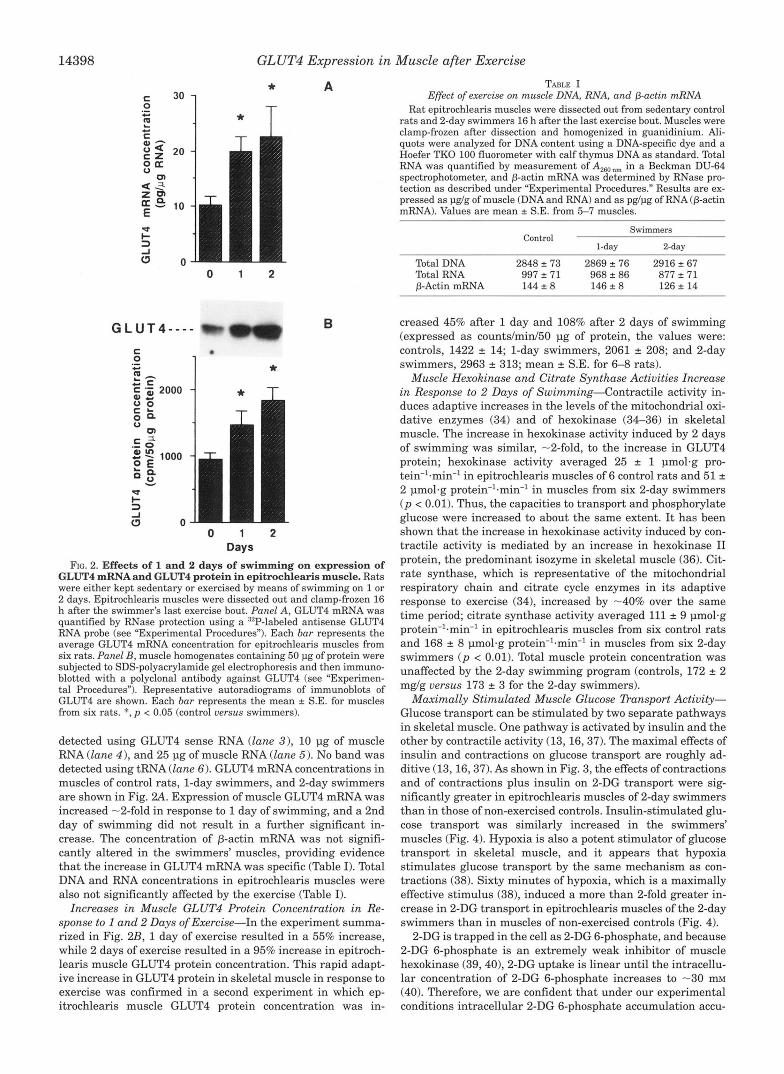
GLUT4 mRNAand GLUT4 protein in epitrochlearis muscle. Rats FIG. 2. Effects of 1 and 2 days of swimming on expression of
were either kept sedentary or exercised by means of swimming on 1 or
h after the swimmer's last exercise bout. Punel A, GLUT4 mRNA was 2 days. Epitrochlearis muscles were dissected out and clamp-frozen 16
quantified by RNase protection using a 32P-labeled antisense GLUT4 RNA probe (see "Experimental Procedures"). Each bar represents the average GLUT4 mRNA concentration for epitrochlearis muscles from six rats. Panel B, muscle homogenates containing 50 pg of protein were subjected to SDS-polyacrylamide gel electrophoresis and then immuno- blotted with a polyclonal antibody against GLUT4 (see "Experimen- tal Procedures"). Representative autoradiograms of immunoblots of GLUT4 are shown. Each bur represents the mean k S.E. for muscles from six rats. *, p < 0.05 (control uersus swimmers).
detected using GLUT4 sense RNA (lane 3), 10 pg of muscle RNA (lane 4), and 25 pg of muscle RNA (lane 5). No band was detected using tRNA (lane 6). GLUT4 mRNA concentrations in muscles of control rats, 1-day swimmers, and 2-day swimmers are shown in Fig. 2 A . Expression of muscle GLUT4 mRNA was increased -2-fold in response to 1 day of swimming, and a 2nd day of swimming did not result in a further significant in- crease. The concentration of p-actin mRNA was not signifi- cantly altered in the swimmers' muscles, providing evidence that the increase in GLUT4 mRNA was specific (Table I). Total DNA and RNA concentrations in epitrochlearis muscles were also not significantly affected by the exercise (Table I).
Increases in Muscle GLUT4 Protein Concentration in Re- sponse to 1 and 2 Days of Exercise-In the experiment summa- rized in Fig. 2B, 1 day of exercise resulted in a 55% increase, while 2 days of exercise resulted in a 95% increase in epitroch- leans muscle GLUT4 protein concentration. This rapid adapt- ive increase in GLUT4 protein in skeletal muscle in response to exercise was confirmed in a second experiment in which ep- itrochlearis muscle GLUT4 protein concentration was in-
Muscle after Exercise TABLE I
Effect of exercise on muscle DNA, RNA, and p-actin mRNA Rat epitrochlearis muscles were dissected out from sedentary control
rats and 2-day swimmers 16 h after the last exercise bout. Muscles were clamp-frozen after dissection and homogenized in guanidinium. Ali- quots were analyzed for DNA content using a DNA-specific dye and a Hoefer TKO 100 fluorometer with calf thymus DNA as standard. Total RNA was quantified by measurement of A260nm in a Beckman DU-64 spectrophotometer, and p-actin mRNA was determined by RNase pro- tection as described under "Experimental Procedures." Results are ex- pressed as pg/g of muscle (DNA and RNA) and as pg/pg of RNA (p-actin mRNA). Values are mean k S.E. from 5-7 muscles.
Swimmers Control
1-day 2-day
Total DNA 2848k73 2869k76 2916k67 Total RNA 997 71 968 86 877 k 71 p-Actin mRNA 144 f 8 146 k 8 126 f 14
creased 45% after 1 day and 108% after 2 days of swimming (expressed as counts/min/5O pg of protein, the values were: controls, 1422 2 14; 1-day swimmers, 2061 2 208; and 2-day swimmers, 2963 +. 313; mean -c S.E. for 6-8 rats).
Muscle Hexokinase and Citrate Synthase Activities Increase in Response to 2 Days of Swimming-Contractile activity in- duces adaptive increases in the levels of the mitochondrial oxi- dative enzymes (34) and of hexokinase (34-36) in skeletal muscle. The increase in hexokinase activity induced by 2 days of swimming was similar, -2-fold, to the increase in GLUT4 protein; hexokinase activity averaged 25 2 1 pmo1.g pro- tein"-min" in epitrochlearis muscles of 6 control rats and 51 f 2 pmo1.g protein".min" in muscles from six 2-day swimmers (p < 0.01). Thus, the capacities to transport and phosphorylate glucose were increased to about the same extent. It has been shown that the increase in hexokinase activity induced by con- tractile activity is mediated by an increase in hexokinase I1 protein, the predominant isozyme in skeletal muscle (36). Cit- rate synthase, which is representative of the mitochondrial respiratory chain and citrate cycle enzymes in its adaptive response to exercise (34), increased by -40% over the same time period; citrate synthase activity averaged 111 2 9 pmo1.g protein-'.min" in epitrochlearis muscles from six control rats and 168 2 8 pmo1.g protein".min" in muscles from six 2-day swimmers (p < 0.01). Total muscle protein concentration was unaffected by the 2-day swimming program (controls, 172 2 2 mglg versus 173 2 3 for the 2-day swimmers).
Maximally Stimulated Muscle Glucose Dunsport Activity- Glucose transport can be stimulated by two separate pathways in skeletal muscle. One pathway is activated by insulin and the other by contractile activity (13,16,37). The maximal effects of insulin and contractions on glucose transport are roughly ad- ditive (13,16,37). As shown in Fig. 3, the effects of contractions and of contractions plus insulin on 2-DG transport were sig- nificantly greater in epitrochlearis muscles of 2-day swimmers than in those of non-exercised controls. Insulin-stimulated glu- cose transport was similarly increased in the swimmers' muscles (Fig. 4). Hypoxia is also a potent stimulator of glucose transport in skeletal muscle, and it appears that hypoxia stimulates glucose transport by the same mechanism as con- tractions (38). Sixty minutes of hypoxia, which is a maximally effective stimulus (38), induced a more than 2-fold greater in- crease in 2-DG transport in epitrochlearis muscles of the 2-day swimmers than in muscles of non-exercised controls (Fig. 4).
2-DG is trapped in the cell as 2-DG 6-phosphate, and because 2-DG 6-phosphate is an extremely weak inhibitor of muscle hexokinase (39,40),2-DG uptake is linear until the intracellu- lar concentration of 2-DG 6-phosphate increases to -30 RIM
(40). Therefore, we are confident that under our experimental conditions intracellular 2-DG 6-phosphate accumulation accu-

2o 1 Control
GLUT4 Expression in Muscle after Exercise
t 14399
Basal Contractions Contractions plus Insulin
FIG. 3. Stimulation of 2-deoxy-[SHlglucose uptake by contrac- tions and contractions plus insulin in epitrochlearis muscles of 2-day swimmers and control rats. Muscles were incubated in oxy- genated KHB containing 8 mM glucose and 32 mM mannitol in the presence or absence of 2 milliunits/ml insulin at 35 “C, stimulated to contract for 10 min, and then incubated for 20 min in the same medium (see “Experimental Procedures”). Next the muscles were rinsed for 10 min in glucose-free medium containing 40 mM mannitol and 2 milliunitdml insulin, if it was present in the preceding incubation, to remove glucose from the extracellular space. The rate of 2-DG uptake was then measured for 20 min as described under “Experimental Pro- cedures.” Each bur represents the mean -c S.E. for six or seven muscles. *, p < 0.05 (control versus 2-day swimmer); 7, p < 0.01 (control versus 2-day swimmer).
x al wtmmer * 2 2
Basal Insulin Hypoxia FIG. 4. Stimulation of 2-deoxy-[sHlglucose uptake by insulin or
hypoxia in epitrochlearis muscles. To determine the response to insulin, muscles were incubated in oxygenated KHB containing 8 mM glucose and 32 mM mannitol in the presence or absence of 2 milliunits/ml insulin at 35 “C for 30 min in a shaking incubator. To
incubator at 35 “C in 2 ml of KHB containing 8 mM glucose and 32 mM evaluate the response to hypoxia, muscles were incubated in a shaking
with 95% N,, 5% CO, (hypoxia) or 95% 0,, 5% CO, (control) for 60 min. mannitol in stoppered Erlenmeyer flasks that were gassed continuously
The KHB was also gassed with 95% N,. 5% CO, or 95% 0,, 5% CO, for 30 min before the incubations. The muscles were then transferred to KHB containing 40 m mannitol and washed for 10 min to remove glucose. The rate of 2-DG uptake was then measured for 20 min as described under “Experimental Procedures.” Each bur represents the mean -+ S.E. for six muscles. * ,p < 0.001 (control uemus 2-day swimmer).
rately reflects the rate of 2-DG transport across the sarco- lemma. Nevertheless, to specifically measure transport, experi- ments were also performed using 3-0-MG, which is transported into muscle cells by the same mechanism as glucose but is not further metabolized. The insulin-stimulated rate of 3-0-MG transport was 60% higher in muscles that had adapted to 1 day of exercise and 103% higher in muscles adapted to 2 days of exercise than in non-exercised controls (Fig. 5). Thus, the adaptive increase in GLUT4 protein concentration in the muscles of the swimmers is associated with increases in glucose transport activity maximally stimulated via the insulin-medi- ated and the contractiodhypoxia-mediated pathways.
GLUT4 Dansporter Banslocation-The increase in GLUT4 protein in the plasma membrane in response to insulin was
0 1 2 FIG. 5. Stimulation of 3-O-[SH]methyl-~-glucose transport by
insulin in epitrochlearis muscles from 1- and 2-day swimmers and control rats. Muscles were incubated in oxygenated KHB con- taining 8 mM glucose and 32 mM mannitol with or without 2 milliunitdml insulin for 30 min at 35 “C in a shaking incubator. The muscles were then rinsed for 10 min in KHB containing 40 mM manni- tol, with or without 2 milliunits (mU)/ml insulin, to remove glucose. The rate of 3-0-MG transport was then measured for 10 min as described under “Experimental Procedures.” Each bur represents the mean -+ S.E. for 5-8 muscles. *, p c 0.001 (1- and 2-day swimmers versus non- exercised controls); +, p < 0.05 (2-day swimmers versus 1-day swim- mers).
compared in forelimb muscles of 2-day swimmers and non- exercised controls. In each rat, muscles from one forelimb were taken in the basal state and compared with the muscles from the other forelimb, which were taken after a maximally effec- tive insulin stimulus produced by a 30-min-long intravenous insulin infusion that increased plasma insulin concentration to -2.5 microunits/ml. The plasma membrane fraction showed a -49-fold enrichment of the plasma membrane marker enzyme potassium-para-nitrophenylphosphatase activity relative to the homogenate (data not shown). As shown in Fig. 6, the increase in GLUT4 in the plasma membrane in response to insulin was -2-fold greater in the muscles of the 2-day swim- mers than in the non-exercised controls.
Rate of Muscle Glycogen Accumulation-There is evidence suggesting that the primary factor that determines the rate of glycogen accumulation, as well as the steady state concentra- tion of glycogen, in skeletal muscle is the rate of glucose uptake (31, 41). The 2-day swimmers’ epitrochlearis muscle glycogen concentration was significantly higher than that of the non- exercised controls after an overnight fast (Fig. 7A) despite the glycogen-depleting effect of their last exercise bout. Even though the initial glycogen concentration was -70% higher in the 2-day swimmers’ muscles, the rate of glycogen accumula- tion in muscles incubated in vitro with glucose and insulin was -2-fold higher in the muscles of the swimmers over the 3-h incubation period (Fig. 7A). Total glycogen synthase activity was not significantly increased after 2 days of swimming, av- eraging 6.04 f 0.35 pmo1.g protein”.min” in epitrochlearis muscles from 20 control rats and 6.73 f 0.36 ymo1.g protein-*.min-l in muscles from 20 two-day swimmers. There was also no significant difference between the swimmers and the controls in the proportion of muscle glycogen synthase in the I form at any of the time points at which glycogen concen- tration was measured (Fig. 7B ). This finding provides evidence that the greater rate of glycogen synthesis in the swimmers’ muscles was due to the higher glucose transport rate associated with the increase in GLUT4.
DISCUSSION
An increase in contractile activity induces major changes in the capacity of muscle to metabolize substrates. Endurance exercise, such as prolonged running or swimming, brings about

14400 GLUT4 Expression in Muscle after Exercise
. + -
Control 2-day Exercise FIG. 6. Increase in GLUT4 protein in plasma membrane in re-
sponse to insulin. Anesthetized control rats and 2-day swimmers were given an intravenous infusion of insulin for 30 min to raise plasma insulin concentration to -2.5 milliunits/ml (see “Experimental Proce- dures”). Forelimb muscles, -0.7 g, were dissected out from one side before the insulin infusion (basal) and from the other side immediately after the insulin infusion. The muscles were homogenized and used for preparation of a plasma membrane fraction (see ”Experimental Proce- dures”). The plasma membrane fraction was subjected to SDS-polyac- rylamide gel electrophoresis and then immunoblotted with a polyclonal antibody against GLUT4 (see “Experimental Procedures”). Represent- ative autoradiograms of immunoblots of GLUT4 are shown. Each bur represents the mean t S.E. for muscles from three rats. *, p < 0.05 (insulin uersus basal); +, p < 0.05 (2-day exercise uersus control).
an adaptive increase in muscle mitochondria with an increase in the capacity to generate energy by respiration (34,421. Con- comitantly, most of the glycolytic enzymes decrease (34). An exception is hexokinase, which increases rapidly in response to increased contractile activity (34-36). Recent studies of the effects of 6-12 weeks of exercise training have shown that an increase in GLUT4 is a component of this adaptation (16, 17, 20-23). In these studies, prolonged periods of training were used because of the impression, gained from studies in which the exercise stimulus was gradually increased, that the adap- tation occurs slowly. However, an adaptation that takes weeks to occur would have no survival value for an animal faced with a sudden change in environment, such as a flood or invasion of its territory by predators, that requires a sustained increase in physical activity. In this context, and in light of the evidence that adaptive increases in some other muscle proteins can be induced by a single exercise bout (35, 431, we tested the hy- pothesis that GLUT4 rapidly increases in response to exercise that results in a sufficiently sustained increase in the muscles’ requirement for carbohydrate.
Our finding that GLUT4 protein in epitrochlearis muscle was increased by -50% 16 h after the first exercise period and by 2-fold after 2 days of exercise indicates that this hypothesis is correct. Exercise appears to induce this increase in GLUT4 expression at the pretranslational level as evidenced by a 2-fold increase in GLUT4 mRNA after 1 day of swimming with no further significant increase with 2 days of exercise. There is no additional increase in GLUT4 protein with more prolonged ex- ercise training.3 It appears from these findings that GLUT4 protein has a half-life of less than 24 h. As in previous studies of exercise training (16, 17,22), the increase in muscle GLUT4 protein induced by 1 or 2 days of swimming in the present study was accompanied by a proportional increase in stimulated glu- cose transport activity. Previous studies in which stimulated glu.cose transport was compared in muscles with widely differ- ing GLUT4 protein contents (13, 14, 16) or in which GLUT4 expression was altered (15, 19) have also shown a good corre- lation between GLUT4 concentration and glucose transport activity. The correlation between total GLUT4 content and
J. M. Ren, E. A. Gulve, and J. 0. Holloszy, unpublished results.
A * T
0 0 . 5
B 1,
2
0 0.5 2
3
1 3
Incubation Time (hr)
synthase I in muscles incubated with glucose and insulin. Ep- FIG. 7. Glycogen accumulation and percentage of glycogen
itrochlearis muscles were clamp-frozen immediately after being dis- sected out or after 0.5, 2, or 3 h of incubation with shaking at 35 ”C in Erlenmeyer flasks containing oxygenated KHB with 8 m glucose and 100 microunitdml insulin. The frozen muscles were used for measure- ment of glycogen concentration and of total glycogen synthase and glycogen synthase I activities (see “Experimental Procedures”). A, time course of muscle glycogen accumulation. Glycogen concentrations are expressed as glucosyl unitsfg of muscle protein. B, percentage of glyco- gen synthase activity in the I form in the same muscles that were used for measurement of glycogen concentration. Each bur represents the mean t S.E. for eight rats at the 0- and 3-h time points and muscles from four rats at the 0.5- and 2-h time points. * , p < 0.01 (controls uersus 2-day swimmers).
stimulated glucose transport rate in muscles implies that the number of glucose transporters translocated into the plasma membrane in response to insulin, exercise, or hypoxia is pro- portional to the GLUT4 content of the cell when the signaling pathways are intact. Experimental evidence for such a rela- tionship is not yet available because of the inadequacy of cur- rent methods for separating the plasma membrane and the GLUT4-containing intracellular membrane fractions in skel- etal muscle. Thus, subcellular fractionation studies on muscle have demonstrated only -50-100% increases in GLUT4 in the plasma membrane fraction in response to insulin (8,12,44,45).
Taken at face value, a 50-100% increase in GLUT4 in the plasma membrane could explain only a small portion of the 5-6-fold increase in glucose transport activity. However, immu- nocytochemical studies have shown a virtual absence of GLUT4 in the plasma membrane of skeletal muscle in the basal state with a marked increase in response to stimulation (46, 47). Furthermore, in a study using an exofacial labeling procedure, Lund et al. (48) found that a maximal insulin stimulus resulted in a -7-fold increase in GLUT4 at the cell surface in rat soleus muscle. Therefore, it seems probable that the large amount of GLUT4 in the plasma membrane fraction prepared from muscles in the basal state by current differential centrifuga- tion-sucrose density gradient procedures represents extensive

GLUT4 Expression in Muscle after Exercise 14401
contamination with GLUT4 from the intracellular pool. If the GLUT4 in the plasma membrane fraction obtained from muscle in the basal state is an artifact, expressing the results in terms of a percent increase in GLUT4 obscures the relative magni- tude of the increase. Nevertheless, the 2-fold greater increase above background of GLUT4 in the plasma membrane fraction in the 2-day swimmers' muscles in response to insulin provides evidence that twice as many glucose transporters were trans- located to the plasma membrane. In this context, we think that the most likely explanation for the larger increases in glucose transport activity in response to insulin, contractions, and hy- poxia in the muscles of the 2-day swimmers is that a propor- tionally larger number of glucose transporters were translo- cated into the plasma membrane as a consequence of the greater content of GLUT4.
Regarding the biological function of the increase in muscle GLUT4, one might reasonably assume that it serves to increase availability of glucose as an energy source. However, it has been shown that enhancing the rate of glucose uptake by muscle during exercise is counterproductive as it causes rapid depletion of liver glycogen, which results in hypoglycemia and makes continuation of exercise impossible (49, 50). Exercise training induces other adaptations that have a carbohydrate- sparing effect and actually result in a slower rate of glucose utilization by muscle during exercise, despite the increase in the capacity for glucose transport and phosphorylation (51-53). These adaptations, which include increases in muscle mito- chondria and the levels of the enzymes involved in fatty acid oxidation (34, 541, result in an increased reliance on fat oxida- tion for energy during exercise (34, 55, 56). As a consequence, muscle glycogen is used less rapidly and, because muscle gly- cogen is essential for prolonged, vigorous exercise (57-591, de- velopment of fatigue is delayed (34).
Raising muscle glycogen increases the capacity for pro- longed, strenuous exercise, while a low initial glycogen concen- tration is associated with more rapid development of fatigue (58, 59). The major factor in determining the steady-state gly- cogen concentration in resting muscle appears to be the rate of muscle glucose uptake (31, 41). In this context, we hypoth- esized that the adaptive increase in GLUT4, by potentiating insulin-stimulated glucose transport, might function to in- crease the rate of muscle glycogen repletion. Our finding of a -2-fold higher rate of glycogen synthesis in epitrochlearis muscles of the 2-day swimmers than in control muscles incu- bated with the same glucose and insulin concentrations sup- ports this hypothesis. The rapid adaptive increase in GLUT4 expression could thus provide a survival advantage by making possible more rapid replenishment of muscle glycogen stores when carbohydrate i s eaten between exercise bouts or even when exercise is continued at a lower intensity (60). The rapid adaptive increase in GLUT4 may also help to explain the find- ing that a few days of exercise training can result in a signifi- cant enhancement of insulin action on glucose disposal (61).
Acknowledgments-We thank Dr. Mike Mueckler for generous gifts of GLUT4 cDNA and antibody F349 against GLUT4 protein. We are grateful to May Chen and Xiang Jing Wang for excellent technical assistance and to Janet Seavitte for expert assistance in preparation of the manuscript.
REFERENCES 1. Cushman, S. W., and Wardzala, L. J . (1980) J. Biol. Chew. 266, 4758-4762 2. Suzuki, K., and Kono, T. (1980) Proe. Natl. Acad. Sci. U. S . A. 77, 25422545 3. Holman, G. D., Kozka, I. J., Clark, A. E., Flower, C. J., Saltis, J., Habberfield,
A. D., Simpson, I. A., and Cushman, S. W. (1990) J. Biol. Chem. 265, 18172-18179
4. Wardzala, L. J., and Jeanrenaud, B. (1981) J. Biol. Chem. 266,7090-7093 5. mip, A., Ramlal, T., Young, D. A., and Holloszy, J. 0. (1987) FEBS Lett. 224,
224-230 6. Slot, J. W., Geuze, H. J. , Gigengack, S., Lienhard, G . E., and James, D. E.
7. Hirshman, M. F., Wallberg-Henriksson, H., Wardzala, L. J., Horton, E. D., and (1991) J. Cell Biol. 113, 123-135
8. Douen, A. G., Ramlal, T., Rastogi, S., Bilan, P. J., Cartee, G. D., Vranic, M., Horton, E. S. (1988) FEBS Lett. 238,23&239
Holloszv. J . 0.. and Klio. A. (1990) J. Biol. Chem. 265,13427-13430 I~~ ~~
9. Mueckler,"MI (1990) Diabe'tes 3 9 , 6 1 1 ~~ ~
10. James, D. E., Strube, M., and Mueckler, M. (1989) Nature 938,8347 11. Klip, A,, and Paquet, M. R. (1990) Diabetes Care 13, 228-243 12. Hirshman, M. F., Goodyear, L. J., Wardzala, L. J., Horton, E. D., and Horton,
13. Henriksen, E. J., Bourey, R. E., Rodnick, K. J., Koranyi, L., Permutt, M.A., and
14. Kern, M., Wells, J. A., Stephens, J. M., Elton, C. W., Friedman, J. E., Tapscott,
15. Megeney, L. A., Neufer, P. D., Dohm, G. L., Tan, M. H., Blewett, C. A., Elder, G.
16. Ploug, T., Stallknecht, B. M., Pedersen, 0.. Kahn, B. B., Ohkuwa, T., Vinten, J.,
17. Rodnick, K. J., Henriksen, E. J., James, D. E., and Holloszy, J . 0. (1992) Am.
18. Henriksen, E. J., Rodnick, K J. , Mondon, C. E., James, D. E., and Holloszy, J.
19. Ren, J.-M., Semenkovich, C. F., and Holloszy, J. 0. (1993)Am. J. Physiol. 264,
20. Friedman, J. E., Sherman, W. M., Reed, M. J., Elton, C. W., and Dohm, G. L.
E. S. (1990) J. Biol. Chem. 266,987-991
Holloszy, J. 0. (1990) Am. J. Physiol. 259, E593-E598
E. B., Pekala, P. H., and Dohm, G. L. (1990) Biochem. J. 270,397-400
C. B., and Bonen, A. (1993) Am. J. Physiol. 264, E583-E593
and Galbo, H. (1990) Am. J. Physiol. 259, E778-E786
J. Physiol. 262, C 9 4 1 4
0. (1991) J. Appl. Physiol. 70,23222327
C146-C150
(1990) FEBS Lett. 268,13-16
L. (1993) Am. J. Physiol. 266, E419-E427 21. Brozinick, J. T., Jr., Etgen, G. J. , Yaspelkis, B. B., 111, Kang, H. Y., and Ivy, J.
22. Goodyear, L. J., Hirshman, M. F., Valyou, P. M., and Horton, E. S. (1992)
23. Houmard, J. A,, Shinebarger, M. H., Dolan, P. L., Leggett-Frazier, N., Bmner, Diabetes 41, 1091-1099
R. K., McCammon, M. R., Israel, R. G., and Dohm, G. L. (1993) Am. J. Physiol. 264, E896E901
24. Cartee, G. D., Young, D. A., Sleeper, M. D., Zierath, J., Wallberg-Henriksson, H., and Holloszy, J . 0. (1989)Am. J. Physiol. 256, E49PE499
25. Young, D. A,, Uhl, J. J., Cartee, G. D., and Holloszy, J. 0. (1986) J. Biol. Chem. 261, 16049-16053
26. Chomczynski, I?, and Sacchi, N. (19871 Anal. Biochem. 162,156-159 27. Gulve, E. A,, Henriksen, E. J., Rodnick, K. J., Youn, J. H., and Holloszy, J. 0.
28. Laemmli, U. K. (1970) Nature 227, 680-685 29. Uyeda, K., and Racker, E. (1965) J. Biol. Chem. 240,46824688 30. Srere, P. A. (1969) Methods Enzymol. 13,3-5 31. Ren, J.-M., Marshall, B. A., Gulve, E. A., Gao, J., Johnson, D. W., Holloszy, J.
32. Passoneau, J. V., and Lauderdale, V. R. (1974) Anal. Biochem. 80.405412 33. Henriksen, E. J . , Rodnick. K. J., and Holloszy, J . 0. (1989) J. Biol. Chem. 264,
34. Holloszy, J. 0.. and Booth, F. W. (1976) Annu. Reo. Physiol. 38, 273-291 35. Peter, J. B., Jeffress, R. N., and Lamb, D. R. (1968) Science 160,200-201 36. Weber, F. E., and Pette, D. (1990) Eur. J. Biochem. 191.85-90 37. Wallberg-Henriksson, H., Constable, S. H., Young, D. A,, and Holloazy, J . 0.
38. Cartee, G. D., Douen, A. G.. Ramlal. T.. Kliu. A.. and Holloszy, J. 0. (1991) J.
(1993) Am. J. Physiol. 264, E319-E327
O., and Mueckler, M. (1993) J. Biol. Chem. 268, 16113-16115
2153621543
(1988) J. Appl. Physiol. 65,909-913 . . _ . .
39. Kipnis, D. M., and Con, C. F. (1959) J. Biol. Chem. 234, 171-177 Appl. Physiol. 70, '1593-1600
40. Hansen, P. A., Gulve, E. A., and Holloszy, J . 0. (1994) J. Appl. Physiol. 76, 979-985
41. Fell, R. D., Terblanche, S. E., Ivy, J. L., Young, J. C., and Holloszy, J . 0. (1982)
42. Holloszy, J. 0. (1967) J. Biol. Chem. 242, 2278-2282 43. Holloszy, J . O., and Winder, W. W. (1979) Am. J. Physiol. 236, R18CLR183 44. Marette, A., Richardson, J. M., Ramlal, T., Balon, T. W., Vranic. M., Pessin, J.
45. Etgen, G. J., Jr., Memon, A. R., Thompson, G. A., Jr., and Ivy, J. L. (1993) J.
46. Rodnick, K. J., Slot, J. W., Studelska, D. R., Hanpeter, D. E., Robinson, L. J.,
47. Bornemann, A., Ploug, T., and Schmalbmch, H. (1992) Diabetes 41, 215-221 48. Lund, S., Holman, G. D., Schmitz, O., and Pedersen, 0. (1993) FEBS Lett. 530,
49. Costill, D. L., Coyle, E., Dalsky, G., Evans, W., Fink, W., and Hoopes, D. (1977)
50. Foster, C. , Costill, D. L., and Fink, W. J. (1979) Med. Sci. Sports 11, 1-5 51. Coggan, A. R., Kohrt, W. M., Spina, R. J., Bier, D. M., and Holloszy, J. 0. (1990)
52. Coggan, A. R., Kohrt, W. M., Spina, R. J . , Kinvan, J. P., Bier, D. M., and J. Appl. Physiol. 68, 990-996
53. Baldwin, K M., Fitts, R. H., Booth, F. W., Winder, W. W., and Holloszy, J . 0. Holloszy, J. 0. (1992) J. Appl. Physiol. 73, 1873-1880
54. Mole, P. A., Oscai, L. B., and Holloszy, J . 0. (1971) J. Clin. Znuest. 60, 2323- (1975) Pfluegers Arch. Eur. J. Physiol. 384,203-212
55. Hurley, B. F., Nemeth, P. M., Martin, W. H., 111, Hagberg, J. M., Dalsky, G. I?, 2330
56. Martin, W. H., 111, Dalsky, G. P., Hurley, B. F., Matthews, D. E., Bier, D. M., and Holloszy, J. 0. (1986) J. Appl. Physiol. 80, 562-567
Hagberg, J. M., Rogers, M. A,, King, D. S., and Holloszy, J. 0. (1993)Am. J. Physiol. 266, E708-E714
~~
J. Appl. Physiol. 52, 434-437
E., and Klip. A. (1992) Am. J. Physiol. 263, C4434452
Biol. Chem. 268,20164-20169
Geuze, H. J., and James, D. E. (1992) J. Biol. Chem. 267,627843285
312-318
J. Appl. Physiol. 43,695-699
57. Lewis, S. F., and Haller, R. G. (1989) Exercise Sport Sci. Rev. 17, 67-113 58. Bergstrom, J., Hermansen, L., Hultman, E., and Saltin, B. (1967)Acta Physiol.
59. Karlsson, J., and Saltin, B. (1971) J. Appl . Physiol. 31, 203-206 60. Constable, S. H., Young, J. C., Higuchi, M., and Holloszy, J. 0. (1984)Am. J.
61. Rogers, M. A., Yamamoto, C., King, D. S., Hagberg, J . M.. Ehsani. A. A.. and
Scand. 71, 140-150
Physiol. 247, R880-R883
Holloszy, J. 0. (1988) Diabetes Care 11, 613-618