the nutrition transition to 2030 why developing countries ... · shift away from traditional...
TRANSCRIPT
The nutrition transition to 2030 Why developing countries are likely to bear the major burden
Josef Schmidhuber and Prakash Shetty1
Josef Schmidhuber Global Perspectives Studies Unit Economic and Social Department Food and Agriculture Organization of the United Nations Tel: (39) 06 570-56264 E-mail: [email protected]
Prakash Shetty Nutrition Planning, Assessment and Evaluation Service Economic and Social Department Food and Agriculture Organization of the United Nations Tel: (39) 06 570-53341 E-mail: [email protected]
1. Introduction and overview
The last two centuries have seen a fundamental transformation of diets in essentially all affluent countries. At the beginning of this transformation was the agro-industrial revolution of the nineteenth century which provided people with the expertise to produce more, the income to consume more and increasingly sophisticated food products. The modernization of agriculture has played a pivotal role in bringing about change. The rigorous application of scientific advances to traditional agriculture, mechanization, genetic improvements and the development of fertilizers and pesticides enabled a doubling and redoubling of food production within the time span of a few decades. In fact, productivity growth was so strong that growth in production comfortably exceeded growth in demand and afforded a rapidly growing population more and better food at declining real prices. Agricultural productivity growth also promoted the industrialization of the then largely agrarian societies. It helped accumulate capital, free up labour and provide ever more and more nutritious food. Eventually, a virtuous circle was created where productivity growth, rising incomes and better nutrition became mutually supportive and thus spurred overall economic development.2 At least for the nineteenth century, however, these developments remained largely limited to industrial countries.
It took more than a century before the agro-industrial revolution started to reach developing countries. With the beginning of the 1960s, the same factors that had initiated the agro-industrial revolution in the developed world in the previous century got a foothold in the food and agricultural sectors of parts of the developing world. The combination of high-yield varieties, expansion of irrigation, increased and improved input supplies and the widespread mechanization of production made more food available to consumers in developing countries. Since the early 1960s, the average calorie availability in the developing world has increased from about 1 950 to 2 680 kcals/person/day while protein availability nearly doubled from about 40 to 70 g/person/day. The prevalence of undernourishment declined from 37 percent in 1970 to 17 percent in 2000 and, while 850 million people (FAO, 2004) are still food insecure.
1 Senior Economist, Global Perspectives Studies Unit and Chief, Nutrition Planning, Assessment and Evaluation Service, FAO. Plenary paper presented at the 97th Seminar of the European Association of Agricultural Economists, University of Reading, England, 21st - 22nd April, 2005. The views expressed by the authors in this document do not necessarily represent those of FAO. 2Fogel (1994) estimates that half of the overall economic growth in France and England in the nineteenth century was a result of better nutrition.
Page 1 of 26

The latter is more often the result of adverse local production conditions, war and civil strife, a lack of income and of access to food rather than the inability of the world as a whole to produce and provide enough food.
As in the industrial world of the nineteenth century, consumers in developing countries have benefited the most from advances in agricultural productivity. In real terms, food prices have declined to the lowest levels in history and, together with gains in broader economic growth, have enabled consumers today to eat better while spending less and less of their budget on food. However, not all countries and regions have benefited from these advances. In parts of the developing word, notably in sub-Saharan Africa, these advances have not even started to yield a meaningful impact. But in many developing countries, the progress in access to providing more, better and cheaper food has been impressive.3 The rapid decline in real food prices has allowed consumers in developing countries to embark on food consumption patterns that were reserved for consumers in industrialized countries at much higher gross domestic product (GDP) levels. Today, a consumer in a developing country can purchase more calories than ever before and more than consumers in industrialized countries ever could at comparable income levels. In China, for instance, consumers today have about 3 000 kcals/day and 50 kg of meat per year (FAO, 2004) at their disposal – at less than US$1 000 nominal income per year (World Bank, 2004)4.
In addition to falling real prices of food, rapid urbanization has affected and will continue to affect consumption patterns. Essentially the entire population growth over the next 30 years will be urban. Urbanization creates a new and improved marketing and distribution infrastructure; attracts supermarkets and their sophisticated food handling systems (cold chains, etc.); makes for better roads and ports, thus improving the access to foreign suppliers and the importance of imports in the overall food supply; and, above all, will promote a globalization of food consumption patterns. Most important from a nutrition perspective, these changes include not only a shift towards higher food energy supplies but also a shift towards more fats and oils and more animal-based foodstuffs, and thus higher intakes of animal protein and fats.
The evolution of these changes has been well-documented recently. Smil (2000) and Popkin (2001) describe the salient steps in the nutritional transition in considerable detail. This paper attempts to outline the likely changes in food consumption patterns over the next 30 years, based on FAO’s outlook for global food and agriculture (Bruinsma, 2003). The rest of the paper is organized as follows: The first part will provide an outlook of how the main drivers of the ongoing nutrition transition are likely to evolve. It will then analyze the main prospective shifts in changes of consumption patterns, both in terms of foodstuffs and related nutrient consumption. These shifts will be analysed against a number of specificities in developing countries, which are likely to compound the adverse effects of the nutrition transition, notably the increasing prevalence of obesity and non-communicable diseases (NCDs) with the co-existing current problem of undernutrition and thus contributing to a “double burden of malnutrition”.
3While not all developing countries have benefited from rapid income growth and nor have they experienced the same rapid socio-economic transformations that come with rapid industrialization and urbanization, the number of countries that are in the process of a profound transformation of their food economies is steadily increasing. As population giants such as China, India, Indonesia, Brazil and Mexico are among the most rapid transformers, the nutrition transition affects a large and growing share of the developing world’s population. 4 Even when income is measured in Purchasing Power Parity (about 3800 US$/person), the ratio of food availability levels to income is much wider than in developed countries at comparable levels of income.
Page 2 of 26

2. The main drivers of the nutrition transition to 2030
Population growth to slow
As far as overall population growth is concerned, the previously projected decline in population growth has been confirmed by the recently published 2002 global population assessment by the United Nations (UN, 2003). The latest assessment suggests that the slow-down in population growth will even be more pronounced than hitherto assumed: world population in 2030, for instance, is forecast to reach “only” 8.1 billion compared to 8.3 billion in the preceding assessment. The slowdown is expected to continue beyond 2030 with a population peak of around 9.5 billion people expected by around 2070. This is a remarkable development in its own right. It means that the process of rapid growth seen over the past 300 years is expected to come to a complete halt within the next 70 years and may even begin to reverse thereafter5.
The slow-down in population growth could provide the much needed breathing space for the world’s resource base. It also suggests that the ability of mankind to feed itself may not be weakened and that global neo-Malthusian scenarios may not be warranted. More detailed analyses (Bruinsma, 2003) support this general assessment and suggest that a slower growing global population will have more food available in the future. The average dietary energy availability over the next 30 years is projected to increase from 2800 to 3050 kcals/person/day globally, in developing countries the increase will even be more pronounced with an increase from 2680 to 2980 kcals/person/day. But the results of this study also suggest that there will be vast differences between countries and regions as well as within countries.
Urbanization to accelerate
Even more dramatic than the slow-down in overall population growth will be shifts in the urban–rural population balance. Globally, virtually all population growth between 2000 and 2030 will be urban (Figure 1a). As with the total population growth, the aggregate picture of a rapidly urbanizing world masks large regional differences. Urbanization will proceed slowly in many developed and transition countries, where the vast majority of the population is already living in urban areas. At the other end of the scale are sub-Saharan Africa and Asia, where urban populations will be growing at an astounding rate of nearly 5% per year. Also remarkable is the outlook for Latin America, traditionally the most urbanized developing region, with urban populations forecast to continue to grow at a rate of more than 2% annually (Figure 1b). Urbanization also means higher female participation in the work force and with that a shift away from traditional time-intensive food preparations towards precooked, convenience food at home or fast food and snacks for outside meals. Particularly for the urban poor, the shift towards fast and convenience foods may also imply a shift away from fresh fruits and vegetables, pulses, potatoes and other roots and tubers towards a much more sugary, salty, and fatty diet (Smil, 2000). It is also often a shift from a diet rich in fibre, minerals and vitamins towards one rich in energy, saturated fats and cholesterol.
However, urbanization not only affects changes in dietary patterns within a country, it 5 While this is positive evolution from many developmental perspectives, some of the underlying factors of this slowdown are not necessarily so. On the negative side are the impacts of HIV/AIDS which over the 30 years alone will mean that world population will be 200 million smaller than otherwise (UN, 2003). Much more positive as well as more significant is the rapid reduction in fertility rates which accounts for the lion’s share of the slow-down in growth.
Page 3 of 26

also promotes changes and convergence across borders. Urbanization creates infrastructure, transportation facilities, ports and roads, trains and airports, thereby facilitating trade both within and across countries. It affords international suppliers advantages of the high proximity to locally concentrated masses of consumers, allowing their foreign distribution channels (international supply chains, supermarkets, fast food chains) to operate efficiently and profitably. Foreign distribution channels displace traditional diets with more processed, sugary, fatty and in general energy dense food. Urbanization is also likely to heighten the burden of non-communicable diseases regardless of the shifts towards an urban diet and a more sedentary lifestyle. What is known as the “Roseto effect” (Egolf et al., 1992) in a more general context, applies to the socio-economic changes associated with urbanization. The “Roseto effect” describes the role of cultural factors related to a stable family structure, social cohesion and the supportive nature of the community in protecting against risk of heart disease and being conducive to longevity despite similar dietary and lifestyle risk factors. Urbanization affects many of these factors. It severs the traditional family links and creates a new geographic, social and cultural environment that affects existing family structures and social cohesion. Loosening of family ties and a loss of social cohesion predispose to increased risk in the same population (Shetty, 1997). And finally, urbanization also reduces levels of physical activity and thus energy expenditures, on average by about 10-15% (Ferro-Luzzi A & Martino L, 1996).
Figure 1 a/b: Urbanization, global outlook and regional differences (data from UN and WDI)
Africa and Asia are just beginning the urbanization process
Urbanization rates and share of urban population: 1999/01
M iddle East-North Africa
South Asia
East Asia
sub-Saharan Africa
Latin America and Caribbean
High Income Countries
Europe and Central Asia-1
0
1
2
3
4
5
20 30 40 50 60 70 80 90 100
Urban population, share of total
Urb
an p
opul
atio
n, g
row
th %
p.a
.
Source: World Bank, World Development Indicators, 2003
Urbanization to accelerate over the next 30 yearsUrban-rural population, World, 1950-2030
0
1
2
3
4
5
1950 1960 1970 1980 1990 2000 2010 2020 2030
billi
on p
eopl
e
Rural
Urban
Source, FAO, FAOSTAT, 2003
The globalization of the food distribution system and the emergence of supermarkets in developing countries
The acceleration in the nutrition transition is also affected by a radical change in the food marketing and distribution system. The emergence of supermarkets in developing countries is at the heart of this development with Latin America taking the lead. Reardon and Berdegué (2002) summarize the most important changes for the region. They found that, over the
Page 4 of 26

1990s, supermarkets have been taking over much of food retailing in Latin America. In 2000 they had roughly 60% on average of the national retail sectors in South America and Mexico, up from 15% in 1990. This means that the structural changes in the food distribution system that took 50 years in the United States have taken place in little more than a decade in Latin America. This rapid expansion was only possible as supermarkets moved far beyond their original niches, expanded from large to small and poor countries, from metropolitan areas to rural towns and expanded the customer base from the upper/middle to the poorer working classes. Reardon and Berdequé (2002) also venture into the likely developments for other regions. They suggest that East and South East Asia as well as Eastern and Central Europe are only 5 to 7 years behind the developments in Latin America and expect that the transition will even be faster in these regions. Even South and East Africa are thought to catch-up to Latin America over the next decade, albeit at a slower pace. Where supermarkets have made such massive inroads into the food retailing system, they affect the entire food economy. For farmers they are crucial as they determine quality and safety standards, packing and packaging, as well as payment practices. For consumers supermarkets often mean an abrupt change in available food supplies with mixed nutritional outcomes. In Brazil for instance, supermarkets have provided a boost to milk consumption, which was driven by a rapid increase in yoghurt and UHT milk (Ultra High Temperature). Here the expansion of supermarkets created a very positive outcome making safe and cheap milk available to the poor. But Reardon and Berdegué also find that supermarkets are often also distribution channels for cheaper, unhealthy snacks and provide the platforms for fast food chains and ‘junk’ food. The role of the food processing and the fast food industry
The growing processing of foodstuffs itself has an increasing influence on food consumption patterns. Vegetable oils, for instance, are important sources of essential fatty acids, but are as such not readily useable as ingredients for many sophisticated food products. Hydrogenation makes possible the conversion of fluid oils into spreadable margarine but the same process turns valuable unsaturated fatty acids into non-essential fats and into potentially harmful trans-fatty acids. Likewise, the almost universal shift to refined grain flour has a direct impact on the nutrient intakes particularly where wheat and maize are staple foods. Modern milling procedures produce refined flour which has better digestibility but destroys its texture, structure and valuable dietary fibre and decimates their minerals and vitamins. Smil (2000) stresses that producing white flour makes little sense from a nutritional perspective (its production entails high losses of total protein as well as lowering the quality), but it makes baking a lot easier.
Since the 1950s, bread made of refined white wheat flour, the dominant staple of European diets for millennia, has made major inroads in all parts of the world. The spread of bread, together with expanding sales of a large variety of other baked goods, has been a key ingredient to the adaptation of a “Western” diet. This trend is expected to continue, it may even accelerate, driven by a growing internationalization of food distribution systems; as already discussed, the spread of supermarkets and rapid urbanization are major factors behind that diffusion (Smil, 2000). Many of the developing countries are likely to consume not only higher levels of wheat but also much higher levels of white flour which is largely void of the fibre, essential minerals and vitamins.
Urbanization also means more frequent eating outside of the home, often under time constraints and sometimes also under budgetary constraints. The fast food industry has catered for these constraints providing fast access to cheap meals, take away services, or
Page 5 of 26

alternatively, home delivery services. The fast food meals also cater for other needs, most importantly the desire to eat a salt, sugar and fat rich diet, an old, evolutionary craving to benefit from access to these formerly scarce energy resources. Fats and sugars also provide a desirable taste and mouth feel and produce satisfactory satiety (Smil, 2000). Smil also underlines that the most popular items - hamburgers, pizza, fried chicken, doughnuts, quasi-Mexican dishes - have more than 30% of their food energy in fats. In addition to the increased fat and sugar content, the size of the typical servings has substantially increased, resulting in energy intakes of up to 1200 Kcals per serving. Rapid income growth globally, but with considerable regional differences
The growing and increasingly urbanised populations of developing countries are also expected to become increasingly affluent. Over the next 30 years, average of global per capita income is projected to rise at a rate of more than 2% per annum. Developing countries, starting from a very low basis, are expected to grow faster than the average. At nearly 4% annual growth per capita, their economies are expected to expand at twice the speed as those in the developed world. The optimistic outlook for developing countries is predicated on a number of factors. A crucial contributor to high growth will be a favourable shift in the population structure. The rapid transition from high to low population growth means that a large share of their future population will be economically active, with only a small share of very old and very young people. These economies will therefore enjoy a period of high economic growth, with lower education costs and lower pension obligations, the so-called “population dividend”. In relative terms, developing countries also stand to gain more from freer trade and should, again in relative terms, reap greater efficiency gains from trade liberalization. Similarly, they are also expected to gain relatively more from freer capital and technology flows which are expected to translate into substantive increases in overall factor endowment and productivity.
Also within the developing world, regional differences are more important than the overall averages. At the lower end of the scale is sub-Saharan Africa where GDP growth per capita will barely reach 2%. Even this depressed outlook seems upbeat when compared with the dismal performance of the past 15 years, when per capita incomes had actually been shrinking. In such an environment, the outcome of rapid urbanization is likely to be less desirable. Low per capita incomes combined with rapid rural-to-urban migration is likely to result in “premature” urbanization in many countries of the region, with slums, urban poverty and HIV/AIDS rising at a high rate thus contributing to the “urbanization of poverty” (UN Habitat, 2003).
At the upper end of the scale is East Asia, likely to experience both robust income growth and rapid urbanization. Particularly China’s population is still “under-urbanized6” and expected to transform rapidly into a much more urban society. A recent change in the government policy is expected to accelerate the current urbanization trend (Kynge and Dickie, 2003). Over the next 30 years, its urban population is expected to nearly double from 456 million to 883 million, while its rural population is expected to shrink from 819 million to 601 million people (UN, 2003). Combined with the prospect for high income growth and increasing international trade integration, food consumption is likely to change as well7.
6 The State Council’s Development Research Center (DRC) underlines that China’s current urbanization rate of 39% is equivalent only to that of the UK in the 1850s, that of the US in 1911 and that of Japan in 1950 (Kynge and Dickie, 2003). 7 How this will affect consumption patterns depends on the responsiveness of consumers to changes in income and prices. Probably the most comprehensive recent overview on income and price responsiveness is available from Seale et al. (2003). Based on data from the 1996 International Comparison Project (ICP), they calculate
Page 6 of 26
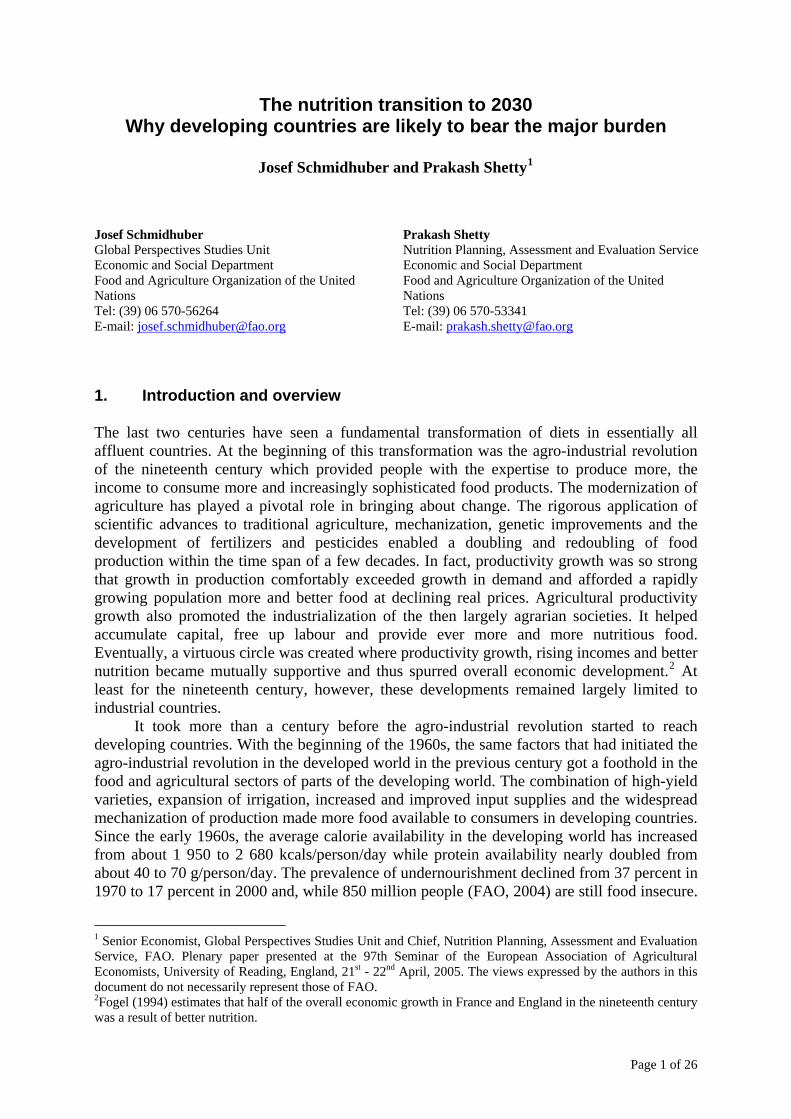
Ageing populations and “little emperors”
As already mentioned, a crucial driver for future income growth is the shift in the population structure. For the developing world as a whole, the share of people above 60 years of age is projected to rise from about 7% in 2000 to 20% in 2050. In tandem, the proportion of people below 15 years of age is projected to decline from 33% to 21%. In China, the ageing process started earlier, is more advanced by now and is projected to be more drastic over the next 50 years: the age bracket 60 years and above is projected to grow from 10% to 30% while the age bracket 15 years and less will shrink from 25% to 16% (Figure 2a/b). These shifts in the population structure are likely to impact on income growth and food consumption. A larger share of the overall population will be economically active, earning income that is spent on a shrinking number of children.
What can affect the developing world at large in the future is already very visible in urban China, where 20 years of a strict one-child policy and a booming economy have created a situation where rising incomes are often spent on the family's only child. Feeding the only child well is often seen as a first “investment” in the younger generation. The situation is often described as the “4:2:1 problem”, where 4 grandparents and 2 parents are focussing much of their attention on the family’s only child. The result is a sharp rise in the prevalence of overweight and obesity for a whole generation of “little emperors”8. The Shanghai Preventive Medical Association, for instance, found that nearly 30% of city’s children were overweight with almost half of them obese (Shanghai Preventive Medical Association, 2002).
Developing countries: Share of population below 15 and above 60 years of age
0%
5%
10%
15%
20%
25%
30%
35%
40%
45%
19501960
19701980
19902000
20102020
20302040
2050
income and price elasticities of food demand for 144 countries. 8 The “Beijing Scene” provides an illustrative description of the problem in an article of April 2003 and writes that Chinese children are now commonly described as "raised on sugar water" (“zai tangshui li zhangdade”) and enjoy all the privileges of being the only child (du shengzi). The little emperors are pampered (jiaoguan) and spoiled (chonghuai) by their parents and become increasingly overnourished (yingyang guosheng). For many parents more food still equates to more wealth and happiness and the growing number of obese children is regarded as a living testament to their family’s affluence.
< 15 years
> 60 years
China: Share of population below 15 and above 60 years of age
0%
5%
10%
15%
20%
25%
30%
35%
40%
45%
19501960
19701980
19902000
20102020
20302040
2050
< 15 years
> 60 years
Figure 2a/b: Ageing populations in developing countries
Page 7 of 26

3. The global nutrition transition: from 1960 to 2030
Ageing populations, urbanization, and rapid income growth will continue to affect food consumption patterns. The next section will try to identify to what extent, where and in what form these drivers of change have already contributed to changes in food consumption patterns; based on this, it will then sketch-out how this transition is expected to continue over the next 30 years. In the description of the nutrition transition, emphasis will be placed on (i) developing countries and in particular those that are likely to experience the fastest transformation and (ii) on changes that are likely to impact on the burden of diet-related diseases. They will then provide the basis for the discussion of factors that explain why developing countries are likely to bear the major health and economic burden of the nutrition transition (section 4).
3.1 Changes in the overall dietary energy supply (DES)
The 1960s: widespread food shortages and undernourishment At the most general level, a nutrition transition can be characterised by the changes in per capita energy supplies (Table 1). The comparison of today’s per capita energy availability with that of forty years ago shows an almost universal trend towards higher Dietary Energy Supply (DES) levels. At the beginning of the 1960s, the entire developing world – with the exception of Argentina, Uruguay and a handful of small countries in the Middle East and the South Pacific – was suffering from substantive calorie deficits, chronic under-nourishment and in some cases outright and population-wide famines. Asia in particular, was frequently hit by famines affecting large segments of its population. China’s great famine from 1958-1962, for instance, is estimated to have caused about 30 million casualties (Smil, 1999). Also India was affected by severe food shortages during the 1960s many of which took a heavy toll on the health and life expectancy of its population. The entire African continent was severely undersupplied, however, without exhibiting today’s differences between a well-supplied North African region and a grossly undersupplied sub-Saharan Africa (Table 1). All in all, nearly 40% of the population in developing countries was chronically undernourished, while over-nutrition and obesity were very minor and geographically narrowly defined problems. Table 1: Nutrition transition: a rapidly growing number of people will have more than 3200 kcals/day available
DES in kcals per person/day less than 2200 kcals 2200-2700 kcals 2700-3200 kcals more than 3200 kcals
Year Countries Pop
(millions) Countries Pop (millions) Countries Pop
(millions) Countries Pop (millions)
1961 86 1789 39 401 27 770 7 110 1970 58 1940 57 513 29 685 15 542 1980 40 1373 56 1473 41 906 22 665 1990 38 553 55 1643 37 1938 29 1103 1999 33 431 56 1893 59 2716 31 916
2015* 15 462 45 892 55 4509 26 1313 2030* 5 196 39 1189 54 3366 43 3477
*The number of countries for 2015 and 2030 is available is lower than for historical years due to the fact that for certain countries, projections are made on an aggregate basis (EU-15).
Many developed countries by contrast were already approaching or even exceeding
Page 8 of 26

DES levels of about 3000 kcals/person/day. However, even among the rich countries, large differences remained. While the most advanced industrialized countries (US, Canada, Germany, etc.) had already attained DES levels of 3300 calories and more, calorie supplies in less advanced industrial countries like Greece, Portugal or Spain remained at or below the 2500 calorie mark. Calorie supplies and composition in the latter group at that time resembled those of advanced developing countries of today like Mexico, Brazil, and China. But it was also the group of low-income industrial countries that experienced the fastest nutrition transition, catching up rapidly to the group of the richest countries. The nutrition transition in many of these countries could be a harbinger for dietary changes in many advanced developing countries over the next 15 years and for most other developing countries over the next 30 years or so.
From 1970 to 2000: the nutrition transition gathers momentum
Figure 3: Higher inequality in low income countries
The three decades from the 1970s to the end of 1990s brought about a radical change in the nutritional situation for many developing countries. Energy supply increased swiftly throughout much of East Asia, Latin America and the Near-East/North African region. Numerous factors have contributed to these improvements; probably the most important being the success of the “Green Revolution” and the shifts towards a more market-oriented agricultural sector in China (“The household responsibility system” and subsequent policy reforms). By the end of the 1990s, the rather homogeneous picture of low DES levels and hunger of the 1960s had changed drastically. The prevalence of undernourishment had fallen in all major developing regions except for sub-Saharan Africa and a few countries in South
Page 9 of 26
Asia to levels below 10%. Outside these areas, energy supplies have surged to levels that are giving rise to new concerns. Populations in the more rapidly developing countries have begun to experience the consequences from oversupply of food energy and a growing rise in obesity. And, where incomes are unequally distributed (Figure 3), hunger and obesity now often co-exist in the same country or region, creating a growing “double burden of malnutrition” in many developing countries. The outlook to 2030: the transition is expected to continue at a fast pace In many advanced developing countries, the rapid shift towards higher DES levels and increases in animal food consumption has already been associated with a rapidly rising prevalence of overweight, obesity and non-communicable diseases. The longer-term outlook suggests that the number of affected countries is likely to rise rapidly over the next 30 years. The speed of the nutrition and lifestyle transition and thus the incidence of overweight and obesity may even gather pace. A faster nutrition transition could be caused by rapid urbanization, high income growth, changes in the population structure (ageing) as well as changes in the food systems (marketing, processing and distribution systems) of developing countries (e.g. changes in food retailing and the emergence of supermarkets). The nutrition transition could be accompanied by a transition towards more sedentary lifestyles, also driven by urbanization and changes in the food distribution (supermarkets) and processing (convenience food) systems. The estimates presented in Table 1 suggest that a growing number of countries will move into per capita energy supply levels of 2700 kcals and more over the next 30 years. On average, consumers in developing countries will have nearly 3000 kcals per day at their disposal. Some developing countries will have even reached the very high calorie supply brackets of developed countries today. Overall, 43 countries, home of 3.5 billion people, will have reaches average calorie availabilities of 3200 kcals or more per person per day (Table 1). At the same time, the number and prevalence of chronically undernourished people will continue to decline; by 2030, only 6% of the developing countries’ population are estimated to remain chronically undernourished (Bruinsma, 2003). By then, the hunger problem should be largely limited to sub-Saharan Africa, but even there the prevalence of undernourishment is projected to be down to 15% or less than half of current levels. Alongside these high levels of average dietary energy supply, overnutrition is likely to become a growing problem. These averages mask, however, substantial differences both within and across countries. Where the income disparities remain high, hunger and over-nutrition are likely to co-exist within the same country. The overall result would be that the double burden of malnutrition will remain unresolved and add to the health and consequent economic burdens of many developing countries. Changes in the composition of the diet towards a more energy dense one rich in saturated fats and cholesterol could further aggravate the burden of high and rising energy supplies and thus add to the prevalence of NCDs. Figures 4a/b/c/d illustrate how rapidly the nutrition transition has evolved over the past 40 years and how it is expected to accelerate over the next 30 years. These figures also show that the transition has not and will not be limited to higher food energy supplies, it will also bring about a marked shift in the composition of the diet. The details of this shift will be analysed in the next section.
Page 10 of 26

Figure 4a/b/c/d: Energy and protein availability, 1961, 1981, 1999, 2030
Changes in the composition of the diet
The rapid increase in food energy supply has been accompanied by a shift in the composition of the diet. The principal steps of change seem to follow a common pattern: The first step could be described as an “expansion” effect. At low income levels, the main thrust of change is one towards higher energy supplies whereby the additional calories come largely from cheaper foodstuffs of vegetable origin. This has been an almost universal development and seems to take place regardless of cultural, religious factors, food traditions or agricultural production patterns. This first step applied as much to the developed countries of Western
Page 11 of 26

Europe9, Japan or Australasia as it applies to the ongoing shifts in many developing countries. Countries in the Near East/North African region, East Asia, Latin America and even the more developed parts of South Asia. Exceptions are largely limited to a few special cases, such as the pastoral societies of Africa, Central Asia or Latin America where ruminant meat is the traditional food staple. The second step is largely a “substitution” effect and reflects a shift from carbohydrate rich staples (cereals, roots and tubers) to vegetable oils, sugar and foodstuffs of animal sources -- largely at the same overall energy supply. The substitution effect exhibits much more country-specificity and is often influenced by cultural or religious food traditions. These factors determine both the extent to which animal products substitute for vegetable products as well as the composition of animal products that enter the diet. Table 2: Calorie availability from livestock products** 1962* 1970* 1980* 1990* 1998* 2015 2030 Calories / person / day World 281 301 321 351 380 397 438 Industrialized Countries 670 725 759 779 786 824 847 Developing Countries 117 133 165 214 284 345 393 Sub-Saharan Africa 106 112 125 115 108 120 138 Latin America 315 333 394 391 468 550 633 Near East/North Africa 215 220 278 264 261 312 362 East Asia 57 88 124 218 360 460 527 South Asia 113 106 118 158 185 247 314Transition Countries 525 616 764 748 568 628 685 * 3-year average centred on the year indicated **Meats, eggs, milk and dairy products (excluding butter and fish) Source: Bruinsma (2003).
Table 2 depicts the increasing importance of calories from animal products globally and the respective country/region-specific differences. A comparison of the estimates for the various points in time underlines the rapid expansion of consumption of animal products in essentially all regions. Growth was particularly pronounced in East Asia while sub-Saharan African countries showed no growth at all. The rapid expansion in East Asia was dominated by soaring (pig) meat consumption in China10, while growth in South Asia was driven by rapidly rising milk consumption over the past three decades (“White Revolution”). Both China’s and India’s growth in consumption of animal products are projected to continue over the next 30 years, albeit at a somewhat slower pace. But even at this slower pace, China will reach meat consumption levels by 2030 that will exceed those of many developed countries in the past (more than 65 kg and more than 500 kcals/day from livestock products). At the same time, meat and milk consumption will continue to rise in Latin America and the Near East/North African region. Again, while the expansion effect will be remarkable in both regions, cultural and agricultural factors will determine the composition of this shift. The expansion in the Near East/North Africa region will be driven by higher milk, eggs and poultry consumption, while higher beef and poultry consumption will continue to dominate the expansion in Latin America. 9 The dietary shifts in Portugal, Spain or Greece witnessed over the past 40 years are a perfect case in point. With growing affluence, dietary energy supplies rapidly rose from about 2500 Kcal per day in the 1960 to more than 3000 kcal in the 1980s and 1990s. The expansion was largely based on higher consumption of vegetable products. In the next step, the total energy supply rose only slowly but was characterized by a strong substitution effect from calories of vegetable origin to calories of animal origin. 10 There are indications that China’s overall meat consumption may be overstated, even after the downward corrections by more than 20% in 1996/97.
Page 12 of 26

Within limits, the shift towards higher meat and milk consumption reflects a desirable nutritional goal, increasing both the quantity and quality of protein and access to essential minerals and vitamins in the diet. It certainly benefits infants and children by promoting steady growth in the first years of life. It improves the dietary availability of micronutrients in general and of iron in particular, a particular advantage to women who are at increased risk of anaemia in their reproductive years. But these benefits decline rapidly as intake levels rise further and, when and where intake reaches adequate levels11, there is no good argument for continued increases. On the contrary, high intakes are associated with considerable risk and detrimental health effects. Increased consumption of red meat tends to increase the risk of some cancers and increased intakes of saturated fat and cholesterol from meat, dairy products and eggs increases the risk of cardiovascular diseases.
Higher meat and milk consumption levels were indeed associated with a marked shift towards higher intake levels of saturated fats and cholesterol. The headcount of countries in Table 3 shows that the increase in consumption of animal products was so strong that it pushed in a rising number of countries the intake levels for cholesterol and saturated fats above the recommended maxima. Even more impressive were the increases below the recommended maxima. Figures 5a/b show that (i) intake levels of both saturated fatty acids and cholesterol have increased almost everywhere over the past four decades (ii) that increases have been more pronounced in developed countries where high consumption levels of animal products have also lifted consumption levels of saturated fatty acids and cholesterol in many countries above the recommended maxima (iii) that in some cases, both levels are being exceeded often by a considerable margin, and (iv) an increasing number of developing countries are exceeding one or both thresholds.
Table 3: Fats and cholesterol availability in excess of recommended levels
1961/63 1969/71 1979/81 1989/91 1999/01 Limits(a) Number of countries
No of countries (b,c) 158 158 158 158 178 Total fat > 30% 28 31 43 54 61 Saturated fatty acids > 10% 47 49 50 55 62
Cholesterol > 300 mg/day 26 30 41 44 64 Notes: (a) All results are based on total availability rather than actual intake. This can result in a
misclassification of countries, particularly where recommendations are defined in absolute terms. (b) Limited to countries for which FAO produces Supply-Utilization Accounts (SUAs). (c) The disintegration of the Former Soviet Union and other countries in Eastern Europe increased
the number of countries for which FAO provided SUAs in the 1990s to 178.
The availability of projections for cholesterol and saturated fat consumption is circumscribed by the commodity break down in FAO’s long-term projections (Bruinsma, 2003). Unlike the historical series12, these projections distinguish “only” 26 food commodities and thus provide a level of aggregation that is too high to compute levels of saturated fatty acids and cholesterol intakes at an acceptable level of precision. However, as
11 A joint WHO/FAO report (WHO, 2003) provides detailed recommendations for appropriate nutritional minima and maxima. 12 The estimates for all historical consumption levels of all nutrients are based on a highly disaggregated dietary decomposition, distinguishing up to 426 different food commodities.
Page 13 of 26

both cholesterol and saturated fat13 intakes are highly correlated with meat, milk and egg consumption, the projections implicitly suggest a swift and substantial increase in intakes of these nutrients. The most pronounced increases can be expected for East Asia and Latin America, driven by further increases in poultry and beef consumption, respectively. But even developed countries are likely to top the already high levels of intake of saturated fatty acids and cholesterol as consumption of animal products is expected to increase even further. Other things being equal, this suggests a further deterioration in the dietary quality of many developed as well as the rapidly growing developing countries.
The adverse impacts of the rapid nutrition transition are likely to be compounded by a number of other factors that are specific to developing countries. This may not only mean that the nutrition transition proceeds faster in developing countries, but also that its adverse impacts are likely to be felt more strongly there. These additional factors include the speed of the transition itself, a phenotypic or genetic predisposition, or simply the fact that many developing countries lack adequate health promotion and healthcare systems that would help prevent and cope with the adverse impacts. The role and significance of these and other factors will be discussed in the next section.
Figure 5a/b: Cholesterol and saturated fatty acid consumption vs. recommended maxima, 1961 and 2001.
13 Cholesterol is completely limited to consumption of food from animal sources; animal fats are also rich in saturated fatty acids.
Page 14 of 26

4. Why developing countries are likely to bear the major burden of the nutrition transition
4.1 Foetal Programming14: “the thrifty phenotype”
The 1990s have seen a series of studies that explored the importance of prenatal nutrition on foetal growth in the development of obesity and NCDs in adult life. Amongst the most important of these studies are those by Susser and Stein (1994), Barker (1994) and Hales and Barker (2001). The basic proposition of these studies is that foetal undernutrition is an important contributor to the development of obesity and increased risk of NCDs in adult life. While the exact mechanism that cause this link is still being explored, the most widely accepted hypothesis (the so-called “Barker hypothesis”) postulates that hunger and undernutrition during certain stages of pregnancy resulting in intra-uterine growth retardation, (IUGR) “programmes”15 the foetal tissues such that food energy in adult life is more efficiently utilised16. As a result, low birth weight babies are more likely to become obese and also at risk of NCDs in a less austere adult life.
The consequences of this link in the context of the accelerating nutrition transition over the next 30 years could be significant, particularly in mid-income developing countries. Where rapid income growth and falling real prices for food raise the dietary energy supplies for large parts of a population in a rapid and massive manner, today’s hunger problems could become a harbinger for tomorrow’s obesity and chronic disease epidemic. In fact, it may already explain the rapid increase in the prevalence of obesity in those developing countries that experienced a rapid transition from paucity and hunger to relative affluence and ample food energy supplies (South Pacific region, Brazil, China, many countries in the Near East and North African region). Delisle (2002) underlines that the sharp increases in CHD and NIDDM in developing countries undergoing a rapid nutrition transition are highly congruent with the foetal origin’s hypothesis of Barker.
With a view to the future, developing countries with a high prevalence of low birth weights (LBW) today and high projected growth in dietary energy supply over the next 30 years could suffer a considerable obesity and NCD epidemic tomorrow. This will be particularly the case where urbanization, better transportation infrastructure, and/or mechanization of labour will lead to an increasingly sedentary and inactive lifestyle and lower energy expenditure even further as compared to dietary energy availability.
The phenotypic predisposition in conjunction with the rapid nutrition transition could 14 Delisle (2002) provides an overview of the evidence and implications for policy and intervention strategies. 15 The exact biological mechanism underlying the concept of “foetal programming” is still unclear. Most likely, it involves alterations in gene expression that modify tissue differentiation as well as hormonal and metabolic regulation. The hypothesis of an alteration in gene expression is supported by results from animal experiments that show clear inter-generational persistence of the programming. If true, this would mean that transient effects in pre-natal life have not only a permanent generational but also a persistent inter-generational effect on our metabolism and activity levels. In response to an adverse nutritional environment (hunger, protein deficit, micronutrient deficiency), a resetting of the metabolism may be involved to become more “thrifty” when nutrient supply is reduced (Hales, 1991). These metabolic changes give the offspring a crucial advantage in times of scarcity, but they also become a liability in an environment of abundance, increasing the risk of obesity and related NCDs. 16 Epidemiological and experimental data reveal that foetal growth is a complex, dynamic process that depends on a continuous supply of nutrients from the mother. Severing this supply, even only over a brief period of time, may lead to irreversible changes in the offspring and to degenerative diseases in adulthood. There is also evidence that programming is not only the result of malnutrition in developing countries, but also of nutritional imbalances in affluent populations. Numerous projects are underway in developed countries to broaden the scientific basis for the foetal origin hypothesis of degenerative diseases such as glucose intolerance, diabetes, obesity, hypertension and cardiovascular diseases (e.g. Remacle, 2001).
Page 15 of 26
also mean that the socio-economic impacts of obesity and NCDs will be felt more strongly in developing countries. While consumers will no longer be “food-poor”, they are still too poor to afford the access to medical care (“health poor”). They may suffer from NIDDM, CHD and obesity without access to the healthcare that makes these diseases manageable. A drop in overall economic productivity and eventually in life expectancy could be the consequence alongside an enormous burden on health in these societies and the consequent loss of economic productivity.
4.2 Childhood undernutrition, stunting and central obesity Evidence is also emerging to suggest that childhood malnutrition is associated with overweight in children from countries that are currently experiencing economic and nutrition transition (Popkin et al, 1996). Stunting in children is a discordance between linear growth and adipocyte development and will enhance adipocyte development when linear growth is affected by malnutrition. There is increasing evidence that malnourished populations in developing societies are at increased risk of the development of obesity. The causal link between the two operates by a range of mechanisms. Recovery from one or several episodes of undernutrition results in alterations in body composition with increases in the amount of fat gained and probably an increase in intra-abdominal fat deposition. Ashworth (1969) reported an increase in percent body fat following nutritional rehabilitation of malnourished children while Fjeld et al. (1989) made similar conclusions when they expressed the fat gained as a proportion of the total weight gained during catch-up growth in malnourished children both during early and late recovery. These alterations in body composition manifesting with a reduced lean tissue mass result in a reduced basal energy expenditure and even a reduction in the energy costs of physical activity. Potential mechanisms for the association between malnutrition and risk of obesity include long-term effects of undernutrition in childhood on energy expenditure, fat oxidation, regulation of food intake, susceptibility to the effects of high-fat diets, and altered insulin sensitivity as reported from studies on stunted children in Brazil (Sawaya et al., 2003).
4.3 Population variations: “The thrifty genotype” In addition to the thrifty-phenotype hypothesis, there is also the thrifty-genotype hypothesis which postulates a genetic predisposition for a more efficient metabolism independent of the effects of IUGR and foetal programming. The thrifty genotype hypothesis was first formulated by Neel (1962). Neel put forward the hypothesis that the diabetic genotype was in a sense a "thrifty" genotype that promoted the efficient utilization of large amounts of food. This could create a survival advantage in an environment in which both feast and famine were common. The apparent overproduction of insulin by certain individuals today could thus be a remnant from evolutionary times, when it helped to accumulate fat storage for times of food scarcity17. 17 The thrifty genotype clusters that have experienced a rapid nutrition transition are particularly interesting for research. They epitomise the extreme case scenario for the development of obesity and related NCDs that may plague thrifty phenotype populations that are or are expected to undergo a very fast transition from low levels to high levels of energy supply. The fate of the Nauruans may help illustrate the case. For millennia, Nauruans have lived as fishermen and farmers, with food supply alternating between bouts of food restriction and other times of abundance. When the island was discovered to be full of high-quality rock phosphate in 1922 its residents became wealthy and they shifted from their traditional lifestyle of “feast and famine” to a lifestyle of permanent food abundance. Their new-found wealth had a profound effect on the people and their health. They turned to a high-sugar/high-energy diet, and adopted an extremely sedentary lifestyle. In only one generation, they have fallen victim to an epidemic of obesity and NCDs. The prevalence of NIDDM
Page 16 of 26

Critics, however, argued that all ancient populations must have been confronted by recurring famines, particularly early agrarian populations. Agricultural societies everywhere, precariously reliant on several staple crops, have been chronically prone to famines (Solbrig and Solbrig 1994). Neel consequently suggested that the thrifty genes may indeed have once been universally acquired, but subsequently it would have been selected against in circumstances of dietary sufficiency in well established agrarian populations. In those circumstances, he argued, metabolic thrift would have caused obesity and diabetes in early life, thereby reducing reproductive success. However, medical science invalidated this explanation later by putting forward evidence that NIDDM did not generally cause disease until after the third decade of life, which means that the problems brought about thrifty genes fail to provide the selection pressure that would have been necessary to explain the observed genetic differences. When Neel (1982) revisited the 1962 research, he also revised the rationale put forward in the original hypothesis and argued that the predisposition of certain populations to develop NIDDM was due to genetically based insulin resistance, acquired in response to hunter-gatherer diets that were low in carbohydrates and high in fat and meat. He argued that a selective insulin resistance would have maximised the availability of glucose in blood as an immediate fuel while also maximising the synthesis of fats from dietary fatty acids and meat-protein amino-acids, and their deposition in adipose tissue as an energy store (McMichael, 2001).
The lactose tolerance connection18
There is growing evidence that, from around 9000 years ago, the first farming
communities from the Middle East (“fertile crescent”) began moving into to Western and then North Western Europe. This “wave of advance” proceeded at the speed of about 1km per year (Diamond 1997). Cavalli-Sforza et al. (Cavalli-Sforza, 1994) calculated that this move resulted in a gradient of “farmers’ genes” that accounts for about 28 % of all genetic variations between sub-populations of Europe. The frequency of these farmers’ genes increased and eventually overwhelmed the smaller hunters-gatherer gene pool of Europe’s indigenous population. As a result, it is claimed that the greater insulin sensitivity of the farmers’ population eventually became prevalent in Europe. However, there are reasons to believe that the actual process of change was not that linear. First, frequent intrusions of non-farming populations into Europe changed the composition of Western European gene pools. Second, it seems unlikely that the selection pressure of exposure to an agricultural diet alone was sufficient for the emergence of the distinctively lower susceptibility to NIDDM in Western European populations today.
The lactose tolerance connection put forward by Allen and Cheer (1996) provides a
more cogent explanation of the driving forces behind the rapid changes in gene frequencies. Most importantly, it provides the rationale for a sufficiently high selection pressure to explain the changes in gene frequencies that must have taken place in just a few millennia.
soared with two-thirds of those over the age of 35 affected by the disease. The Pima Indians in Arizona have experienced a similar transition in diets and lifestyle. And, they suffer problems of the same nature and a similar extent. Their tribal relatives across the border in Mexico, who largely maintained their traditional diets and levels of physical activity characteristic of their native lifestyle, however, managed to eschew the related health problems. 18 For a more complete discussion see McMichael, 2001.
Page 17 of 26

At the heart of the lactose tolerance hypothesis are the metabolic functions of the various nutritional components of milk. First, lactose plays a critical role for the intestinal absorption of calcium. Like Vitamin D, lactose facilitates the absorption of calcium and thus functioned as a surrogate for the missing sunlight in higher latitudes. This was important for proto-European farmers to survive on their way to the north. Insufficient calcium availability and/or absorption would have resulted in bone-deforming rickets and would have, for instance via a misshapen pelvis, significantly lowered the success of reproduction. Second, milk and particular milk protein is in itself a potent stimulus for insulin release. This allowed to clear the blood from high levels of glucose and thus store high amounts of energy of a carbohydrate rich agricultural diet (grains and starchy roots) without suffering from the consequences of hyperglycaemia. And, third lactose is in itself moderately glycaemic adding to the exposure and thus to the pressure to adapt to a glycaemic diet. The consumption of milk allowed proto-European farmers to first survive in northern latitudes without the traditional ultra-violet powered Vitamin D synthesis and then successfully adapt to an unusually glycaemic diet, rich in simple carbohydrates both from cereals and milk products (McMichael, 2001). Allen and Cheer (1996) provide further support for the lactose connection hypothesis. Most importantly, they found a negative correlation (r=-0.56) between the prevalence of NIDDM and lactose tolerance, in a sample of more than forty different populations world-wide. Within this global sample, European populations show the highest levels of lactose tolerance and the lowest prevalence of NIDDM.
4.4 Ethnic differences in disease risk: Interactions of genetic predisposition and environmental change Population specific risk of chronic non-communicable diseases is often manifested as ethnic variations in disease risk seen in migrant populations as compared to the native residents or indigenous populations. This is largely a manifestation of environmental influences and emphasises the importance of environmental factors in chronic disease risk. The best examples of this are seen in the second generation Japanese immigrants to Hawaii and on to California who have similar rates of mortality from colon cancer to the native Caucasians but have much lower rates of mortality from stomach cancer than the Japanese resident in Japan (Kolonel et al, 1980; Wynder et al, 1981). On the other hand, migration or ethnic studies also provide evidence for the unmasking of a probable genetic predisposition to the risk of early onset adult chronic disease. The best examples are the increased risk of NIDDM and coronary heart disease (CHD) among migrants from the Indian subcontinent to the United Kingdom compared to the native European population (McKeigue, 1997). These so called “ethnic variations” in NCD risk forms another important component of our understanding of this interaction between genetic and environmental factors (“nature vs. nurture”). As a result of the alteration in the environment those who had apparently successfully adapted to a different environment now manifest patterns of disease risk which were hitherto concealed. Genetic susceptibilities are expressed in these new environments. South Asian migrants to the UK show that plasma cholesterol is one of the strongest predictors of CHD risk alongside the well recognised association between raised plasma cholesterol and CHD which is just as strong as in the case of Europeans (McKeigue & Sevak, 1994). Studies among the South Asian community so far studied in the UK have neither demonstrated levels of plasma cholesterol higher than the national average in the UK nor have they shown any remarkable differences in dietary intakes of total saturated fat intakes (McKeigue & Sevak, 1994). However, they do show a 3-4 fold increased risk of CHD and NIDDM among migrants as compared to the native populations. Probably the present dietary
Page 18 of 26

intakes and lifestyles are different from their pre-migration diets, lifestyles and their levels of physical activity may have altered and these changes may have unmasked a predisposition to these diseases. Interestingly, they also demonstrate this increased risk at lower levels of obesity (mean BMI around 23) and a tendency to central or abdominal obesity which stands out as an important risk factor associated with this increased risk of CHD and NIDDM. The
relation between obesity and insulin resistance may occur at lower levels of fatness in South Asians compared with Europeans, and in recognition of this the World Health Organization has recommended lower levels of body mass index as desirable in South Asians i.e. a body mass index higher than 23 (Lancet 2004). There is increasing evidence that this genetic predisposition in the South Asian population is probably manifest in markers such as Lipoprotein ‘a’ levels and in markers of thrombosis and increased coagulability (Bhatnagar et al, 1995; Enas & Mehta, 1998; Mohan et al.,1998). Similar variations in disease risk are manifest within a country (or region) following internal migration from rural to urban areas. The best example of this effect of internal migration from rural to urban areas is that reported from Kenya (Poulter et al., 1990). As the men and women of the Luo tribe in rural Kenya with relatively low blood pressures migrated to Nairobi in search of employment their blood pressures showed a rise. This remarkable longitudinal follow-up study of the Luo migrants was a natural experiment that demonstrated a change in blood pressure following migration over a short distance, over a period of 2 years. The new urban environment affected the whole population distribution of blood pressure, which shifted to the right as compared to the distribution observed among the non-migrant rural controls. Not only was the percentage of individuals with hypertension greater among migrants but the percentage of those with low blood pressure was also less in the migrants than in non-migrant controls. This study further implicates rural-urban migration and the accompanying environmental transition characterised by diet and lifestyle changes as being responsible for the development of hypertension. Rural-urban differences in NIDDM and CHD within a region or a country as in India show similar variations in disease risk suggesting that internal migration, urbanisation and exposure to modern diet and life-styles increase risk of chronic disease (Chadha et al, 1995). Here too perhaps both genetic and environmental factors interact to result in increased risk of chronic disease among the internal migrants from rural to urban areas within a region. Recent studies comparing Mexican Americans in San Antonio with Mexicans living in Mexico City however suggests that environmental factors can override even the genetic susceptibility in the expression of the risk of chronic diseases such as that of NIDDM (Stern et al, 1992) attributing even stronger causal roles to environmental changes during an individual’s lifetime. Given the enormous movement of populations in developing countries into urbanised environments (practically their entire population growth will be urban over the next 30 years) and the consequent diet and lifestyle changes the health burden of this aspect of nutrition transition cannot be exaggerated. It is thus estimated that the numbers with diabetes in India are projected to increase to 60 million by 2025 (King & Rewers, 1998) which will impose a huge health and economic burden on its resources. South Asian populations (which include India, Pakistan, Bangladesh and Sri Lanka) are experiencing rapidly escalating epidemics of diabetes and cardiovascular disease. The prevalence of NIDDM in urban Indian adults has increased from <3% in the 1970s to >12% in 2000 (Ramachandran et al., 2001). The prevalence of CHD has increased from < 2% to 10% and it is estimated that CHD will be the leading cause of death in adults (Reddy, 1993) by 2025. This means that one in five diabetic patients in the world will be Indian, and three out of four will be from developing countries. 4.5 Infections and chronic disease
Page 19 of 26
There is an emerging body of evidence in the literature, which is attributing an important role for infective agents in the development of chronic disease risk. NIDDM and CHD share many antecedent factors that frequently co-exist and which has given rise to the concept of common “soil”. Classical risk factors for both these NCDs are also associated with raised concentrations of inflammatory markers such as tumour necrosis factor (TNF-alpha) and interleukin (IL-6) which are raised in individuals with NIDDM (Pickup & Crook, 1998) and CHD (Ross, 1999). These inflammatory markers are also strongly related to measures of endothelial dysfunction (i.e. change in the blood vessel wall characteristics and function) which predisposes to increased risk of cardiovascular disease. There is thus evidence suggesting that early life experiences related to infections may influence adult risk of CHD. Some of this risk may be related to bacterial and other infections in childhood. Chronic bacterial infections have been associated with CHD. Several studies have suggested that seropositivity for Chlamydia pneumoniae as a risk factor for CHD (Mendall et al, 1995). The association of adult CHD with Helicobacter pylori seropositivity suggests that the early childhood environment may be important in determining the risk of CHD in adult life (Mendall et al., 1994). If infections do contribute to CHD risk then they raise issues related to the poor environment in developing societies, particularly among the increasing urban poor and the raised NCD risk they contribute to. It also raises the great potential importance of the ease of treatment of these infections and thus the reduction of the subsequent adult disease risk. In addition, the poor environment and sanitation associated with poor nutrition that predispose to repeated and frequent infections can continue to activate the hypothalamo-cortical axis and further promote abdominal obesity (Bjorntorp, 1993). Given the enormous numbers of undernourished and stunted children in developing societies and the persistence of malnutrition even in countries in rapid developmental transition, it is not unlikely that these factors will contribute to increase the problem of abdominal obesity and the increased risk of NCDs in developing countries. 4.6 Dietary imbalances and chronic disease Elevated blood levels of homocysteine have been linked to increased risk of premature coronary artery disease, stroke, and venous blood clots, even among people with normal cholesterol levels. Homocysteine levels rise in individuals when the dietary intakes of several anti-oxidant vitamins such as folate and B group vitamins are low (Evans et al., 1997). Vitamins and related antioxidant substances are normally (with the exception of vegans, etc) provided by a balanced diet, but they are in short supply in many developing countries. In developing countries the problem is further complicated by the presence of parasitic infestations of the intestines which further compounds the vitamin and mineral deficiencies in the diet. In principle, provision of these vitamins can help prevent this problem, which in developed societies is often possible due to fortification of common foods such as bread by folate for instance.
The role of antioxidant vitamins in preventing chronic diseases like CHD and some cancers also have a bearing on the emergence of NCDs in developing countries. The marginal intakes and poor nutritional status with respect to antioxidant vitamins and minerals increases their predisposition and risk of these chronic diseases. The recent demonstration of homocysteine as a culprit in CHD risk) and the relationship between folic acid and pyridoxine status with homocysteine is another good example of how marginal nutrient deficiencies in populations in developing countries may contribute to the increasing risk of non-communicable diseases. Deficiency in folate affects a majority of women and many men in virtually all countries. The consequences are thought to include an increased risk of heart disease and stroke although the
Page 20 of 26

argument continues to be made that a causal link is yet to be established. Initial research, however, suggested that as many as 25% of deaths from these two causes might be the result of folate deficiency. More conservative estimates put the increased risk at 10% (UNICEF & Micronutrient Initiative, 2004).
5. Summary and conclusions Many developing countries are currently undergoing a rapid nutrition transition. Falling real prices for food enable a growing number of consumers to move swiftly towards higher calorie intake levels and allow them to embark on consumption patterns that had hitherto been reserved for consumers in developed countries at a much higher level of (nominal) income. FAO’s long-term outlook suggests that the shift towards higher energy supply levels will accelerate and encompass a growing number of countries.
In addition to falling real prices of food, rapid urbanization has and will continue to affect both consumption patterns and energy expenditure. Essentially the entire population growth over the next 30 years will be urban. Urbanization creates a new and improved marketing and distribution infrastructure, attracts supermarkets and their sophisticated food handling systems (cold chains, etc.), better roads and ports, thus improves the access of foreign suppliers and the importance of imports in overall food supply and, all in all, will promote a globalization of dietary patterns. Most importantly from a nutrition perspective, these changes include not only a shift towards higher food energy supplies but also a shift towards more fats and oils and more animal-based foodstuffs, and thus higher intakes of saturated fat and cholesterol. Urbanization is also often associated with less physical labour, a mechanization of production, and the convenience of piped water or mechanised transportation. In general it leads to a more sedentary lifestyle with calorie expenditures that are 10-15% below rural averages (Ferro-Luzzi A & Martino L, 1996).
In many developed countries, the shift in consumption patterns and lifestyles has already resulted in a rapid increase in the prevalence of overweight, obesity and related NCDs. Many developing countries are in the process of undergoing a similar transition in nutrition and lifestyles, the health impacts of this transition could be more severe and the capacities to deal with adverse health impacts are more limited. The main compounding factors of these nutritional changes are: a phenotypic and genotypic predisposition towards developing obesity and NCDs. The phenotypic predisposition is the result of rapid transition from hunger and undernourishment towards overnutrition and affluence. There is ample empirical evidence that hunger and malnutrition “programme” the next generation to developing a more efficient energy metabolism and thus to have a higher propensity to develop obesity and related NCDs. The genotypic predisposition may be an important element in certain population or ethnic groups which increases their risk of NCDs at levels much below those observed in the population at large.
The combination of (i) the rapid nutrition transition with rapidly declining share of expenditure on food as percent of total expenditure/income, (ii) urbanization, (iii) the shift in diet towards more animal products, and (iv) the phenotypic and genotypic predisposition towards a more efficient metabolism and NCDs could spark a rapid increase in the prevalence of obesity and NCDs over the next 30 years. The human and economic toll could be dramatic and for many the exit out of food-poverty may be associated with a straight entry into health-poverty. This means that, while fewer people will suffer from hunger and chronic undernourishment, more will have health problems related to obesity and NCDs. The impacts will be felt more severely than in developed countries as fewer consumers in developing countries will be able to afford the needed medical treatment even if they can afford more food. Many NCDs can have a lethal impact if left untreated.
Page 21 of 26

The policy messages from these developments are twofold. First, fighting hunger today and thus minimising the phenotypic predisposition to develop obesity and NCDs should receive extra attention by national policy makers and the international community. Particularly food programmes that help improve pregnancy and pre-pregnancy nutrition should be promoted. By helping to curb a likely obesity epidemic, these programmes will yield an extra return in the future - over and above their current anti-hunger dividend. Second, given the speed of the nutrition transition and the higher susceptibility of consumers in developing countries towards developing obesity and NCDs, there is a need to design and devise policy measures that help avoid adverse nutritional outcomes in developing countries as soon as possible.
Page 22 of 26

Bibliography
Allen, J.S. and Cheer, S.M. (1996), “The non-thrifty genotype”, Current Anthropology, 37, 831-842. Ashworth A (1969). Growth rates in children recovering from protein-calorie malnutrition. British Journal of Nutrition 23: 835-845. Barker DJP (1994). Mothers, babies and diseases in later life, London: BMJ Publishing. Bhatnagar D, Anand IS, Durrington PN, Patel DJ, Wander-GS, Mackness MI, Creed F, Tomenson B, Chandrashekhar Y, M Winterbotham (1995). Coronary risk factors in people from the Indian subcontinent living in west London and their siblings in India Lancet. 345 : 405-9. Bjorntorp, P (1993). Visceral obesity: a ‘civilization syndrome’ Obesity Research 1: 206-222. Bruinsma, J (ed) (2003). “World agriculture: towards 2015/2030, An FAO Perspective”, FAO, Rome and Earthscan, London. Center for Consumer Freedom (2004). An Epidemic of Obesity Myths, June 2004, available at: http://www.consumerfreedom.com/downloads/promotional/docs/040602_obesitymyths.pdf Chadha SL, Gopinath N, Katyal I & S Shekawat (1995). Dietary profile of adults in an urban and rural community. Indian Journal of Medical research.101: 258-67. Diamond, J. (1997), “Guns, Germs and Steel. The fate of Human Societies”, London: Jonathan Cape. Egolf B, Lasker J, Wolf S, L Potvin (1992). The Roseto effect: a 50-year comparison of mortality rates. American Journal of Public Health, 82: 1089-1092 Enas EA and JL Mehta (1998). Lipoprotein (a): an important risk factor in coronary artery disease Journal of the American College of Cardiology. 32: 1132-4 Evans RW; Shaten BJ; Hempel JD; Cutler JA and LH Kuller (1997). Homocyst(e)ine and risk of cardiovascular disease in the Multiple Risk Factor Intervention Trial. Arteriosclerosis Thrombosis & Vascular Biology. 17: 1947-53 FAO (2004). “The State of Food Insecurity in the World 2004”, Rome. Ferro-Luzzi A & L Martino (1996). Obesity and physical activity In: The origins and consequences of obesity. Ciba Foundation Symposium 201:228-246. Chichester: John Wiley & sons, 1996. Fjeld CR, Schoeller DA & KH Brown (1989). Body composition of children recovering from severe protein-energy malnutrition at two rates of catch-up growth. American Journal of Clinical Nutrition 50: 1266-1275.
Page 23 of 26

Fogel, R (1994). “Economic growth, population theory and physiology: the bearing of long-term processes on the making of economic policy”, American Economic Review, 84(3):369-95. Hales CN & DJP Barker (2001). The thrifty phenotype hypothesis British Medical Bulletin 60:5-20. Kantor, L.S., Lipton, K., Manchester, A. and V. Oliveira (1997). “Estimating and Addressing America’s Food Losses”, Food Review, January 1997. Kolonel-LN; Hinds-MW and JH Hankin (1980). Cancer patterns among migrant and native born Japanese in Hawaii in relation to smoking, drinking and dietary habits. In: Genetic and Environmental factors in Experimental and Human Cancer (Gelboin et al, editors) pp327-40. Sci Soc Press: Tokyo. Kynge, J and M Dickie (2003). “China encourages mass urban migration”, in: The Financial Times, 27 November 2003. McKeigue PM & Sevak L (1994). Coronary heart disease in South Asian communities: A manual for health promotion. London: Health Education Authority. McKeigue PM (1997). Cardiovascular disease and diabetes in migrants- interactions between nutritional changes and genetic background. In Diet, nutrition and chronic disease: Lessons from contrasting world, pp59-70. (Editors: Shetty and McPherson) London: John Wiley. McMichael, AJ (2001), “Diabetes, ancestral diets and dairy foods. An evolutionary perspective on population differences in susceptibility to diabetes”, in H. Macbeth and P. Shetty (eds), society for the Study of Human Biology Series 41, Health and Ethnicity, London and New York. Mendall-MA; Carrington-D; Strachan-D; Patel-P; Molineaux-N; Levi-J; Toosey-T; Camm-AJ; Northfield-TC (1995). Chlamydia pneumoniae: risk factors for seropositivity and association with coronary heart disease. Journal of Infection 30: 121-8. Mendall-MA; Goggin-PM; Molineaux-N; Levy-J; Toosy-T; Strachan-D; Camm-AJ; Northfield (1994). Relation of Helicobacter pylori infection and coronary heart disease, British Heart Journal 71: 437-9. Mohan-V; Deepa-R; Haranath-SP; Premalatha-G; Rema-M; Sastry-NG; Enas-EA (1998). Lipoprotein(a) is an independent risk factor for coronary artery disease in NIDDM patients in South India. Diabetes-Care. 21: 1819-23. Neel JV (1962). Diabetes mellitus: a “thrifty genotype” rendered detrimental by “progress”. American Journal of Human Genetics, 14: 353-362 Neel JV (1982). “The thrifty genotype revisited”, in Kobberling,J. and Tattersall, R.(eds) The genetics of Diabetes mellitus, London: Academic Press, pp. 283-293.
Page 24 of 26

Pickup JC & Crook MA (1998). Is type II diabetes mellitus a disease of the innate immune system? Diabetologia 41: 1241-48. Popkin BM, Richards MK & Monteiro CA (1996). Stunting is associated in children of four nations that are undergoing nutrition transition. Journal of Nutrition 126: 3009-16. Popkin, BM, Horton, S, and Kim S (2001). The Nutrition Transition and Prevention of Diet-related Chronic Diseases in Asia and the Pacific, Food and Nutrition Bulletin, vol. 22, no. 4 (supplement), United Nations University Press, The United Nations University, Tokyo. Poulter-NR; Khaw-KT; Hopwood-BE; Mugambi-M; Peart-WS; Rose-G; Sever-PS (1990). The Kenyan Luo migration study: observations on the initiation of a rise in blood pressure. British Medical Journal. 300: 967-72. Ramachandran A, Snehalatha C, Kapur A, Vijay V, Mohan V, Das AK, Rao PV, Yajnik CS, Prasanna Kumar, KM and JD Nair (2001). High prevalence of diabetes and impaired glucose tolerance in India: National Urban Diabetes Survey. Diabetologia 9:1094-1101). Reardon, T and JA Berdegué (2002). “The Rapid Rise of Supermarkets in Latin America: Challenges and Opportunities for Development”, Development Policy Review, 2002, 20 (4): 371-388. Reddy, KS (1993). Cardiovascular diseases in India. World Health Statistics Quarterly. 46:101-107. Ross, R (1999). Atherosclerosis: an inflammatory disease. New England Journal of Medicine 340: 115-26. Sawaya AL, Martins P, Hoffman D, Roberts SB (2003). The link between childhood undernutrition and risk of chronic diseases in adulthood: a case study of Brazil. Nutrition Reviews 61: 168-175. Seale, JL, Regmi, A & J Bernstein, (2003). International evidence on food consumption patterns. Electronic Report from the Economic Research Service (ERS). Technical Bulletin No. 1904, October. Shetty, PS (1997). “Diet, Lifestyle and Chronic Disease: Lessons from Contrasting Worlds”, in “Diet, Nutrition & Chronic Disease, Lessons from Contrasting Worlds”, Shetty, P.S. and K. McPherson (Eds.), Wiley. Smil, V (1999). “China's great famine: 40 years later”. British Medical Journal Volume 319, 18-25th December, pp 1619-1621 Smil, V (2000). Feeding the World – A Challenge for the Twenty-First Century, The MIT Press, Cambridge, Massachusetts and London, England. Solbrig O.T. and Solbrig, D.J. (1994), “So shall you reap”, Washington, DC: Island Press. Stern-MP; Gonzalez-C; Mitchell-BD; Villalpando-E; Haffner-SM & Hazuda-HP (1992). Genetic and environmental determinants of type II diabetes in Mexico City and San Antonio. Diabetes. 41: 484-92
Page 25 of 26
Susser M & Stein Z (1994). Timing in prenatal nutrition: a reprise of the Dutch Famine Study. Nutrition Reviews 52: 84-94 UN Population Division of the Department of Economic and Social Affairs (2003). World Population Prospects: The 2002 Revision, New York: United Nations. UN-Habitat (2003). “Challenge of Slums”, Global Report on Human Settlements in 2003, UN and Earthscan. UNICEF and Micronutrient Initiative (2004). ‘Vitamin & Mineral Deficiency: A Global Progress Report’ Micronutrient Initiative, Canada. World Bank (2004). World Development Indicators. CD-ROM. WHO/FAO (2003). Diet, Nutrition and the Prevention of Chronic Diseases, Report of a Joint WHO/FAO Expert Consultation, WHO Technical Report Series – 916, Geneva. Wynder EL, McCoy GD, Reddy BS (1981). Nutrition and metabolic epidemiology of cancers of the oral cavity, oesophagus, colon, breast, prostate and stomach. In: Nutrition and cancer: etiology and treatment. (Editors: Newell GR and Ellison NM). pp 11-48New York: Raven Press.
Page 26 of 26