the norwegian tax system - main features and … the norwegian tax system — main features and...
TRANSCRIPT

The Norwegian tax system
- main features and developments
Chapter 2 of the budget proposal on taxes 2015
Oslo, 8 October 2014
1
The Norwegian tax system – main features and developments
2 The Norwegian tax system – main features and developments
2.1 Introduction The tax system funds public welfare and
serves as a redistributive tool. Taxes should be
structured to promote high output and efficient
resource allocation. The tax system should not
impose unnecessarily high administrative costs
on taxpayers and authorities. Taxes also have a
counter-cyclical effect. The tax system contrib-
utes to automatic stabilisation of the economy as
tax revenues increase during good times and de-
cline during challenging times.
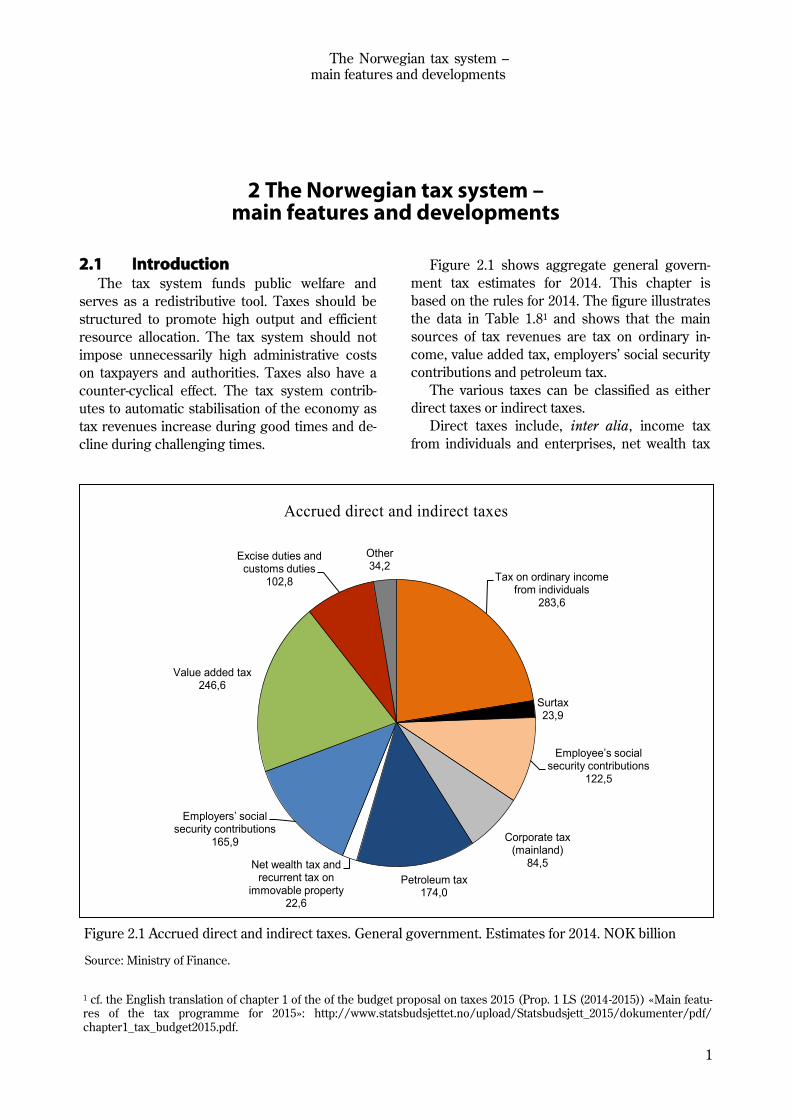
Figure 2.1 shows aggregate general govern-
ment tax estimates for 2014. This chapter is
based on the rules for 2014. The figure illustrates
the data in Table 1.81 and shows that the main
sources of tax revenues are tax on ordinary in-
come, value added tax, employers’ social security
contributions and petroleum tax.
The various taxes can be classified as either
direct taxes or indirect taxes.
Direct taxes include, inter alia, income tax
from individuals and enterprises, net wealth tax
Tax on ordinary income from individuals
283,6
Surtax23,9
Employee’s social security contributions
122,5
Corporate tax (mainland)
84,5
Petroleum tax174,0
Net wealth tax and recurrent tax on
immovable property22,6
Employers’ social security contributions
165,9
Value added tax246,6
Excise duties and customs duties
102,8
Other34,2
Accrued direct and indirect taxes
Figure 2.1 Accrued direct and indirect taxes. General government. Estimates for 2014. NOK billion
Source: Ministry of Finance.
1 cf. the English translation of chapter 1 of the of the budget proposal on taxes 2015 (Prop. 1 LS (2014-2015)) «Main featu-res of the tax programme for 2015»: http://www.statsbudsjettet.no/upload/Statsbudsjett_2015/dokumenter/pdf/
chapter1_tax_budget2015.pdf.

2
The Norwegian tax system —main features and developments
and recurrent tax on immovable property. Direct
taxes account for 72 pct. of overall tax revenues.
47 pct. of this is in the form of income tax from
individuals, including employee’s social security
contributions and surtax, whilst 27 pct. is in the
form of income tax from enterprises, including
the petroleum industry. Tax revenues from main-
land enterprises account for 8 pct. of tax revenues
from Mainland Norway.
Indirect taxes include value added tax, excise
duties and customs duties, and account for 28
pct. of overall tax revenues. Value added tax is the
main source of revenues from indirect taxes, ac-
counting for 20 pct. of overall tax revenues, whilst
excise duties accounts for 8 pct. Customs duties
are now a minor component of public revenues.
2.2 Guidelines for an efficient tax system
The tax system influences labour supply, con-
sumption, savings and investments. It is therefore
important for the tax system to be designed on
the basis of some fundamental principles ensur-
ing that resources are allocated as efficiently as
possible in the economy. This can be achieved by:
first make use of taxes that promote better re-
source utilisation (for example environmental
taxes);
thereafter employing neutral taxes that do not
influence the choices made by producers and
consumers (for example taxes on the economic
rent in the petroleum and energy sector); and
finally using distortionary taxes to achieve suffi-
cient revenue to finance public goods and ser-
vices and to realise redistribution objectives.
The economic costs resulting from distortion-
ary taxation should be kept as low as possible.
Since the 1992 tax reform, the tax system has
been based on the principles of broad tax bases,
low rates and symmetrical treatment of income
and expenses. This reduces the costs of taxation,
and is conducive to the equal treatment of taxpay-
ers. Broad tax bases, covering all types of income,
are a prerequisite for the equal taxation of per-
sons with equal income, and for ensuring that the
progressivity of tax rates will result in improved
distribution. The changes to the tax system result-
ing from the 1992 tax reform have, along with
changes in subsequent years, extended the tax
base, thus narrowing the gap between taxable
income and actual income. The principle of broad
tax bases was again supported with the 2006 tax
reform. This principle has also underpinned
changes made to the net wealth tax in recent
years.
Exemptions and special treatment in the tax
system to support specific groups, industries or
activities make the tax system less efficient and
more administratively complex and challenging.
Other taxes need to be increased in order to keep
tax revenues at the same level, and the economic
costs of taxation tend to increase more than pro-
porsionally with tax rate increases. If it is desira-
ble to support a specific activity or group in socie-
ty, measures on the expenditure side of the budg-
et are often less costly and more targeted.
In some cases, different tax objectives may
conflict. Consequently, various considerations
need to be balanced against each other when de-
signing the tax system. In general, no single tax
should target multiple objectives.
In Norway, public funding of extensive welfare
programs makes it necessary to raise substantial
tax revenues. However, some taxes are also in-
tended to serve other important purposes beyond
raising government revenues. This concerns in
particular income redistribution and health and
environmental considerations.
The tax system has a redistributive effect by
way of, inter alia, the average tax burden increas-
ing with income. Taxation of wage income will
tend to reduce labour supply, but the tax system
should, insofar as possible, promote good deci-
sions with regard to labour force participation,
education and career choices. Empirical research
indicates that the labour supply of low-income
groups is more sensitive to changes in economic
framework conditions than is the labour supply of
high-income groups.
People with the lowest incomes pay little or no
tax. Consequently, changes to the tax system are
of little significance to this group. Many people
with a persistent low income are not working.
The tax rules should as far as possible be de-
signed to make work profitable. Moreover, for
people who receive social security benefits to
compensate for (temporary) loss of wage income
as the result of health problems or unemploy-
ment, the interaction between benefits and tax
rules has a major impact on incentives to return
to work or to increase working hours. One of the
tax and welfare policy challenges is balancing
income protection considerations against work

3
The Norwegian tax system – main features and developments
incentive considerations. This is illustrated in
Box 2.1, showing that there may in some cases
be little financial gain from working rather than
claiming social security benefits.
Environmental taxes contribute to more ap-
propriate pricing of environmentally-harmful ac-
tivities and motivate individuals and enterprises to
more environmentally-friendly behaviour. Moreo-
ver, the use of environmental taxes is consistent
with the polluter pays principle. Revenues from
environmental taxes can be used to strengthen
welfare schemes and public services or to reduce
Box 2.1 Work incentives depend on both the tax system and the benefit system
Work incentives are influenced by both tax rates on labour and any net transfers received by indi-viduals. The Norwegian income protection system (primarily the National Insurance Scheme) compris-es a number of transfer schemes that serve to provide people who, for various reasons, do not work. Examples are disability pension («disability benefits» from 2015) and unemployment benefits. Such benefits are often discontinued, in full or in part, when a person starts working, and hence these serve as an additional «tax» on labour. The effective average tax on labour is often calculated to illustrate the implications of this in terms of work incentives. The effective tax rates reflect both tax and the net transfers foregone when one starts working. Such rates are useful, but they need to be interpreted with caution. In general, these calculations only reflect transfer levels. Other aspects of these schemes, such as the extent to which benefits are subject to time limits and activity requirements for recipients, will also influence work incentives.
Figure 2.2 presents some average effective tax rates on labour when a person moves from unem-ployment to full employment in the Nordic countries (2012 data). The respective calculations are for a single parent with two children and a couple with two children, where one parent stays at home. The figure shows that the effective tax rate on labour can be high. A single parent at 67 pct. of average earn-ings and with two children will in Norway in effect be taxed at about 89 pct. of gross wage income when the loss of unemployment benefit is taken into account.
Effective average tax rate when a person moves from social security benefits1 to full-time
employment
0
20
40
60
80
100
120
Sw
eden
Fin
lan
d
Den
ma
rk
Norw
ay
Icela
nd
0
20
40
60
80
100
120
Single parent2, two children
0
20
40
60
80
100
120
Sw
eden
Fin
lan
d
Denm
ark
Norw
ay
Icela
nd
0
20
40
60
80
100
120
One earner couple3, two children
Figure 2.2 Effective average tax rate when a person moves from unemployment benefits to full-time employment. 2012. Percent
1 The calculations are based on unemployment benefits in the various countries as calculated in OECD Tax and Benefit 2012. The benefit level is that paid in the first year of unemployment. 2 Based on 67 pct. of the average wage in the various countries, in calculating both the benefits and the amount of the
wage income from full employment. 3 Based on 100 pct. of the average wage in the various countries, in calculating both the benefits and the amount of the
wage income when moving into full employment. The spouse/cohabitant is assumed to stay at home in both cases. Sources: OECD and the Ministry of Finance.
4
The Norwegian tax system —main features and developments
other taxes.
Business taxation should principally focus on
raising government revenues, without impeding
sound commercial activity. Making the taxation of
all actual incomes as consistent and uniform as
possible makes resource allocation less suscepti-
ble to, for example, tax-motivated investments.
Taxed profits should correspond to actual profits.
This also entails a broad tax base, thus enabling
tax rates to be kept lower.
Business and capital taxation must also focus
on predictability. Instability may impair business
investment and reduce profits.
Industries exploiting natural resources may
generate extraordinary profits in the form of eco-
nomic rent. It is important to ensure that society
receives a large proportion of such extraordinary
profits. This is the rationale behind the special
taxation of profits from the petroleum industry
and hydropower plants. The petroleum tax sys-
tem and the State's Direct Financial Interest
(SDFI) channel a large proportion of the high in-
come from the continental shelf to the State, with-
out preventing economically profitable invest-
ments from being made. SDFI functions as a cash
flow tax on each field, but its income is not formal-
ly classified as tax revenues.
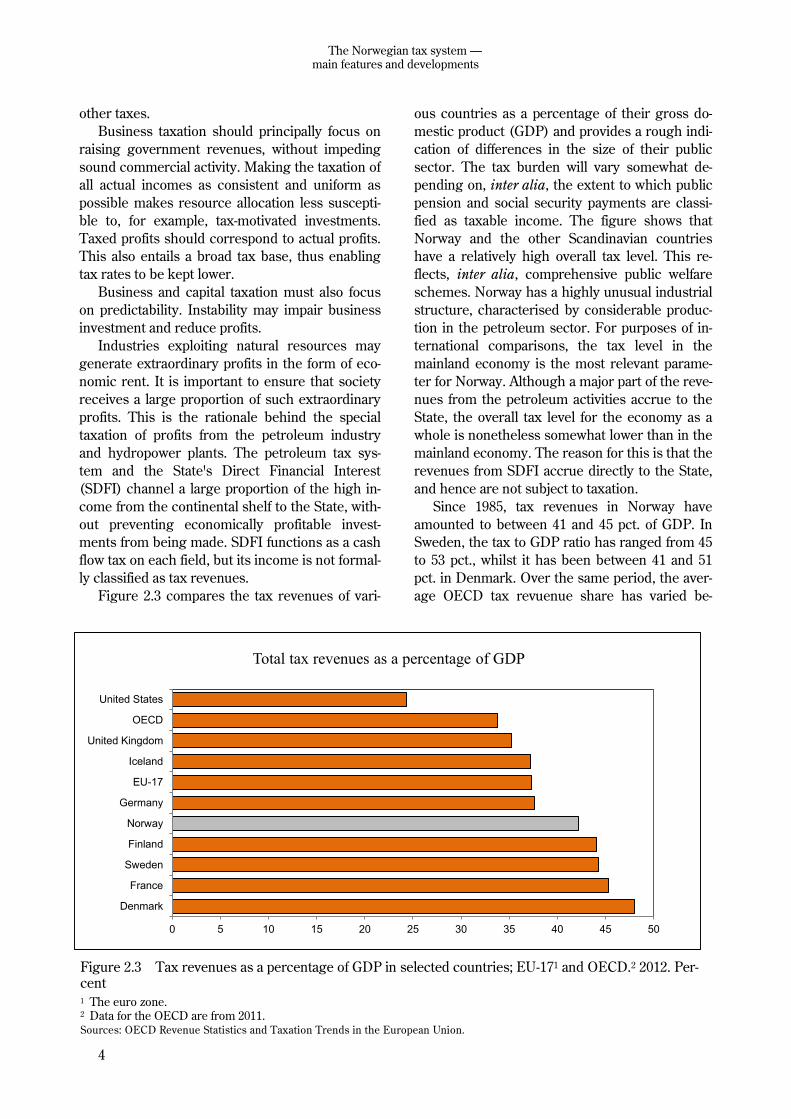
Figure 2.3 compares the tax revenues of vari-
ous countries as a percentage of their gross do-
mestic product (GDP) and provides a rough indi-
cation of differences in the size of their public
sector. The tax burden will vary somewhat de-
pending on, inter alia, the extent to which public
pension and social security payments are classi-
fied as taxable income. The figure shows that
Norway and the other Scandinavian countries
have a relatively high overall tax level. This re-
flects, inter alia, comprehensive public welfare
schemes. Norway has a highly unusual industrial
structure, characterised by considerable produc-
tion in the petroleum sector. For purposes of in-
ternational comparisons, the tax level in the
mainland economy is the most relevant parame-
ter for Norway. Although a major part of the reve-
nues from the petroleum activities accrue to the
State, the overall tax level for the economy as a
whole is nonetheless somewhat lower than in the
mainland economy. The reason for this is that the
revenues from SDFI accrue directly to the State,
and hence are not subject to taxation.
Since 1985, tax revenues in Norway have
amounted to between 41 and 45 pct. of GDP. In
Sweden, the tax to GDP ratio has ranged from 45
to 53 pct., whilst it has been between 41 and 51
pct. in Denmark. Over the same period, the aver-
age OECD tax revuenue share has varied be-
Total tax revenues as a percentage of GDP
0 5 10 15 20 25 30 35 40 45 50
Denmark
France
Sweden
Finland
Norway
Germany
EU-17
Iceland
United Kingdom
OECD
United States
Figure 2.3 Tax revenues as a percentage of GDP in selected countries; EU-171 and OECD.2 2012. Per-cent 1 The euro zone. 2 Data for the OECD are from 2011. Sources: OECD Revenue Statistics and Taxation Trends in the European Union.
5
The Norwegian tax system – main features and developments
tween 30 and 36 pct. of GDP.
The greater mobility of capital, goods and ser-
vices implies that the significance of different
taxation between countries may increase. Nor-
way needs good general tax rules to retain and
attract business activities and capital. However,
location decisions depend on more than tax. Po-
litical stability, good infrastructure, access to
highly qualified manpower, well-functioning fi-
nancial markets, property rights, as well as a sta-
ble and predictable regulatory framework, are
also important determinants of the overall frame-
work conditions for doing business.
2.3 Direct taxes 2.3.1 Income tax for individuals
Rate structure and tax base
The income tax for individuals is calculated on
two different bases. Firstly, a flat rate tax of 27
pct. is paid on «ordinary income» less the person-
al allowance and certain special allowances. Ordi-
nary income comprises all taxable income
(wages including taxable benefits in kind, pen-
sions, net income from self-employment, taxable
income from shares and other capital incomes),
less the basic allowance, deductible losses and
expenses such as debt interest, etc., parental al-
lowance and other allowances. Levying a flat tax
rate on a net tax base ensures that all deductions
are of equal tax value and makes the taxation of
capital symmetric, i.e. income (gains) and expens-
es (losses) are taxed at the same rate.
Secondly, employee’s social security contribu-
tions and any surtax are paid on so-called
«personal income», which comprises gross wage
income and pension income, without deductions
of any kind. Imputed personal income for self-
employed is also included in «personal income».
People with high personal incomes pay a larg-
er proportion of tax on their incomes than do peo-
ple with low personal incomes. Such progressivity
is achieved through minimum allowances and
surtax. It is estimated that about 950,000 people
will be paying surtax in 2014. Box 2.2 shows how
marginal and average tax rates increase with
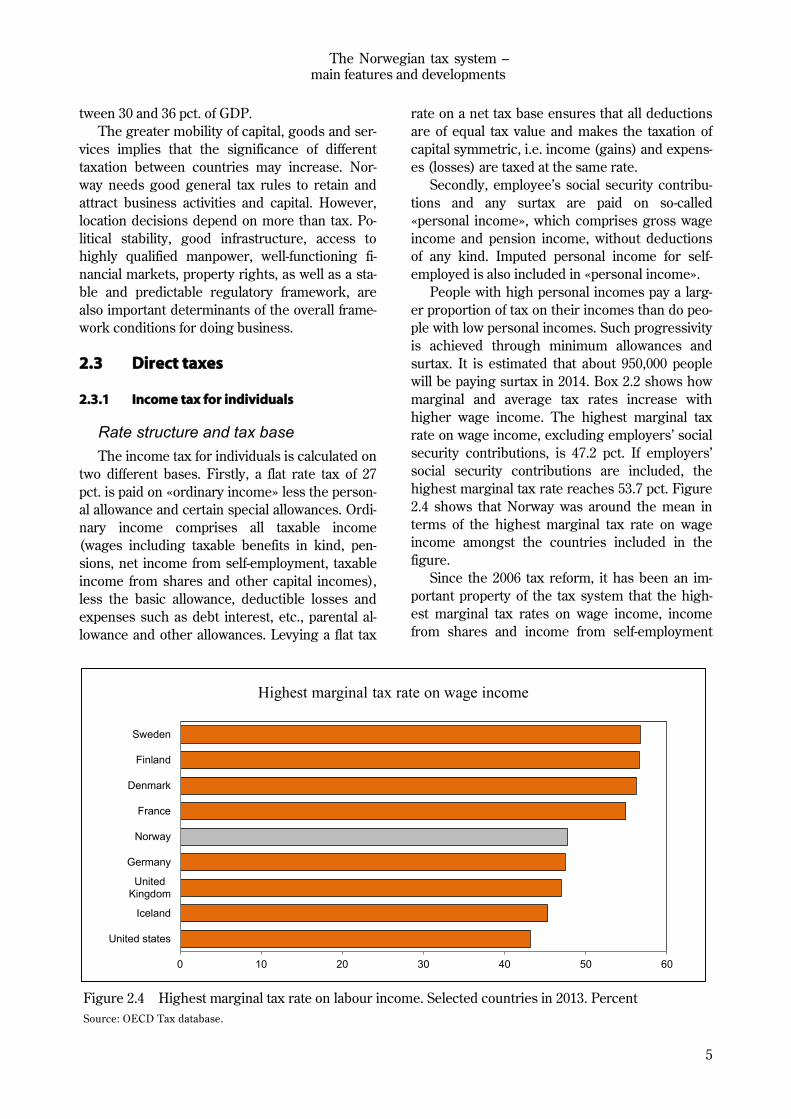
higher wage income. The highest marginal tax
rate on wage income, excluding employers’ social
security contributions, is 47.2 pct. If employers’
social security contributions are included, the
highest marginal tax rate reaches 53.7 pct. Figure
2.4 shows that Norway was around the mean in
terms of the highest marginal tax rate on wage
income amongst the countries included in the
figure.
Since the 2006 tax reform, it has been an im-
portant property of the tax system that the high-
est marginal tax rates on wage income, income
from shares and income from self-employment
Highest marginal tax rate on wage income
0 10 20 30 40 50 60
United states
Iceland
UnitedKingdom
Germany
Norway
France
Denmark
Finland
Sweden
Figure 2.4 Highest marginal tax rate on labour income. Selected countries in 2013. Percent
Source: OECD Tax database.
6
The Norwegian tax system —main features and developments
shall be about the same. When the difference in
marginal tax rates between ownership income
and wage income is small, there is little to gain
from presenting what is actually gained through
work as income from shares in order to reduce
tax. This type of income shifting was a considera-
ble problem before 2006.
Box 2.2 Calculation of tax on wage income
The marginal tax rate is the tax rate applicable to the last krone earned by a taxpayer. The marginal tax rate influences his or her choices with regard to how much to work. A high marginal tax rate may weaken employees’ incentives to work more. Such labour supply distortions imply that resources are allocated less efficiently. The higher the tax rates, the greater are these distortions.
Average tax is tax as a proportion of taxable income. Under a tax system characterised by basic al-lowances, as well as other allowances and a progressive rate structure, the marginal tax rate is always higher than the average tax rate for the same income level, and those with the highest incomes pay the largest proportion of their income in tax.
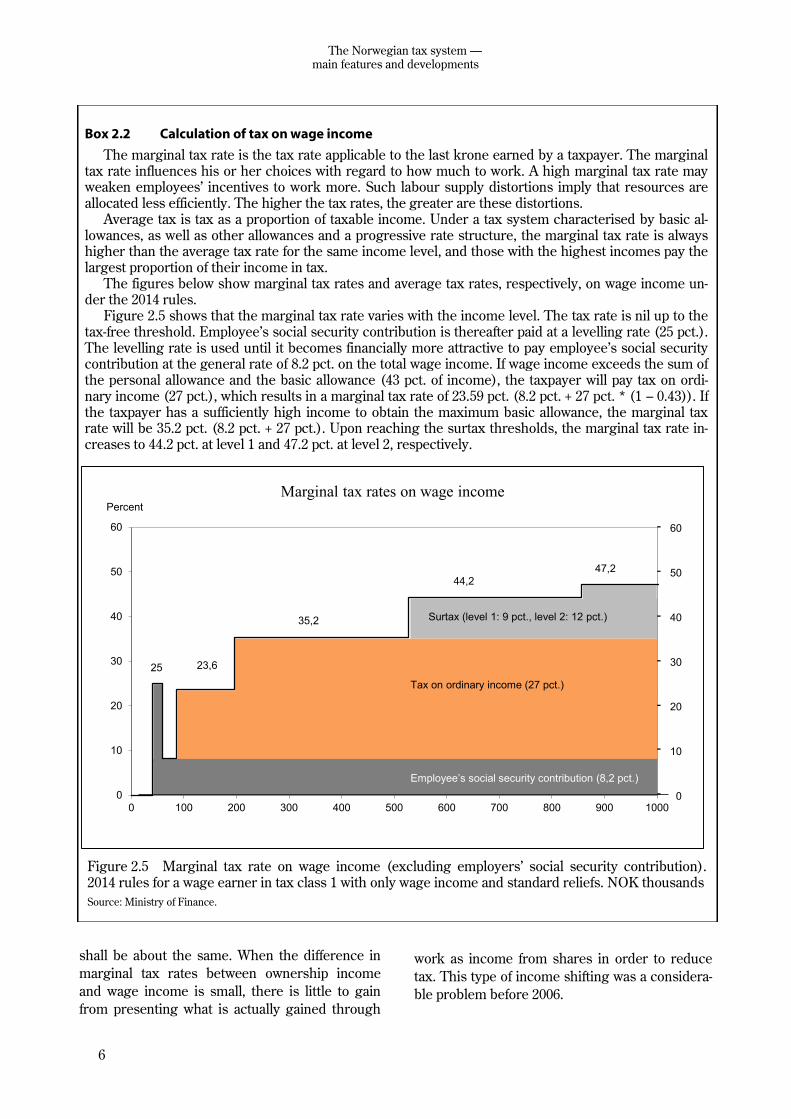
The figures below show marginal tax rates and average tax rates, respectively, on wage income un-der the 2014 rules.
Figure 2.5 shows that the marginal tax rate varies with the income level. The tax rate is nil up to the tax-free threshold. Employee’s social security contribution is thereafter paid at a levelling rate (25 pct.). The levelling rate is used until it becomes financially more attractive to pay employee’s social security contribution at the general rate of 8.2 pct. on the total wage income. If wage income exceeds the sum of the personal allowance and the basic allowance (43 pct. of income), the taxpayer will pay tax on ordi-nary income (27 pct.), which results in a marginal tax rate of 23.59 pct. (8.2 pct. + 27 pct. * (1 – 0.43)). If the taxpayer has a sufficiently high income to obtain the maximum basic allowance, the marginal tax rate will be 35.2 pct. (8.2 pct. + 27 pct.). Upon reaching the surtax thresholds, the marginal tax rate in-creases to 44.2 pct. at level 1 and 47.2 pct. at level 2, respectively.
Marginal tax rates on wage income
25
35,2
23,6
44,2
47,2
Percent
0
10
20
30
40
50
60
0
10
20
30
40
50
60
0 100 200 300 400 500 600 700 800 900 1000
Tax on ordinary income (27 pct.)
Surtax (level 1: 9 pct., level 2: 12 pct.)
Employee’s social security contribution (8,2 pct.)
Figure 2.5 Marginal tax rate on wage income (excluding employers’ social security contribution).
2014 rules for a wage earner in tax class 1 with only wage income and standard reliefs. NOK thousands
Source: Ministry of Finance.

7
The Norwegian tax system – main features and developments
Tax on pension income
Special tax rules mean that pensioners and
recipients of some social security benefits pay
less tax than wage earners. Social security contri-
butions on pensions are lower than on wages. On
the other hand, the basic allowance is somewhat
lower for pension income than for wage income.
A special non-refundable tax credit for pen-
sion income is granted to those on contractual
early retirement pension (AFP) and ordinary re-
tirement pension, which results in no tax being
paid on any pension income up to the minimum
state pension, and in less tax being paid on pen-
sion income than on wage income above that lev-
el. The tax credit is reduced with regard to pen-
sion income in excess of the minimum state pen-
sion, thus implying that the difference between
the tax on pension income and the tax on wage
income declines as the pension income increas-
es.
Disability pension recipients are in 2014 grant-
ed a special disability allowance against ordinary
income. Moreover, a tax limitation rule applies to
disability pension recipients who are more than
two thirds disabled and to recipients of certain
means-tested benefits. The rule implies that in-
come around the level of the minimum state pen-
sion is tax-exempt. Income in excess of that level,
including a net wealth supplement, is taxed at a
rate of 55 pct., thus implying that the preferential
tax treatment is scaled back until it becomes fi-
nancially more attractive to pay tax under the or-
dinary tax rules. The Storting has decided to in-
troduce a new disability benefit from 2015. The
new disability benefit will be taxed as wage in-
come, and hence the special disability allowance
and the tax limitation rule for the disability benefit
recipients will be abolished.
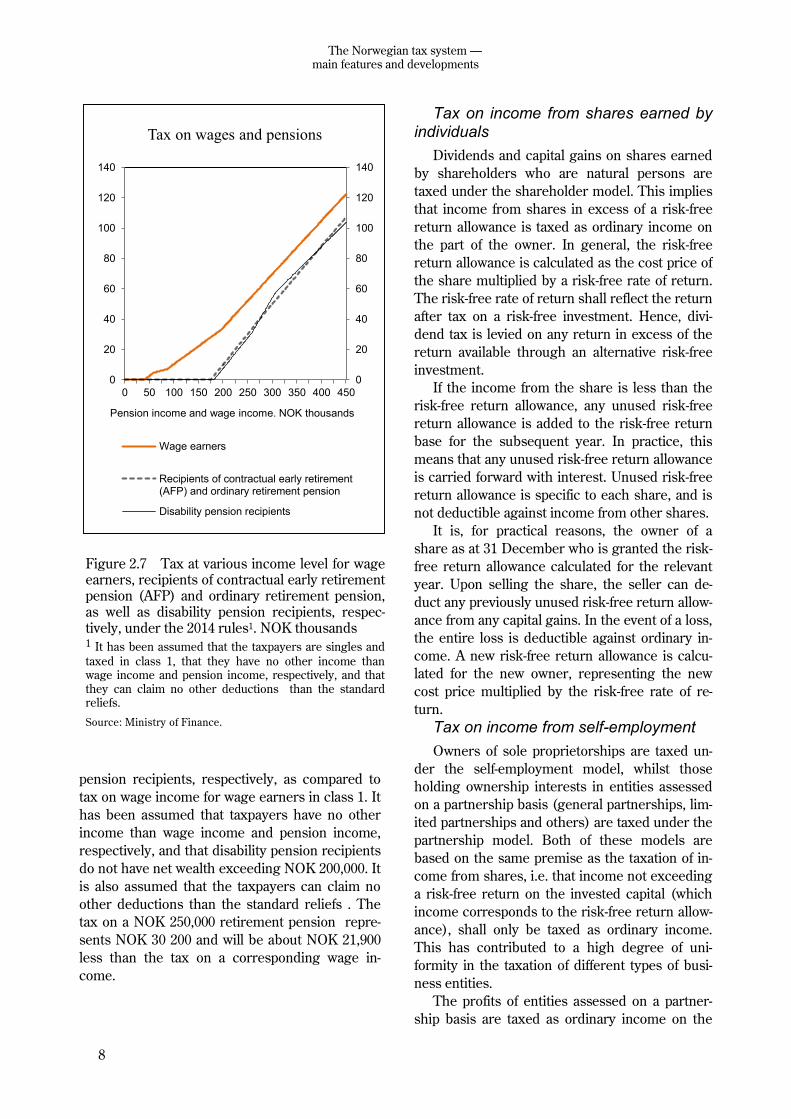
Figure 2.7 shows calculated tax on pension
income under the 2014 rules for single recipients
of contractual early retirement pension (AFP)/
ordinary retirement pension and single disability
Box 2.2 continues
Figure 2.6 shows that the average tax rate is considerably lower than the marginal tax rate.
Average tax rates on wage income
0
10
20
30
40
50
60
Employee’s social security contribution
Tax on ordinary income
Surtax
Surtax level 2
0
10
20
30
40
50
60
0 100 200 300 400 500 600 700 800 900 1000
Marginal tax rate
Percent
Wage income. NOK thousands
Figure 2.6 Average tax rate on wage income (excluding employers’ social security contribution). 2014 rules for a wage earner in tax class 1 with only wage income and standard reliefs. NOK thou-sands
Source: Ministry of Finance.
8
The Norwegian tax system —main features and developments
pension recipients, respectively, as compared to
tax on wage income for wage earners in class 1. It
has been assumed that taxpayers have no other
income than wage income and pension income,
respectively, and that disability pension recipients
do not have net wealth exceeding NOK 200,000. It
is also assumed that the taxpayers can claim no
other deductions than the standard reliefs . The
tax on a NOK 250,000 retirement pension repre-
sents NOK 30 200 and will be about NOK 21,900
less than the tax on a corresponding wage in-
come.
Tax on income from shares earned by individuals
Dividends and capital gains on shares earned
by shareholders who are natural persons are
taxed under the shareholder model. This implies
that income from shares in excess of a risk-free
return allowance is taxed as ordinary income on
the part of the owner. In general, the risk-free
return allowance is calculated as the cost price of
the share multiplied by a risk-free rate of return.
The risk-free rate of return shall reflect the return
after tax on a risk-free investment. Hence, divi-
dend tax is levied on any return in excess of the
return available through an alternative risk-free
investment.
If the income from the share is less than the
risk-free return allowance, any unused risk-free
return allowance is added to the risk-free return
base for the subsequent year. In practice, this
means that any unused risk-free return allowance
is carried forward with interest. Unused risk-free
return allowance is specific to each share, and is
not deductible against income from other shares.
It is, for practical reasons, the owner of a
share as at 31 December who is granted the risk-
free return allowance calculated for the relevant
year. Upon selling the share, the seller can de-
duct any previously unused risk-free return allow-
ance from any capital gains. In the event of a loss,
the entire loss is deductible against ordinary in-
come. A new risk-free return allowance is calcu-
lated for the new owner, representing the new
cost price multiplied by the risk-free rate of re-
turn.
Tax on income from self-employment
Owners of sole proprietorships are taxed un-
der the self-employment model, whilst those
holding ownership interests in entities assessed
on a partnership basis (general partnerships, lim-
ited partnerships and others) are taxed under the
partnership model. Both of these models are
based on the same premise as the taxation of in-
come from shares, i.e. that income not exceeding
a risk-free return on the invested capital (which
income corresponds to the risk-free return allow-
ance), shall only be taxed as ordinary income.
This has contributed to a high degree of uni-
formity in the taxation of different types of busi-
ness entities.
The profits of entities assessed on a partner-
ship basis are taxed as ordinary income on the
Tax on wages and pensions
0
20
40
60
80
100
120
140
0
20
40
60
80
100
120
140
0 50 100 150 200 250 300 350 400 450
Wage earners
Recipients of contractual early retirement(AFP) and ordinary retirement pension
Disability pension recipients
Pension income and wage income. NOK thousands
Figure 2.7 Tax at various income level for wage earners, recipients of contractual early retirement pension (AFP) and ordinary retirement pension, as well as disability pension recipients, respec-tively, under the 2014 rules1. NOK thousands 1 It has been assumed that the taxpayers are singles and
taxed in class 1, that they have no other income than wage income and pension income, respectively, and that
they can claim no other deductions than the standard reliefs.
Source: Ministry of Finance.

9
The Norwegian tax system – main features and developments
part of the owners as they accrue. In addition,
any distributed partnership profits in excess of
the risk-free return allowance are taxed anew as
ordinary income on the part of owners who are
natural persons.
Income from a sole proprietorship in excess
of the risk-free return allowance is taxed as im-
puted personal income and is subject to surtax
and employee’s social security contribution.
Hence, the imputed personal income is taxed
continously. Income from shares, on the other
hand, is not taxed as ordinary income until the
time of dividend payment or realisation. This dif-
ference has to do with sole proprietorships not
being separate legal entities. Consequently, the
distribution of funds will only represent a transfer
of funds within the owner’s own financial sphere.
The self-employed pay a higher social security
contribution than do wage earners on their in-
come from self-employment. On the other hand,
the self-employed do not pay employer’s social
security contributions on their personal income.
However, in some cases the self-employed re-
ceive lower social security benefits than wage
earners. Self-employed fishermen pay employee’s
social security contributions at a medium rate
(like wage earners), but are also subject to a prod-
uct tax.
2.3.2 Corporate taxation
Company profits are taxed as ordinary income
at a flat rate of 27 pct. Losses can be carried for-
ward and deducted from subsequent profits. The
corporate tax system puts a special emphasis on
the principles of equal treatment of different in-
vestments, forms of funding and types of legal
entities, as well as the symmetrical treatment of
income (gains) and expenses (losses). This im-
plies, inter alia, that taxable profits should, to the
extent possible, match actual company profits.
«Durable and significant» assets shall be capital-
ised under various asset groups and depreciated
at rates intended, in principle, to reflect the ex-
pected annual depreciation.
The exemption method implies, as a main rule,
that companies are exempted from the taxation of
dividends and gains on shares, etc. Mirroring
this, there is no right to deduct corresponding
losses. The purpose of the exemption method is
to prevent chain taxation in the corporate sector,
i.e. that dividends and gains on shares held by
companies are taxed several times.
Employers in both the private sector and the
public sector are required to pay employers’ so-
cial security contributions on wage costs. The rate
of employers’ social security contribution depends
on where the enterprise is located.
Figure 2.8 shows that the corporate tax rate in
Norway was significantly below the average statu-
tory corporate tax rate in both the OECD coun-
tries and the EU member states in 1995. While
the corporate tax rate remained at the same level
in Norway until 2014, other countries reduced
their rates. The average statutory corporate tax
rates in OECD and EU are hence now somewhat
lower than in Norway.
The effective taxation of companies will also
depend on the tax base. The effective average tax
rate is paid tax as a proportion of a company’s ac-
tual profits. This is lower than the statutory tax
rate if investments are tax relieved, for example
through generous depreciation rules. The effec-
tive average tax rate is the key variable when a
company decides which country to invest in for
tax reasons. The effective marginal tax rate is the
key variable when a company decides the level of
investment.
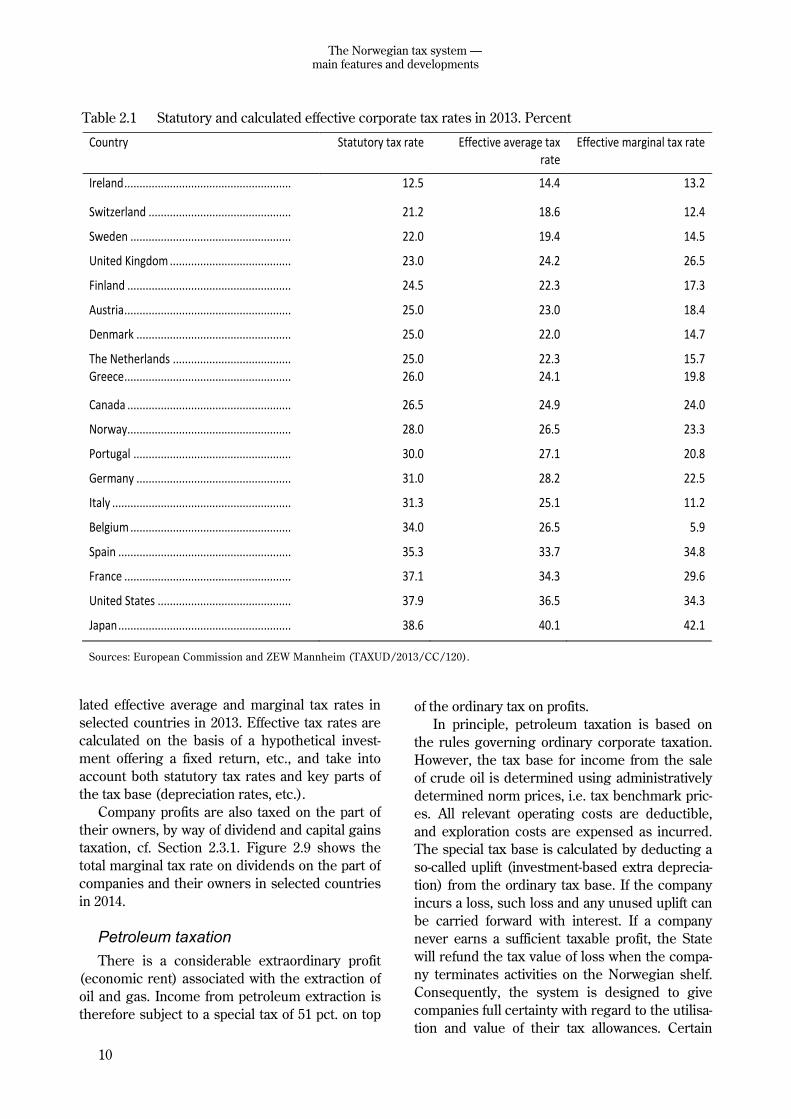
Table 2.1 shows statutory tax rates and calcu-
Statutory corporate tax rates
0
10
20
30
40
50
0
10
20
30
40
50
1995 1998 2001 2004 2007 2010
EU
OECD
Norway
2014
Figure 2.8 Statutory corporate tax rates in Norway, the EU and the OECD.1 1995 – 2014. Percent
1 Non-weighted average for the EU and the OECD. The
EU data encompass the countries that were members as of 1 July 2013 (EU-28).
Sources: OECD, Eurostat and the Ministry of Finance.
10
The Norwegian tax system —main features and developments
lated effective average and marginal tax rates in
selected countries in 2013. Effective tax rates are
calculated on the basis of a hypothetical invest-
ment offering a fixed return, etc., and take into
account both statutory tax rates and key parts of
the tax base (depreciation rates, etc.).
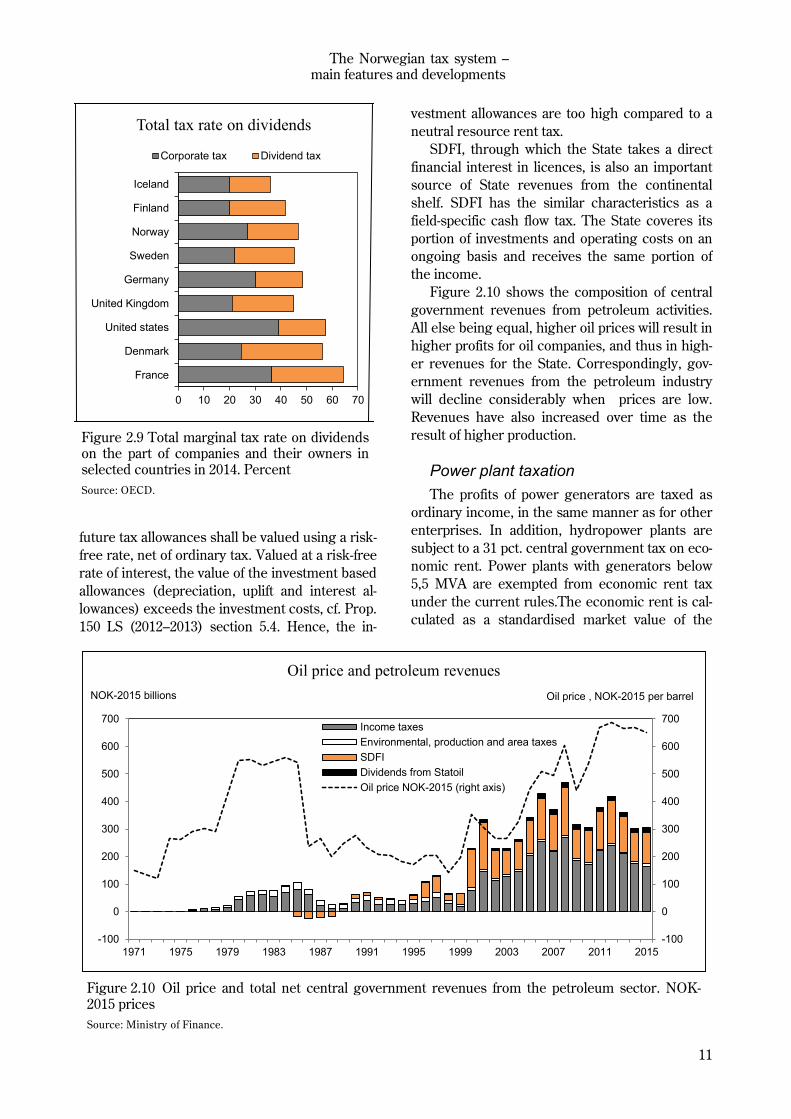
Company profits are also taxed on the part of
their owners, by way of dividend and capital gains
taxation, cf. Section 2.3.1. Figure 2.9 shows the
total marginal tax rate on dividends on the part of
companies and their owners in selected countries
in 2014.
Petroleum taxation
There is a considerable extraordinary profit
(economic rent) associated with the extraction of
oil and gas. Income from petroleum extraction is
therefore subject to a special tax of 51 pct. on top
of the ordinary tax on profits.
In principle, petroleum taxation is based on
the rules governing ordinary corporate taxation.
However, the tax base for income from the sale
of crude oil is determined using administratively
determined norm prices, i.e. tax benchmark pric-
es. All relevant operating costs are deductible,
and exploration costs are expensed as incurred.
The special tax base is calculated by deducting a
so-called uplift (investment-based extra deprecia-
tion) from the ordinary tax base. If the company
incurs a loss, such loss and any unused uplift can
be carried forward with interest. If a company
never earns a sufficient taxable profit, the State
will refund the tax value of loss when the compa-
ny terminates activities on the Norwegian shelf.
Consequently, the system is designed to give
companies full certainty with regard to the utilisa-
tion and value of their tax allowances. Certain
Table 2.1 Statutory and calculated effective corporate tax rates in 2013. Percent
Country Statutory tax rate Effective average tax rate
Effective marginal tax rate
Ireland ....................................................... 12.5 14.4 13.2
Switzerland ............................................... 21.2 18.6 12.4
Sweden ..................................................... 22.0 19.4 14.5
United Kingdom ........................................ 23.0 24.2 26.5
Finland ...................................................... 24.5 22.3 17.3
Austria ....................................................... 25.0 23.0 18.4
Denmark ................................................... 25.0 22.0 14.7
The Netherlands ....................................... 25.0 22.3 15.7 Greece ....................................................... 26.0 24.1 19.8
Canada ...................................................... 26.5 24.9 24.0
Norway...................................................... 28.0 26.5 23.3
Portugal .................................................... 30.0 27.1 20.8
Germany ................................................... 31.0 28.2 22.5
Italy ........................................................... 31.3 25.1 11.2
Belgium ..................................................... 34.0 26.5 5.9
Spain ......................................................... 35.3 33.7 34.8
France ....................................................... 37.1 34.3 29.6
United States ............................................ 37.9 36.5 34.3
Japan ......................................................... 38.6 40.1 42.1
Sources: European Commission and ZEW Mannheim (TAXUD/2013/CC/120).
11
The Norwegian tax system – main features and developments
future tax allowances shall be valued using a risk-
free rate, net of ordinary tax. Valued at a risk-free
rate of interest, the value of the investment based
allowances (depreciation, uplift and interest al-
lowances) exceeds the investment costs, cf. Prop.
150 LS (2012–2013) section 5.4. Hence, the in-
vestment allowances are too high compared to a
neutral resource rent tax.
SDFI, through which the State takes a direct
financial interest in licences, is also an important
source of State revenues from the continental
shelf. SDFI has the similar characteristics as a
field-specific cash flow tax. The State coveres its
portion of investments and operating costs on an
ongoing basis and receives the same portion of
the income.
Figure 2.10 shows the composition of central
government revenues from petroleum activities.
All else being equal, higher oil prices will result in
higher profits for oil companies, and thus in high-
er revenues for the State. Correspondingly, gov-
ernment revenues from the petroleum industry
will decline considerably when prices are low.
Revenues have also increased over time as the
result of higher production.
Power plant taxation
The profits of power generators are taxed as
ordinary income, in the same manner as for other
enterprises. In addition, hydropower plants are
subject to a 31 pct. central government tax on eco-
nomic rent. Power plants with generators below
5,5 MVA are exempted from economic rent tax
under the current rules.The economic rent is cal-
culated as a standardised market value of the
Total tax rate on dividends
0 10 20 30 40 50 60 70
France
Denmark
United states
United Kingdom
Germany
Sweden
Norway
Finland
Iceland
Corporate tax Dividend tax
Figure 2.9 Total marginal tax rate on dividends on the part of companies and their owners in selected countries in 2014. Percent
Source: OECD.
-100
0
100
200
300
400
500
600
700
-100
0
100
200
300
400
500
600
700
1971 1975 1979 1983 1987 1991 1995 1999 2003 2007 2011 2015
Income taxes
Environmental, production and area taxes
SDFI
Dividends from Statoil
Oil price NOK-2015 (right axis)
Oil price and petroleum revenues
NOK-2015 billions Oil price , NOK-2015 per barrel
Figure 2.10 Oil price and total net central government revenues from the petroleum sector. NOK-2015 prices
Source: Ministry of Finance.

12
The Norwegian tax system —main features and developments
power generated (actual power generated multi-
plied by spot market prices), less operating ex-
penses, licence fees, recurrent tax on immovable
property, depreciation and uplift. The uplift is cal-
culated as the risk-free return on the written-down
value of the operating assets. The investment al-
lowances under the economic rent tax are fully
secured. Negative economic rent income in one
power plant can be coordinated with positive eco-
nomic rent income in other power plants within
the same consolidated tax group. Moreover, any
negative economic rent income following coordi-
nation between power plants is paid out. Conse-
quently, the risk-free rate is sufficient to shield
the opportunity return and ensure that the eco-
nomic rent tax does not make profitable projects
unprofitable after tax.
Power generators are also subject to a natural
resource tax (paid to local and regional govern-
ment) of 1.3 øre per kWh. Natural resource tax is
deductible against the company’s assessed cen-
tral Government tax. In addition, power genera-
tors pay a licence fee and (normally) a recurrent
tax on immovable propertyto the municipalities
hosting them, and also have to yield power to
such municipalities under special licence condi-
tions.
Taxation of shipping companies Since the 2007 tax year, companies taxed as
shipping companies have been exempted from
tax on shipping income, and only pay a tonnage
tax. The tonnage tax is an annual tax calculated
on the basis of the net tonnage of ships, the rate
of which varies between different tonnage inter-
vals. The rate may be reduced for ships, etc., that
meet environmental requirements stipulated by
the Norwegian Maritime Authority.
2.3.3 Taxation of assets
Net wealth tax
Individuals pay net wealth tax at a rate of 1
pct. on their taxable net wealth, i.e. gross wealth
less debt, in excess of a basic allowance of NOK 1
million in 2014. Spouses are granted one basic
allowance each. The net wealth tax supplements
income taxation and gives the tax system as a
whole a more progressive effect on individuals.
This is illustrated by Figure 2.11.
As a general rule, the taxable value of assets
is equal to their market value. Homes and other
immovable properties are valued well below mar-
ket value. On average, commercial property oth-
er than power plants, agricultural property and
forestry property is valued at about 60 pct. of mar-
ket value in 2014 for wealth tax purposes. The
taxable value of a primary residence (the home in
which one lives) averages 25 pct. of market value,
whilst it is 60 pct. for second dwellings (homes
other than the primary residence, which are not
commercial property or holiday homes). A safety
valve is intended to ensure that no primary resi-
dence or holiday home has a taxable value in ex-
0
10
20
30
40
50
60
0
10
20
30
40
50
60
1 2 3 4 5 6 7 8 9 10
Net wealth tax
Income tax
0
10
20
30
40
50
60
0
10
20
30
40
50
60
0 - 300 300 -500
500 -750
750 -1000
1000 -3000
3000og over
Net wealth tax
Income tax
Tax in proportion to gross income. 2012
A. For the 1 pct. with the highest net wealth.
Individuals are divided into ten groups of equal
size, based on increasing net wealth. Percent
B. All taxpayers grouped into intervals, based on
gross income. Percent
Deciles
NOK thousands
Figure 2.11 Tax as a proportion of gross income in 2012. Percent
Sources: Statistics Norway and the Ministry of Finance.

13
The Norwegian tax system – main features and developments
cess of 30 pct. of the market value documented
by the taxpayer. The safety valve for commercial
property and second dwellings is 72 pct.
The proportion of people paying net wealth
tax has been reduced in recent years due to in-
creases in the minimum allowance, but the aver-
age amount of tax on the part of those who pay
net wealth tax has increased. It is estimated that
about 14 pct. of taxpayers will pay net wealth tax
in 2015 (2014 rules extrapolated into 2015), cf.
Figure 2.12.
Recurrent tax on immovable property
The introduction of a recurrent tax on immov-
able property is left at the discretion of each mu-
nicipality. All property tax revenues accrue to the
relevant municipality. The property tax rate, if
any, shall be between 0.02 and 0.07 pct. of the
valuation basis, to be determined by valuation
every tenth year. In the valuation of homes, mu-
nicipalities may from the 2014 property tax year
choose to use the net wealth tax bases. Munici-
palities may choose to apply a discount in their
valuation of properties. They may also apply a
minimum allowance to reduce the valuation basis
of homes, including holiday homes. Recurrent
property tax on power plants is governed by spe-
cial valuation rules based on production value,
subject to minimum and maximum limits.
As per 2014, 341 of 428 municipalities had in-
troduced some form of recurrent tax on immova-
ble property, of which 211 levied the tax on
homes in all or part of the municipality. Total tax
revenues were about NOK 8.9 billion in 2013.
Tax on property internationally
Box 2.3 provides an overview of property tax
revenues in the OECD countries.
2.4 Indirect taxes 2.4.1 Value added tax
Value added tax is a general tax on the domes-
tic consumption of goods and services, intended
to raise revenues for central government. Value
added tax is collected and paid by the businesses
that sell goods and services subject to value add-
ed tax. Value added tax is charged at all levels in
the chain of distribution. Businesses collecting
and paying value added tax qualify for tax deduc-
tion of tax on their inputs and have to collectvalue
added tax on their own sales. The tax decution on
inputs prevents the tax from being charged on
taxable businesses throughout the chain of distri-
0
5 000
10 000
15 000
20 000
25 000
0
10
20
30
40
50
1997 1998 1999 2000 2001 2002 2003 2004 2005 2006 2007 2008 2009 2010 2011 2012 2013 2014
Proportion who pays net wealth tax
Average net wealth tax (right axis)
Proportion who pays net wealth tax and average net wealth taxPercent NOK
Figure 2.12 Proportion of people (resides in Norway and 17 years or older) paying net wealth tax1 and average net wealth tax. 1997–2014. Estimates for 2013 and 2014 1
Net wealth tax before possible reductions following the socalled 80-porcentage rule (only relevant in the periode
1997-2008).
Source: Statistics Norway.

14
The Norwegian tax system —main features and developments
bution, thus making VAT a tax on the final con-
sumption of goods and services. When the tax is
charged on final consumption only, it does not
result in production distortions. A general value
added tax encompassing all goods and services at
a uniform rate will not affect the composition of
consumption. Such a value added tax would be
simple to collect and entail relatively low adminis-
trative costs on the part of businesses.
The standard rate of value added tax in Nor-
way is 25 pct. Denmark and Sweden also apply a
standard rate of 25 pct. The rates in the Scandina-
vian countries are high by way of international
comparison. Only Hungary (27 pct.) and Iceland
(25.5 pct.) apply higher standard rates. In Nor-
way, value added tax revenues as a proportion of
GDP are higher than the OECD average, but
somewhat lower than in Denmark and Sweden.
Although the current value added tax is, as a
main rule, a general tax on consumption, it is sub-
ject to various exemptions and reduced rates. In
Norway, foodstuffs are subject to a reduced rate
of 15 pct., whilst a number of services are subject
to a reduced rate of 8 pct. Certain goods are ex-
empted by way of so-called zero-rating, which
implies full deductibility of value added tax on
goods and service inputs, whilst no value added
tax is charged on sales. A number of services fall
outside the scope of the value added tax system,
including, inter alia, financial services, health
services and teaching. Businesses outside the
value added tax system are granted no deduc-
tions in respect of any value added tax on goods
and services procured by them.
The introduction of reduced rates and exemp-
tions means that one moves away from a simple,
general system with a uniform rate on all con-
sumption of goods and services. Value added tax
will thereby influence the composition of con-
sumption and production, as well as the choice
between internal production and external deliver-
ies in sectors exempted from value added tax. In
addition, the administrative costs are higher. The
value added tax system is not well suited for at-
tending to distributional considerations, for sup-
porting specific causes or for moving consump-
Box 2.3 Revenues from taxes on property in the OECD countries
The OECD tax statistics provide an over-view of revenues generated by different types of taxes. Taxes on property include taxes per-taining to the use, ownership and transfer of real estate. Capital gains taxation is not includ-ed. In the case of Norway, municipal recurrent property tax, net wealth tax, inheritance tax and stamp duty will all be included.
For some countries, there may be a differ-ence between the gross and net tax on proper-ty. This applies to, for example, the US, where many taxpayers can deduct any local property tax paid from their income tax base. The OECD figures are based on non-weighted aver-ages of gross taxes.
Figure 2.13 shows revenues from taxes on property in selected OECD countries. Norway derives 2.9 pct. of its tax revenues from proper-ty, which is well below the OECD average. As mentioned, this estimate includes aggregate
revenues from net wealth tax and inheritance tax, etc., and thus also includes tax on assets such as shares, etc.
Revenues from tax on immovable property probably account for less than 2 pct. of overall tax revenues. In addition, Norway stands out internationally in granting unlimited deductibil-ity of debt interest.
0 3 6 9 12 15
Germany
Sweden
Finland
Norway
Denmark
OECD
Iceland
France
United Kingdom
United states
Property taxes
Figure 2.13 Property taxes. Percentage of total tax revenues. 2011
Source: OECD Revenue Statistics.

15
The Norwegian tax system – main features and developments
tion in a desired direction. If, for example, one
intended to reduce the consumption of goods
that are harmful to individuals and to society, it
will be more effective to use excise duties.
2.4.2 Excise duties
Excise duties are intended to fund govern-
ment expenditure, but are also used as instru-
ments for the pricing of the social costs of using
products that are environmentally harmful or haz-
ardous to health.
Excise duties on specific products will, in con-
trast to general taxes on consumption, shift con-
sumption away from taxed products. Hence, ex-
cise duties are suitable policy instruments for re-
Box 2.4 Value added tax rates and bases in OECD countries
Value added tax has been introduced in more than 160 countries worldwide. On average, value add-ed tax revenues account for one fifth of the overall tax revenues of the OECD countries.
OECD has compared the value added tax systems of its member countries, and the ability of such systems to raise revenues. This was done by comparing the actual value added tax revenues for a coun-try with what such revenues would have been if all consumption, both private and public, had been sub-ject to the standard rate applied in that country. If all consumption is taxed at the standard rate of value added tax, the value added tax revenues as a proportion of consumption will also be equal to the value added tax rate. A number of factors may cause the revenue proportion to be lower than such standard rate. This may partly be the result of how the system is designed , with the revenue proportion being lowered by the use of reduced rates and exemptions. The revenue proportion may also be influenced by other factors like the effectiveness of tax collection and compliance, including the extent of tax plan-ning, evasion and fraud. Although such an indicator needs to be interpreted with caution, and a loss of value added tax revenues may be caused by a number of factors, it may serve to illustrate how effective-ly the value added tax system works. Besides, the abolition of reduced rates and exemptions would mean that the same level of government revenues could be raised at a lower tax rate.
Figure 2.14 presents the standard value added tax rates for Norway, the OECD average and a selec-tion of other countries. The figure also presents value added tax revenues as a proportion of consump-tion. The standard rate of value added tax is as high in Norway as in Denmark and Sweden, but value added tax revenues as a proportion of consumption is nonetheless somewhat lower. New Zealand has a very broad value added tax base with one uniform rate and few exemptions. Consequently, virtually all consumption is taxed at the standard rate, including public sector consumption.
0
5
10
15
20
25
30
0
5
10
15
20
25
30
Denmark Sweden Norway France Germany OECD New Zealand
Standard VAT rate
VAT revenues as a percentage of total consumption
Standard VAT rates and VAT revenues as a percentage of total consumption
Figure 2.14 Standard value added tax rates and value added tax revenues as a percentage of total con-sumption. 2012
Sources: OECD (2012) Consumption Tax Trends and the Ministry of Finance.
16
The Norwegian tax system —main features and developments
ducing the social costs associated with the use of
products that are environmentally harmful or haz-
ardous to health. Some excise duties are solely
intended to raise central government revenues.
Examples of such taxes are the stamp duty on
sales of immovable properties and the re-
registration tax on motor vehicles and trailers.
Other exercise duties are also intended to influ-
ence consumption or behaviour. This applies, first
and foremost, to the environmental taxes and to
the taxes on alcohol and tobacco.
The purpose of a tax has a bearing on its de-
sign. In order to limit the social costs of taxation,
fiscally motivated taxes should not be levied on
manufactured intermediate goods. Environmen-
tal taxes intended to put a price tag on an envi-
ronmental problem should, on the other hand,
encompass all sources of such environmental
problem, and the tax rate should reflect the envi-
ronmental damage.
Environmental taxes
Norway’s first environmentally motivated tax
was the tax on the sulphur contents of mineral
oil, which was introduced in 1970. The use of en-
vironmental taxes did not become more wide-
spread until the late 1980s/early 1990s. Environ-
mental taxes have subsequently been introduced
in a number of areas.
Environmental taxes make market prices re-
flect the social costs of environmentally harmful
activities to a greater extent. This helps reducing
such environmentally harmful activities. The rev-
enues from environmental taxes can be used to
reduce other distortionary taxes.
The use of environmental taxes is consistent
with the polluter pays principle. This principle
implies that those using environmental goods
should also pay the costs their environmentally
harmful activities impose on society.
The cost of reducing emissions from environ-
mentally harmful activities may vary between
different sectors of the economy, and the authori-
Box 2.5 Relationship between taxes and emission allowances
Environmental taxes put a price tag on the costs imposed on society by environmentally harmful activity. This makes it financially attractive for those involved to take steps to reduce emissions, by scaling back production, by changing production methods or by introducing abatement measures that cost less than the tax. By imposing a tax, the authorities put a price tag on polluting emissions, but do not directly control emission volumes. Under a cap-and-trade system, on the other hand, the authorities put a cap on emission volumes, whilst emission prices are determined in the market. The cost of the implemented abatement measures will nonetheless be determined by the emission allow-ances price established in the emission allowance market, and will depend on the supply of, and de-mand for, emission allowances.
An environmental tax and a cap-and-trade system will deliver the same emission reductions when the emission allowance price equals the tax. If the emission allowances are auctioned, such allowanc-es can generate the same government revenues as the tax. This is because the residual emissions will correspond to the total volume of emission allowances. Hence, market participants will be willing to pay an emission allowance price equal to the tax. If the emission allowances are allotted free of charge, the authorities will forfeit these revenues and thus forgo the opportunity to reap further eco-nomic gains by reducing other taxes.
1
1
0 1 2 3 4 5
Denmark
The Netherlands
Finland
Sweden
EU 15
Iceland
Norway
Germany
France
OECD
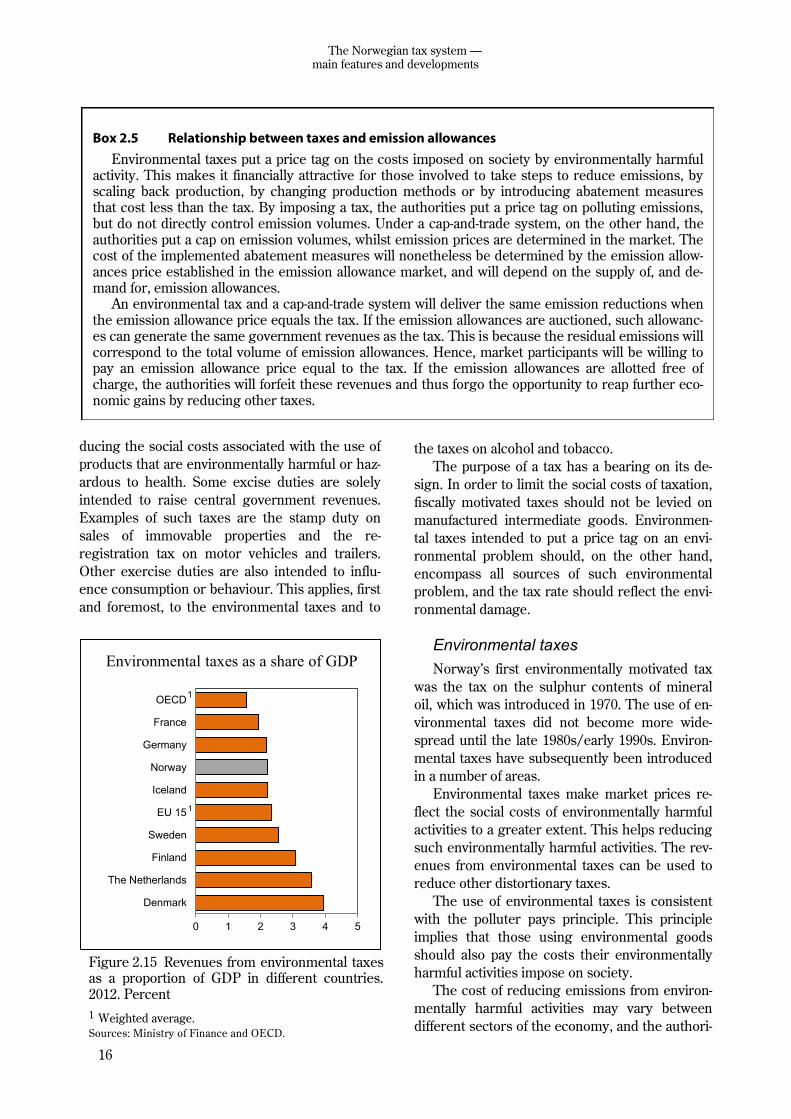
Environmental taxes as a share of GDP
Figure 2.15 Revenues from environmental taxes as a proportion of GDP in different countries. 2012. Percent
1 Weighted average. Sources: Ministry of Finance and OECD.

17
The Norwegian tax system – main features and developments
ties do not have complete information as to the
magnitude of such costs for different enterprises
and households.
A correctly designed environmental tax will,
for example, include all emission sources at one
uniform rate. This facilitates decentralised deci-
sion-making that delivers environmental gains at
the lowest possible social cost. Emission allow-
ances are another cross-sectoral policy instru-
ment that can have effects similar to those of en-
vironmental taxes. Emission allowances and tax-
es are discussed in further detail in Box 2.5.
When environmental taxes work as intended,
they contribute to a reduction in environmentally
harmful activity. This will reduce government
revenues. This may explain some of the decline
in revenues from environmental taxes in recent
years. If environmental taxes are replaced by
emission allowances that are not sold (free emis-
sion allowances), such revenues will decline fur-
ther. Reduced revenues from environmental tax-
es may imply that other taxes need to be in-
creased in order for tax revenues to be kept sta-
ble. Figure 2.15 compares environmental tax rev-
enues in selected countries.
There may be various reasons why environ-
mental taxes or cap-and-trade systems are not
designed in a cost-effective manner. The reason
is often a desire to protect particular groups or
industries. Figure 2.16 shows the marginal cost of
greenhouse gas emissions in various sectors in
Norway. Having diverging prices for greenhouse
gas emissions increases the overall cost of reduc-
ing national emissions.
Environmental taxes on energy products are
often additional to taxes that put a price on other
social costs of such energy use. The environmen-
tal effect will reflect the aggregate level of taxes.
The road usage tax on fuel also serves to curtail
the consumption of petrol and diesel, and hence
to reduce emissions of, inter alia, CO2. The base
tax on mineral oil serves to prevent an environ-
mentally undesirable transition from electrical
heating to the use of heating oil.
There are, in addition to environmental taxes
and energy taxes, other taxes that are fiscally mo-
tivated, whilst also serving environmental objec-
tives. This applies to, for example, the motor vehi-
cle registration tax, which is differentiated on the
basis of, inter alia, CO2 and NOX emissions. Tax-
es on fuels and motor vehicles account for a large
portion of the environmental taxes.
Taxes reflecting health considerations and social considerations
The consumption of goods other than environ-
mental goods may also impose costs on society
Marginal costs of greenhouse gas emissions in 2014
0
50
100
150
200
250
300
350
400
450
500
0
50
100
150
200
250
300
350
400
450
500
0 5 10 15 20 25 30 35 40 45 50
Fishing and catching
Manufacturing industry
included in the EU ETS
HFC, mineral oil
and gasDomestic aviation included in
the EU ETS
Petrol
Oil and gas extraction
Agriculture etc.
Million tonnes of CO2 equivalent emissions
NOK
Auto diesel
NOK
Figure 2.16 Price of greenhouse gas emissions in various sectors. Tax level in NOK per tonne of CO2 equivalents in 2014 and an emission allowance price of NOK 50 per tonne of CO2. Emission data for 2011 Sources: Statistics Norway, the Norwegian Environment Agency and the Ministry of Finance.

18
The Norwegian tax system —main features and developments
that are not reflected in their market prices. This
is exemplified by the consumption of alcoholic
beverages and tobacco products. The taxes on
alcoholic beverages and tobacco products raise
revenues for central government, but also mean
that the prices of these products include, to a
greater extent, the costs imposed on society when
consuming them. These costs relate to the health
expenses imposed on the public sector, as well as
the negative external effects of smoking and alco-
hol consumption on others than those who con-
sume these products.
In addition, there are costs associated with
consumers themselves failing to pay sufficient
attention to the long-term effects of their con-
sumption, or ignoring undesirable effects. A high
level of tax on consumer goods may increase the
volume of cross-border shopping, smuggling and
illicit distillation of alcohol. The health effects of
taxation must be weighed against the social costs
of such activities.
2.4.3 Customs duties
Customs duties serve to protect domestic pro-
ducers against international competition. Import
duties normally result in more expensive goods
for consumers and higher production costs for
businesses. Besides, customs duties reduce trade
volumes and prevent countries from fully utilising
their comparative advantages in the production of
goods and services. Trade in goods and services
has enabled Norway to draw on its competitive
advantages. Norway is currently one of the coun-
tries in the world with the lowest customs barri-
ers for manufactured goods. Certain clothes and
textiles are the only manufactured goods subject
to customs duties.
Customs protection of agricultural goods is an
important part of Norwegian agricultural policy.
Import protection contributes to, inter alia, ensur-
ing that Norwegian agricultural goods are sold at
prices stipulated in the Agricultural Agreement.
Customs protection is an important aspect of the
overall support given to Norwegian agriculture.
The customs duty rates for agricultural goods are
highly variable, depending on the need for protec-
tion.
Maximum customs duty rates are laid down in
international agreements. Norway has committed
to reducing customs duty rates through several
rounds of GATT/WTO2 negotiations, most re-
cently under the WTO 1994 Agreement. Apart
from a certain reduction in customs duties on
manufactured goods, the WTO Agreement en-
tailed commitments with regard to market ac-
cess, domestic subsidies and export subsidies for
agricultural goods. Like other industrialised
countries, Norway grants preferential customs
treatment to developing countries under the GSP
(Generalized System of Preferences) scheme.
The scheme involves individual industrialised
countries granting developing countries im-
proved market access for their goods. GSP is a
unilateral scheme, and can in principle be re-
voked or amended.
2.5 Fees and sectoral taxes In 2006, the Ministry of Finance laid down
general guidelines on central government fees
and sectoral taxes. Fees shall cover, in full or in
part, the cost of services addressed to a specific
user, whilst sectoral taxes are normally levied to
fund services provided by government for a spe-
cific industry or group. The guidelines entered
into effect immediately with regard to the intro-
duction of any new fees and sectoral taxes. Exist-
ing schemes were required to comply gradually
over time. Changes to the bases and rates of
overpriced central government fees and all
changes to sectoral taxes are considered part of
the tax programme.
Follow-up of the guidelines has thus far been
much focused on eliminating overpricing, but
various funding arrangements have also been
straightened out. A number of arrangements that
were previously labelled fees or reimbursements
are now highlighted as sectoral taxes in the fiscal
budget. New guidelines on cost calculation for
chargeable local government services will enter
into effect in 2015. The Government proposes a
reduction in certain overpriced fees in 2015, and
will initiate a review of public sector funding via
fees and sectoral taxes, with a view to revising
the guidelines, cf. the discussion in Chapter 9 of
the white paper on taxes and customs duties
2015.
2 WTO (World Trade Organization) was established in 1995, replacing the former General Agreement on Tariffs and
Trade (GATT) from 1947.

19
The Norwegian tax system – main features and developments
Box 2.6 Consumption opportunities and equivalent income
A person’s consumption opportunities are determined by, inter alia, such person’s income after tax, net wealth, access to government-provided goods and services, as well as home production. Ideal-ly, analyses of resource distribution across a population should be based on overall consumption op-portunities. In most cases, distribution analyses are nonetheless based on income, because of meas-urement difficulties.
Using taxable gross income as the income concept and the basis for classification into income groups does not fully convey how tax changes are reflected in altered consumption opportunities and welfare. A person’s consumption opportunities are influenced by the household to which he or she belongs. People who live together can share fixed costs, for example on housing, cars and electricity (economies of scale), and people with no income of their own can nevertheless have consumption op-portunities if they belong to a household in which others have an income.
To take account of economies of scale and different family composistions, each member of the household is allotted an income based on the aggregate income of the household. Such income is higher than the household’s actual income per person. This allotted income is often termed «equivalent income». This term is intended to represent the income a household member would have needed as a single person in order to have the same consumption opportunities that he or she has as part of the larger household. A person may, for example, have a low equivalent income because her own gross income is low, or because she supports financially other household members without in-come.
There are different methods or «scales» to adjust income in this manner. Norway often uses the EU scale, the OECD scale and the square-root scale. The square-root scale implies that each house-hold member is allotted an income equal to the total household income divided by the square root of the number of persons in the household. This implies, for example, that a four-person household only needs twice the gross income of a single-person household to have the same consumption opportuni-ties. The EU and OECD scales use slightly different weights, thus implying that the economies of scale adjustments differ somewhat. However, all scales are based on the same underlying principle.
The examples in Table 2.2 show the calculation of equivalent income for a four-person household and a two-person household using the square-root scale.
Table 2.2 Examples of calculated equivalent income for a four-person household and a two-person household, respectively, using the square-root scale
Example 1: Couple with two children Example 2: Childless couple
Income (NOK) Income (NOK)
Adult with income 450,000 Adult with income 450,000
Adult with income 350,000 Adult with income 350,000
Child 0
Child 0
Total 800,000 Total 800,000
Equivalent income per person
(800,000/√4)
400,000
Equivalent income per person
(800,000/√2)
565,685
Source: Ministry of Finance.
20
The Norwegian tax system —main features and developments
2.6 Distribution effects of the tax system
2.6.1 Distribution in Norway
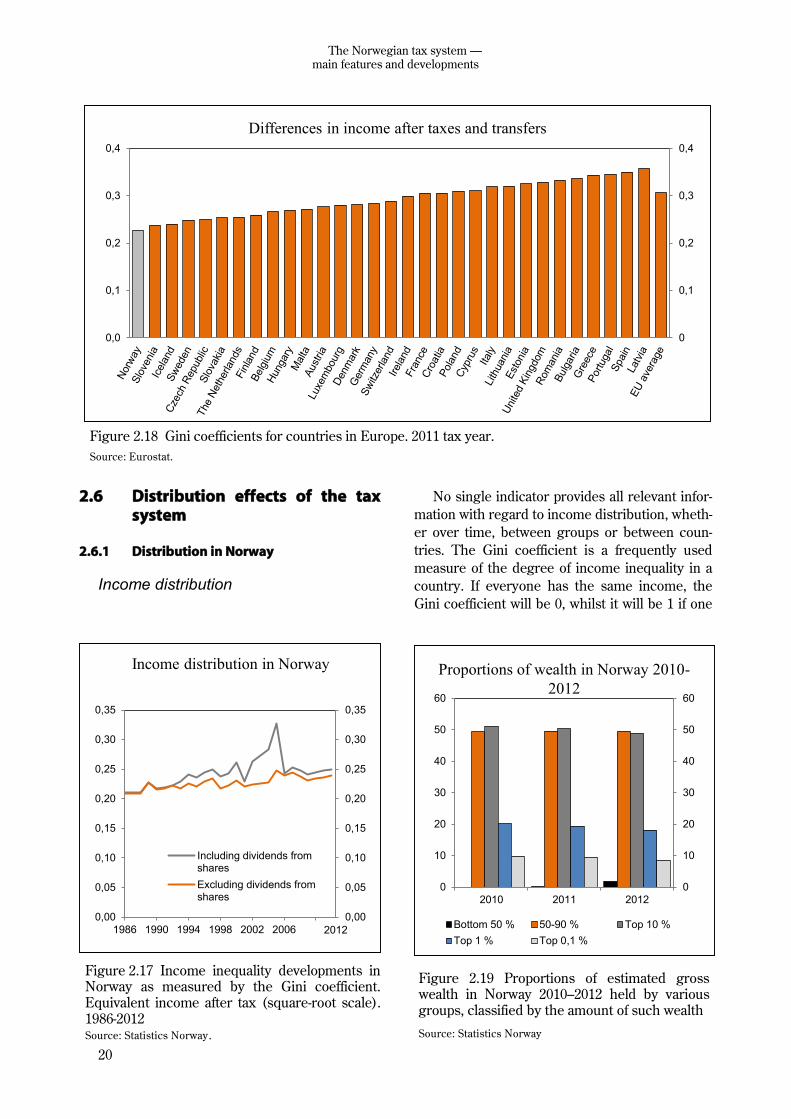
Income distribution
No single indicator provides all relevant infor-
mation with regard to income distribution, wheth-
er over time, between groups or between coun-
tries. The Gini coefficient is a frequently used
measure of the degree of income inequality in a
country. If everyone has the same income, the
Gini coefficient will be 0, whilst it will be 1 if one
0
0,1
0,2
0,3
0,4
0,0
0,1
0,2
0,3
0,4
Differences in income after taxes and transfers
Figure 2.18 Gini coefficients for countries in Europe. 2011 tax year.
Source: Eurostat.
0,00
0,05
0,10
0,15
0,20
0,25
0,30
0,35
0,00
0,05
0,10
0,15
0,20
0,25
0,30
0,35
1986 1990 1994 1998 2002 2006
Including dividends fromshares
Excluding dividends fromshares
Income distribution in Norway
2012
Figure 2.17 Income inequality developments in Norway as measured by the Gini coefficient. Equivalent income after tax (square-root scale). 1986-2012 Source: Statistics Norway.
Proportions of wealth in Norway 2010-
2012
0
10
20
30
40
50
60
0
10
20
30
40
50
60
2010 2011 2012
Bottom 50 % 50-90 % Top 10 %
Top 1 % Top 0,1 %
Figure 2.19 Proportions of estimated gross wealth in Norway 2010–2012 held by various groups, classified by the amount of such wealth
Source: Statistics Norway
21
The Norwegian tax system – main features and developments
person or household gets all the income in socie-
ty. The income concept used includes all house-
hold income after taxes and transfers. The in-
come is adjusted to facilitate comparison of the
income and consumption opportunities of people
belonging to households of different family com-
positions . The method for adjusting income to so
-called equivalent income is described in Box 2.6.
Income inequality in Norway has been fairly
stable over the last 25 years, as measured by de-
velopments in the Gini coefficient, cf. Figure 2.17.
This is particularly striking when looking at in-
come exclusive of dividends from shares. A weak
trend towards increasing inequality appears to
have come to a halt or been reversed since 2005.
The relatively large fluctuations in the Gini coeffi-
cient based on total registered income have to do
with capital income becoming more visible in the
statistics after the 1992 tax reform. The major
change around 2005 has to do with taxpayers
receiving large extraordinary dividends prior to
the introduction of dividend tax in 2006.
Figure 2.18 shows income distribution as
measured by the Gini coefficient in most Europe-
an countries in 2011. According to these calcula-
tions from Eurostat, Norway was the country
with the most equal income distribution in Eu-
rope in 2011. Greece, Spain, Portugal, Latvia and
Bulgaria are amongst the countries with the larg-
est income differences.
Wealth distribution
Wealth is much more unequally distributed
across the population than income. This is com-
monly the case in other countries as well. Figure
2.19 shows the proportion of wealth held by vari-
ous groups, classified by the amount of such
wealth. The 10 pct. with the highest wealth held
about 50 pct. of all net wealth in Norway over the
period 2010–2012. The one percent with the high-
est wealth held about 18 pct., whilst the richest
0.1 pct. of households (about 2,200 households)
held 8 pct. of all wealth in 2012. The distribution
of wealth has become somewhat more equal in
recent years, and is more equal in Norway than in
countries like France, the United Kingdom and
the United States.
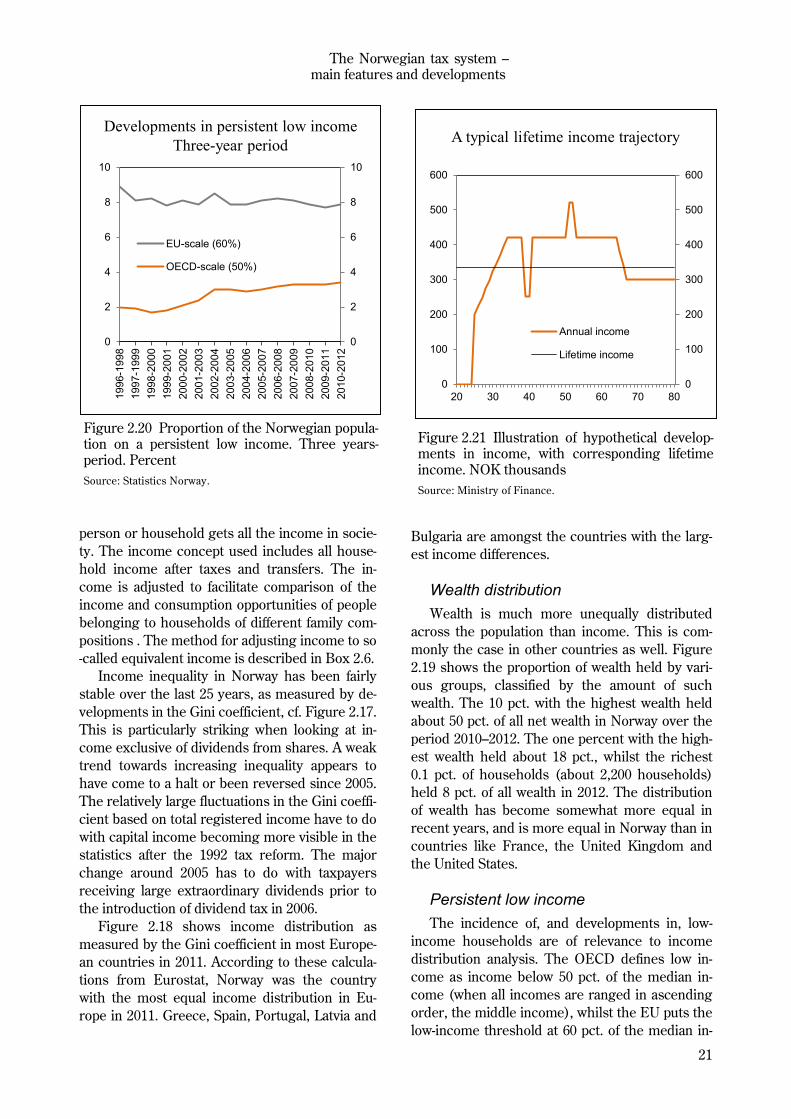
Persistent low income
The incidence of, and developments in, low-
income households are of relevance to income
distribution analysis. The OECD defines low in-
come as income below 50 pct. of the median in-
come (when all incomes are ranged in ascending
order, the middle income), whilst the EU puts the
low-income threshold at 60 pct. of the median in-
0
2
4
6
8
10
0
2
4
6
8
10
1996-1
998
1997-1
999
1998-2
000
1999-2
001
2000-2
002
2001-2
003
2002-2
004
2003-2
005
2004-2
006
2005-2
007
2006-2
008
2007-2
009
2008-2
010
2009-2
011
2010-2
012
EU-scale (60%)
OECD-scale (50%)
Developments in persistent low income
Three-year period
Figure 2.20 Proportion of the Norwegian popula-tion on a persistent low income. Three years-period. Percent
Source: Statistics Norway.
0
100
200
300
400
500
600
0
100
200
300
400
500
600
20 30 40 50 60 70 80
Annual income
Lifetime income
A typical lifetime income trajectory
Figure 2.21 Illustration of hypothetical develop-ments in income, with corresponding lifetime income. NOK thousands
Source: Ministry of Finance.

22
The Norwegian tax system —main features and developments
come. There are also certain other differences
between the EU and the OECD measures, cf. Box
2.6. The incidence of low annual incomes is low in
Norway and the other Scandinavian countries,
when compared to other countries.
The indicator persistent low income, here de-
fined as low average income over a three-year pe-
riod, is used to prevent the data from being overly
influenced by people who have low incomes for
only a short period of time. Figure 2.20 shows that
the measures for persistent low income used by
the EU and the OECD, respectively, suggest both
different levels and different developments over
time when applied to Norwegian data. Under the
EU definition, the proportion on a persistent low
income has remained fairly stable, at around 8
pct., since the late 1990s, whilst it has increased
from 2 pct. to just over 3 pct. under the OECD
definition.
The composition of the persistent low income
group has changed over time. This reflects chang-
ing family patterns, with more sole providers and
single-person households. Increases in the mini-
mum state pension mean that fewer elderly peo-
ple are on low incomes, whilst high immigration
has added to the number of low-income house-
holds. Immigrants and Norwegian-born children
of immigrants are overrepresented in the persis-
tent low income group. Families with children
constituted the single largest group of people
with a persistent low income over the three-year
period from 2010 to 2012.
Distribution across the lifecycle
Analyses covering a three-year period may
exaggerate the actual incidence of low incomes
and income inequality. Income will be more
equally distributed over time. The bottom of the
income distribution scale, in particular, will in-
clude many people who do not actually belong to
low-income groups, but nonetheless fall in this
group when looking at short time periods. In-
come will vary quite significantly over the lifecy-
cle for the vast majority of people, cf. the illustra-
tion in Figure 2.21. Hence, distribution analysis
based on lifetime income can be a useful supple-
ment to traditional one-year analysis.
The Ministry of Finance has developed, in
cooperation with Statistics Norway, a model
for analysing income distribution throughout
the lifecycle. The model generates fictive
lifecycle developments in income, wealth,
etc., for about 7,500 persons based on Norwe-
gian data for about 386,000 persons. This ena-
bles distribution analysis to be based on life-
time income.
Calculations show that the Gini coefficient
declines from 0.294, based on annual income, to
0
0,1
0,2
0,3
0,4
0,5
0,6
0,7
0,0
0,1
0,2
0,3
0,4
0,5
0,6
0,7
Market income
Disposable income after taxes and transfers
Gini coefficients in OECD countries
Figure 2.22 Gini coefficients for market income and disposable income after taxes and transfers. 2012 or most recent available year Source: OECD.

23
The Norwegian tax system – main features and developments
0.154, based on lifetime income. This is a decline
of about 48 pct. The decline is brought about by
examining the average of all annual incomes over
a lifecycle, thus smoothing out individual years of
very high or very low income. These differences
are even larger for the low-income measures.
Only 0.1 pct. of the population has a lifecycle in-
come of less than 50 pct. of the median income,
whilst about 10 pct. of the population has an an-
nual income of less than 50 pct. of the median
income.
2.6.2 Distributional implications of the tax
system
Income distributional implications of the taxation of individuals
High labour force participation, low unem-
ployment and a releatively important element of
centralized wage determination are some of the
reasons why Norway has small income differ-
ences, even before taking into account the redis-
tribution taking place through taxes and trans-
fers, cf. Figure 2.22.
Redistribution via taxes and transfer schemes
is significant in Norway, cf. Figure 2.23. Major
government transfer schemes provide protection
against the loss of income due to illness, disabil-
ity, old age and unemployment. These schemes
reduce the Gini coefficient by about 30 pct. in
Norway. Government transfers and taxes as a
whole reduce the Gini coefficient by more than 40
pct. in Norway. Hence, the key redistribution con-
tribution of the tax system is via its funding of
welfare benefits and income protection schemes.
The tax system contributes, at the same time,
to a redistribution of the financial burden. Figure
2.24 shows average assessed tax as a proportion
of gross income for different income groups. The
progressivity of the tax system is clearly illustrat-
ed by the fact that average tax as a percentage of
income increases with the income level. In 2000
and 2005, those with the very highest incomes
paid a lower percentage of their income in tax
than did other high- and medium-income groups.
This has been changed, especially after the intro-
duction of the dividend tax under the 2006 tax
reform. Besides, the average percentage of in-
come paid in tax has been reduced somewhat for
the 10% of the population with the lowest incomes.
An extensive government-funded education
system and a comprehensive student loan and
grant scheme contribute as well to reduce income
differences and the importance of parents’ income
for the income level of their children.
0,0
0,1
0,2
0,3
0,4
0,5
0,0
0,1
0,2
0,3
0,4
0,5
2000 2002 2004 2006 2008 2010 2012
Income before taxes and transfers
Income after transfers
Income after taxes and transfers
The impact of tax and transfer schemes
Figure 2.23 The impact of tax and transfer schemes on income distribution, as measured by the Gini coefficient. 2000-2012
Source: Statistics Norway.
0,0
0,1
0,2
0,3
0,4
0,5
0,0
0,1
0,2
0,3
0,4
0,5
1st
decile
2nd d
ecile
3rd
decile
4th
de
cile
5th
de
cile
6th
decile
7th
de
cile
8th
de
cile
9th
de
cile
10th
de
cile
To
p 5
pct.
To
p 1
pct.
To
p 0
.1 c
st.
2000
2005
2012
Average assessed tax as a proportion of
gross income
Figure 2.24 Average assessed tax as a propor-
tion of gross income
Source: Statistics Norway.
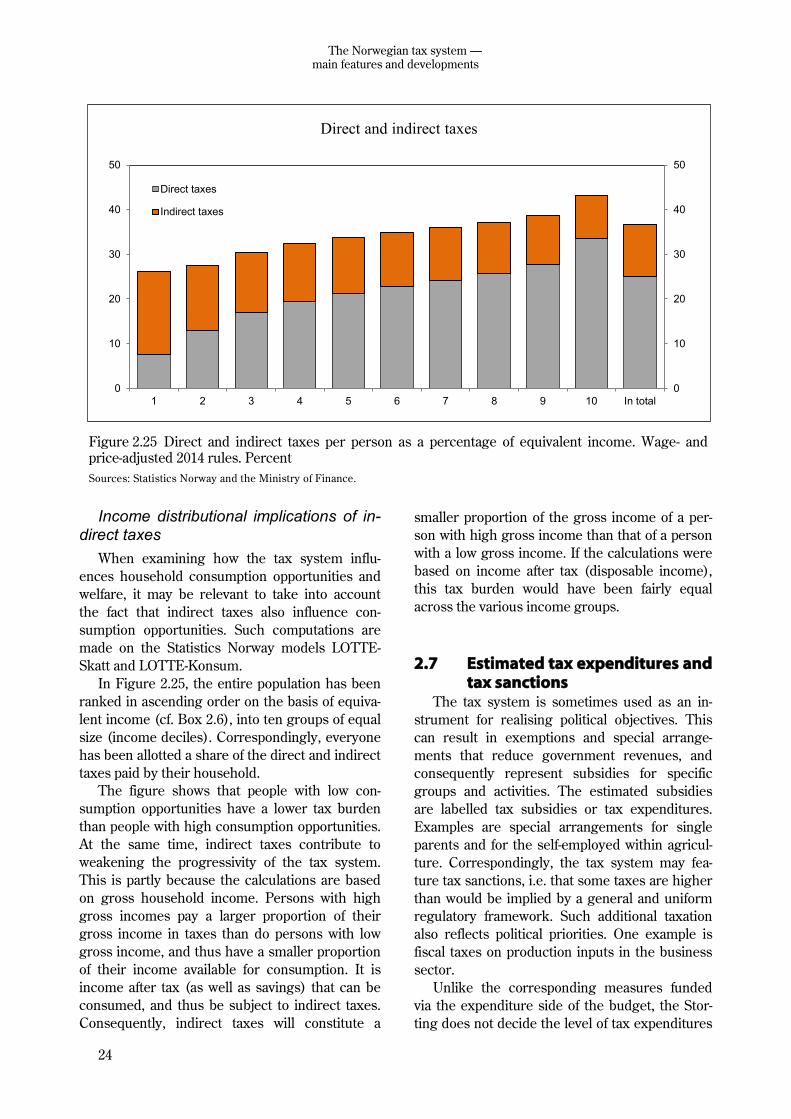
24
The Norwegian tax system —main features and developments
Income distributional implications of in-direct taxes
When examining how the tax system influ-
ences household consumption opportunities and
welfare, it may be relevant to take into account
the fact that indirect taxes also influence con-
sumption opportunities. Such computations are
made on the Statistics Norway models LOTTE-
Skatt and LOTTE-Konsum.
In Figure 2.25, the entire population has been
ranked in ascending order on the basis of equiva-
lent income (cf. Box 2.6), into ten groups of equal
size (income deciles). Correspondingly, everyone
has been allotted a share of the direct and indirect
taxes paid by their household.
The figure shows that people with low con-
sumption opportunities have a lower tax burden
than people with high consumption opportunities.
At the same time, indirect taxes contribute to
weakening the progressivity of the tax system.
This is partly because the calculations are based
on gross household income. Persons with high
gross incomes pay a larger proportion of their
gross income in taxes than do persons with low
gross income, and thus have a smaller proportion
of their income available for consumption. It is
income after tax (as well as savings) that can be
consumed, and thus be subject to indirect taxes.
Consequently, indirect taxes will constitute a
smaller proportion of the gross income of a per-
son with high gross income than that of a person
with a low gross income. If the calculations were
based on income after tax (disposable income),
this tax burden would have been fairly equal
across the various income groups.
2.7 Estimated tax expenditures and
tax sanctions The tax system is sometimes used as an in-
strument for realising political objectives. This
can result in exemptions and special arrange-
ments that reduce government revenues, and
consequently represent subsidies for specific
groups and activities. The estimated subsidies
are labelled tax subsidies or tax expenditures.
Examples are special arrangements for single
parents and for the self-employed within agricul-
ture. Correspondingly, the tax system may fea-
ture tax sanctions, i.e. that some taxes are higher
than would be implied by a general and uniform
regulatory framework. Such additional taxation
also reflects political priorities. One example is
fiscal taxes on production inputs in the business
sector.
Unlike the corresponding measures funded
via the expenditure side of the budget, the Stor-
ting does not decide the level of tax expenditures
Direct and indirect taxes
0
10
20
30
40
50
0
10
20
30
40
50
1 2 3 4 5 6 7 8 9 10 In total
Direct taxes
Indirect taxes
Figure 2.25 Direct and indirect taxes per person as a percentage of equivalent income. Wage- and price-adjusted 2014 rules. Percent
Sources: Statistics Norway and the Ministry of Finance.

25
The Norwegian tax system – main features and developments
and sanctions in the annual budgets. This chap-
ter is therefore intended to provide supplemen-
tary information concerning the various policy
measures and tools incorporated into the current
tax provisions. The overview does not purport to
be complete. Appendix 1 of the white paper on
taxes and customs duties 2015 provides a de-
tailed overview of the tax expenditures and tax
sanctions as calculated by the Ministry, as well as
a more detailed analysis of tax expenditures.
The magnitude of tax expenditures and tax
sanctions depends on how the benchmark sys-
tem is defined. As a main rule, the general tax
provisions are applied. In some areas one applies
the main principles underpinning the design of
the tax system, as established by, inter alia, the
1992 and 2006 tax reforms. Examples include
depreciation rates, the taxation of housing and
certain indirect taxes. As in most other countries,
the Ministry uses the revenue-foregone method,
i.e. the tax expenditures are estimated as the tax
revenues foregone by government as the result
of more lenient provisions than would be implied
by the benchmark system. The calculations do
not take behavioural changes into account. Conse-
quently, the calculations will in many cases not
represent a realistic estimate of the actual reve-
nue losses caused by tax expenditures.
Figure 2.26 shows the distribution of net tax
expenditures in 2014 across different sources of
taxation. The figure illustrates that the taxation of
homes, including holiday homes, is the largest tax
expenditure. This represents about 33 pct. of
overall tax expenditures3. Tax expenditures relat-
ing to financial capital and pension savings ac-
count for about 6 pct. of the total. Exemptions un-
der the value added tax system represent 24 pct.,
whilst the regionally differentiated employers’
social security contributions and tax expenditures
relating to wage income and pension income ac-
count for 9 and 8 pct., respectively.
2.8 Revenue estimation methods Changes to the tax rules will normally have an
impact on government tax revenues. These reve-
nue effects need to be distinguished from tax rev-
Wage and pension income
8 %
Employers’ social security
contributions9 %
Corporations, incl. petroleum
17 %
Self-employed persons
1 %
Financial capital and pension savings
6 %
Value added tax24 %
Homes including holiday homes
33 %
Excise duties3 %
Composition of net tax expenditures
Figure 2.26 Net tax expenditures in 2014 by source of tax. Percent
Source: Ministry of Finance.
3 Stamp duty on the sale of freehold apartments is deducted from tax expenditure relating to homes.

26
The Norwegian tax system —main features and developments
enue changes caused by other developments, in-
cluding business cycle fluctuations. A sound basis
for decision-making needs to include information
on the revenue effects of proposed changes to the
tax rules.
The Ministry of Finance estimates the revenue
effects of tax changes by a number of different
methods. The methods vary from sophisticated
models to simple estimates based exclusively on
statistics. Which method is used depends on
which models have been developed, which data
are available and the deadline by which the esti-
mates have to be prepared.
The Ministry of Finance publishes an annual
report describing the calculation methods used to
estimate the revenue effects of changes to the tax
rules4. The calculation methods are summarised
briefly below.
2.8.1 Benchmark system and tax revenue
benchmark
Benchmark system for tax rules
The revenue effects of changes to tax rules in a
fiscal year are estimated by reference to a bench-
mark system for tax rules. The benchmark sys-
tem is characterised by taxes being kept un-
changed in real terms from the year prior to the
relevant fiscal year. This means that nominal
thresholds and rates5 under the tax rules are ad-
justed annually in line with estimates for the rele-
vant growth factor, for example growth in retail
prices, wages, pensions or asset values.
The benchmark system for direct taxes is
based on the tax rules applicable in the current
year, with allowances and income thresholds un-
der the general rate structure for personal taxa-
tion being, as a main rule, adjusted in line with
estimated wage growth. A taxpayer who only
qualifies for standard reliefs and whose ordinary
income and personal income increase in line with
estimated wage growth, will thus pay approxi-
mately the same average income tax under the
benchmark system as in the current year. Corre-
spondingly, the wealth tax threshold in the bench-
mark system is adjusted such as to make a person
with an average net wealth composition pay the
same net wealth tax under the benchmark sys-
tem as in the current year, measured as a propor-
tion of net wealth. Special allowances and some
other personal taxation thresholds are adjusted in
line with estimated inflation.
Under the benchmark system for excise duties,
all quantitative rates are adjusted in line with esti-
mated inflation (changes in the retail price in-
dex). Hence, the tax burden under this bench-
mark system remains unchanged in real terms.
The benchmark system for value added tax is
based on the current value added tax regulations.
Tax revenue benchmark
The tax revenues that would be generated if
all taxes remained unchanged in real terms may
be labelled the tax revenue benchmark. The tax
revenue benchmark is determined by the bench-
mark system for the tax rules and by estimated
tax base developments. Tax base projections are
based on, inter alia, estimated macroeconomic
developments.
2.8.2 Revenue calculations not incorporating
behavioural effects
The most basic form of revenue calculation
assumes that the tax change does not influence
the behaviour of households or businesses. In
such case, the revenue effect will only reflect the
direct effect on the tax revenues. The revenue
effect of a tax rate change will, for example, be
calculated as the tax base multiplied by such tax
rate change.
Revenue calculations that include only direct
effects will in many cases provide a good approxi-
mation of the revenue effects in the fiscal year in
which the tax rule is changed. Such is the case
where there is little reason to assume that the
change to the tax rules will occasion major be-
havioural changes in the short run, and where
the change will have only a minor impact on oth-
er tax bases.
2.8.3 Revenue calculations incorporating
behavioural effects
Changes to taxes and certain government ex-
4 The report is available on the following webpage: http://www.regjeringen.no/nb/dep/fin/tema/skatter_og_avgifter/
metoder-for-provenyberegninger.html?id=717071 5
Percentage rates, such as for example the value added tax rate and the employee’s social security contribution rates,
remain unchanged from the previous year under the benchmark system.

27
The Norwegian tax system – main features and developments
penditure items may influence government fi-
nances beyond the immediate, direct budgetary
effect. This is because such changes may influ-
ence the behaviour of businesses and house-
holds. An increase in an excise duty will, for ex-
ample, normally result in an increase in the price
of the relevant goods, and thus a reduction in
demand for that good.
It is reasonable to assume that it will take time
for changes to the taxation of wage income and
pension income to induce behavioural changes
with a permanent impact on labour supply. Many
people have fixed working hours and are there-
fore unable to change these without finding a
new job or renegotiating their existing employ-
ment agreements. In most cases it will, for such
reasons, be of most relevance to incorporate the
revenue effects in the budget without behaviour-
al changes.
However, in some cases it may be relevant to
include behavioural effects already in the first
year. In general, financial adaptations occur quite
swiftly, whilst adaptations in the real economy
take more time. Dividends were, for example,
more than halved from 2000 to 2001 as a result of
the temporary dividend tax in 2001. Changes to
indirect taxes may also have a fairly rapid impact
on consumption. As a main rule, the Ministry
therefore incorporates behavioural effects in the
budget estimates for indirect taxes. In some cas-
es it may also be appropriate to assume fairly
swift adaptations to certain changes in the in-
come tax for individuals. One example is the re-
structuring of pensioner taxation in 2011, which
the Ministry assumed would have some impact
on labour supply in the first year.
In some cases the adaptations may happen
before the tax change has entered into effect.
One example is the dividend tax introduced as
part of the 2006 tax reform. Many shareholders
who were natural persons adapted their behav-
iour to the announced dividend tax by arranging
for the distribution of large tax-exempted divi-
dends before the reform entered into effect. The
extraordinary dividends distributed prior to the
reform where to a large extent channelled back
to the companies in the form of loans and new
equity. This meant that shareholders converted
retained profits, which would have become taxa-
ble upon distribution after the reform, to loans
and new equity that could still be distributed
without dividend taxation after the reform. An-
other example is the restructuring of the motor
vehicle registration tax. When the budget pro-
posal was made public in October 2006, it became
evident that cars with low CO2 emissions would
be subject to lower registration tax after 1 January
2007, whilst cars with high CO2 emissions would
be subject to higher registration tax. This resulted
in purchases of car types that would become sub-
ject to lower tax being deferred, whilst purchases
of car types that would become subject to higher
tax were accelerated.
A revenue calculation incorporating behaviour-
al effects will normally only include the direct ef-
fect on tax revenues of the tax base being directly
affected . The revenue calculation will thus take
into account both such regulatory change and
how the resulting behavioural changes on the
part of households and businesses will influence
the tax base.
In some cases one should take into account
the fact that changes to one tax base will have
behavioural effects that also influence other tax
bases. The change to the tax regulations will in
such cases have an indirect effect on tax revenues
via a tax base that is not directly affected by such
regulatory change. An increase in the tax on spir-
its, for example, will not only increase the price of
spirits, and thus reduce demand for spirits. Such
increase may also shift alcohol consumption away
from spirits and towards wines and beers. Conse-
quently, an increase in the tax on spirits may in-
crease the revenues from the tax on wines and
beers.
Permanent effects
The permanent effect of a tax change includes
all long-term effects of such tax change. How long
time it takes for all adaptations to work them-
selves out will depend on which tax is being
changed.
2.8.4 Effects of expansionary fiscal policy
All tax reductions need to be financed, sooner
or later. This can be achieved by increasing other
taxes, by reducing expenditure or by paying inter-
est costs on government debt (or foregoing inter-
est revenues as a result of lower net government
assets). The funding of a tax reduction may also
influence tax bases, as in the case of a reduction
in government expenditure.
A tax reduction that is not financed may result
in an increase in disposable income in the short
28
The Norwegian tax system —main features and developments
run6. Higher private sector incomes may increase
demand and economic activity. This will also re-
sult in higher tax revenues, thus reducing the ini-
tial weakening of the fiscal budget. The impact on
activity will depend on, inter alia, the amount of
spare capacity in the economy. The impact on
activity will be minor during an economic boom,
but may be major in times of recession. In any
case, tax reductions need to be paid for over time,
through higher taxes or reduced expenditure.
This will, when taken in isolation, reduce demand
for goods and services, thus counteracting the
impact of the initial tax reduction on the activity
level and the budget balance. A short-term de-
mand increase resulting from unfinanced tax re-
ductions should not be confused with permanent
effects from behavioural changes. What needs to
be measured for purposes of examining whether
a tax change is making the tax system more effi-
cient or not is any permanent behavioural chang-
es. The impact of any expansionary fiscal policy
on activity will normally be taken into account in
the Ministry’s model computations for the entire
fiscal budget.
6 Increasing social security benefits will, correspondingly, also increase private sector disposable income. Hence, de-
mand effects are general implications of an expansionary fiscal policy, and are not specific to tax policy.