the nontraditional lamb market: …afcerc.tamu.edu/publications/publication-pdfs/cm-02-10...ii the...
TRANSCRIPT
THE NONTRADITIONAL LAMB MARKET: CHARACTERISTICS AND MARKETING STRATEGIES
Julie Stepanek Shiflett Gary W. Williams
Paul Rodgers*
AFCERC Commodity Market Research Report No. CM-02-10
March 2010
*Gary Williams is a Professor and Co-Director, Agribusiness, Food, and Consumer Economics Research Center (AFCERC), Department of Agricultural Economics, Texas A&M University; Julie Stepanek Shiflett is a consultant with Juniper Economic Consulting, Inc.; and Paul Rodgers is Deputy Director of Policy, American Sheep Industry Association.

THE NONTRADITIONAL LAMB MARKET: CHARACTERISTICS AND MARKETING STRATEGIES
Agribusiness, Food, and Consumer Economics Research Center (AFCERC) Commodity Market Research Report No. CM-02-10, March 2010 by Dr. Julie Stepanek Shiflett, Dr. Gary W. Williams, and Mr. Paul Rodgers.
ABSTRACT This study identifies and quantifies the nontraditional lamb market (that is, the number of lambs and lamb product leaving the traditional lamb commodity market and going into nontraditional markets) and characterizes the nontraditional lamb market from a producer and consumer perspective. In the process, the study estimates the volume of lamb and mutton diverted through nontraditional marketing channels, defines the nontraditional market channels, develops a profile of consumers in the nontraditional lamb and mutton market, suggests strategies for marketing lamb to ethnic consumers, and determines the growth prospects for the nontraditional market. The results should enhance the sheep industry’s insight into nontraditional markets and facilitate the development of marketing tools for producers and for monitoring changes in ethnic markets. ACKNOWLEDGEMENTS Prepared under contract with the American Sheep Industry Association with collaboration of the American Lamb Board.
The Agribusiness, Food, and Consumer Economics Research Center (AFCERC) provides analyses, strategic planning, and forecasts of the market conditions impacting domestic and global agricultural, agribusiness, and food industries. Our high-quality, objective, and timely research supports strategic decision-making at all levels of the supply chain from producers to processors, wholesalers, retailers, and consumers. An enhanced emphasis on consumer economics adds depth to our research on the behavioral and social aspects of health, nutrition, and food safety. Through research efforts, outreach programs, and industry collaboration, AFCERC has become a leading source of knowledge on how food reaches consumers efficiently and contributes to safe and healthy lives. AFCERC is a research and outreach service of Texas AgriLife Research and Extension and resides within the Department of Agricultural Economics at Texas A&M University.

ii
THE NONTRADITIONAL LAMB MARKET: CHARACTERISTICS AND MARKETING STRATEGIES
EXECUTIVE SUMMARY There is a growing sentiment in the U.S. sheep industry that the nontraditional lamb market is siphoning off an increasing portion of the commercial slaughter-lamb market away from traditional retail and foodservice sectors. If so, then the nontraditional market may play an important role in how U.S. lamb and sheep markets function, including impacts on the levels of prices, imports, production, processing, and other market variables. The volume of sheep diverted to nontraditional markets is largely unknown. The research reported here was motivated, in part, by the growing aware of a large statistical difference between the lamb crop numbers published by the U.S. Department of Agriculture (USDA) (plus losses) and USDA federally-inspected (FI) slaughter numbers. Between 2004 and 2008, this difference was estimated at nearly 1.2 million head per year, 48 percent of FI slaughter or 2.5 million head per year. The implication is that while FI slaughter has declined, nontraditional market demand has held steady. This project defines, quantifies and forecasts the growth of the nontraditional lamb market in the United States. Also, related marketing opportunities and strategies that may enhance provide value for the industry are identified. Embracing the nontraditional market through promotional activities and improved market monitoring could spur growth in the sheep and lamb industry. The research reported here was conducted in a four-phase survey approach to obtain a better understanding of the volume of lambs flowing through nontraditional markets because the market is fragmented and heterogeneous. In the first phase, informal phone surveys were used to interview the marketing managers at the top lamb packers as well as number of select smaller ethnic packers (the packer survey). In the second phase, informal phone surveys were also used to interview U.S. Department of Agriculture market reporters that report on sheep and lamb auctions (the market reporter survey). In contrast, the third phase of the survey approach featured a formal producer survey to estimate the volume of the nontraditional market at the farm gate, determine the ethnicity of consumers that buy direct from the farm, and determine what motivates producers and buyers to engage in direct marketing (the producer survey). The survey process involved the use of Zoomerang, a web-based survey service, to develop an online survey for sheep and lamb producers. Producers were contacted via e-mail as well as through the American Sheep Industry Association newsletter (Sheep Industry News) and encouraged to participate in the online survey. The result was 488 responses from a total of 20,467 producers. The final phase of the survey research process was another online survey through Zoomerang targeted to a select group of minority or ethnic consumers (the ethnic consumer survey). Zoomerang administered the survey instrument to a pre-profiled sample of 878 individuals who fit the required ethnic/minority profile and who had lamb, mutton, and/or goat in the past year and obtained 410 responses.

iii
In the past couple years, the average live slaughter weight for federally inspected (FI) slaughter has ranged from 138 lbs. to 141 lbs. with a carcass weight between 68 lbs. and 71 lbs. The packer survey revealed that, on average, the lamb carcasses channeled into ethnic markets by the top lamb packers are lighter than those going into more traditional market channels, ranging from about 30 lbs. to 70 lbs. (roughly 60-lb. to 140-lb. liveweight basis). The packer survey also indicated that kosher lambs are typically heavier, ranging from 60 lbs. to 70 lbs. (carcass weight). The responding packers indicated that they sell kosher lamb to the bigger wholesale distributors and the foodservice market. Halal slaughter lambs are typically 55 lbs. to 65 lbs. (carcass weight). The producer survey revealed that lambs sold through direct marketing to consumers ranged from an average 71 lbs. minimum to a high of 124 lbs. According to the market reporter survey, buyers at San Angelo and New Holland auctions will accept all weights although less than 100 lbs. is preferred. Market reporters indicated that lambs selling into the kosher market were typically heavier at 100 lbs. to 130 lbs. They affirmed that demand during holidays is more specific and often for lighter weight lamb. The survey of packers, market reporters, and consumers revealed that meat yield is the number one concern among ethnic buyers. The market reporters indicated that meat yield is the most sought after characteristic at auctions at San Angelo and New Holland but that buyers will buy most anything to fill orders. They also indicated that cleaner, healthier receive premiums and that hair sheep are increasingly popular and sometimes receive the highest prices in San Angelo. The producers surveyed confirmed that meat yield is the most important factor for buyers as perceived by producers. Over half of producers believed meat yield was the most important factor for their buyers across ethnic groups (Hispanic, Middle Eastern or White). Based on the survey results, we estimate that nearly one-half million lambs are channeled into ethnic markets within the traditional marketing sector by the top lamb packers. Within the nontraditional lamb market nearly 300,000 head are likely channeled into the ethnic market through livestock auctions and an additional one million head are likely direct marketed to consumers at the farm gate. Thus, the volume of sheep and lambs direct marketed and sold into ethnic markets from auctions is an estimated 1.3 million head -- close to the calculated statistical difference between the lamb crop and federally-inspected slaughter of 1.2 million head. The volume of lamb channeled into nontraditional markets by the top lamb packers, (defined as ethnic, custom, and natural products), is estimated at 12,000 head per week. This number increases over the Easter holidays. Natural product sales were estimated at 3,100 head per week. To put these numbers into perspective, the volume of lamb channeled into the ethnic market by the top packers is 8,900 head per week or roughly 20% of average weekly federally inspected slaughter (excluding natural product). In other words, nearly one out of every five lambs slaughtered by the top packers is going into the ethnic or nontraditional market. With an annual slaughter of about 2.4 million head, this equates to nearly one-half million head per year channeled into ethnic markets by the largest packers. Livestock auctions in San Angelo and New Holland dominant sheep and goat auctions and ethnic sales. Approximately 30 dealers, acting as agents for others and predominately Hispanic and

iv
Middle Eastern in origin, routinely buy in San Angelo. Dealers in San Angelo buy about 500 head per month each which equates to 15,000 head per month, or 94% of the auction’s volume annually. In New Holland, 60 to 80 sheep and lamb buyers are in the ring each week buying for ethnic sales outlets, typically individual grocery stores and/or meat markets. Each buyer purchases about 30 head per week which equates to 2,100 head per week or 8,400 head per month. In sum, an estimated 289,200 lambs are sold into the ethnic market each year through the San Angelo and New Holland auction markets. The lamb producer survey revealed that an estimated one million lambs were sold direct from producers to consumers in the year ending November 2009. The results indicate that direct marketing accounts for 48% of FI lamb and yearling slaughter in 2008 of 2.3 million head. Nearly half of all direct marketing from the farm are purchased by White buyers (48%), 23% by Middle Eastern buyers, 18% by Hispanic or Latino buyers, and 11% by unknown ethnicities. Based on the ethnic consumer survey results, minority populations in the United States consumed an estimated 58% of the 294.4 million lbs. of total U.S. lamb supply (including imports) in 2008. In other words, the U.S. minority populations which accounted for 35% of America’s population in 2008 consumed a disproportionate 58% of the lamb available. The incidence of minority lamb consumption among the lamb consumer survey respondents is 43% which is higher than similar percentages cited in previous literature. The Food Marketing Institute (2009) found that Hispanic shoppers are much more likely than Caucasian shoppers to eat lamb at 37% versus 24%, respectively. The incidence of lamb consumption among the lamb consumer survey respondents is even higher in the most populated states, including 52% in California, 60% in New York, 43% in New Jersey and 44% in Texas. The analysis of the survey results identified several potential marketing strategies to expand the demand for U.S. lamb: Marketing Strategy #1: Create opportunities to divert lambs from nontraditional markets
into traditional, commercial market channels.
A large volume of lambs currently going directly into nontraditional markets now is not benefitting from the efficiencies, scale of operation and infrastructure currently in place in traditional market channels which could limit the future growth of traditional markets. For example, if most lamb going to the growing ethnic segment of the market is direct marketed, the unavailability of domestic lamb in traditional markets could lead both domestic and ethnic consumers increasingly to turn to imports to meet their lamb demand needs. Traditional market channels may well allow a larger number of producers to take advantage of and benefit from the rapidly growing ethnic market segment and limit the erosion of ethnic consumers to imported lamb over time.
Marketing Strategy #2: Increase ethnic group awareness and purchase frequency by
promoting the specific characteristics of American lamb that they value.

v
The survey results suggest that the targets for advertising and promotion campaigns for selling an increased volume of American lamb to ethnic consumers include concepts related to the meat yield, grass fed, healthy, “natural,” consistency, local, and comes from a trusted source and availability. By informing ethnic consumers of the superiority of American lamb with regard to these specific attributes, ethnic consumers are more likely to search for and demand American over imported lamb and over other competing meats.
Marketing Strategy #3: Enhance ethnic consumer awareness of the availability of American
lamb.
Advertising and promotion to educate ethnic consumers on where and how they can access American lamb could be an important strategy to enhance the ethnic consumption of and loyalty to American lamb. Industry efforts to improve the availability of lamb to this rapidly growing segment of the population are also needed.
Marketing Strategy #4: Target ethnic lamb sales geographically.
California New York are home to 20% and 13%, respectively, of the lamb consuming survey respondents but account for only 7% and 3%, respectively, of the U.S. minority population. Targeting ethnic market advertising and promotion dollars to these areas will likely maximize the bang for each buck spent on this market segment.
Marketing Strategy #5: Target retail over foodservice sales to ethnic consumers.
Nearly 75% of ethnic lamb consumers indicated they eat lamb at home with 37% indicating they eat lamb at least once a month. Thus, promoting lamb sales at retail could be the most effective way of spending ethnic promotion dollars.
Marketing Strategy #6: Target mainstream grocery stores in marketing lamb to ethnic
consumers.
Among the 75% of ethnic consumers indicating that they eat lamb at home, about 60% reported that they purchase their lamb from mainstream grocery stores. When asked why they purchase lamb at grocery stores, “convenience” was the most popular response given followed in equal importance by low cost, selection, freshness and quality. The implication is that targeting mainstream grocery stores frequented by ethnic consumers could enhance the effectiveness of lamb promotions to ethnic groups.
Get ready for the future. Given the high incidence of lamb consumption by minority populations and forecasts for the minority population to grow, lamb consumption could grow exponentially in this country. According to the U.S. Census Bureau, by 2050, the minority population — everyone except for non-Hispanic, single-race Whites — is projected to be 235.7 million out of a total U.S. population of 439 million, or 53% of the population. The non-Hispanic White population will shrink from about 65% of the population to 47%

vi
TABLE OF CONTENTS
ABSTRACT ..................................................................................................................................... i ACKNOWLEDGEMENTS ............................................................................................................. i EXECUTIVE SUMMARY ............................................................................................................ ii LIST OF TABLES ........................................................................................................................ vii LIST OF FIGURES ..................................................................................................................... viii INTRODUCTION .......................................................................................................................... 1 LITERATURE REVIEW ............................................................................................................... 4 LAMB PACKER SURVEY ........................................................................................................... 5 Top Six Packer Survey.................................................................................................................... 6 Lamb Slaughter by Top Packers for Ethnic Markets ...................................................................... 6 Goat Slaughter by Top Packers for Ethnic Markets ....................................................................... 8 Top Packer Survey Conclusions ..................................................................................................... 9 Smaller, Ethnic Packer Survey ....................................................................................................... 9 MARKET REPORTER SURVEY ............................................................................................... 10 Auction Market Characteristics .................................................................................................... 10 San Angelo Auction Market ......................................................................................................... 10 New Holland Auction Market ....................................................................................................... 11 Market Reporter Survey Results ................................................................................................... 11 LAMB PRODUCER SURVEY .................................................................................................... 12 Objectives and Method ................................................................................................................. 13 Descriptive Statistics of Surveyed Producers ............................................................................... 14 Distribution of Sales by Ethnicity and Species ............................................................................. 14 Marketing Channels ...................................................................................................................... 16 Producer Motivation for Direct Marketing ................................................................................... 17 Nontraditional Market Lamb Weights .......................................................................................... 18 Valuation Method ......................................................................................................................... 20 Marketing Lamb Cuts ................................................................................................................... 20 On-Farm Slaughter........................................................................................................................ 21 Farmers’ Markets .......................................................................................................................... 22 Adult Sheep Market ...................................................................................................................... 24 Goat Market .................................................................................................................................. 24 Estimating the Nontraditional Market Volume from the Farm Gate ............................................ 24 ETHNIC LAMB CONSUMER SURVEY ................................................................................... 27 Review of Lamb Consumption Literature .................................................................................... 28 Research Method .......................................................................................................................... 29 Ethnic Consumer Survey Results.................................................................................................. 29
vii
Profile of Minority Lamb Consumers versus Minority Non-Consumers ..................................... 30 Estimating Lamb Consumption by Surveyed Consumers ............................................................ 30 Ethnic Lamb Consumer Demographics ........................................................................................ 32 Other Ethnic Lamb Consumer Survey Results ............................................................................. 36 Ethnic Retail Goat Consumption .................................................................................................. 38 Ethnic Retail Mutton Consumption .............................................................................................. 39 MARKETING STRATEGIES TO ENHANCE INDUSTRY PROFITABILITY SUGGESTED BY THE RESEARCH RESULTS ................................................................................................ 41 WHAT’S THE FUTURE FOR ETHNIC LAMB CONSUMPTION? ......................................... 42 REFERENCES ............................................................................................................................. 44
LIST OF TABLES Table 1: Survey versus National Distribution of Producers ........................................................ 14 Table 2: Descriptive Statistics of Producers Engaged in Nontraditional Marketing ................... 15 Table 3: Distribution of Sales by Ethnicity and Species .............................................................. 15 Table 4: Producers’ Perception of What Motivated Buyers’ Purchases ...................................... 17 Table 5: What Motivated Sales to White Buyers ......................................................................... 18 Table 6: What Motivated Sales to Middle Eastern Buyers .......................................................... 19 Table 7: What Motivated Sales to Hispanic Buyers ................................................................... 19 Table 8: Live Weight Preference by Niche and Direct Markets .................................................. 21 Table 9: Average Weight and Age of Lambs Sold by Ethnicity ................................................. 21 Table 10: What Motivated On Farm Slaughter Sales ................................................................. 23 Table 11: Characteristics of Lamb Demanded by On Farm Slaughter Customers ...................... 23 Table 12: Description of Lamb Sales through Farmers’ Markets ................................................ 23 Table 13: Adult Sheep Sales ........................................................................................................ 25 Table 14: Goat Sales .................................................................................................................... 25 Table 15: Average Number of Lambs Sold by What Motivated Buyers’ Purchases .................. 26 Table 16: Estimated Number of Lambs Sold Direct for Personal/Family Use ............................ 26 Table 17: Descriptive Statistics of Minority Consumers that Had and Had Not Eaten ............... 31 Table 18: Frequency of Eating Lamb Away from Home ............................................................ 31 Table 19: Distribution of Lamb Consumers by Age .................................................................... 37 Table 20: Consumer Perception of Lamb Price and Attributes ................................................... 38

viii
LIST OF FIGURES Figure 1: Sheep & Lamb Inventory, 1990-2008 ............................................................................ 2 Figure 2: Sheep & Lamb Inventory Gains, 2005-2009 ................................................................. 2 Figure 3: Federally Inspected Slaughter & Estimated Nontraditional Market Volume,
2000-2008 ........................................................................................................................3 Figure 4: Average Lamb Weight Purchased by Middle Eastern Buyers ..................................... 21 Figure 5: Incidence of Minority Lamb Consumers ...................................................................... 30 Figure 6: Distribution and Frequency of At Home Lamb Consumption ..................................... 31 Figure 7: Geographic Distribution of Minority Lamb Consumers .............................................. 33 Figure 8: Ethnic Distribution of Lamb Consumers ...................................................................... 34 Figure 9: Religious Identification of Lamb Consumers Surveyed .............................................. 35 Figure 10: Minority Lamb Consumers’ Distribution of Household Income ............................... 36

NONTRADITIONAL LAMB MARKET IN THE UNITED STATES: CHARACTERISTICS AND MARKETING STRATEGIES
INTRODUCTION INTRODUCTION
After over 10 years of inventory contraction, the sheep industry expanded for the first time in 2005 (Figure 1). In 2006, the industry expanded again, but in the four years of 2006 to 2009, inventories contracted 7% and fell below 6 million head for the first time in 2009 to 5.7 million head. However, over the five years of 2005 to 2009, there were periods of sustained inventory growth. While some states experienced sharp inventory contractions, the inventories held constant in some states while increasing in fourteen other states over that time-period (Figure 2). States where inventories grew were primarily in the Northeast and Southeast. Inventory growth also occurred in Utah, Colorado, Arizona, and Washington. Inventories in the most populous sheep and lamb states, Texas and California, contracted over the last five years by 18% to 870,000 head and by 4% to 660,000 head, respectively. The strong inventory growth in certain regions coincides with anecdotal evidence that perhaps many lambs are not being sold through traditional marketing channels – from auctions or producers to feedlots for finishing then on to the major packers. In fact, a statistical difference exists between U.S. Department of Agriculture (USDA) federally inspected (FI) slaughter numbers and the USDA estimated lamb crop (less 5% for losses). Between 2004 and 2008, this difference was nearly 1.2 million head per year, 48% of FI slaughter, or 2.5 million head per year. While FI slaughter has declined, this difference, perhaps the result of marketing into nontraditional markets, has held steady (Figure 3).
RESEARCH OBJECTIVES AND METHOD There were two broad goals of this research: (1) to identify and quantify the nontraditional lamb market (that is, how many lambs and how much product is leaving the traditional lamb commodity market and going into nontraditional markets?) and (2) to characterize and understand the nontraditional lamb market from a producer and consumer perspective. More specifically, this research will: (1) estimate the volume of lamb and mutton diverted through nontraditional marketing channels and (2) define the nontraditional market channels (e.g., producer direct to consumer, producer through auction to state slaughter facilities to small butcher shops), (3) develop a profile of consumers in the nontraditional lamb and mutton market, and (4) determine the growth prospects for the nontraditional market. The research results should provide commercial packers with greater insight into the supply situation of feeder lambs and help improve forecasts of prices in the commercial market through a comprehensive understanding of the nontraditional market, without which forecasts could be shortsighted. The results should enhance the sheep industry’s insight into nontraditional markets and facilitate the development of marketing tools for producers and for monitoring changes in ethnic markets.

2
Figure 1: Sheep & Lamb Inventory, 1990-2008
5,000
6,000
7,000
8,000
9,000
10,000
11,000
12,000
1990
1992
1994
1996
1998
2000
2002
2004
2006
2008
'000 H
ead
Source: USDA/NASS Figure 2: Sheep & Lamb Inventory Gains, 2005-2009
Source: USDA/NASS

3
Figure 3: Federally Inspected Slaughter & Estimated Nontraditional Market Volume, 2000-2008
0
1,000
2,000
3,000
4,000
2000
2001
2002
2003
2004
2005
2006
2007
2008
1,00
0 Hea
d
Nontraditional Market
Federally Inspected (FI) Slaughter
Because nontraditional lamb and mutton markets are fragmented, encompassing varied marketing channels, a survey approach in four phases was designed to meet the project objectives: 1. Packer Survey: Informal, information-gathering phone survey of the top six lamb packers
as well as smaller, ethnic federally or state-inspected lamb slaughter facilities. The survey of the top six packers was intended to determine whether the large packers slaughter lambs for ethnic, natural, or custom slaughter markets (i.e., nontraditional markets) and, if so, how many. The survey of the smaller, ethnic packers was intended to define marketing channels utilized by those packers and to gather a consumer profile of each firm.
2. Market Reporter Survey: Informal, information-gathering phone survey of the USDA market
reporters and auctioneers at two key sheep auctions (San Angelo, Texas and New Holland, Pennsylvania). The main questions involved soliciting from them a profile of buyers and the reporters’ insights regarding marketing channels. The volume of sheep and lamb traded was also obtained from the auction houses.
3. Lamb Producer Survey: A formal online survey of sheep and lamb producers was conducted.
Increased response rates were achieved through a respondent option to enter a drawing for a gift as well as advertisements in the Sheep Industry News. Key questions asked producers included soliciting from them a profile of their buyers, where and how they sell lamb, and their insights on the volume of lamb flowing through specified marketing channels.
4. Ethnic Lamb Consumer Survey: Formal survey of minority or ethnic lamb consumers. The
research utilized Zoomerang, an online survey tool. Zoomerang sent out the survey instrument to its pre-screened survey takers. Key questions included the frequency of lamb consumption, where lamb was consumed, and demographic questions.

4
LITERATURE REVIEW Momentum has been gathering for further research on the nontraditional lamb market. The first formal piece addressing direct marketing was perhaps “Marketing out of the Mainstream” by the American Sheep Industry Association (ASI) in 1995. Previous literature is often very broad in coverage, does not delineate marketing channels, and does not attempt to estimate volume. “Marketing out of the Mainstream” was the first attempt to provide formal definitions and detailed descriptions of the nontraditional lamb and wool markets available to producers. This publication refers to marketing into the nontraditional market as “direct marketing”. The authors make the important distinction that direct marketing “encompasses the activities involved in selling lamb and wool products directly to the general public or niche markets” while “direct marketing” is defined as the sale of lambs direct to packers (p. 1). They determine that direct marketing submarkets include the freezer market, ethnic/religious markets, retail food stores, and restaurants. The authors also provide details of the targeted customers for each submarket of direct marketing as well as the services provided, facilities needed, and management considerations. While not attempting to quantify the nontraditional market, the 1995 ASI publication did draw the conclusion that most direct marketing producers sell freezer market lambs (p. 4). In the freezer market, producers sell live lambs to consumers, help them make arrangements for custom slaughter, and deliver the lamb to the slaughterhouse for them. The publication also explained that lamb is “usually consumed fresh at special occasions” in the ethnic/religious market (p. 8). Although the observance of many ethnic holidays includes eating lamb, many ethnic groups consume lamb as a regular part of their diet. Today the ethnic market likely overlaps to a great degree with the freezer market because lamb is bought and frozen for future consumption. In addition, the publication explains that the three primary ethnic market customers include individuals of the Islam and Judaism faiths from the Middle East and Christians at Easter. The report does not mention Hispanic customers who we will later show play a significant role in the nontraditional lamb market. The primary source for demographic information on lamb consumers has been the American Lamb Board. Several funded projects (e.g., Gross, J. B. 2006 and Shugoll Research 2009) have explored the demographics and the incidence of U.S. lamb consumption. Williams et al. (2005) used AC Nielsen HomeScanTM data to analyze the incidence of lamb consumption and the demographics of lamb consumers (2005). Also, a Food Marketing Institute (FMI) publication entitled “The Power of Meat” (2009) reported on the incidence and demographic profile of lamb consumers. Two studies targeting ethnic lamb consuming groups were conducted through a joint effort of Just Food, Inc. (a community-based group addressing local food and agriculture issues) and the Farming Alternatives Program at Cornell University and Los Sures, a community organization in the Williamsburg section of Brooklyn, New York City. The first study surveyed restaurants in Williamsburg to determine interest in goat meat from New York producers. The other study surveyed 29 consumers at La Marquetta Consumiere, a Hispanic farmers’ market in Williamsburg, to determine the degree to which Hispanic consumers were interested in fresh and prepared goat and lamb products being sold in the community.

5
The primary limitation of existing literature is that the volume of lamb channeled through the nontraditional market is not estimated. A recent study by Shiflett (2008) provides a rough estimate of the volume of the ethnic lamb market from secondary sources but the estimation procedure was quite ad hoc and deserves additional consideration. A recent study by Williams et al. (2008) is the most exhaustive review of nontraditional lamb markets. The study indicates that lambs flowing through “alternative and emerging” lamb markets are lightweight and younger feeder lambs as well as hair sheep that are purchased for slaughter to meet an ethnic demand. A defining factor for this market is that the desired weight range is from about 51 lbs. to 88 lbs. (23-40 kg) compared to the average live weight of 140 lbs. Muslims, Greeks, and Eastern Orthodox Catholics are the primary populations that consume lamb during specific periods of the year during religious observations. However, there are a number of other ethnic groups that contribute to ethnic lamb demand, including Hispanics and Latinos, Italians, Greeks, and African communities. Our research found that kosher markets in the Northeast prefer 100 lb. - 126 lb. (45-57 kg) lambs while the Muslim market favors 60 lb to 88 lb. (27-40 kg) lambs (O’dell et al. 2003). An empirical analysis by Williams et al. (2008) revealed that Muslim and Christian/Orthodox religious events do have a significant impact on the U.S. lamb industry. First, the holidays were found to lead to additional slaughter of lambs and yearlings. Second, purchases of lamb were found to be sensitive to prices, even during holiday periods. The study concludes that gaining access to and serving emerging and alternative markets for ethnic and religious groups, as well as organic meat markets, could be a key marketing strategy for the future off the U.S. sheep industry. The study also points out that the number of lambs channeled through nontraditional market is not well documented. As a consequence, USDA-published data give the potentially misleading impression that the industry is in rapid decline with little positive in its future outlook. This characterization of the industry has negatively affected its ability to attract private, state, and federal resources. Because the rapidly growing nontraditional segment of the industry is not well documented, the industry does not receive the attention by policy makers or the investments needed to promote overall expansion and growth. The study concludes that research is critically needed all along the sheep and lamb supply chain to enhance productivity, reduce costs, and enhance demand if the industry is to successfully compete against imports and begin to growth once again.
LAMB PACKER SURVEY An informal phone survey was conducted in September 2009 with the top six lamb packers in the United States to ascertain their involvement in nontraditional lamb markets as well as their views on the characteristics of that market. The top six lamb packers chosen for the study accounted for 70-80% of sheep and lamb slaughter in 2007. These six packers vary considerably in their involvement in the nontraditional market although all reported at least some experience with both kosher and halal slaughter. While some of these packers have significantly increased their

6
‘natural’ slaughter, none of them reported any organic slaughter. Some packers reported that they currently slaughter goats or have in the past. A similar informal phone survey was conducted during the same time period with smaller, predominantly ethnic packing plants to determine any differences in their experiences with non-traditional markets from those of the top packers. The American Lamb Board identified seventeen predominantly ethnic packing plants. Two facilities were located in California, four in the Midwest, and nine in the East.
Top Six Packer Survey
Packers were asked about the volumes and slaughter practices regarding both lambs and goats destined for nontraditional. After reporting their responses relative to lambs, their responses regarding goats are reported.
Lamb Slaughter by Top Packers for Ethnic Markets
The top six packers reported that lamb from an estimated at 12,000 head of sheep per week is channeled into nontraditional markets (defined as ethnic, custom, and ‘natural’ product sales). The volume was reported to increase over the Easter holidays. If natural product is omitted, the top packers slaughter 8,900 lambs per week to meet ethnic market demand. To put this into perspective, this volume of lamb amounts to roughly 20% of average weekly federally inspected slaughter. In other words, nearly one out of every five lambs slaughtered is going into the nontraditional market. With an annual slaughter of about 2.4 million head, this equates to 462,800 head a year that are channeled into nontraditional markets by the largest packers. The top packers estimated their Halal slaughter at 5,000 head per week with the weekly volume ranging from 500 head to 3,000 head. One packer reported killing all lamb according to Halal requirements and another reported a 100% Halal slaughter capability. For meat to be identified as Halal, the animals must be slaughtered by a Muslim in accordance with the requirements of Islamic law (Australian Halal Food Services 2008). The animal to be slaughtered must be carefully and gently restrained while the throat is slit and all blood is drained. Further, Halal slaughter means that Haram ("unlawful") meat may not be processed in the same area as Halal products. Halal and non-Halal product must be adequately separated and identified at all times, equipment must be thoroughly cleaned and washed if non-Halal meat has been in contact, only genuine Halal products may be issued a Halal certificate, and can be certified Halal only by recognized Islamic organizations (Australian Meat 2009). The results of the top packer survey indicated that the volume of Kosher slaughter by those packers varies from zero head per week to about 1,000 head per week. Based on the survey results, an estimated 3,000 head per week are Kosher slaughtered by the top six lamb packers. Four out of the six packers surveyed indicated that they slaughter Kosher lambs. One packer reported that they did Kosher slaughter at one time but found the technical requirements too involved to make the effort profitable. Two packers reported that the costs associated with Kosher slaughter make it prohibitive because the slaughter chain must slow with kosher
7
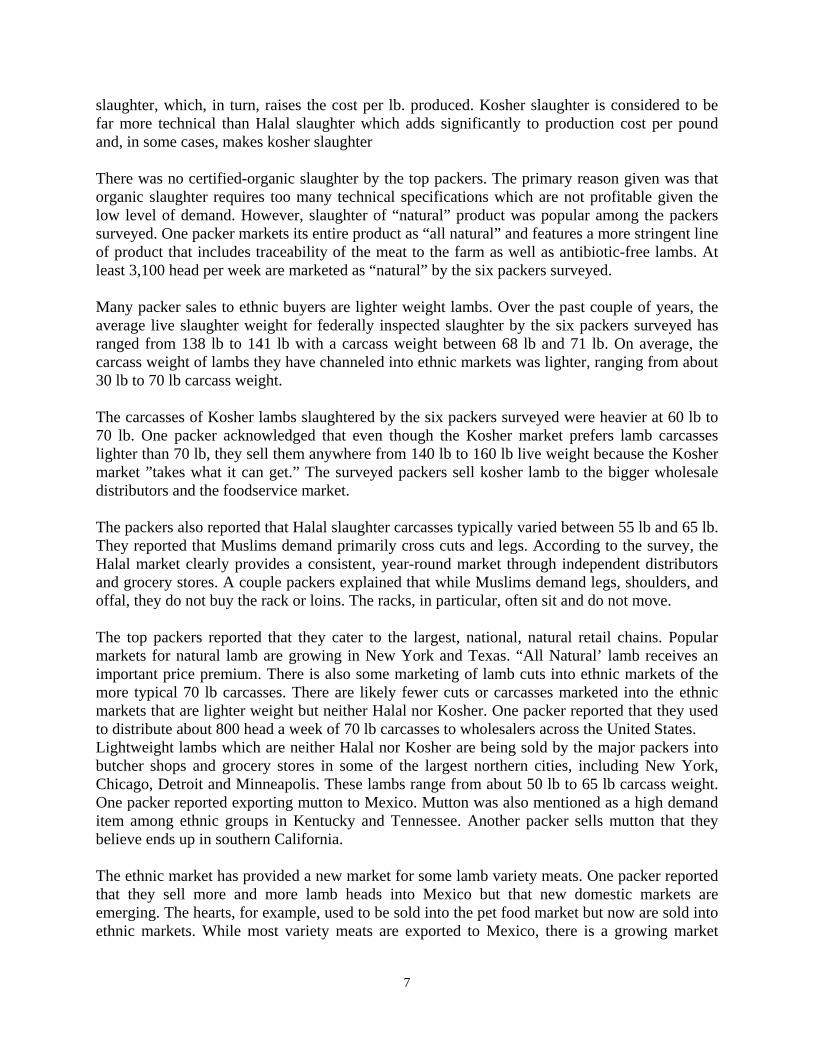
slaughter, which, in turn, raises the cost per lb. produced. Kosher slaughter is considered to be far more technical than Halal slaughter which adds significantly to production cost per pound and, in some cases, makes kosher slaughter There was no certified-organic slaughter by the top packers. The primary reason given was that organic slaughter requires too many technical specifications which are not profitable given the low level of demand. However, slaughter of “natural” product was popular among the packers surveyed. One packer markets its entire product as “all natural” and features a more stringent line of product that includes traceability of the meat to the farm as well as antibiotic-free lambs. At least 3,100 head per week are marketed as “natural” by the six packers surveyed. Many packer sales to ethnic buyers are lighter weight lambs. Over the past couple of years, the average live slaughter weight for federally inspected slaughter by the six packers surveyed has ranged from 138 lb to 141 lb with a carcass weight between 68 lb and 71 lb. On average, the carcass weight of lambs they have channeled into ethnic markets was lighter, ranging from about 30 lb to 70 lb carcass weight. The carcasses of Kosher lambs slaughtered by the six packers surveyed were heavier at 60 lb to 70 lb. One packer acknowledged that even though the Kosher market prefers lamb carcasses lighter than 70 lb, they sell them anywhere from 140 lb to 160 lb live weight because the Kosher market ”takes what it can get.” The surveyed packers sell kosher lamb to the bigger wholesale distributors and the foodservice market. The packers also reported that Halal slaughter carcasses typically varied between 55 lb and 65 lb. They reported that Muslims demand primarily cross cuts and legs. According to the survey, the Halal market clearly provides a consistent, year-round market through independent distributors and grocery stores. A couple packers explained that while Muslims demand legs, shoulders, and offal, they do not buy the rack or loins. The racks, in particular, often sit and do not move. The top packers reported that they cater to the largest, national, natural retail chains. Popular markets for natural lamb are growing in New York and Texas. “All Natural’ lamb receives an important price premium. There is also some marketing of lamb cuts into ethnic markets of the more typical 70 lb carcasses. There are likely fewer cuts or carcasses marketed into the ethnic markets that are lighter weight but neither Halal nor Kosher. One packer reported that they used to distribute about 800 head a week of 70 lb carcasses to wholesalers across the United States. Lightweight lambs which are neither Halal nor Kosher are being sold by the major packers into butcher shops and grocery stores in some of the largest northern cities, including New York, Chicago, Detroit and Minneapolis. These lambs range from about 50 lb to 65 lb carcass weight. One packer reported exporting mutton to Mexico. Mutton was also mentioned as a high demand item among ethnic groups in Kentucky and Tennessee. Another packer sells mutton that they believe ends up in southern California. The ethnic market has provided a new market for some lamb variety meats. One packer reported that they sell more and more lamb heads into Mexico but that new domestic markets are emerging. The hearts, for example, used to be sold into the pet food market but now are sold into ethnic markets. While most variety meats are exported to Mexico, there is a growing market

8
domestically, particularly in southern California. One packer sells hearts and livers and fresh kidneys. Marketing of variety meats is informal for one packer. Customers come into their packing plant every day. For another packer, Halal and Kosher lamb marketing is more formal with most going to grocery stores. This latter packer indicated that the demand for variety meats is so strong that “We can’t get enough kidneys!” A packer explained that one market for the lamb kidney and livers is the African Somalis. This largely Muslim population regularly eats kidney and livers as part of its culture. In general, the survey suggests that while making supplies tight at times and creating price pressure, the nontraditional market was not considered to be of sufficient significance to the largest packers to warrant changes in their procurement strategies. The consensus was that the volumes channeled through the nontraditional market do not impact western producers where many of the largest packers operate. A few packers acknowledged that sometimes price premiums were paid to compete in the nontraditional market. Sometimes a bidding war occurred to secure feeder lambs. Two packers indicated that some farm flocks in Texas are targeted primarily for ethnic markets so that sourcing feeder lambs in Texas has become increasingly difficult. One packer definitely felt that the supply of feeder lambs was tight and that feeders have become more expensive during the winter months, particularly the 80 lb to 100 lb feeders. All the large packers surveyed recognized that ethnic consumers often “didn’t care what they paid” because ethnic consumers are less price sensitive than many consumers in traditional markets. One packer pointed out that the price of feeders used to be below the price of fed lambs. Now the reverse is true – which might be partly a function of the growing demand by ethnic consumers. A growing concern among the largest lamb packers is their impression that many lambs diverted to the nontraditional market are killed on barn floors. Their stated concern was for the unsanitary practices that might lead to bad publicity for the industry as a whole. Another concern voiced by packers is that the reduced supply of lambs channeled through traditional markets will negatively affect the industry’s infrastructure. The largest packers could face rising operating costs if slaughter hours are cut back. Worse yet, slaughter houses could be shut down. The survey suggested that the ethnic market is not so fragmented as to prohibit sales by the top packers. In other words, the ethnic lamb market generates sufficient volume per transaction for most packers to warrant sales and reduce risk. A distributor often buys relatively large volumes from packers and then breaks the loads up for its individual customers, such as grocery stores or smaller “mom and pop” butchers. The “natural” market appeared to be the most mainstream among nontraditional markets, securing accounts from national retailers. For many packers, the goat market is fragmented. Only a few head are sold “here and there” which significantly raises marketing costs.
Goat Slaughter by Top Packers for Ethnic Markets The top lamb packers differ widely in experience slaughtering and marketing goats. “Didn’t pay” and “hit or miss’ was how a couple packers described the goat market. Other packers have had some success, slaughtering up to 300 head of goats per week. Goat slaughter appears to be

9
prompted by customer demand (and not necessarily the same customers buying lamb). One packer is just starting to slaughter goats as the result of interest by a major specialty retailer who wanted goat meat. One packer markets primarily goat carcasses into Muslim markets in southern California. Hispanics also consume goat but are thought to prefer cheaper imported goat meat. Another packer reported slaughtering goats in the past but did not have a favorable experience. The problem was apparently a mismatch between what the packer thought the customers wanted and what the customers actually wanted. The packer bought goats of all weights but the customers just wanted goats less than 20 lb. and meaty.
Top Packer Survey Conclusions
All of the top six lamb packers have embraced the nontraditional market to differing degrees. Most packers have committed significant resources to penetrating this market. Some packers have tried but ceased pursuing this market due to lack of profitability. One packer stated it well when he said that the ethnic market is viewed as the “unseen competitor.” It saps supply and bids up prices. In addition, its marketing volume and strategy are largely fragmented and unknown. Nevertheless, most top packers reported some success in this market, providing high-volumes of quality lambs year round for natural and ethnic markets.
Smaller, Ethnic Packer Survey
In general, the smaller, ethnic packers surveyed slaughtered lambs that were lighter weight than the federally-inspected 137 lb. liveweight average. Their lamb dressed weights ranged from 30 lb. to 60 lb., typically lighter than the 67 lb. to 70 lb. range for the average dressed weight reported by the top packers. The ethnic packers often specialize in 30 lb. to 40 lb. carcasses or else they slaughter heavier, 50 lb. to 60 lb. dressed weight animals. One ethnic packer surveyed reported selling 30 lb. to 40 lb. liveweight lambs to Italian and Greek customers. This packer also reported selling 40 lb. to 60 lb. liveweight adult sheep to Hispanic customers. These markets were year-round, not seasonal. Ethnic packers reported operating primarily in wholesale rather than retail, direct-to-consumer markets. Their wholesale consumers varied from predominantly ethnic supermarkets to ethnic butcher shops. One ethnic packer primarily supplied “Christian Ethiopian” butcher shops in the Washington, D.C. area. The ethnic packers surveyed also varied in the volume of lambs they slaughtered, ranging from 30 to 40 head a week up to 500 head per week. Those that slaughter fewer lambs tended to slaughter other species as well. Respondents reported that they only slaughtered a few goats, typically upon request from customers. One ethnic packer reported slaughtering baby goats for Italian customers during Easter. Ethnic packers that reported performing Halal slaughter were divided when asked whether Muslim consumers will eat non-Halal lamb. Some mentioned that Muslims will eat non-Halal lamb because the animals are assumed to be slaughtered by a man of God. Another packer that slaughtered all Halal acknowledged that whether a Muslim ate only Halal slaughtered lamb was a very personal decision. One ethnic packer reported slaughtering all Kosher lamb but selling into Muslim markets. Another ethnic packer reported selling Kosher forequarters to Jewish

10
customers but then selling the remainder of the carcass to Muslim customers. Legs, in particular, are reportedly in demand by Muslim customers. One packer reported that lamb quality is improved when all the blood is drained from the carcass, as in Halal slaughter. Most ethnic packers reported selling lamb variety meats. They reported that if Halal lamb was sold that the customer usually would also want the variety meats as well. The ethnic packers surveyed all reported that sourcing lambs was not a problem. Packer buyers or auction owners facilitated purchases. One ethnic packer slaughtered 30 to 40 head of lambs a week but also purchased carcasses. One packer in New Jersey reported purchasing lambs from the auction in New Holland but also from Texas because lambs were cheaper in Texas. Another packer commented that they must source from New Holland because the lambs were fresh and much better quality than from Texas.
MARKET REPORTER SURVEY
An informal phone survey of USDA Agriculture Marketing Service (AMS) market reporters in San Angelo, TX, New Holland, PA, and Ft. Collins, CO was done in October 2009 to assess the size of the ethnic markets through auctions, characteristics of ethnic buyers, ethnic marketing channels, and livestock characteristics demanded by ethnic buyers.
Auction Market Characteristics
Livestock auctions in San Angelo, Texas and New Holland, Pennsylvania represent the largest auction markets that sell into the nontraditional sheep, lamb, and goat markets. San Angelo and New Holland accounted for an estimated 70% of lamb sales through major sheep auctions in 2008.1 In 2008, 191,818 head of sheep and lambs were sold through the San Angelo market while 106,726 head were sold through the New Holland market. The next largest auction in volume is likely Fredericksburg, Texas with a much smaller 46,567 head of sheep and lambs moving through that market. Fort Collins, Colorado, likely ranks fourth with 35,929 sheep and lambs moving through that market in 2008 – all reportedly to ethnic buyers.
San Angelo Auction Market
Although the largest sheep and lamb auction in the U.S., San Angelo auction numbers have dropped off in recent years. Between 2006 and 2007, the number of sheep sold through Producers Livestock Co. in San Angelo, Texas dropped 14%. The drop might be a reflection of the severe drought that began in Texas at that time. Between 2006 and 2007, the sheep and lamb inventory in Texas held constant at 1,070 head but fell 9% to 960,000 head in 2008 and then fell another 9% down to 870,000 head in 2009.
1 Data in this paragraph derived from data provided by U.S. Department of Agriculture, Agricultural Marketing Service, Dept. of Ag Market News, reporters Rebecca Sauder and Levi Geyer. Accessed over the phone in September 2009.

11
The sheep and lamb industry contraction in Texas might also be an indication that the nontraditional lamb market might have been making a shift to other hubs, such as the auction in New Holland, Pennsylvania. Sheep sales through New Holland grew 38% between 2004 and 2005 and then jumped another 10% between 2005 and 2006. Approximately 30 dealers – predominately ethnic and acting as agents for others -- routinely buy in the Producers Livestock Auction in San Angelo, Texas. With roughly 500 head per month purchased by each dealer, this equates to 15,000 head a month implying that the dominant dealers in San Angelo purchased an estimated 94% of the auction’s sheep volume in 2008. Perhaps 10% to 15% of the total number of buyers purchase a few head weekly for their own use. In aggregate, these buyers do not represent a significant volume. More typical are buyers that buy for many different accounts. As an example, one of the largest dealers operating out of San Angelo supplies distributors in the Houston area but sends most of his purchases to the Northeast, primarily the New Jersey area. He might buy one to two truckloads each week for delivery in the Northeast. He does not take any sheep or goats to the New Holland auction. A dominant dealer in the San Angelo market reported buying a large number of head in total but for numerous small accounts. He might buy 50 head per week for a grocer in the Detroit area, 50 head for a restaurant in New Jersey, and another 75 head per week for a packer in the New Jersey area. He routinely supplies a good-sized slaughtering plant in the New Jersey area. This plant is small compared to the largest lamb packers but is one of the bigger facilities on the East Coast. Typically, the lamb purchased in San Angelo will be custom slaughtered. Most of the dealers operating in the San Angelo market are in the market week after week. However, there are buyers that might be in the market one to two months at a time, buying a significant volume and then disappearing. Again, these buyers buy for someone else and receive a commission.
New Holland Auction Market New Holland will typically have 60 to 80 sheep and lamb buyers each week, which includes a handful of dealers (about 5 to 6). The bulk of the buyers are individual grocery stores and/or meat markets (about 30 to 40) buying for their stores who have the sheep custom slaughtered. The balance is individuals buying for their own use. Each buyer buys about 30 head per week which equates to 2,100 head per week, 8,400 head per month or 109,200 head per year. In New Holland, a few dealers will be in the market each week buying on behalf of numerous other buyers. One dealer, for example, is the owner of a grocery store in the New Jersey area. He reported that he typically drives to New Holland early in the morning and buys up to 1,200 head for up to 30 different accounts. This equate to about 40 head per customer per week. In sum, San Angelo and New Holland sell an estimated 289,200 lambs into the ethnic market in a year.
Market Reporter Survey Results
The AMS market reporters interviewed indicated that light weight and meat yield are the two primary characteristics demanded by ethnic buyers at auction. At the auctions in San Angelo and
12
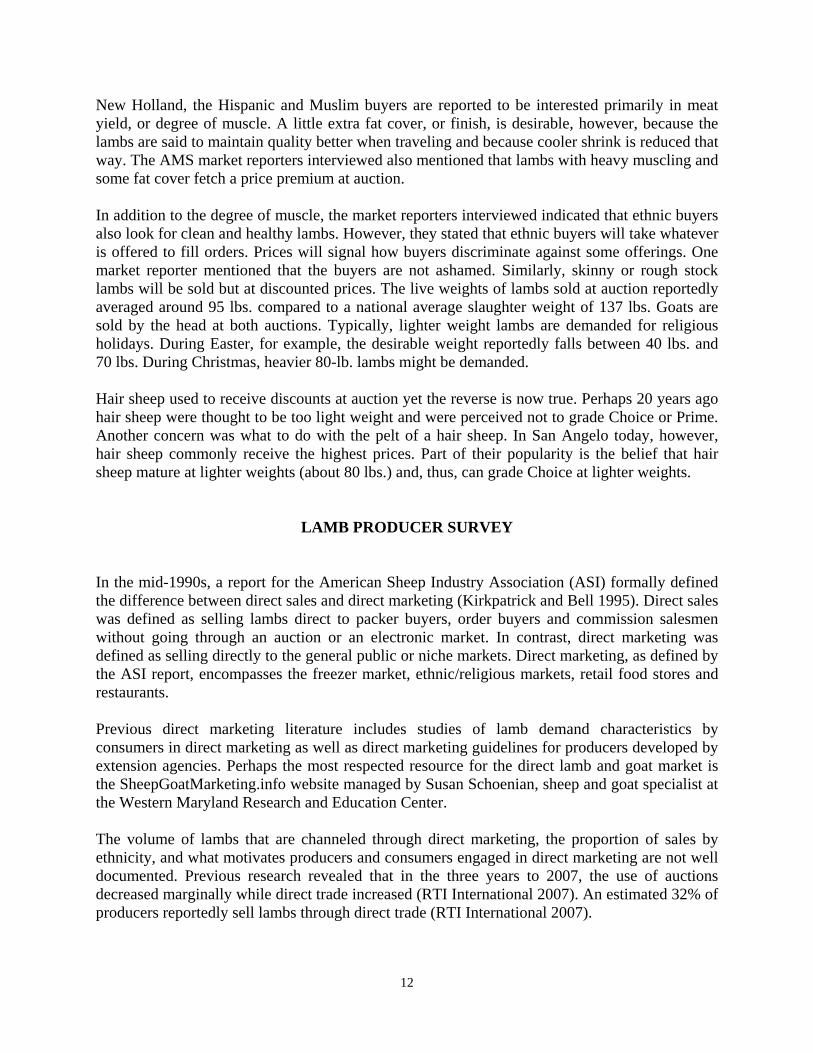
New Holland, the Hispanic and Muslim buyers are reported to be interested primarily in meat yield, or degree of muscle. A little extra fat cover, or finish, is desirable, however, because the lambs are said to maintain quality better when traveling and because cooler shrink is reduced that way. The AMS market reporters interviewed also mentioned that lambs with heavy muscling and some fat cover fetch a price premium at auction. In addition to the degree of muscle, the market reporters interviewed indicated that ethnic buyers also look for clean and healthy lambs. However, they stated that ethnic buyers will take whatever is offered to fill orders. Prices will signal how buyers discriminate against some offerings. One market reporter mentioned that the buyers are not ashamed. Similarly, skinny or rough stock lambs will be sold but at discounted prices. The live weights of lambs sold at auction reportedly averaged around 95 lbs. compared to a national average slaughter weight of 137 lbs. Goats are sold by the head at both auctions. Typically, lighter weight lambs are demanded for religious holidays. During Easter, for example, the desirable weight reportedly falls between 40 lbs. and 70 lbs. During Christmas, heavier 80-lb. lambs might be demanded. Hair sheep used to receive discounts at auction yet the reverse is now true. Perhaps 20 years ago hair sheep were thought to be too light weight and were perceived not to grade Choice or Prime. Another concern was what to do with the pelt of a hair sheep. In San Angelo today, however, hair sheep commonly receive the highest prices. Part of their popularity is the belief that hair sheep mature at lighter weights (about 80 lbs.) and, thus, can grade Choice at lighter weights.
LAMB PRODUCER SURVEY In the mid-1990s, a report for the American Sheep Industry Association (ASI) formally defined the difference between direct sales and direct marketing (Kirkpatrick and Bell 1995). Direct sales was defined as selling lambs direct to packer buyers, order buyers and commission salesmen without going through an auction or an electronic market. In contrast, direct marketing was defined as selling directly to the general public or niche markets. Direct marketing, as defined by the ASI report, encompasses the freezer market, ethnic/religious markets, retail food stores and restaurants. Previous direct marketing literature includes studies of lamb demand characteristics by consumers in direct marketing as well as direct marketing guidelines for producers developed by extension agencies. Perhaps the most respected resource for the direct lamb and goat market is the SheepGoatMarketing.info website managed by Susan Schoenian, sheep and goat specialist at the Western Maryland Research and Education Center. The volume of lambs that are channeled through direct marketing, the proportion of sales by ethnicity, and what motivates producers and consumers engaged in direct marketing are not well documented. Previous research revealed that in the three years to 2007, the use of auctions decreased marginally while direct trade increased (RTI International 2007). An estimated 32% of producers reportedly sell lambs through direct trade (RTI International 2007).

13
Most producers sell lambs into the traditional market although there is an emerging sentiment among industry participants that the nontraditional market is significant and growing. The traditional market encompasses raising lambs through weaning and sometimes backgrounding and then selling the lambs when they reach 30 lbs. to 80 lbs. to a feeder or packer for finishing in a feedlot before slaughtering at an average weight of 136 lbs. The nontraditional lamb market is suspected of siphoning off many potential feeder lambs through auctions and direct sales from producers by primarily ethnic consumers for immediate slaughter.
Objectives and Method
This portion of the research project aimed at validating the anecdotal evidence regarding the significance of the sheep and lamb direct trade and the role of ethnic consumers in this market. This part of the project also delves into the importance of farmers’ markets, the sale of lamb cuts and on-farm slaughter within producers’ direct marketing. More specifically, the objectives for this part of the project include: Estimating the volume of lambs, mutton and goats in the nontraditional market; Profiling direct marketing consumers; and Determining the characteristics of lamb, mutton and goats demanded by producers’
customers. A producer survey was implemented to meet these research objectives. The online survey software Zoomerang was utilized to build and distribute the survey. A total of 20,467 sheep and lamb producers received the survey and 488 responded.2 The response of 488 producers is statistically significant and thus nationally representative of all U.S. producers. Thus, the findings from this survey are generalizations for all sheep and lamb producers.3 The producer survey was comprised of a two-pronged approach to maximize the response rate. Surveys were sent via e-mail as well as through the mail.4 In order to encourage producer response a $1,000 gift card from Home Depot or Lowes was offered in a drawing. The producer survey was comprised of a two-pronged approach to maximize the response rate. Surveys were sent via e-mail as well as through the mail.5 In order to encourage producer response a $1,000 gift card from Home Depot or Lowes was offered in a drawing. 2 Three percent of producers were surveyed. 3 In order to get survey results that reflect the target population of sheep and lamb producers 382 returned surveys were required out of a population of 82,330 sheep and lamb operations. This survey sample size has a confidence interval of 5% which is the plus-or-minus figure usually reported in newspaper or television opinion poll results. For example, if you use a confidence interval of 5% and 25% of your sample picks an answer you can be "sure" that if you had asked the question of the entire relevant population between 20% (25-5) and 30% (25+5) would have picked that answer. The 488 producer responses also ensure a 95% confidence level which tells us how sure we can be in our conclusions. It is expressed as a percentage and represents how often the true percentage of the population who would pick an answer lies within the confidence interval. 4 The value of statistically representative data outweighed concerns about introducing biases into the survey due to different survey methods utilized. 5 The value of statistically representative data outweighed concerns about introducing biases into the survey due to different survey methods utilized.

14
A population of 2,467 American Sheep Industry Association (ASI) members was surveyed via e-mail. This number represented the number of members that had e-mail addresses listed with ASI. The survey was distributed in early October. The e-mail had a link to the Internet site in which producers could access the survey. In early November, the Sheep Industry News was distributed to a broader audience of 18,000 producers that received U.S. Department of Agriculture Wool Loan Deficiency Payments (LDP) in 2008 and 2009. The survey instrument was printed in this issue which could be mailed in if producers chose to participate by mail rather than through the Internet. Producers were also alerted to the Internet site which housed the survey if they chose to take the survey online.
Descriptive Statistics of Surveyed Producers
Among the 488 producers that responded to the survey, 92% sold lambs in the past year, 81% sold adult sheep and 15% sold goats. About 86% of the producer respondents that sold lambs in the past year also sold adult sheep while 15% also sold goats. About 13% of producer respondents were from the Northeast, 42% from the Midwest, 18% from the South, and 27% from the West. By state, 7% of all producer respondents were from Minnesota, 6% from Iowa, 6% from Pennsylvania, 5% from Michigan, 4% from Indiana, 4% from Virginia, 3% were from Maryland, and 2% from West Virginia. The remaining 67% were from a wide variety of other states. The geographic representation of producers surveyed was similar to the actual national distribution but with responses being overrepresented in the Midwest and Northeast and skewed away from the South and West (Table 1). Because the survey was designed to capture the nontraditional lamb, mutton, and goat markets, producers that have invested in nontraditional direct marketing might have self-selected over producers that sell routinely to packer buyers or who take their lambs to auction. The higher response rate for the Midwest may suggest that the Midwest has a higher portion of producers engaged in nontraditional direct marketing than producers in other regions. The survey results suggest that the lamb market is highly fragmented at the producer level with multitudes of different marketing options. One producer reported selling over 2,000 lambs in a year with over 5,000 lbs. of lamb cuts sold from his home and at farmers’ markets. This producer also sold direct to a dozen ethnic buyers and sold over one hundred head to a larger packer. An average 188 lambs were sold by producers engaged in some direct marketing either direct from the farm or through farmers’ markets (Table 2). On average, each responding producer sold 35 adult sheep and 17 goats and allocated 1,137 acres to lamb and sheep and 315 acres to goats. They reported selling to an average 14 different buyers over the past 12 months.
Distribution of Sales by Ethnicity and Species In total, 76% of producers surveyed reported selling lambs to White/Caucasian buyers, 22% to Hispanic or Latino buyers, 17% to Middle Eastern buyers, and 10% to persons of other known

15
Table 1: Survey versus National Distribution of Producers
Producers Surveyed Count Percent Nationally Northeast 62 13% 10% Midwest 202 42% 33% South 87 18% 20% West 132 27% 30% Total 483 (Some producers choose not to include identify residency.) Source: Lamb Producer Survey Results Table 2: Descriptive Statistics of Producers Engaged in Nontraditional Marketing
Sample Size, N=489
Number of lambs sold
Number of adult sheep sold
Number of goats sold
Acres to lamb and sheep
Acres to goats
AUMs (Animal Unit Months)
Number of different buyers
Average 188 35 17 1,137 315 658 14 Minimum 0 0 0 0 0 0 0 Maximum 9,500 1,474 2,273 104,000 39,815 40,034 500 Standard deviation 759 105 148 8,884 3,415 3,065 39
Note: The standard deviation represents how dispersed, or spread out, the values lie from the average. The minimum number of lambs, adult sheep or goats might be zero because producers sold only goats or only lambs or only adult sheep, but no lambs or goats.
ethnicities (Table 3).6 Another 17% sold lambs to persons of unknown ethnicity. However, these numbers include all sales, to packers, auction, etc. The number of direct sales to White/Caucasian buyers is sizable because many buyers bought for consumption but also for breeding purposes, 4-H clubs, for feeders and a couple for research. The motivation for purchases defines the market. For example, adult sheep sales to White buyers were primarily breeding stock while many of the adult sheep sales to Hispanic buyers were for consumption. The survey asked producers whether they believed their buyers were Muslim. Only 3% of producers believed their Hispanic or Latino buyers were Muslim, 17% believed that their Middle Eastern buyers were Muslim, and 2% that their White/Caucasian buyers were Muslim. About 4% of unknown ethnicity was thought to be Muslim and 2% of other, known ethnicity.
6 The known other ethnicities included Native Americans, Africans, Chinese, Korean, Indian, Filipino, Hawaiian, Bosnian, Armenian, Romanian, Russian, Greek, Italian, Saudi Arabian and African American. Italian, Greek, Native American and Africans were mentioned the most.

16
Table 3: Distribution of Sales by Ethnicity and Species Top number is the count of respondents selecting the option. Bottom % is percent of the total respondents selecting the option.
Lamb
Adult Sheep
Goat
Hispanic or Latino 108 22%
44 9%
18 4%
Middle Eastern 82 17%
27 6%
9 2%
White/Caucasian 374 76%
242 49%
49 10%
“Other” known ethnicity 48 10%
17 3%
6 1%
Unknown ethnicity 83 17%
55 11%
15 3%
Note: Columns and rows do not equal. Producers might sell to multiple buyers of different ethnicities. Producers who marketed direct to Middle Eastern consumers were distributed throughout the country, including 11% was from California, 12% from Michigan, 14% from Pennsylvania, 5% from New York and New Jersey, 5% from Washington and another 14% from the central and northern Midwest (Indiana, Illinois, Kansas, Nebraska, Wisconsin, Iowa and Minnesota).
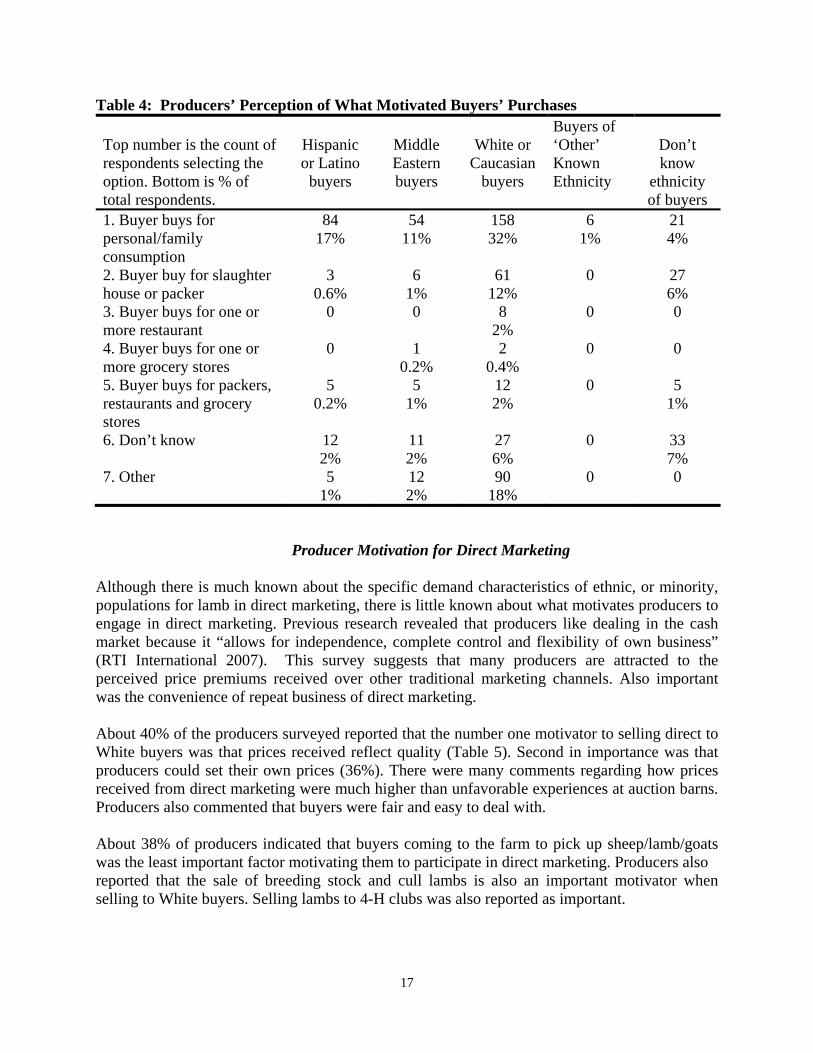
Marketing Channels Producers reported myriad marketing channels. A packer buyer from one of the top lamb packers might come to the farm to negotiate a sale or a family might come to pick out a lamb to stock its freezer. In order to determine the volume of lambs channeled into direct marketing, the producers’ perceptions of what motivated sales was required. Direct marketing does not include a sale to a packer buyer that likely ends up in the traditional, commercial market. About 32% of producers believed their White consumers were buying for family or personal use, 17% of producers believed this of their Hispanic buyers, 11% of Middle Eastern buyers, 4% of buyers of unknown ethnicity and 1% believed this was the case for buyers of ‘other’, known ethnicity (Table 4). About 16% of producers surveyed believed that their White buyers were buying for a packer, restaurant or grocery store (Table 4). This was the case for 2% of Middle Eastern buyers and nearly 1% of Hispanic or Latino buyers. The ‘other’ factor that producers believed motivated sales to Hispanic buyers was that buyers buy not only for own consumption but also for resale to friends as well as for breeding. The “other” reason that producers believed motivated sales to Middle Eastern buyers was that buyers buy for own consumption but also to resell to friends (mentioned by 5 producers). Among the 18% of producers that reported that White/Caucasian buyers buy for “other” reasons included 12% of producers (58 producers) who reported that buyers buy sheep and lambs for breeding stock and Future Farmers’ of America 4-H Clubs.
17
Table 4: Producers’ Perception of What Motivated Buyers’ Purchases Top number is the count of respondents selecting the option. Bottom is % of total respondents.
Hispanic or Latino
buyers
Middle Eastern buyers
White or
Caucasian buyers
Buyers of ‘Other’ Known Ethnicity
Don’t know
ethnicity of buyers
1. Buyer buys for personal/family consumption
84 17%
54 11%
158 32%
6 1%
21 4%
2. Buyer buy for slaughter house or packer
3 0.6%
6 1%
61 12%
0 27 6%
3. Buyer buys for one or more restaurant
0 0 8 2%
0 0
4. Buyer buys for one or more grocery stores
0 1 0.2%
2 0.4%
0 0
5. Buyer buys for packers, restaurants and grocery stores
5 0.2%
5 1%
12 2%
0 5 1%
6. Don’t know 12 2%
11 2%
27 6%
0 33 7%
7. Other 5 1%
12 2%
90 18%
0 0
Producer Motivation for Direct Marketing Although there is much known about the specific demand characteristics of ethnic, or minority, populations for lamb in direct marketing, there is little known about what motivates producers to engage in direct marketing. Previous research revealed that producers like dealing in the cash market because it “allows for independence, complete control and flexibility of own business” (RTI International 2007). This survey suggests that many producers are attracted to the perceived price premiums received over other traditional marketing channels. Also important was the convenience of repeat business of direct marketing. About 40% of the producers surveyed reported that the number one motivator to selling direct to White buyers was that prices received reflect quality (Table 5). Second in importance was that producers could set their own prices (36%). There were many comments regarding how prices received from direct marketing were much higher than unfavorable experiences at auction barns. Producers also commented that buyers were fair and easy to deal with. About 38% of producers indicated that buyers coming to the farm to pick up sheep/lamb/goats was the least important factor motivating them to participate in direct marketing. Producers also reported that the sale of breeding stock and cull lambs is also an important motivator when selling to White buyers. Selling lambs to 4-H clubs was also reported as important.

18
Table 5: What Motivated Sales to White Buyers (1=most important motivator) Top number is the count of respondents selecting the option. Bottom is % of total respondents selecting the option.
1
2
3
4
5
Total
Price received reflects quality
82
40%
52
25%
22
11%
29
14%
22
11%
207
Buyers approached me for the trade.
39
20%
36
19%
40
21%
37
19%
39
20%
191
Buyer comes to my farm to pick up sheep/lambs.
24
12%
34
17%
38
19%
26
13%
74
38%
196
Buyer provides repeat business.
63
28%
59
26%
53
23%
33
14%
21 9%
229
I can set my own prices.
102 36%
44
16%
52
18%
44
16%
40
14%
282
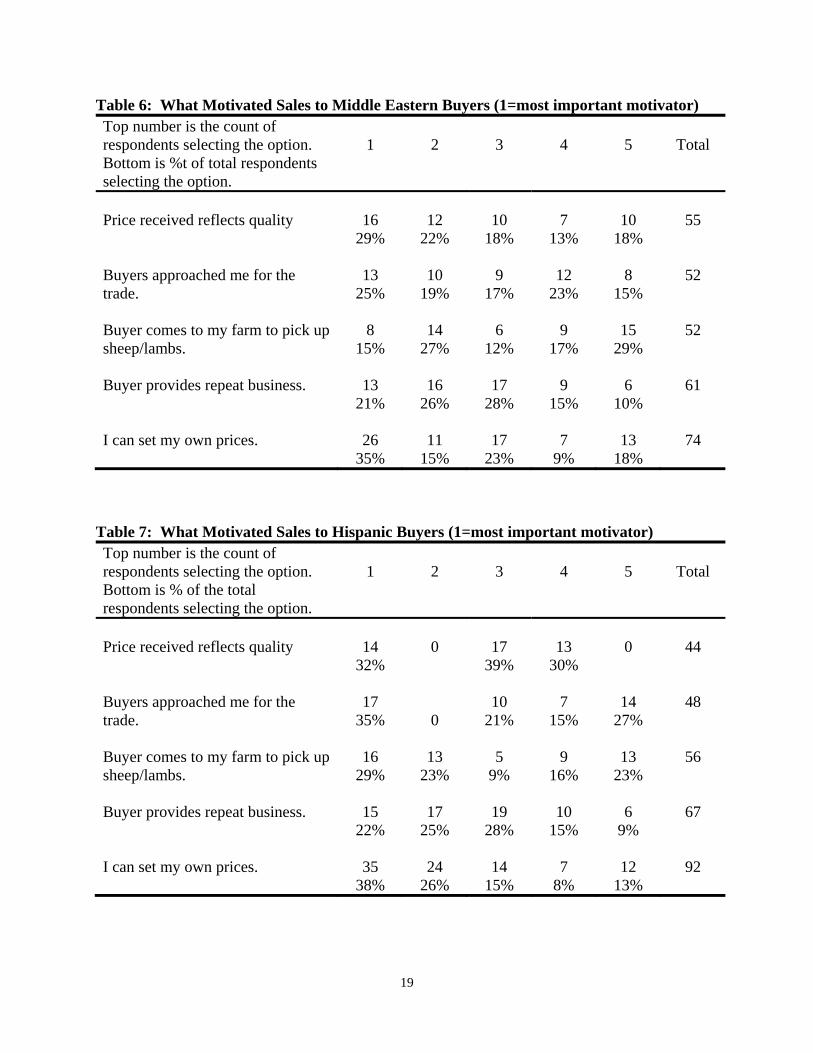
Over one-third of producers (35%) surveyed responded that being able to set their own prices when selling to Middle Eastern buyers was an important motivator (Table 6). Nearly one-third of producers agreed that Middle Eastern buyers coming to pick up the livestock is the least important motivator (29%). The most important factors motivating direct marketing to Hispanic producers included an ability to set your own prices (38%), price received reflects quality (32%) and buyers coming to the farm to pick up the sheep, lambs or goat (29%) (Table 7). Producers were nearly spilt regarding the importance of buyers approaching producers with 35% indicating this to be the most motivating factor while 27% indicating it to be the least important. Producers also cited other reasons for selling to Hispanic buyers including a “deal for Hispanic farm workers” and good holiday sales. A few producers commented that selling to Hispanic or Latinos was a great cull sheep market. There was also a sense among producers that selling to Hispanics was a good way to get rid of sheep that were not wanted.
Nontraditional Market Lamb Weights According to the U.S. Department of Agriculture, nearly 60% of marketed lambs in 2009 were under 65 lbs. and 21% were between 65 lbs. and 84 lbs. (USDA 2009). Most of the 80% of lambs marketed under 84 lbs. go into feedlots for finishing while an unknown volume are channeled into the nontraditional market for slaughter. It is well documented that niche markets and ethnic consumers prefer lighter weight lambs over the average 68-lb. carcasses processed for traditional marketing channels. Direct marketing might include 60-lb. to 90-lb. lambs sold to
19
Table 6: What Motivated Sales to Middle Eastern Buyers (1=most important motivator) Top number is the count of respondents selecting the option. Bottom is %t of total respondents selecting the option.
1
2
3
4
5
Total
Price received reflects quality
16
29%
12
22%
10
18%
7
13%
10
18%
55
Buyers approached me for the trade.
13
25%
10
19%
9
17%
12
23%
8
15%
52
Buyer comes to my farm to pick up sheep/lambs.
8
15%
14
27%
6
12%
9
17%
15
29%
52
Buyer provides repeat business.
13
21%
16
26%
17
28%
9
15%
6
10%
61
I can set my own prices.
26
35%
11
15%
17
23%
7
9%
13
18%
74
Table 7: What Motivated Sales to Hispanic Buyers (1=most important motivator) Top number is the count of respondents selecting the option. Bottom is % of the total respondents selecting the option.
1
2
3
4
5
Total
Price received reflects quality
14
32%
0
17
39%
13
30%
0
44
Buyers approached me for the trade.
17
35%
0
10
21%
7
15%
14
27%
48
Buyer comes to my farm to pick up sheep/lambs.
16
29%
13
23%
5
9%
9
16%
13
23%
56
Buyer provides repeat business.
15
22%
17
25%
19
28%
10
15%
6
9%
67
I can set my own prices.
35
38%
24
26%
14
15%
7
8%
12
13%
92

20
Muslims for own consumption or lambs sold direct to restaurants that are heavier, up to 100 lbs. (Table 8). The average live weight of federally inspected (FI) slaughter in the past few years has hovered around 139 lbs. The survey revealed that lambs sold through direct marketing ranged from an average 71 lbs. minimum to a high of 124 lbs. Williams et al. (2008) reported that a defining factor for the “alternative and emerging markets” is that the desired weight range is from about 51-88 lbs. compared to the average live weight of 140 lbs. Indeed, the nontraditional market demands lighter weight lamb but perhaps not as lightweight as previously reported. Producers indicated that Middle Eastern buyers appear to prefer relatively lighter weight lambs while White/Caucasian buyers typically prefer lambs that are a little heavier but still not up to the average FI slaughter weight (Table 9). Producers also indicated that the average lamb weight desired by Middle Eastern buyers was 81 lbs. (Figure 4). However, they reported a wide distribution of weights of lambs sold to Middle Eastern buyer from less than 25 lbs. up to about 160 lbs. About 44% of Middle Eastern buyers bought lambs 81 lbs. and lighter and 56% bought lambs heavier than 81 lbs.
Valuation Method An area for further research is whether the valuation method of lambs, per head or live weight, offers higher returns for quality. A common perception is that selling live weight rewards weight and not necessarily quality. Previous research reveals that 76% of small producers sell on a live weight basis while 25% sell on a per head basis. In contracts, 53% of large producers sell on a live weight basis while 13% sell on a per head basis (RTI International 2007). Selling by carcass weight, on or not on a grid, was popular with half of the large producers. Sales into nontraditional markets as reported by the producers responding to the survey do not differ widely from the national study cited earlier. About 24% of producers that sold lamb said they were sold by the head, 30% reported by the lb., and 46% said both. Some 42% of producers selling adult sheep reported selling by the head, 27% by the lb., and 31% used both.
Marketing Lamb Cuts
Some producers choose to add value to their sheep and lamb operation by selling lamb cuts. A producer might advertise and sell from home or take a freezer to a farmers’ market. About 18% reported selling lamb cuts with the loin the most popular cut according to 46% of producers, followed closely by the leg according to 37% of producers. About 28% of producers ranked the shoulder as the third most popular selling cut. Only 15% of producers placed the rack as their number-one seller and 42% of producers placed it fourth. Ground lamb was also very popular, followed by stew meat, bratwurst, kabobs, sausage, lamb fries, burgers, shank and chops. On average, producers reported selling 1,996 lbs. of lamb cuts through November 2009 with a maximum of 88,000 lbs. At an average live weight of 100 lbs., this volume of lamb cuts amounts to an average of 20 head per producer.
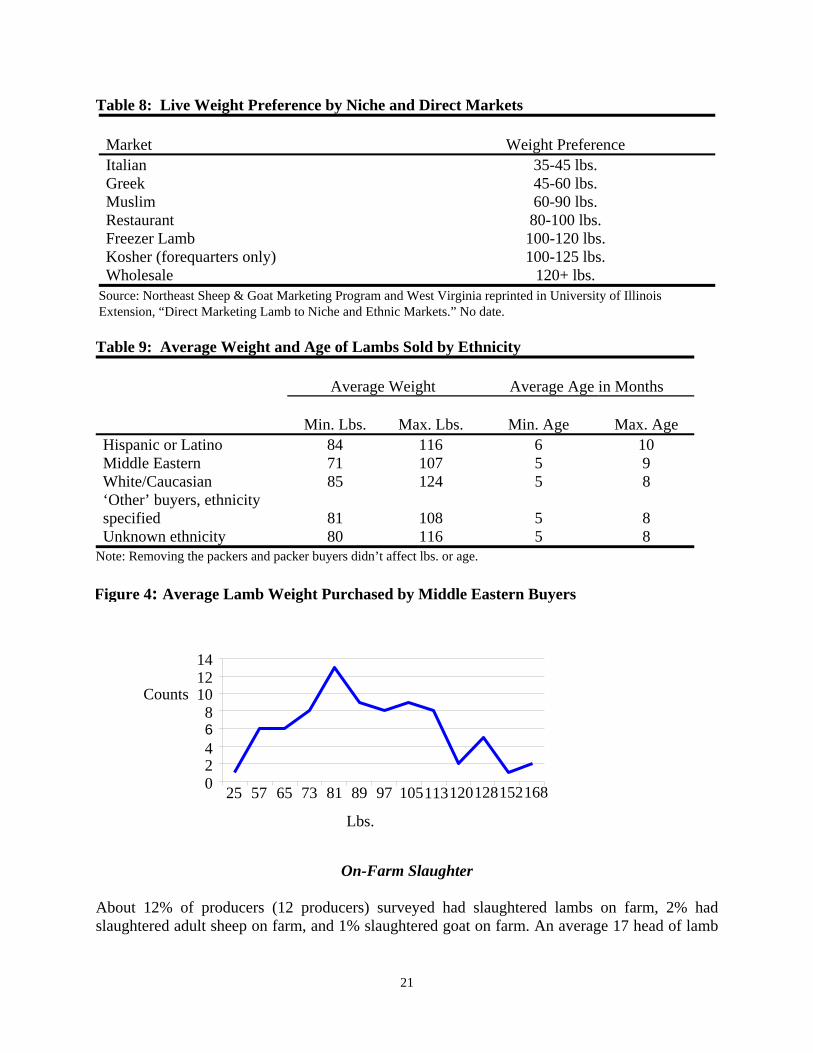
21
Table 8: Live Weight Preference by Niche and Direct Markets Market
Weight Preference
Italian 35-45 lbs. Greek 45-60 lbs. Muslim 60-90 lbs. Restaurant 80-100 lbs. Freezer Lamb 100-120 lbs. Kosher (forequarters only) 100-125 lbs. Wholesale 120+ lbs.
Source: Northeast Sheep & Goat Marketing Program and West Virginia reprinted in University of Illinois Extension, “Direct Marketing Lamb to Niche and Ethnic Markets.” No date. Table 9: Average Weight and Age of Lambs Sold by Ethnicity
Average Weight
Average Age in Months
Min. Lbs.
Max. Lbs.
Min. Age
Max. Age
Hispanic or Latino 84 116 6 10 Middle Eastern 71 107 5 9 White/Caucasian 85 124 5 8 ‘Other’ buyers, ethnicity specified 81 108 5 8 Unknown ethnicity 80 116 5 8
Note: Removing the packers and packer buyers didn’t affect lbs. or age.
Figure 4: Average Lamb Weight Purchased by Middle Eastern Buyers
On-Farm Slaughter About 12% of producers (12 producers) surveyed had slaughtered lambs on farm, 2% had slaughtered adult sheep on farm, and 1% slaughtered goat on farm. An average 17 head of lamb
0 2 4 68
10 12 14
25 57 65 73 81 89 97 105113120128152168
Lbs.
Counts

22
were slaughtered on farm per producer. The liveweight of lambs ranged from 101 lbs. to 131 lbs. Average lamb age ranged from 6 to 9 months. Among all producers surveyed, 3% reported selling lambs to Hispanic or Latino buyers for on farm slaughter; 6% to White/Caucasian buyers, 2% to Middle Eastern buyers, and another 2% to other ethnicities defined as Asian, Croatian, and African (among which, Kenyan) while only 2% believed their on-farm slaughter customers were Muslim. According to the producer survey, 86% of on farm slaughter was purchased by families for personal/family consumption, 6% was sold to packer or packer buyers, 2% was sold to one or more restaurants, and 6 percent to ‘other’ buyers (restaurants, grocery stores and religious organizations). About 41% of the producers surveyed who indicated that they slaughter on-farm reported that they were motivated to do so because they can set their own price that way (Table 10). Another 39% said they were motivated to slaughter on-farm by the fact that price received reflected quality. Other reasons cited were the need for cash, providing lamb where lamb was not available in local stores, and providing lamb for holidays. According to 62% of the producers surveyed, meat yield was the number one factor desired by lamb buyers from their on-farm slaughter (Table 11). The second most important factor was “cleanliness” with 32% of producers ranking this factor as most important. Third in importance was “fat”, with 24% of producers ranking it number one. Over one-third of respondents ranked “female” as the least important factor affecting buyers’ selection decision.
Farmers’ Markets About 10% of lamb producers reported selling lamb, mutton or goat at farmers’ markets in the past year. About 5% reported selling lambs and 3% selling adult sheep at farmers’ markets. Only 1 producer reported selling goats. Producers that indicated that they sell at farmers’ markets sold an average 52% of their total direct lamb sales that way over the last year. Five producers (1.25%) sold 100% of their total lambs sales at farmers’ markets. According to the survey, producers sold an average 35 head of lambs through farmers’ markets in the last year with a weight range of 82 lbs. to 120 lbs. and ranging from 6 months to 9 months of age (Table 12). Many of these lambs likely go direct for personal or family consumption although this cannot be confirmed. An average of 25 adult sheep was sold at farmers’ markets by responding producers over the last year. The weights ranged from 132 lbs. to 205 lbs. while the average age ranged from 2 years to 7 years. The responding producers also sold an average 20 goats at farmers’ markets in the last year, ranging from 80 lbs. to 90 lbs. and 8 to 11 months in age. Among buyers at farmers’ markets, producers believed 53% were White, 22% were Hispanic, 20% were Middle Eastern, and 5% were of unknown backgrounds. About 15% believed their buyers were Muslim.

23
Table 10: What Motivated On Farm Slaughter Sales (1=the most important motivator) Top number is the count of respondents selecting the option. Bottom is % of total respondents selecting the option.
1
2
3
4
5
Total
Price received reflects quality 13 39%
7 21%
6 18%
5 15%
2 6%
33
Buyers approached me for the trade.
5 16%
5 16%
7 23%
7 23%
7 23%
31
Buyer comes to my farm to pick up sheep/lambs.
5 19%
4 15%
5 19%
4 15%
9 33%
27
Buyer provides repeat business. 4 11%
16 42%
7 18%
8 21%
3 8%
38
I can set my own prices. 16 41%
5 13%
6 15%
5 13%
7 18%
39
Table 11: Characteristics of Lamb Demanded by On Farm Slaughter Customers (1=the most important motivator)
Top number is the count of respondents selecting the option. Bottom is % of total respondents selecting the option.
1
2
3
4
5
6
7
Total
Meat yield 13 62%
0 4 19%
2 10%
2 10%
0 0 21
Blemish free, sexually intact and not docked
1 4%
4 15%
3 12%
6 23%
2 8%
2 8%
8 31%
25
Milk Fed 3 13%
0 0 2 8%
4 17%
8 33%
7 29%
24
Clean 10 32%
10 32%
9 29%
1 3%
1 3%
1 3%
0 32
Fat 8 24%
5 15%
5 15%
6 18%
5 15%
2 6%
2 6%
33
Male 2 9%
3 13%
2 9%
7 30%
5 22%
4 17%
0 23
Female 1 3%
0 1 3%
3 10%
7 23%
7 23%
11 37%
29
Table 12: Description of Lamb Sales through Farmers’ Markets
No. of head Min. Lbs. Max Lbs.
Min. Age in Months
Max Age in Months
35 82 120 6 9 1 32 54 3 4
175 150 210 10 18 41 29 38 2 3
24
Adult Sheep Market There is anecdotal evidence that ethnic populations have built a new market for culled sheep that traditionally were exported live to Mexico. This survey revealed that many adult sheep are sold for breeding purposes to White/Caucasian buyers but that many adult sheep are sold to Hispanic or Latino buyers for direct consumption. The survey revealed that 49% of producers sold adult sheep to White buyers, 11% to buyers of unknown ethnicity, 9% to Hispanic buyers, 6% to Middle Eastern buyers, and 3% to other, known ethnicities. About 3% of producers (13 producers) sold adult sheep through farmers’ markets while 2% (10 producers) sold adult sheep through on-farm slaughter. An average 27 adult sheep were sold to White buyers -- primarily for breeding and 23 adult sheep were sold, on average, to Hispanic buyers – primarily for consumption (Table 13). Hispanic consumers bought adult sheep up to 224 lbs. live weight.
Goat Market The survey revealed that 10% of producers sold goats to White buyers, 3% to buyers of unknown ethnicity, 4% to Hispanic buyers, 2% to Middle Eastern buyers, and 1% to other, known ethnicities. Only one producer sold goats through a farmers’ market. Only 1% (5 producers) reported slaughtering goats on farm. The most goats (70 head) were bought, on average, by consumers of unknown ethnicity (Table 14). The second largest consumers were the Hispanic or Latino population. On average, Hispanic consumers bought 50 head of goats weighing from 53 lbs. to 109 lbs. ranging from 6 to 19 years.
Estimating the Nontraditional Market Volume from the Farm Gate The difference between USDA annual lamb crop and federally-inspected slaughter data suggests that about 1.2 million lambs are sold annually into the nontraditional market. The survey of producers enabled us to get a second and more accurate estimate, an estimate derived from marketing activities at the farm gate. In order to estimate the volume of the nontraditional market, the sales incidence through different marketing channels must be estimated. The percent of producers selling direct to individuals for own consumption, the portion of farmers’ market sales, on-farm slaughter and sale of lamb cuts are all considered nontraditional market sales. In order to estimate the direct market volume, the average number of lambs sold to buyers for personal or family consumption was multiplied by the percent of producers reporting such sales and then totaled. The estimated volume for the nontraditional market is based upon producer sales direct to buyers for own or family consumption. Sales to buyers on behalf of packers were not counted. The survey results suggest that many of the producer sales to White/Caucasian packer buyers might go into the traditional market while the ethnic buyers buying for packers, restaurants or grocery stores likely go into the nontraditional market. However, this distinction cannot be confirmed and, thus, were not counted in the estimated volume. For example, one producer reported selling 600 head of lambs to Hispanic or Latino buyers in the past year and believed that the buyer was supplying a packer, restaurants, and grocery stores. It is unknown whether these lambs went into the traditional or nontraditional market. An average 937 lambs in the past year were sold by producers to White/Caucasian packers or packer buyers. This transaction is lambs likely

25
Table 13: Adult Sheep Sales Average
Head of Adult Sheep
Sold
Live Weight Age
Min. Lbs.
Max Lbs.
Min. Years
Max. Years
Hispanic 23 165 224 3 6 Middle Eastern 18 135 195 2 6 White/Caucasian 27 150 210 2 6 Other, known ethnicity
16
140
180
3 6
Unknown ethnicity 12 142 204 3 8 Table 14: Goat Sales
Average Head of
Goats Sold
Live Weight Age
Min. Lbs.
Max Lbs.
Min. Years
Max. Years
Hispanic 50 53 109 6 19 Middle Eastern 21 47 104 6 34 White/Caucasian 20 47 98 6 19 Other, known ethnicity
No responses.
Unknown ethnicity 70 46 88 5 18 channeled into the traditional lamb market and was not counted toward the estimated volume of the nontraditional market. On average, the survey results revealed that producers sold 21 lambs through the year ending November 2009 for customers for personal or family use. Producers sold an average 20 lambs to White consumers, 28 lambs to Middle Eastern consumers, 14 lambs to Hispanic consumers, 36 lambs to consumers of unknown ethnicity and an average 5 lambs to persons of other, known ethnicity (Table 15). As shown earlier in this section, 77% of producers reported selling lambs direct to White customers and within this number, 31% reported selling lambs direct to White customers for their own/family consumption. Given an average sale in a year of 20 lambs and 82,330 sheep and lamb operations in 2008, (USDA 2008) this totals 510,446 lambs channeled into the nontraditional market through White consumers (Table 16). Doing the same calculation for other ethnicities reveals that an estimated one million lambs (995,370 head) sold direct from producers to consumers from the farm in 2009 (Table 16). This equals 48% of federally inspected lamb and yearling slaughter in 2008 of 2.3 million head (LMIC 2009). Over half of all direct marketing from the farm were purchased by White buyers (51%), 21% by Middle Eastern buyers, 19% by Hispanic or Latino buyers and 9% by unknown ethnicities.

26
Table 15: Average Number of Lambs Sold by What Motivated Buyers’ Purchases
Hispanic or Latino buyers
Middle Eastern buyers
White or Caucasian buyers
Buyers of ‘Other’ Known Ethnicity
Don’t know ethnicity of buyers
1. Buyer buys for personal/family consumption
14 lambs
28 lambs
20 lambs
5 lambs
36 lambs
2. Buyer buy for slaughter house or packer
4 lambs
125 lambs
937 lambs
0 lambs
53 lambs
3. Buyer buys for one or more restaurant
0 lambs
0 lambs
47 lambs
0 lambs
0 lambs
4. Buyer buys for one or more grocery stores
0 lambs
125 lambs
300 lambs
0 lambs
0 lambs
5. Buyer buys for packers, restaurants and grocery stores
600 lambs
75 lambs
300 lambs
0 lambs
135 lambs
6. Don’t know
43 lambs
204 lambs
74 lambs
0 lambs
37 lambs
7. Other
10 lambs
100 lambs
111 lambs
0 lambs
0 lambs
Table 16: Estimated Number of Lambs Sold Direct for Personal/Family Use Ethnicity of Buyers
Number of Lambs
Percent of Total
Hispanic or Latino
184,419 19%
Middle Eastern
207,472 21%
White/Caucasian
510,446 51%
Other, known ethnicity
4,117 0%
Unknown ethnicity
88,916 9%
Total Estimate
995,370
100%
In 2000, there was an estimated 1.2 million persons in the United States with Arab ancestry (Census Bureau 2003). This equates to 0.4% of the total population and yet, 23% of purchases of direct lamb sales were by persons of Middle Eastern origin according to the producers surveyed. The U.S. Arab population increased 41% in the 1980s and 38% in the 1990s to 1.2 million in 2000 (Census Bureau 2003). Arabs are distributed across the United States but the

27
largest numbers of Arab population were found to reside in (in order) New York, Dearborn, Michigan, and Los Angeles. Chicago was fourth and Houston was fifth. About 30% of the population of Dearborn was Arab in 2000. Among the ten cities in the U.S. with a population of 100,000 or more Arabs, three cities were in Michigan. Within the estimate of 1 million head in direct marketing, producers sell through farmers’ markets, through on-farm slaughter and also sell lamb cuts. About 5% of producers reported selling lambs through farmers’ markets and sold an average 35 head within the year. This means an estimated 144,078 head of lambs sold through farmers’ markets in the past year, or 13% of total direct marketing were through farmers’ markets. About 12% of producers (12 producers) reported slaughtering lambs on farm with an average head count of 17 lambs in the past year. Given these estimates, the total estimate for the number of lambs slaughtered on farm in the year to November 2009 was 167,953 head. About 18% of producers also sold lamb cuts with an average estimate of 20 head per annum. Given 82,330 producers in the U.S., this yields 296,388 head a year.
ETHNIC LAMB CONSUMER SURVEY Average annual per capita lamb consumption in the United States is less than 1 lb. per person. However, national figures can be misleading because lamb is consumed fairly consistently by a small group of consumers. While most Americans do not eat lamb, there is great geographic variation in consumption as well as differences in the significance of lamb in diets across different races and ethnicities. Many ethnic populations are reported to have a higher incidence of eating lamb than the non-Hispanic White race (FMI 2009). Recent research shows that 20% of consumers can be considered “lamb consumers,” defined as those who have prepared lamb at home within the past 12 months or those who eat lamb but do not prepare it in their homes (Gross 2007). Additionally, 35% of consumers have never eaten lamb, only 13% have prepared lamb at home during the past three months, and 16% no longer eat lamb. Anecdotal evidence from producers, findings from the Nielsen lamb retail scanner data (Williams and Capps 2005), and FMI research (2009) findings reveal that the changing make-up of the U.S. population in terms of race and ethnicity is an important factor for understanding lamb consumption and demand. Americans are becoming more diverse in terms of race and ethnicity and, as a result, there has been a growth in the size of the minority population in terms of both numbers and percentage. The most significant change since 1990 both statistically and demographically has been the rapid growth of the Hispanic population and to a much lesser extent the Asian population. Hispanics have replaced African-Americans as the nation’s largest minority. While many minority groups eat lamb on a day-to-day basis, the Jewish and Muslim populations are of particular interest to the sheep and lamb industry because lamb is the preferred meat in celebration of religious holidays. The Jewish minority comprises of 1.7% of the U.S. population while the Muslim population comprises about 0.6% (Pew 2007). Lamb is often preferred for the

28
estimated 5 million Jews during Passover in the spring and again during Rosh Hashanah in the early fall. Lamb is important for the estimated 1.8 million Muslims during two periods of the year. The first is during the month of Ramadan and on Eidu al-fitr, during the first day of the month following Ramadan. Second, lamb is preferred for Eidu al-adha which occurs during the last month of Islamic calendar and is in celebration of the annual Hajj. The Islamic Hijri calendar does not follow the Gregorian calendar. Consequently, the Islamic holidays fall on different dates on the Gregorian calendar every year. People of both the Jewish and Muslim faiths have specific demands for lamb. People of the Jewish faith who maintain a kosher diet require that animals with cloven hooves like lambs be slaughtered under strict supervision and with specific instructions. Similarly, Muslims prefer Halal lamb which requires that the animal’s throat to be slit and all blood drained in addition to a Muslim prayer and turning the animal’s head toward Mecca. Determining the volume of lamb and marketing channels associated with ethnic groups can help target promotional programs which, in turn, can increase lamb demand. There are three objectives of this study regarding the consumer and retail end of the nontraditional market: Profile consumers in the nontraditional lamb, mutton and goat markets by studying
consumption patterns by the ethnic population; Determine marketing channels utilized by ethnic consumers; and Estimate the volume of lamb consumed by the U.S. ethnic population.
Review of Lamb Consumption Literature
The demographics and frequency of lamb consumption are already known for U.S. lamb consumers. This study is aimed at improving the understanding of the frequency of lamb consumption specifically by the minority and ethnic populations. Several studies have analyzed the demographics and incidence of lamb consumption, typically funded by the American Lamb Board. For example, from a survey of 500 respondents, Shugoll Research (2009) reported that two-thirds of consumers claimed that they never purchase lamb. Only 4% of consumers reported that they purchase lamb once a week or more often and only 38% of consumers prepare lamb in a typical month. Another study by the FMI (2009) concluded that about one-quarter of shoppers (27%) have eaten lamb in the past 12 months. Further, the study found that Hispanic shoppers are much more likely than Caucasian shoppers to eat lamb (37% versus 24%, respectively). The FMI also found that the youngest and the oldest shopper groups are the most likely to have consumed lamb with male Matures (age 65 and up) the most likely to have consumed lamb at 46% (2009). Another study by Williams and Capps (2005) revealed that 18% of Oriental households prepare lamb at home, 15% of Black households, and 11% of White and ‘Other’ households.

29
Research Method A consumer survey was utilized to determine the volume of lamb consumed by ethnic groups and the demand and shopping characteristics of ethnic lamb consumers. The survey utilized Zoomerang, an online survey software which has access to over 2 million customers that have already agreed to take Zoomerang surveys. Zoomerang’s detailed profiling of consumers by ethnicity provided a good partner for this study. The survey attempted to target ethnic groups including those of the Muslims and Jewish religions. The survey respondents were subject to four separate tiers of filtering: 1. The total population was first broken down by current ethnic ratios in the United States,
except the race category “White”; 2. Respondents in the “White” race category were added to the survey sample only if the
background or descent was also Hispanic or Latino; 3. Survey respondents were included in the sample if the primary and secondary languages
spoken at home included Arab, Hebrew, Eastern European languages, Asian Indian languages and others7; and
4. Lastly, only survey respondents indicating that they had eaten lamb, mutton or goat in the past year were included in the survey.
The survey, conducted in November 2009, consisted of a sample of 410 lamb, mutton or goat consumers who met the race and language requirements. The sample was selected from the qualified population to represent the total lamb-consuming minority population over demographic factors such as region, age, gender and income. Thus, for example, the number of men versus women in the sample matched the ratio in the entire minority U.S. population. In summary, the survey sample included all races (except for the Non-Hispanic or Latino White race) and those in the Non-Hispanic or Latino White race category who speak specified foreign languages at home.
Ethnic Consumer Survey Results Zoomerang surveyed a total of 878 consumers of which, 47% or 410 answered, yes, they have eaten lamb, mutton or goat in the past year. The incidence of minority lamb consumers among a profile of minority or foreign speaking consumers is 43% (Figure 5).8 The incidence of minority lamb consumers is higher than cited in previous literature, around 24% for all Americans. of survey respondents. The response of minority lamb consumers was 52% in California, 60% in New York, 43% in New Jersey and 44% in Texas.
7 Languages included were Arabic, Hebrew, Czech, Greek, Gujarati, Hindi, Hungarian, Indonesian, Icelandic, Macedonian, Malay, Nepali, Punjabi, Romanian, Sanskrit, Serbo-Croatian, Slovak, Slovenian, Telugu, Turkish, Ukrainian, and Other. 8 Incidence is 47% for consumers that had eaten lamb, mutton or goat in the past year.
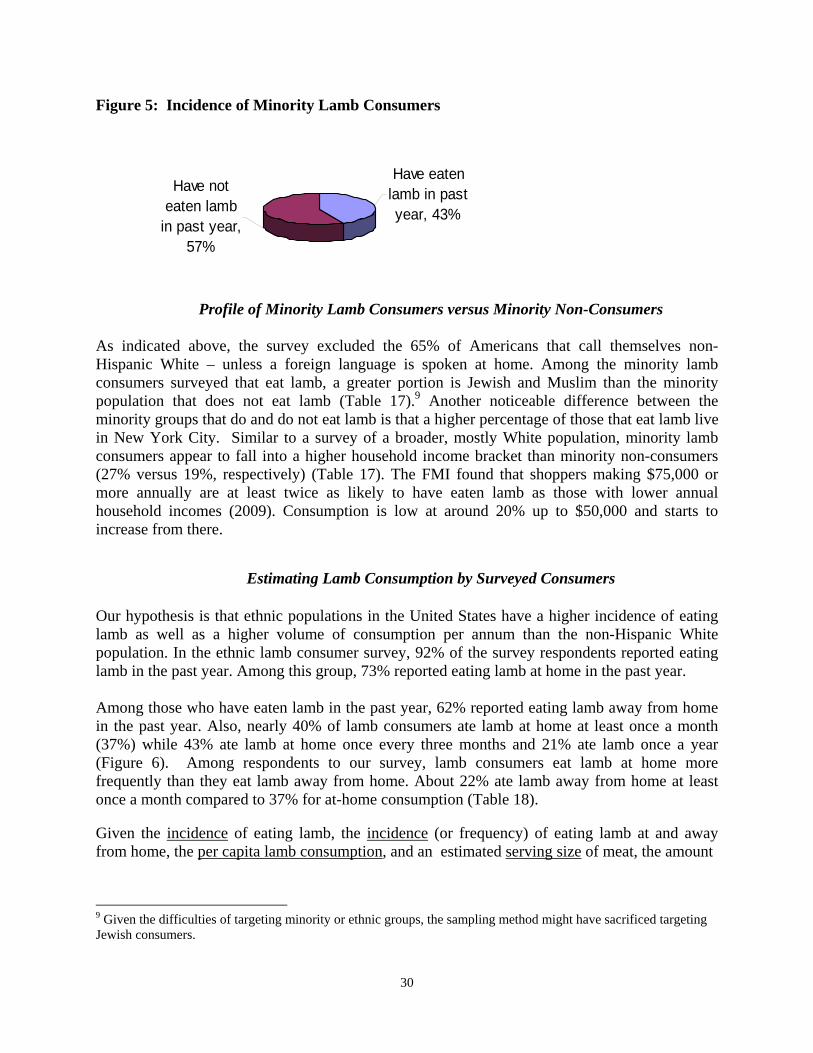
30
Figure 5: Incidence of Minority Lamb Consumers
Have not eaten lamb
in past year, 57%
Have eaten lamb in past year, 43%
Profile of Minority Lamb Consumers versus Minority Non-Consumers
As indicated above, the survey excluded the 65% of Americans that call themselves non-Hispanic White – unless a foreign language is spoken at home. Among the minority lamb consumers surveyed that eat lamb, a greater portion is Jewish and Muslim than the minority population that does not eat lamb (Table 17).9 Another noticeable difference between the minority groups that do and do not eat lamb is that a higher percentage of those that eat lamb live in New York City. Similar to a survey of a broader, mostly White population, minority lamb consumers appear to fall into a higher household income bracket than minority non-consumers (27% versus 19%, respectively) (Table 17). The FMI found that shoppers making $75,000 or more annually are at least twice as likely to have eaten lamb as those with lower annual household incomes (2009). Consumption is low at around 20% up to $50,000 and starts to increase from there.
Estimating Lamb Consumption by Surveyed Consumers Our hypothesis is that ethnic populations in the United States have a higher incidence of eating lamb as well as a higher volume of consumption per annum than the non-Hispanic White population. In the ethnic lamb consumer survey, 92% of the survey respondents reported eating lamb in the past year. Among this group, 73% reported eating lamb at home in the past year. Among those who have eaten lamb in the past year, 62% reported eating lamb away from home in the past year. Also, nearly 40% of lamb consumers ate lamb at home at least once a month (37%) while 43% ate lamb at home once every three months and 21% ate lamb once a year (Figure 6). Among respondents to our survey, lamb consumers eat lamb at home more frequently than they eat lamb away from home. About 22% ate lamb away from home at least once a month compared to 37% for at-home consumption (Table 18). Given the incidence of eating lamb, the incidence (or frequency) of eating lamb at and away from home, the per capita lamb consumption, and an estimated serving size of meat, the amount
9 Given the difficulties of targeting minority or ethnic groups, the sampling method might have sacrificed targeting Jewish consumers.

31
Table 17: Descriptive Statistics of Minority Consumers that Had and Had Not Eaten Lamb, Mutton and Goat in the Past Year Had eaten lamb, mutton,
goat in the past year. Sample size = 410
Screen outs: Had not eaten lamb, mutton, goat in the past year. Sample size =
468 Hispanic or Latino ethnicity 24% 19% African American race 20% 29% Muslim religion 2% 0% Jewish religion 5% 2% 1 or 2 people live in the household
56% 58%
Californian resident 20% 16% New York resident 13% 7%
Male 49% 44% 41 to 65 year olds 61% 65%
Household income between $50,000 and $75,000
21% 24%
Household income between $75,000 and $125,000
27% 19%
Figure 6: Distribution and Frequency of At Home Lamb Consumption
of lamb consumed per survey respondent can be estimated. According to the U.S. Department of Agriculture Food Pyramid: “A serving of meat is about two or three ounces, or about the size of a deck of cards.” The survey revealed that 43% of minority consumers eat lamb. Also, among ethnic consumers that eat lamb, 73% ate lamb at home in the past year and 62% ate lamb away from home in the past year. Survey results also revealed that the survey respondents consumed 3.25 lbs. of lamb per person annually at home and 2.37 lbs. of lamb per person annually away from home.
3% 9%
25%
43%
21%
0% 10% 20% 30% 40%50%
More thanonce a
Once aweek
Once amonth
Onceeverythree
months
Once ayear
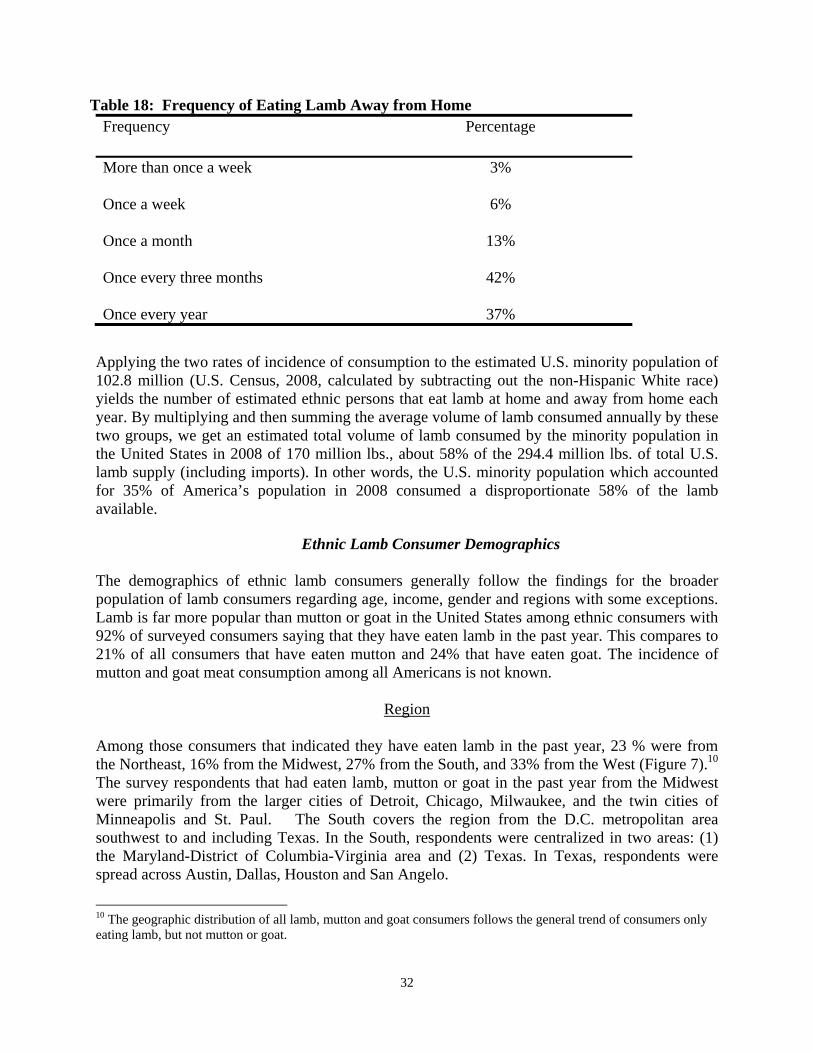
32
Table 18: Frequency of Eating Lamb Away from Home
Applying the two rates of incidence of consumption to the estimated U.S. minority population of 102.8 million (U.S. Census, 2008, calculated by subtracting out the non-Hispanic White race) yields the number of estimated ethnic persons that eat lamb at home and away from home each year. By multiplying and then summing the average volume of lamb consumed annually by these two groups, we get an estimated total volume of lamb consumed by the minority population in the United States in 2008 of 170 million lbs., about 58% of the 294.4 million lbs. of total U.S. lamb supply (including imports). In other words, the U.S. minority population which accounted for 35% of America’s population in 2008 consumed a disproportionate 58% of the lamb available.
Ethnic Lamb Consumer Demographics The demographics of ethnic lamb consumers generally follow the findings for the broader population of lamb consumers regarding age, income, gender and regions with some exceptions. Lamb is far more popular than mutton or goat in the United States among ethnic consumers with 92% of surveyed consumers saying that they have eaten lamb in the past year. This compares to 21% of all consumers that have eaten mutton and 24% that have eaten goat. The incidence of mutton and goat meat consumption among all Americans is not known.
Region
Among those consumers that indicated they have eaten lamb in the past year, 23 % were from the Northeast, 16% from the Midwest, 27% from the South, and 33% from the West (Figure 7).10 The survey respondents that had eaten lamb, mutton or goat in the past year from the Midwest were primarily from the larger cities of Detroit, Chicago, Milwaukee, and the twin cities of Minneapolis and St. Paul. The South covers the region from the D.C. metropolitan area southwest to and including Texas. In the South, respondents were centralized in two areas: (1) the Maryland-District of Columbia-Virginia area and (2) Texas. In Texas, respondents were spread across Austin, Dallas, Houston and San Angelo.
10 The geographic distribution of all lamb, mutton and goat consumers follows the general trend of consumers only eating lamb, but not mutton or goat.
Frequency Percentage
More than once a week 3%
Once a week 6%
Once a month 13%
Once every three months 42%
Once every year 37%

33
Figure 7: Geographic Distribution of Minority Lamb Consumers
About 20% of minority lamb consumers resided in California. Within that state, 60% were from southern California (L.A. area and south to the border) with the remaining 30% from the San Francisco and Sacramento regions. Minority lamb consumers were disproportionately represented in California given that the state accounts for only 7% of the U.S. minority population (i.e., population excluding non-Hispanic white race) (Census Bureau 2009). Although 12% of the total U.S. population, minorities are the majority in California. In 2000, the U.S. Census reported that non-Hispanic Whites were a minority in California with 47% of the population (CBS News 2001). Hispanics accounted for one in three Californians and Asians accounted for 11% of the population. About 13% of the consumers surveyed were from New York and another 4% from New Jersey. Nearly 5% of survey participants were from New York City with the remaining New Yorkers spread across the state. Minority lamb consumers were disproportionately from New York given that the state only represents 3% of the total U.S. minority population (Census Bureau 2009). New York is ethnically and racially diverse. In 2005, nearly 46% of the population spoke a language other than English at home and 36% of its population was foreign born (New York City Department of City Planning 2005). Mutton consumers differ from lamb and goat consumers in that a greater share of mutton consumers are found in the Midwest than in the Northeast. About 16% of mutton consumers resided in the Northeast, 19% in the Midwest, 36% in the South and 29% in the West. The portion of the population consuming goat was less in the Midwest than for lamb or mutton. About 30% of goat meat was consumed in the Northeast, 9% in the Midwest, 34% in the South, and 28% in the West.
Ethnicity and Religion
A total of one-quarter of the minority lamb consumers in the survey indicated they were of Hispanic or Latino in descent, 18% were White of Hispanic or Latino descent while some specified Mexico or other Hispanic or Latino (Figure 8). About 20% of minority lamb consumers in the survey reported they are African American are were primarily from New York and New Jersey (17%) while 8% were from Texas, 8% from Illinois, 7% from North Carolina and 5%
0%
10%
30%
40%
Northeast Midwest South West
Lamb Mutton Goat meat
20%
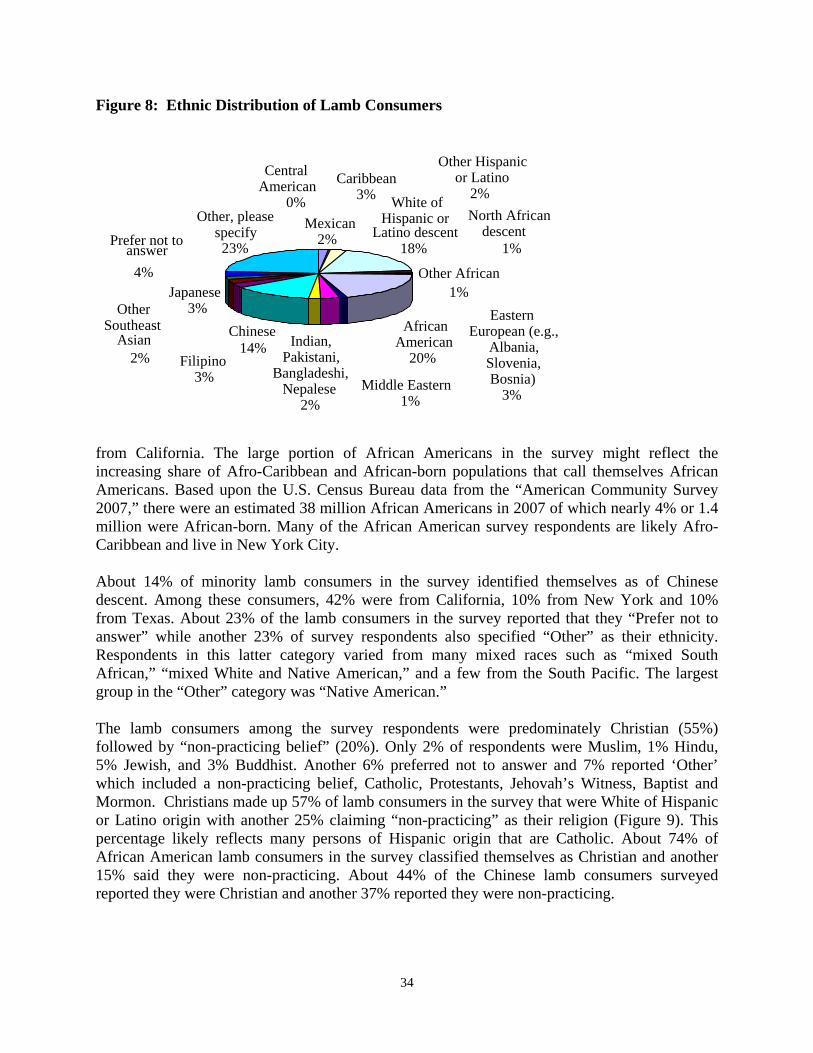
34
Figure 8: Ethnic Distribution of Lamb Consumers
from California. The large portion of African Americans in the survey might reflect the increasing share of Afro-Caribbean and African-born populations that call themselves African Americans. Based upon the U.S. Census Bureau data from the “American Community Survey 2007,” there were an estimated 38 million African Americans in 2007 of which nearly 4% or 1.4 million were African-born. Many of the African American survey respondents are likely Afro-Caribbean and live in New York City. About 14% of minority lamb consumers in the survey identified themselves as of Chinese descent. Among these consumers, 42% were from California, 10% from New York and 10% from Texas. About 23% of the lamb consumers in the survey reported that they “Prefer not to answer” while another 23% of survey respondents also specified “Other” as their ethnicity. Respondents in this latter category varied from many mixed races such as “mixed South African,” “mixed White and Native American,” and a few from the South Pacific. The largest group in the “Other” category was “Native American.” The lamb consumers among the survey respondents were predominately Christian (55%) followed by “non-practicing belief” (20%). Only 2% of respondents were Muslim, 1% Hindu, 5% Jewish, and 3% Buddhist. Another 6% preferred not to answer and 7% reported ‘Other’ which included a non-practicing belief, Catholic, Protestants, Jehovah’s Witness, Baptist and Mormon. Christians made up 57% of lamb consumers in the survey that were White of Hispanic or Latino origin with another 25% claiming “non-practicing” as their religion (Figure 9). This percentage likely reflects many persons of Hispanic origin that are Catholic. About 74% of African American lamb consumers in the survey classified themselves as Christian and another 15% said they were non-practicing. About 44% of the Chinese lamb consumers surveyed reported they were Christian and another 37% reported they were non-practicing.
Mexican2%
Chinese 14%
Other African1%
AfricanAmerican
20%
Middle Eastern 1%
North African descent
1%
Other Hispanic or Latino
2%White of
Hispanic or Latino descent
18%
Indian,Pakistani,
Bangladeshi, Nepalese
2%
Japanese 3%
Filipino 3%
Other Southeast
Asian 2%
Prefer not to answer
4%
Central American
0%
Caribbean3%
Other, please specify 23%
Eastern European (e.g.,
Albania, Slovenia,Bosnia)
3%

35
Figure 9: Religious Identification of Lamb Consumers Surveyed
At the outset we hoped that the consumer survey would pick up more persons of Muslim and Jewish faith than was the case given the common understanding that lamb is the preferred meat choice for both faiths in the observance of religious holidays. In 2008, the Muslim population in the U.S. was an estimated 1.3 million persons or 0.6% of the total population (Kosmin and Keysar 2009). The Jewish population in 2008 was estimated at 2.7 million people, 1.2% of the total. While only 2% of our survey respondents reported being Muslim and 5% Jewish, 6% reported that they eat lamb for Muslim holidays (as shown later). Many Muslims may have chosen “prefer not to answer” when selecting ethnicity creating a downward bias in the percentage of the survey who were Muslim. In any case, the higher percentages of Muslims and Jews represented in the survey indicate that the survey did a good job focusing specifically on the lamb consumers among those populations.
Income
Similar to the profile of lamb consumers across the country, the survey results indicate that ethnic lamb consumers fall into the higher income categories. About 65% of ethnic lamb consumers earn a household income of over $50,000 per year while 35% of ethnic lamb consumers earn less than $50,000 per year (Figure 10). Lamb consumption is often considered to be positively correlated with income levels. Shugoll Research (2009) reported that consumers with household incomes over $50,000 are much more likely to purchase lamb at home in any given month. FMI (2009) reported that shoppers making $75,000 or more annually are at least twice as likely to have eaten lamb as those with lower annual household incomes. Consumption is low at around 20% up to $50,000 and starts to increase from there.
The fact that minority lamb consumers also fall into higher income brackets was an unexpected result. The working hypothesis was that average household income would be lower for ethnic consumers because tradition is often considered to be the main demand driver in ethnic lamb consumption. However, ethnic lamb consumption is relatively more constant among different income levels relative to a broader population of White lamb consumers. The survey revealed that 16% of ethnic lamb consuming households earn over $125,000 per annum, 27% earn between $75,000 and $125,000, 22% earn $50,000 to $75,000 and 35% earn less than $50,000 per annum (Figure 10).
Buddhist, 3%
Christian, 55%
Prefer not to answer, 6% Other, 7%
Non- practicing,
20%
Jewish, 5%
Hindu, 1%Muslim, 3%
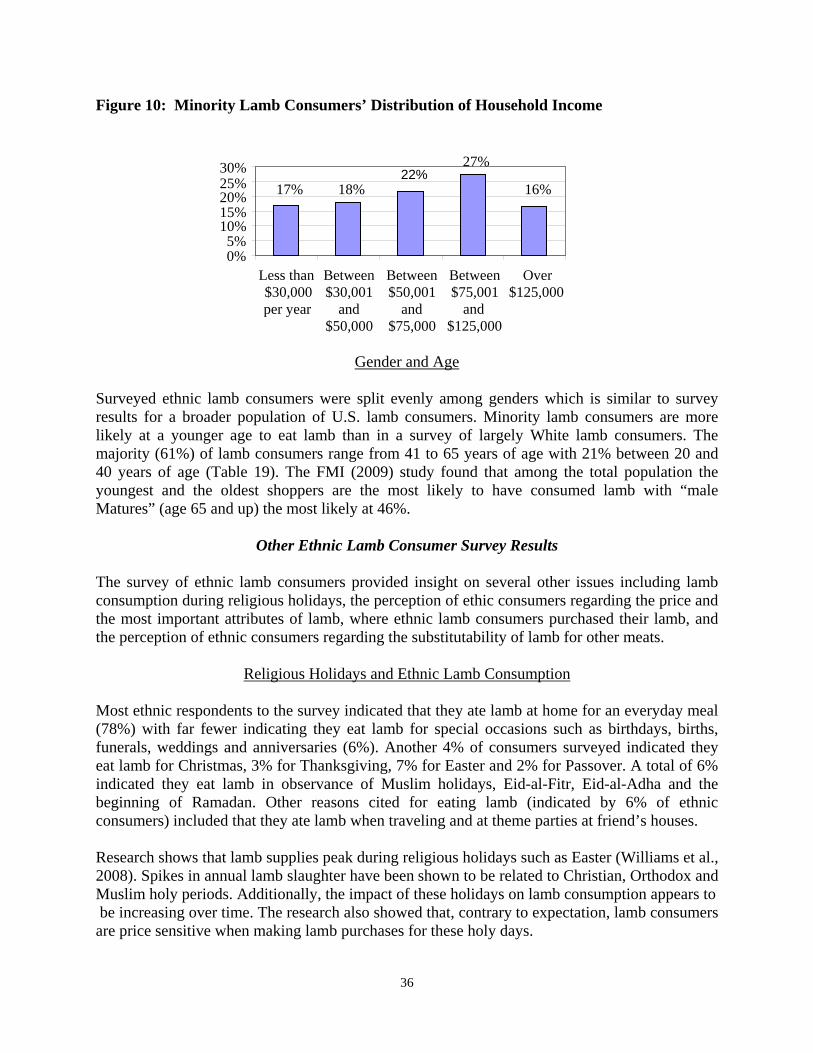
36
Figure 10: Minority Lamb Consumers’ Distribution of Household Income
Gender and Age
Surveyed ethnic lamb consumers were split evenly among genders which is similar to survey results for a broader population of U.S. lamb consumers. Minority lamb consumers are more likely at a younger age to eat lamb than in a survey of largely White lamb consumers. The majority (61%) of lamb consumers range from 41 to 65 years of age with 21% between 20 and 40 years of age (Table 19). The FMI (2009) study found that among the total population the youngest and the oldest shoppers are the most likely to have consumed lamb with “male Matures” (age 65 and up) the most likely at 46%.
Other Ethnic Lamb Consumer Survey Results
The survey of ethnic lamb consumers provided insight on several other issues including lamb consumption during religious holidays, the perception of ethic consumers regarding the price and the most important attributes of lamb, where ethnic lamb consumers purchased their lamb, and the perception of ethnic consumers regarding the substitutability of lamb for other meats.
Religious Holidays and Ethnic Lamb Consumption Most ethnic respondents to the survey indicated that they ate lamb at home for an everyday meal (78%) with far fewer indicating they eat lamb for special occasions such as birthdays, births, funerals, weddings and anniversaries (6%). Another 4% of consumers surveyed indicated they eat lamb for Christmas, 3% for Thanksgiving, 7% for Easter and 2% for Passover. A total of 6% indicated they eat lamb in observance of Muslim holidays, Eid-al-Fitr, Eid-al-Adha and the beginning of Ramadan. Other reasons cited for eating lamb (indicated by 6% of ethnic consumers) included that they ate lamb when traveling and at theme parties at friend’s houses. Research shows that lamb supplies peak during religious holidays such as Easter (Williams et al., 2008). Spikes in annual lamb slaughter have been shown to be related to Christian, Orthodox and Muslim holy periods. Additionally, the impact of these holidays on lamb consumption appears to be increasing over time. The research also showed that, contrary to expectation, lamb consumers are price sensitive when making lamb purchases for these holy days.
17% 18% 22%
27%
16%
0% 5%
10% 15% 20% 25% 30%
Less than $30,000 per year
Between$30,001
and$50,000
Between$50,001
and$75,000
Between$75,001
and $125,000
Over $125,000

37
Table 19: Distribution of Lamb Consumers by Age Age range Percent
Less than 20 years 1% 21 to 40 years 28% 41 to 65 years 61% Over 65 years 11%
Perception of Price and Availability of Lamb
Overwhelmingly, lamb consuming survey respondents indicated that they perceived lamb to be competitively priced, consistent, good in quality and have good availability (Table 20). Among these attributes, availability received the lowest score (56%). About one third of the lamb consuming survey respondents reported that lamb availability was not good. About two thirds had no opinion or felt that the availability of halal and kosher lamb did not apply to them. About 20% disagreed that the availability of halal and kosher lamb was good while 16% said that the availability was very good.
Locations Where Lamb is Purchased Nearly 60% of lamb consumers in the survey reported that they purchased lamb from a grocery store. Another 22% reported the lamb came from Wal-Mart, Sam’s Club, or Costco. Another 38% bought lamb at “Other” grocery stores excluding natural and ethnic grocery stores. Natural grocery stores such as Whole Foods accounted for the purchases of 8% of lamb consumers and ethnic grocery stores for another 8%. About 13% of lamb consumers in the survey reported purchasing their lamb from butchers at meat markets. The remaining sources for lamb purchases included friends or relatives (2%) and farmers’ markets (2%). Only 1% indicated that they purchased lamb direct from a farmer and had it slaughtered at a packing plant. Another 3% did not know where the lamb came from and 5% reported “Other” sources, including lamb purchased from an online meat store and from a U.S. Army commissary. When asked why lamb purchases were made at their particular location, 51% of lamb consuming respondents responded “convenience”. Low cost (35%), freshness (35%), selection (34%) and quality (34%) ranked about equally important in consumers’ lamb purchasing decisions. When lamb-consuming respondents were asked whether they mostly eat domestic or imported lamb, 44% responded U.S., 14% responded imported and 42% responded that they didn’t know. When asked why they consumed imported lamb, 71% responded that domestic lamb was not available while 13% responded that the quality of domestic product was inferior and 12% reported that the price was too high. Other responses included quality was not consistent (4%) and travel in other countries where U.S. lamb was not available. Nearly two-thirds (61%) of lamb consuming respondents who indicated that they eat lamb away from home purchased the lamb at a formal or casual sit-down restaurant. Eating lamb at a friend’s or relative’s house came in at a distant second (21%) with another 6% at a fast-food

38
Table 20: Consumer Perception of Lamb Price and Attributes
Agree Disagree
No Opinion or Doesn’t Apply
Lamb was competitively priced 60%
29%
11%
Lamb quality was very good 77% 18% 5%
Quality was consistent 77% 17% 7%
Availability was good 56% 33% 12%
Availability of halal lamb was very good
16% 20% 64%
Availability of kosher lamb was very good
16% 20% 64%
restaurant, 3% at a food kiosk or vending cart, 3% at an entertainment venue, and about 1% at “Other” venues such as cruises.
Perceived Substitutability of Lamb, Mutton, and Goat Meat for Other Meats
The survey responses suggested that there is some degree of substitution of meats among ethnic in consumers with nearly one-quarter of ethnic lamb consumers also eating goat meat or mutton. About 23% of lamb consumers also ate goat meat and 21% of lamb consumers also reported eating mutton. About 11% of surveyed lamb consumers also ate mutton and goat. If lamb is not available or priced too high, the ethnic lamb consuming respondents most often picked beef as the substitute of choice. Chicken was the second most popular choice. In the case of the unavailability of lamb, 41% of lamb consuming respondents indicated that they would purchase beef instead, 20% would purchase chicken instead, 16% pork, 11% fish or seafood, 5% goat or veal and 3% mutton. If lamb is priced too high, 34% of lamb consuming respondents indicated they would buy beef instead, 30% chicken, 14% pork, 11% fish or seafood, 4% goat or veal and 3% picked mutton.
Ethnic Retail Goat Consumption About 24% of the ethnic consumers surveyed indicated that they had eaten goat meat in the past year compared to 92% that had eaten lamb and 21% that had eaten mutton in the past year. A majority of goat consuming respondents (63%) indicated that they eat goat meat for no particular occasion, for an everyday meal. More than 17% of ethnic consumers eat goat meat in observance of Muslim holidays, 5% eat goat meat during the beginning of Ramadan, 7% for Eid-al-Fitr, 5% for Eid-al-Adha, 2% for Passover, 4% for Easter, 2% for Christmas, and 4% for Thanksgiving. Only 10% of consumers indicated that they choose goat meat for birthdays, births, funerals,

39
weddings and anniversaries while 18% reported eating goat meat for other occasions such as while traveling overseas, at a friend’s house, or at restaurants. Overall, with respect to their most recent experience eating goat meat, 59% of respondents reported that the goat meat was competitively priced, 72% that the quality was very good, 67% reported that the quality was consistent, and 54% said the availability was good. Over half of respondents did not feel the availability of halal goat meat was an issue (54%). The same was the case for the availability of kosher goat meat with 57% reporting that availability was a nonissue. If goat meat was not available, the respondents reported that they choose beef as their first choice for a substitute (26%) with chicken the second choice (19% each) followed by pork (17%). If goat meat was priced too high, 26% of respondents said they choose beef instead, 21% chicken, 19% pork, 17% lamb, 9% fish or seafood, 4% mutton, and 4% veal. American goat meat is fairly well recognized as being American. About 53% of respondents reported eating U.S. goat meat while only 6% (or 6 respondents) said they ate imported goat meat. However, 41% said they did not know the origin of the goat meat they eat. About 67% of respondents reported that they eat imported goat meat because domestic goat meat is not available. One-half of consumers reported that the reasoning for not eating U.S. goat meat was that the price is too high. One-third of respondents felt that the quality of U.S. goat meat is inferior so they purchase imported goat. Goat meat is primarily consumed outside the home according to the survey respondents. On a per capita basis, however, they reported that more goat meat is consumed at home. About 46% of respondents had eaten goat meat at home in the past year and 70% had consumed goat meat away from home. Goat consuming respondents reported an average annual consumption of 2.86 lb per person at home and 2.02 lb per person away from home. Among the sources of goat meat consumed at home, the survey respondents indicated that 27% was purchased from a meat market/butcher shop and 24% from an ethnic grocery store. There were multiple reasons for the choice of the locations for purchasing goat meat including freshness (47% of consumers), convenience (44%), low cost (42%), selection (36%), and quality (27%). Among the 98 consumers that had eaten goat meat in the past year, 70% reported eating goat meat away from home in the past year. When eating goat meat away from home, the most popular venue was a casual or formal sit-down restaurant (39%) followed by a friend’s or relative’s house 36%, and then fast food restaurants (12%). About 42% of goat meat consuming respondents reported eating goat once a year, 29% once every three months, 20% once a month, and 8% at least once a week.
Ethnic Retail Mutton Consumption Among the 410 consumers surveyed, 21% had eaten mutton in the last year. Mutton was the choice of meal for “no particular occasion/an everyday meal” for 62% of the respondents. Just over half (51%) of the respondents thought that the availability of mutton was good. This compares to 56% for lamb consuming respondents and 54% for goat consuming respondents. Over two thirds of mutton consuming respondents thought that the mutton was competitively

40
priced, 72% reported that the quality was good, and 73% said that quality was consistent. Over half of mutton consuming respondents thought that the availability of Halal mutton was not an issue (54%) and 58% that the availability of Kosher mutton was not an issue. If mutton was not available mutton consuming respondents mostly picked beef as the next best substitute (27%) and then fish or seafood (16%), lamb (14%), goat meat (13%), chicken (12%), pork (11%) and veal (7%). If mutton was priced too high, then 23% of mutton consuming respondents switched to beef, followed by fish or seafood (18%), pork (16%), lamb (13%), chicken (12%), goat meat (10%) and veal (4%). Just under two-thirds of mutton consuming respondents reported eating U.S. mutton while 8% said the mutton was imported, and one-third reported that they did not know the origin. Overwhelmingly, mutton consuming respondents said that U.S. mutton was priced too high as the reason why imported product was chosen (71%). The majority (59%) of mutton consuming respondents ate mutton at home in the past year while 55% of mutton consuming respondents ate mutton at least once a month, 29 % every three months, and 16% once a year. Mutton was reportedly purchased from Wal-Mart, Sam’s Club or Costco by 20% of respondents. “Other grocery stores” (not including ethnic or natural grocery stores) accounted for 22% of respondents’ answers, and another 22% said the mutton came from a butcher/meat market. Three individuals purchased the mutton from a farmers’ market and one purchased it live from a farmer and had it processed at a slaughter facility. Convenience was the most popular reason for deciding upon where to purchase mutton (51% of responses). Low cost and freshness ranked evenly as the second most popular reason (41% each) followed by selection (37%) and quality (29%). Four people indicated that they like to select a live animal as the reason for their choice of where to source mutton. About 69% of mutton consuming respondents reported eating mutton away from home. More than two-thirds of mutton consuming respondents (68%) ate mutton away from home at least once every three months to once a year, 13% at least once a week, and 19% once a month. While more mutton consuming respondents ate mutton away from home than at home, they reported eating a lower volume away from home. About 55% of mutton consuming respondents ate mutton at home with an average annual per capita consumption of 4.35 lbs. However, 69% of mutton consuming respondents ate mutton away from home with an average annual consumption of 2.58 lbs. per person. Nearly one-half (48%) of mutton consuming respondents ate mutton at a casual or formal sit-down restaurant, 38% at a friend’s or relative’s house, 7% at a fast food restaurant, and 3% at a fair, trade show or other entertainment venue.

41
MARKETING STRATEGIES TO ENHANCE INDUSTRY PROFITABILITY SUGGESTED BY THE RESEARCH RESULTS
The research suggested a number of strategies for marketing lamb to nontraditional markets that could enhance industry profitability. Six key strategies for marketing to nontraditional markets suggested by the research include the following: Marketing Strategy #1: Create opportunities to divert lambs from nontraditional markets into traditional, commercial market channels. Most producers would likely suggest that they would prefer benefiting from marketing directly to nontraditional markets rather than selling to those markets through packers. However, the fact is that the large volume of lambs currently going into nontraditional markets now is not benefitting from the efficiencies, scale of operation and infrastructure currently in place in traditional market channels. As a result, the future growth of traditional markets could well be impeded by the lack of efficient slaughter, distribution and infrastructure to facilitate the growth. One consequence could be a growing number of ethnic consumers buying imported lamb because of the unavailability of domestic lamb to meet their needs. Traditional market channels may well allow a larger number of producers to take advantage of and benefit from this quickly growing market segment and limit the erosion of ethnic consumers to imported lamb over time. Marketing Strategy #2: Increase ethnic group awareness and purchase frequency by promoting the specific characteristics of American lamb that they value. The survey results indicated that the critical attributes of lamb that they value most when buying lamb include: the meat yield, grass fed, healthy, “natural,” consistency, local, and comes from a trusted source and availability. These then are the targets for advertising and promotion campaigns for selling an increased volume of American lamb to ethnic consumers. By informing ethnic consumers of the superiority of American lamb with regard to these specific attributes, ethnic consumers are more likely to search for and demand American over imported lamb and over other competing meats. Marketing Strategy #3: Enhance ethnic consumer awareness of the availability of American lamb. When minority lamb consuming respondents were asked whether they eat domestic or imported lamb, 44% responded American lamb, 14% responded imported and 42% responded that they did not know. When those who eat imported lamb were asked why they did so, an overwhelming majority (71%) responded that domestic lamb simply was not available. Advertising and promotion to educate ethnic consumers on where and how they can access American lamb could be an important strategy to enhance the ethnic consumption of and loyalty to American lamb. Industry efforts to improve the availability of lamb to this rapidly growing segment of the population are also needed.

42
Marketing Strategy #4: Target ethnic lamb sales geographically. The survey results indicated that a disproportionate number of lamb consumers live in California and New York. While California is home to 20% of the lamb consuming survey respondents with southern California accounting for 12% of the respondents, California is home to only 7% of the U.S. minority population (all ethnicities excluding non-Hispanic white race). Also, New York is home to 13% of the ethnic lamb consumers surveyed but accounts for only 3% of the total U.S. population. Targeting ethnic market advertising and promotion dollars to these areas will likely maximize the bang for each buck spent on this market segment. Marketing Strategy #5: Target retail over foodservice sales to ethnic consumers. Nearly 75% of ethnic lamb consumers indicated they eat lamb at home with 37% indicating they eat lamb at least once a month. Thus, despite the growing trend toward away-from-home consumption for many food products and even lamb, most ethnic consumers continue to eat lamb at home. Thus, promoting lambs sales at retail could be the most effective way of spending ethnic promotion dollars. Marketing Strategy #6: Target mainstream grocery stores in marketing lamb to ethnic consumers. Among the 75% of ethnic consumers indicating that they eat lamb at home, about 60% reported that they purchase their lamb from mainstream grocery stores. When asked why they purchase lamb at grocery stores, “convenience” was the most popular response given followed in equal importance by low cost, selection, freshness and quality. So despite the perhaps prevailing perception that the lamb consumed by ethnic groups comes from live animals they purchase and custom slaughter, in fact nearly two-thirds shop for their lamb in mainstream grocery stores. The implication is that targeting mainstream grocery stores frequented by ethnic consumers could enhance the effectiveness of lamb promotions to ethnic groups. Obviously, these six strategies should be designed to work together for maximum effectiveness. Other results of the survey should also be taken into account such as the apparent price sensitivity of ethnic consumers even when buying for special occasions and special holidays. Because ethnic lamb shoppers have relatively lower incomes than other lamb consuming groups, cost could be a factor in the choice of many to buy lamb at grocery stores rather than at more specialty ethnic or natural grocers or even from butchers.
WHAT’S THE FUTURE FOR ETHNIC LAMB CONSUMPTION? While the increase in population growth will surely increase lamb demand, the ethnic composition of that growth will likely accelerate lamb consumption in the future. According to the Pew Research Center (2008), if current trends continue, ethnic populations in the U.S. are estimated to grow exponentially while the non-Hispanic White population grows only marginally. The U.S. Census Bureau reported that minorities, now roughly one-third of the U.S.

43
population, are expected to become the majority in 2042, with the nation projected to be 54% minority in 2050. The Pew Research Center estimated that by 2050, the White population will shrink from 67% of the population to 47%; the Hispanic population will grow from 14% to 29%; the Blacks will hold at about 13%; and Asians will grow from 5% to 9% (2008:2). If these growth rates hold, then lamb consumption could grow exponentially given the results of this survey on the incidence of lamb consumption among ethnic groups. According to the U.S. Census Bureau (Census Bureau 2008), by 2050, the minority population (everyone except for non-Hispanic, single-race whites) is projected to be 235.7 million out of a total U.S. population of 439 million. Also according to the U.S. Census Bureau, the greatest rate of growth by ethnicity will be the Hispanic population followed by Asian Americans. The African American population is also expected to grow but at a somewhat lower rate. Given an estimated 235.7 million minority population in 2050 and the survey findings, we can calculate an estimated volume of lamb consumption by the minority populations in 2050. Recall that the estimated ethnic lamb consumption incidence rate, based on our survey results, is 43 %. The annual per capita consumption of lamb eaten at home is estimated at 3.25 lbs. and away from home at 2.37 lbs. Thus, an estimated 240 million lbs. will be consumed at home by ethnic groups and 329 million lbs. will be consumed away from home by those groups for a grand total of 569 million lbs. of projected lamb consumption by persons of ethnic backgrounds. In 2008, domestic commercial lamb and mutton production totaled 173.8 million lbs. and lamb and mutton imports totaled 183.3 million lbs. for a total availability of 357.1 million lbs. Thus, lamb consumption by ethnic groups in 2050 is expected to surpass current lamb availability by 60%. This estimate is conservative given that the non-Hispanic white population will likely adopt more international cuisine, including lamb, over time. Additionally, as the minority population increases, so will the portion of the ethnic working population that can choose lamb as a meal. The greater portion of working age ethnic populations in the total will also accelerate lamb consumption. According to the U.S. Census Bureau, the percentage of the population in the “working ages” of 18 to 64 is projected to decline from 63% in 2008 to 57% in 2050. However, the working-age population is projected to become more than 50% minority in 2039 and be 55% minority in 2050 (up from 34% in 2008). Also in 2050, the working-age population is projected to be more than 30% Hispanic (up from 15% in 2008), 15 % black (up from 13% in 2008) and 9.6% Asian (up from 5.3% in 2008). According to the Pew Research Center (2009), the rise of consumers expressing no religious preference has been one of the most important trends on the American religious scene since 1990. Although the overall rate of growth of those expressing no religious preference slowed after 2001, the numbers offering a specific self-identification as Agnostic or Atheist rose markedly from over one million in 1990 to about 3.6 million in 2009. This suggests that religion will become less of a factor for marketing lamb in traditional markets. This may be less of a concern among Muslim and Jewish populations, however, since the observance of many Muslim and Jewish holidays and a long tradition of frequent lamb consumption will likely continue to encourage the slaughter and preparation of lamb among these two religious groups in the future.

44
REFERENCES Australian Halal Food Services. Accessed online at http://www.ahfservices.com.au/halal.html in
December 2009. Australian Meat. Accessed online at http://www.australian-meat.com/australian-meat-home in
12/2009. CBS News. “Whites Now a Minority in California,” March 30, 2001. Faris, Waleed F. “Region and Lamb Consumption,” Muslim Students Association Coordinator,
Virginia Tech., 2002. Food Marketing Institute (FMI), “The Power of Meat,” co-published with the American Meat
Institute, 2009. Gross, J. B. “American Lamb Attitude and Usage Study 2006,” Presentation made at the
American Lamb Board Meeting, San Antonio, TX, January 25, 2006. Holz-Clause, Mary, AgMRC, Iowa State University. “Marketing Beef to Latino Con
sumers,”December 2009. Iqbal, A. “Halal Meat Trade in the United States of America.” Accessed online at
www.sheepandgoatmarketing.info, 12/18/09. Just Food, Inc., Cornell University, Los Sures. “Market Research in Ethnic Community Shows
Restaurants with Goat Meat,” 1999. Kirkpatrick, T. B. Bell, et al. for the American Sheep Industry Association. “Marketing out of
the Mainstream,” 1995. Kosmin, Barry A. and Ariela Keysar. ARIS. “American Religious Identification Survey,” (ARIS
2008), March 2009. New York City Department of City Planning, "The Newest New Yorkers: 2000," 2005.
Available on-line at: http://www.nyc.gov/html/dcp/pdf/census/nny_briefing_booklet.pdf. Accessed 12/2009.
O’dell, D., D.J. Marshall, D. Singh, G.F. Plaugher, P.E. Lewis, E.K. Inskeep, and D. Smith, “Final report: West Virginia lamb marketing information project.” Prepared for the West Virginia Department of Agriculture, Marketing and Development Division, Charleston, WV, March 2004.
Pew Forum on Religion and Public Life. “Pew Forum's U.S. Religious Landscape Survey,” February 2007.
Pew Forum on Religion and Public Life. “Portrait of Muslims,” Accessed 11/27/09 http://religions.pewforum.org/.
Pew Research Center. Jeffrey S. Passel and D’Vera Cohn. “U.S. Population Projections: 2005–2050,” February 2008.
RTI International (Viator, C. L., S.C. Cates, M. K. Muth, S. A. Karns, G. Brester). “Cash versus Contract Marketing in the U.S. Lamb Industry,” June 15, 2007.
Schoenian, Susan. “Producing and Selling Sheep and Goats to the Ethnic/Religious Meat Markets,” 2007.
Shiflett, J. S., W. D. Purcell, D. Marsh, and P. Rodgers. “Analysis of Lamb Demand in the United States,” Report to the American Lamb Board, January. 2007.
Shiflett, J. “Sheep and Lamb Economic Impact Study,” for the American Sheep Industry Association (ASI). 2008.
Shugoll Research. “Consumer Research on Proteins, Lamb,” September 2009.

45
University of Illinois Extension, A. Larson and E. Thompson. “Direct Marketing Lamb to Niche and Ethnic Markets.” No date.
U.S. Census Bureau. ACS Demographic and Housing Estimate 2006-2008. ‘California.’ Accessed online 12/2009.
U.S. Census Bureau. ACS Demographic and Housing Estimate 2006-2008. ‘New York.’ Accessed online 12/2009.
U.S. Census Bureau. “An Older and More Diverse Nation by Midcentury,” Aug. 14, 2008. U.S. Census Bureau. “Census 2000 Brief, The Arab Population: 2000,” December 2003. U.S. Census Bureau. “Table 1. Annual Estimates of the Population for the United States,
Regions, States, and Puerto Rico: April 1, 2000 to July 1, 2009,” Accessed 12/2009. U.S. Census Bureau. “Table 1. Annual Estimates of the Population for the United States,
Regions, States, and Puerto Rico: April 1, 2000 to July 1, 2009,” Accessed 12/2009. U.S. Census Bureau. “Table 1. Annual Estimates of the Population for the United States,
Regions, States, and Puerto Rico: April 1, 2000 to July 1, 2009,” Accessed 12/2009. U.S. Department of Agriculture, Agricultural Marketing Service, Dept. of Ag. Market News,
reporters Rebecca Sauder and Levi Geyer. Phone interviews, September 2009. U.S. Department of Agriculture. Packers & Stockyards Program. 2008 Annual Report. United
States Department of Agriculture Grain Inspection, Packers and Stockyards Administration. March 1, 2009.
Williams, G. W. and Oral Capps, Jr. “Household Level Lamb Consumption Patterns,” TAMRC Commodity Market Research Report No. CM-02-05, Texas Agribusiness Market Research Center, Texas A&M University, College Station, Texas, September 2005.
Williams, G.W., D. Bailey, O. Capps, Jr., L.A. Detwiler, H.S. Glimp, T. Hammonds, D.D. Hedley, H.H. Jensen, and D.L. Thomas. Changes in the Sheep Industry in the United States: Making the Transition from Tradition. Washington, D.C.: The National Academies Press, 2008.