the nonemployer in middle georgia seedbed of prosperity 2008 data released june 24, 2010
TRANSCRIPT

The Nonemployer in Middle Georgia
Seedbed ofSeedbed ofProsperityProsperity
2008 DataReleased June 24, 2010

What are Nonemployer businesses?
• have no paid employees, • have annual business receipts of $1,000 or
more ($1 or more in the construction industries)
• and are subject to federal income taxes.
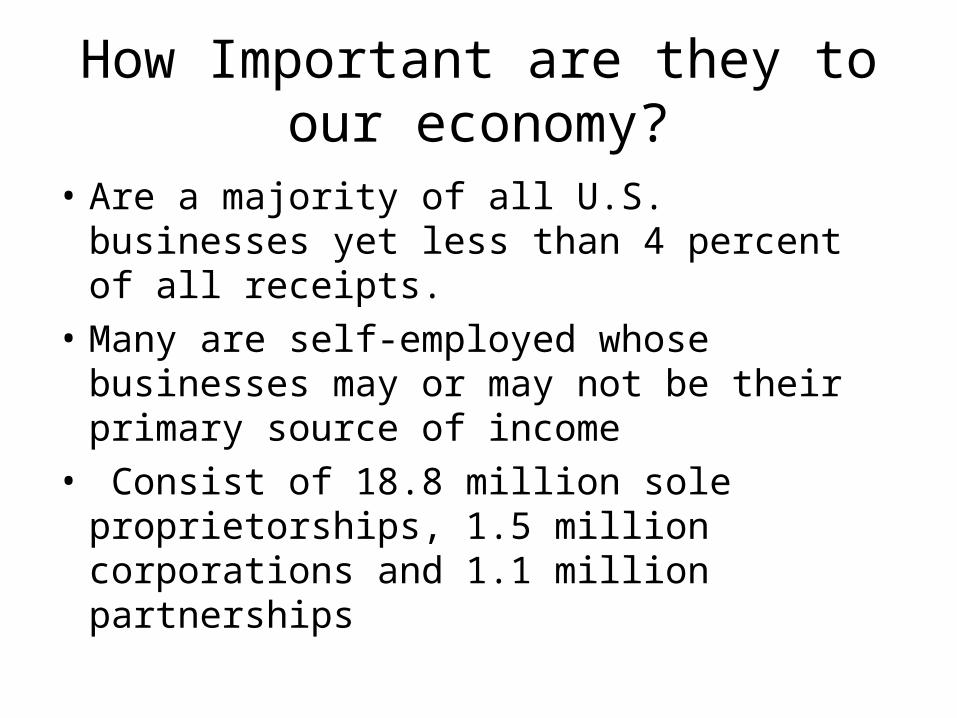
How Important are they to our economy?
• Are a majority of all U.S. businesses yet less than 4 percent of all receipts.
• Many are self-employed whose businesses may or may not be their primary source of income
• Consist of 18.8 million sole proprietorships, 1.5 million corporations and 1.1 million partnerships

Some Nonemployers
• Electricians, Plumbers & Carpenters
• Real Estate Agents & Lessors
• Auto Mechanics & Body Repair
• Hair, Nail & Skin Care• Clothing Stores• Grocery Stores
• Truck Drivers• Accounting &
Bookkeeping• Physicians• Janitorial & Landscaping• Investigation & Security• Home Health Care• Auto Dealers• Child Day Care
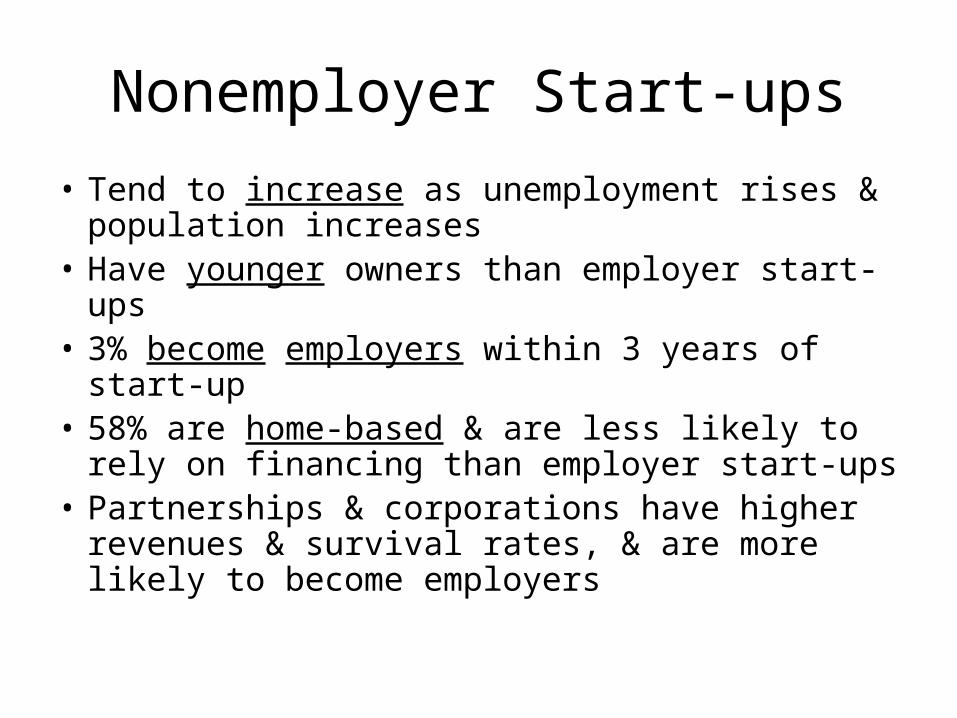
Nonemployer Start-ups
• Tend to increase as unemployment rises & population increases
• Have younger owners than employer start-ups• 3% become employers within 3 years of start-up• 58% are home-based & are less likely to rely on
financing than employer start-ups• Partnerships & corporations have higher
revenues & survival rates, & are more likely to become employers

National Results for 2008
• All but two states — Texas and Louisiana, plus the District of Columbia — saw a decline in the number of nonemployer businesses between 2007 and 2008.
• The nation had 21.4 million nonemployer firms in 2008, a decrease of 350,000 from 2007 (1.6 percent), the U.S. Census Bureau announced today - June 24, 2010.

Middle Ga, the State & Nation in 2008
• Middle Ga’s share of Ga’s establishments is about 4.2%4.2% & 3.7%3.7% of its receipts
• Receipts per establishment average $35,921 $35,921 in Middle Ga, versus $40,510 $40,510 in Ga & $45,09345,093 in the U.S.
• Growth - Since 2003, Mid Ga has a higher establishment growth rate & a lower receipt rate than the State & Nation


Latest Developments
• Mid Ga Nonemployers are optimists – receipts were going sour, but they perservered thru 2007
• After major declines in receipts in 2007 & 2008, many gave up their dream
• Major declines occurred in Construction & Real Estate - in total & on a Receipts per Establishment basis
• Healthcare advanced in all respects, but receipts were best for Truck Drivers who stuck it out


Middle GaNonemployer Industry Concentration• Nonemployers are clustered in 4 industries –– Leaders in total receipts are• Construction 22% of receipts • Real Estate 14% of receipts
– Leaders in establishments are• Admin & Support 12% of establishments mostly
janitorial & landscaping• Other Services 21% of establishments primarily
personal services such as beauty & barber shops
• Receipts per establishment are highest in Transportation & lowest in Admin & Support

Middle Ga Region: Nonemployers in 2008
Number of Establish
ments
Receipts ($1,000)
Receipts Per Estab
% of Mid Ga
Estab
% of Mid Ga
Receipts
Total for all sectors 30,849 $1,108,113 $35,921 100.0% 100.0%
Construction 4,368 $248,564 $56,906 14.2% 22.4%
Real estate and rental and leasing 2,275 $151,305 $6,508 7.4% 13.7%
Other services (exc public admin) 6,469 $133,377 $20,618 21.0% 12.0%
Retail trade 2,541 $99,964 $39,340 8.2% 9.0%
Transportation and warehousing 1,387 $99,065 $71,424 4.5% 8.9%
Professional, scientific, and technical svs 2,763 $82,984 $30,034 9.0% 7.5%
Health care and social assistance 3,059 $82,800 $27,068 9.9% 7.5%
Admin & Support & Waste Mang & Remed 3,628 $55,456 $15,286 11.8% 5.0%
All Other Industries 4,359 $154,598 $35,466 14.1% 14.0%

Middle Ga Region: Middle Ga Region: Nonemployers by IndustryNonemployers by Industry
2007-2008 Change 2007-2008 Change
EstablishmentsEstablishments Receipts in Receipts in $000's$000's
Receipts per Receipts per EstablishmentEstablishment
AmtAmt %% AmtAmt %% AmtAmt %%
Total for all sectors (137) -0.4% ($86,543) -7.2% ($2,634) -6.8%
Construction (358) -7.6% ($60,328) -19.5% ($8,454) -12.9%
Real estate and rental and leasing (194) -7.9% ($25,331) -14.3% ($5,034) -7.0%
Other services (exc public admin) 449 7.5% $1,783 1.4% ($1,241) -5.7%
Retail trade (164) -6.1% ($841) -0.8% $2,074 5.6%
Transportation and warehousing (119) -7.9% $4,863 5.2% $8,873 14.2%
Prof, scientific, and tech svs (11) -0.4% ($3,860) -4.4% ($1,272) -4.1%
Health care and social assistance 226 8.0% $10,009 13.8% $1,374 5.3%
Admin & Support & Waste Mgt 87 2.5% ($3,868) -6.5% ($1,467) -8.8%
All Other Industries (53) -1.2% ($8,970) -5.5% ($1,607) -4.3%

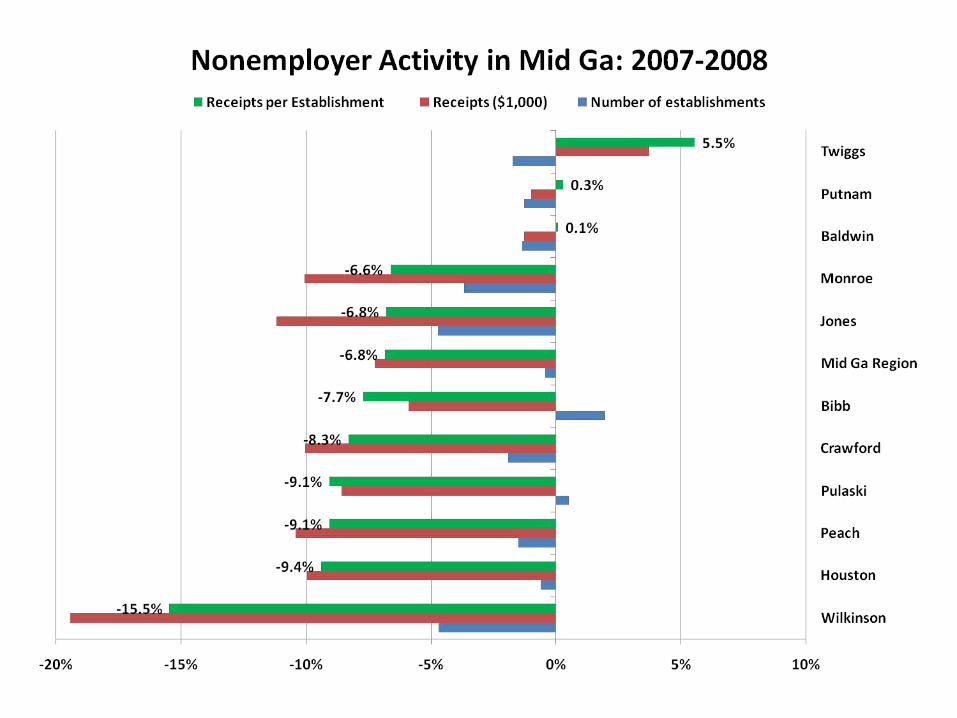
Counties in 2007-2008
• County Shares of $1 billion in receipts - mostly generated in Bibb & Houston with around 59% of establishments & receipts, but with 60% of the 2007-08 $ losses
• % Gains - Twiggs fared the best while Wilkinson was hit hardest
• Receipts per Establishment - Peach & Putnam are highest, with Twiggs & Putnam gaining the most

NonemployersNonemployers by by County: 2008County: 2008
Number of Number of establishestablish
mentsmentsReceipts Receipts ($1,000)($1,000)
Receipts/ Receipts/ EstabsEstabs
% of % of Mid GaMid Ga EstabsEstabs
% of% of Mid Ga Mid Ga ReceiptsReceipts
Baldwin Baldwin 2,861 2,861 $107,302$107,302 $37,505$37,505 9.3%9.3% 9.7%9.7%
BibbBibb 11,031 11,031 $383,002$383,002 $34,721$34,721 35.8%35.8% 34.6%34.6%
CrawfordCrawford 767 767 $23,439$23,439 $30,559$30,559 2.5%2.5% 2.1%2.1%
HoustonHouston 7,348 7,348 $258,355$258,355 $35,160$35,160 23.8%23.8% 23.3%23.3%
Jones Jones 1,934 1,934 $72,634$72,634 $37,556$37,556 6.3%6.3% 6.6%6.6%
Monroe Monroe 1,937 1,937 $72,212$72,212 $37,280$37,280 6.3%6.3% 6.5%6.5%
Peach Peach 1,515 1,515 $63,636$63,636 $42,004$42,004 4.9%4.9% 5.7%5.7%
Pulaski Pulaski 581 581 $19,303$19,303 $33,224$33,224 1.9%1.9% 1.7%1.7%
Putnam Putnam 1,796 1,796 $81,604$81,604 $45,437$45,437 5.8%5.8% 7.4%7.4%
Twiggs Twiggs 512 512 $13,191$13,191 $25,764$25,764 1.7%1.7% 1.2%1.2%
Wilkinson Wilkinson 567 567 $13,435$13,435 $23,695$23,695 1.8%1.8% 1.2%1.2%
Mid Ga Region 30,849 $1,108,113 $35,921 100.0% 100.0%

Middle Ga Region: Middle Ga Region: Nonemployers by Nonemployers by
County County 2007-2008 Change2007-2008 Change
EstablishmentsEstablishments Receipts in $000'sReceipts in $000's Receipts per Receipts per EstablishmentEstablishment
AmtAmt %% AmtAmt %% AmtAmt %%
Baldwin -39 -1.3% $ (1,378) -1.3% $ 29 0.1%Bibb 213 2.0% $ (23,959) -5.9% $ (2,898) -7.7%Crawford -15 -1.9% $ (2,617) -10.0% $ (2,761) -8.3%Houston -46 -0.6% $ (28,555) -10.0% $ (3,643) -9.4%Jones -96 -4.7% $ (9,157) -11.2% $ (2,735) -6.8%Monroe -74 -3.7% $ (8,072) -10.1% $ (2,642) -6.6%Peach -23 -1.5% $ (7,409) -10.4% $ (4,189) -9.1%Pulaski 3 0.5% $ (1,814) -8.6% $ (3,311) -9.1%Putnam -23 -1.3% $ (812) -1.0% $ 129 0.3%Twiggs -9 -1.7% $ 473 3.7% $ 1,353 5.5%Wilkinson -28 -4.7% $ (3,243) -19.4% $ (4,335) -15.5%Mid Ga Region -137 -0.4% $ (86,543) -7.2% $ (2,634) -6.8%

Middle Georgia Businesses: 2008Middle Georgia Businesses: 2008Geographic Area Name
Non employers Employers Total
% Non employers
Crawford 767 111 878 87.4%Twiggs 512 82 594 86.2%Jones 1,934 364 2,298 84.2%Putnam 1,796 465 2,261 79.4%Monroe 1,937 510 2,447 79.2%Wilkinson 567 162 729 77.8%Baldwin 2,861 844 3,705 77.2%Houston 7,348 2,327 9,675 75.9%Peach 1,515 494 2,009 75.4%Pulaski 581 202 783 74.2%Bibb 11,031 4,380 15,411 71.6%
Mid Ga RegionMid Ga Region 30,849 30,849 9,941 9,941 40,790 40,790 75.6%75.6%

2009 & Beyond
• We don’t have current data on what happened to nonemployers in 2009 & so far in 2010
• This data provides hints as to what it will tell us about the recession’s effects
• Losses are highly related to construction & real estate
• Gains are related to consumer spending - healthcare, retail & distribution