the nisonger center health characteristics and access to ... · ttnisonger.ose 2 |health...
TRANSCRIPT

Health Characteristics and Access to Healthcare Services of Adults with Down SyndromeBRIEF REPORT
Marc J. Tassé, PhD, Susan M. Havercamp, PhD, Betsey A. Benson, PhD, Kandamurugu Manickam, MD, Dawn C. Allain, MS, CGC, Suzanne Davis, BA, & Patricia Navas, PhD
Picture: Classroom Friends; Author: Manuel López FrancésIII Institute on Community Integration (INICO) Digital Photo Contest (1st Award, 2005) Grupo Norte Foundation Award
THE NISONGER CENTER

http://nisonger.osu.edu
Acknowledgments
We wish to thank the Columbus Foundation for generously supporting this study of the health
status and access to healthcare services of adult Ohioans with Down syndrome. We also thank our
partners in this project, without whom recruitment and outreach would have been
impossible: Down Syndrome Association of Central Ohio, DownSyndrome Achieves, and Franklin
County Board of Developmental Disabilities. Most importantly, we thank the adults with
Down syndrome who agreed to participate in our study and their parents, siblings, grandparents,
care givers and support staff, who assisted and supported them in their participation.
© 2013 The Ohio State University Nisonger Center
http://nisonger.osu.edu/ds-healthcare
Citation: Tassé, M. J., Havercamp, S. M., Benson, B. A., Manickam, K., Allain, D. C., Davis, S., &
Navas, P. (2013). Health Characteristics and Access to Healthcare Services of Adults with Down
Syndrome: Brief Report. Columbus, OH: The Ohio State University Nisonger Center.

http://nisonger.osu.edu
Persons with intellectual and developmental disabilities
experience worse health than typically developing peers.
This health differential is often described in terms of health
disparities – which refers to differences caused or facilitated by
social or access issues (Havercamp, Scandlin, & Roth, 2004).
Following growing concerns regarding the health status of
people with intellectual disability (ID), the US Surgeon General
commissioned a national conference and report that exam-
ined the health disparities of persons with intellectual disability.
The US Surgeon General’s report concluded the
following: “Like other Americans, persons with mental
retardation [now referred to as intellectual disability] grow
up, grow old, and need good health and health care services
in their communities. But people with [ID], their families, and
their advocates report exceptional challenges in staying
healthy and getting appropriate health services when they
are sick. They feel excluded from public campaigns to
promote wellness. They describe shortages of health care
professionals who are willing to accept them as patients and
who know how to meet their specialized needs.”
(U.S. Department of Health and Social Services, 2002; p. xi).
It has been reported that individuals with intellectual disability
must contact on average 50 physicians before they can find
one who has been trained to treat persons with disabilities
(Corbin, Holder, & Engstrom, 2005).
Down syndrome occurs in 1 in every 700 births, resulting
in the most frequent genetic condition associated with
intellectual disability (Parker et al., 2010). Because of associated
congenital health issues, life expectancy of individuals with
Down syndrome is generally lower than the general population.
However, according to the Center for Disease Control and
Prevention (CDC), people with Down syndrome in the United
States live much longer now than 30 years ago. Current
average life expectancy of individuals with Down syndrome
is approximately 55 years of age, with many living well into
their 60s and 70s. However, adults with Down syndrome are
more likely to be overweight/obese and have more secondary
health problems than adults from the general population
(Rubin, Rimmer, Chocoine, Braddock, & McGuire, 1998). Being
overweight is a major risk factor for many chronic diseases,
including heart disease, Type II diabetes, and arthritis (Leon,
Koupilova, Lithell, & McKeigue, 1996). Being overweight also
exacerbates other health problems, such as high blood pres-
sure, high blood cholesterol, sleep apnea, etc.
We developed an online health survey to examine the
health of adults with Down syndrome. Health information
was collected between July 2011 and May 2013 on adults with
Down syndrome living in Ohio. The survey included questions
addressing: 1) Current physical and mental health problems,
2) Frequency of routine health screenings, 3) Healthy behaviors,
and 4) Access to healthcare services. This report summarizes
some of the findings obtained from the online health survey.
1 We want to thank our partners on this project: DSACO, FCBDD, and DownSyndrome Achieves. We also thank the many organizations in Ohio who helped distribute information about this project and reach adults with Down syndrome: Up-side of Down, Hamilton Down Syndrome Association, Delaware County Board of DD, Ohio Association of County Boards of DD, Special Olympics Ohio, Down Syndrome Association of the Valley, Tuscarawas County Board of DD, and Arc of Ohio. This project was made possible with a grant from the Columbus Foundation #TFB11-0357-TG. Requests for additional information should be addressed to: Marc J. Tassé, PhD, Nisonger Center, The Ohio State University, 1581 Dodd Drive, Columbus, OH 43210 or email: [email protected]. http://nisonger.osu.edu/ds-healthcare
2 Nisonger Center - UCEDD, The Ohio State University.
3 Department of Internal Medicine, Division of Human Genetics, The Ohio State University Wexner Medical Center.
Health Characteristics and Access to Healthcare Services of Adults with Down Syndrome
Marc J. Tassé, PhD2, Susan M. Havercamp, PhD2, Betsey A. Benson, PhD2, Kandamurugu Manickam, MD3, Dawn C. Allain, MS, CGC3, Suzanne Davis, BA2, & Patricia Navas, PhD2
Brief Report

http://nisonger.osu.edu
2 | Health Characteristics and Access to Healthcare Services of Adults with Down Syndrome
Health Indicators
Information about health indicators
was recruited for 291 adults with
Down syndrome living in Ohio. The
survey was completed, in most cases
(70%), by a parent of the adult with
Down syndrome and the adult with
Down syndrome completed the survey
by himself/herself in 6.5% (n=19) of the
cases. Siblings completed the survey in
10% of the cases, while direct support
professionals filled in the survey in 14%
of the cases. The age of the adults with
Down syndrome ranged from 18 to 79
years old (average age = 34 years old).
More than a half of participants (n=154
or 53%) were men (see Figure 1) and
most cases of Down syndrome (74%)
were reported as resulting from trisomy
21 (see Figure 2). Fifty eight people
(19.9%) did not know the type of Down
syndrome, and 3.8% (n=11) reported
it as resulting from translocation or
mosaic (2.1%).
As other studies have reported
(Havercamp, Scandlin, & Roth,
2004; Prasher, 2008; Rimmer & Yamaki,
2006; Rubin et al., 1998), a higher than
expected prevalence of obesity (49%
vs. 35%) is present in these adults than
the general population. The standard
weight status categories associated
with Body Mass Index (BMI) for adults
in the general population are shown in
Table 1. The average height (61 inches)
and average weight (157 lbs) of the
adults with Down syndrome in our sam-
ple yield an average BMI of 30.1, which
falls in the obese range.
Table 1. BMI ranges
BMI Weight Status
Below 18.5 Underweight
18.5 – 24.9 Normal
25.0 – 29.9 Overweight
30.0 and Above Obese
* Source: Centers for Disease Control and Prevention
53%
47%
Figure 1. Gender
Male
Female
74%
4%
2% 20%
Figure 2. Type of Down syndrome
Trisomy 21
Translocation
Mosaic
Don't know
Figure 1. Gender
Figure 2. Types of Down syndrome

http://nisonger.osu.edu
Health Characteristics and Access to Healthcare Services of Adults with Down Syndrome | 3
0.0
5.0
10.0
15.0
20.0
25.0
30.0
35.0
40.0
45.0
50.0
Underweight Healthy Overweight Obesity
1.0
21.5
28.7
48.8
1.7
29.8 33.2
35.3
Figure 3. BMI
Down syndrome
General population As shown in Figure 3, higher rates
of obesity were found for adults
with Down syndrome compared to the
rates of obesity in the general
population (CDC: Years 2007-2010).
Despite having a BMI in the obese
range, 70% of these adults report
considering their eating habits as
Good, Very Good, or Excellent
(see Figure 4).
With regard to where they live,
a large majority (71%) of the
adults with Down syndrome reported
living in their parent’s or relative’s
home.
0
5
10
15
20
25
30
35
40
45
Excellent Very Good Good Average Poor Don’t Know
12
16
11 14
6
22 14 18 18
7
1
24
43
27 29
12
Figure 4. Eating habits by weight status
Underweight Healthy
Overweight Obesity
Figure 3. BMI
Figure 4. Eating habits by weight status

http://nisonger.osu.edu
4 | Health Characteristics and Access to Healthcare Services of Adults with Down Syndrome
Figure 6. Physical health conditions
.7
1.0
1.7
1.7
2.1
2.4
2.8
3.1
3.1
4.2
4.5
4.9
5.2
5.6
6.3
6.3
9.7
11.1
11.8
12.2
17.7
20.5
21.2
24.0
25.3
32.6
33.7
Arterial hypertension
CVA
Infections
Gastric or duodenal ulcer
Epilepsy
Heart disease
Migraines and headaches
Accidents with injuries
Celiac disease
Osteoporosis
Hyperthyroidism
Asthma
Back or spinal pain
Diabetes
Respiratory conditions
Allergic rhinitis
Cataracts
None
Congenital heart disease
Arthritis/rheumatism or osteoarthritis/arthrosis
Dental problems
Functional digestive disorders
Sleep apnea
Allergies
Other
Skin conditions
Hypothyroidism
3%
17%
45%
11%
24%
Figure 5. Co-occurring disabilities
Cerebral Palsy
Autism
Learning Disability
Attention Deficit/Hyperactivity
Other DD
Figure 5. Co-occuring disabilities
Figure 6. Physical health conditions
Sixty-five percent (65% or n=189)
of adults with Down syndrome in
our survey reported having moderate
intellectual disability and 17% also
reported having a co-occurring
diagnosis of autism spectrum
disorder (see Figure 5).
When specifically asked about
co-occurring health problems,
only 32 individuals (11%) of our total
sample reported having no other
secondary health condition.
Eighty-eight percent (88% or n=256)
of the total group of adults with Down
syndrome who completed our health
survey reported at least one secondary
health condition. The most common
health conditions reported, included:
34% = Hypothyroidism,
33% = Skin Conditions,
24% = Allergies, 21% = Sleep Apnea,
and 20% = Digestive Problems
(see Figure 6).
http://nisonger.osu.edu
Health Characteristics and Access to Healthcare Services of Adults with Down Syndrome | 5
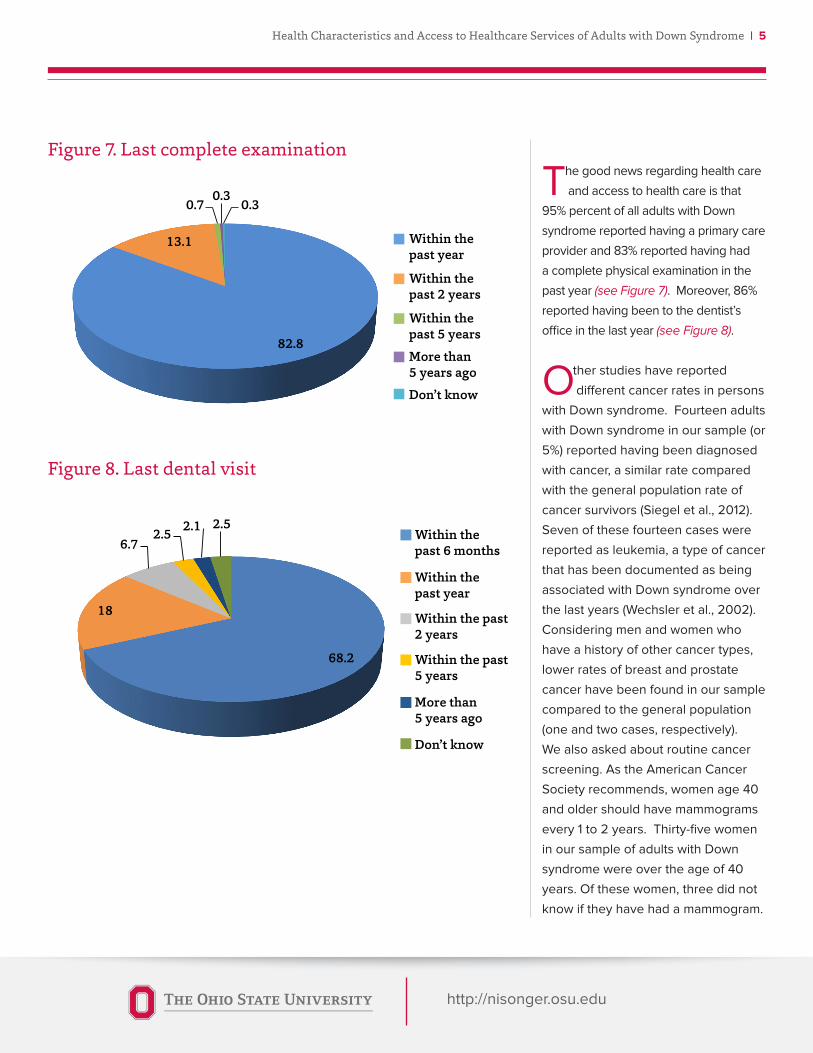
Figure 8. Last dental visit
Figure 7. Last complete examination
82.8
13.1
0.7 0.3
0.3
Figure 7. Last complete examination
Within the past year
Within the past 2 years
Within the past 5 years
More than 5 years ago
Don’t know
68.2
18
6.7 2.5 2.1 2.5
Figure 8. Last dentist visit
Within the past 6 months
Within the past year
Within the past 2 years
Within the past 5 years
More than 5 years ago
Don’t know
The good news regarding health care
and access to health care is that
95% percent of all adults with Down
syndrome reported having a primary care
provider and 83% reported having had
a complete physical examination in the
past year (see Figure 7). Moreover, 86%
reported having been to the dentist’s
office in the last year (see Figure 8).
Other studies have reported
different cancer rates in persons
with Down syndrome. Fourteen adults
with Down syndrome in our sample (or
5%) reported having been diagnosed
with cancer, a similar rate compared
with the general population rate of
cancer survivors (Siegel et al., 2012).
Seven of these fourteen cases were
reported as leukemia, a type of cancer
that has been documented as being
associated with Down syndrome over
the last years (Wechsler et al., 2002).
Considering men and women who
have a history of other cancer types,
lower rates of breast and prostate
cancer have been found in our sample
compared to the general population
(one and two cases, respectively).
We also asked about routine cancer
screening. As the American Cancer
Society recommends, women age 40
and older should have mammograms
every 1 to 2 years. Thirty-five women
in our sample of adults with Down
syndrome were over the age of 40
years. Of these women, three did not
know if they have had a mammogram.
http://nisonger.osu.edu
6 | Health Characteristics and Access to Healthcare Services of Adults with Down Syndrome
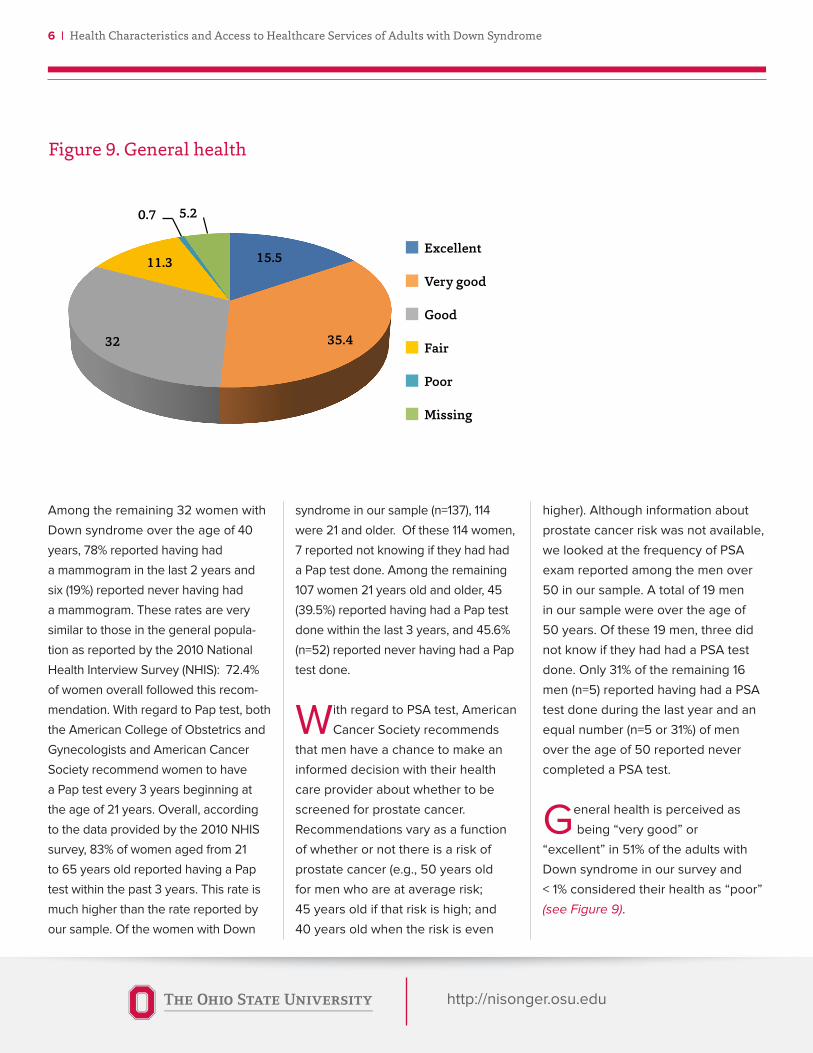
15.5
35.4 32
11.3
0.7 5.2
Figure 9. General Health
Excellent
Very good
Good
Fair
Poor
Missing
Among the remaining 32 women with
Down syndrome over the age of 40
years, 78% reported having had
a mammogram in the last 2 years and
six (19%) reported never having had
a mammogram. These rates are very
similar to those in the general popula-
tion as reported by the 2010 National
Health Interview Survey (NHIS): 72.4%
of women overall followed this recom-
mendation. With regard to Pap test, both
the American College of Obstetrics and
Gynecologists and American Cancer
Society recommend women to have
a Pap test every 3 years beginning at
the age of 21 years. Overall, according
to the data provided by the 2010 NHIS
survey, 83% of women aged from 21
to 65 years old reported having a Pap
test within the past 3 years. This rate is
much higher than the rate reported by
our sample. Of the women with Down
syndrome in our sample (n=137), 114
were 21 and older. Of these 114 women,
7 reported not knowing if they had had
a Pap test done. Among the remaining
107 women 21 years old and older, 45
(39.5%) reported having had a Pap test
done within the last 3 years, and 45.6%
(n=52) reported never having had a Pap
test done.
With regard to PSA test, American
Cancer Society recommends
that men have a chance to make an
informed decision with their health
care provider about whether to be
screened for prostate cancer.
Recommendations vary as a function
of whether or not there is a risk of
prostate cancer (e.g., 50 years old
for men who are at average risk;
45 years old if that risk is high; and
40 years old when the risk is even
higher). Although information about
prostate cancer risk was not available,
we looked at the frequency of PSA
exam reported among the men over
50 in our sample. A total of 19 men
in our sample were over the age of
50 years. Of these 19 men, three did
not know if they had had a PSA test
done. Only 31% of the remaining 16
men (n=5) reported having had a PSA
test done during the last year and an
equal number (n=5 or 31%) of men
over the age of 50 reported never
completed a PSA test.
General health is perceived as
being “very good” or
“excellent” in 51% of the adults with
Down syndrome in our survey and
< 1% considered their health as “poor”
(see Figure 9).
Figure 9. General health

http://nisonger.osu.edu
Health Characteristics and Access to Healthcare Services of Adults with Down Syndrome | 7
Conclusions
* The adults in our survey benefitted from unusually good access to primary
health care. Most have a primary care physician and most report having had a
complete physical exam in the last year.
* One hypothesis is that this better than average access to health care
(compared to other adults with developmental disabilities) is likely attributable
to a high proportion of the adults living with parents or family members.
* Adults with Down syndrome in our survey reported being very physically
active and the vast majority were in good to excellent health.
* Breast and prostate cancer rates appear to be reported lower than the rates
seen in the general population.
* As expected, rates of certain health conditions were reported to be
significantly higher in these adults with Down syndrome, including:
hypothyroidism, skin conditions, sleep apnea, to name a few.
* Based on the calculated Body Mass Index, the rate of obesity in our sample
was almost 50%, significantly higher than the rate reported in adults in the
general population. Interestingly, the rate of diabetes was lower than would be
expected in a comparably overweight/obese population.
Regarding their physical activity,
65% of adults with Down
syndrome reported being engaged in
“moderate” level of physical activity.
For the majority of the individuals in
our sample (70%), this level of activity
lasts for 30 minutes or more per day.
In addition, for more than half (61%),
the frequency of their moderate
activity is reported to occur at least
three or more times per week
(see Figure 10).
14.2
47.2
38.6
Figure 10. Times per week
Five times or more per week
�ree to four times per week
One to two times per week
Figure 10. Times per week

http://nisonger.osu.edu
8 | Health Characteristics and Access to Healthcare Services of Adults with Down Syndrome
References
• Corbin S., Holder M., & Engstrom K. (2005). Changing
attitudes, changing the world: the health and health
care of people with intellectual disabilities. Washington,
DC: Special Olympics International.
• Havercamp, S. M., Scandlin, D., & Roth, M. (2004).
Health disparities among adults with developmental
disabilities, adults with other disabilities, and adults
not reporting disability in North Carolina. Public Health
Reports, 119, 428-426.
• Holder, M., Waldman, H. B., & Hood, H. (2009). Prepar-
ing Health Professionals to Provide Care to Individuals
with Disabilities. International Journal of Oral Science,
1, 66–71.
• Leon, D. A., Koupilova, I., Lithell, H.O., & McKeigue, P. M.
(1996). Failure to realize growth potential in utero and
adult obesity in relation to blood pressure in 50 year
old Swedish men. British Medical Journal, 312, 401-406.
• Parker, S. E., Mai, C. T., Canfield, M. A., Rickard, R.,
Wang, Y., Meyer, R. E., Anderson, P., Mason, C. A.,
Collins, J. S., Kirby, R. S., & Correa, A. (2010). Updated
national birth prevalence estimates for selected birth
defects in the United States, 2004–2006. Birth Defects
Research Part A: Clinical and Molecular Teratology, 88,
1008–1016.
• Prasher, V. P. (2008). Overweight and obesity amongst
Down’s syndrome adults. Journal of Intellectual Disabil-
ity Research, 39(5), 437-441.
• Rimmer, J. H., & Yamaki, K. (2006). Obesity and intellec-
tual disability. Mental Retardation and Developmental
Disabilities Research Review, 12, 22-27.
• Rubin, S. S., Rimmer, J. H., Chicoine, B., Braddock, D.,
& McGuire, D. E. (1998). Overweight Prevalence in
Persons with Down Syndrome. Mental Retardation, 36,
175-181.
• Siegel, R., DeSantis, C., Virgo, K., Stein, K., Mariotto, A.,
Smith, T., … Ward, E. (2012), Cancer treatment and sur-
vivorship statistics. CA: A Cancer Journal for Clinicians,
62, 220–241. doi: 10.3322/caac.21149
• US Department of Health and Social Services (2002).
The Report on the Surgeon General’s Conference on
Health Disparities and Mental Retardation. Washington,
DC: US Department of Health and Social Services.
• Wechsler, J., Greene, M., McDevitt, M. A., Anastasi,
J., Karp, J. E., Le Beau, M. M., & Crispino, J. D. (2002).
Acquired mutations in GATA1 in the megakaryoblastic
leukemia of Down syndrome. Nature genetics, 32(1),
148-152.
http://nisonger.osu.edu
Research Team Members
Marc J. Tassé, PhD, Director, Nisonger Center - UCEDD, Professor, Departments of Psychology and
Psychiatry, The Ohio State University. Email: [email protected], Tel.: 614-685-3193.
Susan M. Havercamp, PhD, Director of Health Promotion and Healthcare Parity, Nisonger
Center - UCEDD, Associate Professor, Departments of Psychiatry and Psychology,
The Ohio State University. Email: [email protected].
Betsey A. Benson, PhD, Director of Adult Behavior Support Services, Nisonger Center - UCEDD,
Associate Professor, Departments of Clinical Psychiatry and Psychology, The Ohio State University.
Kandamurugu Manickam, MD, Assistant Professor, Department of Internal Medicine,
Division of Human Genetics, The Ohio State University Wexner Medical Center.
Dawn C. Allain, MS, CGC, Assistant Professor, Department of Internal Medicine,
Division of Human Genetics, The Ohio State University Wexner Medical Center.
Suzanne Davis, BA, Clinical Research Assistant, Nisonger Center - UCEDD,
The Ohio State University. Email: [email protected], Tel: 614-685-3195.
Patricia Navas, PhD, Postdoctoral Fellow, Nisonger Center - UCEDD, The Ohio State University.
Doctoral degree in Psychology, University of Salamanca - Spain.
Email: [email protected].
Photo courtesy of Lindsay Gantzer

The Ohio State University Nisonger Center
McCampbell Hall
1581 Dodd Drive
Columbus, Ohio · 43210-1257
Tel: (614) 685-3192
Fax: (614) 366-6373
http://nisonger.osu.edu
Nisonger CenterA University Center for Excellence in Developmental Disabilities
Our MissionThe mission of The Ohio State University Nisonger Center is to work with communities to
value and support the meaningful participation of people with disabilities of all ages through
education, service and research. The Center provides assistance to people with disabilities,
families, service providers and organizations to promote inclusion in education, health, em-
ployment and community settings.
Our VisionThrough interdisciplinary collaboration we will lead in research, education and service to im-
prove the lives of persons with disabilities, their families and service providers worldwide.
Our ValuesThe Nisonger Center incorporates the values of community inclusion, cultural diversity and
self-determination across the lifespan.