the nightsat mission concept - the urban wildlands · pdf file{earth observation group ......
TRANSCRIPT

Dow
nloa
ded
By:
[CD
L Jo
urna
ls A
ccou
nt] A
t: 22
:44
21 J
une
2007
The Nightsat mission concept
C. D. ELVIDGE*{, P. CINZANO{§, D. R. PETTIT", J. ARVESEN**,P. SUTTON{{, C. SMALL{{, R. NEMANI§§, T. LONGCORE""II, C. RICH"",
J. SAFRAN{{{, J. WEEKS{{{ and S. EBENER§§§
{Earth Observation Group, NOAA-NESDIS National Geophysical Data Center,Boulder, Colorado 80305, USA
{Dipartimento di Astronomia, Universita di Padova, Padova 2-35122, Italy
§Istituto di Scienza e Tecnologia dell’Inquinamento Luminoso (ISTIL), Thiene 13-36016,Italy
"NASA Johnson Spaceflight Center, Houston, Texas 77058, USA
**Cirrus Digital Systems, Tiburon, California 94920, USA
{{Department of Geography, University of Denver, Denver, Colorado 80208, USA;Department of Geography, Population and Environmental Management, Flinders
University, Adelaide, Australia
{{Lamont-Doherty Earth Observatory of Columbia University, Palisades, New York10964-8000, USA
§§NASA Ames Research Center, Moffett Field, California 94035, USA
""The Urban Wildlands Group, P.O. Box 24020, Los Angeles, California 90024-0020,USA
IIDepartment of Geography, University of Southern California, Los Angeles,California 90089-0255, USA
{{{Cooperative Institute for Research in the Environmental Sciences, University ofColorado 80309, USA
{{{International Population Center, San Diego State University, San Diego, California92182, USA
§§§World Health Organization, CH-1271 Geneva 27, Switzerland
(Received 14 November 2005; in final form 27 August 2006)
Nightsat is a concept for a satellite system capable of global observation of thelocation, extent and brightness of night-time lights at a spatial resolution suitablefor the delineation of primary features within human settlements. Based onrequirements from several fields of scientific inquiry, Nightsat should be capableof producing a complete cloud-free global map of lights on an annual basis. Wehave used a combination of high-resolution field spectra of outdoor lighting,moderate resolution colour photography of cities at night from the InternationalSpace Station, and high-resolution airborne camera imagery acquired at night todefine a range of spatial, spectral, and detection limit options for a futureNightsat mission. The primary findings of our study are that Nightsat shouldcollect data from a near-synchronous orbit in the early evening with 50 to 100mspatial resolution and have detection limits of 2.5E28Watts cm22sr21mm21 orbetter. Although panchromatic low-light imaging data would be useful,multispectral low-light imaging data would provide valuable information on
*Corresponding author. Email: [email protected]
International Journal of Remote SensingVol. 28, No. 12, 20 June 2007, 2645–2670
International Journal of Remote SensingISSN 0143-1161 print/ISSN 1366-5901 online # 2007 Taylor & Francis
http://www.tandf.co.uk/journalsDOI: 10.1080/01431160600981525

Dow
nloa
ded
By:
[CD
L Jo
urna
ls A
ccou
nt] A
t: 22
:44
21 J
une
2007
the type or character of lighting; potentially stronger predictors of variables, suchas ambient population density and economic activity; and valuable informationto predict response of other species to artificial night lighting. The Nightsatmission concept is unique in its focus on observing a human activity, in contrastto traditional Earth observing systems that focus on natural systems.
1. Introduction
Nocturnal lighting is a unique indicator of human activity that can be measuredfrom space. A new satellite sensor for night-time lighting, Nightsat, could be used tomap the extent and character of development more accurately and completely thanmost currently available tools. Improved global mapping of human settlements andhuman activity would address a variety of science and policy issues in the 21stcentury—an era in which human population numbers are expected growsubstantially from the current 6+ billion mark.
The density of infrastructure and the intensity of human activity—or‘urbanness’—can be viewed as a continuum, ranging from wilderness at oneextreme to central business districts at the other extreme (Weeks 2004, Weeks et al.in press). Human beings worldwide tend to cluster in spatially limited habitats,occupying less than 5% of the world’s land area. Today, more than half of theworld’s population lives in urban areas, with the most rapid increases occurring inthe developing countries of Latin America, Asia and Africa. In Europe, NorthAmerica and Japan 80% or more of the population already live in urban areas.Worldwide, the trend is for increasing numbers of people to concentrate insettlements and for the settlements to expand at their perimeters. Sprawl on theurban fringe and exurban development are two of the more conspicuous signs ofurban change, but structural change permeates urban areas through continuous re-development and the replacement of ageing infrastucture with new construction.Thus, urban areas are in a constant state of re-development and flux that reflectboth, growing urban populations and the evolution of urbanizing technologies.
Interest in satellite remote sensing of nocturnal lighting stems, in part, from thedifficulty in global mapping of human settlements in a repeatable, timely mannerfrom traditional sources. Although development features can be extracted from highspatial resolution (,1m) satellite imagery, the production of global annual maps ofdevelopment from these data sources is not feasible (at this time) from either acollection or analysis perspective. Moderate resolution Landsat-style systems offerthe potential of global collections on an annual basis and such data have been usedeffectively for mapping urban areas and tracking growth in local settings. Recentanalyses of Landsat data from diverse urban areas worldwide indicate, however,that the combination of inter-urban and intra-urban heterogeneity precludes theexistence of any unique spectral characteristic of urban areas as a thematic class(Small 2005). The spectral complexity and classification ambiguities of Landsat-styledata contribute to the lengthy production period typical for continental to global-scale derived products from these sources. For example, both the USGS NationalLand Cover Data (NLCD) for the USA (Vogelmann et al. 2001) and NASA’s globalGeocover Land Cover products required five years to complete. In addition,Landsat-style data are poorly suited for the detection of sparse development.
In contrast, the remote sensing of nocturnal lighting provides an accurate,economical, and straightforward way to map the global distribution and density ofdeveloped areas. The widespread use of outdoor lighting is a relatively recent
2646 C. D. Elvidge et al.

Dow
nloa
ded
By:
[CD
L Jo
urna
ls A
ccou
nt] A
t: 22
:44
21 J
une
2007
phenomenon, tracing its roots back to the electric light bulb, commercialized byThomas Edison in the early 1880s. Nocturnal lighting has emerged as one of thehallmarks of modern development and provides a unique attribute for identifyingthe presence of development or human activity that can be sensed remotely.Although there are some cultural variations in the quantity and quality of lighting invarious countries, there is a remarkable level of similarity in lighting technology andlighting levels around the world. The primary factor affecting the quantity oflighting is wealth. Regions with high per capita income have much more lightingthan regions with low per capita income. Even within affluent regions, however,lighting technology (lamps and lighting fixtures) is gradually changing, as pressure isapplied to reduce night-time sky brightness and conserve energy. In someapplications, night-time lights are used as a proxy for variables that are difficultto measure in a globally consistent manner, including many socio-economicvariables, such as population density and gross domestic product (e.g. Doll et al.2000, Balk et al. 2005). In other applications, the spatial distribution and quality oflighting is used as a variable directly, as in the detection of bioluminescence (Milleret al. 2005) and analyses of ecological effects of nocturnal lighting (see chapters inRich and Longcore 2006), the analysis of artificial sky brightness impacts on thevisibility of stars and planets, and human health effects of lighting (Hansen 2001,Pauley 2004, Stevens and Rea 2001).
The only satellite sensor currently collecting global night-time lights data is theU.S. Air Force Defense Meteorological Satellite Program (DMSP) OperationalLinescan System (OLS). The NOAA National Geophysical Data Center (NGDC)has been producing DMSP night-time lights products since 1994 and has workedextensively with the scientific community to develop applications for this datasource. As a result of these efforts, it can be concluded that the current technologyfor global mapping of night-time lights falls short of the science community’srequirements. The objective of this paper is to review the science community’srequirements for global satellite observations of nocturnal lighting and to define aNightsat mission concept to address these requirements. Most of the scientificapplications for satellite-observed night-time lights could be addressed by a systemcapable of producing an annual cloud-free night-time lights composite that isradiance calibrated and collected in spectral bands that are linked to standards usedin lighting technology.
2. Current status
Since the early 1970s the U.S. Air Force Defense Meteorological Satellite Programhas operated polar orbiting platforms, carrying cloud imaging satellite sensorscapable of detecting clouds using two broad spectral bands: visible–nearinfrared (VNIR) and thermal infrared (TIR). The program began with the SAP(sensor aerospace vehicle electronics package), which were flown from 1970–76. Thecurrent generation of OLS sensors began flying in 1976 and are expected to continueflying until at least 2010. At night, the VNIR band is intensified with aphotomultiplier tube to permit detection of clouds illuminated by moonlight. TheOLS detects radiances down to the 5E210Watts cm22sr21 range (Table 1), whichmakes it possible to detect artificial sky brightness surrounding large cities and gasflares.
A digital archive for the DMSP–OLS data was established in mid-1992 at NGDC.In 1994, NGDC began developing algorithms for producing annual global cloud-
The Nightsat mission concept 2647

Dow
nloa
ded
By:
[CD
L Jo
urna
ls A
ccou
nt] A
t: 22
:44
21 J
une
2007
free composites of night-time lights using DMSP data (Elvidge et al. 1997a, 1999,2001). These annual products have been used for a variety of applications, including:
(a) spatial modelling of socio-economic variables, such as population density(Dobson et al. 2000, Sutton 1997 and 2003, Sutton et al., 1997, 2001, 2003,Balk et al. 2005) and economic activity (Elvidge et al. 1997b, Doll et al. 2000,Ebener et al. 2005);
(b) measurements of the density of infrastructure (Elvidge et al. 2004) for use inhydrologic modelling, flood prediction, the assessment of losses inagricultural land (Imhoff et al. 1997), terrestrial carbon dynamics (Milesiet al. 2003 and 2005, Imhoff et al. 2004);
(c) as reference data in the detection of power outages following disasters(Elvidge et al. 1998);
(d) analysis of the ecological effects of nocturnal lighting on sea turtle hatchlings(Salmon et al. 2000 and Salmon 2006);
(e) inventory of heavily lit fishing boats (Cho et al. 1999, Rodhouse et al. 2001,Waluda et al. 2002, Maxwell et al., 2004);
(f) estimation of artificial sky brightness and its effect on the visibility ofastronomical features (Cinzano et al. 2000, 2001a, 2001b, 2004);
(g) calculation of anthropogenic emissions to the atmosphere (Saxon et al. 1997and Toenges-Schuller et al. 2006).
Table 1. Comparison of the low-light imaging systems surveyed.
Sensor Years Description Platform Altitude
Groundsampledistance
Detectionlimit
OperationalLinescanSystem(OLS)
1973–present
Scanning telescopewith three singledetector focal planes.Light intensificationachieved with aphotomultiplier tube(PMT).
DefenseMeteorologicalSatelliteProgram(DMSP)
830 km 2.7 km 1029wattscm22 sr21
VisibleInfraredImagingRadiometerSuite(VIIRS)
2009+ Twenty-two channelimaging radiometerwith a single broadlow-light imagingband employingtime-delayintegration (TDI)on a charge-coupleddevice (CCD).
NationalPolar-orbitingOperationalEnvironmentalSatellite System(NPOESS)
830 km 742m 1029wattscm22 sr21
Kodak-Nikon760
2002–2003
Colour digitalcamera with imagemotioncompensation device.
InternationalSpace Station(ISS)
390 km 60–100m
Unknown
CirrusDCS
2004 Colour digitalcamera (Hasselblad555ELD with KodakDCS ProBack with IRblocking filterremoved).
NASA ER-2 14 km 1.5m 1025wattscm22 sr21
2648 C. D. Elvidge et al.

Dow
nloa
ded
By:
[CD
L Jo
urna
ls A
ccou
nt] A
t: 22
:44
21 J
une
2007
In working with the science community using the annual composites of DMSPnight-time lights, certain characteristics of the products were identified that limitedthe utility of the data. The OLS generates low-light imaging data with a 2.7-kmground sample distance and the ground instantaneous field of view at nadir isapproximately 5 km. As a consequence of the coarse spatial resolution and theaccumulation of geolocation errors in the compositing process, the OLS-derivednight-time lights cover much larger areas than the lit areas on the ground (figure 1and Small et al. 2005). In addition, the scattering of light in the atmosphere and thephotomultiplier’s response to bright emission sources results in an ‘overglow’ effectin OLS night-time lights. This overglow is conspicuous at gas flares and offshorefrom major urban centres (figure 2). Higher spatial resolution would be required tounambiguously separate the spatially diffused overglow arising from artificial skybrightness from lighting emitted directly from development present on the ground.Additionally, the DMSP lights cannot be used to analyse differences in lighting type
Figure 1. The area of lights measured by DMSP–OLS versus the area of the correspondinglight sources derived from Landsat ETM + data. Spatial extents of both the OLS lights anddevelopments observed in the Landsat data were extracted visually.
The Nightsat mission concept 2649

Dow
nloa
ded
By:
[CD
L Jo
urna
ls A
ccou
nt] A
t: 22
:44
21 J
une
2007
or to discriminate sub-kilometer variations in lighting, are typically saturated inurban centres, and have uncertain radiometry.
Based on these results, eleven specific shortcomings for the observation of night-time lights have been identified for the OLS sensor: (a) coarse spatial resolution; (b)lack of on-board calibration; (c) lack of systematic recording of in-flight gainchanges; (d) limited dynamic range; (e) six-bit quantitization; (f) signal saturation inurban centres resulting from standard operation at the high gain setting; (g) lack of athermal band suitable for fire detection; (h) limited data recording and downloadcapabilities (most OLS data are averaged on-board to enable download of globalcoverage); (i) lack of a well characterized point spread function (PSF); (j) lack of awell characterized field-of-view (FOV); and (k) lack of multiple spectral bandscapable of detecting lights.
The follow-on for the OLS is the visible/infrared imager/radiometer suite (VIIRS),which will fly on the national polar-orbiting operational environmental satellite system(NPOESS). The first VIIRS is currently being built and represents an improved(table 1), but still imperfect, instrument to measure nocturnal lighting (Lee et al. 2004).The NPOESS VIIRS instrument will provide low-light imaging data with improvedspatial resolution (0.742 km), wider dynamic range, higher quantitization, on-boardcalibration, and simultaneous observation with a broader suite of bands for improvedcloud and fire discrimination over the OLS. The VIIRS is not, however, designed with
Figure 2. DMSP-OLS cloud-free composite of 2003 night-time lights contrast enhanced toshow the overglow surrounding bright urban centres. The overglow arises from artificial skybrightness and extends more than 50 km offshore from Los Angeles, California and blanketsthe San Gabriel Mountains north of Los Angeles. Overglow digital number (DN) valuesexceed DN values for lighting from Interstate 15 highway traffic and many small towns.
2650 C. D. Elvidge et al.
Dow
nloa
ded
By:
[CD
L Jo
urna
ls A
ccou
nt] A
t: 22
:44
21 J
une
2007
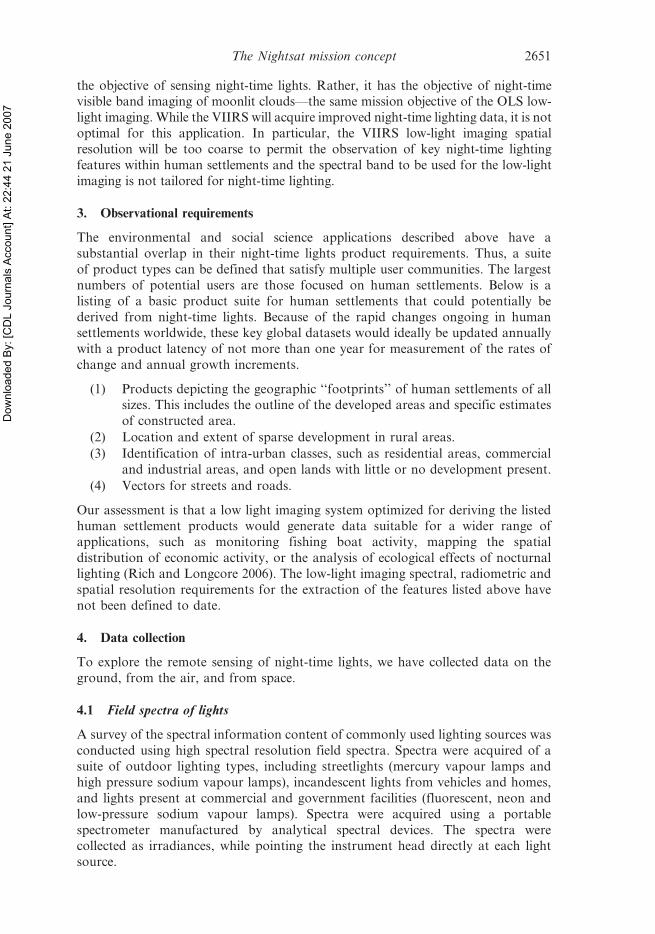
the objective of sensing night-time lights. Rather, it has the objective of night-timevisible band imaging of moonlit clouds—the same mission objective of the OLS low-light imaging. While the VIIRS will acquire improved night-time lighting data, it is notoptimal for this application. In particular, the VIIRS low-light imaging spatialresolution will be too coarse to permit the observation of key night-time lightingfeatures within human settlements and the spectral band to be used for the low-lightimaging is not tailored for night-time lighting.
3. Observational requirements
The environmental and social science applications described above have asubstantial overlap in their night-time lights product requirements. Thus, a suiteof product types can be defined that satisfy multiple user communities. The largestnumbers of potential users are those focused on human settlements. Below is alisting of a basic product suite for human settlements that could potentially bederived from night-time lights. Because of the rapid changes ongoing in humansettlements worldwide, these key global datasets would ideally be updated annuallywith a product latency of not more than one year for measurement of the rates ofchange and annual growth increments.
(1) Products depicting the geographic ‘‘footprints’’ of human settlements of allsizes. This includes the outline of the developed areas and specific estimatesof constructed area.
(2) Location and extent of sparse development in rural areas.(3) Identification of intra-urban classes, such as residential areas, commercial
and industrial areas, and open lands with little or no development present.(4) Vectors for streets and roads.
Our assessment is that a low light imaging system optimized for deriving the listedhuman settlement products would generate data suitable for a wider range ofapplications, such as monitoring fishing boat activity, mapping the spatialdistribution of economic activity, or the analysis of ecological effects of nocturnallighting (Rich and Longcore 2006). The low-light imaging spectral, radiometric andspatial resolution requirements for the extraction of the features listed above havenot been defined to date.
4. Data collection
To explore the remote sensing of night-time lights, we have collected data on theground, from the air, and from space.
4.1 Field spectra of lights
A survey of the spectral information content of commonly used lighting sources wasconducted using high spectral resolution field spectra. Spectra were acquired of asuite of outdoor lighting types, including streetlights (mercury vapour lamps andhigh pressure sodium vapour lamps), incandescent lights from vehicles and homes,and lights present at commercial and government facilities (fluorescent, neon andlow-pressure sodium vapour lamps). Spectra were acquired using a portablespectrometer manufactured by analytical spectral devices. The spectra werecollected as irradiances, while pointing the instrument head directly at each lightsource.
The Nightsat mission concept 2651

Dow
nloa
ded
By:
[CD
L Jo
urna
ls A
ccou
nt] A
t: 22
:44
21 J
une
2007
4.2 Space photography
We investigated the feature content of moderate-resolution colour imagery of lightsat night from space with digital photography acquired from the InternationalSpace Station (ISS). Astronauts have long marveled at the shear beauty and thetechnical information about the development of humanity from city lights at nightas viewed from orbit. However, the features have been difficult to photograph,owing to mismatches between the optimal exposure times and the velocity of thespacecraft. During Expedition 6 (23 November 2002—3 May 2003) to theInternational Space Station, a mechanized but manually driven image motioncompensation mount was built from existing hardware and images were acquiredof cities at night all over the world through an optical-quality nadir-viewingwindow. Images were acquired of large urban areas and a number of sparselypopulated areas. About 2000 images with dark currents and flat field exposureswere collected.
The orbital tracking mount consisted of the IMAX movie camera mount withboth, a 70mm film format (55mm square image) Haselblad 203 camera with 350mmtelephoto lens (a square field of view of 9 degrees) and a Kodak-Nikon 760 digitalcamera with 58mm, f1.2 nocto aspheric lens (see figure 3). A Makita drill driver wasused to rotate a long threaded bolt that pushed against a wedge and drove onedirection of gimbal at a smooth rate, determined by the degree that the trigger wassqueezed on the drill driver. The mount was attached to the 508 cm diameter, nadirviewing science window in the US Laboratory module so that the direction ofgimbal was aligned with the direction of orbital motion. In operation, the astronautwould look through the Hasselblad camera, vary the rotation rate of the drill driveruntil city lights were stationary with respect to the view finder reticule, and then takethe images using the Kodak-Nikon 760 digital camera. The ground sample distance(GSD) of the imagery is 60m, however not all the images had the same degree ofsharpness, hence ground resolution owing to variations in effectiveness of the imagemotion compensation.
4.3 Airborne photography
The spatial resolution and detection limit requirements for a Nightsat wereinvestigated using night-time visible band digital imagery, acquired using a CirrusDSC camera (table 1). The Cirrus camera was flown on NASA’s ER-2 aircraftacross Las Vegas, Nevada and Los Angeles, California on 27 September 2004 at13.7 km above sea level. Digital photography was acquired using an 80mm lens anda 1/60th s exposure. The Cirrus DCS is designed as a colour camera. For the night-time collections the infrared blocking filter was removed and the signal from each ofthe three bands were aggregated in post flight processing to form panchromaticimagery. The collections span desert areas devoid of lighting, cross a wide range ofdevelopment types, and encounter the world’s brightest light, emitted from theLuxor Hotel and Casino in Las Vegas. The Luxor lighting installation is composedof thirty-nine 7000 Watt xenon lamps, pointing straight up into the sky (figure 4).The lighting installation intensity reaches 40 billion candelas. The spatial resolutionof the Cirrus camera data was 1.5m at 16-bit quantitization. The Cirrus camera wassubsequently calibrated using an integrating sphere at the NASA Ames ResearchCenter.
2652 C. D. Elvidge et al.

Dow
nloa
ded
By:
[CD
L Jo
urna
ls A
ccou
nt] A
t: 22
:44
21 J
une
2007
Figure 3. The optical window on the International Space Station and the improvized imagemotion compensation attachment used to acquire moderate resolution colour photography ofcities at night.
The Nightsat mission concept 2653

Dow
nloa
ded
By:
[CD
L Jo
urna
ls A
ccou
nt] A
t: 22
:44
21 J
une
2007
5. Defining requirements for Nightsat data
5.1 Spatial resolution requirements
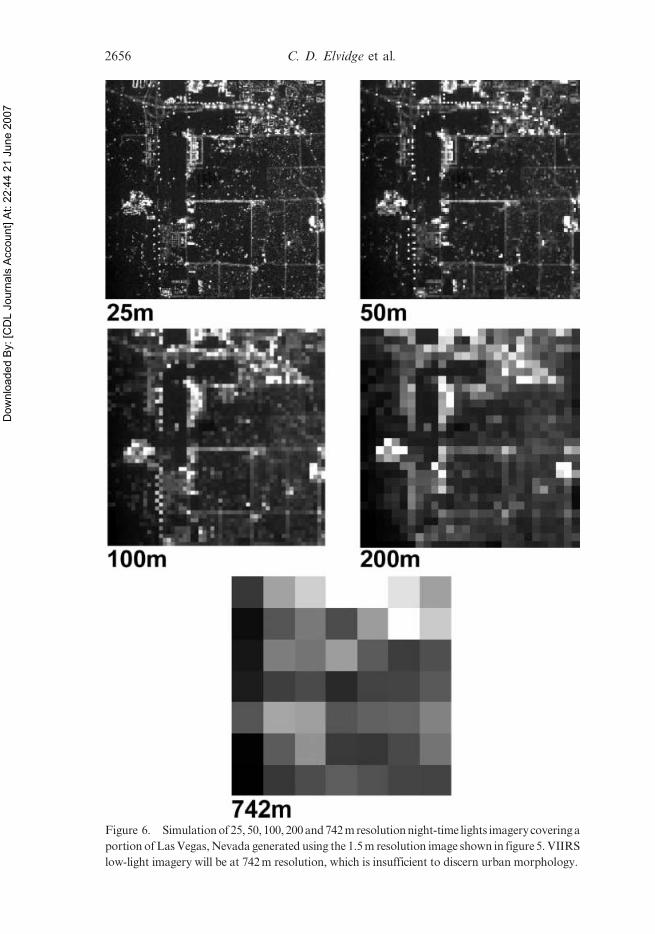
To determine the spatial resolution necessary to adequately characterize night-timelights we analysed the 1.5m resolution night-time camera imagery. In the fullresolution imagery it is easy to distinguish major roads, commercial centres, dimlylit residential neighbourhoods, and undeveloped tracts without lights (figure 5).Acceptable spatial resolutions would retain these basic features. We used the 1.5mdata to simulate imagery at resolutions of 25, 50, 100, 200 and 742m (figure 6). Inaddition, we examined the ISS night-time photography of cities at night. Figure 7shows two of the ISS images we examined, covering Chicago and Tokyo.
With the original Cirrus camera data (1.5m resolution), it is possible to detectmany individual lights in residential neighbourhoods, individual streetlights and a litarea surrounding many of these lights. Lines of streetlights delineate many streetsand roads. Commercial buildings and commercial properties are lit much morebrightly than residential areas and can be readily distinguished. As the resolution isdegraded, finer detail is gradually lost, but most features, such as streets and roads,are still evident at both 25 and 50m resolution. At 100m resolution, major forms arestill evident, such as major streets and roads and clusters of commercial buildings.At 200m resolution, very few features remain. At 742m resolution, the resolutionthat will be provided by the VIIRS low-light imaging band, none of the features seenso clearly in the original imagery can be discerned.
Figure 4. The 40 billion candela xenon beacon pointed into the sky from the Luxor Hoteland Casino in Las Vegas, Nevada was one of several light sources found to saturate the CirrusDCS camera flown at 13.7 km above the earth.
2654 C. D. Elvidge et al.

Dow
nloa
ded
By:
[CD
L Jo
urna
ls A
ccou
nt] A
t: 22
:44
21 J
une
2007
Based on the spatial resolution simulations conducted with the Cirrus cameraimagery, we conclude that 50 to 100m resolution would be necessary to retain theprimary night-time lights features present in urban and rural environments. Thesefindings are corroborated by the delineation of commercial centres and major roadswith the ,60m resolution ISS night-time photography (figure 7). Obviously, asensor capable of acquiring 25m low-light imaging data will be physically larger,more expensive, and have a higher data volume than a system providing 100mresolution data. Overall, 50 to 60m resolution low-light imaging data appears tostrike the best balance, making it feasible to map urban forms and measuredevelopment growth rates on an annual basis.
5.2 Low-light imaging spectral bands
Outdoor lighting sources can be divided into three primary types: flames (lightproduced by combustion), incandescent (light produced using heated filaments), andvapour lamps (where light is generated by electrically charged gases, e.g. mercury
Figure 5. Airborne night-time lights imagery at 1.5m resolution covering a portion of LasVegas, Nevada. Imagery acquired from NASA’s ER-2 flown at 13.7 km above the Earth witha Cirrus DCS digital camera.
The Nightsat mission concept 2655
Dow
nloa
ded
By:
[CD
L Jo
urna
ls A
ccou
nt] A
t: 22
:44
21 J
une
2007
Figure 6. Simulationof 25, 50, 100, 200and742mresolutionnight-time lights imagerycoveringa
portion ofLasVegas,Nevada generated using the 1.5m resolution image shown in figure5. VIIRS
low-light imagery will be at 742m resolution, which is insufficient to discern urban morphology.
2656 C. D. Elvidge et al.

Dow
nloa
ded
By:
[CD
L Jo
urna
ls A
ccou
nt] A
t: 22
:44
21 J
une
2007
Figure 7. Chicago (top) and Tokyo (below) as imaged at night from the ISS. The resolutionof the imagery is approximately 60m. The ISS cities at night digital photographydemonstrates the feasibility of collecting moderate resolution multispectral low-light imagingdata globally from a satellite platform.
The Nightsat mission concept 2657
Dow
nloa
ded
By:
[CD
L Jo
urna
ls A
ccou
nt] A
t: 22
:44
21 J
une
2007
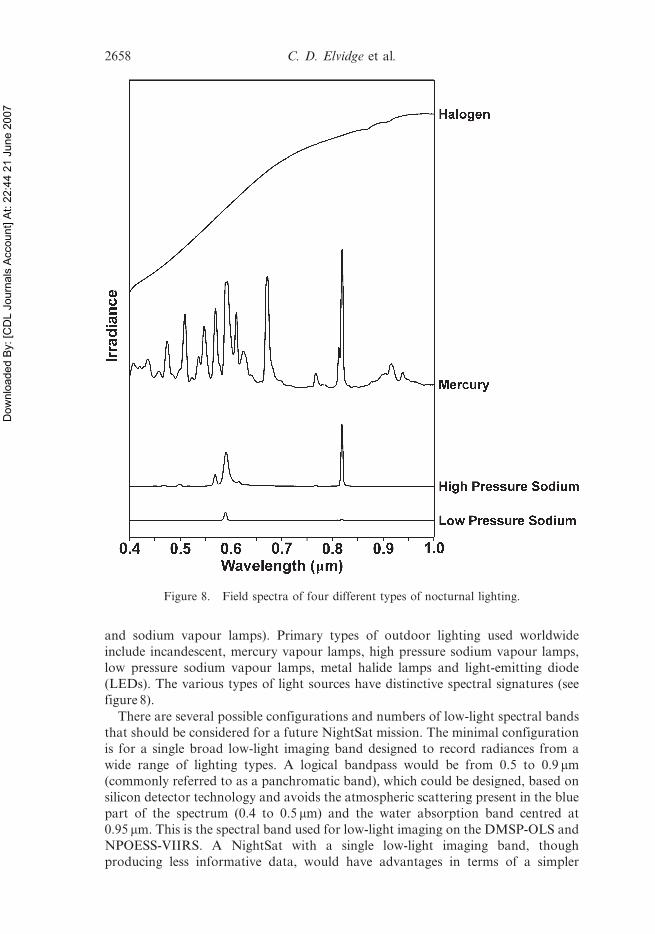
and sodium vapour lamps). Primary types of outdoor lighting used worldwideinclude incandescent, mercury vapour lamps, high pressure sodium vapour lamps,low pressure sodium vapour lamps, metal halide lamps and light-emitting diode(LEDs). The various types of light sources have distinctive spectral signatures (seefigure 8).
There are several possible configurations and numbers of low-light spectral bandsthat should be considered for a future NightSat mission. The minimal configurationis for a single broad low-light imaging band designed to record radiances from awide range of lighting types. A logical bandpass would be from 0.5 to 0.9 mm(commonly referred to as a panchromatic band), which could be designed, based onsilicon detector technology and avoids the atmospheric scattering present in the bluepart of the spectrum (0.4 to 0.5 mm) and the water absorption band centred at0.95 mm. This is the spectral band used for low-light imaging on the DMSP-OLS andNPOESS-VIIRS. A NightSat with a single low-light imaging band, thoughproducing less informative data, would have advantages in terms of a simpler
Figure 8. Field spectra of four different types of nocturnal lighting.
2658 C. D. Elvidge et al.

Dow
nloa
ded
By:
[CD
L Jo
urna
ls A
ccou
nt] A
t: 22
:44
21 J
une
2007
design, lower costs, and potentially lower data volume and simpler data processingfor product generation.
Collecting data with a set of low-light imaging bands, specifically tailored for night-time lights, would be indispensable to (i) obtain quantities that can be related directlyto international recognized measurements and standards for outdoor lighting, (ii)define the predominant type or mixture of lighting present, and consequently (iii)detect changes in lighting type over time. In considering the bandpass options for amultispectral Nightsat, it is important to consider the characteristics of human vision,internationally recognized lighting standards, the spectral content of lighting sources,and the responses of other species to different spectra.
With hyperspectral low-light imaging, the full spectral complexity of artificiallight sources could be observed. This would be the best approach for the mappingof lighting types and how they change over time. Achieving the detection limitsand spatial resolution requirements specified above with a hyperspectral imager,however, would be a technological challenge that would increase the sensor size,data rates, and processing complexity. Given the magnitude of these challenges,we propose that the first NightSat have from three to five low-light imagingbands.
Artificial night-time lighting design is based on the visual sensation of the humanobserver. The aim of photometry is to measure light in such a way that the result canbe correlated with the visual sensation to a normal human observer exposed to thatradiation. In 1979, Conference Generale des Poids et Mesures (CGPM 1979)redefined the basic SI unit candela (cd), formerly defined based on the radiationfrom platinum at the temperature of its solidification, as ‘the luminous intensity, in agiven direction, of a source that emits monochromatic radiation of frequency540610l2 hertz and that has a radiant intensity in that direction of (1/683) Watt persteradian.’ In redefining the candela, photometry merged with radiometry—a fieldcommonly used in remote sensing. To achieve the aim of photometry, one musttake into account the characteristics of human vision, i.e. its relative spectralresponsivity. The relative luminous efficiency function for photopic vision—thephotopic band—was originally proposed by Gibson and Tyndall (1923) and wasadopted by the Commission International de l’Eclairage in 1924 (CIE 1924). Thephotopic band, shown in figure 9 has a bandpass (full width half maximum)spanning from 0.51 to 0.61 mm and has peak responsivity at 0.555 mm. Althoughthe photopic band does not properly match the relative spectral responsivity ofhuman vision (e.g. Judd 1951, Vos 1978, Stockman and Sharpe 1999) it has beenwidely adopted and remains an irrefutable standard in lighting science andtechnology. The photopic band has been published by Comite International desPoids et Mesures in 1982 (CIPM 1982) to supplement the 1979 definition ofcandela and republished by CIE in 2004 (CIE 2004). More recently, it has beenadopted as an ISO standard (ISO 23539:2005). Photopic response is largelydetermined by the properties of the population of cone photoreceptors, which lieat the centre of the retinal region providing the most acute vision, the fovea.Night-time outdoor lighting has typical luminances (radiance in ISO photopicband) on the order of 1 to 2 cd/m2. In this range of luminances, the vision responseis derived mainly from cones. Because artificial night-time lighting installations aredesigned based on the photopic quantities (e.g. luminances) prescribed by standardrules or as required by customers, the photopic band is a key spectral band forNightSat applications such as estimation of ambient population, the spatial
The Nightsat mission concept 2659

Dow
nloa
ded
By:
[CD
L Jo
urna
ls A
ccou
nt] A
t: 22
:44
21 J
une
2007
distribution of economic activity, and the measurement of development growthrates.
The spectral responsivity of human vision deviates significantly from the photopicresponse at very low levels of luminance when rod photoreceptors became moreimportant than cones in determining the eye response. Vision with the retinal rodsalone, at luminances under about 0.01 cd/m2, is determined by the relative luminousefficiency function for scotopic vision (Le Grand 1951, Wyszecki and Stiles 1967). Itwas defined by CIE in 1951 (CIE 1951), recognized by CIPM in 1976 and 1982(CIPM 1976, 1982), and adopted by ISO in 2005 (ISO 23539:2005). The term‘scotopic’ should not be mistaken for ‘night vision’, which can involve both, rodsand cones. It is much more restrictive because it applies to the rods alone. Thescotopic vision generally occurs only in specific nocturnal situations recognizablebecause no colours are seen but only an achromatic whitish-greenish sensation. Thescotopic band is the second standard band for physical photometry used in lightingengineering. The scotopic band, shown in figure 9, spans from 0.454 to 0.549 mm fullwidth half maximum (FWHM) and has peak responsivity at 0.507 mm. The scotopicto photopic lumen ratio can be used to describe the whiteness of the light when moreaccurate chromaticity coordinates are not available. It is of particular interest for usbecause (i) the ‘whiteness’ of the light could be used as an additional estimator ofparameters, such as population density and economic activity, (ii) the scotopic tophotopic lumen ratio can be used to distinguish between the main class of lampspectra (table 2), and (iii) the radiance in the scotopic band is fundamental tocompute the effects of light pollution on the scotopic vision of the eye, i.e. forobservers in low luminosity conditions. As an example, luminous stars tends to beseen with cones, in particular under bright skies, but pure, or almost pure, rod visionis responsible for the whitish starred sky that we see as background, in dark sites.
Figure 9. Relative response curves for the scotopic and photopic bands. For comparison,the spectrum from a high pressure sodium streetlight is plotted in red.
2660 C. D. Elvidge et al.
Dow
nloa
ded
By:
[CD
L Jo
urna
ls A
ccou
nt] A
t: 22
:44
21 J
une
2007
Based on these considerations, the scotopic band should be included with thephotopic band on a multispectral Nightsat.
For improved discrimination of lighting types and changes in lighting types overtime, additional low-light imaging bands at wavelengths longer than the photopicband could be defined. These additional low-light imaging bands would assist indiscrimination of lighting types with broad spectral emission, like incandescent (seefigure 8), metal halide (flat broad spectra) and LED lamps. Radiance emissions fromincandescent lamps and flames follow a blackbody emission pattern and are muchbrighter in the near infra-red (NIR) than in the visible. In contrast, emissions fromLED lamps are typically low in the NIR. There is a prominent sodium vapouremission line at 0.82 mm (see figure 8) for which a spectral band could be tailored.
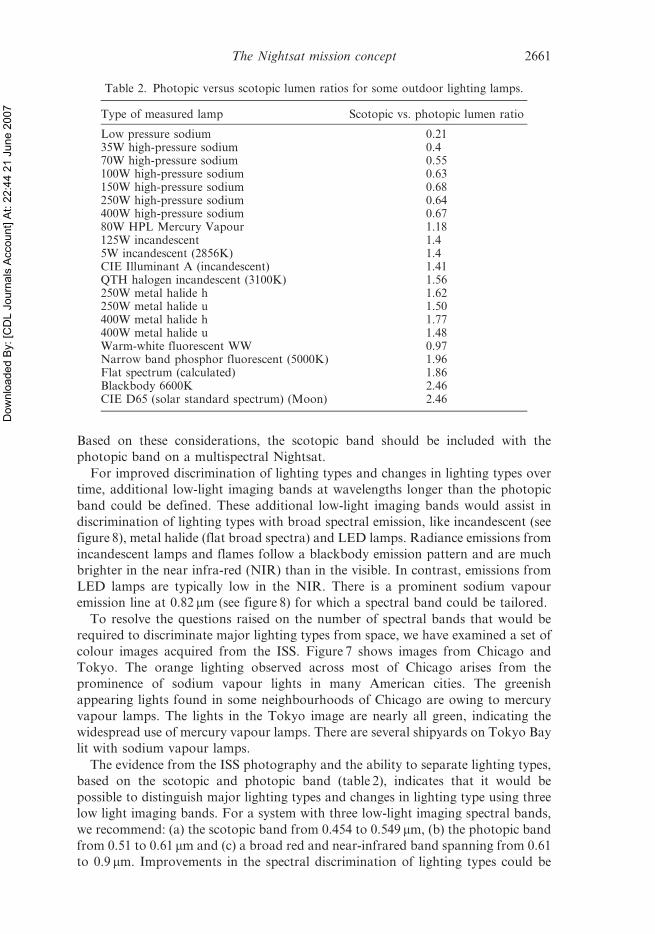
To resolve the questions raised on the number of spectral bands that would berequired to discriminate major lighting types from space, we have examined a set ofcolour images acquired from the ISS. Figure 7 shows images from Chicago andTokyo. The orange lighting observed across most of Chicago arises from theprominence of sodium vapour lights in many American cities. The greenishappearing lights found in some neighbourhoods of Chicago are owing to mercuryvapour lamps. The lights in the Tokyo image are nearly all green, indicating thewidespread use of mercury vapour lamps. There are several shipyards on Tokyo Baylit with sodium vapour lamps.
The evidence from the ISS photography and the ability to separate lighting types,based on the scotopic and photopic band (table 2), indicates that it would bepossible to distinguish major lighting types and changes in lighting type using threelow light imaging bands. For a system with three low-light imaging spectral bands,we recommend: (a) the scotopic band from 0.454 to 0.549 mm, (b) the photopic bandfrom 0.51 to 0.61 mm and (c) a broad red and near-infrared band spanning from 0.61to 0.9 mm. Improvements in the spectral discrimination of lighting types could be
Table 2. Photopic versus scotopic lumen ratios for some outdoor lighting lamps.
Type of measured lamp Scotopic vs. photopic lumen ratio
Low pressure sodium 0.2135W high-pressure sodium 0.470W high-pressure sodium 0.55100W high-pressure sodium 0.63150W high-pressure sodium 0.68250W high-pressure sodium 0.64400W high-pressure sodium 0.6780W HPL Mercury Vapour 1.18125W incandescent 1.45W incandescent (2856K) 1.4CIE Illuminant A (incandescent) 1.41QTH halogen incandescent (3100K) 1.56250W metal halide h 1.62250W metal halide u 1.50400W metal halide h 1.77400W metal halide u 1.48Warm-white fluorescent WW 0.97Narrow band phosphor fluorescent (5000K) 1.96Flat spectrum (calculated) 1.86Blackbody 6600K 2.46CIE D65 (solar standard spectrum) (Moon) 2.46
The Nightsat mission concept 2661

Dow
nloa
ded
By:
[CD
L Jo
urna
ls A
ccou
nt] A
t: 22
:44
21 J
une
2007
achieved by splitting this third band into either two or three individual bands. Therecommended four band system would have the scotopic, photopic, red and broadNIR bands. The recommended five band system would split the broad NIR bandinto two, with the fifth band encompassing the prominent sodium vapor emissionline present at 0.82 These options are presented in table 3.
5.3 Low light imaging detection limits
In examining the Cirrus camera imagery, we found that the dimmest detectablelighting had radiances in the range of 5E25Watts cm22 srv1mm21. These areas weregenerally lit terrain closely surrounding shielded lights. The signal-to-noise ratio(SNR) for this lighting was about nine. Lighting from individual poorly shielded100-Watt incandescent bulbs present on the exteriors of recently constructed homesproduced measured radiances in the range of 1E24Watts cm22 sr21mm21 The Cirruscamera saturated at radiances above 3.83E23Watts cm22 sr21mm21. The Luxor light(figure 4) produced a 37m diameter circular zone of saturated pixels. Other smallareas of saturated data were found on large casinos near the Luxor. Since the Luxorbeacon is the brightest light on earth, this effectively defines the saturation radiancefor a Nightsat at approximately 2.5E22Watts cm22 sr21mm21, a level suitable fordaylight imaging of the earth.
The night-time light features from the Cirrus camera imagery were comparedagainst 1m Ikonos imagery acquired a week earlier. This examination revealed thatthe Cirrus camera imagery detected lighting in most, but not all, areas ofdevelopment. The Cirrus camera was unable to detect lit surfaces more than about10m out from individual streetlights. Examining the background DN (digitalnumber) values along transects from dark desert areas through the centre of the LasVegas Strip revealed that the Cirrus camera was unable to detect the broad region ofterrain lit by artificial night sky brightness inside of an urban centre. Likewise, theCirrus camera would have been unable to detect moonlit terrain if the data had beencollected under full moon conditions.
There is a growing trend for the installation of shielding on outdoor lighting, toreduce light pollution and to conserve energy. Full cutoff shielding directs all of thelighting towards the surface below, with no lighting emissions directed towards thesky. It would be important to be able to detect the areas lit by well shielded lightinginstallations out to illumination levels commonly prescribed for outdoor lighting.Otherwise, implementation of currently available technology and continuation of
Table 3. Spectral band options for panchromatic, three, four and five low-light imagingbands.
Numberof bands Band 1 Band 2 Band 3 Band 4 Band 5
One 0.5–0.9 umTwo Not recommendedThree Scotopic band
0.454 to 0.549mmPhotopic band0.51 to 0.61mm
Red to NIRband 0.61 to0.9mm
Four Scotopic band0.454 to 0.549mm
Photopic band0.51 to 0.61mm
Red band 0.61to 0.7mm
NIR band 0.7to 0.9 mm
Five Scotopic band0.454 to 0.549mm
Photopic band0.51 to 0.61mm
Red band 0.61to 0.7mm
NIR band A0.7 to 0.8mm
NIR band B0.8 to 0.9mm
2662 C. D. Elvidge et al.
Dow
nloa
ded
By:
[CD
L Jo
urna
ls A
ccou
nt] A
t: 22
:44
21 J
une
2007
the trend towards shielding could render a NightSat useless for the detection ofwidespread artificial lighting.
From these observations, it is evident that are several detection limit options for aNightSat sensor. The detection of lighting from commercial centres and streetlightsas widely configured today could be accomplished with a system having capabilitiescomparable to the Cirrus digital camera system (DCS) camera, i.e. in the1E25Watts cm22 sr21mm21 range for the photopic band. Because the Cirrus camerawas unable to detect many areas of known lighting, it is recommended that theNightsat detection limits be substantially lower than those achieved by the Cirruscamera. It is estimated that detection of the terrain lit by shielded lights and sparselighting in rural environments would require detection limits in the2.5E28Watts cm22 sr21mm21 range in photopic band for a 50m pixel size.Quantification of lighting levels on terrain illuminated by artificial sky brightnessin and around urban centres would require detection limits in the5E210Watts cm22 sr21mm21 range in photopic band.
Based on these considerations we recommend the Nightsat’s minimal detectableaverage spectral radiance in photopic band at 2.5E28Watts cm22 sr21mm21 with aSNR of 10 and a saturation radiance of 2.5E22Watts cm22 sr21mm21. Thissaturation radiance would make it possible for Nightsat to collect unsaturateddata, even during the daylight portion of the orbits. If a detection limit of5E210Watts cm22 sr21mm21 could be achieved, it would be possible to analyse thepatterns of artificial sky brightness that surround major cities. Given the engineeringchallenge of achieving the recommended detection limits, it is clear that systemscapable of detecting light in the 2.5E28Watts cm22 sr21mm21 range would providequite useful data.
The question then arises, at what detection limit would a Nightsat begin to have acapability to detect moonlit terrain? How would this affect the data quality andprocessing of Nightsat data acquired under high lunar illumination conditions?Lunar illuminance depends mainly on the phase, the elevation of the moon abovethe horizon, and atmospheric extinction. We can roughly calculate the magnitudeorder of the maximum radiance observed from the satellite for a typical soil (20%albedo) near full moon (0.3 lx), and an atmospheric transmission of 0.7. Thisradiance is estimated to be 2E28Watts cm22 sr21mm21 in the photopic band. Bysetting the Nightsat detection limits slightly above the sensitivity required to detectheavily moonlit objects, the effects of lunar cycles on the Nightsat observationswould be reduced. For a sensor capable of detecting radiances in the5E210Watts cm22 sr21mm21 range observations of dimly lit terrain would havenon-negligible errors, if measured during moonlight. The observed radiance ofmoonlighted soil is comparable to the minimal radiance required to observe a dimlylit road, even if the ratio between the luminances of the road and the soil is around15. In fact, a typical 8m wide road fills 1/6 of a pixel with 50m pixel size and it likelyhas a uniformity of about 50%, whereas moonlight has a filling factor of 100% and auniformity of 100%. The lunar contribution could not be computed and subtracted,unless detailed information about surface reflectance was available at the resolutionof the Nightsat data. In the absence of surface albedo, valid radiances could beextracted from the upper end of the dynamic range (e.g. above1E26Watts cm22 sr21mm21), thresholding out the dim lighting associated withmoonlit terrain. With this lunar thresholding approach, there would be some loss inthe detection of dim lighting associated sparse rural and exurban populations when
The Nightsat mission concept 2663
Dow
nloa
ded
By:
[CD
L Jo
urna
ls A
ccou
nt] A
t: 22
:44
21 J
une
2007
lunar illuminance is high. It is clear that as with the OLS, the best night-time lightsdata would be collected on nights with little or no lunar illuminance.
5.4 Thermal band
Thermal band data would be essential for discrimination of cloud-free areasobserved with a NightSat. In addition, thermal band data would facilitate in theidentification of lighting produced from combustion (e.g. biomass burning and gasflares). The thermal band data could be provided from another sensor, if NightSatwere flown on a multisensor platform. Otherwise, a NightSat would need to have atleast one thermal band for use in cloud and fire discrimination. An examination ofMODIS Airborne Simulator data collected over Los Angeles, California, indicatesthat a single thermal band in the 3 to 5mm region could be used for both, cloud andfire. The thermal band data should be co-registered with the low-light imaging banddata, but the spatial resolution could be somewhat coarser, perhaps in the 300 to500m range.
5.5 Orbital requirements
There are four primary issues to be considered for the orbit of a future NightSatmission.
5.5.1 Global coverage. The orbit should permit the collection of global coveragefrom a single satellite. Achieving global coverage with a single satellite could only beaccomplished using a polar orbit.
5.5.2 Overpass time. Having a consistent overpass time would be important foraccurate change detections. In many regions of the world, outdoor lighting isgradually turned off starting around 10 p.m. Thus, the ideal overpass time would bethe middle of the evening, i.e. in the 8:30 to 10:00 p.m. range. This time slot wouldpermit the observation of the maximum extent of lighting in regions where lightsmay be gradually turned off as midnight approaches. An earlier overpass timewould result in reductions in data coverage, due to solar contamination present atmid-to-high latitudes during the summer months. As with the requirement for globalcoverage, the requirement for a consistent overpass time implies a polar orbit.
5.5.3 Low altitude. Achieving the spatial resolution and detection limit targetsdefined above will require a specialized sensor, capable of collecting and processingminute quantities of light. This would be easier—in terms of the sizing of thesensor—from a lower altitude orbit than a higher altitude orbit.
5.5.4 Repeat cycle. Multiple collections would be required for most parts of theworld to ensure that a global cloud-free annual composite could be produced. Theother factor to consider is the lunar cycle. Automated extraction of surface lightingfeatures would become complicated for a sensor capable of detecting moonlit terrain(e.g. detection limits in the range of 2E28Watts cm22 sr21mm21). For example,shadows would appear in the imagery where terrain or large buildings obstructedmoonlight. The lunar contribution to the signal and variations introduced byshadowing would detract from the quality of NightSat data collected on nights whenlunar illumination is high. Therefore, it would be important to randomize the mix oflunar conditions under which observations would occur during a year for anyparticular location. The least desirable repeat cycle for a Nightsat would be 29 days,
2664 C. D. Elvidge et al.

Dow
nloa
ded
By:
[CD
L Jo
urna
ls A
ccou
nt] A
t: 22
:44
21 J
une
2007
matching the synodic period of the Moon (29.5305 89 days on average). With thistype of orbit, orbital strips would be acquired at nearly the same lunar phasethroughout the year. Likewise, a repeat cycle period of 15 days would result in thecollection of data at two opposite lunar phases throughout the year. To betterrandomize the lunar illumination conditions of collections for each part of the worldduring a year, a repeat cycle of ,20 days could be utilized. With a polar orbit and a20-day repeat cycle, most areas of the world could be collected 18 times per year.
5.5.5 Alternative orbits. A polar orbit would be required to achieve globalcoverage from a single satellite and a consistent overpass time in the early evening. ANightsat instrument on a platform, such as the ISS, could acquire substantialquantities of valuable night-time lights data. The relatively low orbit of the ISSwould make achieving the GSD and radiometric capabilities specified easier. Thelatitude range over which data could be collected would be limited to approximately50u north and south. Users would need to consider how variations in the localoverpass times might affect the observations. More detailed analysis of the diurnalpattern of night-time lighting and power outages associated with disasters could beobserved from geostationary satellites. Because geostationary orbits are muchhigher than standard polar orbits, the spatial resolutions would be coarse. However,as seen with the OLS, spatial resolutions in the range of 1 to 5 km would still provideuseful data on diurnal patterns and power outages.
6. Nightsat observational requirements
We propose a mission sensor with similarity to Landsat, optimized for theconstruction of annual global cloud-free, radiance-calibrated composite images ofnight-time lights. The system capabilities are summarized in table 4.
(1) Low-light imaging with one or more visible/NIR bands with detection limitsand dynamic range suitable for detecting and measuring radiances fromnight-time lights. The minimal detectable radiance should be at least2.5E28Watts cm22sr21mm21.
(2) Nadir pointing with a GSD in the 50 to 100m range, and a swath ofapproximately 100 km.
Table 4. Nightsat performance metrics.
Low-light band(s) Thermal band(s)
Ground sample distance (m) 50–100 300–500GIFOV (m) 70–150 400–600Swath (km) ,200 ,200Revisit time (days) ,20 ,20Geolocation error (RMS in m) 50 100Min. radiance or temperature(Watts cm22 sr21mm21 ordegrees K)
Good: 2.5E28 (human settlements) 240KBetter: 2.5E29 (terrain lit by shieldedlighting and sparsely lit development)Best: 5E210 (artificial sky brightness)
Max. radiance or temperature(Watts cm22 sr21mm21 ordegrees K)
2.5E22 (sunlit terrain) 400K
Duty cycle 40% 40%
The Nightsat mission concept 2665

Dow
nloa
ded
By:
[CD
L Jo
urna
ls A
ccou
nt] A
t: 22
:44
21 J
une
2007
(3) On-board calibration or a repeatable procedure for calibrating sensor datato radiance units.
(4) One or more thermal bands for detecting cloud-free areas and contamina-tion by fires (300 to 500m GSD). The VIIRS instrument could provide thethermal band data if NightSat were flown on an NPOESS satellite.
(5) Collection from a polar orbiting satellite in low earth orbit, with a mid-evening overpass (8:30 to 10:00 p.m. local time) and a repeat cycle of about20 days.
(6) Geolocation accuracy comparable to Landsat.
7. Conclusion
Satellite sensors, designed for the collection of reflected sunlight, do not havedetection limits low enough to observe nocturnal lighting. Satellite observation ofnight-time lights at a spatial resolution, suitable for mapping urban forms anddetection, limits tailored to span the range from sparse development in rural areas tothe cores of urban centres will require a specialized sensor. We have analysed acombination of field, laboratory, and airborne data to develop the generalspecifications for such a system, which we call Nightsat. The data from aNightsat system would enable a wide range of social, economic, and biologicalapplications where there is currently a dearth of systematically collected, unbiased,global data. Nightsat data would provide important constraints and inputs for thespatial modelling of human population growth and distribution, land use, rates ofdevelopment, anthropogenic emissions to the atmosphere and independentestimation of economic indices. In addition, Nightsat data would be used to modeland understand human impacts on the environment such as the proliferation ofimpervious surface area, non-point sources of aquatic pollution, habitat fragmenta-tion, and the direct effects of nocturnal lighting on night environment, humanhealth, security, and the visibility of stars.
Moderate resolution low-light imaging sensor data would be an importantcomplement to the mapping capacity of moderate resolution daytime imagingsensors such as Aster and Landsat because it would provide an unambiguousindication of the presence of development and growth in development. Nightsatdata would also be useful for calibrating and validating coarser resolution low-lightimaging data acquired with the OLS and VIIRS sensors.
To be effective in delineating primary night-time lighting patterns, Nightsat low-light imaging data must be acquired in the range of 50 to 100m spatial resolution andachieve minimal detectable radiances in the range of 2.5E28Watts cm22 sr21mm21 (orbetter) with a SNR of 10.While panchromatic low-light imaging data would be useful,multispectral low-lighting imaging data acquired with three to five spectral bandswould enable more quantitative applications and enable the detection of lighting typeconversions. Cloud and fire screening of the low light imaging data would beaccomplished using simultaneously acquired thermal band data. The thermal banddata could come from VIIRS if Nightsat were flown on an NPOESS satellite. Thesystem would use a combination of methods to produce radiance-calibrated data.Geolocation accuracy would be ,50m, comparable to that of Landsat. The systemobjective would be to collect a sufficient quantity of imagery to construct annualglobal cloud-free composites of night-time lights. A near-sun-synchronous polarorbit, with an early evening overpass, would provide temporal consistency important
2666 C. D. Elvidge et al.
Dow
nloa
ded
By:
[CD
L Jo
urna
ls A
ccou
nt] A
t: 22
:44
21 J
une
2007
for change detection. The overall system performance is listed in table 4. It should benoted that additional research would be required to optimize the detection limits foreach of the proposed low-light imaging bands based on the spectra of a wide range ofcurrently available lighting types.
The weight of scientific evidence over the past decades point to human activity asthe primary driver for environmental and biological change on the planet. This istrue for the land, the sea, and the atmosphere. While other satellite missions focuson observing the changes in the environment, the Nightsat mission will focus onmapping the spatial distribution and intensity of an indicator of human activity—artificial lighting. The Nightsat sensor requirements have been set to cover a widerange in brightness levels and lighting types, providing detection of sparsedevelopment in rural areas and detailed mapping of forms present in urban areas.The ability to track the growth in lighting globally, in a consistent manner on anannual basis would enable a synoptic understanding of the human footprint on theland and ocean surface.
ReferencesBALK, D., POZZI, F., YETMAN, G., DEICHMANN, U. and NELSON, A., 2005, The distribution of
people and the dimension of place: methodologies to improve the global estimation ofurban extent. Proceedings of the Urban Remote Sensing Conference, Tempe, Arizona,April 2005.
CHO, K., R. Ito. R., SHIMODA, H. and SAKATA, T., 1999, Fishing fleet lights and sea surfacetemperature distribution observed by DMSP/OLS sensor. International Journal ofRemote Sensing, 20, pp. 3–9.
CIE 1924, Commission Internationale de l’Eclairage C.I.E., Compte Rendu des Seances,Sixieme Session, Geneve 1924, p. 67.
CIE 1951, Commission Internationale de l’Eclairage C.I.E., Compte Rendu, CIE CentralBureau, vol. 3, Table 11, pp. 37–39.
CIE 2004, The CIE system of physical photometry, CIE Standard 010/E: 2004.CINZANO, P., FALCHI, F., ELVIDGE, C.D. and BAUGH, K.E., 2000, The artificial night sky
brightness mapped from DMSP Operational Linescan System measurements.Monthly Notices of the Royal Astronomical Society, 318, pp. 641–657.
CINZANO, P., FALCHI, F. and ELVIDGE, C.D., 2001a, Naked eye star visibility and limitingmagnitude mapped from DMSP-OLS satellite data. Monthly Notices of the RoyalAstronomical Society, 323, pp. 34–46.
CINZANO, P., FALCHI, F. and ELVIDGE, C.D., 2001b, The first world atlas of the artificial nightsky brightness. Monthly Notices of the Royal Astronomical Society, 328, pp. 689–707.
CINZANO, P. and ELVIDGE, C.D., 2004, Night sky brightness at sites from DMSP-OLSsatellite measurements. Monthly Notices of the Royal Astronomical Society, 353, pp.1107–1116.
CIPM 1976, Comite Internationale Des Poids et Mesures C.I.P.M., Proces-Verbaux, 44, p. 4.CIPM 1982, Comite Consultatif de Photometrie et Radiometrie, Session-1982, Bureau
International Des Poids et Mesures, Sevres, France.CGPM 1979, Comptes Rendus des Seances de la 16e Conference Genrale des Poids et
Mesures, Paris 1979, Bureau International Des Poids et Mesures, Sevres, France.DOBSON, J., BRIGHT, E.A., COLEMAN, P.R., DURFEE, R.C. and WORLEY, B.A., 2000,
LandScan: a global population database for estimating populations at risk.Photogrammetric Engineering and Remote Sensing, 66, pp. 849–857.
DOLL, C.N.H., MULLER, J.-P. and ELVIDGE, C.D., 2000, Night-time imagery as a tool forglobal mapping of socio-economic parameters and greenhouse gas emissions. Ambio,29, pp. 157–162.
The Nightsat mission concept 2667
Dow
nloa
ded
By:
[CD
L Jo
urna
ls A
ccou
nt] A
t: 22
:44
21 J
une
2007
EBENER, S., MURRAY, C., TANDON, A. and ELVIDGE, C., 2005, From wealth to health:modeling the distribution of income per capita at the sub-national level using night-time lights imagery. International Journal of Health Geographics, 4, pp. 5–14.
ELVIDGE, C.D., BAUGH, K.E., KIHN, E.A., KROEHL, H.W. and DAVIS, E.R., 1997a, Mappingcity lights with nighttime data from the DMSP Operational Linescan System.Photogrammetric Engineering and Remote Sensing, 63, pp. 727–734.
ELVIDGE, C.D., BAUGH, K.E., HOBSON, V., KIHN, E., KROEHL, H., DAVIS, E. and COCERO, D.,1997b, Satellite inventory of human settlements using nocturnal radiation emissions: acontribution for the global toolchest. Global Change Biology, 3, pp. 387–395.
ELVIDGE, C.D., BAUGH, K.E., HOBSON, V.R., KIHN, E.A. and KROEHL, H.W., 1998,Detection of fires and power outages using DMSP-OLS data. In Remote SensingChange Detection: Environmental Monitoring Methods and Applications, R. Lunettaand C. Elvidge (Eds), pp. 123–135 (Ann Arbor Press).
ELVIDGE, C.D., BAUGH, K.E., DIETZ, J.B., BLAND, T., SUTTON, P.C. and KROEHL, H.W.,1999, Radiance calibration of DMSP-OLS low-light imaging data of humansettlements. Remote Sensing of Environment, 68, pp. 77–88.
ELVIDGE, C.D., IMHOFF, M.L., BAUGH, K.E., HOBSON, V.R., NELSON, I., SAFRAN, J.,DIETZ, J.B. and TUTTLE, B.T., 2001, Night-time lights of the world: 1994–1995.ISPRS Journal of Photogrammetry and Remote Sensing, 56, pp. 81–99.
ELVIDGE, C.D., MILESI, C., DIETZ, J.B., TUTTLE, B.T., SUTTON, P.C., NEMANI, R. andVOGELMANN, J.E., 2004, U.S. Constructed Area Approaches the Size of Ohio. AGUEOS Transactions, 85, p. 233.
GIBSON, K.S. and TYNDALL, E.P.T., 1923, Visibility of radiant energy. Scientific Papers of theBureau of Standards, 19, pp. 131–191.
HANSEN, J., 2001, Light at night, shiftwork, and breast cancer risk. Journal of the NationalCancer Institute, 93, pp. 1513–1515.
IMHOFF, M.L., LAWRENCE, W.T., ELVIDGE, C.D., PAUL, T., LEVINE, E., PRIVALSKY, M.V.and BROWN, V., 1997, Using nighttime DMSP/OLS images of city lights to estimatethe impact of urban land use on soil resources in the United States. Remote Sensing ofEnvironment, 59, pp. 105–117.
IMHOFF, M.L., BOUNOUA, L., DEFRIES, R., LAWRENCE, W.T., STUTZER, D., TUCKER, C.J. andRICKETT, T., 2004, The consequences of urban land transformation on netprimary productivity in the United States. Remote Sensing of Environment, 89, pp.434–443.
ISO 2005, The CIE system of physical photometry, ISO Standard 23539:2005(E) (Geneva:International Organization for Standardization).
JUDD, D.B., 1951, Report of U.S. Secretariat Committee on Colorimetry and ArtificialDaylight. Proceedings of the Twelfth Session of the CIE, Stockholm, pp. 1–11 (Paris:Bureau Central de la CIE).
LEE, T.F., MILLER, S.D., TURK, F.J., SCHUELER, C., JULIAN, R., DEYO, S., DILLS, P. andWANG, S., 2006, The NPOESS/VIIRS day/night visible sensor. Bulletin of theAmerican Meteorological Society, 87, pp. 191–199.
LE GRAND, Y., 1951, Comite d’Etudes sur la Lumiere et la Vision. In CommissionInternationale de l’Eclairage C.I.E., Compte rendu Stockholm, Vol. 1, Chap. 4, p. 1.
LONGCORE, T. and RICH, C., 2004, Ecological light pollution. Frontiers in Ecology and theEnvironment, 2, pp. 191–198.
MAXWELL, M.R., HENRY, A., ELVIDGE, C.D., SAFRAN, J., HOBSON, V.R., NELSON, I.,TUTTLE, B.T., DIETZ, J.B. and HUNTER, J.R., 2004, Fishery dynamics of theCalifornia market squid (Loligo opalescens), as measured by satellite remote sensing.Fishery Bulletin, 102, pp. 661–670.
MILESI, C., ELVIDGE, C.D., NEMANI, R.R. and RUNNING, S.W., 2003, Assessing the impact ofurban land development on net primary productivity in the southeastern UnitedStates. Remote Sensing of Environment, 86, pp. 273–432.
2668 C. D. Elvidge et al.

Dow
nloa
ded
By:
[CD
L Jo
urna
ls A
ccou
nt] A
t: 22
:44
21 J
une
2007
MILESI, C., ELVIDGE, C.D., DIETZ, J.NB., TUTTLE, B.J., NEMANI, R.R. and RUNNING, S.W.,2005, Mapping and modeling the biogeochemical cycling of turf grasses in the UnitedStates. Environmental Management, 36, pp. 426–438.
MILLER, S.D., hADDOCK, S.H.D., ELVIDGE, C.D. and LEE, T.F., 2005, Detection of abioluminescent milky sea from space. Proceedings of the National Academy ofSciences, 102, pp. 14181–14184.
PAULEY, S.M., 2004, Lighting for the human circadian clock: recent research indicates thatlighting has become a public health issue. Medical Hypotheses, 63, pp. 588–596.
RICH, C., and LONGCORE, T. (Eds), 2006, Ecological Consequences of Artificial Night Lighting(Washington, D.C.: Island Press).
RODHOUSE, P.G., ELVIDGE, C.D. and TRATHAN, P.N., 2001, Remote sensing of the globallight-fishing fleet: an analysis of interactions with oceanography, other fisheries andpredators. Advances in Marine Biology, 39, pp. 261–303.
SALMON, M., 2006, Protecting sea turtles from artificial night lighting at Florida’s oceanicbeaches. In Ecological Consequences of Artificial Night Lighting, C. Rich and T.Longcore (Eds), pp. 141–168 (Washington, D.C.: Island Press).
SALMON, M., WITHERINGTON, B.E. and ELVIDGE, C.D., 2000, Artificial lighting and therecovery of sea turtles. In Sea Turtles of the Indo-Pacific: Research, Management andConservation, N. Pilcher and G. Ismail (Eds), pp. 25–34 (London: ASEAN AcademicPress).
SAXON, E.C., PARRIS, T. and ELVIDGE, C.D., 1997, Satellite Surveillance of National CO2Emissions From Fossil Fuels. Harvard Institute for International Development,Development Discussion Paper 608.
SMALL, C., 2005, Global analysis of urban reflectance. International Journal of RemoteSensing, 26, pp. 661–681.
SMALL, C., POZZI, F. and ELVIDGE, C., 2005, Spatial analysis of global urban extent fromDMSP-OLS night lights. Remote Sensing of Environment, 96, pp. 277–291.
STEVENS, R.G. and REA, M.S., 2001, Light in the built environment: potential role ofcircadian disruption in endocrine disruption and breast cancer. Cancer Causes andControl, 12, pp. 279–287.
STOCKMAN, A. and SHARPE, L.T., 1999, Cone spectral sensitivities and color matching. InColor Vision: From Genes to Perception, K. Gegenfurtner and L.T. Sharpe (Eds) pp.51–85 (Cambridge: Cambridge University Press).
SUTTON, P., 1997, Modeling population density with nighttime satellite imagery and GIS.Computers, Environment, and Urban Systems, 21, pp. 227–244.
SUTTON, P.C., 2003, A scale-adjusted measure of ‘‘urban sprawl’’ using nighttime satelliteimagery. Remote Sensing of Environment, 86, pp. 353–363.
SUTTON, P., ROBERTS, D., ELVIDGE, C.D. and MEIJ, J., 1997, A comparison of nighttimesatellite imagery and population density for the continental United States.Photogrammetric Engineering and Remote Sensing, 63, pp. 1303–1313.
SUTTON, P.C., ROBERTS, D., ELVIDGE, C. and BAUGH, K., 2001, Census from heaven: anestimate of the global population using nighttime satellite imagery. InternationalJournal of Remote Sensing, 22, pp. 3061–3076.
SUTTON, P.C., ELVIDGE, C. and OBREMSKI, T., 2003, Building and evaluating models toestimate ambient population density. Photogrammetric Engineering and RemoteSensing, 69, pp. 545–553.
TOENGES-SCHULLER, N., STEIN, O., ROHRER, F., WAHNER, A., RICHTER, A., BURROWS, J.P.,BEIRLE, S., WAGNER, T., PLATT, U. and ELVIDGE, C.D., 2006, Global distributionpatter of anthropogenic nitrogen oxide emissions: Correlation analysis of satellitemeasurements and model calculations. Journal of Geophysical Research, 111, p.D05312.
VOGELMANN, J.E., HOWARD, S.M., YANG, L., LARSON, C.R., WYLIE, B.K. and VAN
DRIEL, N., 2001, Completion of the 1990s national land cover data set for the
The Nightsat mission concept 2669

Dow
nloa
ded
By:
[CD
L Jo
urna
ls A
ccou
nt] A
t: 22
:44
21 J
une
2007
conterminous united states from landsat thematic mapper data and ancillary datasources. Photogrammetric Engineering and Remote Sensing, 67, pp. 650–662.
VOS, J.J., 1978, Colorimetric and photometric properties of a 2-deg fundamental observer.Color Research and Application, 3, pp. 125–128.
WALUDA, C.M., TRATHAN, P.N., ELVIDGE, C.D., HOBSON, V.R. and RODHOUSE, P.G., 2002,Throwing light on straddling stocks of Ilex argentinus: assessing fishing intensity withsatellite imagery. Canadian Journal of Fisheries and Aquatic Sciences, 59, pp. 592–596.
WEEKS, J.R., 2004, Using remote sensing and geographic information systems to identify theunderlying properties of urban environments. In New Forms of Urbanization:Conceptualizing and Measuring Human Settlement in the Twenty-first Century, T.Champion and G. Hugo (Eds) (London: Ashgate Publishing Limited).
WEEKS, J.R., LARSON, D. and FUGATE, F., Patterns of urban land use as assessed by satelliteimagery: an application to Cairo, Egypt. In Population, Land Use, Environment:Research Directions,B. Entwisle, R. Rindfuss and P. Stern (Eds) (Washington, D.C.:National Research Council). In press.
WYSZECKI, G. and STILES, W.S., 1967, Color Science (New York: John Wiley).
2670 The Nightsat mission concept