the new york midtown dispersion study (mid-05) meteorological data
TRANSCRIPT

THE NEW YORK MIDTOWN DISPERSION STUDY (MID-05) METEOROLOGICAL DATA
R. Michael Reynolds, T.M. Sullivan, S. Smith, V. Cassella
July 25, 2006
Environmental Sciences Department/Environmental Research & Technology Division
Brookhaven National Laboratory
P.O. Box 5000 Upton, NY 11973-5000
www.bnl.gov
Notice: This manuscript has been authored by employees of Brookhaven Science Associates, LLC under Contract No. DE-AC02-98CH10886 with the U.S. Department of Energy. The publisher by accepting the manuscript for publication acknowledges that the United States Government retains a non-exclusive, paid-up, irrevocable, world-wide license to publish or reproduce the published form of this manuscript, or allow others to do so, for United States Government purposes.
BNL-77945-2007-IR

DISCLAIMER
This report was prepared as an account of work sponsored by an agency of the United States Government. Neither the United States Government nor any agency thereof, nor any of their employees, nor any of their contractors, subcontractors, or their employees, makes any warranty, express or implied, or assumes any legal liability or responsibility for the accuracy, completeness, or any third party’s use or the results of such use of any information, apparatus, product, or process disclosed, or represents that its use would not infringe privately owned rights. Reference herein to any specific commercial product, process, or service by trade name, trademark, manufacturer, or otherwise, does not necessarily constitute or imply its endorsement, recommendation, or favoring by the United States Government or any agency thereof or its contractors or subcontractors. The views and opinions of authors expressed herein do not necessarily state or reflect those of the United States Government or any agency thereof.

THE NEW YORK MIDTOWN DISPERSION STUDY (MID-05) METEOROLOGICAL
DATA REPORT
July 25, 2006
R. Michael Reynolds T.M. Sullivan
S. Smith V. Cassella
Brookhaven National Laboratory
Abstract
The New York City midtown dispersion program, MID05, examined atmospheric transport in the
deep urban canyons near Rockefeller Center. Little is known about air flow and hazardous gas
dispersion under such conditions, since previous urban field experiments have focused on small
to medium sized cities with much smaller street canyons and examined response over a much
larger area. During August, 2005, a series of six gas tracer tests were conducted and sampling
was conducted over a 2 km grid. A critical component of understanding gas movement in these
studies is detailed wind and meteorological information in the study zone. .To support data
interpretation and modeling, several meteorological stations were installed at street level and on
roof tops in Manhattan. In addition, meteorological data from airports and other weather
instrumentation around New York City were collected. This document describes the
meteorological component of the project and provides an outline of data file formats for the
different instruments. These data provide enough detail to support highly-resolved
computational simulations of gas transport in the study zone.

Table of Contents
1.0 Introduction..............................................................................................................................1 1.1 Organization of this report ................................................................................................ 1
2.0 Instrumentation........................................................................................................................3 2.1 Mesonet Data .................................................................................................................... 3 2.2 MID05 Wind Data ............................................................................................................ 5 2.2.1 Sonic Anemometers ....................................................................................................... 5 2.2.2 Mini Sodars .................................................................................................................... 7
3.0 Instrumentation Location and Data File Identification .....................................................10 3.1 Instrument Location Codes (ID codes) ........................................................................... 10
4.0 Deployment.............................................................................................................................16 5.0 Data Organization..................................................................................................................19
5.1 Time Recording and Averaging..................................................................................... 19 5.2 Data processing levels..................................................................................................... 19 5.3 Level 1 Data File Naming Convention ........................................................................... 22 5.4 Meteorological Data Summary ....................................................................................... 23
6. DATA PROCESSING .............................................................................................................29 6.1 Sonic Anemometer Data Processing.............................................................................. 29 6.2 Mini Sodar Data Processing............................................................................................ 32
7. Equipment Quality Assurance Tests......................................................................................37 7.1 Windrose Intercomparison at Mesonet Stations ............................................................ 40 7.2 Wind Intercomparisons in the BNL Meteorological Field ............................................ 44
Appendix A: Listing of All Folders and Files In Level 0 for MID05 .....................................59 Appendix B: Listing of All Folders and Files for Level 1 Data ..............................................74
B.1 FILES CONTAINED IN THE LEVEL 1 FOLDERS .................................................. 80 Appendix C: RM Young 81000 UltraSonic Anemometer .......................................................83

List of Figures Figure 1 Roof top installation of 3D sonic anemometer................................................................ 7 Figure 2 Mini Sodar on the MetLife Building with 3DSonic anemometer in the left background.......................................................................................................................................................... 9 Figure 3 Photographs of the twelve street locations for sonic anemometers used in MID05 tests........................................................................................................................................................ 13 Figure 4 Map showing locations of roof top stations deployed for the MID05 experiment. ...... 14 Figure 5 Map showing the locations of street sonic anemometer stations during IOPs 1 -3 and IOPs 4 - 6. ..................................................................................................................................... 15 Figure 6 The mini Sodar and wind measurements from the MetLife building roof..................... 39 Figure 7 The mini Sodar and wind measurements from the General Motors Building (gm) roof........................................................................................................................................................ 40 Figure 8 Directional Wind Rose from nine mesonet stations in August 2005. ........................... 42 Figure 9 The vector speed, vector direction, and air temperature at 10 m (blue) and 88 m (red) from the BNL meteorological tower............................................................................................. 44 Figure 10 Wind speed and direction measured by the mini Sodar at 20 m (blue) and 100 m (red)........................................................................................................................................................ 45 Figure 11 Comparsion of Wind Speed and Direction for the miniSodar at 20, 40, 60, and 90 meters and the BNL meteorological tower at 88 m. ..................................................................... 47 Figure 12 The group mean wind speed (left column) and direction (right column) during each of the intercomparison periods.......................................................................................................... 49 Figure 13 Comparison of measured wind direction to the group mean wind direction for instruments SN 320, SN 364, and SN 607 in group 1. ................................................................. 52

List of Tables
Table 1 Specifications and Settings for 3D sonic anemometers during MID05............................. 5 Table 2 Settings for Mini Sodars used during MID05................................................................... 8 Table 3 Station identification codes, location and geographic locaters....................................... 10 Table 4 Station identification codes and level 0 File Folder name.............................................. 20 Table 5. Summary of data collected by each sonic anemometer station for each day of the experiment. The numbers are in Mbytes of raw data for each day. Note that a full day of 10-Hz data produces a file of 58 Mbytes. ................................................................................................ 24 Table 6 Street level 3D anemometer operating times (EST). ...................................................... 24 Table 7 Roof top and set back 3D anemomtor operating times during the IOPs. ....................... 26 Table 8 Meteorological variables measured at the mesonet stations........................................... 27 Table 9 File format for 3D sonic anemometer data processed and averaged over a 5 minute period. ........................................................................................................................................... 30 Table 10 mini Sodar data table .................................................................................................... 33 Table 11 Results from the three-step cleaning process for SODAR wind time series from different levels above the roof. ..................................................................................................... 36 Table 12 The mean bias and standard deviation for each sonic anemometer during the four-part field test......................................................................................................................................... 50

1 of 88
1.0 Introduction In August 2005 a series of six tracer studies were conducted in near Rockefeller Center as part of
the New York City Urban Dispersion Program (UDP). Collectively these studies are known as
MID05 they examined outdoor releases of Perfluorocarbon Tracer (PFT) tracers and Sulfur
hexafluoride (SF6), indoor releases of PFTs, and subway releases of PFTs. Depending on the
test, up to 160 samplers were used to measure SF6 and up to 80 samplers were used to measure
PFTs during the sampling event. Samplers were located covering a 2 km square grid as well as
being in the building being tested and along several subway lines. A critical component of
understanding gas movement in these studies is detailed wind and meteorological information.
This document provides details on the meteorological equipment used and data that were
collected by Brookhaven National Laboratory (BNL) during the UDP, MID05. Intense
Operation Periods (IOPs) were conducted on August .8, 12, 14, 18, 20 and 24 in which portable
meteorological instrumentation was deployed and operated from 6A.M. to 12 A.M., Eastern
Standard Time (EST). In addition, a mesonet was formed using local area airports and other
installed weather instrumentation as well as roof top instrumentation installed specifically for the
UDP tests. Mesonet data were collected continuously from at least a week prior to the first IOP
and for several weeks after the last IOP. This report focuses on data collected during the
sampling period of August 8th - 24th.
1.1 Organization of this report
Instrumentation: The instrumentation is described in a general way in Section 2.

2 of 88
Locations: Location sites are named and described in Section 3. The location sites are described
independently from the instrumentation located there. Thus a wind station and a mini Sodar can
occupy the same location, for example a roof top on a building.
Deployment procedures: Section 4 describes the procedures followed in deploying, aligning,
and data recording.
Data Organization: The structure of the data files from the different instruments is discussed in
section 5.
Data Processing: Section 6 provides review of the data processing methods used for the wind
and sodar data sets.
Quality Assurance: Section 7 reviews several techniques used for quality assurance. Tests
were performed at the BNL meteorology field to determine the quality of the sodar and 3D sonic
anemometer data.

3 of 88
2.0 Instrumentation
Several different types of weather instrumentation were available for data collection during the
MID05 study period. Data from surrounding weather stations at airports, Universities, and
National Oceanic and Atmospheric Administrations (NOAA) National Weather Service (NWS)
stations were available. This data is referred to as the mesonet for these experiments. The
mesonet stations are described briefly in this section and the data collected is described in
Section 5. In addition, mini Sodars and sonic anemometers were installed on rooftops and
building setbacks for the duration of the test period. Sonic anemometers were also installed at
street level during the IOPs. The data format for these instruments is described in Appendix A
and B.
2.1 Mesonet Data
Mesonet data was collected from several locations. General information on the different types of
stations is provided below. Data collected and stored as part of the MID05 experiment are
discussed in chapter 5 and Appendix B of this report.
2.1.1 ASOS Stations
The Automated Surface Observing Systems (ASOS) program is a joint effort of the National
Weather Service (NWS), the Federal Aviation Administration (FAA), and the Department of
Defense (DOD). The ASOS systems serve as the nation’s primary surface weather observing
network. ASOS is designed to support weather forecast activities and aviation operations and, at
the same time, support the needs of the meteorological, hydrological, and climatological research
communities. ASOS stations report basic weather elements including:
• Sky condition: cloud height and amount (clear, scattered, broken, overcast) up to 12,000 feet
• Visibility: (to at least 10 statute miles)

4 of 88
• Basic present weather information: type and intensity for rain, snow, and freezing rain
• Obstructions to vision: fog, haze
• Pressure: sea-level pressure, altimeter setting
• Ambient temperature, dew point temperature
• Wind direction, speed and character (gusts, squalls)
• Precipitation accumulation
• Selected significant remarks including- variable cloud height, variable visibility, precipitation beginning/ending times, rapid pressure changes, pressure change tendency, wind shift, peak wind.
More information on these sites can be found at http://www.nws.noaa.gov/asos/
2.1.2 City College New York (CCNY) Meteorological Station The NOAA-CREST weather station, located on the roof of the Marshak Science Building on
Convent Avenue north of 135th Street in Manhattan, began operation on 12 December, 2003. The
station’s sensors collect data each second and compute one-minute averages. The station's sensor
array collects data in one-minute cycles controlled by the program resident in a datalogger at the
site. The datalogger is polled and the information downloaded to the host computer in the
Steinman Hall Engineering Building via the campus internet. Archived data is available on the
NOAA-CREST web site. Data includes wind speed, direction and their vectors; air, dew point,
wet bulb, heat index and wind chill temperatures; relative humidity; air pressure; rain; plant
trans-evaporation and solar flux. More information on this weather station can be found at
http://icerd.engr.ccny.cuny.edu/noaa/wc/
2.1.3 Stevens Institute of Technology The New York Harbor Observing and Prediction System (NYHOPS) was established to permit
an assessment of ocean, weather, environmental, and vessel traffic conditions throughout the
New York Harbor region. The system is designed to provide a knowledge of meteorological and
oceanographic conditions both in real-time and forecasted out to 48 hours in the Hudson River,

5 of 88
the East River, NY/NJ Estuary, Raritan Bay, Long Island Sound and the coastal waters of New
Jersey. For more information see http://hudson.dl.stevens-tech.edu/NYHOPS/
NOAA DCNET/URBANet
DCNet/URBANet is a NOAA program designed to test and evaluate the feasibility of acquiring
wind turbulence measurements within the complex topology of the urban environment. They
maintain weather instrumentation to provide three-dimensional wind speed and direction,
relative humidity, temperature and other derived weather variables. In New York City they
maintain stations at the Environmental Measurement Laboratory (EML) and Times Square.
More information can be found at http://dcnet.atdd.noaa.gov/.
2.2 MID05 Wind Data
Data collected specifically for the MID05 tests included street level sonic anemometers and roof
top level anemometers and mini Sodars.
2.2.1 Sonic Anemometers
The three-dimensional sonic anemometer (3Dsonic) model 81000 manufactured by R.M. Young
Co. was used for turbulence measurements in this project. The instrument provided velocity
measurements in 3 dimensions (u, v, and w) and sonic temperature (Tsonic). The instrument
brochure with all specifications is given in Appendix C. Table 1, below, provides key
characteristics for the measurements.
Table 1 Specifications and Settings for 3D sonic anemometers during MID05
Variable Settings Internal sampling rate
160 Hz

6 of 88
Output sample rate 10 Hz
Output format ASCII
Output variables u, v, w, Tsonic
Wind speed range +/- 40 m/s
Wind speed resolution ±0.01 m/s
Valid wind elevation angles ±60 deg
Sonic anemometers are well suited for urban locations, especially at street level, where wind
speeds have considerable vertical flow and where wind velocities can be quite small. However, a
limitation in this type of instrument is that measurements become suspect with the elevation from
horizontal exceeds ±60º. 3Dsonic data where this limitation is exceeded is flagged in the data
file. The ASCII digital output from the 3Dsonic is collected by a laptop PC running a
customized program called “ECCheck.”

7 of 88
Figure 1 Roof top installation of 3D sonic anemometer.
2.2.2 Mini Sodars
Sodar (sonic detection and ranging) systems were used to remotely measure the vertical
turbulence structure and the wind profile of the lower layer of the atmosphere. Sodars operate on

8 of 88
the principle of acoustic backscattering. The mini Sodar, the instrument used in this study, was
developed by AeroVironment Inc. in the late 1980’s to measure wind profiles in helicopter
landing areas where noise levels were extreme. It was made commercially available in 1994 and
has been deployed in situations where winds within the lowest 200 m are needed and ambient
noise in the lower frequency range (1000–2000 Hz) is high. It was determined that the optimum
frequency to operate Sodar in these conditions was near 4500 Hz. The same conclusion was
reached by Crescenti and Baxter (1998) and Crescenti (1998) for the urban environment where
automobiles and HVAC systems can add considerable ambient noise. The following table lists
the specifications for the mini Sodar. Figure 2 shows a picture of a mini Sodar installed on the
roof of the MetLife building.
Table 2 Settings for Mini Sodars used during MID05
Parameter Settings Maximum Sampling Altitude 200 m Minimum sampling Altitude 15 m Height Resolution 10 m Transmit frequency 4500 Hz Averaging interval 2 min Wind speed range 0–35 m/s Wind speed accuracy < 0.2 m/s Wind direction accuracy < 5 deg Power input (electrical) 30 W Power output (acoustic avg) 40 W Voltage 120/220 VAC Weight 255 lbs Antenna ht 1.2 m Antenna Width 1.2 m Antenna length 1.5 m Total ht with collar 2.1 m Beam width 16 Beam zenith angles 6 deg

9 of 88
Figure 2 Mini Sodar on the MetLife Building with 3DSonic anemometer in the left background.

10 of 88
3.0 Instrumentation Location and Data File Identification
3.1 Instrument Location Codes (ID codes)
A set of ID codes has been developed in order to provide unambiguous reference to any
meteorological data in the project. Table 3 presents the station ID codes, a narrative description
of the location, latitude, longitude, ground elevation in meters above mean sea level (MSL), and
instrument elevation in meters above ground level. Latitude and longitude values are based on
the WGS 84 datum.
Table 3 Station identification codes, location and geographic locaters
Station Identifier Location Latitude Longitude
Ground Elevation (m) (msl)
Wind sensor
Elevation (m)
Regional Meteorological Stations
cpk Central park, NOAA ASOS 40.7833 -73.967 39.6 25
ewr Newark Airport ASOS 40.7167 -74.1667 2.3 10
field BNL meteorological field 40.87083 -72.6167 27.4 3
fok Westhampton Gabreski Airport 40.85 -72.6333 20.4 10
hpn White Plains Westchester Co Airport 41.0667 -73.7 115.5 10
hwv Shirley Brookhaven Airport 40.8167 -72.8667 25 10
isp Islip Long Island Macarthur Airport 40.8 -73.1 25.6 10
lga New York LaGuardia Airport 40.7833 -73.8833 3.4 10
jfk New York J F Kennedy Int'l Airport 40.6333 -73.7667 3.4 10
Roof top meteorological stations

11 of 88
ccny CCNY Roof, NOAA GPS station 40.8192 -73.95 98 58
eml Environ Meas Lab, 15th floor, roof 40.72842 -74.0066 5 82
gm1 GM Building Roof
(3D sonic anemometer) 40.76357 -73.9725 -- 225
gm2 GM Building Roof
(mini Sodar) 40.76352 -73.9724 -- 225
lbr1 Bldg A, 745 Seventh Ave, Roof installation dcnet dcnet -- --
lbr2 Bldg A, S side setback, above 49th St. 40.76041 -73.9833 -- ~32
met1 MetLife Building
(3D sonic anemometer) 40.75342 -73.9765 -- 247
met2 MetLife Building
(mini Sodar) 40.75321 -73.9764 -- 247
mgh1 McGraw-Hill roof, SE corner 40.75946 -73.9812 17.7 213
mgh2 McGraw-Hill setback, N side, 49th St. 40.76011 -73.9832 -- 30
opp One Penn Plaza, roof, SW corner 40.75168 -73.9933 10.7 233
ppz Park Ave Plaza roof station 40.75922 -73.9738 -- 182
Street Level Meteorological Stations
s1 6th Ave btwn 49th and 50th St. Rockefeller Center west entrance.
40.75944 -73.9806 18 3
s2 49th Street btwn 6th and 7th Aves. 40.75967 -73.9825 17 3
s3 1221 6th Ave., on 48th St. 40.75931 -73.9825 17.6 3
s4 On curb in front of 1230 6th Ave. 40.75879 -73.9811 17.6 3
s5 On curb on 6th btwn 50th and 51st Sts. 40.76021 -73.9801 18.9 3

12 of 88
s6 On curb, 50th St btwn 6th and Bdwy. 40.75995 -73.9808 18.2 3
s7 On 7th Ave btwn 48th and 49th Sts. 40.76011 -73.9839 16.1 3
s8 7th Ave. btwn 49th and 50th Sts. 40.7607 -73.9834 16.1 3
s9 50th St btwn 6th and 7th aves. 40.7608 -73.9827 16.5 3
s10 49th St btwn 7th and 6th Aves 40.7603 -73.983 16.1 3
s11 45th St btwn 6th and 7th Aves. 40.757 -73.9835 17 3
s12 54th St. btwn 6th and 7th Aves. 40.76278 -73.9793 20 3
sit1 Stevens Inst. of Tech., Admin Roof 40.7608 -73.9827 32 51.8
Figure 3 shows pictures of the street level sonic anemometer installations. Maps are provided
with the locations of roof top instrumentation, Figure 4, and street level instrumentation, Figure
5.

13 of 88
Figure 3 shows the street level sonic anemometers at all 12 locations.
Figure 3 Photographs of the twelve street locations for sonic anemometers used in MID05 tests.

14 of 88
Figure 4 Map showing locations of roof top stations deployed for the MID05 experiment.

15 of 88
Figure 5 Map showing the locations of street sonic anemometer stations during IOPs 1 -3 and IOPs 4 - 6.

16 of 88
4.0 Deployment
The deployments of roof top meteorological stations were all completed prior to the first IOP
(Intensive Operations Period). The buildings were selected based on geographical location and
ability to gain access. The installations took place within the month preceding the first IOP.
Installation included mounting the equipment to the roof or setback, testing of equipment
response, and calibration. Installations included two setback stations, one at the McGraw Hill
building (mgh2) and one at the Lehman Brothers building (lbr2). The exact installation
procedure varied due to the facilities available to us on each building. All equipment was tied
into building power with a Marine battery available for backup. Each station was checked for
performance one day prior to each IOP. At this time stations that were not operating were
restarted.
There were six IOPs during the MID05 experiment. In order to facilitate the coordination of the
large number of participants, it was arranged that the BNL staff responsible for deploying the
street level sonic anemometers would meet at the Tick Tock Diner, on the northwest corner of 8th
Avenue and 35th street, at 0400 hours (EST) each morning. Two vans loaded with the 10 3D
sonic anemometers and associated towers left BNL by 0245 hours to arrive at the diner by 0400.
MID05 student team members met BNL staff and formed three teams of three people to install
the equipment. The vans were driven to two staging areas, the first was 100 feet north of the
northeast corner of 6th Ave and 49th street. The second location was 300 feet east of the south
east corner of 7th Ave and 49th street. There were 3 teams each installing 3 or 4 stations. For
consistency, all BNL and student team members reported to the same location for each IOP. The
installation procedure involved unloading the vans and placing the 3D Sonic anemometer and

17 of 88
tower on a cart with associated equipment (computer to run operations, and installation
hardware). The team members wheeled the carts and carried the equipment to each of the
predesignated locations. For each of the six IOPs the same equipment and the same team
members went to the same station. The towers and the anemometers were identical units. The
computers collecting the data had similar physical characteristics and were running identical data
acquisition software. All ten street level stations were set up and running by 0600 EST except on
the first IOP where delays prevented a few of the instruments from starting on time. The sonic
anemometers were aligned parallel to 6th and 7th Avenues or perpendicular to the street they were
set up on. This insured that all the instruments would be oriented in the same direction. The
compass heading for 6th Avenue is 29 degrees. Once the stations were up and running BNL staff
that deployed the equipment “roamed” from station to station confirming operation. At 1200
hours (EST) the stations were shut down, disassembled and brought back to be loaded into one
of the vans waiting at the staging areas.
Between IOPs the equipment was brought back to BNL. The batteries were recharged and the
anemometers were checked for proper operation. The data were copied from the laptops to
thumb drives and then copied again to a central computer. Any and all repairs, if necessary, were
made during this time.
Equipment failures involving street level stations were minimal. Data recovery
from the street level stations was above 95 percent of the total expected. We experienced a
slightly higher failure rate on the roof top stations. These failures were mainly due to exposure to
extreme heat. We measured rooftop temperatures to be 50 ºC and higher. The computers
collecting the data were shutting down due to the excessive temperature in the enclosures. Some

18 of 88
of the instrumentation power supplies overheated and failed. To compensate for the heat between
the 3rd and 4th IOP, fans and vents were installed in the enclosures to remove the excessive heat
inside and to circulate cooler air from the outside. In addition, cables were run to allow
instrumentation to be located in shady areas and reduce the heat loading. These modifications
corrected most of the problems with the rooftop stations. Data recovery from the rooftop stations
was better than 80 percent over the six IOPs. After taking the steps to reduce heat loading on the
equipment, data recovery was near 100%.
After the final IOP all of the roof top equipment was removed within two weeks. Data collected
from roof top equipment was similarly copied from the laptops to a central computer. All of the
data was post processed and went through a QA/QC process.

19 of 88
5.0 Data Organization
The two goals of this technical report are to provide a complete description of the meteorological
measurement sub-task to the MID05 experiment, and to provide a description of the data set that
accompanies this report.
5.1 Time Recording and Averaging
In all data in this report, all dates and times are recorded and reported in Eastern Standard Time,
unless otherwise specified. The EST time zone is -5 hours different than Greenwich Mean Time.
Time is written from year to seconds left to right. For example a time of 20050806,072634 is
equal to 8/6/2005 7:26:34., using the United States date format, For all data sets averaged over a
time-interval, the date/time mark represents the center of the averaging time. For instance, if an
averaging interval is 300 seconds (5 minutes), the 0900 h average is derived from data samples
from 085730 to 090230.
5.2 Data processing levels
Data are segregated into three levels.
Level 0: Level 0 data are the raw data collected by the recording device available at the location.
The raw 10 Hz data from the 3DSonic instrument are included here. Archive ASOS data
downloaded from the NWS or other on line sources are collected here exactly as
received. In some cases raw level 0 data are cleaned to remove obviously bad records,
spikes, and dropouts. As the original data are not altered, these files remain in the level 0

20 of 88
Level 1: The raw data becomes level 1 after they are processed by applying calibration
coefficients, wind direction rotations, and any corrections to produce data in true physical
units.
Level 2: Level 2 data are finalized, corrected, and calibrated data sets. Derived variables are also
included at level 2.
In this report, Level 0 and Level 1 data are provided. A listing of all level 0 data files is
presented in Appendix A and all level 1 data files are listed in Appendix B. Level 0 data are
grouped into folders based on the instrumentation or location for ASOS stations. There is one
Level 0 folder for each instrument used. Table 4 lists all of the Level 0 folders. These folders
contain the raw data collected as part of the MID05 field study. For 3D Sonic anemometer data
as received data use a file extension dat while files that have had obviously bad records removed
use an extension of da1. Detailed descriptions of format and contents of the Level 0 data files
are in section 5.4.
Table 4 Station identification codes and level 0 File Folder name.
Station Identifier Level 0 Folder Name
Regional Meteorological Stations
cpk cpk_Central_Park_asos
ewr ewr_NewarkAirport_asos
hpn hpn_airport_asos
isp isp_IslipAirp[ort_asos
lga lga_LaGuardiaAirport_asos
jfk jfK_KennedyAirport_asos
sit1 sit_Stevens_HoweCenter
Roof Top Meterological Stations
ccny CCNY

21 of 88
eml eml_NYC002
gm1 gm1_GMBldg_roof_met
gm2 gm1_GMBldg_roof_Sodar
lbr1 lbr1_BldgA_roof
lbr2 lbr2_LehmanBrothers_setback
met1 metl1_met
met2 metl2_sodar
mgh1 mgh1_McGrawHill_roof
mgh2 mgh2_McGrawHill_setback
opp opp_OnePennPlaza_roof_met
ppz ppza_ParkPlaza_roof
Street Level Meteorological Stations
s1 s1
s2 s2
s3 s3
s4 s4
s5 s5
s6 s6
s7 s7
s8 s8
s9 s9
s10 s10
s11 s11
s12 s12
Level 1 data files contain data processed from the Level 0 files. Processing depends on the file
but typically involves calculating averages over a time period or aligning data to correspond to
true North. For example, the 3DSonic data are collected every 0.1 seconds. This data is
reviewed by computer software, bad records are omitted, and a five minute (300 second) average

22 of 88
of the data is calculated. Level 1 data are grouped into eight folders IOP1, IOP2, IOP3, IOP4,
IOP5, IOP6, meso, and field. IOP folders contain the data from street level sonic anemometers
designated as s1 – s12. This data was collected only during the 6 hour period of each IOP. The
meso folder contains all of the ASOS weather station data and rooftop meteorological station
data. This data were collected for the entire month of August 2005. The field folder contains the
sonic anemometer data used on side-by-side comparisons of these instruments conducted at the
BNL meteorological field.
5.3 Level 1 Data File Naming Convention
Level 1 Data files are named using a set pattern. Any file or folder names that belong to a
particular IOP will begin with the IOP followed by an underscore and an optional descriptive
text. For example, a folder might be named iop1_08AugustRelease.
Each data set is identified by the following three sets of ID codes:
a) Experiment ID: “mid” is the ID code for this experiment.
b) IOP ID: The entire data set is subdivided into groups called Intensive Operation periods.
IOPs have a specific start and stop time as defined in the IOP information file. In
addition to IOPs, an ID is available to designate meteorological data from all permanent
weather stations such as NOAA ASOS stations at airports, the DCNet/URBANet stations
and any BNL stations. THE ID for this data is meso. The IDs for these projects are:
meso, iop1, iop2, iop3, iop4, iop5, iop6.
c) Station ID: In each IOP a set of particular stations are defined. A station here is defined as a
particular set of instrumentation that produces a specific data set. For example, an ASOS
airport station, a mini Sodar, and a BNL street tripod are all separate stations, even if they

23 of 88
are co-located. In the case of the roof of the MetLife building, a sodar and a BNL
meteorological station are co-located, so they are given stations names of met1 and met2.
Station IDs are provided in Table 3 above.
An example file name is mid_meso_met1_rmy3d_300av.dat. This file will contain all of the data
from the met1 station (Metropolitan Life roof top, 3D Sonic anemometer), from the meso folder
for the MID05 field campaign. Recall that meso data were collected for the entire month of
August 2005. So this file will contain the 3D Sonic data from the Metropolitan Life rooftop on a
five minute (300 second) averaging period for the entire month of August.
5.4 Meteorological Data Summary
5.4.1 Sonic Anemometer Data
The sonic anemometer wind stations provided information of the 3-dimensional turbulent winds.
Stations were deployed on rooftops (eml, gm1, lbr1, met1, mgh1, opp, ppz ), building setbacks
(lbr2, mgh2), and the street stations during iop1—iop6(s1-s12). The wind stations were
comprised of (a) the RMY 3D sonic anemometer, (b) a tripod, 3 or 6 m high, or a mounting pole
in the case of gm1, and (c) a data acquisition system with battery backup, AC converter, and
laptop PC. The data acquisition program was a custom built program called ECCheck.exe.
Table 5 summarizes of all the 3D-sonic turbulence data collected for the UDP MID05
experiment. The roof stations and street stations are shown with their identifiers. The columns
are labeled according to the date from August 2nd to September 3rd. The first column contains the
Station ID. A full description of the station locations is in Table 3. The numbers in each cell are
the file sizes in Mbytes for each station and for each day. A dash means no data were collected
on that day. A number of 0 indicates that less than 1 Mbyte was collected on that day.

24 of 88
Table 5. Summary of data collected by each sonic anemometer station for each day of the
experiment. The numbers are in Mbytes of raw data for each day. Note that a full day of 10-Hz
data produces a file of 58 Mbytes.
AUGUST 2005 SEP 2005 STATION: 02 03 04 05 06 07 08 09 10 11 12 13 14 15 16 17 18 19 20 21 22 23 24 25 26 27 28 29 30 31 01 02 03 ----------------------------------------------------------------------------------------------------------- gm1: - - 26 58 58 58 58 58 58 58 33 - - - - 14 58 58 58 58 58 58 58 58 58 58 58 58 58 58 32 - - lbr2: - - - - - - - - 16 58 58 58 58 58 58 58 58 58 58 58 58 58 58 58 58 58 58 58 58 58 31 - - mgh1: - - - 0 - - - - - - - - 41 35 - 28 58 58 58 58 58 58 58 58 58 58 58 58 58 58 28 - - mgh2: - - - 31 58 58 58 58 58 58 58 58 58 58 58 58 58 58 58 58 58 58 58 58 58 58 58 58 58 58 26 - - metl1: 58 58 58 58 58 58 58 58 57 58 21 - 22 - - 20 58 58 58 58 58 6 46 58 58 58 58 49 - - - - 58 opp: - 0 - - - - - - 0 22 44 - - - - 36 58 58 58 58 58 58 58 58 58 58 58 58 58 58 58 58 26 ppz: - - 32 22 - - - - - - - - - - 23 58 58 58 58 58 58 58 58 58 58 58 58 58 58 58 58 58 22 s1: - - - - - - 13 - - - 16 - 13 - - - 16 - 16 - - - 17 - - - - - - - - - - s2: - - - - - - 16 - - - 12 - 16 - - - - - - - - - - - - - - - - - - - - s3: - - - - - - 14 - - - 15 - 16 - - - 16 - 15 - - - 16 - - - - - - - - - - s4: - - - - - - 15 - - - 16 - 13 - - - 13 - 16 - - - 17 - - - - - - - - - - s5: - - - - - - 16 - - - 16 - 13 - - - 16 - 15 - - - 16 - - - - - - - - - - s6: - - - - - - 8 - - - 17 - 13 - - - - - - - - - - - - - - - - - - - - s7: - - - - - - 15 - - - 14 - 16 - - - 15 - 13 - - - 17 - - - - - - - - - - s8: - - - - - - 15 - - - 0 - 13 - - - 16 - 16 - - - 17 - - - - - - - - - - s9: - - - - - - 5 - - - 17 - 13 - - - 15 - 15 - - - 16 - - - - - - - - - - s10: - - - - - - 13 - - - 10 - 15 - - - 16 - 15 - - - 17 - - - - - - - - - - s11: - - - - - - - - - - - - - - - - 15 - 16 - - - 16 - - - - - - - - - - s12: - - - - - - - - - - - - - - - - 16 - 15 - - - 17 - - - - - - - - - - -----------------------------------------------------------------------------------------------------------
Table 5 provides the information collected from the street-level 3D sonic anemometers used
during each IOP. Data were collected during each IOP from approximately 06:00 to 12:00 EST.
The anemometers provided 3D velocity measurements (u, v, w), speed of sound (SOS), and
sonic temperature (TSonic) every 0.1 seconds. The first tracer release of each IOP occurred
6:00. From Table 5 it is clear that data were not always collected during the IOP time period of
6:00 – 12:00. This was due to machine failures attributed to overheating. Table 6 shows the
operating times of all the street level 3D sonic instrumentation based on obtaining a valid 300
second average of the 10 Hz data. If the Table cell is shaded gray it indicates that data were
unavailable for at least 30 minutes over the time period form 6:00 – 12:00.
Table 6 Street level 3D anemometer operating times (EST).
Station ID IOP1 August 8
IOP2 August 12
IOP3 August 14
IOP4 August 18
IOP5 August 20
IOP6 August 24
s1 6:40 – 12:00 5:10 – 12:00 5:00 – 10:35 5:15 – 12:00 5:15 – 12:00 5:05 – 12:00 s2 5:30 – 12:15 5:25 – 6:20
7:35 – 8:05 8:20 – 9:05 10:00-12:05
5:00 – 11:55 -- -- --

25 of 88
s3 6:15 – 12:00 5:45 – 11:55 5:25 – 12:00 5:15 – 12:00 5:35 – 11:55 5:20 – 12:00 s4 5:45 – 12:10 5:30 – 12:00 5:25 – 10:35 5:10 – 12:00 5:15 – 12:00 5:05 – 12:00 s5 5:25 – 12:00 5:10 – 12:05 5:10 – 10:30 5:30 – 12:00 5:40 – 12:00 5:15 – 12:00 s6 6:15 – 6:20
6:35 – 8:45 9:50 – 9:55
10:05 – 10:30
5:10 – 12:05 5:05 – 10:30 -- -- --
s7 5:45 – 12:10 5:45 – 11:45 5:25 – 12:05 5:30 – 12:00 5:25 – 12:00* 5:05 – 12:00 s8 5:45 – 11:50 6:05 – 12:10 5:05 -8:00
8:25 – 10:25 11:25
11:40 – 11:5012:00 – 12:05
5:20 – 12:05 5:35 – 12:00 5:05 – 12:05
s9 7;00 – 7:35 7:55 – 9:25
9:50
5:25 – 12:20 6:25 – 11:55 5:45 – 11:55 5:30 – 11:55 5:25 – 12:00
s10 5:30 – 6:25 7:45 – 12:10
5:10 – 9:30 5:15 – 11:55 5:10 – 12:05** 5:40 – 12:00 4:45 – 12:00
s11 -- -- -- 5:45 – 12:00 5:20 – 12:00 5:10 – 12:00 s12 -- -- -- 5:55 – 12:25 6:00 – 12:15 5:15 – 12:00#
* Invalid data for five-minute average at 6:20. ** Invalid data for five-minute average at 5:40, 5:55, and 6:00. # Invalid data for five-minute average at 10:45.
To summarize Table 6, four stations s1, s6, s9, and s10 were not successful in keeping data loss
to less than ½ hour over the six hour sampling period in IOP 1. This was in part due to logistical
considerations which were corrected after the first IOP and in part due to equipment problems.
In IOP 2, two stations failed to collect data over the entire period, s2 and s10. In IOP3, five
stations failed to collect continuous data. Four of them failed almost simultaneously at 10:30 in
the morning. This was attributed to overheating of the computer equipment that is part of the
data acquisition system. Fans were installed and measures were taken to provide more shade for
this equipment after IOP3. Once this was done, all equipment was successful in data acquisition
for the last 3 IOPs.
The rooftop and setback stations also had data acquisition problems. Nominally, the data were
collected continuously for the entire month of August 2005. In Table 5, any value less than 58

26 of 88
Mbytes of data collection for a day indicates partial failure. A blank in table 5 indicates that no
data were collected on that day. Table 7 presents the time of data collection from rooftop sonic
anemometers during the six IOPs. A shaded table cell indicates that data were not obtained for
at least 30 minutes during the six hour IOP.
Table 7 Roof top and set back 3D anemometer operating times during the IOPs.
Station ID IOP1 August 8
IOP2 August 12
IOP3 August 14
IOP4 August 18
IOP5 August 20
IOP6 August 24
gm1 6:00 – 12:00
6:00 – 8:25 8:40 – 12:00*
-- 6:00 – 12:00 6:00 – 12:00 6:00 – 12:00
lbr2 -- 6:00 – 12:00 6:00 – 12:00 6:00 – 12:00 6:00 – 12:00 6:00 – 12:00 mgh1 -- -- 7:05 – 12:00 6:00 – 12:00 6:00 – 12:00 6:00 – 12:00
mgh2 6:00 – 12:00 6:00 – 12:00 6:00 – 12:00 6:00 – 12:00 6:00 – 12:00 6:00 – 12:00 metl1 6:00 – 12:00 6:00- 8:45 6:00 – 12:00 6:00 – 12:00 6:00 – 12:00 6:00 – 12:00 opp -- 6:00 – 12:00 -- 6:00 – 12:00 6:00 – 12:00 6:00 – 12:00 ppz -- -- -- 6:00 – 12:00 6:00 – 12:00 6:00 – 12:00
* Instrument gm1 failed at 13:50 on August 12th and was restarted on August 17th at 18:15.
Seven roof top or setback sonic anemometers were deployed. In the first and third IOP, three of
the seven were successful in collecting data. In the second IOP, four of the seven operated
properly. All seven stations were available 100% of the time during the last 3 IOPs.
5.4.2 Mini sodar data
Mini sodar instrumentation was installed on the Met Life building on August 3rd 2005 and the
General Motors Building on August 19th. After installation the sodars operated continually over
the remainder of the IOPs. Therefore, data are available for all IOPs from the mini Sodar
installed at the Met Life building and the 5th and 6th IOP for the mini Sodar installed at the
General Motors building. The mini Sodar data includes a three-dimensional wind-field at

27 of 88
elevations of 20 – 200 m above the instrument in 20 m intervals. A complete description of the
raw data is in Appendix A and the description of the processed data is in Appendix B.
5.4.3 Mesonet data
Table 8 presents the meteorological variables measured at the mesonet stations from the nominal
period starting at midnight (time 00:00:00) August 1, 2005 to September 4, 2005, time
(00:00:00). Due to instrumentation problems a continuous record was not kept on all
instruments as described in sections 5.4.2. The mesonet included all rooftop and setback
stations, regional ASOS stations, DCUrbanet stations, CCNY stations and Stevens Institute of
Technology stations. Continuous data over the time period was available from the ASOS and
DCUrbanet stations.
Table 8 Meteorological variables measured at the mesonet stations.
Station ID Sample duration (s)
Variables measured
ccny 1 s,d,t,rh,p
cpk 1 s,d,t,rh,ppt,p
eml 1 s,d,t,rh
ewr 0.5 s,d,t,rh,p,ppt
gm1 0.1 s,d,w,tsonic
gm2 1 u,v,w (20-150m)
jfk 1 s,d,t,rh,p,ppt
lbr1 0.5 u,v
lbr2 0.1 u,v,w,tsonic
lga 1 s,d,t,rh,p,ppt
met1 0.1 u,v,w,tsonic
met2 1 u,v,w (20-150 m)
mgh1 0.1 u,v,w,tsonic

28 of 88
mgh2 0.1 u,v,w tsonic
opp 0.1 u,v,w,tsonic
ppz 0.1 u,v,w,tsonic
sit1 1 s,d,t,rh
Key to table 8.
d – direction (º true North) p - barometric pressure (mbar) ppt – precipitation (mm/hr) rh – relative humidity (%) s – wind speed (m/s) t – temperature (ºC) tsonic – Sonic temperature (ºC) u – velocity from east (m/s) v– velocity from north (m/s) w – velocity from below (m/s)

29 of 88
6. DATA PROCESSING
Data were collected on the ten 3D Sonic anemometers and the two mini Sodars that were
deployed during each IOP. The raw data were processed to provide 5 minute averages of the
sonic anemometer data and 15 minute averages of the sodar data. Sodar data were collected
from 20 – 200 m above the installation height at 10 m increments. This section describes the
data processing steps and the output files that were generated.
6.1 Sonic Anemometer Data Processing
Clean raw data files:
Raw 3D sonic data files are described in Appendix A. Raw files are stored in the “level0” folder
mid_level0 -> stationID_ShortDesc -> daqID$yyyyMMdd.dat
example:
mid_level0 -> gm1_GMBldg_roof_met -> UDP01$20050821.dat
where the stationID is described above in Table 3 (e.g. gm1), the ShortDesc is an arbitrary short
descriptive string, daqID is identifies the data acquisition system, in this case the laptop assigned
ID UDP01, yyyyMMdd is the data of the first record in this data file. The “dat” raw files are
large, about 58 MB per day. This file is a Level 0 file.
Each raw data file is first scanned to remove bad records. Bad records occur during rain or in
rare cases (<0.01%) during collection by the data collection program ECCheck. The program
01_clean_all_rmy3d.pl is a PERL program that reads each record of the raw data file and
discards all bad records. It can be found in the directory mid -> sw -> rmy3d ->. The cleaned
files are saved with names like

30 of 88
mid_level0 -> gm1_GMBldg_roof_met -> gm1_yyyyMMdd.da1
where the “da1” extension identifies a cleaned raw data file. Since the only thing that has been
done is to remove bad records, this is also a Level 0 data file.
Average cleaned data files:
After the raw files are cleaned of any bad records, the program 02_avg_all_rmy3d.pl
produces averages of the 10 Hz data. This program is also in the mid -> sw -> rmy3d ->
directory. Averaging times are user-defined, but typically a 300 sec (5 min) averaging time is
selected. Note, in all cases, when averages are made, the time mark of the average is the center
of the averaging period. In the example above, the averaged data file is saved in the following
way:
mid -> level1 -> meso -> gm1_GeneralMotors_met -> mid_meso_gm1_rmy3d_av300.dat
All processed data are stored the following hierarchy:
mid (main project data set) level1 (first level of processed data)
meso (IOP data subdivision, includes iop1, … iop6) gm1_GeneralMotors_met (station ID)
mid_meso_gm1_rmy3d_av300.dat (5-min averaged data)
An example of an averaged data file is given in Table 9.
Table 9 File format for 3D sonic anemometer data processed and averaged over a 5 minute
period.
DATE (local std) WSPD VSPD WDIR SIGMA-THETA U (EAST) V (NORTH) W (UP) date jd time m/s m/s degT Yamartino Vector av stdev av stdev av stdev 2005-08-04 (216) 13:15:00, 1.91, 1.49, 170.8, 48.49, 17.63, -0.24, 1.08, 1.47, 1.04, 0.06, 0.65, 2005-08-04 (216) 13:20:00, 2.88, 2.73, 153.6, 30.54, 4.34, -1.21, 1.11, 2.44, 0.89, -0.10, 0.68, 2005-08-04 (216) 13:25:00, 1.76, 1.45, 171.6, 52.30, 14.43, -0.21, 1.15, 1.43, 0.96, -0.05, 0.56,

31 of 88
where the data columns include:
date(year -month -day),
ID (modified Julian day),
time (hours:minutes:seconds) – midpoint of the averaging period,
WSPD – scalar average wind speed (m/s)
VSPD – vector average wind speed (m/s)
degT - º true North
Yamartino – The standard deviation of the wind direction as determined using the EPA approved
Yamartino method.
Vector – The standard deviation of the wind direction as determined from the ratio of the vector-
mean speed and the mean scalar wind speed.
U (two columns) – the mean scalar average (m/s) and standard deviation of vector wind speed
from the East.
V(two columns) – the mean scalar average (m/s) and standard deviation of vector wind speed
from the East.
W(two columns) – the mean scalar average (m/s) and standard deviation of vector wind speed
from below.

32 of 88
6.2 Mini Sodar Data Processing
Raw Sodar Processing
The mini Sodar Acoustic Signal Processor (ASP) produces binary data that is stored and
collected from the sodar on a regular basis. The binary records are processed by a program
HT SPD DIR W SDW IW GSPD GDIR U SDU NU IU SNRU V SDV NV IV SNRV NW
SNR
W
200 4.93 145 -0.16 0.34 187 7.15 138 -4.44 0.32 18 174 5 2.16 0.38 11 168 5 17 4
190 5.25 136 -0.34 0.31 201 6.89 107 -5.02 0.4 12 158 5 1.53 0.48 11 160 5 24 5
180 5.29 141 -0.17 0.33 186 6.81 133 -4.9 0.31 22 173 6 1.99 0.43 14 162 6 21 5
170 5 151 -0.15 0.3 186 6.66 117 -4.26 0.38 36 195 6 2.61 0.35 22 171 6 28 5
160 4.35 135 0 0.45 210 7.14 134 -4.19 0.45 48 233 8 1.17 0.41 39 215 8 41 6
150 3.98 141 -0.11 0.39 270 9.38 79 -3.71 0.46 50 261 9 1.46 0.53 40 196 9 49 8
140 4.19 144 -0.05 0.41 304 8.83 147 -3.8 0.5 46 258 9 1.76 0.81 41 189 9 57 9
130 3.97 136 -0.06 0.4 309 7.38 99 -3.8 0.57 52 290 10 1.14 0.79 37 193 10 50 9
120 3.92 138 -0.05 0.51 372 11.18 102 -3.7 0.61 57 317 11 1.29 0.78 49 207 11 60 10
110 3.9 140 -0.06 0.51 389 7.3 139 -3.63 0.56 61 316 12 1.42 0.72 53 223 12 63 11
100 3.25 141 -0.15 0.54 401 7.16 118 -3.01 0.57 69 305 12 1.21 0.7 55 246 12 67 13
90 3.19 134 -0.06 0.52 444 6.45 101 -3.08 0.58 67 320 15 0.81 0.6 64 278 15 66 15
80 3.34 137 -0.03 0.57 495 7.11 125 -3.18 0.61 65 380 15 1.02 0.6 70 412 15 67 15
70 3.13 133 -0.03 0.6 508 8.23 87 -3.04 0.54 71 430 18 0.76 0.61 70 413 18 71 15
60 3.27 131 0 0.54 544 6.42 168 -3.2 0.49 69 404 16 0.67 0.49 72 399 16 71 18
50 2.39 119 -0.03 0.44 565 4.19 120 -2.39 0.43 72 436 19 0 0.31 72 618 19 72 18
40 2.53 116 -0.11 0.25 802 3.84 115 -2.52 0.42 72 600 22 -0.13 0.18 72 1268 22 72 25
30 2.95 123 -0.09 0.24 1434 5.79 121 -2.95 0.49 72 778 21 0.21 0.05 72 4509 21 72 20
20 2.55 95 -0.04 0.09 4912 4.5 102 -2.33 0.43 71 1159 16 -1.05 0.15 72 4191 16 72 23

33 of 88
called SodarPro to produce raw ASCII data files. The ASCII data files are stored in the level0
data folder as (for example):
mid_level0 -> gm2_GMBldg_roof_sodar -> 050820dv.dat
where the previously described folder/file nomenclature is followed. The raw ASCII data file
name has the yyMMdd to identify the data set. The SodarPro program divides the data into
individual days.
The sodar dv files are organized in “data tables” showing all setup data and the measured winds
at each level for each time. Table 10 shows an example of the data table.
Table 10 mini Sodar data table
GM1 08/20/2005 00:05:03 TO 08/20/2005 00:10:02 VR3.14 4500 800 100 90 20 0 0 300 10 15 5 -120 0 10 5 64 960 6 5 5 -800 800 -800 800 -800 800 1 10 29 500 68 1 19 7 0 0 0 10 2 3 COMPONENT 19HTS ZENITH 16-16 ARA 029 SEPANG 090 MXHT 0 UNOISE 122 VNOISE 144
WNOISE 157 ANTENNA STATUS: OK AC STATUS: OFF BATTV 3.970
where the first three lines are the setup data and include the date and time period of the
measurement (8-25-05 from 00:05:03 to 00:10:02) (the third line is wrapped in this example)
used by the code, the fourth line is a header and each elevation level follows from the highest to
lowest. A complete description of the header data is presented in Appendix A.
In the processing we convert the raw ASCII data files to raw time series files using a PERL
program a01_read_sodar_dat.pl which produces time series ASCII data files that have the
sodar wind data for each individual level. In this way, we can process sodar data exactly as if it
were made by an individual anemometer magically held at the level. This program is found in
the directory mid -> sw -> sodar ->. A time series data file is labeled
mid_level0 -> gm2_GMBldg_roof_sodar -> gm2_30.dat

34 of 88
where the data file name includes the station name and the sodar level (30 m in this example).
These files are used to generate the time series average files and are not presented in the data
package.
Note the wspd/wdir in the sodar wind table and in the time series ascii files are computed by the
sodar using the u, and v, wind directions and the sodar alignment angle shown in the table
header. The alignment angle is set in the installation configuration file and is shown in header
line 3 following the string “ARA”. The time series file is a simple translation of the sodar raw
ASCII wind tables. No data processing or calibrations are applied to the data in the time series
files.
6.2.1 Averaging the Sodar Time Series Data
The time series data files are averaged with the PERL program a02_sodar_dat_avg.pl. this file
is stored in the directory mid -> sw -> sodar ->
The program produces level1 data files such as:
mid -> level1 -> meso -> gm2_GMBldg_sodar -> gm2_030_av900.dat
where the sodar wind level and the averaging time are shown in the file name (30 m and 900 sec
in this example.
Program: a02_sodar_dat_avg Version: 2.1 EditDate: 2005/11/22 Runtime 2005-11-22 (326) 21:47:33 platform: BNL expname: mid iopname: meso sitename: gm2 sensorname: 30 datapath: /Users/mike/data/urban rawpath: /Users/mike/data/urban/mid/level0/gm2_GMBldg_roof_sodar

35 of 88
rawid: _30.dat outpath: /Users/mike/data/urban/mid/meso/gm2_GMBldg_sodar avgsecs: 900 timezone: -5 MaxSamps: 2e+20 Nsamp_min: 1 missing: -999 snr_threshold: 5 rotation: 29 StartTime: 2005,8,1,0,0,0 EndTime: 2005,9,30,0,0,0 ------------------------------------------------------------------------------------------------------------------------------------------ DATE (local std) WSPD VSPD WDIR SIGMA-THETA U (EAST) V (NORTH) W (UP) m/s m/s degT Yamartino Vector av stdev snr av stdev snr av stdev snr ------------------------------------------------------------------------------------------------------------------------------------------ 2005-08-19 (231) 17:15:00, 4.60, 4.39, 138.7, 16.67, 3.69, -2.89, 1.11, 11.3, 3.30, 0.82, 11.3, 0.40, 0.92, 13.2 2005-08-19 (231) 17:30:00, 3.88, 3.86, 125.7, 5.68, 0.42, -3.13, 1.17, 11.0, 2.25, 0.89, 11.0, 0.57, 0.93, 13.3 2005-08-19 (231) 17:45:00, 4.74, 4.73, 124.4, 3.75, 0.16, -3.90, 1.26, 11.0, 2.67, 0.75, 11.0, 0.32, 0.97, 12.7
This file has an extensive header which provides information on the data processing. The time
mark is the time at the center of the averaging period. WSPD is the scalar wind speed. VSPD
and WDIR are vector averaged wind speed and direction based on the wind vector. In
processing, the ‘Av_u’ and ‘Av_v’ columns of the raw time series files are rotated by the ARA
angle described above and this vector is used to compute the average U and V columns and the
vector averaged VSPD and WDIR columns. Sigma-theta by the Yamartino method uses unit
vectors from the raw u and v data and sigma-theta by the vector method uses the ratio of vector
speeds, VSPD to WSPD.
Techniques for removal of sporadic errors have been provided by Fleming (Fleming and Hill,
1982) and Taylor(Taylor, 1982). The Chauvenet’s Criterion method was used to reject outlying
points. Noise in the SODAR data occurs often as sporadic bursts which are effectively removed
by the Chauvenet’s criterion, described above. Occasionally an averaging time block will be
primarily “bad” data and in this case Chauvenet’s criterion fails to work properly because it will

36 of 88
remove the good data points which are in a minority. An ad hoc method was developed from
trial and error. When an averaged block is dominated by noise, the resulting value of the vector
mean speed,Sv, tends to jump significantly from surrounding good data. An example time series
might be Sv = {. . , 1.45, 1.96, 2.21, 22.34, 15.55, 1.45, 1.98, . . .}. The final cleaning process
compares the current value of Sv with the previous value. If the time gap since the last good
block is less than 2 hours and if the difference between Sv(now)-Sv(last) < 10 m/s, then the
block is recorded, otherwise it is rejected. This last procedure removes almost all of the sporadic
periods of noise. The final output table contains only the data that has padded the quality
assurance checks.
Table 11 Results from the three-step cleaning process for SODAR wind time series from
different levels above the roof.
Z N Nerror % bad
20 42596 1105 3
40 42596 3817 9
60 42596 7767 18
The SODAR deployment period was 471.4 days and during this time the data recovery was
94.1%. Outages were due to software crashes and a power failure. Of the recovered data, the
number of bad winds, Nerror, varied from 3% at 20 m to 18% data loss at 60 m.

37 of 88
7. Equipment Quality Assurance Tests
Equipment were installed and used following manufacturers specifications. However, it is
difficult to determine the quality of the data. One approach that provides confidence in data
quality is comparison between outputs of instruments that are collocated. For this reason,
comparisons were done between the mini Sodar and 3D Sonic anemometers on the rooftops at
Met Life and the General Motors buildings.
Although the mini Sodar provides wind data at elevations of 20 – 200 m and the anemometer
provides data at 6 m, the general wind directions should be consistent. Wind velocities should be
slightly less at the lower elevations. Figure 6 contains eight graphs of the 15 minute averaged
wind data taken during the field campaign. The top row of three graphs are mini Sodar wind
velocity comparisons between 20 – 40 m, 30 – 40 m, and 40 – 60 m. Beneath this are three
graphs for the comparison of the wind direction at these three elevations. The bottom two
graphs in the Figure are the comparison of wind speed and direction from the mini Sodar (red) at
40 m and the sonic anemometer (blue).
The wind speeds shown in Figure 6 at 20 and 30 meter elevations were substantially lower than
at 40 m. In addition the wind directions were much different at the lower elevations as compared
to 40 m. This suggests that the lower elevation data from the sodar are not representative of the
regional winds. The comparison of sodar data at 40 and 60 meters is much better. Both the wind
speed and directions are closely aligned. Considerable differences were found between the wind
directions from the anemometer and the sodar located on the Met Life building, Figure 6. A
quality assurance check was performed on the software used to process both data streams. The
processing programs were checked on a step-by-step basis and compared with hand calculations.
Both the anemometer and sodar processing programs were demonstrated to be operating

38 of 88
correctly. This further supports the finding that the sodar wind data below 40 m are not
representative of the winds in the area. After verifying the software, comparison plots of sodar
and anemometer data were made for short time blocks throughout the time series.
Figure 7 is identical to Figure 6 except the data are from the mini Sodar and anemometer on the
roof top of the GM building. In this case, the wind speed and direction compare as expected at
all three elevations. The mini Sodar data at 40 m and the sonic anemometer data are consistent
at this site.

39 of 88
Figure 6 The mini Sodar and wind measurements from the MetLife building roof. The sodar 40-m level is used as a standard for comparison here. The 40-m measurements are shown in blue. In the top two rows the sodar wind speeds and directions at 20, 30, and 60 m are compared to the 40-m level. The bottom row compares the speed and direction of the sonic anemometer (red)to the sodar 40-m level (blue). All of these data are 900 sec (15 min) averages.

40 of 88
Figure 7 The mini Sodar and wind measurements from the General Motors Building (gm) roof. The sodar 40-m level is used as a standard for comparison here. The 40-m measurements are shown in blue. In the top two rows the sodar wind speeds and directions at 20, 30, and 60 m are compared to the 40-m level. The bottom row compares the speed and direction of the sonic anemometer to the sodar 40-m level. All of these data are 900 sec (15 min) averages.
7.1 Windrose Intercomparison at Mesonet Stations
Figure 8 is a compilation of simple wind roses for stations in the mesonet array during the
MID05 test period in the month of August, 2005 for 16 different direction bins. Wind roses are
presented for the ASOS stations at Kennedy Airport (JFK) and LaGuardia airport (LGA); roof
top 3Dsonic anemometers at One Penn Plaza (OPP), Metropolitan Life Building (MET1), Park

41 of 88
Plaza (PPZ), General Motors Building (GM1) and the McGraw Hill building (MGH1); and mini
Sodars at 60 m above the roof top at Metropolitan Life (MET2) and General Motors (GM2)
buildings. The wind rose shows the percentage of time that the wind is blowing from one of the
16 direction bins. Wind speeds are color coded with the inner red region representing 0 – 3 m/s,
the white region is 3 – 7 m/s, and the outer red regions is >7 m/s. In some cases the percentages
do not add up to 100% because of equipment failures that occurred during the month (heat
problems). Nevertheless, one can see a tremendous scatter in the wind directions at the different
stations. This highlights the need for very localized data to accurately predict dispersion in urban
environments..
The ASOS stations at JFK and LGA airports are consistent and show a dominant southerly wind.
The LGA station also shows a sea/land breeze related to flow in and out of Long Island Sound.
Examining the figure it is clear that the wind patterns at these two airport ASOS stations are
considerably different than the Manhattan Mesonet stations.
The raw data sets were carefully checked to assure that the instruments were installed correctly
and that the data processing was done properly. The exact same processing software was used in
the BNL meteorological field comparisons (section 7.2) and the results there were quite good
(average wind speeds within 0.1 m/s and wind direction within 2º).
The miniSodar data shown in Figure 8 are from time series of winds at the 60 m range gate.
Comparison with the wind roses at 40, 50, and 70 m show similar and consistent results. The
comparison between MET1 (MetLife building 6-m tower) and MET2 (MetLife building
miniSodar at 60 m) is somewhat similar. However, they are dissimilar enough as to call into
question the value of roof stations as a predictor of higher level winds. The comparisons of

42 of 88
GM1 (General Motors building rooftop) and GM2 (General Motors building sodar at 60 m) are
different as discussed above.
The 3D sonic rooftop wind direction measurements from OPP, PPZ and GM1, are generally
similar showing, roughly, a N-S preference and a dominant southerly flow.
Figure 8 Directional Wind Rose from nine mesonet stations in August 2005.

43 of 88

44 of 88
7.2 Wind Intercomparisons in the BNL Meteorological Field
7.2.1 Field Comparisons of the mini Sodar at BNL
A mini Sodar has been evaluated through comparison of measurements made at the BNL
meteorological tower. The BNL meteorological tower has calibrated anemometers at heights of
10 m and 88 m. The sodar was placed in the meteorological field approximately 100 m from the
base of the tower. A comparison of the winds is shown in the figures below:
Figure 9 The vector speed, vector direction, and air temperature at 10 m (blue) and 88 m (red) from the BNL meteorological tower.

45 of 88
Figure 10 Wind speed and direction measured by the mini Sodar at 20 m (blue) and 100 m (red).
Prior to field deployment the new ASC miniSodar (called SODAR-2) was operated in the BNL
meteorological field (BNLMET) from June 21 – June 30, 2005 where the 90 m tower collects
precise wind measurements at 10 m and 88 m. The sodar averaged wind profiles for two
minutes. BNLMET data are sampled at one hertz and the data acquisition system makes one
minute averages.
The sodar data were processed with the same processing routines as used for the Manhattan
study on the General Motors building (gm2). Nine hundred second averages, 15 minutes, were
calculated of the wind speed and direction at 10 m intervals from 20 m to 200 m. Figure 11
compares data from three levels, (20 m, 40 m, and 90 m) with the tower wind measurements
taken from the 88 m level. The wind roses consider three groups, 0 – 3 m/s (red near center of
the figure), 3 – 7 m/s (white regions), and > 7 m/s red in the outer region of the circle. The
figure demonstrates that the comparison between the 90 m sodar and the 88 m tower wind roses

46 of 88
is quite good. The wind roses from lower levels show the expected effects of friction and
summer time nocturnal inversions. The sodar data file header below shows the processing
parameters.
SODAR2 DATA AVERAGING HEADER a02_sodar_dat_avg.pl (Ver: 105, 060625) Runtime 2006-06-25 (176) 12:45:56 platform: BNL expname: mid iopname: field sitename: sodar2_0602 height: 40 datapath: rawpath: /Volumes/hd2/data2/sodar/sodar0602/level0 Raw file name ID: _040.dat outpath: /Users/mike/data/urban/mid/level1/field/sodar2_0602 avgsecs: 900 timezone: -5 MaxSamps: 1e+20 Nsamp_min: 1 missing: -999 snr_threshold: 5 rotation: -78 StartTime: 2006,02,10,11,00,00 EndTime: 2006,03,15,15,00,00 Record times are the center of the averaging time. Time is in Eastern Standard Time. Height is the center of the range gate. Comments: This series was an evaluation of the performance of one of the two new miniSodar systems before deployment in the Manhattan mesonet. This sodar was deployed on the GM building (station gm2) during the UDP experiment "mid-05". 060625-rerun program with rotation = -78 deg. This represents a correction of -90 and an axis rotation of 12 deg, from MagN to TrueN. When I apply this angle, the sodar agrees almost exactly with the BnlMet tower data at 88 m.

47 of 88
Figure 11 Comparison of Wind Speed and Direction for the miniSodar at 20, 40, 60, and 90 meters and the BNL meteorological tower at 88 m.
7.1.2 Side-by-side comparison of 3D Sonic Anemometers

48 of 88
After the field campaign in August 2005, the 3D Sonic anemometers were brought back to BNL.
In September, these instruments were tested at the BNL meteorological field in a side-by- side
comparisons over several days. Four series of tests were completed based on when the
instrumentation was returned. In general, one or more instruments were used in more than one
series to provide a measure of consistency between tests. Figure 12 plots the mean speed and
mean direction of each group. This was a mid-summer exercise and the winds were generally
weak and showed strong nocturnal variability. Average wind speeds for the days tested ranged
from 0.3 m/s to 1.4 m/s. Table 12 compares the deviation from the group mean speed and
direction based on 5 minute averages. The horizontal speed and direction are compared in this
analysis. In almost all cases, each anemometer agreed with the group mean by, <0.1 m/s in
speed and by < 2 deg in direction. Note the direction bias is dependent on proper alignment
during installation. A few instruments showed high standard deviations about the mean in wind
direction.

49 of 88
Figure 12 The group mean wind speed (left column) and direction (right column) during each of the intercomparison periods.

50 of 88
Table 12 The mean bias and standard deviation for each sonic anemometer during the four-part field test. GROUP: GP1 MEAN VEL: 0.4 m/s, 204.1 degT START: 20050913, 000000, STOP: 20050913,235500, Npts = 288 Wind Speed Wind Direction RMY SN BIAS STD DEV BIAS STD DEV SN 320 0.039 0.100 -0.1 15.7 SN 358 0.039 0.118 -0.1 14.4 SN 362 0.061 0.110 1.0 15.5 SN 363 0.055 0.108 1.1 14.5 SN 364 -0.027 0.230 0.7 24.6 SN 365 0.064 0.107 0.3 14.0 SN 366 0.056 0.253 -1.1 26.8 SN 367 0.062 0.110 -1.7 16.5 SN 597 0.017 0.094 -1.4 14.7 SN 607 0.017 0.512 5.1 53.0 GROUP: GP2 MEAN VEL: 0.3 m/s, 194.3 degT START: 20050911,000000, STOP: 20050911,235500, Npts = 288 Wind Speed Wind Direction RMY SN BIAS STD DEV BIAS STD DEV SN 595 0.066 0.235 -3.0 23.8 SN 602 0.055 0.241 -2.8 23.9 SN 608 0.087 0.341 7.0 35.9 GROUP: GP3 MEAN VEL: 1.4 m/s, 320.4 degT START: 20050901,000000, STOP: 20050901,235500, Npts = 288 Wind Speed Wind Direction RMY SN B RMY BIAS STD DEV BIAS STD DEV SN 358 0.055 0.108 -1.0 5.5 SN 601 -0.046 0.521 -2.5 23.4 SN 606 0.004 0.139 -0.5 7.4 SN 610 0.010 0.106 -0.1 5.3 SN 611 0.003 0.100 0.8 5.4 SN 614 0.032 0.110 -0.5 5.6 SN 621 0.046 0.108 -1.1 5.6 GROUP: GP4 MEAN VEL: 0.9 m/s, 343.3 degT START: 20050904,000000, STOP: 20050904,235500, Npts = 288 Wind Speed Wind Direction RMY SN BIAS STD DEV BIAS STD DEV SN 320 0.009 0.109 -0.4 7.0 SN 358 0.026 0.124 -0.3 8.0 SN 364 0.094 0.178 -0.0 8.3 SN 598 -0.023 0.104 -1.0 7.5

51 of 88
SN 608 0.014 0.438 3.1 26.3 SN 616 0.013 0.110 0.5 6.6
Table 12 shows that some of the 3D sonic anemometers exhibit a large standard deviation in the
wind direction. For example, machines SN 607 in group 1, SN 608 in group 2 and 4. Further
examination of the performance of these machines is presented in Figure 13 which contains a
comparison of the difference between the mean wind direction of the group and the wind
direction of three individual instruments, SN 320, SN 364, and SN 607. From table 12, the mean
direction 204º true North and instrument SN 607 had a bias of 5.1 and standard deviation of 53º.
This is considerably more scatter than the others and this is evident in Figure 13. This suggests
that values for wind speed and direction can be viewed with high confidence for instruments SN
320 and SN 364, while this is not the case for instrument SN 607. Based on the data in Figure
12, the performance of instruments SN 601 and SN 608 are also suspect.

52 of 88
Figure 13 Comparison of measured wind direction to the group mean wind direction for
instruments SN 320, SN 364, and SN 607 in group 1.

53 of 88
Appendix A: LEVEL 0, TOP LEVEL FOLDERS
Each instrument used in the MID05 has a level 0 folder containing all of the raw data collected
during the field campaign. A listing of all of the folders in the level 0 folder is shown below.
Date Folder Name 4 rmr rmr 136 Oct 27 2005 ccny 4 rmr rmr 136 Oct 27 2005 cpk_Central_Park_asos 3 rmr rmr 102 Oct 27 2005 eml_nyc002 4 rmr rmr 136 Oct 27 2005 ewr_NewarkAirport_asos 54 rmr rmr 1836 Oct 27 2005 gm1_GMBldg_roof_met 16 rmr rmr 544 Oct 27 2005 gm2_GMBldg_roof_sodar 5 rmr rmr 170 Oct 27 2005 hpn_airport_asos 4 rmr rmr 136 Oct 27 2005 isp_IslipAirp[ort_asos 3 rmr rmr 102 Oct 27 2005 jfk_KennedyAirport_asos 4 rmr rmr 136 Oct 27 2005 lbr1_BldgA_roof 49 rmr rmr 1666 Oct 27 2005 lbr2_LehmanBros_setback 3 rmr rmr 102 Oct 27 2005 lga_laguardia airport_asos 63 rmr rmr 2142 Oct 27 2005 metl1_met 33 rmr rmr 1122 Oct 27 2005 metl2_sodar 41 rmr rmr 1394 Oct 27 2005 mgh1_McGrawHill_roof 59 rmr rmr 2006 Oct 27 2005 mgh2_McGrawHill_setback 60 rmr rmr 2040 Oct 27 2005 opp_OnePennPlaza_roof_met 84 rmr rmr 2856 Oct 27 2005 ppza_ParkPlaza_roof 16 rmr rmr 544 Oct 27 2005 s1 16 rmr rmr 544 Oct 27 2005 s10 10 rmr rmr 340 Oct 27 2005 s11 10 rmr rmr 340 Oct 27 2005 s12 10 rmr rmr 340 Oct 27 2005 s2 17 rmr rmr 578 Oct 27 2005 s3 17 rmr rmr 578 Oct 27 2005 s4 17 rmr rmr 578 Oct 27 2005 s5 12 rmr rmr 408 Oct 27 2005 s6 16 rmr rmr 544 Oct 27 2005 s7 19 rmr rmr 646 Oct 27 2005 s8 16 rmr rmr 544 Oct 27 2005 s9 4 rmr rmr 136 Oct 27 2005 sit_Stevens_HoweCenter The level 0 folder contains all of the raw data that are collected from the following sources: ASOS: (cpk, ewr, hpn, isp, jfk, lga): NOAA automated weather stations. The raw file here has
a name such as cpk2005 which has data from 1 Jan 2005 to 1 Sep 2005 which covers both the
MSG and MID experiments. The header of the ASOS file is shown below
Station: cpk Year: 2005 Time correction: 0

54 of 88
wdir Date JD Time wspd(m/s) (degT) tair(C) tdew(C) rh(%)slp(hPa) ppt(mm) 2005-01-01 (001) 00:51:00, 5.7, 230, 11.1, 5.6, 69, 1016.8, 0.0 2005-01-01 (001) 01:51:00, 3.6, 240, 11.1, 5.6, 69, 1016.8, 0.0 2005-01-01 (001) 02:51:00, 4.1, 240, 11.1, 5.6, 69, 1016.8, 0.0 2005-01-01 (001) 03:51:00, 4.1, 240, 10.6, 5.6, 71, 1016.8, 0.0
ASOS records are reported hourly, typically at 50 minutes after the hour, and are a five-minute
average of the measurement suite. The file contains columns for the date, Julian date, time
(EST), wind speed (m/s), wind direction (True North), air temperature (ºC), dew point
temperature (ºC), barometric pressure (kPa), and precipitation (mm).
BNL Rooftop and Setback Sonics (gm1, lbr2, metl1, mgh1, mgh2, opp, ppza): BNL installed
seven sonic anemometer stations on roof tops and setbacks. These are all identical instruments
collecting three components of wind and the sonic temperature at a 10 Hz sampling rate.
There are two file types in this folder. The original files have names such as
UDP01$20050805.dat where the first five characters designate the data acquisition computer and
the last eight are the starting date for the file.
The second type of file has a form such as gm1_20050826.da1 where the location is identified
along with the date. These files called the “da1” files are exactly the same as the first type but
the data here are cleaned and any short records are removed. The header and a few data lines
for the da1 files is given below:
PROGRAM rmy3d_clean_v3b.pl (ver v3b, 0509030): requires two arguments. The program
reads each raw data file and combs through for short data lines. Experience indicates that at

55 of 88
worst, we get about 0.3% bad data lines. When short lines occur several other lines are lost
completely. Spike values are also bad lines with missing data. All short or bad lines (spikes) are
removed from the file.
v3a 050928 rmr -- modify input to binary and set up for DOS-generated
raw data files. Output files are Unix format (\cJ) end-0f-line.
v3b 050930 rmr -- check for non numeric spike values.
2005-08-26 00:00:25.09 01 -1.38 -3.65 0.54 343.80 20.16 0
2005-08-26 00:00:25.19 01 -0.64 -3.29 -0.18 343.80 20.16 0
2005-08-26 00:00:25.29 01 -0.55 -3.24 -0.03 343.76 20.11 0
...
BNL Rooftop Sodar Stations (gm2, metl2): Two mini Sodar systems were deployed on two
different rooftop locations in Midtown. The raw data from the sodar system is organized in daily
files with names such as 050807dv.dat which gives the date as yyMMdd as the file name.
The data in the raw files are organized into data tables. A new data table is created at the end of
each averaging period (1 minute) for this experiment. A typical table is shown here (pardon the
small print). Header information follows.

56 of 88

57 of 88

58 of 88
Other sources (ccny, sit): The two universities CCNY and SIT operate meteorological
instrumentation on exposed sites on their campuses. Their data are available from the internet.
DCNet NOAA (lbr1, eml): Two stations are operated by NOAA. The data were collected from
NOAA by internet connection. The files have names such as eml_nyc002_rooftop.txt and the
first lines in a file look like the example below:
Date Time tempC, relHumidity, windSpeedMs, windDir, baroMb 2005-08-01 00:15:00, 21.5, 86, 1.814, 101, -999.0 2005-08-01 00:30:00, 21.7, 84, 1.661, 110, -999.0 2005-08-01 00:45:00, 21.6, 84, 1.747, 114, -999.0 . . .
These records are produced each 15 minutes.

59 of 88
Appendix A: Listing of All Folders and Files In Level 0 for MID05
The following lists the folder and file names for all level 0 data. A complete list of folders is found FOLDER: /Volumes/hd1/mid_level0/ccny: total 752 -rwxrwxrwx 1 rmr rmr 381316 Sep 12 2005 ccny_08-26-31.txt FOLDER: /Volumes/hd1/mid_level0/cpk_Central_Park_asos: total 912 -rwxrwxrwx 1 rmr rmr 460493 Sep 12 2005 cpk2005.dat FOLDER: /Volumes/hd1/mid_level0/eml_nyc002: total 304 -rwxrwxrwx 1 rmr rmr 147512 Sep 12 2005 eml_nyc002_rooftop.txt FOLDER: /Volumes/hd1/mid_level0/ewr_NewarkAirport_asos: total 912 -rwxrwxrwx 1 rmr rmr 460849 Sep 12 2005 ewr2005.dat FOLDER: /Volumes/hd1/mid_level0/gm1_GMBldg_roof_met: total 5166064 -rwxrwxrwx 1 rmr rmr 26519888 Sep 29 2005 UDP01$20050804.dat -rwxrwxrwx 1 rmr rmr 58751448 Aug 6 2005 UDP01$20050805.dat -rwxrwxrwx 1 rmr rmr 58751616 Aug 7 2005 UDP01$20050806.dat -rwxrwxrwx 1 rmr rmr 58751968 Aug 8 2005 UDP01$20050807.dat -rwxrwxrwx 1 rmr rmr 58751984 Aug 9 2005 UDP01$20050808.dat -rwxrwxrwx 1 rmr rmr 58751976 Aug 10 2005 UDP01$20050809.dat -rwxrwxrwx 1 rmr rmr 58751992 Aug 11 2005 UDP01$20050810.dat -rwxrwxrwx 1 rmr rmr 58751952 Aug 12 2005 UDP01$20050811.dat -rwxrwxrwx 1 rmr rmr 33536795 Aug 17 2005 UDP01$20050812.dat -rwxrwxrwx 1 rmr rmr 14157378 Aug 18 2005 UDP01$20050817.dat -rwxrwxrwx 1 rmr rmr 58751944 Aug 19 2005 UDP01$20050818.dat -rwxrwxrwx 1 rmr rmr 58751984 Aug 20 2005 UDP01$20050819.dat -rwxrwxrwx 1 rmr rmr 58752000 Aug 21 2005 UDP01$20050820.dat -rwxrwxrwx 1 rmr rmr 58752001 Sep 30 2005 UDP01$20050821.dat -rwxrwxrwx 1 rmr rmr 58751968 Aug 23 2005 UDP01$20050822.dat -rwxrwxrwx 1 rmr rmr 58750001 Aug 24 2005 UDP01$20050823.dat -rwxrwxrwx 1 rmr rmr 58751952 Aug 25 2005 UDP01$20050824.dat -rwxrwxrwx 1 rmr rmr 58752000 Aug 26 2005 UDP01$20050825.dat -rwxrwxrwx 1 rmr rmr 58751960 Aug 27 2005 UDP01$20050826.dat -rwxrwxrwx 1 rmr rmr 58752000 Aug 28 2005 UDP01$20050827.dat -rwxrwxrwx 1 rmr rmr 58751912 Aug 29 2005 UDP01$20050828.dat

60 of 88
-rwxrwxrwx 1 rmr rmr 58752000 Aug 30 2005 UDP01$20050829.dat -rwxrwxrwx 1 rmr rmr 58751912 Aug 31 2005 UDP01$20050830.dat -rwxrwxrwx 1 rmr rmr 58751928 Oct 1 2005 UDP01$20050831.dat -rwxrwxrwx 1 rmr rmr 32435976 Sep 1 2005 UDP01$20050901.dat -rwxrwxrwx 1 rmr rmr 2312 Oct 1 2005 UDP01x$20050831.dat -rw-r--r-- 1 rmr rmr 26115128 Sep 30 2005 gm1_20050804.da1 -rw-r--r-- 1 rmr rmr 57852157 Sep 30 2005 gm1_20050805.da1 -rw-r--r-- 1 rmr rmr 57870448 Sep 30 2005 gm1_20050806.da1 -rw-r--r-- 1 rmr rmr 57870582 Sep 30 2005 gm1_20050807.da1 -rw-r--r-- 1 rmr rmr 57509251 Sep 30 2005 gm1_20050808.da1 -rw-r--r-- 1 rmr rmr 57811488 Sep 30 2005 gm1_20050809.da1 -rw-r--r-- 1 rmr rmr 57643921 Sep 30 2005 gm1_20050810.da1 -rw-r--r-- 1 rmr rmr 57796949 Sep 30 2005 gm1_20050811.da1 -rw-r--r-- 1 rmr rmr 32787390 Sep 30 2005 gm1_20050812.da1 -rw-r--r-- 1 rmr rmr 13923406 Sep 30 2005 gm1_20050817.da1 -rw-r--r-- 1 rmr rmr 57279240 Sep 30 2005 gm1_20050818.da1 -rw-r--r-- 1 rmr rmr 54208295 Sep 30 2005 gm1_20050819.da1 -rw-r--r-- 1 rmr rmr 57538061 Sep 30 2005 gm1_20050820.da1 -rw-r--r-- 1 rmr rmr 57704757 Oct 1 2005 gm1_20050821.da1 -rw-r--r-- 1 rmr rmr 57388651 Oct 1 2005 gm1_20050822.da1 -rw-r--r-- 1 rmr rmr 57279174 Oct 1 2005 gm1_20050823.da1 -rw-r--r-- 1 rmr rmr 56977204 Oct 1 2005 gm1_20050824.da1 -rw-r--r-- 1 rmr rmr 56747394 Oct 1 2005 gm1_20050825.da1 -rw-r--r-- 1 rmr rmr 57456589 Oct 1 2005 gm1_20050826.da1 -rw-r--r-- 1 rmr rmr 57635144 Oct 1 2005 gm1_20050827.da1 -rw-r--r-- 1 rmr rmr 56754563 Oct 1 2005 gm1_20050828.da1 -rw-r--r-- 1 rmr rmr 57062897 Oct 1 2005 gm1_20050829.da1 -rw-r--r-- 1 rmr rmr 56527165 Oct 1 2005 gm1_20050830.da1 -rw-r--r-- 1 rmr rmr 55021969 Oct 1 2005 gm1_20050831.da1 -rw-r--r-- 1 rmr rmr 31640417 Oct 1 2005 gm1_20050901.da1 FOLDER: /Volumes/hd1/mid_level0/gm2_GMBldg_roof_sodar: total 18704 -rwxrwxrwx 1 rmr rmr 231329 Sep 2 2005 050819dv.dat -rwxrwxrwx 1 rmr rmr 774720 Sep 2 2005 050820dv.dat -rwxrwxrwx 1 rmr rmr 774720 Sep 2 2005 050821dv.dat -rwxrwxrwx 1 rmr rmr 774720 Sep 2 2005 050822dv.dat -rwxrwxrwx 1 rmr rmr 774720 Sep 2 2005 050823dv.dat -rwxrwxrwx 1 rmr rmr 774720 Sep 2 2005 050824dv.dat -rwxrwxrwx 1 rmr rmr 774720 Sep 2 2005 050825dv.dat -rwxrwxrwx 1 rmr rmr 774720 Sep 2 2005 050826dv.dat -rwxrwxrwx 1 rmr rmr 774720 Sep 2 2005 050827dv.dat -rwxrwxrwx 1 rmr rmr 774720 Sep 2 2005 050828dv.dat -rwxrwxrwx 1 rmr rmr 774720 Sep 2 2005 050829dv.dat -rwxrwxrwx 1 rmr rmr 774720 Sep 2 2005 050830dv.dat -rwxrwxrwx 1 rmr rmr 774720 Sep 2 2005 050831dv.dat

61 of 88
FOLDER: /Volumes/hd1/mid_level0/hpn_airport_asos: total 2048 -rwxrwxrwx 1 rmr rmr 578254 Sep 12 2005 hpn2004.dat -rwxrwxrwx 1 rmr rmr 460298 Sep 12 2005 hpn2005.dat FOLDER: /Volumes/hd1/mid_level0/isp_IslipAirp[ort_asos: total 2272 -rwxrwxrwx 1 rmr rmr 692959 Sep 12 2005 isp2004.dat -rwxrwxrwx 1 rmr rmr 460928 Sep 12 2005 isp2005.dat FOLDER: /Volumes/hd1/mid_level0/jfk_KennedyAirport_asos: total 912 -rwxrwxrwx 1 rmr rmr 460927 Sep 12 2005 jfk2005.dat FOLDER: /Volumes/hd1/mid_level0/lbr1_BldgA_roof: total 288 -rwxrwxrwx 1 rmr rmr 141045 Sep 12 2005 lbr1_BldgA.txt FOLDER: /Volumes/hd1/mid_level0/lbr2_LehmanBros_setback: total 4931584 -rwxrwxrwx 1 rmr rmr 16742912 Aug 11 2005 UDP21$20050810.dat -rwxrwxrwx 1 rmr rmr 58788506 Aug 12 2005 UDP21$20050811.dat -rwxrwxrwx 1 rmr rmr 58790377 Aug 13 2005 UDP21$20050812.dat -rwxrwxrwx 1 rmr rmr 58787268 Aug 14 2005 UDP21$20050813.dat -rwxrwxrwx 1 rmr rmr 58823800 Aug 15 2005 UDP21$20050814.dat -rwxrwxrwx 1 rmr rmr 58782440 Aug 16 2005 UDP21$20050815.dat -rwxrwxrwx 1 rmr rmr 58826448 Aug 17 2005 UDP21$20050816.dat -rwxrwxrwx 1 rmr rmr 58786745 Aug 18 2005 UDP21$20050817.dat -rwxrwxrwx 1 rmr rmr 58827418 Aug 19 2005 UDP21$20050818.dat -rwxrwxrwx 1 rmr rmr 58783105 Aug 20 2005 UDP21$20050819.dat -rwxrwxrwx 1 rmr rmr 58825712 Aug 21 2005 UDP21$20050820.dat -rwxrwxrwx 1 rmr rmr 58788004 Aug 22 2005 UDP21$20050821.dat -rwxrwxrwx 1 rmr rmr 58788479 Aug 23 2005 UDP21$20050822.dat -rwxrwxrwx 1 rmr rmr 58827744 Aug 24 2005 UDP21$20050823.dat -rwxrwxrwx 1 rmr rmr 58784590 Aug 25 2005 UDP21$20050824.dat -rwxrwxrwx 1 rmr rmr 58825308 Aug 26 2005 UDP21$20050825.dat -rwxrwxrwx 1 rmr rmr 58785581 Aug 27 2005 UDP21$20050826.dat -rwxrwxrwx 1 rmr rmr 58784484 Aug 28 2005 UDP21$20050827.dat -rwxrwxrwx 1 rmr rmr 58826539 Aug 29 2005 UDP21$20050828.dat -rwxrwxrwx 1 rmr rmr 58786189 Aug 30 2005 UDP21$20050829.dat -rwxrwxrwx 1 rmr rmr 58788460 Aug 31 2005 UDP21$20050830.dat -rwxrwxrwx 1 rmr rmr 58785054 Sep 1 2005 UDP21$20050831.dat -rwxrwxrwx 1 rmr rmr 31369560 Sep 1 2005 UDP21$20050901.dat -rw-r--r-- 1 rmr rmr 16435999 Oct 1 2005 lbr2_20050810.da1 -rw-r--r-- 1 rmr rmr 57721588 Oct 1 2005 lbr2_20050811.da1

62 of 88
-rw-r--r-- 1 rmr rmr 57727868 Oct 1 2005 lbr2_20050812.da1 -rw-r--r-- 1 rmr rmr 57717684 Oct 1 2005 lbr2_20050813.da1 -rw-r--r-- 1 rmr rmr 47963224 Oct 1 2005 lbr2_20050814.da1 -rw-r--r-- 1 rmr rmr 55467385 Oct 1 2005 lbr2_20050815.da1 -rw-r--r-- 1 rmr rmr 57751951 Oct 1 2005 lbr2_20050816.da1 -rw-r--r-- 1 rmr rmr 57715623 Oct 1 2005 lbr2_20050817.da1 -rw-r--r-- 1 rmr rmr 57755408 Oct 1 2005 lbr2_20050818.da1 -rw-r--r-- 1 rmr rmr 52832185 Oct 1 2005 lbr2_20050819.da1 -rw-r--r-- 1 rmr rmr 57749827 Oct 1 2005 lbr2_20050820.da1 -rw-r--r-- 1 rmr rmr 57719599 Oct 1 2005 lbr2_20050821.da1 -rw-r--r-- 1 rmr rmr 57721380 Oct 1 2005 lbr2_20050822.da1 -rw-r--r-- 1 rmr rmr 57756437 Oct 1 2005 lbr2_20050823.da1 -rw-r--r-- 1 rmr rmr 57708718 Oct 1 2005 lbr2_20050824.da1 -rw-r--r-- 1 rmr rmr 57748099 Oct 1 2005 lbr2_20050825.da1 -rw-r--r-- 1 rmr rmr 57712021 Oct 1 2005 lbr2_20050826.da1 -rw-r--r-- 1 rmr rmr 57708347 Oct 1 2005 lbr2_20050827.da1 -rw-r--r-- 1 rmr rmr 57746510 Oct 1 2005 lbr2_20050828.da1 -rw-r--r-- 1 rmr rmr 57713725 Oct 1 2005 lbr2_20050829.da1 -rw-r--r-- 1 rmr rmr 57721306 Oct 1 2005 lbr2_20050830.da1 -rw-r--r-- 1 rmr rmr 56984425 Oct 1 2005 lbr2_20050831.da1 -rw-r--r-- 1 rmr rmr 30799234 Oct 1 2005 lbr2_20050901.da1 FOLDER: /Volumes/hd1/mid_level0/lga_laguardia airport_asos: total 912 -rwxrwxrwx 1 rmr rmr 460847 Sep 12 2005 lga2005.dat FOLDER: /Volumes/hd1/mid_level0/metl1_met: total 5697008 -rwxrwxrwx 1 rmr rmr 40800 Jul 28 2005 UDP10$20050728.dat -rwxrwxrwx 1 rmr rmr 28883642 Jul 30 2005 UDP10$20050729.dat -rwxrwxrwx 1 rmr rmr 58542976 Jul 31 2005 UDP10$20050730.dat -rwxrwxrwx 1 rmr rmr 58543088 Aug 1 2005 UDP10$20050731.dat -rwxrwxrwx 1 rmr rmr 58543752 Aug 2 2005 UDP10$20050801.dat -rwxrwxrwx 1 rmr rmr 58543560 Aug 3 2005 UDP10$20050802.dat -rwxrwxrwx 1 rmr rmr 58340176 Aug 4 2005 UDP10$20050803.dat -rwxrwxrwx 1 rmr rmr 58585784 Aug 5 2005 UDP10$20050804.dat -rwxrwxrwx 1 rmr rmr 58544896 Aug 6 2005 UDP10$20050805.dat -rwxrwxrwx 1 rmr rmr 58544816 Aug 7 2005 UDP10$20050806.dat -rwxrwxrwx 1 rmr rmr 58544864 Aug 8 2005 UDP10$20050807.dat -rwxrwxrwx 1 rmr rmr 58544824 Aug 9 2005 UDP10$20050808.dat -rwxrwxrwx 1 rmr rmr 58585664 Aug 10 2005 UDP10$20050809.dat -rwxrwxrwx 1 rmr rmr 57523736 Aug 11 2005 UDP10$20050810.dat -rwxrwxrwx 1 rmr rmr 58585688 Aug 12 2005 UDP10$20050811.dat -rwxrwxrwx 1 rmr rmr 21460496 Aug 12 2005 UDP10$20050812.dat -rwxrwxrwx 1 rmr rmr 22602129 Aug 14 2005 UDP10$20050814.dat -rwxrwxrwx 1 rmr rmr 20399507 Aug 17 2005 UDP21$20050817.dat

63 of 88
-rwxrwxrwx 1 rmr rmr 58751836 Aug 19 2005 UDP21$20050818.dat -rwxrwxrwx 1 rmr rmr 58751784 Aug 19 2005 UDP21$20050819.dat -rwxrwxrwx 1 rmr rmr 58751834 Aug 20 2005 UDP21$20050820.dat -rwxrwxrwx 1 rmr rmr 58751796 Aug 21 2005 UDP21$20050821.dat -rwxrwxrwx 1 rmr rmr 58751340 Aug 22 2005 UDP21$20050822.dat -rwxrwxrwx 1 rmr rmr 6405526 Aug 22 2005 UDP21$20050823.dat -rwxrwxrwx 1 rmr rmr 46552410 Aug 24 2005 UDP21$20050824.dat -rwxrwxrwx 1 rmr rmr 58751817 Aug 25 2005 UDP21$20050825.dat -rwxrwxrwx 1 rmr rmr 58751808 Aug 26 2005 UDP21$20050826.dat -rwxrwxrwx 1 rmr rmr 58751739 Aug 27 2005 UDP21$20050827.dat -rwxrwxrwx 1 rmr rmr 58751515 Aug 28 2005 UDP21$20050828.dat -rwxrwxrwx 1 rmr rmr 49775815 Aug 29 2005 UDP21$20050829.dat -rw-r--r-- 1 rmr rmr 40764 Oct 1 2005 metl1_20050728.da1 -rw-r--r-- 1 rmr rmr 26651020 Oct 1 2005 metl1_20050729.da1 -rw-r--r-- 1 rmr rmr 55893170 Oct 1 2005 metl1_20050730.da1 -rw-r--r-- 1 rmr rmr 56090217 Oct 1 2005 metl1_20050731.da1 -rw-r--r-- 1 rmr rmr 55908446 Oct 1 2005 metl1_20050801.da1 -rw-r--r-- 1 rmr rmr 55940137 Oct 1 2005 metl1_20050802.da1 -rw-r--r-- 1 rmr rmr 54981434 Oct 1 2005 metl1_20050803.da1 -rw-r--r-- 1 rmr rmr 55365411 Oct 1 2005 metl1_20050804.da1 -rw-r--r-- 1 rmr rmr 55210909 Oct 1 2005 metl1_20050805.da1 -rw-r--r-- 1 rmr rmr 53594735 Oct 1 2005 metl1_20050806.da1 -rw-r--r-- 1 rmr rmr 54821639 Oct 1 2005 metl1_20050807.da1 -rw-r--r-- 1 rmr rmr 55308997 Oct 1 2005 metl1_20050808.da1 -rw-r--r-- 1 rmr rmr 55356031 Oct 1 2005 metl1_20050809.da1 -rw-r--r-- 1 rmr rmr 54420979 Oct 1 2005 metl1_20050810.da1 -rw-r--r-- 1 rmr rmr 57200072 Oct 1 2005 metl1_20050811.da1 -rw-r--r-- 1 rmr rmr 21144893 Oct 1 2005 metl1_20050812.da1 -rw-r--r-- 1 rmr rmr 22050800 Oct 1 2005 metl1_20050814.da1 -rw-r--r-- 1 rmr rmr 20098579 Oct 1 2005 metl1_20050817.da1 -rw-r--r-- 1 rmr rmr 57886909 Oct 1 2005 metl1_20050818.da1 -rw-r--r-- 1 rmr rmr 57886758 Oct 1 2005 metl1_20050819.da1 -rw-r--r-- 1 rmr rmr 57887166 Oct 1 2005 metl1_20050820.da1 -rw-r--r-- 1 rmr rmr 57870886 Oct 1 2005 metl1_20050821.da1 -rw-r--r-- 1 rmr rmr 57832551 Oct 1 2005 metl1_20050822.da1 -rw-r--r-- 1 rmr rmr 6306729 Oct 1 2005 metl1_20050823.da1 -rw-r--r-- 1 rmr rmr 45795354 Oct 1 2005 metl1_20050824.da1 -rw-r--r-- 1 rmr rmr 57846162 Oct 1 2005 metl1_20050825.da1 -rw-r--r-- 1 rmr rmr 57748869 Oct 1 2005 metl1_20050826.da1 -rw-r--r-- 1 rmr rmr 57816539 Oct 1 2005 metl1_20050827.da1 -rw-r--r-- 1 rmr rmr 57837592 Oct 1 2005 metl1_20050828.da1 -rw-r--r-- 1 rmr rmr 49001378 Oct 1 2005 metl1_20050829.da1 FOLDER: /Volumes/hd1/mid_level0/metl2_sodar: total 224112 -rwxrwxrwx 1 rmr rmr 1688008 Aug 19 2005 050803dv.dat

64 of 88
-rwxrwxrwx 1 rmr rmr 4037760 Aug 19 2005 050804dv.dat -rwxrwxrwx 1 rmr rmr 4037760 Aug 19 2005 050805dv.dat -rwxrwxrwx 1 rmr rmr 4037760 Aug 19 2005 050806dv.dat -rwxrwxrwx 1 rmr rmr 4037760 Aug 19 2005 050807dv.dat -rwxrwxrwx 1 rmr rmr 4037763 Aug 19 2005 050808dv.dat -rwxrwxrwx 1 rmr rmr 4037760 Aug 19 2005 050809dv.dat -rwxrwxrwx 1 rmr rmr 4001308 Aug 19 2005 050810dv.dat -rwxrwxrwx 1 rmr rmr 4037767 Aug 19 2005 050811dv.dat -rwxrwxrwx 1 rmr rmr 4037762 Aug 19 2005 050812dv.dat -rwxrwxrwx 1 rmr rmr 4037760 Aug 19 2005 050813dv.dat -rwxrwxrwx 1 rmr rmr 4037760 Aug 19 2005 050814dv.dat -rwxrwxrwx 1 rmr rmr 4037760 Sep 2 2005 050815dv.dat -rwxrwxrwx 1 rmr rmr 4037760 Sep 2 2005 050816dv.dat -rwxrwxrwx 1 rmr rmr 4037774 Sep 2 2005 050817dv.dat -rwxrwxrwx 1 rmr rmr 4037760 Sep 2 2005 050818dv.dat -rwxrwxrwx 1 rmr rmr 4037760 Sep 2 2005 050819dv.dat -rwxrwxrwx 1 rmr rmr 4034839 Sep 2 2005 050820dv.dat -rwxrwxrwx 1 rmr rmr 4037760 Sep 2 2005 050821dv.dat -rwxrwxrwx 1 rmr rmr 4037760 Sep 2 2005 050822dv.dat -rwxrwxrwx 1 rmr rmr 4037760 Sep 2 2005 050823dv.dat -rwxrwxrwx 1 rmr rmr 4037760 Sep 2 2005 050824dv.dat -rwxrwxrwx 1 rmr rmr 4037760 Sep 2 2005 050825dv.dat -rwxrwxrwx 1 rmr rmr 4037760 Sep 2 2005 050826dv.dat -rwxrwxrwx 1 rmr rmr 4037760 Sep 2 2005 050827dv.dat -rwxrwxrwx 1 rmr rmr 4037760 Sep 2 2005 050828dv.dat -rwxrwxrwx 1 rmr rmr 4037760 Sep 2 2005 050829dv.dat -rwxrwxrwx 1 rmr rmr 4037760 Sep 2 2005 050830dv.dat -rwxrwxrwx 1 rmr rmr 4037760 Sep 2 2005 050831dv.dat drwxr-xr-x 29 rmr rmr 986 Oct 27 2005 metl2_sodar_dfs FOLDER: /Volumes/hd1/mid_level0/mgh1_McGrawHill_roof: total 3689664 -rwxrwxrwx 1 rmr rmr 856634 Aug 5 2005 UDP09$20050805.dat -rwxrwxrwx 1 rmr rmr 41410139 Aug 15 2005 UDP09$20050814.dat -rwxrwxrwx 1 rmr rmr 35618328 Aug 15 2005 UDP09$20050815.dat -rwxrwxrwx 1 rmr rmr 28395518 Aug 18 2005 UDP09$20050817.dat -rwxrwxrwx 1 rmr rmr 58751976 Aug 19 2005 UDP09$20050818.dat -rwxrwxrwx 1 rmr rmr 58751944 Aug 20 2005 UDP09$20050819.dat -rwxrwxrwx 1 rmr rmr 58751936 Aug 21 2005 UDP09$20050820.dat -rwxrwxrwx 1 rmr rmr 58751936 Aug 22 2005 UDP09$20050821.dat -rwxrwxrwx 1 rmr rmr 58751872 Aug 23 2005 UDP09$20050822.dat -rwxrwxrwx 1 rmr rmr 58751920 Aug 24 2005 UDP09$20050823.dat -rwxrwxrwx 1 rmr rmr 58751952 Aug 25 2005 UDP09$20050824.dat -rwxrwxrwx 1 rmr rmr 58751968 Aug 26 2005 UDP09$20050825.dat -rwxrwxrwx 1 rmr rmr 58751968 Aug 27 2005 UDP09$20050826.dat -rwxrwxrwx 1 rmr rmr 58751976 Aug 28 2005 UDP09$20050827.dat

65 of 88
-rwxrwxrwx 1 rmr rmr 58751936 Aug 29 2005 UDP09$20050828.dat -rwxrwxrwx 1 rmr rmr 58751992 Aug 30 2005 UDP09$20050829.dat -rwxrwxrwx 1 rmr rmr 58751952 Aug 31 2005 UDP09$20050830.dat -rwxrwxrwx 1 rmr rmr 58751976 Sep 1 2005 UDP09$20050831.dat -rwxrwxrwx 1 rmr rmr 28355984 Sep 1 2005 UDP09$20050901.dat -rw-r--r-- 1 rmr rmr 844094 Oct 1 2005 mgh1_20050805.da1 -rw-r--r-- 1 rmr rmr 39563193 Oct 1 2005 mgh1_20050814.da1 -rw-r--r-- 1 rmr rmr 34866694 Oct 1 2005 mgh1_20050815.da1 -rw-r--r-- 1 rmr rmr 27976749 Oct 1 2005 mgh1_20050817.da1 -rw-r--r-- 1 rmr rmr 57888497 Oct 1 2005 mgh1_20050818.da1 -rw-r--r-- 1 rmr rmr 54858020 Oct 1 2005 mgh1_20050819.da1 -rw-r--r-- 1 rmr rmr 57888363 Oct 1 2005 mgh1_20050820.da1 -rw-r--r-- 1 rmr rmr 57888296 Oct 1 2005 mgh1_20050821.da1 -rw-r--r-- 1 rmr rmr 57885214 Oct 1 2005 mgh1_20050822.da1 -rw-r--r-- 1 rmr rmr 57887693 Oct 1 2005 mgh1_20050823.da1 -rw-r--r-- 1 rmr rmr 57887961 Oct 1 2005 mgh1_20050824.da1 -rw-r--r-- 1 rmr rmr 57887760 Oct 1 2005 mgh1_20050825.da1 -rw-r--r-- 1 rmr rmr 57875968 Oct 1 2005 mgh1_20050826.da1 -rw-r--r-- 1 rmr rmr 57887291 Oct 1 2005 mgh1_20050827.da1 -rw-r--r-- 1 rmr rmr 55002807 Oct 1 2005 mgh1_20050828.da1 -rw-r--r-- 1 rmr rmr 57728568 Oct 1 2005 mgh1_20050829.da1 -rw-r--r-- 1 rmr rmr 57856270 Oct 1 2005 mgh1_20050830.da1 -rw-r--r-- 1 rmr rmr 54214083 Oct 1 2005 mgh1_20050831.da1 -rw-r--r-- 1 rmr rmr 27939497 Oct 1 2005 mgh1_20050901.da1 FOLDER: /Volumes/hd1/mid_level0/mgh2_McGrawHill_setback: total 6102512 -rwxrwxrwx 1 rmr rmr 31251840 Aug 6 2005 UDP07$20050805.dat -rwxrwxrwx 1 rmr rmr 58710464 Aug 7 2005 UDP07$20050806.dat -rwxrwxrwx 1 rmr rmr 58752000 Aug 8 2005 UDP07$20050807.dat -rwxrwxrwx 1 rmr rmr 58751904 Aug 9 2005 UDP07$20050808.dat -rwxrwxrwx 1 rmr rmr 58751968 Aug 10 2005 UDP07$20050809.dat -rwxrwxrwx 1 rmr rmr 58751952 Aug 11 2005 UDP07$20050810.dat -rwxrwxrwx 1 rmr rmr 58751968 Aug 12 2005 UDP07$20050811.dat -rwxrwxrwx 1 rmr rmr 58542304 Aug 13 2005 UDP07$20050812.dat -rwxrwxrwx 1 rmr rmr 58742024 Aug 14 2005 UDP07$20050813.dat -rwxrwxrwx 1 rmr rmr 58750984 Aug 15 2005 UDP07$20050814.dat -rwxrwxrwx 1 rmr rmr 58751840 Aug 16 2005 UDP07$20050815.dat -rwxrwxrwx 1 rmr rmr 58751960 Aug 17 2005 UDP07$20050816.dat -rwxrwxrwx 1 rmr rmr 58710719 Aug 18 2005 UDP07$20050817.dat -rwxrwxrwx 1 rmr rmr 58751944 Aug 19 2005 UDP07$20050818.dat -rwxrwxrwx 1 rmr rmr 58745720 Aug 20 2005 UDP07$20050819.dat -rwxrwxrwx 1 rmr rmr 58740912 Aug 21 2005 UDP07$20050820.dat -rwxrwxrwx 1 rmr rmr 58751064 Aug 22 2005 UDP07$20050821.dat -rwxrwxrwx 1 rmr rmr 58751928 Aug 23 2005 UDP07$20050822.dat -rwxrwxrwx 1 rmr rmr 58751912 Aug 24 2005 UDP07$20050823.dat

66 of 88
-rwxrwxrwx 1 rmr rmr 58751896 Aug 25 2005 UDP07$20050824.dat -rwxrwxrwx 1 rmr rmr 58751872 Aug 26 2005 UDP07$20050825.dat -rwxrwxrwx 1 rmr rmr 58745264 Aug 27 2005 UDP07$20050826.dat -rwxrwxrwx 1 rmr rmr 58741224 Aug 28 2005 UDP07$20050827.dat -rwxrwxrwx 1 rmr rmr 58751480 Aug 29 2005 UDP07$20050828.dat -rwxrwxrwx 1 rmr rmr 58751888 Aug 30 2005 UDP07$20050829.dat -rwxrwxrwx 1 rmr rmr 58751952 Aug 31 2005 UDP07$20050830.dat -rwxrwxrwx 1 rmr rmr 58751928 Sep 1 2005 UDP07$20050831.dat -rwxrwxrwx 1 rmr rmr 26234360 Sep 1 2005 UDP07$20050901.dat -rw-r--r-- 1 rmr rmr 30790682 Oct 1 2005 mgh2_20050805.da1 -rw-r--r-- 1 rmr rmr 57845885 Oct 1 2005 mgh2_20050806.da1 -rw-r--r-- 1 rmr rmr 57888564 Oct 1 2005 mgh2_20050807.da1 -rw-r--r-- 1 rmr rmr 57888229 Oct 1 2005 mgh2_20050808.da1 -rw-r--r-- 1 rmr rmr 57888430 Oct 1 2005 mgh2_20050809.da1 -rw-r--r-- 1 rmr rmr 57888296 Oct 1 2005 mgh2_20050810.da1 -rw-r--r-- 1 rmr rmr 57888430 Oct 1 2005 mgh2_20050811.da1 -rw-r--r-- 1 rmr rmr 57668536 Oct 1 2005 mgh2_20050812.da1 -rw-r--r-- 1 rmr rmr 57855064 Oct 1 2005 mgh2_20050813.da1 -rw-r--r-- 1 rmr rmr 46458699 Oct 1 2005 mgh2_20050814.da1 -rw-r--r-- 1 rmr rmr 54937616 Oct 1 2005 mgh2_20050815.da1 -rw-r--r-- 1 rmr rmr 57888430 Oct 1 2005 mgh2_20050816.da1 -rw-r--r-- 1 rmr rmr 57846823 Oct 1 2005 mgh2_20050817.da1 -rw-r--r-- 1 rmr rmr 57888363 Oct 1 2005 mgh2_20050818.da1 -rw-r--r-- 1 rmr rmr 52708325 Oct 1 2005 mgh2_20050819.da1 -rw-r--r-- 1 rmr rmr 57851513 Oct 1 2005 mgh2_20050820.da1 -rw-r--r-- 1 rmr rmr 57885415 Oct 1 2005 mgh2_20050821.da1 -rw-r--r-- 1 rmr rmr 57888296 Oct 1 2005 mgh2_20050822.da1 -rw-r--r-- 1 rmr rmr 57888229 Oct 1 2005 mgh2_20050823.da1 -rw-r--r-- 1 rmr rmr 57888296 Oct 1 2005 mgh2_20050824.da1 -rw-r--r-- 1 rmr rmr 57888095 Oct 1 2005 mgh2_20050825.da1 -rw-r--r-- 1 rmr rmr 57865918 Oct 1 2005 mgh2_20050826.da1 -rw-r--r-- 1 rmr rmr 57852384 Oct 1 2005 mgh2_20050827.da1 -rw-r--r-- 1 rmr rmr 57886822 Oct 1 2005 mgh2_20050828.da1 -rw-r--r-- 1 rmr rmr 57888162 Oct 1 2005 mgh2_20050829.da1 -rw-r--r-- 1 rmr rmr 57888363 Oct 1 2005 mgh2_20050830.da1 -rw-r--r-- 1 rmr rmr 55744095 Oct 1 2005 mgh2_20050831.da1 -rw-r--r-- 1 rmr rmr 25849030 Oct 1 2005 mgh2_20050901.da1 FOLDER: /Volumes/hd1/mid_level0/opp_OnePennPlaza_roof_met: total 5513232 -rw-r--r-- 1 rmr rmr 1853 Sep 29 2005 CleanSummary.dat -rwxrwxrwx 1 rmr rmr 815922 Aug 3 2005 UDP05$20050803.dat -rwxrwxrwx 1 rmr rmr 38683 Aug 10 2005 UDP05$20050810.dat -rwxrwxrwx 1 rmr rmr 22113237 Aug 12 2005 UDP05$20050811.dat -rwxrwxrwx 1 rmr rmr 44104486 Aug 12 2005 UDP05$20050812.dat -rwxrwxrwx 1 rmr rmr 36107472 Aug 18 2005 UDP05$20050817.dat

67 of 88
-rwxrwxrwx 1 rmr rmr 58751968 Aug 19 2005 UDP05$20050818.dat -rwxrwxrwx 1 rmr rmr 58751896 Aug 20 2005 UDP05$20050819.dat -rwxrwxrwx 1 rmr rmr 58751976 Aug 21 2005 UDP05$20050820.dat -rwxrwxrwx 1 rmr rmr 58751968 Aug 22 2005 UDP05$20050821.dat -rwxrwxrwx 1 rmr rmr 58752000 Aug 23 2005 UDP05$20050822.dat -rwxrwxrwx 1 rmr rmr 58751960 Aug 24 2005 UDP05$20050823.dat -rwxrwxrwx 1 rmr rmr 58751968 Aug 25 2005 UDP05$20050824.dat -rwxrwxrwx 1 rmr rmr 58751968 Aug 26 2005 UDP05$20050825.dat -rwxrwxrwx 1 rmr rmr 58751904 Aug 27 2005 UDP05$20050826.dat -rwxrwxrwx 1 rmr rmr 58752000 Aug 28 2005 UDP05$20050827.dat -rwxrwxrwx 1 rmr rmr 58751984 Aug 29 2005 UDP05$20050828.dat -rwxrwxrwx 1 rmr rmr 58751968 Aug 30 2005 UDP05$20050829.dat -rwxrwxrwx 1 rmr rmr 58752000 Aug 31 2005 UDP05$20050830.dat -rwxrwxrwx 1 rmr rmr 58751976 Sep 1 2005 UDP05$20050831.dat -rwxrwxrwx 1 rmr rmr 58751984 Sep 2 2005 UDP05$20050901.dat -rwxrwxrwx 1 rmr rmr 58751976 Sep 3 2005 UDP05$20050902.dat -rwxrwxrwx 1 rmr rmr 58751944 Sep 4 2005 UDP05$20050903.dat -rwxrwxrwx 1 rmr rmr 58751968 Sep 5 2005 UDP05$20050904.dat -rwxrwxrwx 1 rmr rmr 58751968 Sep 6 2005 UDP05$20050905.dat -rwxrwxrwx 1 rmr rmr 58751976 Sep 7 2005 UDP05$20050906.dat -rwxrwxrwx 1 rmr rmr 58751928 Sep 8 2005 UDP05$20050907.dat -rwxrwxrwx 1 rmr rmr 58751960 Sep 9 2005 UDP05$20050908.dat -rwxrwxrwx 1 rmr rmr 26152800 Sep 9 2005 UDP05$20050909.dat -rw-r--r-- 1 rmr rmr 804296 Oct 1 2005 opp_20050803.da1 -rw-r--r-- 1 rmr rmr 36878 Oct 1 2005 opp_20050810.da1 -rw-r--r-- 1 rmr rmr 21788159 Oct 1 2005 opp_20050811.da1 -rw-r--r-- 1 rmr rmr 43455877 Oct 1 2005 opp_20050812.da1 -rw-r--r-- 1 rmr rmr 35575889 Oct 1 2005 opp_20050817.da1 -rw-r--r-- 1 rmr rmr 57888497 Oct 1 2005 opp_20050818.da1 -rw-r--r-- 1 rmr rmr 57796774 Oct 1 2005 opp_20050819.da1 -rw-r--r-- 1 rmr rmr 57888497 Oct 1 2005 opp_20050820.da1 -rw-r--r-- 1 rmr rmr 57888430 Oct 1 2005 opp_20050821.da1 -rw-r--r-- 1 rmr rmr 57888564 Oct 1 2005 opp_20050822.da1 -rw-r--r-- 1 rmr rmr 57888363 Oct 1 2005 opp_20050823.da1 -rw-r--r-- 1 rmr rmr 57888497 Oct 1 2005 opp_20050824.da1 -rw-r--r-- 1 rmr rmr 57888430 Oct 1 2005 opp_20050825.da1 -rw-r--r-- 1 rmr rmr 57888296 Oct 1 2005 opp_20050826.da1 -rw-r--r-- 1 rmr rmr 57888564 Oct 1 2005 opp_20050827.da1 -rw-r--r-- 1 rmr rmr 57841798 Oct 1 2005 opp_20050828.da1 -rw-r--r-- 1 rmr rmr 57888497 Oct 1 2005 opp_20050829.da1 -rw-r--r-- 1 rmr rmr 57888564 Oct 1 2005 opp_20050830.da1 -rw-r--r-- 1 rmr rmr 57780627 Oct 1 2005 opp_20050831.da1 -rw-r--r-- 1 rmr rmr 57888497 Oct 1 2005 opp_20050901.da1 -rw-r--r-- 1 rmr rmr 57886822 Oct 1 2005 opp_20050902.da1 -rw-r--r-- 1 rmr rmr 57888430 Oct 1 2005 opp_20050903.da1 -rw-r--r-- 1 rmr rmr 57888497 Oct 1 2005 opp_20050904.da1

68 of 88
-rw-r--r-- 1 rmr rmr 57888497 Oct 1 2005 opp_20050905.da1 -rw-r--r-- 1 rmr rmr 57888497 Oct 1 2005 opp_20050906.da1 -rw-r--r-- 1 rmr rmr 57888363 Oct 1 2005 opp_20050907.da1 -rw-r--r-- 1 rmr rmr 57888430 Oct 1 2005 opp_20050908.da1 -rw-r--r-- 1 rmr rmr 25768764 Oct 1 2005 opp_20050909.da1 FOLDER: /Volumes/hd1/mid_level0/ppza_ParkPlaza_roof: total 8410448 -rwxrwxrwx 1 rmr rmr 32517392 Aug 5 2005 UDP02$20050804.dat -rwxrwxrwx 1 rmr rmr 22031719 Aug 16 2005 UDP02$20050805.dat -rwxrwxrwx 1 rmr rmr 23786328 Aug 17 2005 UDP02$20050816.dat -rwxrwxrwx 1 rmr rmr 58751992 Aug 18 2005 UDP02$20050817.dat -rwxrwxrwx 1 rmr rmr 58751992 Aug 19 2005 UDP02$20050818.dat -rwxrwxrwx 1 rmr rmr 58752000 Aug 20 2005 UDP02$20050819.dat -rwxrwxrwx 1 rmr rmr 58752000 Aug 21 2005 UDP02$20050820.dat -rwxrwxrwx 1 rmr rmr 58751992 Aug 22 2005 UDP02$20050821.dat -rwxrwxrwx 1 rmr rmr 58752000 Aug 23 2005 UDP02$20050822.dat -rwxrwxrwx 1 rmr rmr 58751940 Aug 24 2005 UDP02$20050823.dat -rwxrwxrwx 1 rmr rmr 58752000 Aug 25 2005 UDP02$20050824.dat -rwxrwxrwx 1 rmr rmr 58751992 Aug 26 2005 UDP02$20050825.dat -rwxrwxrwx 1 rmr rmr 58752000 Aug 27 2005 UDP02$20050826.dat -rwxrwxrwx 1 rmr rmr 58752000 Aug 28 2005 UDP02$20050827.dat -rwxrwxrwx 1 rmr rmr 58751960 Aug 29 2005 UDP02$20050828.dat -rwxrwxrwx 1 rmr rmr 58751960 Aug 30 2005 UDP02$20050829.dat -rwxrwxrwx 1 rmr rmr 58751920 Aug 31 2005 UDP02$20050830.dat -rwxrwxrwx 1 rmr rmr 58751984 Sep 1 2005 UDP02$20050831.dat -rwxrwxrwx 1 rmr rmr 58752000 Sep 2 2005 UDP02$20050901.dat -rwxrwxrwx 1 rmr rmr 58751992 Sep 3 2005 UDP02$20050902.dat -rwxrwxrwx 1 rmr rmr 58751992 Sep 4 2005 UDP02$20050903.dat -rwxrwxrwx 1 rmr rmr 58752000 Sep 5 2005 UDP02$20050904.dat -rwxrwxrwx 1 rmr rmr 58751960 Sep 6 2005 UDP02$20050905.dat -rwxrwxrwx 1 rmr rmr 58752000 Sep 7 2005 UDP02$20050906.dat -rwxrwxrwx 1 rmr rmr 58752000 Sep 8 2005 UDP02$20050907.dat -rwxrwxrwx 1 rmr rmr 58751976 Sep 9 2005 UDP02$20050908.dat -rwxrwxrwx 1 rmr rmr 22725560 Sep 9 2005 UDP02$20050909.dat -rw-r--r-- 1 rmr rmr 32039294 Oct 1 2005 ppz_20050804.da1 -rw-r--r-- 1 rmr rmr 21708028 Oct 1 2005 ppz_20050805.da1 -rw-r--r-- 1 rmr rmr 23436829 Oct 1 2005 ppz_20050816.da1 -rw-r--r-- 1 rmr rmr 57888497 Oct 1 2005 ppz_20050817.da1 -rw-r--r-- 1 rmr rmr 57888497 Oct 1 2005 ppz_20050818.da1 -rw-r--r-- 1 rmr rmr 55244811 Oct 1 2005 ppz_20050819.da1 -rw-r--r-- 1 rmr rmr 57888564 Oct 1 2005 ppz_20050820.da1 -rw-r--r-- 1 rmr rmr 57888497 Oct 1 2005 ppz_20050821.da1 -rw-r--r-- 1 rmr rmr 57888564 Oct 1 2005 ppz_20050822.da1 -rw-r--r-- 1 rmr rmr 57888363 Oct 1 2005 ppz_20050823.da1 -rw-r--r-- 1 rmr rmr 57888564 Oct 1 2005 ppz_20050824.da1

69 of 88
-rw-r--r-- 1 rmr rmr 57888497 Oct 1 2005 ppz_20050825.da1 -rw-r--r-- 1 rmr rmr 57888564 Oct 1 2005 ppz_20050826.da1 -rw-r--r-- 1 rmr rmr 57888564 Oct 1 2005 ppz_20050827.da1 -rw-r--r-- 1 rmr rmr 57810844 Oct 1 2005 ppz_20050828.da1 -rw-r--r-- 1 rmr rmr 57888430 Oct 1 2005 ppz_20050829.da1 -rw-r--r-- 1 rmr rmr 57887626 Oct 1 2005 ppz_20050830.da1 -rw-r--r-- 1 rmr rmr 53208949 Oct 1 2005 ppz_20050831.da1 -rw-r--r-- 1 rmr rmr 57888564 Oct 1 2005 ppz_20050901.da1 -rw-r--r-- 1 rmr rmr 57888497 Oct 1 2005 ppz_20050902.da1 -rw-r--r-- 1 rmr rmr 57888497 Oct 1 2005 ppz_20050903.da1 -rw-r--r-- 1 rmr rmr 57888564 Oct 1 2005 ppz_20050904.da1 -rw-r--r-- 1 rmr rmr 57888430 Oct 1 2005 ppz_20050905.da1 -rw-r--r-- 1 rmr rmr 57888564 Oct 1 2005 ppz_20050906.da1 -rw-r--r-- 1 rmr rmr 57888564 Oct 1 2005 ppz_20050907.da1 -rw-r--r-- 1 rmr rmr 57888497 Oct 1 2005 ppz_20050908.da1 -rw-r--r-- 1 rmr rmr 22391830 Oct 1 2005 ppz_20050909.da1 -rwxrwxrwx 1 rmr rmr 32038979 Sep 13 2005 ppza_20050804.da1 -rwxrwxrwx 1 rmr rmr 21707659 Sep 13 2005 ppza_20050805.da1 -rwxrwxrwx 1 rmr rmr 23436460 Sep 13 2005 ppza_20050816.da1 -rwxrwxrwx 1 rmr rmr 57888128 Sep 13 2005 ppza_20050817.da1 -rwxrwxrwx 1 rmr rmr 57888128 Sep 13 2005 ppza_20050818.da1 -rwxrwxrwx 1 rmr rmr 57598360 Sep 13 2005 ppza_20050819.da1 -rwxrwxrwx 1 rmr rmr 57888195 Sep 13 2005 ppza_20050820.da1 -rwxrwxrwx 1 rmr rmr 57888128 Sep 13 2005 ppza_20050821.da1 -rwxrwxrwx 1 rmr rmr 57888195 Sep 13 2005 ppza_20050822.da1 -rwxrwxrwx 1 rmr rmr 57887994 Sep 13 2005 ppza_20050823.da1 -rwxrwxrwx 1 rmr rmr 57888195 Sep 13 2005 ppza_20050824.da1 -rwxrwxrwx 1 rmr rmr 57888128 Sep 13 2005 ppza_20050825.da1 -rwxrwxrwx 1 rmr rmr 57888195 Sep 13 2005 ppza_20050826.da1 -rwxrwxrwx 1 rmr rmr 57888195 Sep 13 2005 ppza_20050827.da1 -rwxrwxrwx 1 rmr rmr 57884408 Sep 13 2005 ppza_20050828.da1 -rwxrwxrwx 1 rmr rmr 57888061 Sep 13 2005 ppza_20050829.da1 -rwxrwxrwx 1 rmr rmr 57887797 Sep 13 2005 ppza_20050830.da1 -rwxrwxrwx 1 rmr rmr 57082076 Sep 13 2005 ppza_20050831.da1 -rwxrwxrwx 1 rmr rmr 57888195 Sep 13 2005 ppza_20050901.da1 -rwxrwxrwx 1 rmr rmr 57888128 Sep 13 2005 ppza_20050902.da1 -rwxrwxrwx 1 rmr rmr 57888128 Sep 13 2005 ppza_20050903.da1 -rwxrwxrwx 1 rmr rmr 57888195 Sep 13 2005 ppza_20050904.da1 -rwxrwxrwx 1 rmr rmr 57888061 Sep 13 2005 ppza_20050905.da1 -rwxrwxrwx 1 rmr rmr 57888195 Sep 13 2005 ppza_20050906.da1 -rwxrwxrwx 1 rmr rmr 57888195 Sep 13 2005 ppza_20050907.da1 -rwxrwxrwx 1 rmr rmr 57888128 Sep 13 2005 ppza_20050908.da1 -rwxrwxrwx 1 rmr rmr 22391461 Sep 13 2005 ppza_20050909.da1 FOLDER: /Volumes/hd1/mid_level0/s1: total 367728

70 of 88
-rwxrwxrwx 1 rmr rmr 856 Sep 21 2005 CleanSummary.dat -rwxrwxrwx 1 rmr rmr 13259664 Aug 8 2005 UDP06$20050808.dat -rwxrwxrwx 1 rmr rmr 16891072 Aug 12 2005 UDP06$20050812.dat -rwxrwxrwx 1 rmr rmr 13667672 Aug 14 2005 UDP06$20050814.dat -rwxrwxrwx 1 rmr rmr 16564199 Aug 18 2005 UDP06$20050818.dat -rwxrwxrwx 1 rmr rmr 16727656 Aug 20 2005 UDP06$20050820.dat -rwxrwxrwx 1 rmr rmr 17012970 Aug 24 2005 UDP06$20050824.dat -rwxrwxrwx 1 rmr rmr 13258912 Sep 21 2005 s1_20050808.da1 -rwxrwxrwx 1 rmr rmr 16890716 Sep 21 2005 s1_20050812.da1 -rwxrwxrwx 1 rmr rmr 13666776 Sep 21 2005 s1_20050814.da1 -rwxrwxrwx 1 rmr rmr 16562760 Sep 21 2005 s1_20050818.da1 -rwxrwxrwx 1 rmr rmr 16726912 Sep 21 2005 s1_20050820.da1 -rwxrwxrwx 1 rmr rmr 17012104 Sep 21 2005 s1_20050824.da1 FOLDER: /Volumes/hd1/mid_level0/s10: total 349088 -rw-r--r-- 1 rmr rmr 401 Sep 28 2005 CleanSummary.dat -rwxrwxrwx 1 rmr rmr 13341514 Aug 9 2005 UDP17$20050808.dat -rwxrwxrwx 1 rmr rmr 10852730 Aug 12 2005 UDP17$20050812.dat -rwxrwxrwx 1 rmr rmr 15463153 Aug 14 2005 UDP17$20050814.dat -rwxrwxrwx 1 rmr rmr 16646341 Aug 18 2005 UDP17$20050818.dat -rwxrwxrwx 1 rmr rmr 15871194 Aug 20 2005 UDP17$20050820.dat -rwxrwxrwx 1 rmr rmr 17829413 Aug 24 2005 UDP17$20050824.dat -rw-r--r-- 1 rmr rmr 13144998 Sep 28 2005 s10_20050808.da1 -rw-r--r-- 1 rmr rmr 10689649 Sep 28 2005 s10_20050812.da1 -rw-r--r-- 1 rmr rmr 15233184 Sep 28 2005 s10_20050814.da1 -rw-r--r-- 1 rmr rmr 16400796 Sep 28 2005 s10_20050818.da1 -rw-r--r-- 1 rmr rmr 15636795 Sep 28 2005 s10_20050820.da1 -rw-r--r-- 1 rmr rmr 17566261 Sep 28 2005 s10_20050824.da1 FOLDER: /Volumes/hd1/mid_level0/s11: total 189744 -rw-r--r-- 1 rmr rmr 200 Sep 28 2005 CleanSummary.dat -rwxrwxrwx 1 rmr rmr 15503898 Aug 18 2005 UDP11$20050818.dat -rwxrwxrwx 1 rmr rmr 16482717 Aug 20 2005 UDP11$20050820.dat -rwxrwxrwx 1 rmr rmr 16931692 Aug 24 2005 UDP11$20050824.dat -rw-r--r-- 1 rmr rmr 15275330 Sep 28 2005 s11_20050818.da1 -rw-r--r-- 1 rmr rmr 16236911 Sep 28 2005 s11_20050820.da1 -rw-r--r-- 1 rmr rmr 16682464 Sep 28 2005 s11_20050824.da1 FOLDER: /Volumes/hd1/mid_level0/s12: total 191968 -rw-r--r-- 1 rmr rmr 199 Sep 28 2005 CleanSummary.dat -rwxrwxrwx 1 rmr rmr 16075148 Aug 18 2005 UDP15$20050818.dat -rwxrwxrwx 1 rmr rmr 15503767 Aug 20 2005 UDP15$20050820.dat -rwxrwxrwx 1 rmr rmr 17910924 Aug 24 2005 UDP15$20050824.dat

71 of 88
-rw-r--r-- 1 rmr rmr 15838532 Sep 28 2005 s12_20050818.da1 -rw-r--r-- 1 rmr rmr 15275594 Sep 28 2005 s12_20050820.da1 -rw-r--r-- 1 rmr rmr 17646728 Sep 28 2005 s12_20050824.da1 FOLDER: /Volumes/hd1/mid_level0/s2: total 181360 -rwxrwxrwx 1 rmr rmr 198 Sep 21 2005 CleanSummary.dat -rwxrwxrwx 1 rmr rmr 12989596 Aug 12 2005 UDP13$20050812.dat -rwxrwxrwx 1 rmr rmr 16727851 Aug 8 2005 UDP15$20050808.dat -rwxrwxrwx 1 rmr rmr 16727825 Aug 14 2005 UDP15$20050814.dat -rwxrwxrwx 1 rmr rmr 16727319 Sep 21 2005 s2_20050808.da1 -rwxrwxrwx 1 rmr rmr 12937602 Sep 21 2005 s2_20050812.da1 -rwxrwxrwx 1 rmr rmr 16727590 Sep 21 2005 s2_20050814.da1 FOLDER: /Volumes/hd1/mid_level0/s3: total 368608 -rwxrwxrwx 1 rmr rmr 397 Sep 21 2005 CleanSummary.dat -rwxrwxrwx 1 rmr rmr 32643 Aug 8 2005 UDP03$20050808.av1 -rwxrwxrwx 1 rmr rmr 14238080 Aug 8 2005 UDP03$20050808.dat -rwxrwxrwx 1 rmr rmr 15339464 Aug 12 2005 UDP03$20050812.dat -rwxrwxrwx 1 rmr rmr 16115272 Aug 14 2005 UDP03$20050814.dat -rwxrwxrwx 1 rmr rmr 16643872 Aug 18 2005 UDP03$20050818.dat -rwxrwxrwx 1 rmr rmr 15624554 Aug 20 2005 UDP03$20050820.dat -rwxrwxrwx 1 rmr rmr 16359768 Aug 24 2005 UDP03$20050824.dat -rwxrwxrwx 1 rmr rmr 14236208 Sep 21 2005 s3_20050808.da1 -rwxrwxrwx 1 rmr rmr 15337128 Sep 21 2005 s3_20050812.da1 -rwxrwxrwx 1 rmr rmr 16113892 Sep 21 2005 s3_20050814.da1 -rwxrwxrwx 1 rmr rmr 16639328 Sep 21 2005 s3_20050818.da1 -rwxrwxrwx 1 rmr rmr 15621300 Sep 21 2005 s3_20050820.da1 -rwxrwxrwx 1 rmr rmr 16358284 Sep 21 2005 s3_20050824.da1 FOLDER: /Volumes/hd1/mid_level0/s4: total 363536 -rwxrwxrwx 1 rmr rmr 395 Sep 21 2005 CleanSummary.dat -rwxrwxrwx 1 rmr rmr 36549 Aug 8 2005 UDP08$20050808.av1 -rwxrwxrwx 1 rmr rmr 15789148 Aug 9 2005 UDP08$20050808.dat -rwxrwxrwx 1 rmr rmr 16482816 Aug 12 2005 UDP08$20050812.dat -rwxrwxrwx 1 rmr rmr 13015099 Aug 14 2005 UDP08$20050814.dat -rwxrwxrwx 1 rmr rmr 13545331 Aug 18 2005 UDP08$20050818.dat -rwxrwxrwx 1 rmr rmr 16727736 Aug 20 2005 UDP08$20050820.dat -rwxrwxrwx 1 rmr rmr 17461950 Aug 24 2005 UDP08$20050824.dat -rwxrwxrwx 1 rmr rmr 15788240 Sep 21 2005 s4_20050808.da1 -rwxrwxrwx 1 rmr rmr 16481908 Sep 21 2005 s4_20050812.da1 -rwxrwxrwx 1 rmr rmr 13014724 Sep 21 2005 s4_20050814.da1 -rwxrwxrwx 1 rmr rmr 13544648 Sep 21 2005 s4_20050818.da1 -rwxrwxrwx 1 rmr rmr 16727116 Sep 21 2005 s4_20050820.da1

72 of 88
-rwxrwxrwx 1 rmr rmr 17460700 Sep 21 2005 s4_20050824.da1 FOLDER: /Volumes/hd1/mid_level0/s5: total 367104 -rwxrwxrwx 1 rmr rmr 394 Sep 21 2005 CleanSummary.dat -rwxrwxrwx 1 rmr rmr 36921 Aug 8 2005 UDP04$20050808.av1 -rwxrwxrwx 1 rmr rmr 16197364 Aug 9 2005 UDP04$20050808.dat -rwxrwxrwx 1 rmr rmr 16279011 Aug 12 2005 UDP04$20050812.dat -rwxrwxrwx 1 rmr rmr 13382248 Aug 14 2005 UDP04$20050814.dat -rwxrwxrwx 1 rmr rmr 16115554 Aug 18 2005 UDP04$20050818.dat -rwxrwxrwx 1 rmr rmr 15707802 Aug 20 2005 UDP04$20050820.dat -rwxrwxrwx 1 rmr rmr 16238161 Aug 24 2005 UDP04$20050824.dat -rwxrwxrwx 1 rmr rmr 16197056 Sep 21 2005 s5_20050808.da1 -rwxrwxrwx 1 rmr rmr 16278452 Sep 21 2005 s5_20050812.da1 -rwxrwxrwx 1 rmr rmr 13381856 Sep 21 2005 s5_20050814.da1 -rwxrwxrwx 1 rmr rmr 16114368 Sep 21 2005 s5_20050818.da1 -rwxrwxrwx 1 rmr rmr 15707320 Sep 21 2005 s5_20050820.da1 -rwxrwxrwx 1 rmr rmr 16237584 Sep 21 2005 s5_20050824.da1 FOLDER: /Volumes/hd1/mid_level0/s6: total 152496 -rwxrwxrwx 1 rmr rmr 198 Sep 21 2005 CleanSummary.dat -rwxrwxrwx 1 rmr rmr 17095168 Aug 12 2005 UDP11$20050812.dat -rwxrwxrwx 1 rmr rmr 13830979 Aug 14 2005 UDP11$20050814.dat -rwxrwxrwx 1 rmr rmr 651 Aug 6 2005 UDP20$20050806.av1 -rwxrwxrwx 1 rmr rmr 34596 Aug 8 2005 UDP20$20050808.av1 -rwxrwxrwx 1 rmr rmr 8076751 Aug 8 2005 UDP20$20050808.dat -rwxrwxrwx 1 rmr rmr 8074924 Sep 21 2005 s6_20050808.da1 -rwxrwxrwx 1 rmr rmr 17094520 Sep 21 2005 s6_20050812.da1 -rwxrwxrwx 1 rmr rmr 13829424 Sep 21 2005 s6_20050814.da1 FOLDER: /Volumes/hd1/mid_level0/s7: total 364608 -rwxrwxrwx 1 rmr rmr 651 Aug 4 2005 UDP12$20050804.av1 -rwxrwxrwx 1 rmr rmr 15789384 Aug 8 2005 UDP12$20050808.dat -rwxrwxrwx 1 rmr rmr 14687608 Aug 12 2005 UDP12$20050812.dat -rwxrwxrwx 1 rmr rmr 16645967 Aug 14 2005 UDP12$20050814.dat -rwxrwxrwx 1 rmr rmr 15952580 Aug 18 2005 UDP12$20050818.dat -rwxrwxrwx 1 rmr rmr 13627072 Aug 20 2005 UDP12$20050820.dat -rwxrwxrwx 1 rmr rmr 17299032 Aug 24 2005 UDP12$20050824.dat -rwxrwxrwx 1 rmr rmr 15557227 Oct 6 2005 s7_20050808.da1 -rwxrwxrwx 1 rmr rmr 14471223 Oct 6 2005 s7_20050812.da1 -rwxrwxrwx 1 rmr rmr 16400684 Oct 6 2005 s7_20050814.da1 -rwxrwxrwx 1 rmr rmr 15718094 Oct 6 2005 s7_20050818.da1 -rwxrwxrwx 1 rmr rmr 13426962 Oct 6 2005 s7_20050820.da1 -rwxrwxrwx 1 rmr rmr 17044761 Oct 6 2005 s7_20050824.da1

73 of 88
FOLDER: /Volumes/hd1/mid_level0/s8: total 363520 -rwxrwxrwx 1 rmr rmr 122361 Aug 12 2005 (lab)UDP16$20050812.dat -rw-r--r-- 1 rmr rmr 453 Sep 28 2005 CleanSummary.dat -rwxrwxrwx 1 rmr rmr 837 Aug 4 2005 UDP16$20050804.av1 -rwxrwxrwx 1 rmr rmr 36270 Aug 8 2005 UDP16$20050808.av1 -rwxrwxrwx 1 rmr rmr 15136656 Aug 8 2005 UDP16$20050808.dat -rwxrwxrwx 1 rmr rmr 13911718 Aug 14 2005 UDP16$20050814.dat -rwxrwxrwx 1 rmr rmr 16687124 Aug 18 2005 UDP16$20050818.dat -rwxrwxrwx 1 rmr rmr 16034242 Aug 20 2005 UDP16$20050820.dat -rwxrwxrwx 1 rmr rmr 17299080 Aug 24 2005 UDP16$20050824.dat -rwxrwxrwx 1 rmr rmr 14565332 Aug 12 2005 UDP21$20050812.dat -rw-r--r-- 1 rmr rmr 14913798 Sep 28 2005 s8_20050808.da1 -rw-r--r-- 1 rmr rmr 14350245 Sep 28 2005 s8_20050812.da1 -rw-r--r-- 1 rmr rmr 13705706 Sep 28 2005 s8_20050814.da1 -rw-r--r-- 1 rmr rmr 16441599 Sep 28 2005 s8_20050818.da1 -rw-r--r-- 1 rmr rmr 15798196 Sep 28 2005 s8_20050820.da1 -rw-r--r-- 1 rmr rmr 17044398 Sep 28 2005 s8_20050824.da1 FOLDER: /Volumes/hd1/mid_level0/s9: total 324720 -rw-r--r-- 1 rmr rmr 393 Sep 28 2005 CleanSummary.dat -rwxrwxrwx 1 rmr rmr 5180728 Aug 8 2005 UDP13$20050808.dat -rwxrwxrwx 1 rmr rmr 13830916 Aug 14 2005 UDP13$20050814.dat -rwxrwxrwx 1 rmr rmr 15299488 Aug 18 2005 UDP13$20050818.dat -rwxrwxrwx 1 rmr rmr 15870864 Aug 20 2005 UDP13$20050820.dat -rwxrwxrwx 1 rmr rmr 16319753 Aug 24 2005 UDP13$20050824.dat -rwxrwxrwx 1 rmr rmr 17217466 Aug 12 2005 UDP15$20050812.dat -rw-r--r-- 1 rmr rmr 5102452 Sep 28 2005 s9_20050808.da1 -rw-r--r-- 1 rmr rmr 16964065 Sep 28 2005 s9_20050812.da1 -rw-r--r-- 1 rmr rmr 13626795 Sep 28 2005 s9_20050814.da1 -rw-r--r-- 1 rmr rmr 15073392 Sep 28 2005 s9_20050818.da1 -rw-r--r-- 1 rmr rmr 15636594 Sep 28 2005 s9_20050820.da1 -rw-r--r-- 1 rmr rmr 16078928 Sep 28 2005 s9_20050824.da1 FOLDER: /Volumes/hd1/mid_level0/sit_Stevens_HoweCenter: total 416 -rwxrwxrwx 1 rmr rmr 206580 Sep 12 2005 sit_HoweCenter.txt

74 of 88
Appendix B: Listing of All Folders and Files for Level 1 Data
DESCRIPTION OF THE LEVEL 1 DATA FOLDERS AND FILES
The level 1 data are located in the level1 folder on a path ~/data/mid/level1. A listing of the
level 1 folder is given below.
drwxr-xr-x 7 rmr rmr 238 Apr 18 13:25 field drwxrwxrwx 15 rmr rmr 510 Apr 6 21:41 iop1 drwxrwxrwx 15 rmr rmr 510 Apr 6 20:42 iop2 drwxrwxrwx 15 rmr rmr 510 Apr 6 22:42 iop3 drwxrwxrwx 15 rmr rmr 510 Apr 6 22:46 iop4 drwxrwxrwx 15 rmr rmr 510 Apr 6 22:47 iop5 drwxrwxrwx 15 rmr rmr 510 Apr 6 22:48 iop6 drwxrwxrwx 22 rmr rmr 748 Apr 6 23:42 meso
where the folders hold data from the field calibrations, the six IOPs and the mesonet array that
was in operation most of the month of August.
Field Data files
The field data are divided into four directories gp1, gp2, gp3, and gp4. Each directory contains a
data set from is a different time when a different set of sonic anemometers were compared.
/Users/rmr/data/mid/level1/field: total 0 drwxrwxr-x 23 rmr rmr 782 Apr 18 13:25 gp1 drwxrwxr-x 9 rmr rmr 306 Apr 18 16:31 gp2 drwxrwxr-x 17 rmr rmr 578 Apr 18 16:31 gp3 drwxrwxr-x 15 rmr rmr 510 Apr 18 16:31 gp4
Each of the folders contain avg files for the instruments in that group. As an example, the contents of gp1 is
-rw-r--r-- 1 rmr rmr 7862 Apr 18 13:18:35 2006 mid_field_z366_rmy3d_av300.mat -rw-r--r-- 1 rmr rmr 7895 Apr 18 13:18:35 2006 mid_field_z367_rmy3d_av300.mat -rw-r--r-- 1 rmr rmr 7823 Apr 18 13:18:35 2006 mid_field_z597_rmy3d_av300.mat -rw-r--r-- 1 rmr rmr 7888 Apr 18 13:18:35 2006 mid_field_z607_rmy3d_av300.mat -rw-r--r-- 1 rmr rmr 7838 Apr 18 13:18:34 2006 mid_field_z320_rmy3d_av300.mat -rw-r--r-- 1 rmr rmr 7843 Apr 18 13:18:34 2006 mid_field_z358_rmy3d_av300.mat -rw-r--r-- 1 rmr rmr 7892 Apr 18 13:18:34 2006 mid_field_z362_rmy3d_av300.mat -rw-r--r-- 1 rmr rmr 7856 Apr 18 13:18:34 2006 mid_field_z363_rmy3d_av300.mat

75 of 88
-rw-r--r-- 1 rmr rmr 7636 Apr 18 13:18:34 2006 mid_field_z364_rmy3d_av300.mat -rw-r--r-- 1 rmr rmr 7793 Apr 18 13:18:34 2006 mid_field_z365_rmy3d_av300.mat -rw-r--r-- 1 rmr rmr 37202 Apr 17 15:04:40 2006 mid_field_z607_rmy3d_av300.dat -rw-r--r-- 1 rmr rmr 36864 Apr 17 15:04:39 2006 mid_field_z320_rmy3d_av300.dat -rw-r--r-- 1 rmr rmr 37202 Apr 17 15:04:39 2006 mid_field_z358_rmy3d_av300.dat -rw-r--r-- 1 rmr rmr 37202 Apr 17 15:04:39 2006 mid_field_z362_rmy3d_av300.dat -rw-r--r-- 1 rmr rmr 37202 Apr 17 15:04:39 2006 mid_field_z363_rmy3d_av300.dat -rw-r--r-- 1 rmr rmr 37202 Apr 17 15:04:39 2006 mid_field_z364_rmy3d_av300.dat -rw-r--r-- 1 rmr rmr 36864 Apr 17 15:04:39 2006 mid_field_z365_rmy3d_av300.dat -rw-r--r-- 1 rmr rmr 37202 Apr 17 15:04:39 2006 mid_field_z366_rmy3d_av300.dat -rw-r--r-- 1 rmr rmr 37202 Apr 17 15:04:39 2006 mid_field_z367_rmy3d_av300.dat -rw-r--r-- 1 rmr rmr 37202 Apr 17 15:04:39 2006 mid_field_z597_rmy3d_av300.dat
where the file names show the experiment (mid), the data segment (field), the sonic serial number (z366), the instrument type (rmy3d), and the averaging time in seconds (av300). The format of these files is explained below in Appendix B.1 that describes level 1 data formats. Twenty instruments were compared during gp1 time period.
IOP Data Files Each of the six IOP data folders is organized in the same way. The iop1 folder contains one ASCII file named INFO_mid_iop1.txt is an information file that provides details about that particular IOP. Any information that is general to the IOP and applies to all measurement systems is recorded in this file. It also contains folders for each street level anemometer used during the IOP. The directory is shown below:
-rwxrwxrwx 1 rmr rmr 1064 Sep 21 2005 INFO_mid_iop1.txt drwxrwxrwx 5 rmr rmr 170 Apr 6 21:39 s1 drwxrwxrwx 5 rmr rmr 170 Apr 6 21:39 s2 drwxrwxrwx 5 rmr rmr 170 Apr 6 21:39 s3 drwxrwxrwx 5 rmr rmr 170 Apr 6 21:39 s4 drwxrwxrwx 5 rmr rmr 170 Apr 6 21:39 s5 drwxrwxrwx 5 rmr rmr 170 Apr 6 21:39 s6 drwxrwxrwx 5 rmr rmr 170 Apr 6 21:39 s7 drwxrwxrwx 5 rmr rmr 170 Apr 6 21:39 s8 drwxrwxrwx 5 rmr rmr 170 Apr 6 21:39 s9 drwxrwxrwx 5 rmr rmr 170 Apr 6 21:41 s10
The folders s1, s2, …, s10 hold all level 1 data for the particular station. One example of this folder, s1, is given below: -rwxrwxrwx 1 rmr rmr 610 Apr 6 22:38 INFO_mid_iop1_s1.txt -rwxrwxrwx 1 rmr rmr 9224 Apr 9 07:17 mid_iop1_s1_rmy3d_av300.dat
where the file INFO_mid_iop1_s1.txt is an information ASCII file that provides specific information about the station, s1, during IOP 1. Instrument failures, alignment issues, wind blockage from truck, etc are entered to this file. The averaged wind data are listed in the ASCII data file with a name of mid_iop1_s1_rmy3d_av300.dat which includes the experiment (mid), IOP (iop1), station (s1), instrument (rmy3d), and averaging time in seconds (av300).
Meso Data Files

76 of 88
The level 1 folder called “meso” holds the mesoscale wind network data for the experiment. The instruments and data collected here cover the entire month of August as continuous time series. The meso folder is as follows: -rwxrwxrwx 1 rmr rmr 591 Oct 1 2005 INFO_mid_meso.txt drwxr-xr-x 4 rmr rmr 136 Apr 6 23:05 ccny_roof_met drwxrwxrwx 6 rmr rmr 204 Apr 6 23:25 cpk_CentralPark_asos drwxr-xr-x 5 rmr rmr 170 Apr 6 23:07 eml_EnvironMeasLab_DCnet drwxr-xr-x 6 rmr rmr 204 Apr 6 23:25 ewr_Newark_asos drwxrwxrwx 7 rmr rmr 238 Apr 14 06:25 gm1_GeneralMotors_met drwxrwxrwx 42 rmr rmr 1428 Apr 14 06:26 gm2_GMBldg_sodar drwxr-xr-x 6 rmr rmr 204 Apr 6 23:26 jfk_Kennedy_asos drwxrwxrwx 4 rmr rmr 136 Apr 6 23:28 lbr1_LhrBros_roof_noaa drwxrwxrwx 5 rmr rmr 170 Oct 6 2005 lbr2_LehmanBros_setback drwxrwxrwx 6 rmr rmr 204 Apr 6 23:29 lga_LaguardiaAP_asos drwxrwxrwx 7 rmr rmr 238 Apr 14 06:26 met1_MetLife_met drwxrwxrwx 42 rmr rmr 1428 Apr 14 06:27 met2_MetLife_sodar drwxrwxrwx 5 rmr rmr 170 Oct 4 2005 mgh1_McGraw-Hill_roof drwxrwxrwx 5 rmr rmr 170 Oct 5 2005 mgh2_McGraw-Hill_setback drwxrwxrwx 5 rmr rmr 170 Oct 6 2005 opp drwxrwxrwx 5 rmr rmr 170 Oct 6 2005 ppz_ParkPlaza_roof drwxr-xr-x 7 rmr rmr 238 Apr 6 23:53 sit1_met
where the ASCII information file, INFO_mid_meso.txt provides general information about mesonet data. Data specific to a particular station are not in this file.
The different mesonet stations are discussed in the Appendix that describes Level 0 file organization. The following types of stations are included here:
gm1,lbr2,met1,mgh1,mgh2,opp,ppz: UDP rooftop or setback wind stations. These are all RMY 3D sonic anemometers.
gm2,met2: mini Sodar installations.
cpk,ewr,jfk,lga: NOAA NWS ASOS stations.
ccny: The rooftop station from CCNY. This is an important site at the north end of Manhattan.
eml: The NOAA DCnet station on the roof of the DHS’s EML building in west Greenwich Village.
lbr1: The NOAA Dcnet station on the roof of Building ‘A’
sit1: The meteorological system deployed by the Stevens Institute of Technology in Hoboken New Jersey.
ASOS Data Files
The Automated Observing Systems (ASOS) weather stations are deployed by NOAA around the
country. The ASOS data are collected over the internet (see

77 of 88
http://www.ncdc.noaa.gov/oa/climate/stationlocator.html) in a standard format. The raw files
from the internet have a format shown below:
Month:, 06/2005 Station Name:, "JOHN F KENNEDY INTERNATIONAL AIRPORT" Call Sign:, JFK Day,Time,StationType,Maint Indic,SkyConditions,Visibility,Weather Type,Dry Bulb Faren,Dry Bulb Cel,Wet Bulb Faren,Wet Bulb Cel,Dew Point Faren,Dew Point Cel,Rel Humd,Wind Speed,Wind Dir,Wind Char Gusts,Val. for Wind Char,Station Pressure,Press Tend,Sea Level Pressure,Report Type,Precip Total 01,0051,AO2 ,-,FEW008 ,10SM ,-,56 , 13.3,54 , 12.4,53 , 11.7, 90 , 5 ,090,-,0 ,30.14,0,216,AA,- 01,0151,AO2 ,-,SCT008 ,8SM ,-,56 , 13.3,54 , 12.1,52 , 11.1, 87 , 6 ,090,-,0 ,30.15,-,218,AA,- 01,0251,AO2 ,-,BKN008 ,7SM ,-,56 , 13.3,54 , 12.4,53 , 11.7, 90 , 5 ,090,-,0 ,30.14,-,217,AA,- 01,0351,AO2 ,-,OVC008 ,10SM ,-,56 , 13.3,54 , 12.1,52 , 11.1, 87 , 8 ,090,-,0 ,30.16,3,221,AA,-
where the lines are wrapped for convenience. We have ASOS data from 2000 to present day. A
PERL program named ReadNwsAsos.pl reads the raw files and the level 1 files. Level 1 files
with names such as jfk2005.dat where the station identifier (jfk) and the year (2005) define the
data set. An example of the first lines of this file is given below.
PROGRAM: ReadNwsAsos.pl Version: v1.01, Editdate: 2005/09/12 Station: jfk Year: 2005 Time correction: 0 DATE (JD) TIME Npts wspd(m/s) wdir(degT) tair(C) tdew(C) rh(%) slp(hPa) ppt(mm) 2005-02-28 (059) 23:51:00, 5.7, 10, -0.6, -1.7, 92, 996.8, 0.8 2005-03-01 (060) 00:51:00, 5.1, 360, -0.6, -2.2, 89, 996.5, 0.0 2005-03-01 (060) 01:51:00, 5.7, 10, -0.6, -2.8, 85, 995.8, 1.0 2005-03-01 (060) 02:51:00, 3.6, 350, -1.1, -2.2, 92, 995.8, 0.3
Note that the ASOS data are reported once each hour at 51 minutes after the hour. Each record
gives averages for a five-minute sampling period. The data here are taken directly from the raw
files, possibly with a change of units.
CCNY Data File Formats
The CCNY data are available from the BNL mesonet data base.
Timestamp, tempC, relHumidity, windSpeedMs, windDir, baroMb 2005-08-26 12:36:00, 26.9, 34,2.850, 234, 999.9 2005-08-26 12:37:00, 26.7, 35,0.900, 275, 999.9 2005-08-26 12:38:00, 26.8, 35,1.840, 202, 999.9 2005-08-26 12:39:00, 26.9, 36,2.920, 192, 999.9 2005-08-26 12:40:00, 27.0, 34,3.500, 213, 999.9 2005-08-26 12:41:00, 26.9, 33,2.720, 218, 999.9

78 of 88
2005-08-26 12:42:00, 26.7, 33,2.060, 224, 999.9
The CCNY data are reported each minute. Units are in metric, relative to true north. The
internet files are averaged and converted to level 1 files with a PERL program, wx1_web_avg.pl
which is used on all files that are derived from the BNL data base.
The output of the program is a level 1 averaged file with a name such as
mid_meso_lbr1_web_av300.dat where the name includes the experiment name (mid), the data
segment (meso), the station ID (lbr1), and the averaging time, in seconds (300). An example of
the first lines of data follows:

79 of 88
Program: wx1_web_avg.pl.pl Version: 2.2 (mid lbr1) EditDate: 060613 RUN PROGRAM at 2006-06-13 (164) 16:28:59 EXPNAME: mid SEGMENT: meso STATION: lbr1 SENSOR: web START TIME: 2005,08,01,0,0,0 END TIME: 2005,09,04,23,59,59 RAW SAMPLE PERIOD (sec): 900 AVG TIME (secs): 1800 Sample time is centered on the averaging interval. Instrument heading (degT): 0 Note: rotation correction is applied to raw samples before vector averaging. Percent good points required for an average: 49 (1 points) Raw data path: /Users/mike/data/urban/mid-05/mid_level0/lbr1_BldgA_roof Out data path: /Users/mike/data/urban/mid-05/mid/level1/meso/lbr1_LhrBros_roof_noaa Time is in standard time, timezone: -5 Missing data value: -999 COMMENTS: Add comments here. Indent > 1 space. DATE (local std) WSPD VSPD WDIR SIGMA-THETA TAIR (DEGC) RH (%) BARO (hPa) date jd time m/s m/s degT Yamartino Vector av stdev av stdev av stdev 2005-08-01 (213) 01:00:00, 2.37, 2.37, 124.0, 0.00, 0.00, 20.20, 0.00, 89.00, 0.00, -999.00, -999.00 2005-08-01 (213) 01:30:00, 2.33, 2.32, 122.3, 3.50, 0.15, 20.50, 0.14, 88.50, 0.71, -999.00, -999.00 2005-08-01 (213) 02:00:00, 2.31, 2.29, 125.7, 7.50, 0.68, 20.60, 0.00, 85.50, 0.71, -999.00, -999.00
The header lines are wrapped for convenience. The format of the files here is exactly the same
for all data sets that are generated from the BNL mesonet web site.

80 of 88
B.1 FILES CONTAINED IN THE LEVEL 1 FOLDERS
Folder: /Users/rmr/data/mid/level1/field: total 0 drwxrwxr-x 23 rmr rmr 782 Apr 18 13:25 gp1 drwxrwxr-x 9 rmr rmr 306 Apr 18 16:31 gp2 drwxrwxr-x 17 rmr rmr 578 Apr 18 16:31 gp3 drwxrwxr-x 15 rmr rmr 510 Apr 18 16:31 gp4 FOLDER /Users/rmr/data/mid/level1/iop1: total 16 -rw-r--r-- 1 rmr rmr 635 Apr 6 22:38 INFO.tmp -rwxrwxrwx 1 rmr rmr 1064 Sep 21 2005 INFO_mid_iop1.txt drwxrwxrwx 5 rmr rmr 170 Apr 6 21:39 s1 drwxrwxrwx 5 rmr rmr 170 Apr 6 21:41 s10 drwxrwxrwx 5 rmr rmr 170 Apr 6 21:39 s2 drwxrwxrwx 5 rmr rmr 170 Apr 6 21:39 s3 drwxrwxrwx 5 rmr rmr 170 Apr 6 21:39 s4 drwxrwxrwx 5 rmr rmr 170 Apr 6 21:39 s5 drwxrwxrwx 5 rmr rmr 170 Apr 6 21:39 s6 drwxrwxrwx 5 rmr rmr 170 Apr 6 21:39 s7 drwxrwxrwx 5 rmr rmr 170 Apr 6 21:39 s8 drwxrwxrwx 5 rmr rmr 170 Apr 6 21:39 s9 FOLDER /Users/rmr/data/mid/level1/iop2: total 16 -rw-r--r-- 1 rmr rmr 635 Apr 6 22:42 INFO.tmp -rwxrwxrwx 1 rmr rmr 689 Sep 21 2005 INFO_mid_iop2.txt drwxrwxrwx 4 rmr rmr 136 Oct 6 2005 s1 drwxrwxrwx 5 rmr rmr 170 Oct 6 2005 s10 drwxrwxrwx 5 rmr rmr 170 Oct 6 2005 s2 drwxrwxrwx 4 rmr rmr 136 Oct 6 2005 s3 drwxrwxrwx 4 rmr rmr 136 Oct 6 2005 s4 drwxrwxrwx 4 rmr rmr 136 Oct 6 2005 s5 drwxrwxrwx 5 rmr rmr 170 Apr 6 22:43 s6 drwxrwxrwx 5 rmr rmr 170 Oct 6 2005 s7 drwxrwxrwx 5 rmr rmr 170 Oct 6 2005 s8 drwxrwxrwx 4 rmr rmr 136 Oct 6 2005 s9 FOLDER /Users/rmr/data/mid/level1/iop3: total 16 -rw-r--r-- 1 rmr rmr 724 Apr 6 22:45 INFO.tmp -rwxrwxrwx 1 rmr rmr 595 Apr 9 06:14 INFO_mid_iop3.txt drwxrwxrwx 5 rmr rmr 170 Apr 6 22:46 s1

81 of 88
drwxrwxrwx 4 rmr rmr 136 Oct 6 2005 s10 drwxrwxrwx 5 rmr rmr 170 Apr 6 22:50 s2 drwxrwxrwx 5 rmr rmr 170 Oct 6 2005 s3 drwxrwxrwx 5 rmr rmr 170 Oct 6 2005 s4 drwxrwxrwx 4 rmr rmr 136 Oct 6 2005 s5 drwxrwxrwx 5 rmr rmr 170 Dec 30 07:17 s6 drwxrwxrwx 4 rmr rmr 136 Oct 6 2005 s7 drwxrwxrwx 5 rmr rmr 170 Oct 6 2005 s8 drwxrwxrwx 4 rmr rmr 136 Oct 6 2005 s9 FOLDER /Users/rmr/data/mid/level1/iop4: total 16 -rw-r--r-- 1 rmr rmr 542 Apr 6 22:47 INFO.tmp -rwxrwxrwx 1 rmr rmr 775 Sep 21 2005 INFO_mid_iop4.txt drwxrwxrwx 5 rmr rmr 170 Oct 6 2005 s1 drwxrwxrwx 4 rmr rmr 136 Oct 6 2005 s10 drwxrwxrwx 5 rmr rmr 170 Oct 6 2005 s11 drwxrwxrwx 5 rmr rmr 170 Oct 6 2005 s12 drwxrwxrwx 4 rmr rmr 136 Oct 6 2005 s3 drwxrwxrwx 4 rmr rmr 136 Oct 6 2005 s4 drwxrwxrwx 4 rmr rmr 136 Oct 6 2005 s5 drwxrwxrwx 4 rmr rmr 136 Oct 6 2005 s7 drwxrwxrwx 5 rmr rmr 170 Oct 6 2005 s8 drwxrwxrwx 4 rmr rmr 136 Oct 6 2005 s9 FOLDER /Users/rmr/data/mid/level1/iop5: total 16 -rw-r--r-- 1 rmr rmr 539 Apr 6 22:48 INFO.tmp -rwxrwxrwx 1 rmr rmr 541 Sep 21 2005 INFO_mid_iop5.txt drwxrwxrwx 5 rmr rmr 170 Oct 6 20:02 s1 drwxrwxrwx 4 rmr rmr 136 Oct 6 2005 s10 drwxrwxrwx 4 rmr rmr 136 Oct 6 2005 s11 drwxrwxrwx 5 rmr rmr 170 Oct 6 2005 s12 drwxrwxrwx 4 rmr rmr 136 Oct 6 2005 s3 drwxrwxrwx 4 rmr rmr 136 Oct 6 2005 s4 drwxrwxrwx 4 rmr rmr 136 Oct 6 2005 s5 drwxrwxrwx 5 rmr rmr 170 Oct 6 2005 s7 drwxrwxrwx 5 rmr rmr 170 Oct 6 2005 s8 drwxrwxrwx 4 rmr rmr 136 Oct 6 2005 s9 FOLDER /Users/rmr/data/mid/level1/iop6: total 16 -rw-r--r-- 1 rmr rmr 539 Apr 6 22:49 INFO.tmp -rwxrwxrwx 1 rmr rmr 785 Sep 21 2005 INFO_mid_iop6.txt drwxrwxrwx 5 rmr rmr 170 Oct 6 2005 s1 drwxrwxrwx 4 rmr rmr 136 Oct 6 2005 s10

82 of 88
drwxrwxrwx 4 rmr rmr 136 Oct 6 2005 s11 drwxrwxrwx 5 rmr rmr 170 Oct 6 2005 s12 drwxrwxrwx 4 rmr rmr 136 Oct 6 2005 s3 drwxrwxrwx 4 rmr rmr 136 Oct 6 2005 s4 drwxrwxrwx 4 rmr rmr 136 Oct 6 2005 s5 drwxrwxrwx 4 rmr rmr 136 Oct 6 2005 s7 drwxrwxrwx 5 rmr rmr 170 Oct 6 2005 s8 drwxrwxrwx 4 rmr rmr 136 Oct 6 2005 s9 FOLDER /Users/rmr/data/mid/level1/meso: total 16 -rw-r--r-- 1 rmr rmr 695 Apr 7 00:07 INFO.tmp -rwxrwxrwx 1 rmr rmr 591 Oct 1 2005 INFO_mid_meso.txt drwxr-xr-x 4 rmr rmr 136 Apr 6 23:05 ccny_roof_met drwxrwxrwx 6 rmr rmr 204 Apr 6 23:25 cpk_CentralPark_asos drwxr-xr-x 5 rmr rmr 170 Apr 6 23:07 eml_EnvironMeasLab_DCnet drwxr-xr-x 6 rmr rmr 204 Apr 6 23:25 ewr_Newark_asos drwxrwxrwx 7 rmr rmr 238 Apr 14 06:25 gm1_GeneralMotors_met drwxrwxrwx 42 rmr rmr 1428 Apr 14 06:26 gm2_GMBldg_sodar drwxr-xr-x 6 rmr rmr 204 Apr 6 23:26 jfk_Kennedy_asos drwxrwxrwx 4 rmr rmr 136 Apr 6 23:28 lbr1_LhrBros_roof_noaa drwxrwxrwx 5 rmr rmr 170 Oct 6 2005 lbr2_LehmanBros_setback drwxrwxrwx 6 rmr rmr 204 Apr 6 23:29 lga_LaguardiaAP_asos drwxrwxrwx 7 rmr rmr 238 Apr 14 06:26 met1_MetLife_met drwxrwxrwx 42 rmr rmr 1428 Apr 14 06:27 met2_MetLife_sodar drwxrwxrwx 5 rmr rmr 170 Oct 4 2005 mgh1_McGraw-Hill_roof drwxrwxrwx 5 rmr rmr 170 Oct 5 2005 mgh2_McGraw-Hill_setback drwxrwxrwx 5 rmr rmr 170 Oct 6 2005 opp drwxrwxrwx 5 rmr rmr 170 Oct 6 2005 ppz_ParkPlaza_roof drwxr-xr-x 7 rmr rmr 238 Apr 6 23:53 sit1_met
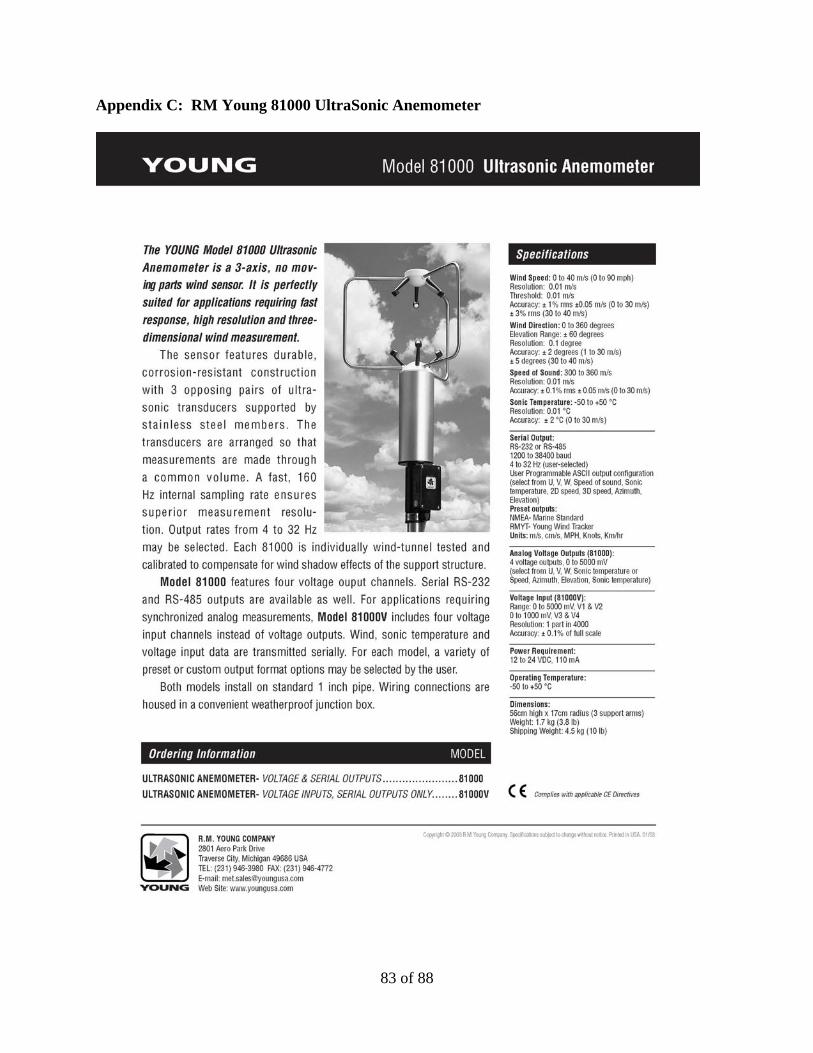
83 of 88
Appendix C: RM Young 81000 UltraSonic Anemometer

84 of 88