the new market segmentation of boursa kuwait new market segmentation of boursa kuwait what you need...
TRANSCRIPT

The New Market
Segmentation of
Boursa Kuwait
What You Need To
Know...
1
HIGHLIGHTS Boursa Kuwait issued a new Rulebook which will come into effect
with the launch of the phase two of the market development project expected in early 2018. The Rulebook is meant to be an all-inclusive document containing a complete regulatory and organizational framework that would govern all operational aspects of the stock exchange
• The rulebook has specified a new segmentation of the market into three new markets: the Premier Market, The Main Market, and the Auction Markets. A new set of Indices was also announced. The new Indices will be market cap weighted and will replace all existing indices which will be discontinued
• This represents another step in the broader framework of a market development plan aimed at overhauling and reforming the local stock exchange and elevating it to international standards
• The new segmentation will potentially have far reaching implications for listed companies especially in terms of shareholding structure. It will effectively move part of the burden of creating liquidity to the companies themselves
• The listing and status maintenance requirements of the Premier market will make it a blue-chip, mid to large cap segment of the overall market that comprises market leaders in terms of size, liquidity, transparency, and corporate governance.

2
THE NEW RULEBOOK
Boursa Kuwait issued a new Rulebook which will come into effect with the launch of the phase two of
the market development project expected in early 2018. The Rulebook is meant to be an all-inclusive
document containing a complete regulatory and organizational framework that would govern all
operational aspects of the stock exchange and the parties that deal with it including brokers, listed
companies, investors, and service providers, among others.
In particular, the rulebook has specified a new segmentation of the market into three new markets
and has revised the listing rules into each of the markets.
Accordingly, the parallel market will be canceled, and listed companies will be redistributed into three
markets according to criteria which include market cap and liquidity. The new markets are the
following:
- The Premier Market - The Main Market - The Auction Market
The Premier Market will be the market where relatively larger and more liquid companies are listed.
Achieving and then maintaining Premier Market status is the most demanding in terms of
requirements. The only requirement for the Main markets, on the other hand, is to achieve and
maintain the minimum liquidity threshold as set by the Boursa Kuwait on the annual review.
The new rulebook recognizes a transitory period to facilitate the redistribution of companies into the
new market segments. Companies currently listed in the main market will be redistributed to the
Premier and to the new Main markets. Should the implementation of the new classification guidelines
result in companies being moved to the Auction market, then a grace period is given to those
companies until the next evaluation period. Such companies will still be listed in the main market in
the meantime. On the other hand, companies listed in the parallel market will be moved to the Main
market if their capital is equal to or greater than KD 10 million and to the Auction market if the capital
is less than KD 10 million.
UNDERSTANDING THE NEW SPLIT
Listing Rules
The listing rules into the Premier and Main markets have been revised with no listing allowed into the
Auction market. The new listing rules have been formulated to be more in-line with internationally
observed practices according to Boursa Kuwait. The new rules appear to revolve around ensuring that
the companies wanting to list on the local stock exchange are established companies with a proven
operational track record and that their shareholding structure has ample free float to allow for enough
liquidity for their stock post listing.

3
Naturally the listing rules in the Premier market are more restrictive than those for the Main market.
Highlights of the main requirements for each are presented below noting that the new listing rules
are applicable to companies already listed in the market and new companies aiming to be listed.
Premier Market listing conditions:
1. The fair value of the company’s shares that are not owned by the controlling group of
shareholders should be valued at a minimum of KD 45 million. Such fair value is to be
determined by an independent valuation consultant licensed by the Capital Markets Authority
(CMA).
2. The company should have a minimum of 450 shareholders each owning shares valued at KD
10,000 at least as per the fair value determined above.
3. The company must have been operating according to at least one of its main objectives as
stated in its articles of association and has had most of its revenues generated from that
objectives over the past 7 full years. It must also have issued financial statement that are
approved by its general assembly for the last 7 years prior to the listing application.
Main Market listing conditions:
1. The fair value of the company’s shares that are not owned by the controlling group of
shareholders should be valued at a minimum of KD 15 million. Such fair value is to be
determined by an independent valuation consultant licensed by the CMA.
2. The company should have a minimum of 450 shareholders each owning shares valued at KD
5,000 at least as per the fair value determined above, or 225 shareholders each owning shares
valued at a minimum of KD 10,000 each.
3. The company must have been operating according to at least one of its main objectives as
stated in its articles of association and has had most of its revenues generated from that
objectives over the past 3 full years. It must also have issued financial statement that are
approved by its general assembly for the last 3 years prior to the listing application.
Given the above, the direction seems to be on emphasizing the potential liquidity of a company in
absolute terms rather than relative to its size in a departure from the existing rules where the free
float was measured as a percentage of a company’s issued capital.
Market Segmentation
The market segmentation guidelines are an important component of the Rulebook. They specify the
various requirement for the companies to comply with to be listed in the Premier and Main markets
and to maintain its listing status in those two markets.
For listed companies the requirement for classification in the Main market are straight forward. The
Average Daily Traded Value (ADTV) of a company calculated daily over the previous full year has to
meet the minimum threshold required to qualify for Main market status as set by the exchange during
the annual review.
The requirements to qualify for the Premier market, on the other hand, are a little more extensive and
depend on multiple factors including market cap, liquidity levels, turnover, and price, among others.
4
Premier Market Qualification Requirements:
- A company should have been listed on the stock exchange for at least two years
- The company’s Market capitalization should satisfy the minimum threshold specified by
Boursa Kuwait for each of the two years preceding the annual review
- In terms of liquidity, the candidate’s Average Daily Traded Value (ADTV) should meet the
minimum threshold announced by Boursa Kuwait for each of the two years preceding the
annual review
- The company’s average share price should not be below its nominal value for each of the two
years preceding the annual review
- The company should have been operational for at least 7 consecutive years
Premier Market Status Maintenance Requirements:
- The average market capitalization of should meet the minimum threshold required as
announced by Boursa Kuwait for the year preceding the annual review
- Liquidity levels represented by the ADTV should satisfy the required liquidity threshold
announced by Boursa Kuwait for the year preceding the annual review
- The price of the company’s shares should not go below its nominal value at the end of the
year
- The company should hold a quarterly analyst conference within 5 days of issuing the quarterly
and the annual financial statements and publish a transcript of this conference on the
exchange website at least 40 minutes before the next trading session following the conference
- Not to repeat any violation especially those violations that lead to the suspension of trading
- Publish all company announcements in both Arabic and English
It is worth noting at this point that for purposes of market cap calculation the below formula will be
used:
𝑀𝑎𝑟𝑘𝑒𝑡 𝐶𝑎𝑝𝑖𝑡𝑎𝑙𝑖𝑧𝑎𝑡𝑖𝑜𝑛 =Trading Days x Average Daily Traded Value
Annualized Turnover Ratio
This will effectively calculate the market capitalization of a company using its average share price and
average shares outstanding throughout the year as opposed to using the price and share outstanding
data at a single point in time such as at year-end or quarter-end. This will help smooth out any sudden
swings in the share price due to market volatility.
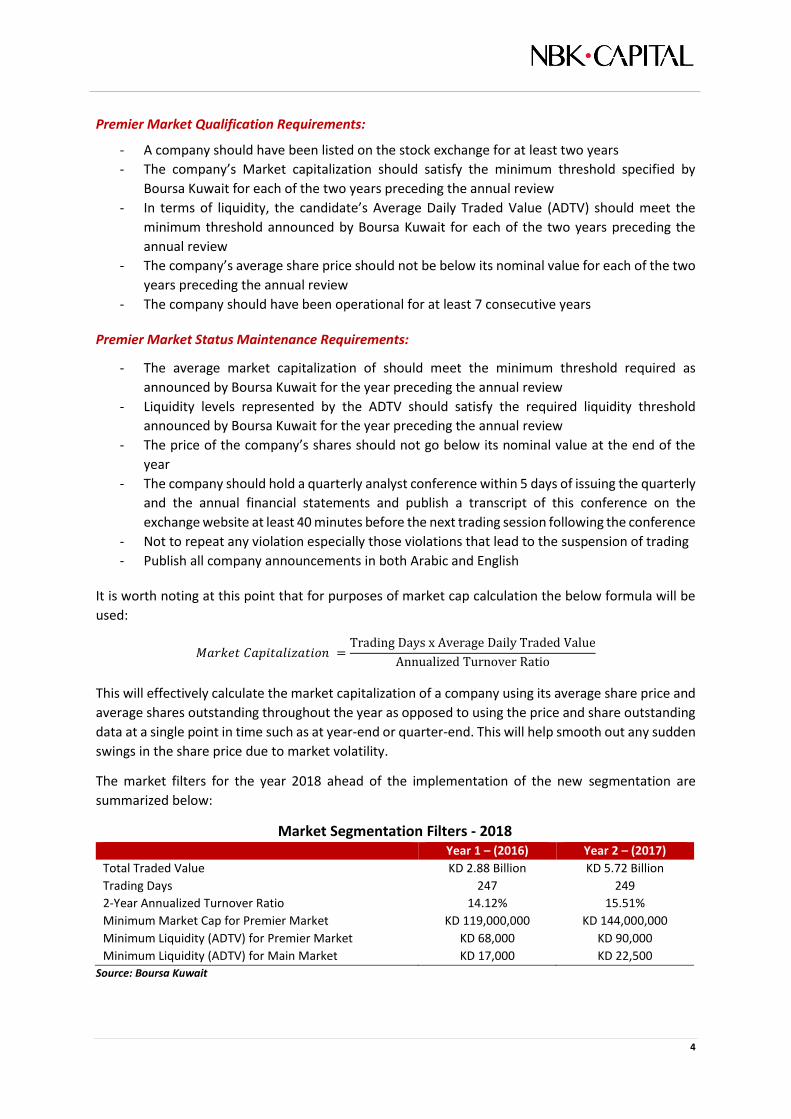
The market filters for the year 2018 ahead of the implementation of the new segmentation are
summarized below:
Market Segmentation Filters - 2018 Year 1 – (2016) Year 2 – (2017)
Total Traded Value KD 2.88 Billion KD 5.72 Billion
Trading Days 247 249
2-Year Annualized Turnover Ratio 14.12% 15.51%
Minimum Market Cap for Premier Market KD 119,000,000 KD 144,000,000
Minimum Liquidity (ADTV) for Premier Market KD 68,000 KD 90,000
Minimum Liquidity (ADTV) for Main Market KD 17,000 KD 22,500
Source: Boursa Kuwait

5
Should a company violate any of the status maintenance requirements during an annual review, it will
be given one year to rectify its position after which it will be demoted to a lower market on the
following year’s annual review. This applies to companies listed in both the Premier and Main markets.
In the case of Premier market companies however, such companies, even if they were able to comply
within the one year grace period, they will be placed on an “Ongoing Requirements Watchlist” for
three consecutive years during which any repeat violation will result in an automatic reclassification.
A “Premier Market Watchlist” is also maintained which includes companies that are listed in the main
but need one of the requirements to qualify for an upgrade to the Premier Market. These companies
are upgraded to the Premier Market as soon as they satisfy all of the requirements after the annual
review unless the company concerned explicitly requests not to be upgraded.
The Auction Market
The auction market contains the least liquid companies of the market that do not qualify for either
the Premier or the Main market because of their low liquidity levels regardless of their market
capitalization. Two auctions will be held per day, each for 15 minutes with 45 minutes between
auctions. The Auction market will not have its own index and its components will not be included in
any of the market indices because of their low liquidity levels.
Indices
The existing market indices will be scrapped and a new set of indices which are more representative
of the new market segmentation will be created. All indices will be market cap weighted and two
versions of each will be calculated, a price return version and total return version.
There will be a General Market Index covering companies listed in both the Premier and the Main
markets, a Premier Market Index and Main Market Index. In addition, indices for each of the 13 market
sectors will be calculated as follows:
1. Oil & Gas Weighted Index 2. Basic Material Weighted Index 3. Industrials Weighted Index 4. Consumer Goods Weighted Index 5. Healthcare Weighted Index 6. Consumer Services Weighted Index 7. Telecommunications Weighted Index 8. Utilities Weighted Index 9. Banks Weighted Index 10. Insurance Weighted Index 11. Real Estate Weighted Index 12. Financial Services Weighted Index 13. Technology Weighted Index
The Market Map
The new market segmentation resulted in 16 companies classified in the Premier Market with a total
capitalization of around KD 17 billion representing 63.5% of the total market. Overall, these companies
seem to be stable in terms of their classification having a relatively comfortable margin over the
liquidity and market cap minimum requirements, pending of course their compliance with the other
status maintenance requirements such as analyst conferences and others.
6
Things become a little more uncertain for companies classified in the Main market. For example, out
of the 15 Main market companies that are placed on the Premier Market Watchlist for a possible
upgrade, 8 are also flagged for a possible downgrade to the Auction market mostly on liquidity issues.
These companies, with the exception of one, mostly satisfy the market cap requirements and fall short
on liquidity.
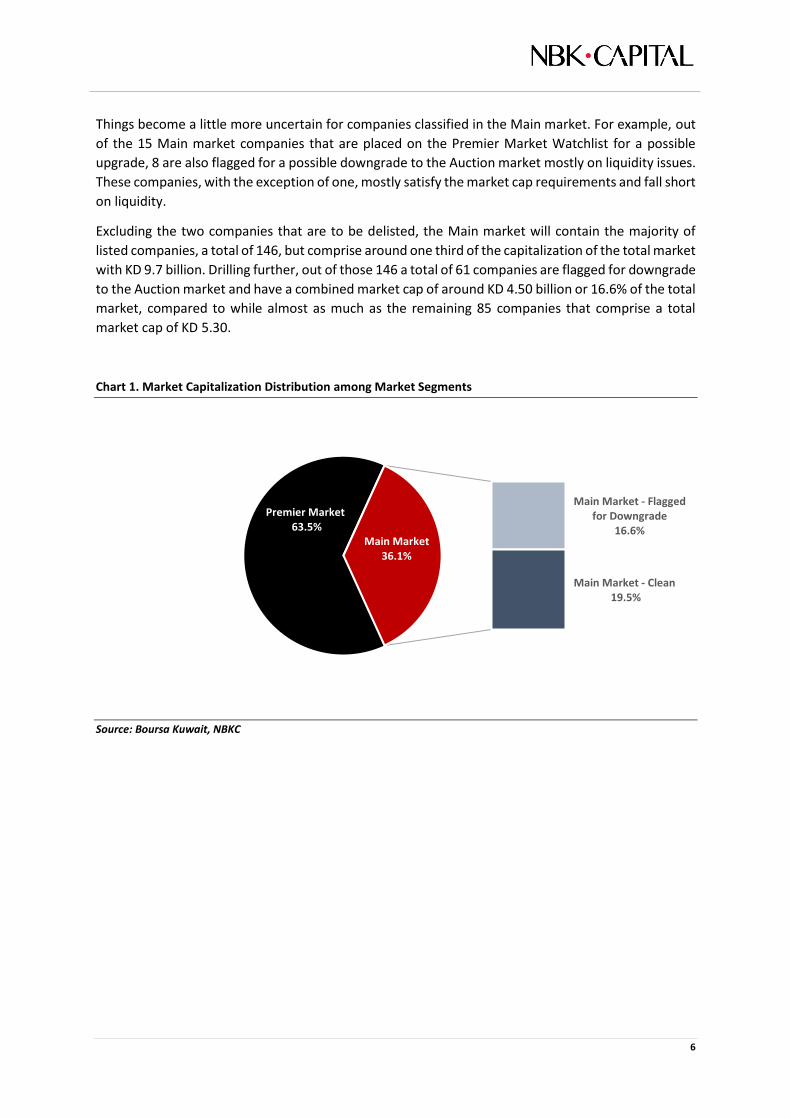
Excluding the two companies that are to be delisted, the Main market will contain the majority of
listed companies, a total of 146, but comprise around one third of the capitalization of the total market
with KD 9.7 billion. Drilling further, out of those 146 a total of 61 companies are flagged for downgrade
to the Auction market and have a combined market cap of around KD 4.50 billion or 16.6% of the total
market, compared to while almost as much as the remaining 85 companies that comprise a total
market cap of KD 5.30.
Chart 1. Market Capitalization Distribution among Market Segments
Source: Boursa Kuwait, NBKC
Premier Market63.5%
Main Market - Flagged for Downgrade
16.6%
Main Market - Clean19.5%
Main Market 36.1%

7
IMPLICATIONS
What is clear so far is that after the implementation of the new segmentation, 2018 will effectively be
a transitory year until the component of the different market segments more or less stabilize,
especially those of the Main market. As things stand today, only 13 companies will constitute the
Auction market, while 61 of those listed in the Main market have been flagged for a possible
downgrade. Going forward, we expect the number of companies traveling between the two markets
to decrease significantly as things stabilize over the medium to long term.
The Premier market, on the other hand, comprising around two thirds of the total market will be the
main barometer of the market. It is the market segment that will attract the attention of the
institutional and long term investors, both local and foreign. This will provide the motivation for the
rest of the market, especially to those more than 20 companies which already have achieved, or are
very close to achieving, the more challenging market cap threshold to create liquidity on their shares
to qualify for an upgrade for the Premier market.
Scrapping the Price index and creating a brand new set of market cap weighted indices will surely
provide higher quality and more representative benchmarks for measuring the performance of the
various market segments. It will also open the door and encourage market participants to create new
investment instruments such as Exchange Traded Funds or ETFs, which will participate in enhancing
liquidity levels in the market.
Another important implication of the new market segmentation, especially for those companies that
would aspire to achieve Premier Market status, is that it will incentivize changes in the shareholding
structure of companies. This will be driven by the need to comply with the minimum required value
of shares held by non-controlling shareholders for both the Premier and Main markets as detailed in
the listing requirement sections above.
All in all, the new segmentation of the market seems to be aimed at achieving two major objectives.
One is to create a blue-chip mid to large cap segment of the market that comprises market leaders in
terms of size, liquidity, transparency, and governance which will effectively be the Premier Market.
The Second would be a market of small to mid-size companies that are relatively liquid and well
governed. Moreover, and with the imminent upgrade of the local market by FTSE, this is surely
another step in the right direction which will help put the Kuwaiti market on the international markets
map and on the radar of foreign institutional investors.
8
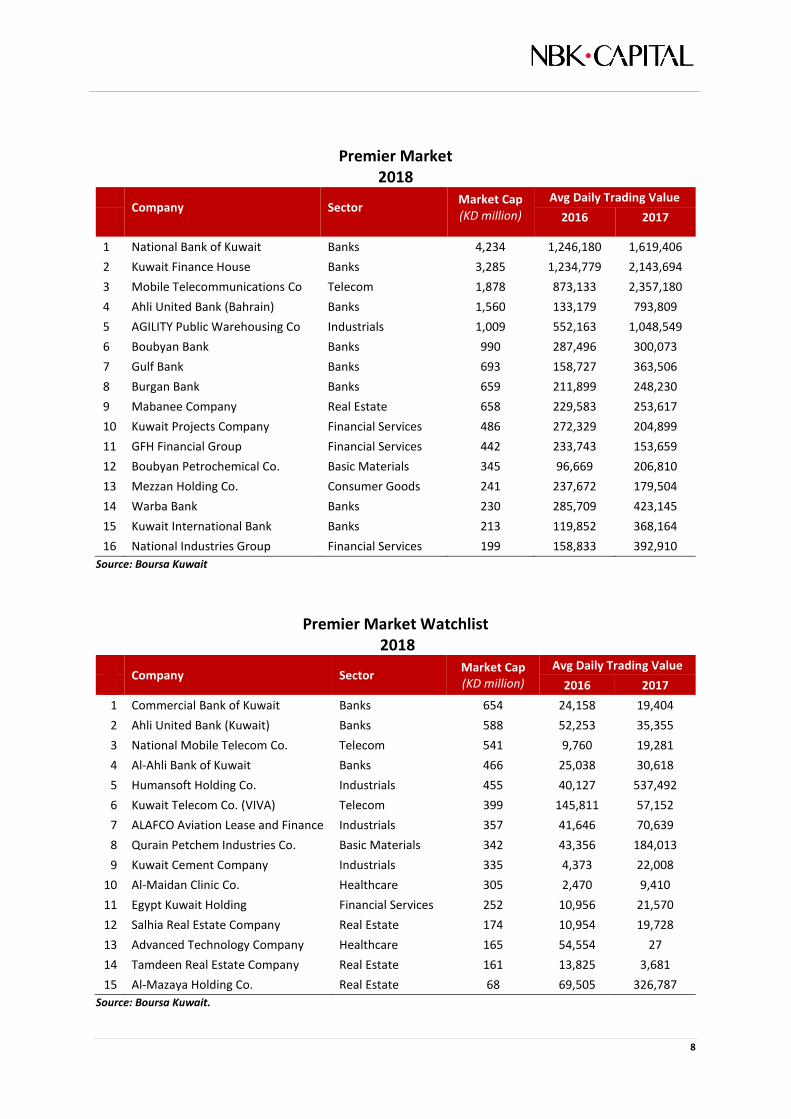
Premier Market 2018
Company Sector
Market Cap (KD million)
Avg Daily Trading Value
2016 2017 1 National Bank of Kuwait Banks 4,234 1,246,180 1,619,406
2 Kuwait Finance House Banks 3,285 1,234,779 2,143,694
3 Mobile Telecommunications Co Telecom 1,878 873,133 2,357,180
4 Ahli United Bank (Bahrain) Banks 1,560 133,179 793,809
5 AGILITY Public Warehousing Co Industrials 1,009 552,163 1,048,549
6 Boubyan Bank Banks 990 287,496 300,073
7 Gulf Bank Banks 693 158,727 363,506
8 Burgan Bank Banks 659 211,899 248,230
9 Mabanee Company Real Estate 658 229,583 253,617
10 Kuwait Projects Company Financial Services 486 272,329 204,899
11 GFH Financial Group Financial Services 442 233,743 153,659
12 Boubyan Petrochemical Co. Basic Materials 345 96,669 206,810
13 Mezzan Holding Co. Consumer Goods 241 237,672 179,504
14 Warba Bank Banks 230 285,709 423,145
15 Kuwait International Bank Banks 213 119,852 368,164
16 National Industries Group Financial Services 199 158,833 392,910
Source: Boursa Kuwait
Premier Market Watchlist 2018
Company Sector
Market Cap (KD million)
Avg Daily Trading Value
2016 2017
1 Commercial Bank of Kuwait Banks 654 24,158 19,404
2 Ahli United Bank (Kuwait) Banks 588 52,253 35,355
3 National Mobile Telecom Co. Telecom 541 9,760 19,281
4 Al-Ahli Bank of Kuwait Banks 466 25,038 30,618
5 Humansoft Holding Co. Industrials 455 40,127 537,492
6 Kuwait Telecom Co. (VIVA) Telecom 399 145,811 57,152
7 ALAFCO Aviation Lease and Finance Industrials 357 41,646 70,639
8 Qurain Petchem Industries Co. Basic Materials 342 43,356 184,013
9 Kuwait Cement Company Industrials 335 4,373 22,008
10 Al-Maidan Clinic Co. Healthcare 305 2,470 9,410
11 Egypt Kuwait Holding Financial Services 252 10,956 21,570
12 Salhia Real Estate Company Real Estate 174 10,954 19,728
13 Advanced Technology Company Healthcare 165 54,554 27
14 Tamdeen Real Estate Company Real Estate 161 13,825 3,681
15 Al-Mazaya Holding Co. Real Estate 68 69,505 326,787
Source: Boursa Kuwait.
9
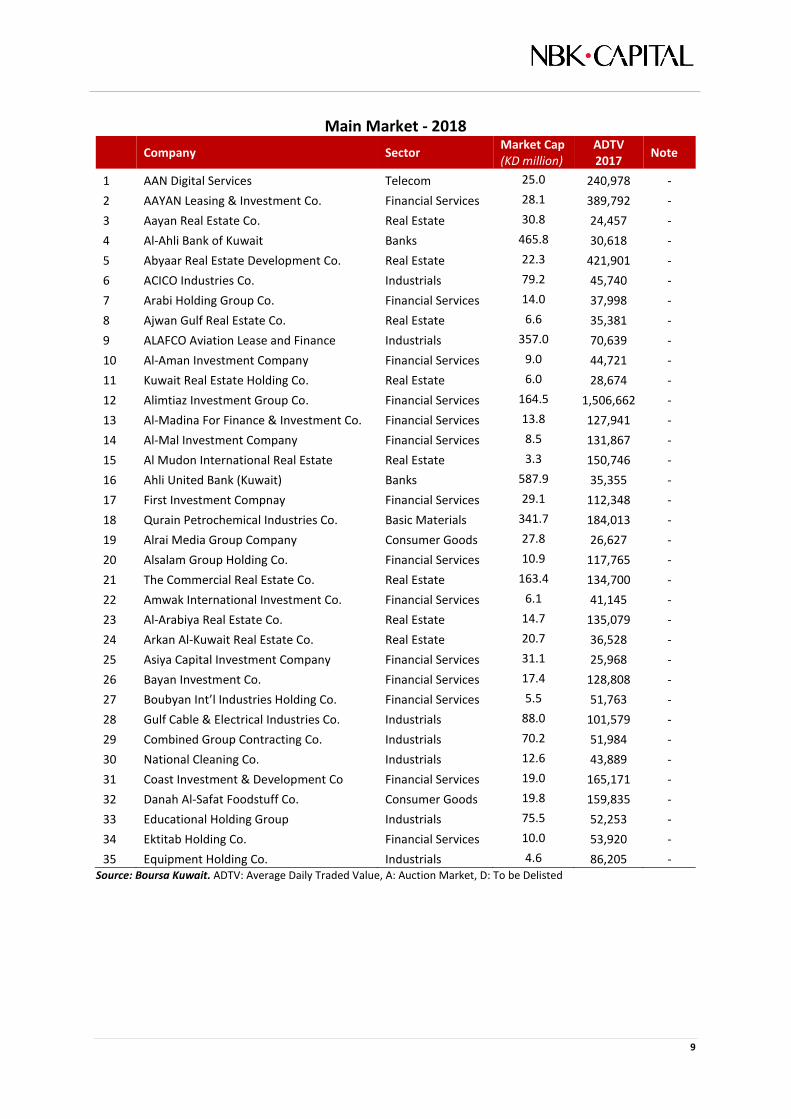
Main Market - 2018
Company Sector Market Cap (KD million)
ADTV 2017
Note
1 AAN Digital Services Telecom 25.0 240,978 -
2 AAYAN Leasing & Investment Co. Financial Services 28.1 389,792 -
3 Aayan Real Estate Co. Real Estate 30.8 24,457 -
4 Al-Ahli Bank of Kuwait Banks 465.8 30,618 -
5 Abyaar Real Estate Development Co. Real Estate 22.3 421,901 -
6 ACICO Industries Co. Industrials 79.2 45,740 -
7 Arabi Holding Group Co. Financial Services 14.0 37,998 -
8 Ajwan Gulf Real Estate Co. Real Estate 6.6 35,381 -
9 ALAFCO Aviation Lease and Finance Industrials 357.0 70,639 -
10 Al-Aman Investment Company Financial Services 9.0 44,721 -
11 Kuwait Real Estate Holding Co. Real Estate 6.0 28,674 -
12 Alimtiaz Investment Group Co. Financial Services 164.5 1,506,662 -
13 Al-Madina For Finance & Investment Co. Financial Services 13.8 127,941 -
14 Al-Mal Investment Company Financial Services 8.5 131,867 -
15 Al Mudon International Real Estate Real Estate 3.3 150,746 -
16 Ahli United Bank (Kuwait) Banks 587.9 35,355 -
17 First Investment Compnay Financial Services 29.1 112,348 -
18 Qurain Petrochemical Industries Co. Basic Materials 341.7 184,013 -
19 Alrai Media Group Company Consumer Goods 27.8 26,627 -
20 Alsalam Group Holding Co. Financial Services 10.9 117,765 -
21 The Commercial Real Estate Co. Real Estate 163.4 134,700 -
22 Amwak International Investment Co. Financial Services 6.1 41,145 -
23 Al-Arabiya Real Estate Co. Real Estate 14.7 135,079 -
24 Arkan Al-Kuwait Real Estate Co. Real Estate 20.7 36,528 -
25 Asiya Capital Investment Company Financial Services 31.1 25,968 -
26 Bayan Investment Co. Financial Services 17.4 128,808 -
27 Boubyan Int’l Industries Holding Co. Financial Services 5.5 51,763 -
28 Gulf Cable & Electrical Industries Co. Industrials 88.0 101,579 -
29 Combined Group Contracting Co. Industrials 70.2 51,984 -
30 National Cleaning Co. Industrials 12.6 43,889 -
31 Coast Investment & Development Co Financial Services 19.0 165,171 -
32 Danah Al-Safat Foodstuff Co. Consumer Goods 19.8 159,835 -
33 Educational Holding Group Industrials 75.5 52,253 -
34 Ektitab Holding Co. Financial Services 10.0 53,920 -
35 Equipment Holding Co. Industrials 4.6 86,205 - Source: Boursa Kuwait. ADTV: Average Daily Traded Value, A: Auction Market, D: To be Delisted
10
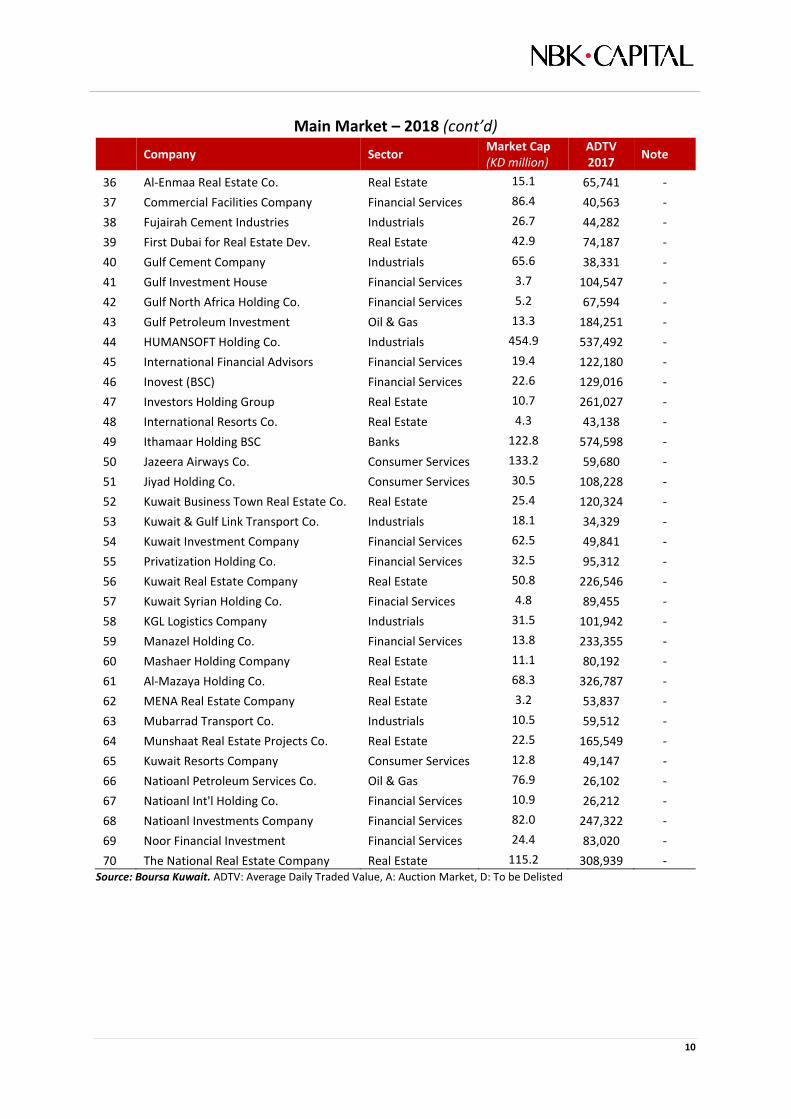
Main Market – 2018 (cont’d)
Company Sector Market Cap (KD million)
ADTV 2017
Note
36 Al-Enmaa Real Estate Co. Real Estate 15.1 65,741 -
37 Commercial Facilities Company Financial Services 86.4 40,563 -
38 Fujairah Cement Industries Industrials 26.7 44,282 -
39 First Dubai for Real Estate Dev. Real Estate 42.9 74,187 -
40 Gulf Cement Company Industrials 65.6 38,331 -
41 Gulf Investment House Financial Services 3.7 104,547 -
42 Gulf North Africa Holding Co. Financial Services 5.2 67,594 -
43 Gulf Petroleum Investment Oil & Gas 13.3 184,251 -
44 HUMANSOFT Holding Co. Industrials 454.9 537,492 -
45 International Financial Advisors Financial Services 19.4 122,180 -
46 Inovest (BSC) Financial Services 22.6 129,016 -
47 Investors Holding Group Real Estate 10.7 261,027 -
48 International Resorts Co. Real Estate 4.3 43,138 -
49 Ithamaar Holding BSC Banks 122.8 574,598 -
50 Jazeera Airways Co. Consumer Services 133.2 59,680 -
51 Jiyad Holding Co. Consumer Services 30.5 108,228 -
52 Kuwait Business Town Real Estate Co. Real Estate 25.4 120,324 -
53 Kuwait & Gulf Link Transport Co. Industrials 18.1 34,329 -
54 Kuwait Investment Company Financial Services 62.5 49,841 -
55 Privatization Holding Co. Financial Services 32.5 95,312 -
56 Kuwait Real Estate Company Real Estate 50.8 226,546 -
57 Kuwait Syrian Holding Co. Finacial Services 4.8 89,455 -
58 KGL Logistics Company Industrials 31.5 101,942 -
59 Manazel Holding Co. Financial Services 13.8 233,355 -
60 Mashaer Holding Company Real Estate 11.1 80,192 -
61 Al-Mazaya Holding Co. Real Estate 68.3 326,787 -
62 MENA Real Estate Company Real Estate 3.2 53,837 -
63 Mubarrad Transport Co. Industrials 10.5 59,512 -
64 Munshaat Real Estate Projects Co. Real Estate 22.5 165,549 -
65 Kuwait Resorts Company Consumer Services 12.8 49,147 -
66 Natioanl Petroleum Services Co. Oil & Gas 76.9 26,102 -
67 Natioanl Int'l Holding Co. Financial Services 10.9 26,212 -
68 Natioanl Investments Company Financial Services 82.0 247,322 -
69 Noor Financial Investment Financial Services 24.4 83,020 -
70 The National Real Estate Company Real Estate 115.2 308,939 - Source: Boursa Kuwait. ADTV: Average Daily Traded Value, A: Auction Market, D: To be Delisted

11
Main Market – 2018 (cont’d)
Company Sector Market Cap (KD million)
ADTV 2017
Note
71 Osos Holding Group Company Technology 9.2 24,208 -
72 Oula Fuel Marketing Co. Consumer Services 44.2 24,919 -
73 Kuwait Portland Cement Company Industrials 92.7 28,394 -
74 Real Estate Asset Management Co. Real Estate 51.6 59,223 -
75 Kuwait Remal Real Estate Co. Real Estate 11.9 267,647 -
76 Salbookh Trading Co. Industrials 5.4 29,716 -
77 The Securities House co. Financial Services 25.0 206,288 -
78 Senergy Holding Company (KSCP) Oil & Gas 7.0 68,466 -
79 Heavy Eng’g Industries & Ship Bldg Co. Industrials 37.3 24,392 -
80 National Ranges Company Industrials 6.2 91,519 -
81 Sokouk Holding Co. Real Estate 27.2 233,841 -
82 Specialities Group Holding Co. Industrials 10.3 34,830 -
83 Taameer Real Estate Investment Co. Real Estate 6.7 163,296 -
84 Unicap Investment & Finance Finacial Services 10.0 58,591 -
85 Kuwait Telecom Co. (VIVA) Telecom 399.0 57,152 -
86 Kuwait Food Company (Americana) Consumer Goods 435.0 97,189 D
87 Burgan Co. for Well Drilling Oil & Gas 19.3 5,106 A
88 Al-Ahleia Insurance Company Insurance 91.3 1,983 A
89 Al-Deera Holding Co. Financial Services 5.5 16,408 A
90 Alkout Industrial Projects Co. Basic Materials 60.5 1,653 A
91 Aqar Real Estate Investments Co. Real Estate 14.2 3,196 A
92 Ajial Real Estate Entertainment Co. Real Estate 32.4 4,882 A
93 AlArgan International Real Estate Co. Real Estate 38.3 12,961 A
94 Arzan Financial Group Financial Services 23.9 19,137 A
95 Automated Systems Company Technology 13.8 2,044 A
96 Advanced Technology Company Healthcare 165.0 27 A
97 Livestock Transport & Trading Co. Consumer Goods 47.9 8,124 A
98 Commercial Bank of Kuwait Banks 654.1 19,404 A
99 Egypt Kuwait Holding Fiancial Services 252.0 21,570 A
100 The Energy House Co. Oil & Gas 21.6 15,908 A
101 First Takaful Insurance Company Insurance 6.9 6,348 A
102 Future Kid Entertainment & Real Estate Consumer Services 11.0 916 A
103 Gulf Insurance Insurance 147.5 3,281 A
104 Hilal Cement Co. Industrials 15.8 402 A
105 IFA Hotels & Resorts Co. Consumer Services 109.5 47 A Source: Boursa Kuwait. ADTV: Average Daily Traded Value, A: Auction Market, D: To be Delisted

12
Main Market – 2018 (cont’d)
Company Sector Market Cap (KD million)
ADTV 2017
Note
106 Injazzat Real Estate Development Co. Real Estate 27.8 13,260 A
107 Independent Petroleum Group Oil & Gas 72.1 6,347 A
108 KAMCO Investment Company Financial Services 17.2 6,153 A
109 Kuwait Cerment Company Industrials 335.2 22,008 A
110 Kuwait National Cinema Consumer Services 122.6 4,616 A
111 Kuwait Cofor Process Plant Construction Industrials 13.7 1,083 A
112 Kuwait Finance & Investment Co Financial Services 14.0 2,156 A
113 Kuwait Foundry Co Basic Materials 38.3 21,705 A
114 Kuwait Insurance Company Insurance 50.8 3,501 A
115 Kuwait & Middle East Fin Investment Co. Financial Services 6.3 7,690 A
116 Kuwait Reinsurance Company Insurance 30.9 212 A
117 Al-Madar Finance & Investment Co. Financial Services 5.1 7,403 A
118 Real Estate Trade Centers Co. Real Estate 4.0 10,649 A
119 Kuwait Financial Center Financial Services 52.4 2,705 A
120 Massaleh Real Estate Co. Real Estate 8.2 13,803 A
121 Mushrif Trading & Contracting Co. Industrials 17.2 0 A
122 Nafais Holding Company Industrials 86.2 13,632 AD
123 National Industries Company Industrials 72.2 8,741 A
124 National Mobile Telecom Co. Telecom 541.3 19,281 A
125 Osoul Investment Co. Financial Services 10.8 7,051 A
126 Shuaiba Industrial Co. Industrials 23.9 9,198 A
127 Umm Al Qaiwan General Investment Co. Fiancial Services 29.0 1,452 A
128 Ras Al-Khaiamh Co. Industrials 41.0 3,080 A
129 Sanam Real Estate Co Real Estate 4.2 5,095 A
130 Sharjah Cement & Industrial Dev. Co. Industrials 54.7 10,832 A
131 Soor Fuel Marketing Company Consumer Services 44.5 10,279 A
132 Salhia Real Estate Company Real Estate 174.0 19,728 A
133 Sultan Center Food Products Group Co. Consumer Services 37.8 15,439 A
134 Credit Rating & Collection Financial Services 4.1 493 A
135 Tamdeen Real Estate Company Real Estate 161.4 3,681 A
136 Tamdeen Investment Company Fiancial Services 103.2 5,031 A
137 Tijara & Real Estate Investment Co. Real Estate 21.1 14,685 A
138 United Projects Co. Industrials 55.7 2,573 A
139 United Real Estate Company Real Estate 85.9 6,172 A
140 Wethaq Takaful Insurance Company Insurance 4.9 6,991 A Source: Boursa Kuwait. ADTV: Average Daily Traded Value, A: Auction Market, D: To be Delisted

13
Main Market – 2018 (cont’d)
Company Sector Market Cap (KD million)
ADTV 2017
Note
141 Warba Insurance Company Insurance 10.5 1,198 A
142 YIACO Medical Co. Healthcare 31.8 5,393 A
143 Al-Eid Food Co. Consumer Services 8.0 3 A
144 Amar For Finance & Leasing Co. Financial Services 10.7 1,023 A
145 Al-Masaken Int'l Redevelopment Co. Real Estate 7.8 7,814 A
146 Al-Maidan Clinic Healthcare 305.0 9,410 A
147 Sanad Holding Company Financial Services 43.7 0 A
148 Dar Al-Thuraya Real Estate Co. Real Estate 29.9 0 A Source: Boursa Kuwait. ADTV: Average Daily Traded Value, A: Auction Market, D: To be Delisted
Auction Market – 2018
Company Sector Market Cap (KD million)
ADTV 2017
1 Tamkeen Holding Co. Financial Services 1.2 43,133
2 Bahrain Kuwait Insurance Co. Insurance 25.4 0
3 Kuwait Cable Vision Consumer Services 0.7 482
4 Dalqan Real Estate Co. Real Estate 17.5 0
5 Effect Real Estate Co. Real Estate 1.9 13,561
6 Kuwait Bahrain Int'l Exchange Co. Financial Services 7.3 0
7 Gulf Franchising Holding Co. Financial Services 2.3 15,949
8 Kuwait Gypsum Industrials 2.8 22
9 Hayat Communications Company Telecom 6.0 16,807
10 Kuwait Hotels Company Consumer Services 13.9 558
11 Metal & Recycling Co. Industrials 7.5 1,266
12 National Consumer Holding Co. Financial Services 8.1 285
13 Palms Agro Production Co. Financial Services 4.4 289
Source: Boursa Kuwait. ADTV: Average Daily Traded Value

14
Contacts:
Investment Strategy & Advisory Asset Management Arraya Tower II, Floor 35
P.O. Box 4950, Safat 13050, Kuwait T. (965) 2224 5111
F. (965) 2224 6904
15
Disclaimer:
The information, opinions, tools, and materials contained in this report (the “Content”) are not addressed to, or intended for publication, distribution
to, or use by, any individual or legal entity who is a citizen or resident of or domiciled in any jurisdiction where such distribution, publication,
availability, or use would constitute a breach of the laws or regulations of such jurisdiction or that would require Watani Investment Company KSCC
(“NBK Capital”) or its parent company, its subsidiaries or its affiliates (together “NBK Group”) to obtain licenses, approvals, or permissions from the
regulatory bodies or authorities of such jurisdiction. The Content, unless expressly mentioned otherwise, is under copyright to NBK Capital. Neither
the Content nor any copy of it may be in any way reproduced, amended, transmitted to, copied, or distributed to any other party without the prior
express written consent of NBK Capital. All trademarks, service marks, and logos used in this report are trademarks or service marks or registered
trademarks or registered service marks of NBK Capital.
The Content is provided to you for information purposes only and is not to be used, construed, or considered as an offer or the solicitation of an offer
to sell or to buy or to subscribe for any investment (including but not limited to securities or other financial instruments). No representation or
warranty, express or implied, is given by NBK Capital or any of its respective directors, partners, officers, affiliates, employees, advisors, or
representatives that the investment referred to in this report is suitable for you or for any particular investor. Receiving this report shall not mean or
be interpreted that NBK Capital will treat you as its customer. If you are in doubt about such investment, we recommend that you consult an
independent investment advisor since the investment contained or referred to in this report may not be suitable for you and NBK Capital makes no
representation or warranty in this respect.
The Content shall not be considered investment, legal, accounting, or tax advice or a representation that any investment or strategy is suitable or
appropriate for your individual circumstances or otherwise constitutes a personal recommendation to you. NBK Capital does not offer advice on the
tax consequences of investments, and you are advised to contact an independent tax adviser.
The information and opinions contained in this report have been obtained or derived from sources that NBK Capital believes are reliable without
being independently verified as to their accuracy or completeness. NBK Capital believes the information and opinions expressed in this report are
accurate and complete; however, NBK Capital gives no representations or warranty, express or implied, as to the accuracy or completeness of the
Content. Additional information may be available upon request. NBK Capital accepts no liability for any direct, indirect, or consequential loss arising
from the use of the Content. This report is not to be relied upon as a substitution for the exercise of independent judgment. In addition, NBK Capital
may have issued, and may in the future issue, other reports that are inconsistent with and reach different conclusions from the information presented
in this report. Those reports reflect the different assumptions, views, and analytical methods of the analysts who prepared the reports, and NBK
Capital is under no obligation to ensure that such other reports are brought to your attention. NBK Capital may be involved in many businesses that
relate to companies mentioned in this report and may engage with them. Past performance should not be taken as an indication or guarantee of
future performance, and no representation or warranty, express or implied, is made regarding future performance. Information, opinions, and
estimates contained in this report reflect a judgment at the report’s original date of publication by NBK Capital and are subject to change without
notice.
The value of any investment or income may fall as well as rise, and you may not get back the full amount invested. Where an investment is
denominated in a currency other than the local currency of the recipient of the research report, changes in the exchange rates may have an adverse
effect on the value, price, or income of that investment. In the case of investments for which there is no recognized market, it may be difficult for
investors to sell their investments or to obtain reliable information about their value or the extent of the risk to which they are exposed.
NBK Capital has not reviewed the addresses of, the hyperlinks to, or the websites referred to in the report and takes no responsibility for the content
contained therein. Such address or hyperlink (including addresses or hyperlinks to NBK Capital’s own website material) is provided solely for your
convenience and information, and the content of the linked site does not in any way form part of this document. Accessing such websites or following
such links through this report or NBK Capital’s website shall be at your own risk.
NBK Group may have a financial interest in one or any of the securities that are the subject of this report. Funds managed by NBK Group may own
the securities that are the subject of this report. NBK Group may own units in one or more of the aforementioned funds.
NBK Group may be in the process of soliciting or executing fee-earning mandate or doing business for companies that are either the subject of this
report or are mentioned in this report. As a result, you should be aware that NBK Group may have material conflict of interest that could affect the
objectivity of this report.